Attached files
| file | filename |
|---|---|
| EXCEL - IDEA: XBRL DOCUMENT - SPARTON CORP | Financial_Report.xls |
| EX-10.21 - EXHIBIT - SPARTON CORP | exhibit1021-amendmentofsol.htm |
| EX-10.23 - EXHIBIT - SPARTON CORP | exhibit1023-orderforsuppli.htm |
| EX-10.24 - EXHIBIT - SPARTON CORP | exhibit1024-amendmentofsol.htm |
| EX-31.2 - EXHIBIT - SPARTON CORP | exhibit31210-k2014.htm |
| EX-10.25 - EXHIBIT - SPARTON CORP | exhibit1025-subcontractora.htm |
| EX-10.22 - EXHIBIT - SPARTON CORP | exhibit1022-amendmenttobas.htm |
| EX-32.1 - EXHIBIT - SPARTON CORP | exhibit32110-k2014.htm |
| EX-31.1 - EXHIBIT - SPARTON CORP | exhibit31110-k2014.htm |
| EX-10.7 - EXHIBIT - SPARTON CORP | exhibit107-6x30x201410xk.htm |
| EX-10.20 - EXHIBIT - SPARTON CORP | exhibit10-20solicitationof.htm |
| EX-23.1 - EXHIBIT - SPARTON CORP | exhibit23110-k2014.htm |
| EX-21.1 - EXHIBIT - SPARTON CORP | exhibit21110-k2014.htm |
UNITED STATES
SECURITIES AND EXCHANGE COMMISSION
Washington, D.C. 20549
FORM 10-K
(Mark One)
x | ANNUAL REPORT PURSUANT TO SECTION 13 OR 15 OF THE SECURITIES EXCHANGE ACT OF 1934 |
For the fiscal year ended: June 30, 2014
Or
¨ | TRANSITION REPORT PURSUANT TO SECTION 13 OR 15 OF THE SECURITIES EXCHANGE ACT OF 1934 |
For the transition period from to
Commission File Numbers 1-1000
Sparton Corporation
(Exact name of registrant as specified in its charter)
Ohio | 38-1054690 | |
(State or other jurisdiction of incorporation or organization) | (I.R.S. Employer Identification No.) | |
425 N. Martingale Road, Suite 2050
Schaumburg, Illinois 60173
(Address of principal executive offices)
Registrant’s telephone number, including area code: (847) 762-5800
Securities registered pursuant to Section 12(b) of the Act:
Title of each class | Name of each exchange on which registered | |
Common Stock, par value $1.25 per share | New York Stock Exchange | |
Securities registered pursuant to Section 12(g) of the Act:
None
Indicate by check mark if the registrant is a well-known seasoned issuer, as defined in Rule 405 of the Securities Act. Yes ¨ No x
Indicate by check mark if the registrant is not required to file reports pursuant to Section 13 or Section 15(d) of the Act. Yes ¨ No x
Indicate by check mark whether the registrant (1) has filed all reports required to be filed by Section 13 or 15(d) of the Securities Exchange Act of 1934 during the preceding 12 months (or for such shorter period that the registrant was required to file such reports), and (2) has been subject to such filing requirements for the past 90 days. Yes x No ¨
Indicate by check mark whether the registrant has submitted electronically and posted on its corporate website, if any, every Interactive Data File required to be submitted and posted pursuant to Rule 405 of Regulation S-T (§232.405 of this chapter) during the preceding 12 months (or such shorter period that the registrant was required to submit and post such files). Yes x No ¨
Indicate by check mark if disclosure of delinquent filers pursuant to Item 405 of Regulation S-K is not contained herein, and will not be contained, to the best of registrant’s knowledge, in definitive proxy or information statements incorporated by reference in Part III of this Form 10-K or any amendment to this Form 10-K. x
Indicate by check mark whether the registrant is a large accelerated filer, an accelerated filer, a non-accelerated filer, or a smaller reporting company. See definitions of “large accelerated filer,” “accelerated filer,” and “smaller reporting company” in Rule 12b-2 of the Exchange Act. (Check one):
Large accelerated filer o | Accelerated filer x | Non-accelerated filer o | Smaller reporting company o | |||
Indicate by check mark whether the registrant is a shell company (as defined in Rule 12b-2 of the Act). Yes ¨ No x
The aggregate market value of the voting and non-voting common equity held by non-affiliates computed by reference to the price at which the common equity was last sold (based on the closing price on the New York Stock Exchange) as of December 31, 2013 (the last business day of the registrant’s most recently completed second fiscal quarter) was approximately $261,186,000. For purposes of this computation, affiliates of the registrant include the registrant’s executive officers and directors and their respective affiliates as of December 31, 2013.
As of August 29, 2014, there were 10,129,031 shares of common stock, $1.25 par value per share, outstanding.
Documents Incorporated by Reference
Part III incorporates information by reference to the registrant’s definitive proxy statement for its 2014 Annual Meeting of Shareholders to be filed with the Securities and Exchange Commission within 120 days after the end of the fiscal year.
TABLE OF CONTENTS
ITEM 1. | ||
ITEM 1A. | ||
ITEM 1B. | ||
ITEM 2. | ||
ITEM 3. | ||
ITEM 4. | ||
ITEM 5. | ||
ITEM 6. | ||
ITEM 7. | ||
ITEM 7A. | ||
ITEM 8. | ||
ITEM 9. | ||
ITEM 9A. | ||
ITEM 9B. | ||
ITEM 10. | ||
ITEM 11. | ||
ITEM 12. | ||
ITEM 13. | ||
ITEM 14. | ||
ITEM 15. | ||
2
FORWARD-LOOKING STATEMENTS
This Annual Report on Form 10-K contains statements about future events and expectations that are “forward-looking statements.” We may also make forward-looking statements in our other reports filed with the SEC, in materials delivered to our shareholders and in press releases. These statements relate to future events or our future financial performance and involve known and unknown risks, uncertainties and other factors that may cause our actual results, levels of activity, performance or achievements to be materially different from any future results, levels of activity, performance or achievements expressed or implied by these forward-looking statements. Certain of these risks, uncertainties and other factors are described in Item 1A, “Risk Factors” of this report. In some cases, you can identify forward-looking statements by terminology such as “may,” “will,” “should,” “expects,” “intends,” “plans,” “anticipates,” “believes,” “estimates,” “predicts,” “potential,” or the negative use of these terms or other comparable terminology that convey the uncertainty of future events or outcomes. Although we believe these forward-looking statements are reasonable, they are based on a number of assumptions concerning future conditions, any or all of which may ultimately prove to be inaccurate. These forward-looking statements are based on management’s views and assumptions at the time originally made, and we undertake no obligation to update these statements whether as a result of new information or future events. There can be no assurance that our expectations, projections or views will materialize, and you should not place undue reliance on these forward-looking statements. Any statement in this report that is not a statement of historical fact may be deemed to be a forward-looking statement and subject to the safe harbor created by the Private Securities Litigation Reform Act of 1995.
3
PART I
ITEM 1. BUSINESS
General
Sparton Corporation and subsidiaries (the “Company” or “Sparton”) has been in continuous existence since 1900. It was last reorganized in 1919 as an Ohio corporation. The Company is a provider of design, development, and manufacturing services for complex electromechanical devices, as well as sophisticated engineered products complementary to the same electromechanical value stream. The Company serves the Medical & Biotechnology, Military & Aerospace and Industrial & Commercial markets through three reportable business segments; Medical Device (“Medical”), Complex Systems (“CS”) and Defense & Security Systems (“DSS”). Financial information by segment is presented in Note 16. All of the Company's facilities are certified to one or more of the ISO/AS standards, including ISO 9001, AS9100 or ISO 13485, with most having additional certifications based on the needs of the customers they serve. The Company's products and services include offerings for Original Equipment Manufacturers (“OEM”) and Emerging Technology (“ET”) customers that utilize microprocessor-based systems which include transducers, printed circuit boards and assemblies, sensors, and electromechanical components, as well as development and design engineering services relating to these product sales. Sparton also develops and manufactures sonobuoys, anti-submarine warfare (“ASW”) devices used by the United States Navy and other free-world countries. Many of the physical and technical attributes in the production of sonobuoys are similar to those required in the production of the Company's other electrical and electromechanical products and assemblies.
The Company's website address is www.sparton.com. Information contained on our website is not part of this Annual Report on Form 10-K. Our website provides public access to, among other items, the Annual Report on Form 10-K, Quarterly Reports on Form 10-Q, Quarterly Earnings Releases, News Releases, Governance Guidelines, and the Code of Ethics, as well as various Board of Director committee charters. Upon request, the Company provides, free of charge, copies of its periodic and current reports (e.g., Forms 10-K, 10-Q and 8-K) and amendments to such reports that are filed with the Securities and Exchange Commission (“SEC”), as well as the Board of Director committee charters. Reports are available as soon as reasonably practicable after such reports are filed with or furnished to the SEC, either at the Company's website, through a link to the SEC's website or upon request through the Company's Shareholders Relations Department.
Medical Segment
Medical segment operations are comprised of contract design, manufacturing, and aftermarket repair and refurbishment of sophisticated medical and biotechnology devices and sub-assemblies. Customers include industry leaders, emerging technologies companies and start-ups. In manufacturing devices for its customers, this business unit follows specific design and manufacturing processes to assure product reliability and safety in accordance with Food and Drug Administration (“FDA”) guidelines and approvals. This group specializes in technologies, systems and processes required by medical OEM and ET customers primarily in the diagnostic, therapeutic, surgical and laboratory device segments of the medical and biotechnology marketplaces. The Medical segment also includes some non-medical customers.
Our Medical segment's objective is to be the preferred contract design and manufacturer of medical devices for market leading OEM's as well as emerging technology customers. The market is driven by providing the total solution concept, at a competitive price to the customer. Our market advantage is our lean enterprise-based Sparton Production System, experience and knowledge of the market, breadth of services that we offer, and the referral relationships which have developed over the past 20 years. The major corporations on the customer side want to focus their time and energy supporting their major profit areas of consumables and new innovation through research and development. In addition, many companies are outsourcing certain engineering activities finding it costly and inefficient to have full time engineers available for new product development which cycles with new projects every three to five years. This is the niche that has proven to be successful to Sparton.
The contract manufacturing of highly complex medical instrumentation is a fairly fragmented industry with no dominant player in the market. In the past, large Printed Circuit Board contract manufacturers have sold their “box build” capabilities and have been very successful. The industry has continued to grow with more companies developing Printed Circuit Board Assembly (“PCBA”) capabilities and others entering the market via mergers and acquisitions of smaller companies. This has led to stronger competition with larger companies that have the financial resources to offer the services that the customers are requiring. Customers will assume that quality will be 100% and will drive their decisions based on pricing and services offered that best fit their total solutions needs.
4
The understanding of the medical market needs is critical for our success. We are well positioned with our engineering development, reliability engineering, manufacturing/testing, and support services to meet our current organic growth plans. Additional growth may be gained through an acquisition strategy employed to expand our market reach and footprint into other geographic areas of the U.S and abroad.
On August 6, 2010, the Company completed the acquisition of certain assets related to the contract manufacturing business of Delphi Medical Systems, LLC (“Delphi Medical” or “Delphi”) in an approximate $8.4 million all-cash transaction. The acquired business, which is reported in the Company's Medical segment, provided a new and diversified customer base and provided Sparton with a geographic presence in the western United States.
On March 4, 2011, the Company completed the acquisition of certain assets and assumption of certain liabilities of Byers Peak, Incorporated (“Byers Peak”) in an approximate $4.1 million all-cash transaction. The acquired business, which is reported in the Company's Medical segment, provided further expansion into the therapeutic device market, diversified Sparton's customer base, and further expanded the Company's geographic reach into the western United States. Additionally, the acquisition increased Sparton's offerings with the inclusion of field service and refurbishment capabilities.
On November 15, 2012, the Company completed the acquisition of Onyx EMS, LLC (“Onyx”) in a $43.25 million all-cash transaction. Additional consideration of $2.19 million was paid in relation to a post-closing working capital adjustment, which was settled in the Company's fiscal 2013 third quarter. The acquired business, which is reported in the Company's Medical segment, provided further expansion regionally into the Minneapolis medical device corridor, diversifying the Company's customer base through both existing programs and a strong business development pipeline, and increased the number of complex sub-assembly and full device programs within Sparton. Additionally, the business brought long-term customers which can utilize Sparton's expanded list of service offerings such as our low cost country footprint in Vietnam and full engineering design capabilities.
On March 17, 2014, the Company completed the acquisition of Aubrey Group, Inc. ("Aubrey”), located in Irvine, CA, in a $5.3 million all-cash transaction, subject to certain post-closing adjustments and financed through the use of borrowings under the Company's Credit Facility. Additional consideration of approximately $0.6 million was paid at closing for cash of the business in excess of net customer deposits held by the Aubrey. The transaction includes an approximate $0.5 million escrowed holdback which is available to fund any potential post-closing working capital adjustment and potential seller indemnification obligations in relation to the acquisition agreement. The acquired business, a design and manufacturing company, which is part of the Medical segment and which is expected to add $8 million (unaudited) in annualized revenue, develops new products for OEMs in the Medical and Biotechnology. Inventors, entrepreneurs, and industry leading OEMs utilize Aubrey's design and engineering teams to develop innovative solutions in a timely manner in their efforts to deliver their new products into the marketplace faster and more cost effectively.
Fenwal Blood Technologies contributed 14%, 20% and 15% of consolidated revenue during the years ended June 30, 2014, 2013 and 2012, respectively. During the Company's fiscal 2014 third quarter, Fenwal Blood Technologies began a rebalancing of its program engagements with the Company. The rebalancing of Fenwal programs negatively affected comparative sales to this customer by $10.2 million in the second half of the Company's fiscal 2014 and is expected to negatively affect comparative sales to this customer by as much as $19 million in the Company's fiscal 2015, substantially all of which will be realized during the first half of that year. The loss of Fenwal Blood Technologies as a customer could have a material adverse financial effect on the Company. We are dependent on a few large customers and the loss of such customers or reduction in their demand could substantially harm our business and operating results. See Item 1A, “Risk Factors”, for a further discussion regarding these customers. While the overall relationship with Fenwal Blood Technologies is important to Sparton, the contract with this company is such as ordinarily accompanies the kind of business conducted by Sparton, and the Company does not believe that it is substantially dependent on any individual contract or agreement with this customer. The contractual arrangement entered into with Fenwal Blood Technologies is represented by a master agreement which includes certain master terms and conditions of Sparton's relationship with this customer. This agreement does not commit the customer to any specific volume of purchases. Moreover, these terms can be amended in appropriate circumstances. Thus, until this customer submits a purchase order to Sparton, there is no guarantee of any revenue to Sparton. Rather than depending on this contract for revenue, the Company accepts purchase orders from this customer which determine volume and delivery requirements. Medical backlog was approximately $80.3 million and $74.6 million at June 30, 2014 and 2013, respectively. A majority of the June 30, 2014 Medical backlog is currently expected to be realized within the next 12 months.
As a medical device manufacturer, Sparton operates in a heavily regulated environment. Despite efforts to harmonize domestic and international regulations, inconsistencies still exist. Quality Management System requirements are generally compatible but device approval, licensing and environmental requirements vary widely and change frequently. RoHS (Restriction of Hazardous Substances) and REACH (Registration, Evaluation and Authorization of Chemicals) directives are examples of the regulatory challenges we face. Similar environmental regulations are expected from other countries and the
5
United States. Non-compliance risks range from variance notifications to production/shipping prevention depending upon the agency and form of non-compliance.
Complex Systems Segment
Complex Systems segment operations are comprised of manufacturing and aftermarket repair and refurbishment of sophisticated printed circuit card assemblies, sub-assemblies, full product assemblies, and cable/wire harnesses. Customers include military and aerospace prime and sub-prime contractors, as well as industrial and commercial OEM's. In manufacturing for its customers, this segment adheres to very strict military and aerospace specifications in addition to product and process certifications. Customers are primarily engaged in applications that include: flight controls, industrial and military control systems, cockpit displays, fuel system controls, secure communications, early warning detection, security systems, satellite communications, and audio. The CS segment also includes some medical customers.
The segment competes against numerous foreign and domestic companies in addition to the internal capabilities of some of our customers. Some of our competitors have substantially greater financial, manufacturing or marketing resources than we do. Sparton's Complex Systems segment excels in providing low-volume, high-mix services. OEM's in our market segments are continually driving costs out of their respective businesses through outsourcing strategies, allowing opportunity for Sparton to capture additional value add opportunities. We believe that the principal competitive factors in our targeted electronic manufacturing services (“EMS”) markets are the lean enterprise-based Sparton Production System, engineering capabilities, product quality, flexibility, cost and timeliness in responding to design and schedule changes, reliability in meeting product delivery schedules, pricing, rapid prototyping, technological sophistication and geographic location.
Complex Systems provides to its customers support services that include engineering services, material management, obsolescence analysis and management, documentation development, and process improvement. Our engineering services, led by our rapid prototype and pilot build process, offer our customers a high quality product that can quickly be placed into their channels of distribution. Once a product has been proven viable, we offer domestic and low cost country manufacturing and distribution solutions.
The segment strives to exceed customers' expectations with high delivery and quality performance. As these attributes are demanded by Complex Systems customers that produce the aforementioned products, Complex Systems strives to exceed those expectations through utilization of contemporary management tools to ascertain the effectiveness of all business operating systems. This has allowed Complex Systems to gain competitive traction in the market place.
Sparton Complex Systems continues to engage in ongoing strategic initiatives to expand market awareness of Sparton capabilities. As we continue to execute to our growth strategy, we anticipate adding additional resources in business development, marketing, program administration and product launch services. We are engaged with local and regional economic development authorities and have developed alliances with higher education institutions' research and development programs as well as county and regional economic leadership teams. Our Vietnam location continues to be engaged with the local government authority assisting North American companies seeking to conduct business in Vietnam. These additional efforts will allow focused marketing for each of our identified markets optimizing our ability to selectively target new customers.
On June 6, 2013, the Company completed the acquisition of certain assets related to the contract manufacturing business of Creonix, LLC (“Creonix”) in a $2.0 million all-cash transaction, after settlement of a $0.1 million working capital adjustment during the second quarter of the Company's fiscal 2014 year. The transaction was financed through the use of borrowings under the Company's Credit Facility. The acquired business, which is reported in the Company's Complex Systems segment, provides the Company with the capability of cable and wire harness engineering and assembly. Additionally, the acquisition provided further expansion into the Industrial and Military & Aerospace markets, diversifies Sparton's customer base and increased utilization of the Company's existing assets through the consolidation of this business into Complex Systems' Brooksville, Florida plant.
On December 11, 2013, the Company completed the acquisition of Beckwood Services, Inc. ("Beckwood”), located in Plaistow, N.H., in a $15.3 million all-cash transaction financed through the use of cash on hand and borrowings under the Company's Credit Facility. The transaction includes an approximate $1.5 million escrowed holdback which is available to fund potential seller indemnification obligations in relation to the acquisition agreement. The acquired business, which is part of the Company's Complex Systems segment and which is expected to add $18 million (unaudited) in annualized revenue, develops electronic or electro-mechanical controls and electronic assemblies. Their customer profile includes international Fortune 1000 manufacturers of industrial control systems, analytical instruments, measuring and detecting equipment and military, defense and Homeland Security equipment.
6
On July 10, 2014, the Company completed the acquisition of Electronic Manufacturing Technology, LLC. (“eMT”). The purchase price of $18.5 million is subject to a final working capital adjustment and was financed through the use of borrowings under the Company's Credit Facility. The acquired business, which will be part of the Company's Complex Systems segment and which is expected to add $25 million in projected annualized revenue, is engaged in the contract services business of manufacturing electromechanical controls and electronic assemblies. Their customer profile includes international Fortune 1000 manufacturers of highly reliable industrial excimer laser products, laser eye surgery sub-assemblies, target simulators for space and aviation systems, power modules for computerized tomography products, test systems for commercial aerospace OEMs, and toll road antennas and control boxes.
Complex Systems backlog was approximately $34.4 million and $39.7 million at June 30, 2014 and 2013, respectively. A majority of the June 30, 2014 Complex Systems backlog is currently expected to be realized within the next 12 months.
The majority of Sparton's Complex Systems customers are in highly regulated industries where strict adherence to regulations such as the International Tariff and Arms Regulations (“ITAR”) and regulations issued by the FDA and the Federal Aviation Administration (“FAA”) is necessary. These requirements are highly technical in nature and require strict adherence and documentation related to operational processes. Sparton's quality system provides us the ability to service such markets, differentiating Sparton from some potential competitors which lack such systems.
DSS Segment
Defense & Security segment operations are comprised of design, development and production of products for both domestic and foreign defense as well as commercial needs. Sparton designs and manufactures anti-submarine warfare ("ASW") devices known as sonobuoys for the U.S. Navy and foreign governments that meet Department of State licensing requirements. This segment also performs an engineering development function for the United States military and prime defense contractors for advanced technologies ultimately leading to future defense products as well as replacements for existing products. The sonobuoy product line is built to stringent military specifications. These products are restricted by International Tariff and Arms Regulations (“ITAR”) and qualified by the U.S. Navy, which limits opportunities for competition. Sparton is also a provider of ruggedized flat panel display systems for military panel PC workstations, air traffic control and industrial applications. Ruggedized displays are manufactured for prime contractors to specific military grade specifications. Additionally, this business unit internally develops and markets commercial products for underwater acoustics and microelectromechanical (“MEMS”)-based inertial measurement.
Sparton is partner to a 50/50 joint venture (“JV”) with UnderSea Sensor Systems, Inc. (“USSI”), the only other major producer of U.S. derivative sonobuoys. USSI's parent company is Ultra Electronics Holdings PLC, based in the United Kingdom. The JV operates under the name ERAPSCO and allows DSS and USSI to combine their own unique and complementary backgrounds to jointly develop and produce U.S. derivative sonobuoy designs for the U.S. Navy as well as foreign countries friendly to the U.S. In concept, and in practice, ERAPSCO serves as a pass-through entity maintaining no funds or assets. While the JV provides the opportunity to maximize efficiencies in the design and development of the related sonobuoys, both venture companies function independently as subcontractors; therefore, there is no separate entity to be accounted for or consolidated. The Board of Directors of ERAPSCO has the responsibility for the overall management and operation of the JV. The six member board consists of equal representation (full time employees) from both JV partners for three year terms. Manpower for ERAPSCO, specifically a president, vice president, general manager, contract administrator and financial manager, are similarly assigned by the JV partners for rotating three year terms and the costs of these assigned individuals are borne by the party assigning the personnel. In response to a customer request for proposal (“RFP”) that ERAPSCO will bid on, the Board of Directors of ERAPSCO approves both the composition of a response to the RFP and the composite bid to be submitted to the customer. The Board of Directors strives to divide the aggregate contract awards at a 50/50 share ratio. Each JV partner bears the costs it incurs associated with the preparation and submission of proposals. Each JV partner submits to ERAPSCO a proposal for the estimated price of performing that portion of the RFP applicable to it. Upon award of a contract to the JV, separate subcontracts are generated between ERAPSCO and each of the JV partners defining the responsibilities and compensation for each JV partner. These subcontracts contain terms and conditions consistent with the prime contract. Each JV partner is responsible to ERAPSCO for the successful execution of its respective scope of work under its subcontract and each JV partner is individually accountable for the profit or losses sustained in the execution of the subcontract against its respective bid. In some instances, either DSS or USSI handles the complete production and delivery of sonobuoys to ERAPSCO's customer. In other instances, either DSS or USSI starts the production and ship completed subassemblies to the other party for additional processing before being delivered to the customers. Under ERAPSCO, individual contract risk exposures are reduced, while the likelihood of achieving U.S. Navy and other ASW objectives is enhanced. ERAPSCO has been in existence for approximately twenty-six years and historically, the agreed upon products included under the JV were generally developmental or sonobuoys with low volume demand. Seven years ago, the JV expanded to include all future sonobuoy development and substantially all U.S. derivative sonobuoy products for customers
7
outside of the United States. The JV was further expanded two years later to include all sonobuoy products for the U.S. Navy beginning with U.S. Navy's 2010 fiscal year contracts.
While the ERAPSCO agreement provides certain benefits to Sparton as described above, the Company does not believe that it is substantially dependent upon this agreement to conduct its business. If in the future, Sparton determines that this commercial arrangement is no longer beneficial, the Company has the ability to terminate the joint venture in relation to future business awards and return to independent bidding for U.S. Navy and foreign government ASW awards.
New internally funded products are under development for sale as commercial products to the navigation, heading and positioning systems applications markets. Markets for these products include autonomous underwater and ground vehicles, as well as unattended aerial vehicles as our product offerings grow. The principal example of such products is a family of precision navigation sensors for applications such as navigation or undersea petroleum exploration. Competition among companies that build these products is intense and dynamic. As such, development of our commercial products requires the identification of sustainable competitive advantages (“SCA”) prior to investment to ensure there is a viable market for our products. Each new product must advance the technology available to the market enough to overcome the inherent inertia preventing potential customers from switching from competitor's products. Likewise, existing products are evaluated periodically to ensure their SCA is still maintained and if not, either redesign or end-of-life occurs. The expansion of our commercial product lines leverages the intrinsic engineering talent at DSS and capitalizes on the sonobuoy product volumes to provide technological as well as economies of scale advantages. Pursuit of commercial markets and all sales and profits from this endeavor are not a part of the ERAPSCO JV.
Sonobuoy and related engineering services, including sales to the U.S. Navy and foreign governments, accounted for approximately 28%, 28% and 34% of consolidated revenue for the fiscal years ended June 30, 2014, 2013 and 2012, respectively. Sales to the U.S Navy, including subcontract sales through ERAPSCO, accounted for 19%, 20% and 21% of consolidated revenue for the fiscal years ended June 30, 2014, 2013 and 2012, respectively. The U.S. Navy issues multiple contracts annually for its sonobuoy and engineering requirements. The loss of U.S. Navy sonobuoy sales would have a material adverse financial effect on the Company. While the overall relationship with the U.S. Navy is important to Sparton, the contracts with the U.S. Navy, including subcontracts through ERAPSCO, are such as ordinarily accompany the kind of business conducted by Sparton and the Company does not believe that it is substantially dependent on any individual contract or agreement with this customer, other than the Subcontract effective July 17, 2014 between Sparton DeLeon Springs, LLC and ERAPSCO that is considered a material contract to the Company and is filed as an exhibit to this Annual Report on Form 10-K (the "Subcontract"). Pursuant to the Subcontract, DSS will supply sonobouys to the U.S. Navy through ERAPSCO for a total contract value of approximately $90.5 million to Sparton DeLeon Springs, LLC.
On August 30, 2013, the Company completed the acquisition of certain assets and liabilities of Aydin Displays, Inc. ("Aydin Displays" or “Aydin”), located in Birdsboro, PA, in a $15.5 million all-cash transaction, after settlement of a $0.5 million working capital adjustment during the third quarter of the Company's fiscal 2014 year. The transaction was financed through the use of borrowings under the Company's Credit Facility. Additional acquisition consideration of up to $6.6 million is contingent upon Aydin attaining certain performance thresholds during the twelve month period following the transaction. The transaction includes an approximate $1.2 million escrowed holdback which is available to fund potential seller indemnification obligations in relation to the acquisition agreement. The acquired business, which is part of the Company's DSS segment and which is expected to add $18 million in annualized revenue, develops enhanced flat panel display and touch-screen solutions with application-critical performance criteria including ruggedization, high resolution, color accuracy, response/refresh times, sunlight readability and other criteria such as magnetic interference and emanations security for the Military & Aerospace and Civil Marine markets. These products are currently specified in the U.S. Navy P8A Poseidon ASW aircraft behind-the-cockpit control center, the command and control centers of many U.S. Navy ships, Federal Aviation Administration air traffic control systems, and cockpit command centers for various civil marine applications. The acquired business will continue to operate as Aydin Displays.
DSS backlog was approximately $32.4 million and $85.5 million at June 30, 2014 and 2013, respectively. A majority of the June 30, 2014 DSS backlog is currently expected to be realized within the next 18 months.
United States Navy contracts allow Sparton to submit performance based billings, which are then applied against inventories purchased and manufacturing costs incurred by the Company throughout its performance under these contracts. Inventories were reduced by performance based payments from the U.S. Navy for costs incurred related to long-term contracts, thereby establishing inventory to which the U.S. Navy then has title, of approximately $8.0 million and $15.2 million, respectively, at June 30, 2014 and 2013. At June 30, 2014 and 2013, current liabilities include performance based payments of $3.2 million and $20.9 million, respectively, on Navy contracts. As these payments are in excess of cost, there is no inventory to which the government would claim title and, therefore, no offset to inventory has been made.
8
During fiscal 2014, 2013 and 2012, DSS incurred internally funded research and development (“R&D”) expenses of $1.2 million, $1.3 million and $1.3 million, respectively, for the internal development of technologies for use in navigation and oil and gas exploration. Customer funded R&D costs, which are usually part of a larger production agreement, totaled approximately $9.7 million, $10.4 million and $8.6 million for the years ended June 30, 2014, 2013 and 2012, respectively.
DSS's business is affected by numerous laws and regulations relating to the award, administration and performance of U.S. Navy contracts. The U.S. Navy generally has the ability to terminate DSS contracts, in whole or in part, without prior notice, for convenience or for default based on performance. If any of these contracts were terminated for convenience, Sparton would generally be protected by provisions covering reimbursement for costs incurred on the contracts and profit on those costs, but not the anticipated profit that would have been earned had the contract been completed.
Other
Non-sonobuoy related manufacturing and services are sold primarily through a direct sales force. In addition, our divisional and executive management teams are an integral part of our sales and marketing teams.
While overall sales can fluctuate during the year in each of our segments, revenues for our Complex Systems and DSS segments are typically higher in the second half of the Company's fiscal year as compared to the first half. Various factors can affect the distribution of our revenue between accounting periods, including the timing of customer orders, including U.S. Navy and allied foreign government contract awards, the availability of government funding, production calendars, product deliveries and customer acceptance.
Materials for our operations are generally available from a variety of worldwide sources, except for selected components. Access to competitively priced materials is critical to success in our businesses. In certain markets, the volume purchasing power of our larger competitors creates a cost advantage for them. The Company has encountered availability and extended lead time issues on some electronic components due to strong market demand, and this condition resulted in higher prices and late deliveries. However, the Company does not expect to encounter significant long-term problems in obtaining sufficient raw materials. The risk of material obsolescence in our businesses is less significant than that which exists in many other markets since raw materials and component parts are generally purchased only upon receipt of a customer's order. However, excess material resulting from order lead-time is a risk factor due to potential order cancellation or design changes by customers.
Sparton earns revenues from United States based customers as well as international customers. Additionally, the Company has a manufacturing facility in Vietnam. Financial information regarding the Company's geographic sales concentration and locations of long-lived assets is presented in Note 17, Business, Geographic and Sales Concentration, of the Notes to Consolidated Financial Statements included in this Annual Report on Form 10-K.
At June 30, 2014, Sparton employed 1,483 people, including 98 contractors. None of the Company's employees are represented by a labor union. The Company considers employee relations to be good.
9
Executive Officers of the Registrant
Information with respect to executive officers of the Registrant is set forth below. The positions have been held for the periods noted.
Cary B. Wood | Chief Executive Officer since November 2008 and President since April 2009. Previously Mr. Wood held the position of Chief Operating Officer for Citation Corporation in Novi, MI since August 2004. (Age 47) | |
Mark Schlei | Senior Vice President and Chief Financial Officer since November 2012. Previously, Mr. Schlei held the position of Chief Financial Officer for Paperworks Industries, Inc. in Philadelphia, PA from November 2011 to February 2012. Prior to that date, Mr. Schlei was Chief Financial Officer at Thetford Corporation in Ann Arbor, MI from September 2004 to November 2011. (Age 51) | |
Gordon B. Madlock | Senior Vice President, Operations since January 2009. Previously, Mr. Madlock held the position of Senior Vice President of Operations for Citation Corporation in Novi, MI since September 1999. (Age 56) | |
Michael W. Osborne | Senior Vice President, Corporate Development since June 2012. Previously Mr. Osborne held the position of Senior Vice President, Corporate and Business Development since January 2009. Prior to that date, Mr. Osborne held the position of Vice President, Operations at The Niven Marketing Group in Carol Stream, IL since January 2006. Prior to that date, Mr. Osborne held the position of Vice President, Operations & Engineering at Gardner Bender in Milwaukee, WI since March 2004. (Age 43) | |
Steven M. Korwin | Senior Vice President, Quality and Engineering since September 2009. Previously, Mr. Korwin held the position of Group Vice President, Electronic Manufacturing Services since December 2008. Prior to that date, Mr. Korwin held the position of Vice President of Quality and Engineering for Citation Corporation in Novi, MI since October 2005. (Age 51) | |
Mike Gaul | Group Vice President, Medical Manufacturing since January 2014. Prior to that, Mr. Gaul held the position of General Manager of the Strongsville, Ohio medical manufacturing facility since September, 2011. Prior to that, Mr. Gaul held the positions of Vice President, Operations and COO at SynCardia Systems since April 2005. Prior to that, Mr. Gaul held the position of Vice President of Manufacturing Operations for Ventana Medical since May 2003. His industry experience includes Medical Devices and Reagents, Complex Capital Automation Equipment, Public Safety Communication System's and Industrial Controls and Instrumentation. (Age 60) | |
James M. Lackemacher | Group Vice President, DSS Engineered Products since January 2014. Previously, Mr. Lackemacher held the position of Vice President/General Manager, Defense and Security Systems Business Unit since April 2005. (Age 52) | |
Jamie Shaddix | Group Vice President, Military & Aerospace Manufacturing Services since January 2014. Prior to that, Mr. Shaddix held the position of General Manager of the Frederick, Colorado medical manufacturing facility since August, 2011. Prior to that, Mr. Shaddix held various positions including General Manager for Citation Corporation since July, 1999. (Age 50) | |
Lawrence R. Brand | Vice President, Human Resources since May 2011. Previously, Mr. Brand held the position of Director, Corporate Human Resources since February 2010. Prior to that date, Mr. Brand held the position of Senior Manager, Human Resources for Fellowes, Inc. in Itasca, IL since November 2004. (Age 47) | |
Christopher A. Ratliff | Vice President, Information Technology since March 2014. Previously, Mr. Ratliff held the position of Information Technologies Director for Tootsie Roll Industries in Chicago, IL since May 2003. (Age 49) | |
Jake Rost | Vice President, Business Development since June 2012. Previously, Mr. Rost held the position of Vice President/General Manager, Medical Business Unit since March 2011. Prior to that date, Mr. Rost held the position of Vice President, Business Development for Byers Peak since January 2007. (Age 45) | |
There are no family relationships among the persons named above. All officers are elected annually and serve at the discretion of the Board of Directors.
10
ITEM 1A. RISK FACTORS
We operate in a changing economic, political and technological environment that presents numerous risks, many of which are driven by factors that we cannot control or predict. The following discussion, as well as our “Critical Accounting Policies and Estimates” and “Management’s Discussion and Analysis” in Item 7, highlight some of these risks. The terms “Sparton,” “the Company,” “we,” “us,” and “our” refer to Sparton Corporation and subsidiaries.
The industry is extremely competitive and we depend on continued outsourcing by OEMs.
The Complex Systems and Medical industries in general are highly fragmented and intensely competitive. Our contract manufacturing services are available from many sources, and we compete with numerous domestic and foreign firms. Within Sparton’s target market, the high-mix, low- to medium-volume sector of the Complex Systems and Medical industries, there are substantially fewer competitors, but competition remains strong. Some competitors have substantially greater manufacturing, R&D, marketing or financial resources and, in some cases, have more geographically diversified international operations. Sparton expects competition to intensify further as more companies enter our target markets and our customers consolidate. In the future, increased competition from large electronic component manufacturers that are selling, or may begin to sell, electronics manufacturing services may occur. Future growth will depend on new outsourcing opportunities, and could be limited by OEMs performing such functions internally or delaying their decision to outsource.
DSS is partner to a 50/50 joint venture agreement with USSI, the only other major producer of U.S. derivative sonobuoys. If USSI were to terminate this joint venture, DSS would be required to return to independent bidding and production for U.S. Navy and other foreign country sonobuoy business. If this was to happen, it is possible that the Company’s future results could be negatively impacted. Starting with the 2014 U.S. Government fiscal year, the U.S. Navy opened up its sonobuoy contract bidding process potentially allowing additional competitors to vie for this business. While the Company believes that there are significant barriers to entry into the sonobuoy market, if a new competitor was able to successfully develop the necessary technical capabilities and gain entry into the market space, the Company’s future results could be negatively impacted.
In some cases, Sparton may not be able to offer prices as low as some competitors for a host of reasons. For example, those competitors may have lower cost structures for their services, they may be willing to accept business at lower margins in order to utilize more of their excess capacity, or they may be willing to take on business at low or even zero gross margins to gain entry into the Company’s markets. Upon the occurrence of any of these events, our net sales would likely decline. Periodically, we may be operating at a cost disadvantage compared to some competitors with greater direct buying power. As a result, competitors may have a competitive advantage and obtain business from our customers.
Principal competitive factors in our targeted markets are believed to be quality, reliability, the ability to meet delivery schedules, customer service, technological sophistication, geographic location and price. During periods of recession in the Complex Systems and Medical industries, our competitive advantages in the areas of adaptive manufacturing and responsive customer service may be of reduced importance due to increased price sensitivity. We also expect our competitors to continue to improve the performance of their current products or services, to reduce their current products or service sales prices and to introduce new products or services that may offer greater performance and improved pricing. Any of these could cause a decline in sales, loss of market acceptance of our products or services, profit margin compression, or loss of market share.
Our operating results are subject to general economic conditions and may vary significantly from period to period due to a number of factors.
We are subject to inflation, interest rate changes, availability of capital markets, consumer spending rates, the effects of governmental plans to manage economic conditions and other national and global economic occurrences beyond our control. Such factors, economic weakness, and constrained customer spending have resulted in the past, and may result in the future, in decreased revenue, gross margin, earnings or growth rates.
We can experience significant fluctuations in our annual and quarterly results of operations. In addition to general economic conditions, other factors that contribute to these fluctuations are our effectiveness in managing manufacturing processes and costs, as well as the level of capacity utilization of our manufacturing facilities and associated fixed costs, in order to maintain or increase profitability. The timing of our sonobuoy sales to the U.S. Navy is dependent upon access to the test range and successful passage of product tests performed by the U.S. Navy. Additionally, we rely on our customers’ demands, which can and do change dramatically, sometimes with little notice. Such factors also could affect our results of operations in the future.
11
Start-up costs and inefficiencies related to new or transferred programs can adversely affect our operating results and may not be recoverable.
Start-up costs, the management of labor and equipment resources in connection with new programs and new customer relationships and the need to estimate the extent and timing of required resources can adversely affect our profit margins and operating results. These factors are particularly evident with the introduction of new products and programs. The effects of these start-up costs and inefficiencies can also occur when new facilities are opened or programs are transferred from one facility to another.
If new programs or customer relationships are terminated or delayed, our operating results may be harmed, particularly in the near term. We may not be able to recoup our start-up costs or quickly replace these anticipated new program revenues.
We depend on limited or single source suppliers for some critical components; the inability to obtain components as required, with favorable purchase terms, could harm our business.
A significant portion of our costs are related to electronic components purchased to produce our products. In some cases our customers dictate that we purchase particular components from a single or limited number of suppliers. Supply shortages for a particular component can delay production, and thus delay shipments to customers and the associated revenue of all products using that component. This could cause the Company to experience a reduction in sales, increased inventory levels and costs, and could adversely affect relationships with existing and prospective customers. In the past, we have secured sufficient allocations of constrained components so that revenue was not materially impacted. The Company believes that alternative suppliers are available to provide the components, including unique components, necessary to manufacture our customers’ products. If, however, we are unable to procure necessary components under favorable purchase terms, including at favorable prices and with the order lead times needed for the efficient and profitable operation of our factories, our results of operations could suffer.
The Dodd-Frank Wall Street Reform and Consumer Protection Act (the “Dodd-Frank Act”) contains provisions to improve the transparency and accountability concerning the supply of minerals originating from the conflict zones of the Democratic Republic of Congo (“DRC”) and adjoining countries. As a result, the SEC established new annual disclosure and reporting requirements for those companies who use “conflict” minerals mined from the DRC and adjoining countries in their products. These requirements could affect the sourcing and availability of minerals used in the manufacturing of our electrical components. As a result, we may not be able to obtain products at competitive prices and there may be additional costs associated with complying with the new due diligence procedures as required by the SEC. Also, since our supply chain is complex, we may face reputational challenges with our customers and other stakeholders if we are unable to sufficiently verify the origins for all metals used in our products through the due diligence procedures that we implement. We may also encounter challenges to satisfy those customers who require that all of the components of our products are certified as conflict free. If we are not able to meet customer requirements, customers may choose to disqualify us as a supplier.
We are dependent on a few large customers; the loss of such customers or reduction in their demand could substantially harm our business and operating results.
For the fiscal year ended June 30, 2014, our ten largest customers, including the U.S. Navy, accounted for approximately 55% of total net sales. The U.S. Navy, a DSS customer through the Company’s ERAPSCO agreement, represented 19% of our total net sales in the same period. Fenwal Blood Technologies, a Medical customer, contributed 14% of total net sales in fiscal 2014. We expect to continue to depend upon a relatively small number of customers, but we cannot ensure that present or future large customers will not terminate, significantly change, reduce, or delay their manufacturing arrangements with us. During the Company's fiscal 2014 third quarter, Fenwal began a rebalancing of its program engagements with the Company. The rebalancing of Fenwal programs negatively affected comparative sales to this customer by $10.2 million in the second half of the Company's fiscal 2014 and is expected to negatively affect comparative sales to this customer by as much as $19 million in the Company's fiscal 2015, substantially all of which will be realized during the first half of that year. Because our major customers represent such a large part of our business, the loss of any of our major customers or reduced sales to these customers could negatively impact our business.
Additionally, the U.S. Navy generally has the ability to terminate DSS contracts, in whole or in part, without prior notice, for convenience or for default based on performance. If any of these U.S. Navy contracts were to be terminated for convenience, Sparton would generally be protected by provisions covering reimbursement for costs incurred on the contracts and profit on those costs, but not the anticipated profit that would have been earned had the contract been completed.
12
We rely on the continued growth and financial stability of our customers, including our major customers. Adverse changes in the end markets they serve can reduce demand from our customers in those markets and/or make customers in these end markets more price sensitive. Furthermore, mergers or restructurings among our customers or our customers’ customers could increase concentration or reduce total demand as the combined entities rationalize their business and consolidate their suppliers. Future developments, particularly in those end markets which account for more significant portions of our revenues, could harm our business and our results of operations.
Sparton also generates large accounts receivable in connection with its manufacturing services. If one or more of our customers experiences financial difficulty and is unable to pay for the services provided, our operating results and financial condition could be adversely affected. If our customers seek bankruptcy protection, they could act to terminate all or a portion of their business with us, originate new business with our competitors and terminate or assign our long-term supply agreements. Any loss of revenue from our major customers, including the non-payment or late payment of our invoices, could materially adversely affect our business, results of operations and financial condition.
Congressional budgetary constraints or reallocations can reduce our government sales.
Our U.S. Government contracts have many inherent risks that could adversely impact our financial results. Future governmental sales could be affected by a change in defense spending by the U.S. Government, or by changes in spending allocation that could result in one or more of our programs being reduced, delayed or terminated, which could adversely affect our financial results. The Company’s U.S. governmental sales are funded by the Federal budget. Changes in negotiations for program funding levels or unforeseen world events can interrupt the funding for a program or contract. The timing of sonobuoy sales to the U.S. Navy is dependent upon access to their test facilities and successful passage of their product tests. Any future reduction or interruption in access to the test range or changes in sonobuoy testing criteria may impact the consistency or predictability of our reported revenues.
Customer cancellations, reductions, or delays could adversely affect our operating results.
We generally do not obtain long-term purchase commitments from our customers. Customers may cancel orders, delay the delivery of orders or release orders for fewer products than we previously anticipated for a variety of reasons, including decreases in demand for their products and services. Such changes by a significant customer, by a group of customers, or by a single customer whose production is material to an individual facility could seriously harm results of operations in that period. In addition, since much of our costs and operating expenses are relatively fixed, a reduction in customer demand would adversely affect our margins and operating income. Although we are always seeking new opportunities, we cannot be assured that we will be able to replace deferred, reduced or cancelled orders.
Our inability to forecast the level of customer orders with much certainty makes it difficult to schedule production and maximize utilization of manufacturing capacity. Additionally, we are often required to place materials orders from vendors, some of which are non-cancelable, based on an expected level of customer volume. At June 30, 2014, non-cancelable purchase orders with vendors totaled approximately $49.9 million. If actual demand is higher than anticipated, we may be required to increase staffing and other expenses in order to meet such demand of our customers. Alternatively, anticipated orders from our customers may be delayed or fail to materialize, thereby adversely affecting our results of operations. Such customer order fluctuations and deferrals have had a material adverse effect on us in the past, and we may experience similar effects in the future.
Such order changes could cause a delay in the repayment to us for inventory expenditures we incurred in preparation for the customer’s orders or, in certain circumstances, require us to return the inventory to our suppliers, resell the inventory to another customer or continue to hold the inventory. In some cases, excess material resulting from longer order lead time is a risk due to the potential of order cancellation or design changes by customers. Additionally, dramatic changes in circumstances for a customer could also negatively impact the carrying value of our inventory for that customer.
The Company and its customers may be unable to keep current with technological changes.
Our customers participate in markets that have rapidly changing technology, evolving industry standards, frequent new product introductions, and relatively short product life cycles. The introduction of products embodying new technologies or the emergence of new industry standards can render existing products obsolete or unmarketable. Our success depends upon our customers’ ability to enhance existing products and to develop and introduce new products, on a timely and cost-effective basis, that keep pace with technological developments and emerging industry standards, and address increasingly sophisticated customer requirements. There is no assurance that our customers will do so, and any failure to do so could substantially harm our customers and us.
13
Additionally, our future success will depend upon our ability to maintain and enhance our own technological capabilities, develop and market manufacturing services and products which meet changing customer needs, and successfully anticipate or respond to technological changes in manufacturing processes on a cost-effective and timely basis. If we are unable to do so, business, financial condition and operating results could be materially adversely affected.
Our growth strategies could be ineffective due to the risks of further acquisitions.
Our growth strategy has included acquiring complementary businesses. We could fail to identify, finance or complete suitable acquisitions on acceptable terms and prices. Acquisition efforts could increase a number of risks, including diversion of management’s attention, difficulties in integrating systems and operations, potential loss of key employees and customers of the acquired companies and exposure to unanticipated liabilities, as well as the price we pay may exceed the value we realize. Our discovery of, or failure to discover, material issues during due diligence investigations of acquisition targets, either before closing with regard to potential risks of the acquired operations, or after closing with regard to the timely discovery of breaches of representations or warranties, could materially harm our business. Acquisitions also may result in the recording of goodwill and other intangible assets which are subject to potential impairments in the future that could harm our financial results.
Our current use of performance based billings within Government contracts may not continue.
Our current contracts with the U.S. Navy include provisions for certain billing and collection of funds from the Government in advance of related inventory purchases and incurrence of manufacturing expenses. These contractual provisions are an integral part of our capital and liquidity profile. While we have other sources of liquidity including, but not limited to, our operations, existing cash balances and our revolving line-of-credit, and we believe we have sufficient liquidity for our anticipated needs over the next 12 months, no assurances regarding liquidity can be made. The discontinuance of performance based billing provisions from future U.S. Navy contracts would require us to fund the working capital requirements related to these contracts from other sources and otherwise could materially adversely impact our business, results of operations and financial condition.
Fluctuations in foreign currency exchange rates could increase operating costs.
A portion of the Company’s operations and some customers are in foreign locations. As a result, transactions may occur in currencies other than the U.S. dollar. Currency exchange rates fluctuate on a daily basis as a result of a number of factors and cannot be easily predicted. Volatility in the U.S. dollar could seriously harm our business, operating results and financial condition. The primary impact of currency exchange fluctuations is on the adjustments related to the remeasurement of the Company’s Vietnamese financial statements into U.S. dollars, which are included in current earnings, as well as impacting the cash, receivables, payables, property and equipment of our operating entities. The Company currently does not use financial instruments to hedge foreign currency fluctuation and unexpected expenses could occur from future fluctuations in exchange rates.
Failure to attract and retain key personnel and skilled associates could hurt operations.
Our success depends to a large extent upon the continued services of key management personnel. While we have employment contracts in place with several of our executive officers, we nevertheless cannot be assured that we will retain our key employees, and the loss of service of any of these officers or key management personnel could have a material adverse effect on our business growth and operating results.
Our future success will require an ability to attract and retain qualified employees. Competition for such key personnel is intense, and we cannot be assured that we will be successful in attracting and retaining such personnel. Changes in the cost of providing pension and other employee benefits, including changes in health care costs, investment returns on plan assets, and discount rates used to calculate pension and related liabilities, could lead to increased costs in any of our operations.
Certain of our U.S. government contracts require our employees to maintain various levels of security clearances, and we are required to maintain certain facility security clearances complying with U.S. Government requirements. If our employees are unable to obtain security clearances in a timely manner, or at all, or if our employees who hold security clearances are unable to maintain the clearances or terminate employment with us, then a customer requiring classified work could terminate the contract or decide not to renew it upon its expiration. In addition, we expect that many of the contracts on which we will bid will require us to demonstrate our ability to obtain facility security clearances and employ personnel with specified types of security clearances.
To the extent we are not able to obtain facility security clearances or engage employees with the required security clearances for a particular contract, we may not be able to bid on or win new contracts, or effectively bid on expiring contracts.
14
The occurrence of litigation in which we could be named as a defendant is unpredictable.
Our business activities expose us to risks of litigation with respect to our customers, suppliers, creditors, shareholders, product liability, or environmental-related matters. We may incur significant expense to defend or otherwise address current or future claims. Any litigation, even a claim without merit, could result in substantial costs and diversion of resources, and could have a material adverse effect on our business and results of operations. Although we maintain insurance policies, we cannot assure you that this insurance will be adequate to protect us from all material judgments and expenses related to potential future claims or that these levels of insurance will be available in the future at economical prices or at all.
Adverse regulatory developments could harm our business.
Our business operates, and certain of our customers’ businesses operate, in heavily regulated environments. We must manage the risk of changes in or adverse actions under applicable law or in our regulatory authorizations, licenses and permits, governmental security clearances, government procurement regulations or other legal rights in order to operate our business, manage our work force, or import and export goods and services as needed. We also face the risk of other adverse regulatory actions, compliance costs, or governmental sanctions. The regulations and regulatory bodies include, but are not limited to, the following: the Federal Acquisition Regulations, the Truth in Negotiations Act, the False Claims Act and the False Statements Act, the Foreign Corrupt Practices Act, the Food and Drug Administration, the Federal Aviation Administration and the International Traffic in Arms Regulations.
Our failure to comply with applicable regulations, rules and approvals or misconduct by any of our employees could result in the imposition of fines and penalties, the loss of security clearances, the loss of our government contracts or our suspension or debarment from contracting with the U.S. government generally, any of which would harm our business, financial condition and results of operations. See also additional risk factors below relating to U.S. Government contract audits, securities laws regulations, environmental law regulations and foreign law regulations.
U.S. Government audits and investigations could adversely affect our business.
Federal government agencies, including the Defense Contract Audit Agency (“DCAA”) and the Defense Contract Management Agency (“DCMA”), routinely audit and evaluate government contracts and government contractors’ administrative processes and systems. These agencies review the Company’s performance on contracts, pricing practices, cost structure, financial capability and compliance with applicable laws, regulations and standards. They also review the adequacy of the Company’s internal control systems and policies, including the Company’s purchasing, accounting, estimating, compensation and management information processes and systems. Any costs found to be improperly allocated to a specific contract will not be reimbursed, while such costs already reimbursed must be refunded. If an audit or investigation of our business were to uncover improper or illegal activities, then we could be subject to civil and criminal penalties and administrative sanctions, including termination of contracts, forfeiture of profits, suspension of payments, fines and suspension or prohibition from doing business with the U.S. Government. In addition, responding to governmental audits or investigations may involve significant expenses and divert management attention. If any of the forgoing were to occur, our financial condition and operating result could be materially adversely affected.
The efficiency of our operations could be adversely affected by disruptions to our Information Technology (IT) Services.
We rely in part on various IT systems to manage our operations and to provide analytical information to management. In addition, a significant portion of internal communications, as well as communication with customers and suppliers depends on information technology. We are exposed to the risk of cyber incidents in the normal course of business. Cyber incidents may be deliberate attacks for the theft of intellectual property or other sensitive information or may be the result of unintentional events. Like most companies, the Company's information technology systems may be vulnerable to interruption due to a variety of events beyond the Company's control, including, but not limited to, natural disasters, terrorist attacks, power and/or telecommunications failures, computer viruses, hackers and other security issues. The Company has technology security initiatives and disaster recovery plans in place to mitigate the Company's risk to these vulnerabilities, but these measures may not be adequate or implemented properly to ensure that the Company's operations are not disrupted. Potential consequences of a material cyber incident include damage to our reputation, litigation, inefficiencies or production down-times and increased cyber security protection and remediation costs. Such consequences could have a negative impact on our ability to meet customers’ orders, resulting in a delay or decrease to our revenue and a reduction to our operating margins.
15
Business disruptions could seriously harm our business and results of operations.
Increased international political instability, evidenced by threats and occurrence of terrorist attacks, conflicts in the Middle East and Asia, and strained international relations arising from these conflicts, may hinder our ability to do business. The political environment in communist countries can contribute to the threat of instability. While we have not been adversely affected as yet due to this exposure, one of our facilities is based in Vietnam, which is a communist country. These events have had and may continue to have an adverse impact on the U.S. and world economies, particularly customer confidence and spending, which in turn could affect our revenue and results of operations. The impact of these events on the volatility of the U.S. and world financial markets could increase the volatility of our securities and may limit the capital resources available to us, our customers and our suppliers.
Our operations could be subject to natural disasters, disease and other business disruptions, including earthquakes, power shortages, telecommunications failures, water shortages, tsunamis, floods, hurricanes, fires, pandemic outbreaks and other natural or manmade disasters, which could seriously harm our financial condition and increase our expenses. In the past, hurricanes have adversely impacted the performance of two of our production facilities located in Florida. We have a production facility outside Ho Chi Minh City, Vietnam. This area, in the tropics and close to the sea, may be vulnerable to storms, floods and typhoons.
If we are unable to maintain effective internal control over our financial reporting, investors could lose confidence in the reliability of our financial statements, which could result in a reduction in the value of our common stock.
As required by Section 404 of the Sarbanes-Oxley Act of 2002 (the "Sarbanes-Oxley Act"), the SEC adopted rules requiring public companies to include a report of management on the company’s internal control over financial reporting in their annual reports on Form 10-K. The report must contain an assessment by management of the effectiveness of our internal control over financial reporting. In addition, the independent registered public accounting firm auditing a company’s financial statements must attest to and report on the effectiveness of the company’s internal control over financial reporting, if the Company’s public equity float remains above certain thresholds.
We are continuing our comprehensive efforts to comply with Section 404 of the Sarbanes-Oxley Act. If we are unable to maintain effective internal control over financial reporting, this could lead us to issue a financial restatement or otherwise cause us to fail to meet our reporting obligations to the SEC or could result in a finding by our independent auditors of a significant deficiency or material weakness in our controls over financial reporting, which, in turn, could result in an adverse reaction to our stock in the financial markets due to a loss of confidence in the reliability of our financial statements.
We are subject to a variety of environmental laws, which expose us to potential liability.
Our operations are regulated under a number of federal, state, provincial, local and foreign environmental laws and regulations, which govern, among other things, the discharge of hazardous materials into the air and water, as well as the handling, storage and disposal of such materials. These laws and regulations include the Clean Air Act, the Clean Water Act, the Resource, Conservation and Recovery Act and the Comprehensive Environmental Response, Compensation and Liability Act, as well as analogous state and foreign laws. Compliance with these environmental laws is a significant consideration for us because we use various hazardous materials in our manufacturing processes. We may be liable under environmental laws for the cost of cleaning up properties we own or operate if they are or become contaminated by the release of hazardous materials, regardless of whether we caused the release, even if we fully comply with applicable environmental laws. In the event of contamination or violation of environmental laws, we could be held liable for damages including fines, penalties and the costs of remedial actions and could also be subject to revocation of our discharge permits. Any such penalties or revocations could require us to cease or limit production at one or more of our facilities, thereby harming our business. In addition, such regulations could restrict our ability to expand our facilities or could require us to acquire costly equipment, or to incur other significant expenses to comply with environmental regulations, including expenses associated with the recall of any non-compliant product.
16
Sparton has been involved with ongoing environmental remediation since the early 1980’s related to one of its former manufacturing facilities, located in Albuquerque, New Mexico (“Coors Road”). Although the Company entered into a long-term lease of the Coors Road property that was accounted for as a sale of property during fiscal 2010, it remains responsible for the remediation obligations related to its past operation of this facility. During the fourth quarter of fiscal 2014, Sparton completed a review of its remediation plan, which included remediation methods currently in use, desired outcomes, progress to date, anticipated progress over the next sixteen years, and estimated costs to complete the remediation plan by fiscal 2030, following the terms of a March 2000 consent decree. The Company’s minimum cost estimate is based upon existing technology and excludes certain legal costs, which are expensed as incurred. The Company’s estimate includes equipment and operating and maintenance costs for onsite and offsite pump and treat containment systems, as well as continued onsite and offsite monitoring. It also includes periodic reporting requirements. During this latest review, the Company found: additional concentrations of contaminants on-site that required clean-up actions previously not included within the remediation plan; progress to date on the removal of certain other on-site contaminants was taking place slower than previously anticipated; and that certain efficiencies regarding periodic reporting were not being realized as had been previously anticipated. The discovery of additional on-site contaminants, slower than expected removal rates of other on-site contaminants, and continued high periodic reporting costs added significant additional costs to the remediation project that are expected to continue for a number of years. As a result, the remaining estimated minimum future undiscounted costs of this financial liability increased to $8.2 million at June 30, 2014, thereby requiring a $4.2 million non-cash charge against operations in the fourth quarter of fiscal 2014. This charge is net of United States Department of Energy (“DOE”) reimbursements of $1.5 million expected to take place in future years, under the fiscal 2003 agreement between the Company and the DOE.
Uncertainties associated with environmental remediation contingencies are pervasive and often result in wide ranges of reasonably possible outcomes. Estimates developed in the early stages of remediation can vary significantly. Normally a finite estimate of cost does not become fixed and determinable at a specific point in time. Rather, the costs associated with environmental remediation become estimable over a continuum of events and activities that help to frame and define a liability. Factors which cause uncertainties for the Company include, but are not limited to, the effectiveness of the current work plans in achieving targeted results and proposals of regulatory agencies for desired methods and outcomes. It is possible that cash flows and results of operations could be materially affected by the impact of changes associated with the ultimate resolution of this contingency. At June 30, 2014, the Company estimates that it is reasonably possible, but not probable, that future environmental remediation costs associated with the Company’s past operations at the Coors Road property, in excess of amounts already recorded, could be up to $3.1 million before income taxes over the next sixteen years, with such amount expected to be offset by related reimbursement from the DOE of $1.0 million. See Item 3 — “Legal Proceedings” of this Annual Report on Form 10-K.
Operations outside of the United States may be affected by legal and regulatory risks, and government reviews, inquiries or investigations could harm the Company’s business.
The Company’s operations in Vietnam and the business it conducts outside the United States are subject to risks relating to compliance with legal and regulatory requirements in the United States as well as in local jurisdictions. Additionally, there is a risk of potentially higher incidence of fraud or corruption in certain foreign jurisdictions and greater difficulty in maintaining effective internal controls. From time to time, the Company may conduct internal investigations and compliance reviews to ensure that the Company is in compliance with applicable laws and regulations. Additionally, the Company could be subject to inquiries or investigations by government and other regulatory bodies. Any determination that the Company’s operations or activities are not in compliance with United States laws, including the Foreign Corrupt Practices Act, or various international laws and regulations could expose the Company to significant fines, penalties or other sanctions that may harm the business and reputation of the Company.
If we are not able to protect our intellectual property and other proprietary rights, we may be adversely affected.
Our success can be impacted by our ability to protect our intellectual property and other proprietary rights. We rely primarily on patents, trademarks, copyrights, trade secrets and unfair competition laws, as well as license agreements and other contractual provisions, to protect our intellectual property and other proprietary rights. However, a significant portion of our technology is not patented, and we may be unable or may not seek to obtain patent protection for this technology. Moreover, existing U.S. legal standards relating to the validity, enforceability and scope of protection of intellectual property rights offer only limited protection, may not provide us with any competitive advantages, and may be challenged by third parties. The laws of countries other than the United States may be even less protective of intellectual property rights. Accordingly, despite our efforts, we may be unable to prevent third parties from infringing upon or misappropriating our intellectual property or otherwise gaining access to our technology. If we fail to protect our intellectual property and other proprietary rights, then our business, results of operations or financial condition could be negatively impacted.
17
A tightened credit market, either nationally or globally, may adversely affect the availability of funds to us for working capital, liquidity requirements, and other purposes, which may adversely affect our cash flows and financial condition.
On November 15, 2012, we replaced our previous revolving line-of-credit facility with a new $65.0 million credit facility with BMO Harris Bank N.A.The credit facility expires on November 15, 2017. In July 2014, the Company exercised the accordian feature of its Credit Facility increasing lender commitments under the Facility by $35.0 million to a total of $100.0 million. For a summary of our banking arrangements, see Note 8, Debt, of the “Notes to Consolidated Financial Statements” in this Annual Report on Form 10-K. We anticipate that our credit facility will be a component of our available working capital during fiscal 2015 and continue to be available to fund potential acquisition activity. However, there are no assurances that the line-of-credit will be sufficient for all purposes. Additionally, if vendors of electronic components restrict or reduce credit to us for purchase of raw materials as a result of general market conditions, the vendor’s credit status, or our financial position, it could adversely affect liquidity, cash flows, and results of operations.
Our stock price may be volatile, and the stock is thinly traded, which may cause investors to lose most or part of their investment in our common stock.
The stock market may experience volatility that is often unrelated to the operating performance of any particular company or companies. If market-sector or industry-based fluctuations occur, our stock price could decline regardless of our actual operating performance, and investors could lose a substantial part of their investments. Moreover, if an active public market for our common stock is not sustained in the future, it may be difficult to resell such stock. Generally, our stock is thinly traded. When trading volumes are low, a relatively small buy or sell order can result in a relatively large change in the trading price of our common stock and investors may not be able to sell their securities at a favorable price.
ITEM 1B. UNRESOLVED STAFF COMMENTS
None.
ITEM 2. PROPERTIES
The following is a listing of Sparton’s principal properties as of June 30, 2014. As described below, Sparton owns some of these properties and leases others. These facilities provide a total of approximately 744,000 square feet of manufacturing and administrative space. There are manufacturing and office facilities at most locations. Sparton’s manufacturing facilities in aggregate are underutilized. Underutilized percentages vary by plant; however, ample space exists to accommodate expected growth. Sparton believes these facilities are suitable for its operations.
Segment/Location | Square Feet | Ownership | ||
Medical Segment: | ||||
Strongsville, Ohio | 60,000 | Owned | ||
Frederick, Colorado | 65,000 | Leased | ||
Watertown, South Dakota | 130,000 | Owned | ||
Plymouth, Minnesota | 10,000 | Leased | ||
Irvine, California | 30,000 | Leased | ||
Complex Systems Segment: | ||||
Brooksville, Florida | 136,000 | Owned | ||
Thuan An District, Binh Duong Province, Vietnam (Outside of Ho Chi Minh City) | 56,000 | Owned | ||
Plaistow, New Hampshire | 20,000 | Leased | ||
DSS Segment: | ||||
De Leon Springs, Florida | 183,000 | Owned | ||
Birdsboro, Pennsylvania | 41,000 | Leased | ||
Corporate Office: | ||||
Schaumburg, Illinois | 13,000 | Leased | ||
The Company’s Frederick, Colorado facility has approximately three years remaining on its initial lease term. The lease provides the Company the option to extend the term up to an additional five years.
The Company’s Plymouth, Minnesota facility has approximately seven years remaining on its lease term.
18
The Company’s Irvine, California facility has approximately two years remaining on its initial lease term. The lease provides the Company the option to extend the term up to an additional five years.
The Company’s Plaistow, New Hampshire facility has one and a half years remaining on its initial lease term. The lease provides the Company the option to extend the term up to an additional two years.
The Company’s Birdsboro, Pennsylvania facility has approximately four years remaining on its initial lease term. The lease provides the Company the option to extend the term up to an additional two periods of five years each, with the option to purchase the Premises at any time during the term.
The Company’s Schaumburg, Illinois Corporate Office has five years remaining on its lease term.
While the Company owns the building and other assets in Vietnam, the land is occupied under a long-term lease covering approximately 40 years of which approximately 31 years remain. This lease is prepaid, with the cost amortized over the term of the lease, and carried in other long-term assets on our balance sheet.
As of June 30, 2014, substantially all of our assets, including real estate, are pledged as collateral to secure any potential borrowings under our revolving line-of-credit facility (see Note 8, Debt, of the “Notes to Consolidated Financial Statements” in this Annual Report on Form 10-K).
ITEM 3. LEGAL PROCEEDINGS
Environmental Remediation
Sparton has been involved with ongoing environmental remediation since the early 1980’s related to one of its former manufacturing facilities, located in Albuquerque, New Mexico (“Coors Road”). Although the Company entered into a long-term lease of the Coors Road property that was accounted for as a sale of property during fiscal 2010, it remains responsible for the remediation obligations related to its past operation of this facility. During the fourth quarter of fiscal 2014, Sparton completed a review of its remediation plan, which included remediation methods currently in use, desired outcomes, progress to date, anticipated progress over the next sixteen years, and estimated costs to complete the remediation plan by fiscal 2030, following the terms of a March 2000 consent decree. The Company’s minimum cost estimate is based upon existing technology and excludes certain legal costs, which are expensed as incurred. The Company’s estimate includes equipment and operating and maintenance costs for onsite and offsite pump and treat containment systems, as well as continued onsite and offsite monitoring. It also includes periodic reporting requirements. During this latest review, the Company found: additional concentrations of contaminants on-site that required clean-up actions previously not included within the remediation plan; progress to date on the removal of certain other on-site contaminants was taking place slower than previously anticipated; and that certain efficiencies regarding periodic reporting were not being realized as had been previously anticipated. The discovery of additional on-site contaminants, slower than expected removal rates of other on-site contaminants, and continued high periodic reporting costs added significant additional costs to the remediation project that are expected to continue for a number of years. As a result, the remaining estimated minimum future undiscounted costs of this financial liability increased to $8.2 million at June 30, 2014, thereby requiring a $4.2 million non-cash charge against operations in the fourth quarter of fiscal 2014. This charge is net of United States Department of Energy (“DOE”) reimbursements of $1.5 million expected to take place in future years, under the fiscal 2003 agreement between the Company and the DOE, as further explained below. Of the $8.2 million financial liability, $0.6 million is classified as a current liability and included on the balance sheet in other accrued expenses.
In fiscal 2003, Sparton reached an agreement with the United States Department of Energy (“DOE”) and others to recover certain remediation costs. Under the settlement terms, Sparton received cash and obtained some degree of risk protection as the DOE agreed to reimburse Sparton for 37.5% of certain future environmental expenses in excess of $8.4 million incurred from the date of settlement, of which approximately $5.3 million has been expended as of June 30, 2014 toward the $8.4 million threshold. It is expected that the DOE reimbursements will commence in the years after fiscal 2020. At June 30, 2014, the Company recognized a $1.5 million long-term asset in relation to these expected reimbursements. Uncertainties associated with environmental remediation contingencies are pervasive and often result in wide ranges of reasonably possible outcomes. Estimates developed in the early stages of remediation can vary significantly. Normally a finite estimate of cost does not become fixed and determinable at a specific point in time. Rather, the costs associated with environmental remediation become estimable over a continuum of events and activities that help to frame and define a liability. Factors which cause uncertainties for the Company include, but are not limited to, the effectiveness of the current work plans in achieving targeted results and proposals of regulatory agencies for desired methods and outcomes. It is possible that cash flows and results of operations could be materially affected by the impact of changes associated with the ultimate resolution of this contingency. At June 30, 2014, the Company estimates that it is reasonably possible, but not probable, that future environmental remediation costs associated with the Company’s past operations at the Coors Road property, in excess of
19
amounts already recorded, could be up to $3.1 million before income taxes over the next sixteen years, with such amount expected to be offset by related reimbursement from the DOE of $1.0 million.
The Company and its subsidiaries are also involved in certain existing compliance issues with the EPA and various state agencies, including being named as a potentially responsible party at several sites. Potentially responsible parties (“PRP“s) can be held jointly and severally liable for the clean-up costs at any specific site. The Company’s past experience, however, has indicated that when it has contributed relatively small amounts of materials or waste to a specific site relative to other PRPs, its ultimate share of any clean-up costs has been minor. Based upon available information, the Company believes it has contributed only small amounts to those sites in which it is currently viewed as a PRP and that reasonably possible losses related to these compliance issues are immaterial.
U.S. Government Audits
Federal government agencies, including the Defense Contract Audit Agency (“DCAA”) and the Defense Contract Management Agency (“DCMA”), routinely audit and evaluate government contracts and government contractors’ administrative processes and systems. These agencies review the Company’s performance on contracts, pricing practices, cost structure, financial capability and compliance with applicable laws, regulations and standards. They also review the adequacy of the Company’s internal control systems and policies, including the Company’s purchasing, accounting, estimating, compensation and management information processes and systems.
DCAA has completed its most recent review of the Company's two Cost Accounting Standards Disclosure Statements for the Company and DSS. Corrective actions relating to this review have been implemented and during the fourth quarter of fiscal 2014, the Company received an adequate determination for both Disclosure Statements from DCMA.
Other
In addition to the foregoing, from time to time, the Company is involved in various legal proceedings relating to claims arising in the ordinary course of business. The Company is not currently a party to any other such legal proceedings, the adverse outcome of which, individually or in the aggregate, is expected to have a material adverse effect on our business, financial condition or results of operations.
ITEM 4. MINE SAFETY DISCLOSURES
Not applicable.
20
PART II
ITEM 5. MARKET FOR REGISTRANT’S COMMON EQUITY, RELATED STOCKHOLDER MATTERS AND ISSUER PURCHASES OF EQUITY SECURITIES
Market Information. Our common stock is traded on the New York Stock Exchange (“NYSE”) under the symbol “SPA”.
The table below sets forth the high and low closing prices of our common stock as reported by the NYSE for each quarter during the last two years:
Quarter | |||||||||||||||
1st | 2nd | 3rd | 4th | ||||||||||||
Year ended June 30, 2014 | |||||||||||||||
High | $ | 25.50 | $ | 27.95 | $ | 33.36 | $ | 30.81 | |||||||
Low | $ | 17.34 | $ | 24.16 | $ | 27.32 | $ | 24.87 | |||||||
Year ended June 30, 2013 | |||||||||||||||
High | $ | 12.69 | $ | 14.38 | $ | 15.50 | $ | 17.24 | |||||||
Low | $ | 9.52 | $ | 12.05 | $ | 13.33 | $ | 12.31 | |||||||
Holders. As of September 2, 2014, there were 395 record holders of our common stock. The number of record holders does not include beneficial owners whose shares are held in the names of banks, brokers, nominees or other fiduciaries.
Dividends. We have not paid dividends on our common stock during either fiscal 2014 or fiscal 2013. Other than in fiscal 2006, the Company has not declared or paid cash dividends on our common stock for many years. In addition, our credit facility prohibits us from declaring or paying any dividends on our capital stock in excess of $3.0 million during any fiscal year without obtaining prior approval from our credit facility providers.
Securities Authorized for Issuance Under Equity Compensation Plans. See our disclosure below in “Part III, Item 12. Security Ownership of Certain Beneficial Owners and Management and Related Stockholder Matters.”
21
Performance Graph. The performance graph below compares the cumulative total shareholder return on our common stock for the past five years against the cumulative total return of a broad market index (Russell 2000 Index) and a peer group index, which is composed of AeroVironment, Inc., American Science and Engineering, Inc., Analogic Corporation, AngioDynamics, Inc., API Technologies Corp., Astronics Corporation, Ducommun, Inc., Exactech, Inc., Greatbatch, Inc., IEC Electronics Corp., Key Tronic Corporation, LMI Aerospace, Inc, Maxwell Technologies, Inc., Mercury Systems, Inc., Micrel, Inc., Newport Corporation, Raven Industries, Inc., Sypris Solutions, Inc., SMTC Corp., Sigmatron International Inc. and Universal Electronics, Inc. The comparative peer group was selected based on a review of publicly available information about these companies and the Company’s determination that they are engaged in electronics manufacturing businesses similar to that of the Company or its reportable operating segments.
The graph assumes that $100.00 was invested in our common stock and in each index on June 30, 2009. The total return for the common stock and the indices used assumes the reinvestment of dividends, if any. The comparisons in the graph below are based upon historical data and are not indicative of, nor intended to forecast, future performance of our common stock.
Comparison of Cumulative Total Return
Among Sparton Corporation,
Russell 2000 Index and Peer Group Index
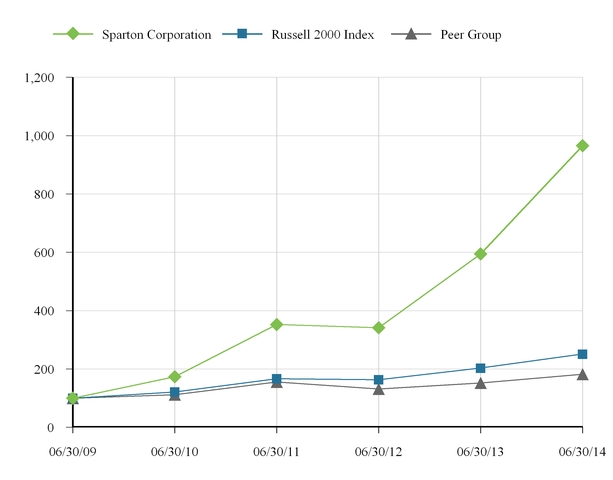
6/30/2009 | 6/30/2010 | 6/30/2011 | 6/30/2012 | 6/30/2013 | 6/30/2014 | ||||||||||||
Sparton Corporation | 100.00 | 173.45 | 352.41 | 341.38 | 594.48 | 956.55 | |||||||||||
Russell 2000 Index | 100.00 | 121.48 | 166.93 | 163.46 | 203.03 | 251.03 | |||||||||||
Peer Group | 100.00 | 111.55 | 155.27 | 131.36 | 151.79 | 181.89 | |||||||||||
22
ITEM 6. SELECTED FINANCIAL DATA
The following table sets forth a summary of selected financial data for the last five fiscal years. This selected financial data should be read in conjunction with “Management’s Discussion and Analysis of Financial Condition and Results of Operations” and our Audited Consolidated Financial Statements and, in each case, any related notes thereto included elsewhere in this report. (dollars in thousands, except per share amounts)
2014 (a) | 2013 (a) (b) | 2012 (a) (b) | 2011 (a) (b) | 2010 (b) | |||||||||||||||
Operating Results: | |||||||||||||||||||
Net sales | $ | 336,139 | $ | 264,627 | $ | 226,455 | $ | 200,080 | $ | 173,977 | |||||||||
Cost of goods sold | 271,686 | 219,192 | 187,423 | 167,615 | 147,394 | ||||||||||||||
Gross profit | 64,453 | 45,435 | 39,032 | 32,465 | 26,583 | ||||||||||||||
Selling and administrative expenses | 35,698 | 26,451 | 22,232 | 20,842 | 18,205 | ||||||||||||||
Internal research and development expenses | 1,169 | 1,300 | 1,293 | 1,110 | — | ||||||||||||||
Amortization of intangible assets | 3,287 | 1,575 | 435 | 545 | 467 | ||||||||||||||
Restructuring/impairment charges | 188 | 55 | (68 | ) | 75 | 4,076 | |||||||||||||
Gain on acquisition | — | — | — | (2,550 | ) | — | |||||||||||||
Gain on sale of property, plant and equipment | — | — | — | (139 | ) | (3,119 | ) | ||||||||||||
Impairment of intangible asset | — | — | — | 3,663 | — | ||||||||||||||
Impairment of goodwill | — | — | — | 13,153 | — | ||||||||||||||
EPA Related - net environmental remediation | 4,238 | — | — | — | — | ||||||||||||||
Other operating (income) expenses, net | (16 | ) | 13 | 65 | 298 | 1,232 | |||||||||||||
Operating income (loss) | 19,889 | 16,041 | 15,075 | (4,532 | ) | 5,722 | |||||||||||||
Other income (expense), net | (287 | ) | 131 | 41 | (114 | ) | (198 | ) | |||||||||||
Income (loss) before income taxes | 19,602 | 16,172 | 15,116 | (4,646 | ) | 5,524 | |||||||||||||
Provision for (benefit from) income taxes | 6,615 | 2,702 | 5,269 | (11,657 | ) | (1,916 | ) | ||||||||||||
Net income | $ | 12,987 | $ | 13,470 | $ | 9,847 | $ | 7,011 | $ | 7,440 | |||||||||
Weighted-Average Common Shares Outstanding: | |||||||||||||||||||
Common stock — basic | 10,109,915 | 10,193,530 | 10,174,176 | 10,217,494 | 9,972,409 | ||||||||||||||
Common stock — diluted | 10,141,395 | 10,228,687 | 10,208,810 | 10,225,368 | 9,972,409 | ||||||||||||||
Per Share of Common Stock — Income: | |||||||||||||||||||
Common stock — basic | $ | 1.28 | $ | 1.32 | $ | 0.97 | $ | 0.69 | $ | 0.75 | |||||||||
Common stock — diluted | $ | 1.28 | $ | 1.32 | $ | 0.96 | $ | 0.68 | $ | 0.75 | |||||||||
Shareholders’ equity — Per Share | $ | 10.87 | $ | 9.52 | $ | 8.21 | $ | 7.35 | $ | 6.30 | |||||||||
Cash Dividends — Per Share | $ | — | $ | — | $ | — | $ | — | $ | — | |||||||||
Other Financial Data: | |||||||||||||||||||
Total assets | $ | 198,980 | $ | 165,922 | $ | 144,278 | $ | 122,523 | $ | 119,522 | |||||||||
Working capital | $ | 75,443 | $ | 51,184 | $ | 59,839 | $ | 51,476 | $ | 38,333 | |||||||||
Working capital ratio | 2.83:1 | 1.92:1 | 2.08:1 | 2.23:1 | 1.85:1 | ||||||||||||||
Debt | $ | 41,000 | $ | 11,539 | $ | 1,669 | $ | 1,796 | $ | 1,917 | |||||||||
Shareholders’ equity | $ | 110,115 | $ | 96,072 | $ | 82,980 | $ | 75,200 | $ | 64,872 | |||||||||
(a) | Operating results of acquired businesses have been included in the Company’s consolidated financial results since the dates of respective acquisitions. The Company's consolidated financial results have also been adjusted for the DSS revenue recognition change, as described in Note 3, Change in Accounting Principle, of the Notes to the Consolidated Financial Statements included in this Annual Report on Form 10-K. |
(b) | Fiscal 2011 through fiscal 2013 reflect the retroactive impact of the Company's fiscal 2014 change in its revenue recognition policy related to its DSS sonobuoy sales. The Company was not able to determine the retroactive impact of this accounting change on its fiscal 2010 statement of income and; therefore, could not retroactively apply the accounting change to this period. June 30, 2010 balance sheet items above have been adjusted to reflect the retroactive impact. |
23
ITEM 7. MANAGEMENT’S DISCUSSION AND ANALYSIS OF FINANCIAL CONDITION AND RESULTS OF OPERATIONS
The following is an analysis of the Company’s results of operations, liquidity and capital resources and should be read in conjunction with the Consolidated Financial Statements and notes related thereto included in this Annual Report on Form 10-K. To the extent that the following Management’s Discussion and Analysis contains statements which are not of a historical nature, such statements are forward-looking statements which involve risks and uncertainties. These risks include, but are not limited to the risks and uncertainties discussed in “Item 1A Risk Factors” in this Annual Report on Form 10-K. The following discussion and analysis should be read in conjunction with the “Forward Looking Statements” and “Item 1A Risk Factors” each included in this Annual Report on Form 10-K.
Business Overview
General
Sparton Corporation and subsidiaries (the “Company” or “Sparton”) has been in continuous existence since 1900. It was last reorganized in 1919 as an Ohio corporation. The Company is a provider of design, development, and manufacturing services for complex electromechanical devices, as well as sophisticated engineered products complementary to the same electromechanical value stream. The Company serves the Medical & Biotechnology, Military & Aerospace and Industrial & Commercial markets through three reportable business segments; Medical Device (“Medical”), Complex Systems (“CS”) and Defense & Security Systems (“DSS”). Financial information by segment is presented in Note 16. All of the Company's facilities are certified to one or more of the ISO/AS standards, including ISO 9001, AS9100 or ISO 13485, with most having additional certifications based on the needs of the customers they serve. The Company's products and services include offerings for Original Equipment Manufacturers (“OEM”) and Emerging Technology (“ET”) customers that utilize microprocessor-based systems which include transducers, printed circuit boards and assemblies, sensors, and electromechanical components, as well as development and design engineering services relating to these product sales. Sparton also develops and manufactures sonobuoys, anti-submarine warfare (“ASW”) devices used by the United States Navy and other free-world countries. Many of the physical and technical attributes in the production of sonobuoys are similar to those required in the production of the Company's other electrical and electromechanical products and assemblies.
The Company uses an internal management reporting system, which provides important financial data to evaluate performance and allocate the Company's resources on a segment basis. Net sales are attributed to the segment in which the product is manufactured or service is performed. A segment's performance is evaluated based upon its operating income (loss). A segment's operating income (loss) includes its gross profit on sales less its selling and administrative expenses, including allocations of certain corporate operating expenses. Certain corporate operating expenses are allocated to segment results based on the nature of the service provided. Other corporate operating expenses, including certain administrative, financial and human resource activities as well as items such as interest expense, interest income, other income (expense) and income tax expense (benefit), are not allocated to operations and are excluded from segment profit. These costs are not allocated to the segments, as management excludes such costs when assessing the performance of the segments. Inter-segment transactions are generally accounted for at amounts that approximate arm's length transactions. Identifiable assets by segments are those assets that are used in each segment's operations. The accounting policies for each of the segments are the same as for the Company taken as a whole.
Medical Segment
Medical segment operations are comprised of contract design, manufacturing, and aftermarket repair and refurbishment of sophisticated medical and biotechnology devices and sub-assemblies. Customers include industry leaders, emerging technologies companies and start-ups. In manufacturing devices for its customers, this business unit follows specific design and manufacturing processes to assure product reliability and safety in accordance with Food and Drug Administration (“FDA”) guidelines and approvals. This group specializes in technologies, systems and processes required by medical OEM and ET customers primarily in the diagnostic, therapeutic, surgical and laboratory device segments of the medical and biotechnology marketplaces. The Medical segment also includes some non-medical customers.
Complex Systems Segment
Complex Systems segment operations are comprised of manufacturing and aftermarket repair and refurbishment of sophisticated printed circuit card assemblies, sub-assemblies, full product assemblies, and cable/wire harnesses. Customers include military and aerospace, as well as industrial and commercial OEM's. In manufacturing for its customers, this segment adheres to very strict military and aerospace specifications in addition to product and process certifications. Customers are primarily engaged in applications that include: flight controls, industrial and military control systems, cockpit displays, fuel system controls, secure communications, early warning detection, security systems, satellite communications, and audio. The CS segment also includes some medical customers.
24
DSS Segment
Defense & Security segment operations are comprised of design, development and production of products for both domestic and foreign defense as well as commercial needs. Sparton designs and manufactures anti-submarine warfare ("ASW") devices known as sonobuoys for the U.S. Navy and foreign governments that meet Department of State licensing requirements. This segment also performs an engineering development function for the United States military and prime defense contractors for advanced technologies ultimately leading to future defense products as well as replacements for existing products. The sonobuoy product line is built to stringent military specifications. These products are restricted by International Tariff and Arms Regulations (“ITAR”) and qualified by the U.S. Navy, which limits opportunities for competition. Sparton is also a provider of ruggedized flat panel display systems for military panel PC workstations, air traffic control and industrial applications. Ruggedized displays are manufactured for prime contractors to specific military grade specifications. Additionally, this business unit internally develops and markets commercial products for underwater acoustics and microelectromechanical (“MEMS”)-based inertial measurement.
Risks and Uncertainties
Sparton, as a high-mix, low to medium volume supplier, provides rapid product turnaround for customers. High-mix describes customers needing multiple product types with generally low to medium volume manufacturing runs. As a contract manufacturer with customers in a variety of markets, the Company has substantially less visibility of end user demand and, therefore, forecasting sales can be problematic. Customers may cancel their orders, change production quantities and/or reschedule production for a number of reasons. Depressed economic conditions may result in customers delaying delivery of product, or the placement of purchase orders for lower volumes than previously anticipated. Unplanned cancellations, reductions, or delays by customers may negatively impact the Company's results of operations. As many of the Company's costs and operating expenses are relatively fixed within given ranges of production, a reduction in customer demand can disproportionately affect the Company's gross margins and operating income. The majority of the Company's sales have historically come from a limited number of customers. Significant reductions in sales to, or a loss of, one of these customers could materially impact our operating results if the Company were not able to replace those sales with new business.
Other risks and uncertainties that may affect our operations, performance, growth forecasts and business results include, but are not limited to, timing and fluctuations in U.S. and/or world economies, sharp volatility of world financial markets over a short period of time, competition in the overall contract manufacturing business, availability of production labor and management services under terms acceptable to the Company, Congressional budget outlays for sonobuoy development and production, Congressional legislation, uncertainties associated with the outcome of litigation, changes in the interpretation of environmental laws and the uncertainties of environmental remediation and customer labor and work strikes. Further risk factors are the availability and cost of materials, as well as non-cancelable purchase orders we have committed to in relation to customer forecasts that can be subject to change. A number of events can impact these risks and uncertainties, including potential escalating utility and other related costs due to natural disasters, as well as political uncertainties such as the unrest in Africa and the Middle East and increased tension between Vietnam and China over oil rights in the South China Sea. Additional trends, risks and uncertainties include dependence on key personnel, risks surrounding acquisitions, uncertainties surrounding the global economy, U.S. healthcare legislation, U.S. budget sequestration and debt ceiling negotiations and the effects of those uncertainties on OEM behavior, including heightened inventory management, product development cycles and outsourcing strategies. Finally, the Sarbanes-Oxley Act, and more recently the Dodd-Frank Act, have required or will require changes in, and formalization of, some of the Company's corporate governance and compliance practices. The SEC and the New York Stock Exchange have also passed or will pass related rules and regulations requiring additional compliance activities, including those implementing the conflict minerals provisions of the Dodd-Frank Act. Compliance with these rules has increased administrative costs and may increase these costs further in the future. A further discussion of the Company’s risk factors has been included in Part I, Item 1A, “Risk Factors”, of this Annual Report on Form 10-K. Management cautions readers not to place undue reliance on forward-looking statements, which are subject to influence by the enumerated risk factors as well as unanticipated future events.
25
Acquisitions
Fiscal Year 2015
Electronic Manufacturing Technology, LLC.
On July 9, 2014, the Company completed the acquisition of Electronic Manufacturing Technology, LLC. (“eMT”). The purchase price of $18.5 million is subject to a final working capital adjustment and was financed through the use of borrowings under the Company's Credit Facility. The acquired business, which will be part of the Company's Complex Systems segment and which is expected to add $25 million (unaudited) in projected annualized revenue, is engaged in the contract services business of manufacturing electromechanical controls and electronic assemblies. Their customer profile includes international Fortune 1000 manufacturers of highly reliable industrial excimer laser products, laser eye surgery sub-assemblies, target simulators for space and aviation systems, power modules for computerized tomography products, test systems for commercial aerospace OEMs, and toll road antennas and control boxes. The transaction includes an approximate $2.4 million escrowed holdback which is available to fund any potential post-closing working capital adjustment and potential seller indemnification obligations in relation to the acquisition agreement.
The initial accounting for the acquisition is not complete pending detailed analyses of the facts and circumstances that existed as of the acquisition date.
Fiscal Year 2014
Aubrey Group, Inc.
On March 17, 2014, the Company completed the acquisition of Aubrey Group, Inc. ("Aubrey”), located in Irvine, CA, in a $5.3 million all-cash transaction, subject to certain post-closing adjustments and financed through the use of borrowings under the Company's Credit Facility. Additional consideration of approximately $0.6 million was paid at closing for cash of the business in excess of net customer deposits held by the Aubrey. At June 30, 2014, the Company has recognized accounts receivable of $0.3 million as consideration to be returned in relation to a post-closing working capital adjustment, which is expected to be settled in the first quarter of the Company's fiscal 2015 year. The transaction includes an approximate $0.5 million escrowed holdback which is available to fund any potential post-closing working capital adjustment and potential seller indemnification obligations in relation to the acquisition agreement.
The acquired business, a design and manufacturing company, which is part of the Medical segment and which is expected to add $8 million (unaudited) in annualized revenue, develops new products for OEMs in the Medical and Biotechnological markets. Inventors, entrepreneurs, and industry leading OEMs utilize Aubrey's design and engineering teams to develop innovative solutions in a timely manner in their efforts to deliver their new products into the marketplace faster and more cost effectively.
Total purchase consideration has been allocated to the tangible assets acquired and liabilities assumed based on their estimated fair values at the acquisition date. The Aubrey acquisition has resulted in approximately $4.5 million of goodwill, which is not expected to be deductible for tax purposes and has been assigned entirely to the Company's Medical segment. The Company believes that goodwill primarily relates to strategic fit, resulting synergies and the acquired workforce that this business brings to existing operations.
Included in the Company’s Consolidated Statements of Income for the year ended June 30, 2014 are net sales of approximately $2.2 million and loss before provision for income taxes of approximately $0.3 million, since the March 17, 2014 acquisition of Aubrey.
The Company incurred legal, professional and other costs related to this acquisition aggregating approximately $0.3 million. These costs were recognized as selling and administrative expenses in the year ended June 30. 2014 and reflected as non-segment corporate and other unallocated costs.
Beckwood Services, Inc.
On December 11, 2013, the Company completed the acquisition of Beckwood Services, Inc. ("Beckwood”), located in Plaistow, N.H., in a $15.3 million all-cash transaction financed through the use of cash on hand and borrowings under the Company's Credit Facility. The transaction includes an approximate $1.5 million escrowed holdback which is available to fund potential seller indemnification obligations in relation to the acquisition agreement.
26
The acquired business, which is part of the Company's Complex Systems segment and which is expected to add $18 million (unaudited) in annualized revenue, develops electronic or electro-mechanical controls and electronic assemblies. Their customer profile includes international Fortune 1000 manufacturers of industrial control systems, analytical instruments, measuring and detecting equipment and military, defense and Homeland Security equipment.
Total purchase consideration has been allocated to the tangible assets acquired and liabilities assumed based on their estimated fair values at the acquisition date. The Beckwood acquisition has resulted in approximately $6.7 million of goodwill, which is not expected to be deductible for tax purposes and has been assigned entirely to the Company’s Complex Systems segment. The Company believes goodwill primarily relates to strategic fit, resulting synergies and the acquired workforce that this business brings to existing operations.
Included in the Company’s Consolidated Statements of Income for the year ended June 30, 2014 are net sales of approximately $9.5 million and income before provision for income taxes of approximately $0.2 million, since the December 11, 2013 acquisition of Beckwood.
The Company incurred legal, professional and other costs related to this acquisition aggregating approximately $0.2 million for the year ended June 30, 2014. These costs were recognized as selling and administrative expenses and reflected as non-segment corporate and other unallocated costs.
Aydin Displays, Inc.
On August 30, 2013, the Company completed the acquisition of certain assets and liabilities of Aydin Displays, Inc. ("Aydin Displays" or “Aydin”), located in Birdsboro, PA, in a $15.5 million all-cash transaction, after settlement of a $0.5 million working capital adjustment during the third quarter of the Company's fiscal 2014 year. The transaction was financed through the use of borrowings under the Company's Credit Facility. Additional acquisition consideration of up to $6.6 million is contingent upon Aydin attaining certain performance thresholds during the twelve month period following the transaction. The transaction includes an approximate $1.2 million escrowed holdback which is available to fund potential seller indemnification obligations in relation to the acquisition agreement.
The acquired business, which is part of the Company's DSS segment and which is expected to add $18 million (unaudited) in annualized revenue, develops enhanced flat panel display and touch-screen solutions with application-critical performance criteria including ruggedization, high resolution, color accuracy, response/refresh times, sunlight readability and other criteria such as magnetic interference and emanations security for the Military & Aerospace and Civil Marine markets. These products are currently specified in the U.S. Navy P8A Poseidon ASW aircraft behind-the-cockpit control center, the command and control centers of many U.S. Navy ships, Federal Aviation Administration air traffic control systems, and cockpit command centers for various civil marine applications. The acquired business will continue to operate as Aydin Displays.
Total purchase consideration has been allocated to the tangible assets acquired and liabilities assumed based on their estimated fair values at the acquisition date. Additional acquisition consideration of up to $6.6 million is contingent upon Aydin attaining certain performance thresholds. The Company has assigned no fair value to this contingent liability. The Aydin acquisition has resulted in approximately $2.2 million of goodwill, which is expected to be deductible for tax purposes and has been assigned entirely to the Company’s DSS segment. The Company believes goodwill primarily relates to strategic fit, resulting synergies and the acquired workforce that this business brings to existing operations.
Included in the Company’s Consolidated Statements of Income for the year ended June 30, 2014 are net sales of approximately $14.3 million and income before provision for income taxes of approximately $0.9 million, since the August 30, 2013 acquisition of Aydin.
The Company incurred legal, professional and other costs related to this acquisition aggregating approximately $0.3 million for the year ended June 30, 2014. These costs were recognized as selling and administrative expenses and reflected as non-segment corporate and other unallocated costs.
Fiscal Year 2013
Creonix, LLC
On June 6, 2013, the Company completed the acquisition of certain assets related to the contract manufacturing business of Creonix, LLC (“Creonix”) in a $2.0 million all-cash transaction, after settlement of a $0.1 million working capital adjustment during the second quarter of the Company's fiscal 2014 year. The transaction was financed through the use of borrowings under the Company's Credit Facility.
27
The acquired business, which is reported in the Company's Complex Systems segment, provides the Company with the capability of cable and wire harness engineering and assembly. Additionally, the acquisition provides further expansion into the Industrial and Military & Aerospace markets, diversifies Sparton's customer base and increases utilization of the Company's existing assets through the consolidation of this business into Complex Systems's Brooksville, Florida plant. Creonix primarily manufactures products and components for battery monitoring, high speed optical imaging, neuromuscular incapacitation, imaging and wiring assemblies for military applications, and electrical grid transformer protection systems.
Onyx EMS, LLC
On November 15, 2012, the Company completed the acquisition of Onyx EMS, LLC (“Onyx”) in a $43.25 million all-cash transaction, subject to certain post-closing adjustments, which was financed through the use of Company cash and borrowings under the Company's Credit Facility. Additional consideration of $2.19 million was paid in relation to a post-closing working capital adjustment, which was settled in the Company's fiscal 2013 third quarter. The transaction includes an approximate $4.3 million escrowed holdback which is available to fund potential seller indemnification obligations in relation to the acquisition agreement.
The acquired business, which is reported in the Company's Medical segment, provides further expansion regionally into the Minneapolis medical device corridor, diversifying the Company's customer base through both existing programs and a strong business development pipeline, and increases the number of complex sub-assembly and full device programs within Sparton. Additionally, Onyx brings long-term customers which can utilize Sparton's expanded list of service offerings such as our low cost country footprint in Vietnam and full engineering design capabilities. Onyx primarily manufactures medical devices for OEM and ET companies, including products for cardiovascular diagnostics, hearing assistance, patient temperature and warming, point-of-care diagnostics, and surgical equipment used in intraosseous medicine. Onyx also produces products such as precision measurement instruments for monitoring air quality and pollution, commercial fire and smoke alarm systems, sensing tools, test fixtures, and complex LED assemblies.
Consolidated Results of Operations
Presented below are more detailed comparative data and discussions regarding our consolidated and reportable segment results of operations for the year ended June 30, 2014 compared to the year ended June 30, 2013, and the year ended June 30, 2013 compared to the year ended June 30, 2012.
For the Year ended June 30, 2014 compared to the Year ended June 30, 2013
The following table presents consolidated statements of income data as a percentage of net sales for the years ended June 30, 2014 and 2013 (dollars in thousands):
2014 | 2013 | ||||||||||||
Total | % of Sales | Total | % of Sales | ||||||||||
Net sales | $ | 336,139 | 100.0 | % | $ | 264,627 | 100.0 | % | |||||
Cost of goods sold | 271,686 | 80.8 | 219,192 | 82.8 | |||||||||
Gross profit | 64,453 | 19.2 | 45,435 | 17.2 | |||||||||
Selling and administrative expenses | 35,698 | 10.6 | 26,451 | 10.0 | |||||||||
Internal research and development expenses | 1,169 | 0.3 | 1,300 | 0.5 | |||||||||
Amortization of intangible assets | 3,287 | 1.0 | 1,575 | 0.6 | |||||||||
Restructuring charges | 188 | 0.1 | 55 | — | |||||||||
EPA Related - net environmental remediation | 4,238 | 1.3 | — | — | |||||||||
Other operating (income) expense, net | (16 | ) | — | 13 | — | ||||||||
Operating income | 19,889 | 5.9 | 16,041 | 6.1 | |||||||||
Total other income (expense), net | (287 | ) | (0.1 | ) | 131 | — | |||||||
Income before provision for income taxes | 19,602 | 5.8 | 16,172 | 6.1 | |||||||||
Provision for income taxes | 6,615 | 2.0 | 2,702 | 1.0 | |||||||||
Net income | $ | 12,987 | 3.8 | % | $ | 13,470 | 5.1 | % | |||||
28
The following table presents net sales by reportable segment for the years ended June 30, 2014 and 2013 (dollars in thousands):
2014 | 2013 | |||||||||||||||
Sales | % of Total | Sales | % of Total | % Change | ||||||||||||
SEGMENT | ||||||||||||||||
Medical | $ | 162,648 | 48.4 | % | $ | 146,873 | 55.5 | % | 10.7 | % | ||||||
Complex Systems | 83,119 | 24.7 | 60,649 | 22.9 | 37.0 | |||||||||||
DSS | 109,134 | 32.5 | 75,430 | 28.5 | 44.7 | |||||||||||
Eliminations | (18,762 | ) | (5.6 | ) | (18,325 | ) | (6.9 | ) | 2.4 | |||||||
Totals | $ | 336,139 | 100.0 | % | $ | 264,627 | 100.0 | % | 27.0 | |||||||
The following table presents gross profit and gross profit as a percent of net sales by reportable segment for the years ended June 30, 2014 and 2013 (dollars in thousands):
2014 | 2013 | ||||||||||||
Gross Profit | GP% | Gross Profit | GP% | ||||||||||
SEGMENT | |||||||||||||
Medical | $ | 25,190 | 15.5 | % | $ | 21,287 | 14.5 | % | |||||
Complex Systems | 9,230 | 11.1 | 6,388 | 10.5 | |||||||||
DSS | 30,033 | 27.5 | 17,760 | 23.5 | |||||||||
Totals | $ | 64,453 | 19.2 | $ | 45,435 | 17.2 | |||||||
The following table presents operating income (loss) and operating income (loss) as a percent of net sales for the years ended June 30, 2014 and 2013 (dollars in thousands):
2014 | 2013 | ||||||||||||
Operating Income | % of Sales | Operating Income | % of Sales | ||||||||||
SEGMENT | |||||||||||||
Medical | $ | 12,561 | 7.7 | % | $ | 11,602 | 7.9 | % | |||||
Complex Systems | 4,106 | 4.9 | 3,553 | 5.9 | |||||||||
DSS | 19,943 | 18.3 | 11,525 | 15.3 | |||||||||
Corporate and other unallocated | (16,721 | ) | — | (10,639 | ) | — | |||||||
Totals | $ | 19,889 | 5.9 | $ | 16,041 | 6.1 | |||||||
Medical
Included in the results for the Company’s Medical segment for the year ended June 30, 2014 are net sales of approximately $57.6 million resulting from the acquisition of Onyx and Aubrey compared to $31.2 million in net sales from the acquisition of Onyx in the prior year. Excluding the $26.4 million in incremental sales from the acquisition of Onyx and Aubrey, legacy Medical sales decreased approximately $10.6 million, or 9%, for the year ended June 30. 2014 as compared to the prior year. This comparative decrease primarily reflects a rebalancing of Fenwal Blood Technologies' program engagements with the Company that began in the Company's fiscal 2014 third quarter. Medical sales are dependent on a small number of key strategic customers. Fenwal Blood Technologies contributed 14% and 20% of consolidated Company net sales during the year ended June 30, 2014 and 2013 , respectively. The rebalancing of Fenwal programs negatively affected comparative sales to this customer by $10.2 million in the second half of the Company's fiscal 2014 and is expected to negatively affect comparative sales to this customer by as much as $19 million in the Company's fiscal 2015, substantially all of which will be realized during the first half of that year. Medical backlog was approximately $80.3 million at June 30, 2014 compared to $74.6 at June 30, 2013. Commercial orders, in general, may be rescheduled or canceled without significant penalty, and, as a result, may not be a meaningful measure of future sales. A majority of the June 30, 2014 Medical backlog is currently expected to be realized in the next 12 months.
Gross profit varies from period to period and can be affected by a number of factors, including product mix, production efficiencies, capacity utilization, and costs associated with new program introduction. Gross profit percentage on Medical sales increased to 15.5% from 14.5% for the years ended June 30, 2014 and 2013, respectively. This increase in margin percentage
29
on Medical sales primarily reflects certain favorable product mix between the two years, partially offset by the negative effect of fixed overhead costs on lower legacy sales.
Selling and administrative expenses relating to the Medical segment were $10.5 million for the year ended June 30, 2014 compared to $8.1 million for the year ended June 30, 2013, primarily reflecting incremental direct and allocated expenses related to Aubrey and Onyx operations.
Amortization of intangible assets was $2.1 million and $1.6 million for the years ended June 30, 2014 and 2013, respectively. The increase relates to a full year of amortization of customer relationships and non-compete agreements acquired as part of the fiscal 2013 Onyx transaction.
Complex Systems
Included in the results for the Company’s Complex Systems segment for the year ended June 30, 2014 are net sales of approximately $20.2 million resulting from the acquisitions of Creonix and Beckwood compared to $0.3 million in net sales from Creonix in the prior year. Excluding these sales and an increase in intercompany sales of $0.4 million, CS sales to legacy external customers for the year ended June 30, 2014 increased $2.2 million, or 5%, as compared with the prior year. CS intercompany sales result primarily from the production of circuit boards that are then utilized in DSS product sales. These intercompany sales are eliminated in consolidation. CS backlog was approximately $34.4 million at June 30, 2014 compared to $39.7 million at June 30, 2013. Commercial orders, in general, may be rescheduled or canceled without significant penalty, and, as a result, may not be a meaningful measure of future sales. A majority of the June 30, 2014 CS backlog is currently expected to be realized in the next 12 months.
The gross profit percentage on CS sales increased to 11.1% for the year ended June 30, 2014 compared to 10.5% for the year ended June 30, 2013, primarily reflecting increased capacity utilization and favorable product mix between the comparative years.
Selling and administrative expenses relating to the CS segment were $3.9 million and $2.8 million for the years ended June 30, 2014 and 2013, respectively, primarily due to the inclusion of operating expenses of Creonix and Beckwood.
Amortization of intangible assets was $1.0 million for the year ended June 30, 2014 due to the acquisitions of Creonix and Beckwood.
Restructuring charges related to the CS segment were $0.2 million and $0.1 million for the years ended June 30, 2014 and 2013, respectively, relating to the consolidation of the recently acquired Creonix business into the Company's Brooksville, Florida facility. For a further discussion of this restructuring activity see Note 15, Restructuring Activities, of the "Notes to Consolidated Financial Statements" in this Annual Report.
Defense and Security Systems
Included in the results for the Company’s Defense and Security Systems segment for the year ended June 30, 2014 are net sales of approximately $14.3 million resulting from the acquisition of Aydin. Excluding the fiscal year 2014 incremental sales from the acquisition of Aydin, DSS legacy sales increased approximately $19.4 million, or 26%, in the year ended June 30, 2014 as compared with the period last year, reflecting increased sonobuoy sales to the U. S. Navy and foreign governments as well as increased U.S. Navy engineering sales. Total sales to the U.S. Navy for the full year ended June 30, 2014 and 2013 were approximately $63.2 million and $51.9 million, or 19% and 20%, respectively, of consolidated Company net sales for those periods. DSS backlog was approximately $32.4 million at June 30, 2014 compared to $85.5 million at June 30, 2013. A majority of the June 30, 2014 DSS backlog is currently expected to be realized in the next 14 months.
Gross margin percentage on DSS sales increased to 27.5% for the year ended June 30. 2014 compared to 23.5% for the year ended June 30, 2013. Gross profit percentage was positively affected in the current year by increased volume as well as favorable product mix as compared to the prior year.
Selling and administrative expenses relating to the DSS segment were $8.7 million and $4.9 million for the years ended June 30, 2014 and 2013, respectively, reflecting incremental expenses related to Aydin operations.
Internal research and development expenses reflect costs incurred for the internal development of technologies for use in navigation, oil and gas exploration and flat panel display technology. These costs include salaries and related expenses, contract labor and consulting costs, materials and the cost of certain research and development specific equipment. The Company
30
incurred $1.2 million and $1.3 million of internally funded research and development expenses for the years ended June 30, 2014 and 2013, respectively.
Corporate and Other Unallocated
Total corporate selling and administrative expenses were $20.9 million and $17.7 million for the years ended June 30, 2014 and 2013, respectively, or 6.2% and 6.7% of consolidated sales, respectively, reflecting relative economies of scale achieved due to the Company's growth between the two comparative quarters. Of these costs, $8.4 million and $7.1 million, respectively, were allocated to segment operations in each of these periods. Allocations of corporate selling and administrative expenses are based on the nature of the service provided and can fluctuate from period to period.
The Company recognized a $4.2 million EPA related - net environmental expense for the year ended June 30, 2014 in relation to ongoing environmental remediation the Company has been involved with since the early 1980’s. This non-cash charge in fiscal 2014 increases an existing liability and is expected to be realized over the next sixteen years. See Note 11, Commitments and Contingencies, of the “Notes to Consolidated Financial Statements” in this Annual Report on Form 10-K for a further discussion of the Company's environmental remediation activities.
Interest expense consists of interest and fees on the Company's outstanding debt and revolving credit facility, including amortization of financing costs and bond discount. Interest expense was $0.8 million and $0.5 million for the years ended June 30, 2014 and 2013, respectively. The comparative interest expense reflects comparative borrowings under the Company’s credit facility between the two periods and accelerated amortization of bond discount in relation to the redemption of the Company's Ohio Revenue Bonds, partially offset by lower facility fees in the current period as compared to the prior year period. See Note 8, Debt, of the “Notes to Consolidated Financial Statements” in this Annual Report on Form 10-K for a further discussion of debt.
The Company recognized an income tax provision of approximately $6.6 million, or approximately 33.7% of income before provision for income taxes, for the full year ended June 30, 2014. During the full year ended June 30, 2013, the Company recognized a $2.1 million income tax benefit with respect to the Company's investments in a Canadian subsidiary that held the Company's Canadian operations until these operations ceased during fiscal 2009. Excluding this discrete tax benefit, the Company recognized an income tax provision of approximately $4.8 million, or approximately 29.2%, of income before provision for income taxes, for the year ended June 30, 2013. See Note 9, Income Taxes, of the “Notes to Consolidated Financial Statements” in this Annual Report on Form 10-K for a further discussion of income taxes.
Due to the factors described above, the Company reported net income of $13.0 million ($1.28 per share, basic and diluted) for the year ended June 30, 2014, compared to net income of $13.5 million ($1.32 per share, basic and diluted) for the corresponding period last year.
For the Year ended June 30, 2013 compared to the Year ended June 30, 2012
The following table presents consolidated statements of income data as a percentage of net sales for the years ended June 30, 2013 and 2012 (dollars in thousands):
31
2013 | 2012 | ||||||||||||
Total | % of Sales | Total | % of Sales | ||||||||||
Net sales | $ | 264,627 | 100.0 | % | $ | 226,455 | 100.0 | % | |||||
Cost of goods sold | 219,192 | 82.8 | 187,423 | 82.8 | |||||||||
Gross profit | 45,435 | 17.2 | 39,032 | 17.2 | |||||||||
Selling and administrative expenses | 26,451 | 10.0 | 22,232 | 9.8 | |||||||||
Internal research and development expenses | 1,300 | 0.5 | 1,293 | 0.6 | |||||||||
Amortization of intangible assets | 1,575 | 0.6 | 435 | 0.2 | |||||||||
Restructuring charges | 55 | — | (68 | ) | — | ||||||||
Other operating expense, net | 13 | — | 65 | — | |||||||||
Operating income | 16,041 | 6.1 | 15,075 | 6.6 | |||||||||
Total other income, net | 131 | — | 41 | — | |||||||||
Income before provision for income taxes | 16,172 | 6.1 | 15,116 | 6.6 | |||||||||
Provision for income taxes | 2,702 | 1.0 | 5,269 | 2.3 | |||||||||
Net income | $ | 13,470 | 5.1 | % | $ | 9,847 | 4.3 | % | |||||
The following table presents net sales by reportable segment for the years ended June 30, 2013 and 2012 (dollars in thousands):
2013 | 2012 | |||||||||||||||
Sales | % of Total | Sales | % of Total | % Change | ||||||||||||
SEGMENT | ||||||||||||||||
Medical | $ | 146,873 | 55.5 | % | $ | 110,894 | 48.9 | % | 32.4 | % | ||||||
Complex Systems | 60,649 | 22.9 | 53,609 | 23.7 | 13.1 | |||||||||||
DSS | 75,430 | 28.5 | 76,980 | 34.0 | (2.0 | ) | ||||||||||
Eliminations | (18,325 | ) | (6.9 | ) | (15,028 | ) | (6.6 | ) | 21.9 | |||||||
Totals | $ | 264,627 | 100.0 | % | $ | 226,455 | 100.0 | % | 16.9 | |||||||
The following table presents gross profit and gross profit as a percent of net sales by reportable segment for the years ended June 30, 2013 and 2012 (dollars in thousands):
2013 | 2012 | ||||||||||||
Gross Profit | GP% | Gross Profit | GP% | ||||||||||
SEGMENT | |||||||||||||
Medical | $ | 21,287 | 14.5 | % | $ | 15,242 | 13.7 | % | |||||
Complex Systems | 6,388 | 10.5 | 5,762 | 10.7 | |||||||||
DSS | 17,760 | 23.5 | 18,028 | 23.4 | |||||||||
Totals | $ | 45,435 | 17.2 | $ | 39,032 | 17.2 | |||||||
The following table presents operating income (loss) and operating income (loss) as a percent of net sales for the years ended June 30, 2013 and 2012 (dollars in thousands):
2013 | 2012 | ||||||||||||
Operating Income | % of Sales | Operating Income | % of Sales | ||||||||||
SEGMENT | |||||||||||||
Medical | $ | 11,602 | 7.9 | % | $ | 8,685 | 7.8 | % | |||||
Complex Systems | 3,553 | 5.9 | 2,985 | 5.6 | |||||||||
DSS | 11,525 | 15.3 | 12,945 | 16.8 | |||||||||
Corporate and other unallocated | (10,639 | ) | — | (9,540 | ) | — | |||||||
Totals | $ | 16,041 | 6.1 | $ | 15,075 | 6.6 | |||||||
32
Medical
Included in the Company's Consolidated Statements of Income and the results for the Company's Medical segment for the year ended June 30, 2013 are net sales of approximately $31.2 million, gross profit of approximately $3.8 million and operating income of approximately $0.1 million, resulting from the acquisition of Onyx since November 15, 2012. Included in these results for the year ended June 30, 2013 is recognition as additional cost of goods sold of approximately $0.6 million gross profit capitalized as part of the purchase accounting for Onyx. Also included in these results are depreciation and amortization for the seven and one half months ended June 30, 2013 of approximately $2.6 million.
Excluding the fiscal year 2013 incremental sales from the acquisition of Onyx, legacy Medical sales increased approximately $4.8 million in the year ended June 30, 2013 as compared with the prior year. Reflected within the increase is $19.0 million of increased sales to this business unit's largest customer due to expanded demand for its programs and additional refurbishment service revenue which began in the second half of fiscal 2012. Additionally reflected is $2.7 million of increased sales to another customer to meet increased demand for its products. Partially offsetting these increases were decreased sales to three customers totaling $17.3 million. Decreased sales to one customer reflect the dual sourcing of certain of its programs with the Company during fiscal 2012. Decreased sales to the remaining two customers reflect these customers' disengagements during fiscal 2012. Several other customers in the aggregate accounted for the remaining sales variance. Medical sales are dependent on a small number of key strategic customers. Fenwal Blood Technologies contributed 20% and 15% of consolidated Company net sales during the years ended June 30, 2013 and 2012, respectively. Medical backlog was approximately $74.6 million at June 30, 2013 compared to $46.2 million at June 30, 2012.
Gross profit varies from period to period and can be affected by a number of factors, including product mix, production efficiencies, capacity utilization, and costs associated with new program introduction. The gross profit percentage on Medical sales increased to 14.5% for the year ended June 30, 2013 compared to 13.7% for the year ended June 30, 2012. This margin percentage on Medical sales comparison reflects certain favorable product mix between the two periods, partially offset by the impact of a non-cash capitalization of profit as part of the fair value accounting for the acquired inventory of Onyx and the impact of increased depreciation relating to the write-up in value of the Watertown, South Dakota facility assets in connection with the acquisition accounting for Onyx purchase. The capitalization of gross profit recognized as part of the purchase accounting for Onyx was fully recognized as additional cost of goods sold in the Company's second quarter statement of income and will not impact margin percentage in future periods.
Selling and administrative expenses relating to the Medical segment were $8.1 million and $6.2 million for the years ended June 30, 2013 and 2012, respectively. The current year period includes $2.5 million of incremental expenses related to the Company's acquired business in Watertown, South Dakota. The prior year period includes certain costs relating to changes in operational leadership in fiscal 2012.
Amortization of intangible assets was $1.6 million and $0.4 million for the years ended June 30, 2013 and 2012, respectively. The increase relates to amortization of customer relationships and non-compete agreements acquired as part of the Onyx transaction.
Complex Systems
Excluding an increase in intercompany sales of $3.1 million and $0.3 million of incremental sales from the acquisition of Creonix, legacy CS sales to external customers for the year ended June 30, 2013 increased $3.6 million as compared with the prior year, due primarily to $4.4 million of increased sales to four customers, reflecting relative demand for each of these customers' products. Partially offsetting these increases was $1.0 million of decreased sales to one customer reflecting this customer's inventory management efforts in the current year. CS intercompany sales result primarily from the production of circuit boards that are utilized in DSS product sales. These intercompany sales are eliminated in consolidation. CS backlog was approximately $39.7 million at June 30, 2013 compared to $25.5 million at June 30, 2012.
The gross profit percentage on CS sales remained relatively consistent at 10.5% for the year ended June 30, 2013 compared to 10.7% for the year ended June 30, 2012, reflecting increased capacity utilization, partially offset by unfavorable product mix between the comparable periods.
Selling and administrative expenses relating to the CS segment remained relatively consistent at $2.8 million for each of the years ended June 30, 2013 and 2012.
Restructuring charges related to the CS segment were $0.1 million for the year ended June 30, 2013 and relate to the consolidation of the recently acquired Creonix business into the Company's Brooksville, Florida facility. For a further discussion of this restructuring activity see Note 15, Restructuring Activities, of the "Notes to Consolidated Financial Statements" in this Annual Report.
33
Defense and Security Systems
DSS sales decreased approximately $1.6 million in the year ended June 30, 2013 as compared with the prior year, reflecting decreased sales to foreign governments and decreased engineering sales, partially offset by increased U.S. Navy sonobuoy production and digital compass sales in the current year. Total sales to the U.S. Navy in the years ended June 30, 2013 and 2012 were approximately $51.8 million and $47.6 million, respectively, or 20% and 21%, respectively, of consolidated Company net sales for each of those years. DSS backlog was approximately $85.5 million at June 30, 2013 compared to $76.7 million at June 30, 2012.
The gross profit percentage on DSS sales remained relatively consistent at 23.5% and 23.4% for the years ended June 30, 2013 and 2012, respectively. Gross profit percentage was adversely affected in fiscal 2013 by decreased foreign sonobuoy sales as compared to the prior year, partially offset by favorable product mix on increased U.S. Navy sonobuoy sales and the favorable impact of increased digital compass sales.
Selling and administrative expenses relating to the DSS segment were $4.9 million and $3.8 million for the years ended June 30, 2013 and 2012, respectively, primarily reflecting increased business development efforts and increased corporate allocated charges in the current fiscal year.
Internal research and development expenses reflect costs incurred for the internal development of technologies for use in navigation, heading and positioning systems applications. These costs include salaries and related expenses, contract labor and consulting costs, materials and the cost of certain research and development specific equipment. The Company incurred $1.3 million of internally funded research and development expenses in each of the years ended June 30, 2013 and 2012.
Corporate and Other Unallocated
Total corporate selling and administrative expenses were $17.7 million and $16.3 million for the years ended June 30, 2013 and 2012, respectively,with the increase primarily reflecting professional and travel expenses relating to the pursuit of acquisitions and costs related to the Company's overall transformation of its finance organization. Of these costs, $7.1 million and $6.8 million, respectively, were allocated to segment operations in each of these periods. Allocations of corporate selling and administrative expenses are based on the nature of the service provided and can fluctuate from period to period.
Interest expense consists of interest and fees on our outstanding debt and revolving credit facility, including amortization of financing costs. Interest expense was $0.5 million and $0.7 million for the years ended June 30, 2013 and 2012, respectively. Fiscal 2013 was favorably impacted by lower amortization of financing fees paid and lower facility fees as compared to the prior year period, partially offset by borrowings under the Company's new credit facility in the current period. See Note 8, Debt, of the “Notes to Consolidated Financial Statements” in this Annual Report on Form 10-K for a further discussion of debt.
Other income (expense), net for the year ended June 30, 2012 includes a gain on sale of investment of $0.1 million from the sale of the Company’s interest in Cybernet Systems Corporation.
The Company is responsible for income taxes in each jurisdiction in which it operates. During the year ended June 30, 2013, the Company recognized a $2.1 million income tax benefit with respect to the Company's investments in a Canadian subsidiary that held the Company's Canadian operations until these operations were ceased during fiscal 2009. Excluding this discrete tax benefit, the Company recorded income tax expense of approximately $4.8 million, or an effective rate of 29.2% for the year ended June 30, 2013 compared to an income tax expense of approximately $5.3 million, or an effective rate of approximately 34.8%, for the year ended June 30, 2012. The fiscal 2013 effective rate was favorably impacted in comparison to the rate in the prior year by the domestic manufacturing deduction and other non-recurring items. The use of this deduction in fiscal 2012 was limited to a greater extent than in the current year due to the greater use of net operating loss carryovers to offset Federal taxable income during that year. See Note 9, Income Taxes, of the “Notes to Consolidated Financial Statements” in this Annual Report on Form 10-K.
Due to the factors described above, the Company reported net income of $13.5 million ($1.32 per share, basic and diluted) for the year ended June 30, 2013, compared to net income of $9.8 million ($0.97 per share, basic and $0.96 per share, diluted) for the prior fiscal year.
Liquidity and Capital Resources
The Company has a $65.0 million credit facility with BMO Harris Bank N.A., consisting of a $35.0 million revolving line-of-credit facility (the “Revolving Credit”) to support the Company’s working capital needs and other general corporate purposes, and a $30.0 million acquisition loan commitment (the “Acquisition Facility” and together with the Revolving Credit, the “Credit Facility”) to finance permitted acquisitions. The Credit Facility expires on November 15, 2017, is secured by substantially all assets of the Company and provides for up to an additional $35.0 million in uncommitted loans available for
34
additional Revolving Credit loans or Acquisition loans. In July 2014, the Company exercised the accordian feature of its Credit Facility increasing lender commitments under the Facility by $35.0 million to a total of $100.0 million. As a condition of the Credit Facility, the Company is subject to certain customary covenants, which it was in compliance with at June 30, 2014. The Company had $41.0 million of borrowings drawn against the Credit Facility at June 30, 2014. See Note 8, Debt, of the “Notes to Consolidated Financial Statements” in this Annual Report on Form 10-K for a further discussion of the Company's debt.
Certain of the Company's DSS contracts allow for billings to occur when certain milestones under the applicable program are reached, independent of the amount shipped by Sparton as of such date. These performance based billings reduce the amount of cash that would otherwise be required during the performance of these contracts. As of June 30, 2014 and 2013, $3.2 million and $20.9 million, respectively, of proceeds from billings in excess of costs were received.
The Company currently expects to meet its liquidity needs through a combination of sources including, but not limited to, operations, existing cash balances, its revolving line-of-credit, anticipated continuation of performance based billings on certain DSS contracts and improvement in inventory management. With the above sources providing the expected cash flows, the Company currently believes that it will have sufficient liquidity for its anticipated needs over the next 12 months, but no assurances regarding liquidity can be made.
Operating activities provided $12.5 million, $2.9 million and $26.9 million of net cash flows in fiscal 2014, 2013 and 2012, respectively. Excluding changes in working capital, operating activities provided $26.1 million, $19.6 million and $16.2 million in fiscal 2014, 2013 and 2012, respectively, reflecting the Company’s relative operating performance during those years. Working capital used $13.6 million and $16.7 million of net cash flows in fiscal 2014 and 2013, respectively, and provided $10.7 million of net cash flows in fiscal 2012. Working capital related cash flows for fiscal 2014 primarily reflect the funding of production related to U.S. Navy contracts during the year in excess of performance based payments received and to a lesser degree, a decrease in accrued expenses, partially offset by decreased receivables and inventories. Fiscal 2013 working capital related cash flows primarily reflect increased accounts receivable and funding of production related to U.S. Navy contracts during the year in excess of performance based payments received and increased inventories. Fiscal 2012 working capital related cash flows primarily reflect collection of performance based billings related to U.S. Navy contracts in excess of the funding of production under those contracts as well as decreased inventories, partially offset by increased accounts receivable.
Cash flows used in investing activities in fiscal 2014, 2013 and 2012 totaled $39.0 million, $51.1 million and $2.2 million, respectively. Fiscal 2014 reflects the $15.5 million acquisition of Aydin, the $15.3 million acquisition of Beckwood and the $4.8 million acquisition of Aubrey, net of acquired cash. The Aydin and Aubrey acquisitions are subject to certain post-closing adjustments. The Aydin and Aubrey acquisitions were funded through borrowings under the Company’s Credit Facility. The Beckwood acquisition was funded through a combination of cash on hand and borrowings under the Company's Credit Facility. Fiscal 2013 reflects the $45.4 million acquisition of Onyx. Fiscal 2013 also reflects the $2.1 million acquisition of certain assets of Creonix. These two purchases were financed through the use of Company cash and borrowings under the Company's Credit Facility. Fiscal 2012 reflects the Company’s sale of its investment in Cybernet Systems Corporation for approximately $1.8 million. Capital expenditures for the years ended June 30, 2014, 2013 and 2012 were approximately $3.5 million, $3.9 million and $4.2 million, respectively. Proceeds from the sale of property, plant and equipment for the years ended June 30, 2014, 2013 and 2012 were approximately $0.1 million, $0.3 million and $0.3 million, respectively. Fiscal 2013 and 2012 proceeds from sale of property, plant and equipment represent receipt of its final two annual payments of approximately $0.3 million in relation to the long-term lease of its Coors Road property.
Cash flows provided by (used in) financing activities in fiscal 2014, 2013 and 2012 totaled $28.5 million, $7.3 million and $(2.3) million, respectively. Fiscal 2014 reflects $31.0 million of net borrowing under the Company's Credit Facility and the $1.6 million redemption of the Company's remaining Industrial Revenue Bonds. Fiscal year 2014 also reflects $0.5 million of tax benefits in excess of recorded stock-based compensation, the repurchase of $0.9 million of the Company's common stock under Company's stock repurchase plan (see below for a further discussion of this program), and $0.7 million of shares surrendered to cover taxes. Fiscal 2013 reflects $10.0 million of net borrowing under the Company's Credit Facility, the payment of $0.6 million of financing fees and the use of cash of $0.2 million to satisfy income tax withholding requirements in relation to the vesting of executives' restricted stock in exchange for the surrender of a portion of the vested shares. Fiscal 2013 additionally reflects the repurchase of $2.1 million of the Company’s common stock and $0.3 million of shares surrendered to cover taxes. The primary use of cash in fiscal 2012 was the repurchase of $3.0 million of the Company’s common stock. The Company received $0.1 million, $0.2 million and $0.5 million from the exercise of stock options during fiscal 2014, 2013, and 2012, respectively. Additionally, all three years reflect tax benefits in excess of recorded stock-based compensation.
On May 1, 2013, the Company’s Board of Directors approved a repurchase by the Company of up to $3.0 million of shares of its common stock over a 12-month period. The Company has been authorized to purchase shares from time to time in open market, block transactions and privately negotiated transactions at prices deemed appropriate by management, depending
35
on market conditions, applicable laws and other factors. The stock repurchase program does not require the Company to repurchase any specific number of shares and can be modified, extended or terminated by the Board of Directors at any time.
Pursuant to this stock repurchase program, during the year ended June 30, 2014, the Company purchased 47,119 shares of its common stock at an average price of $18.51 per share for approximately $0.9 million. Previously, during the year ended June 30, 2013, the Company purchased 128,158 shares of its common stock at an average price of $16.55 per share for approximately $2.1 million. Total shares purchased pursuant to this stock repurchase program total 175,277 at an average price of $17.08. Shares purchased under the plan were canceled upon repurchase. As of June 30, 2014, all authorized funds under the stock repurchase program have been expended.
On July 10, 2014, the Company completed the acquisition of Electronic Manufacturing Technology, LLC. (“eMT”). The purchase price of $18.5 million is subject to a final working capital adjustment and was financed through the use of borrowings under the Company's Credit Facility. The acquired business, which will be part of the Company's CS segment and which is expected to add $25 million (unaudited) in projected annualized revenue, is engaged in the contract services business of manufacturing electromechanical controls and electronic assemblies. Their customer profile includes international Fortune 1000 manufacturers of highly reliable industrial excimer laser products, laser eye surgery sub-assemblies, target simulators for space and aviation systems, power modules for computerized tomography products, test systems for commercial aerospace OEMs, and toll road antennas and control boxes.
Commitments and Contingencies
Please see “Part I, Item 3. Legal Proceedings” for a discussion regarding our commitments and contingencies.
Contractual Obligations
Future minimum contractual cash obligations for the next five years and in the aggregate at June 30, 2014, are as follows (dollars in thousands):
Payments Due By Period | |||||||||||||||||||
Total | Less than 1 Year | 2-3 Years | 4-5 Years | More than 5 Years | |||||||||||||||
Contractual obligations: | |||||||||||||||||||
Debt | $ | 41,000 | $ | — | $ | — | $ | 41,000 | $ | — | |||||||||
Cash interest (1) | 3,507 | 809 | 1,619 | 1,079 | — | ||||||||||||||
Performance based payments on customer contracts | 3,196 | 3,196 | — | — | — | ||||||||||||||
Operating leases (2) | 4,229 | 1,251 | 2,104 | 649 | 225 | ||||||||||||||
Environmental liabilities | 8,199 | 555 | 922 | 979 | 5,743 | ||||||||||||||
Non-cancelable purchase orders | 49,948 | 49,948 | — | — | — | ||||||||||||||
Total | $ | 110,079 | $ | 55,759 | $ | 4,645 | $ | 43,707 | $ | 5,968 | |||||||||
(1) | Cash interest reflects interest payments on the Company's Credit Facility discussed below. |
(2) | Does not include payments due under renewals to the original lease terms. |
Debt - The Company currently has $65.0 million credit facility with BMO Harris Bank N.A., as a lender and as agent for additional lenders and with Bank of America N.A. as an additional lender. The line-of-credit facility consists of a $35.0 million revolving line-of-credit facility (the “Revolving Credit”) to support the Company's working capital needs and other general corporate purposes, and a $30.0 million acquisition loan commitment (the “Acquisition Facility” and together with the Revolving Credit, the “Credit Facility”) to finance permitted acquisitions, including the acquisition of Onyx and Creonix. In July 2014, the Company exercised the accordian feature of its Credit Facility increasing lender commitments under the Facility by $35.0 million to a total of $100.0 million. See Note 8, Debt, of the “Notes to Consolidated Financial Statements” in this Annual Report on Form 10-K of this report for a further discussion of this line of credit.
Performance based payments on customer contracts — Certain of the Company’s DSS contracts allow for billings to occur when certain milestones under the applicable program are reached, independent of the amount shipped by Sparton as of such date. These performance based payments reduce the amount of cash that would otherwise be required during the performance of these contracts.
36
Operating leases — See Note 11, Commitments and Contingencies, of the “Notes to Consolidated Financial Statements” in this Annual Report on Form 10-K for further discussion of operating leases.
Environmental liabilities — See Note 11, Commitments and Contingencies, of the “Notes to Consolidated Financial Statements” in this Annual Report on Form 10-K of this report for a description of the accrual for environmental remediation. Of the $8.2 million total, $0.6 million is classified as a current liability and $7.6 million is classified as a long-term liability, both of which are included on the balance sheet as of June 30, 2014.
Non-cancelable purchase orders — Binding orders the Company has placed with suppliers that are subject to quality and performance requirements.
Off-Balance Sheet Arrangements
The Company has standby letters of credit outstanding of approximately $0.6 million at June 30, 2014, principally to support an operating lease agreement. Other than these standby letters of credit and the operating lease commitments included above, we have no off-balance sheet arrangements that would have a current or future material effect on our financial condition, changes in financial condition, revenue, expense, results of operations, liquidity, capital expenditures or capital resources.
Inflation
We believe that inflation has not had a significant impact in the past and is not likely to have a significant impact in the foreseeable future on our results of operations.
CRITICAL ACCOUNTING POLICIES AND ESTIMATES
The preparation of our consolidated financial statements in conformity with accounting principles generally accepted in the United States of America (“GAAP”) requires management to make estimates, judgments and assumptions that affect the amounts reported as assets, liabilities, revenues and expenses, and related disclosure of contingent assets and liabilities. Estimates are regularly evaluated and are based on historical experience and on various other assumptions believed to be reasonable under the circumstances. Actual results could differ from those estimates. In many cases, the accounting treatment of a particular transaction is specifically dictated by GAAP and does not require management’s judgment in application. There are also areas in which management’s judgment in selecting among available alternatives would not produce a materially different result. The Company believes that of its significant accounting policies discussed in Note 2 to the Consolidated Financial Statements, which is included in Item 8, the following involve a higher degree of judgment and complexity. Senior management has reviewed these critical accounting policies and related disclosures with the audit committee of Sparton’s Board of Directors.
Environmental Contingencies
One of Sparton’s former manufacturing facilities, located in Albuquerque, New Mexico (Coors Road), has been the subject of ongoing investigations and remediation efforts conducted with the EPA under the Resource Conservation and Recovery Act (“RCRA”). As discussed in Note 11, Commitments and Contingencies, of the “Notes to Consolidated Financial Statements” in this Annual Report on Form 10-K, Sparton has accrued its estimate of the minimum future non-discounted financial liability. The Company’s minimum cost estimate is based upon existing technology and excludes certain legal costs, which are expensed as incurred. The Company’s estimate includes equipment and operating and maintenance costs for onsite and offsite pump and treat containment systems, as well as continued onsite and offsite monitoring. It also includes periodic reporting requirements. Sparton recognizes certain legal costs in the periods incurred and reviews its EPA accrual activity quarterly. Uncertainties associated with environmental remediation contingencies are pervasive and often result in wide ranges of reasonably possible outcomes. Estimates developed in the early stages of remediation can vary significantly. Normally a finite estimate of cost does not become fixed and determinable at a specific point in time. Rather, the costs associated with environmental remediation become estimable over a continuum of events and activities that help to frame and define a liability. Factors which cause uncertainties for the Company include, but are not limited to, the effectiveness of the current work plans in achieving targeted results and proposals of regulatory agencies for desired methods and outcomes. It is possible that cash flows and results of operations could be materially affected by the impact of changes associated with the ultimate resolution of this contingency.
During the fourth quarter of fiscal 2014, Sparton completed a review of its remediation plan, which included remediation methods currently in use, desired outcomes, progress to date, anticipated progress over the next sixteen years, and estimated costs to complete the remediation plan by fiscal 2030, following the terms of a March 2000 consent decree. During this latest review, the Company found: additional concentrations of contaminants on-site that required clean-up actions previously not included within the remediation plan; progress to date on the removal of certain other on-site contaminants was taking place
37
slower than previously anticipated; and that certain efficiencies regarding periodic reporting were not being realized as had been previously anticipated. The discovery of additional on-site contaminants, slower than expected removal rates of other on-site contaminants, and continued high periodic reporting costs added significant additional costs to the remediation project that are expected to continue for a number of years. As a result, the remaining estimated minimum future undiscounted costs of this financial liability increased to $8.2 million at June 30, 2014, thereby requiring a $4.2 million non-cash charge against operations in the fourth quarter of fiscal 2014. This charge is net of United States Department of Energy (“DOE”) reimbursements of $1.5 million expected to take place in future years, under the fiscal 2003 agreement between the Company and the DOE. At June 30, 2014, the Company estimates that it is reasonably possible, but not probable, that future environmental remediation costs associated with the Company’s past operations at the Coors Road property, in excess of amounts already recorded, could be up to $3.1 million before income taxes over the next sixteen years, with such amount expected to be offset by related reimbursement from the DOE of $1.0 million.
Percentage-of-Completion Accounting
In the first quarter of fiscal 2014, the Company voluntarily changed its revenue recognition policy related to DSS sonobuoy sales to the U.S. Navy and foreign government customers under long-term contracts that require lot acceptance testing. The new policy continues to recognize revenue under the percentage of completion method, but changes the measurement of progress under these contracts from a completed units accepted basis (whereby revenue was recognized for each lot of sonobuoys produced when that lot was formally accepted by the customer) to a units-of-production basis (whereby revenue is recognized when production and internal testing of each lot of sonobuoys is completed). The Company now has significant experience in producing sonobuoys to customer specifications and internal testing to assess compliance with those specifications and, as such, now has an adequate history of continuous customer acceptance of all sonobuoys produced. Accordingly, the Company believes the new method is preferable primarily because it eliminates delays in revenue and related cost of goods sold recognition due to timing of customer testing and acceptance delays. Such delays commonly occur due to customer circumstances that are unrelated to the product produced. Under the new policy, the revenue and related costs of goods sold of these manufactured sonobuoy lots will more closely match the period in which the product was produced and the related revenue earned, thereby better reflecting the economic activity of the DSS segment. Additionally, this new method provides better matching of periodic operating expenses incurred during production. The Company additionally has certain other long-term contracts that are accounted for under the percentage-of-completion method of accounting, whereby contract revenues are recognized on a pro-rata basis based upon the ratio of costs incurred compared to total estimated contract costs. Contract costs include labor and material placed into production, as well as allocation of indirect costs.
Losses for the entire amount of long-term contracts are recognized in the period when such losses are determinable. Significant judgment is exercised in determining estimated total contract costs including, but not limited to, cost experience to date, estimated length of time to contract completion, costs for materials, production labor and support services to be expended and known issues on remaining units to be completed. In addition, estimated total contract costs can be significantly affected by changing test routines and procedures, resulting design modifications and production rework from these changing test routines and procedures, and limited range access for testing these design modifications and rework solutions. Estimated costs developed in the early stages of contracts can change, sometimes significantly, as the contracts progress, and events and activities take place. Changes in estimates can also occur when new designs are initially placed into production. The Company formally reviews its costs incurred-to-date and estimated costs to complete on all significant contracts at least quarterly and revised estimated total contract costs are reflected in the financial statements. Depending upon the circumstances, it is possible that the Company’s financial position, results of operations and cash flows could be materially affected by changes in estimated costs to complete on one or more significant government contracts.
Commercial Inventory Valuation
Valuation of commercial customer inventories requires a significant degree of judgment. These valuations are influenced by the Company’s experience to date with both customers and other markets, prevailing market conditions for raw materials, contractual terms and customers’ ability to satisfy these obligations, environmental or technological materials obsolescence, changes in demand for customer products, and other factors resulting in acquiring materials in excess of customer product demand. Contracts with some commercial customers may be based upon estimated quantities of product manufactured for shipment over estimated time periods. Raw material inventories are purchased to fulfill these customer requirements. Within these arrangements, customer demand for products frequently changes, sometimes creating excess and obsolete inventories.
The Company regularly reviews raw material inventories by customer for both excess and obsolete quantities. Wherever possible, the Company attempts to recover its full cost of excess and obsolete inventories from customers or, in some cases, through other markets. When it is determined that the Company’s carrying cost of such excess and obsolete inventories cannot be recovered in full, a charge is taken against income for the difference between the carrying cost and the estimated realizable amount. These cost adjustments for excess and obsolete inventory create a new cost basis for the inventory. The Company
38
recorded inventory write-downs totaling approximately $0.5 million, $0.6 million and $0.7 million for the years ended June 30, 2014, 2013 and 2012, respectively. These charges are included in cost of goods sold for the periods presented. If inventory that has previously been impaired is subsequently sold, the amount of reduced cost basis is reflected as cost of goods sold. The Company experienced minimal subsequent sales of excess and obsolete inventory during the three years ended June 30, 2014 that resulted in higher gross margins due to previous write-downs. Such sales and the impact of those sales on gross margin were not material to the years presented. If assumptions the Company has used to value its inventory deteriorate in the future, additional write-downs may be required.
Allowance for Probable Losses on Receivables
The accounts receivable balance is recorded net of allowances for amounts not expected to be collected from customers. The allowance is estimated based on historical experience of write-offs, the level of past due amounts, information known about specific customers with respect to their ability to make payments, and future expectations of conditions that might impact the collectability of accounts. Accounts receivable are generally due under normal trade terms for the industry. Credit is granted, and credit evaluations are periodically performed, based on a customer’s financial condition and other factors. Although the Company does not generally require collateral, cash in advance or letters of credit may be required from customers in certain circumstances, including some foreign customers. When management determines that it is probable that an account will not be collected, it is charged against the allowance for probable losses. The Company reviews the adequacy of its allowance monthly. The allowance for doubtful accounts considered necessary was approximately $0.1 million and $0.1 million at June 30, 2014 and 2013, respectively. If the financial condition of customers were to deteriorate, resulting in an impairment of their ability to make payment, additional allowances may be required. Given the Company’s significant balance of government receivables and in some cases letters of credit from foreign customers, collection risk is considered minimal. Historically, uncollectible accounts have generally been insignificant, have generally not exceeded management’s expectations, and the allowance is deemed adequate.
Pension Obligations
The Company calculates the cost of providing pension benefits under the provisions of FASB Accounting Standards Codification (“ASC”) Topic 715, “Compensation — Retirement Benefits”, (“ASC Topic 715”). The key assumptions required within the provisions of ASC Topic 715 are used in making these calculations. The most significant of these assumptions are the discount rate used to value the future obligations and the expected return on pension plan assets. The discount rate is consistent with market interest rates on high-quality, fixed income investments. The expected return on assets is based on long-term returns and assets held by the plan, which is influenced by historical averages. If actual interest rates and returns on plan assets materially differ from the assumptions, future adjustments to the financial statements would be required. While changes in these assumptions can have a significant effect on the pension benefit obligation and the unrecognized gain or loss accounts disclosed in the Notes to Consolidated Financial Statements, the effect of changes in these assumptions is not expected to have the same relative effect on net periodic pension expense in the near term. While these assumptions may change in the future based on changes in long-term interest rates and market conditions, there are no known expected changes in these assumptions as of June 30, 2014. As indicated above, to the extent the assumptions differ from actual results, there would be a future impact on the financial statements. The extent to which this will result in future expense is not determinable at this time as it will depend upon a number of variables, including trends in interest rates and the actual return on plan assets. The annual actuarial valuation of the pension plan is completed at the end of each fiscal year. Based on these valuations, net periodic pension (income) cost for fiscal years 2014, 2013 and 2012 was calculated to be $0.0 million, $0.0 million and $(0.1) million, respectively.
Effective April 1, 2009, participation and the accrual of benefits in the Company’s pension plan were frozen, at which time all participants became fully vested and all remaining prior service costs were recognized. Lump-sum benefit distributions during fiscal years 2014 exceeded plan service and interest costs, resulting in a lump-sum settlement charge of approximately $0.1 million also being recognized during the respective years. The components of net periodic pension expense are detailed in Note 10, Employee Retirement Benefit Plans, of the “Notes to Consolidated Financial Statements” in this Annual Report on Form 10-K.
Business Combinations
The Company accounts for business combinations under the acquisition method of accounting in accordance with ASC Topic 805, “Business Combinations”. Accordingly, the Company recognizes amounts for identifiable assets acquired and liabilities assumed equal to their estimated acquisition date fair values. Transaction and integration costs associated with business combinations are expensed as incurred. Any excess of the acquisition price over the estimated fair value of net assets acquired is recorded as goodwill while any excess of the estimated fair value of net assets acquired over the acquisition price is recorded in current earnings as a gain.
39
The Company makes various assumptions in estimating the fair values of assets acquired and liabilities assumed. As fair value is a market-based measurement, it is determined based on the assumptions that market participants would use. The most significant assumptions typically relate to the estimated fair values of inventory and intangible assets, including customer lists and non-compete agreements. Management arrives at estimates of fair value based upon assumptions it believes to be reasonable. These estimates are based on historical experience and information obtained from the management of the acquired business and is inherently uncertain. Critical estimates in valuing certain intangible assets include but are not limited to: future expected discounted cash flows from customer relationships and contracts assuming similar product platforms and completed projects; the acquired company’s market position, as well as assumptions about the period of time the acquired customer relationships will continue to generate revenue streams; and attrition and discount rates. Unanticipated events and circumstances may occur which may affect the accuracy or validity of such assumptions, estimates or actual results, particularly with respect to amortization periods assigned to identifiable intangible assets.
Valuation of Property, Plant and Equipment
The Company records an impairment charge on our investment in property, plant and equipment that we hold and use in our operations if and when management determines that the related carrying values may not be recoverable. If one or more impairment indicators are deemed to exist, Sparton will measure any impairment of these assets based on current independent appraisals or a projected discounted cash flow analysis using a discount rate determined by management to be commensurate with the risk inherent in our business model. Our estimates of cash flows require significant judgment based on our historical and anticipated operating results and are subject to many factors.
Goodwill and Intangible Assets
The Company tests for possible goodwill impairment annually or more often should events or changes in circumstances indicate the carry value of the goodwill may not be recoverable. The test is conducted at the reporting unit level. Sparton has three reportable business segments (Medical, Complex Systems, and DSS). In fiscal years 2014, 2013 and 2012, Medical, Complex Systems and DSS each consist of a single reporting unit. In fiscal 2014, goodwill resided within each of the Company's reporting units and testing was done on each unit. For fiscal years 2013 and 2012, all of the Company’s goodwill resided within the Medical reporting unit and goodwill impairment testing was conducted on this single reporting unit.
The Company may elect to perform a qualitative assessment for its annual goodwill impairment test. If the qualitative assessment indicates that it is more likely than not that the fair value of a reporting unit is less than its carrying amount, or if Sparton elects to not perform a qualitative assessment, then the Company would be required to perform a quantitative impairment test for goodwill.
A quantitative impairment analysis is a two-step process. The first step is to identify a potential impairment by comparing the fair value of a reporting unit with its carrying value. If the fair value of the reporting unit exceeds the carrying value of the net assets assigned to the reporting unit, goodwill is considered not impaired and the Company is not required to perform further testing. If the carrying value of the net assets assigned to the reporting unit exceeds the fair value of the reporting unit, then management will perform the second step of the impairment test in order to determine the implied fair value of the goodwill of the reporting unit. If the carrying value of a reporting unit’s goodwill exceeds its implied fair value, then the Company would record an impairment loss equal to the difference.
When a quantitative impairment assessment is required, Sparton determines the fair value of its reporting units, with the assistance of an independent valuation firm, based upon a combination of the income approach (discounted cash flow method) and market approach (market comparable model) methodologies. In concluding on the fair value estimates of its reporting units, the income approach and the market approach are given weighting based on the quality and suitability of information available in performing each approach.
The income approach methodology utilized in estimating the fair value of the Company’s reporting units for purposes of the goodwill impairment testing requires various judgmental assumptions about revenues, operating margins, growth rates, working capital requirements and appropriate discount rate. In determining those judgmental assumptions, Sparton considers a variety of data, including, for each reporting unit, its annual budget for the upcoming year, its longer-term business plan, anticipated future cash flows, market data, and historical cash flow growth rates. The key assumptions used to estimate the fair value of the Company’s reporting units under the discounted cash flow method are: (i) projected revenue growth over a five-year period; (ii) projected operating margins over a five-year period; (iii) projected terminal growth rate; and (iv) a weighted-average cost of capital.
Under the market approach, the value of each of the Company’s reporting units is estimated by comparing it to publicly-traded firms in similar lines of business and geographic markets. The market approach takes into account, among other things, the market value of total invested capital to earnings before interest, taxes, depreciation and amortization (“EBITDA”)
40
multiples of comparable companies. The selected multiples are then applied to the reporting unit’s projected EBITDA to arrive at an indicated range of value.
The Company's fiscal 2014 quantitative annual tests of goodwill related to the Medical, Complex Systems and DSS reporting units did not indicate that the related goodwill was impaired. The Company determined at that time that the fair value of the three reporting units substantially exceeded their carrying values, having exceeded the carrying values by approximately 70%, 33% and over 1,100%, respectively. In fiscal 2013, the Company elected to perform a qualitative assessment for its annual goodwill impairment test. Based on the Company's fiscal 2013 qualitative assessment of goodwill, the Company concluded that it was more likely than not that the fair value of our Medical segment was greater than its carrying amount, and therefore no further testing was required. The Company’s fiscal 2012 quantitative annual tests of goodwill related to its Medical reporting unit did not indicate that the related goodwill was impaired. The Company determined at that time that the fair value of the reporting unit substantially exceeded its carrying value, having exceeded the carrying values by approximately 58%.
Determining the fair value of any reporting unit and intangible asset is judgmental in nature and involves the use of significant estimates and assumptions. The Company bases its fair value estimates on assumptions believed to be reasonable, but which are unpredictable and inherently uncertain. Actual future results may differ from those estimates. Circumstances that may lead to future impairment of goodwill include, but are not limited to, unforeseen decreases in future performance or industry demand, as well as further loss of a significant customer or program in excess of future incremental new business wins. The next annual goodwill impairment review is expected to be performed during the fourth quarter of fiscal 2015.
The Company’s intangible assets other than goodwill represent the values assigned to customer relationships acquired in conjunction with the Company’s purchases of Astro, Byers Peak, Onyx, Creonix, Aydin, Beckwood and Aubrey, values assigned to non-compete agreements acquired in conjunction with the Company’s purchase of Onyx, Beckwood and Aubrey, and values assigned to trademarks/tradenames and unpatented technology acquired in conjunction with the Company's purchase of Aydin. At June 30, 2014, Aydin customer relationships of approximately $1.3 million are included in the DSS segment, Creonix and Beckwood customer relationships of approximately $9.3 million are included within the Complex Systems segment. All remaining customer relationships intangible assets of $8.4 million are included within the Medical segment. The Beckwood non-compete intangible assets of $0.3 million reside in the Complex Systems segment, while Aubrey's non-compete intangible assets of $0.1 million reside in the Medical segment. Aydin's trademarks/tradenames of approximately $0.2 million and unpatented technology of approximately $0.5 million reside in the DSS segment. The impairment test for these intangible assets is conducted when impairment indicators are present. The Company continually evaluates whether events or circumstances have occurred that would indicate the remaining estimated useful lives of its intangible assets warrant revision or that the remaining balance of such assets may not be recoverable. The Company uses an estimate of the related undiscounted cash flows over the remaining life of the asset in measuring whether the asset is recoverable. If the carrying amount of an asset exceeds its estimated undiscounted future cash flows, an impairment charge would be recognized for the amount that the carrying amount of the asset exceeds the fair value of the asset. The Company’s fair value estimates related to its intangible assets impairment analyses are based on Level 3 inputs within the fair value hierarchy as described below in this note under “Fair value measurements.”
The customer relationships acquired in conjunction with the Company’s purchase of Astro, Byers Peak, Onyx, Creonix, and Beckwood are also being amortized using an accelerated methodology over 10 years, while the customer relationships acquired in conjunction with the Company's purchase of Aydin are being amortized over 15 years. The Company’s non-compete agreements are being amortized on a straight-line basis over five years for Beckwood and two years for Aubrey as the ratable decline in value over time is most consistent with the contractual nature of these assets. Aydin's trademarks/tradenames are being amortized on a straight-line basis over 10 years, while Aydin's unpatented technology is being amortized using an accelerated methodology over 7 years.
Income Taxes
We recognize federal, state and foreign current tax liabilities or assets based on our estimate of taxes payable or refundable in the current fiscal year by tax jurisdiction. We also recognize federal, state and foreign deferred tax assets or liabilities, as appropriate, for our estimate of future tax effects attributable to temporary differences and carry forwards.
We recognize the tax benefit from an uncertain tax position only if it is more likely than not that the tax position will be sustained on examination by the taxing authorities, based on the technical merits of the position. The tax benefits recognized in the consolidated financial statements from such positions are measured based on the largest benefit that has a greater than fifty percent likelihood of being realized upon ultimate resolution. Management must also assess whether uncertain tax positions as filed could result in the recognition of a liability for possible interest and penalties if any. The Company had successor tax liability with respect to the Onyx shares acquired during fiscal 2013. The Company identified approximately $0.1 million, net of federal benefit, of uncertain tax positions for certain state income tax liabilities related to periods prior to the business
41
combination. At acquisition, management made the determination that it was more likely than not that the full benefit of tax positions would not be sustained on examination and accordingly, established a liability for unrecognized tax benefits of $0.2 million as of June 30, 2013. During fiscal 2014, the Company settled certain of these uncertain tax positions with taxing authorities and changed its assessment regarding the determination that it is more-likely-than-not that the remaining tax position will be sustained upon examination. Our estimates are based on the information available to us at the time we prepare the income tax provisions. Our income tax returns are subject to audit by federal, state, and local governments, generally years after the returns are filed. These returns could be subject to material adjustments or differing interpretations of the tax laws.
Our calculation of current and deferred tax assets and liabilities is based on certain estimates and judgments and involves dealing with uncertainties in the application of complex tax laws. Our estimates of current and deferred tax assets and liabilities may change based, in part, on added certainty or finality to an anticipated outcome, changes in accounting or tax laws in the United States and overseas, or changes in other facts or circumstances. In addition, we recognize liabilities for potential United States tax contingencies based on our estimate of whether, and the extent to which, additional taxes may be due. If we determine that payment of these amounts is unnecessary, or if the recorded tax liability is less than our current assessment, we may be required to recognize an income tax benefit, or additional income tax expense, respectively, in our consolidated financial statements.
In preparing our consolidated financial statements, management assesses the likelihood that our deferred tax assets will be realized from future taxable income. In evaluating our ability to recover our deferred income tax assets, management considers all available positive and negative evidence, including operating results, ongoing tax planning and forecasts of future taxable income on a jurisdiction by jurisdiction basis. A valuation allowance is established if we determine that it is more likely than not that some portion or all of the net deferred tax assets will not be realized.
Stock-Based Compensation
ASC Topic 718, “Share-Based Payment”, requires significant judgment and the use of estimates in the assumptions for the model used to value the share-based payment awards, including stock price volatility, and expected option terms. In addition, expected forfeiture rates for the share-based awards must be estimated. Because of our small number of option grants during our history, we are limited in our historical experience to use as a basis for these assumptions. While we believe that the assumptions and judgments used in our estimates are reasonable, actual results may differ from these estimates under different assumptions or conditions.
New Accounting Pronouncements
In July 2013, the Financial Accounting Standards Board (the "FASB") issued authoritative guidance under Accounting Standards Update No. 2013-11 ("ASU 2013-11"), which provides guidance on the financial statement presentation of an unrecognized tax benefit when a net operating loss (“NOL”) carryforward, a similar tax loss, or a tax credit carryforward exists. ASU 2013-11 requires entities to present an unrecognized tax benefit as a reduction of a deferred tax asset for a NOL or tax credit carryforward whenever the NOL or tax credit carryforward would be available to reduce the additional taxable income or tax due if the tax position is disallowed. This accounting standard update requires entities to assess whether to net the unrecognized tax benefit with a deferred tax asset as of the reporting date. ASU 2013-11 will be effective for the Company’s first quarter of fiscal 2015. The adoption of this guidance is not expected to have a significant impact on the Company's consolidated financial statements.
In May 2014, the FASB issued Accounting Standards Update No. 2014-09 ("ASU 2014-09"), which amends guidance for revenue recognition. Under the new standard, revenue will be recognized when control of the promised goods or services is transferred to customers in an amount that reflects the consideration to which the Company expects to be entitled in exchange for those goods and services. The standard creates a five-step model that will generally require companies to use more judgment and make more estimates than under current guidance when considering the terms of contracts along with all relevant facts and circumstances. These include the identification of customer contracts and separating performance obligations, the determination of transaction price that potentially includes an estimate of variable consideration, allocating the transaction price to each separate performance obligation, and recognizing revenue in line with the pattern of transfer. The standard also requires extensive additional disclosures to provide greater insight into revenues recognized and deferred, including quantitative and qualitative information about significant judgments and changes in those judgments made to determine the timing and amount of revenues recognized. ASU 2014-09 is effective for annual reporting periods beginning after December 15, 2016, including interim periods within that reporting period. Early adoption is not permitted. Companies have the option of using either a full or modified retrospective approach in applying this standard. The Company is currently in the process of evaluating the impact of adoption on its consolidated financial statements.
42
ITEM 7A. QUANTITATIVE AND QUALITATIVE DISCLOSURES ABOUT MARKET RISK
The Company manufactures its products in the United States and Vietnam. Sales of the Company’s products are in the U.S. and foreign markets. The Company is subject to foreign currency exchange rate risk relating to intercompany activity and balances and to receipts from customers and payments to suppliers in foreign currencies. Adjustments related to the remeasurement of the Company's Vietnamese financial statements into U.S. dollars are included in current earnings. As a result, the Company's financial results could be affected by factors such as changes in foreign currency exchange rates or economic conditions in the domestic and foreign markets in which the Company operates. However, minimal third party receivables and payables are denominated in foreign currency and the related market risk exposure is considered to be immaterial.
The Company's revolving credit line, when drawn upon, is subject to future interest rate fluctuations which could potentially have a negative impact on cash flows of the Company. The Company had $41.0 million outstanding under its Credit Facility at June 30, 2014. A prospective increase of 100 basis points in the interest rate applicable to the Company's outstanding borrowings under its Credit Facility would result in an increase of approximately $0.4 million in our annual interest expense. The Company is not party to any currency exchange or interest rate protection agreements as of June 30, 2014.
ITEM 8. FINANCIAL STATEMENTS AND SUPPLEMENTARY DATA
Our financial statements required by this item are submitted as a separate section of this Annual Report on Form 10-K. See “Index to Consolidated Financial Statements,” commencing on page F-1 hereof.
ITEM 9. CHANGES IN AND DISAGREEMENTS WITH ACCOUNTANTS ON ACCOUNTING AND FINANCIAL DISCLOSURE
None.
ITEM 9A. CONTROLS AND PROCEDURES
Evaluation of Disclosure Controls and Procedures
Each of our Chief Executive Officer and Chief Financial Officer has evaluated the effectiveness of our disclosure controls and procedures (as such term is defined in Rules 13a-15(e) and 15d-15(e) under the Securities and Exchange Act of 1934) as of the end of the period covered by this Annual Report. Based on such evaluation, such officers have concluded that, as of the end of the period covered by this Annual Report, our disclosure controls and procedures are effective.
There have been no changes in our internal control over financial reporting (as such term is defined in Rules 13a-15(f) and 15d-15(f) under the Securities and Exchange Act of 1934) during the quarter ended June 30, 2014 that have materially affected, or are reasonably likely to materially affect, our internal control over financial reporting.
Management Report on Internal Control over Financial Reporting
Our management is responsible for establishing and maintaining adequate internal control over financial reporting. Our internal control system was designed to provide reasonable assurance to our management and board of directors regarding the reliability of financial reporting and the preparation of financial statements for external purposes in accordance with generally accepted accounting principles.
Any internal control system, no matter how well designed, has inherent limitations and may not prevent or detect misstatements. Accordingly, even those systems determined to be effective can provide only reasonable assurance with respect to financial statement preparation and presentation.
Our management conducted an assessment of the effectiveness of our internal control over financial reporting as of June 30, 2014. This assessment was based on the criteria set forth by the Committee of Sponsoring Organizations of the Treadway Commission, or COSO, in Internal Control — Integrated Framework (1992). Based on this assessment, management believes that, as of June 30, 2014, our internal control over financial reporting was effective.
BDO USA, LLP, our independent registered public accounting firm, issued an attestation report on the effectiveness of our internal control over financial reporting. Their report appears below.
/S/ CARY B. WOOD | /S/ MARK SCHLEI | |
Cary B. Wood President and Chief Executive Officer September 9, 2014 | Mark Schlei Senior Vice President and Chief Financial Officer September 9, 2014 | |
43
REPORT OF INDEPENDENT REGISTERED PUBLIC ACCOUNTING FIRM
To the Board of Directors and Shareholders of
Sparton Corporation
Schaumburg, Illinois
We have audited Sparton Corporation’s internal control over financial reporting as of June 30, 2014, based on criteria established in Internal Control — Integrated Framework (1992) issued by the Committee of Sponsoring Organizations of the Treadway Commission (the COSO criteria). Sparton Corporation’s management is responsible for maintaining effective internal control over financial reporting and for its assessment of the effectiveness of internal control over financial reporting, included in the accompanying Item 9A, Management Report on Internal Control Over Financial Reporting. Our responsibility is to express an opinion on the Company’s internal control over financial reporting based on our audit.
We conducted our audit in accordance with the standards of the Public Company Accounting Oversight Board (United States). Those standards require that we plan and perform the audit to obtain reasonable assurance about whether effective internal control over financial reporting was maintained in all material respects. Our audit included obtaining an understanding of internal control over financial reporting, assessing the risk that a material weakness exists, and testing and evaluating the design and operating effectiveness of internal control based on the assessed risk. Our audit also included performing such other procedures as we considered necessary in the circumstances. We believe that our audit provides a reasonable basis for our opinion.
A company’s internal control over financial reporting is a process designed to provide reasonable assurance regarding the reliability of financial reporting and the preparation of financial statements for external purposes in accordance with generally accepted accounting principles. A company’s internal control over financial reporting includes those policies and procedures that (1) pertain to the maintenance of records that, in reasonable detail, accurately and fairly reflect the transactions and dispositions of the assets of the company; (2) provide reasonable assurance that transactions are recorded as necessary to permit preparation of financial statements in accordance with generally accepted accounting principles, and that receipts and expenditures of the company are being made only in accordance with authorizations of management and directors of the company; and (3) provide reasonable assurance regarding prevention or timely detection of unauthorized acquisition, use, or disposition of the company’s assets that could have a material effect on the financial statements.
Because of its inherent limitations, internal control over financial reporting may not prevent or detect misstatements. Also, projections of any evaluation of effectiveness to future periods are subject to the risk that controls may become inadequate because of changes in conditions, or that the degree of compliance with the policies or procedures may deteriorate.
In our opinion, Sparton Corporation maintained, in all material respects, effective internal control over financial reporting as of June 30, 2014, based on the COSO criteria.
We also have audited, in accordance with the standards of the Public Company Accounting Oversight Board (United States), the consolidated balance sheets of Sparton Corporation as of June 30, 2014 and 2013, and the related consolidated statements of income, comprehensive income, cash flows and shareholders’ equity for each of the three years in the period ended June 30, 2014, and our report dated September 9, 2014 expressed an unqualified opinion thereon.
/s/ BDO USA, LLP
Grand Rapids, Michigan
September 9, 2014
ITEM 9B. OTHER INFORMATION
None.
44
PART III
ITEM 10. DIRECTORS, EXECUTIVE OFFICERS AND CORPORATE GOVERNANCE
The information required by Item 10 is incorporated herein by reference from the Company’s Proxy Statement for the 2014 Annual Meeting of Shareholders. Information concerning executive officers is set forth in Part I, Item 1 of this Annual Report on Form 10-K.
ITEM 11. EXECUTIVE COMPENSATION
The information required by Item 11 is incorporated herein by reference from the Company’s Proxy Statement for the 2014 Annual Meeting of Shareholders.
ITEM 12. SECURITY OWNERSHIP OF CERTAIN BENEFICIAL OWNERS AND MANAGEMENT AND RELATED STOCKHOLDER MATTERS
The information required by Item 12 is incorporated herein by reference from the Company’s Proxy Statement for the 2014 Annual Meeting of Shareholders.
ITEM 13. CERTAIN RELATIONSHIPS AND RELATED TRANSACTIONS, AND DIRECTOR INDEPENDENCE
The information required by Item 13 is incorporated herein by reference from the Company’s Proxy Statement for the 2014 Annual Meeting of Shareholders.
ITEM 14. PRINCIPAL ACCOUNTANT FEES AND SERVICES
The information required by Item 14 is incorporated herein by reference from the Company’s Proxy Statement for the 2014 Annual Meeting of Shareholders.
45
PART IV
ITEM 15. EXHIBITS AND FINANCIAL STATEMENT SCHEDULES
(a) | The following documents are filed as part of this Annual Report on Form 10-K: |
1. | Financial Statements |
See the Index to Consolidated Financial Statements on page F-1.
2. | Financial Statement Schedules |
See the Index to Consolidated Financial Statements on page F-1.
3. | See the Exhibit Index following the financial statements. |
(b) | See the Exhibit Index following the financial statements. |
(c) | Financial Statement Schedules. See (a) 2 above. |
46
SIGNATURES
Pursuant to the requirements of Section 13 or 15(d) of the Securities Exchange Act of 1934, the registrant has duly caused this report to be signed on its behalf by the undersigned, thereunto duly authorized.
Sparton Corporation | |
By: | /S/ CARY B. WOOD |
Cary B. Wood President and Chief Executive Officer | |
Date: September 9, 2014 | |
Pursuant to the requirements of the Securities Exchange Act of 1934, this report has been signed below by the following persons on behalf of the registrant and in the capacities and on the dates indicated.
Name | Title | Date | ||
/S/ JAMES R. SWARTWOUT | Director, Chairman of the Board of Directors | September 9, 2014 | ||
James R. Swartwout | ||||
/S/ CARY B. WOOD | Director, President and Chief Executive Officer (Principal Executive Officer) | September 9, 2014 | ||
Cary B. Wood | ||||
/S/ JAMES D. FAST | Director | September 9, 2014 | ||
James D. Fast | ||||
/S/ JOSEPH J. HARTNETT | Director | September 9, 2014 | ||
Joseph J. Hartnett | ||||
/S/ CHARLES R. KUMMETH | Director | September 9, 2014 | ||
Charles R. Kummeth | ||||
/S/ DAVID P. MOLFENTER | Director | September 9, 2014 | ||
David P. Molfenter | ||||
/S/ DOUGLAS R. SCHRANK | Director | September 9, 2014 | ||
Douglas R. Schrank | ||||
/S/ MARK SCHLEI | Senior Vice President and Chief Financial Officer (Principal Financial and Accounting Officer) | September 9, 2014 | ||
Mark Schlei | ||||
47
SPARTON CORPORATION AND SUBSIDIARIES
INDEX TO CONSOLIDATED FINANCIAL STATEMENTS AND SCHEDULE
Page | ||
F-1
REPORT OF INDEPENDENT REGISTERED PUBLIC ACCOUNTING FIRM
To the Board of Directors and Shareholders of
Sparton Corporation
Schaumburg, Illinois
We have audited the accompanying consolidated balance sheets of Sparton Corporation and subsidiaries as of June 30, 2014 and 2013, and the related consolidated statements of income, comprehensive income, cash flows and shareholders’ equity for each of the three years in the period ended June 30, 2014. In connection with our audits of the financial statements, we have also audited the financial statement schedule listed in the accompanying index. These financial statements and schedule are the responsibility of the Company’s management. Our responsibility is to express an opinion on these financial statements and schedule based on our audits.
We conducted our audits in accordance with the standards of the Public Company Accounting Oversight Board (United States). Those standards require that we plan and perform the audit to obtain reasonable assurance about whether the financial statements are free of material misstatement. An audit includes examining, on a test basis, evidence supporting the amounts and disclosures in the financial statements, assessing the accounting principles used and significant estimates made by management, as well as evaluating the overall presentation of the financial statements and schedule. We believe that our audits provide a reasonable basis for our opinion.
In our opinion, the consolidated financial statements referred to above present fairly, in all material respects, the financial position of Sparton Corporation and subsidiaries as of June 30, 2014 and 2013, and their results of operations and cash flows for each of the three years in the period ended June 30, 2014, in conformity with accounting principles generally accepted in the United States of America.
Also, in our opinion, the financial statement schedule, when considered in relation to the basic consolidated financial statements taken as a whole, presents fairly, in all material respects, the information set forth therein.
We also have audited, in accordance with the standards of the Public Company Accounting Oversight Board (United States), Sparton Corporation’s internal control over financial reporting as of June 30, 2014, based on criteria established in Internal Control — Integrated Framework (1992) issued by the Committee of Sponsoring Organizations of the Treadway Commission (COSO) and our report dated September 9, 2014 expressed an unqualified opinion thereon.
/s/ BDO USA, LLP
Grand Rapids, Michigan
September 9, 2014
F-2
SPARTON CORPORATION AND SUBSIDIARIES
CONSOLIDATED BALANCE SHEETS
(Dollars in thousands, except per share amounts)
June 30, 2014 | June 30, 2013 | ||||||
Assets | |||||||
Current Assets: | |||||||
Cash and cash equivalents | $ | 8,028 | $ | 6,085 | |||
Accounts receivable, net of allowance for doubtful accounts of $126 and $61, respectively | 48,697 | 49,572 | |||||
Inventories and cost of contracts in progress, net | 53,372 | 46,334 | |||||
Deferred income taxes | 3,813 | 2,951 | |||||
Prepaid expenses and other current assets | 2,654 | 1,731 | |||||
Total current assets | 116,564 | 106,673 | |||||
Property, plant and equipment, net | 28,523 | 28,904 | |||||
Goodwill | 28,189 | 14,767 | |||||
Other intangible assets, net | 20,041 | 10,713 | |||||
Deferred income taxes — non-current | 1,192 | 4,075 | |||||
Pension asset | 44 | — | |||||
Other non-current assets | 4,427 | 790 | |||||
Total assets | $ | 198,980 | $ | 165,922 | |||
Liabilities and Shareholders’ Equity | |||||||
Current Liabilities: | |||||||
Current portion of long-term debt | $ | 900 | $ | 136 | |||
Accounts payable | 16,543 | 19,596 | |||||
Accrued salaries and wages | 7,854 | 6,329 | |||||
Accrued health benefits | 1,538 | 1,793 | |||||
Performance based payments on customer contracts | 3,196 | 20,902 | |||||
Other accrued expenses | 11,090 | 6,733 | |||||
Total current liabilities | 41,121 | 55,489 | |||||
Pension liability — non-current portion | — | 274 | |||||
Long-term debt — non-current portion | 40,100 | 11,403 | |||||
Environmental remediation — non-current portion | 7,644 | 2,684 | |||||
Total liabilities | 88,865 | 69,850 | |||||
Commitments and contingencies | |||||||
Shareholders’ Equity: | |||||||
Preferred stock, no par value; 200,000 shares authorized; none issued | — | — | |||||
Common stock, $1.25 par value; 15,000,000 shares authorized, 10,129,031 and 10,095,716 shares issued and outstanding, respectively | 12,661 | 12,619 | |||||
Capital in excess of par value | 19,478 | 18,751 | |||||
Retained earnings | 78,944 | 65,957 | |||||
Accumulated other comprehensive loss | (968 | ) | (1,255 | ) | |||
Total shareholders’ equity | 110,115 | 96,072 | |||||
Total liabilities and shareholders’ equity | $ | 198,980 | $ | 165,922 | |||
See Notes to consolidated financial statements.
F-3
SPARTON CORPORATION AND SUBSIDIARIES
CONSOLIDATED STATEMENTS OF INCOME
(Dollars in thousands, except per share amounts)
For the year ended June 30, | |||||||||||
2014 | 2013 | 2012 | |||||||||
Net sales | $ | 336,139 | $ | 264,627 | $ | 226,455 | |||||
Cost of goods sold | 271,686 | 219,192 | 187,423 | ||||||||
Gross profit | 64,453 | 45,435 | 39,032 | ||||||||
Operating expense: | |||||||||||
Selling and administrative expenses | 35,698 | 26,451 | 22,232 | ||||||||
Internal research and development expenses | 1,169 | 1,300 | 1,293 | ||||||||
Amortization of intangible assets | 3,287 | 1,575 | 435 | ||||||||
Restructuring charges | 188 | 55 | (68 | ) | |||||||
EPA related - net environmental remediation | 4,238 | — | — | ||||||||
Other operating (income) expense, net | (16 | ) | 13 | 65 | |||||||
Total operating expense, net | 44,564 | 29,394 | 23,957 | ||||||||
Operating income | 19,889 | 16,041 | 15,075 | ||||||||
Other income (expense): | |||||||||||
Interest expense | (838 | ) | (518 | ) | (696 | ) | |||||
Interest income | 9 | 102 | 94 | ||||||||
Gain on sale of investment | — | — | 127 | ||||||||
Other, net | 542 | 547 | 516 | ||||||||
Total other income (expense), net | (287 | ) | 131 | 41 | |||||||
Income before provision for income taxes | 19,602 | 16,172 | 15,116 | ||||||||
Provision for income taxes | 6,615 | 2,702 | 5,269 | ||||||||
Net income | $ | 12,987 | $ | 13,470 | $ | 9,847 | |||||
Income per share of common stock: | |||||||||||
Basic | $ | 1.28 | $ | 1.32 | $ | 0.97 | |||||
Diluted | $ | 1.28 | $ | 1.32 | $ | 0.96 | |||||
Weighted average shares of common stock outstanding: | |||||||||||
Basic | 10,109,915 | 10,193,530 | 10,174,176 | ||||||||
Diluted | 10,141,395 | 10,228,687 | 10,208,810 | ||||||||
See Notes to consolidated financial statements.
F-4
SPARTON CORPORATION AND SUBSIDIARIES
CONSOLIDATED STATEMENTS OF COMPREHENSIVE INCOME
(Dollars in thousands)
For the year ended June 30, | |||||||||||
2014 | 2013 | 2012 | |||||||||
Net income | $ | 12,987 | $ | 13,470 | $ | 9,847 | |||||
Other comprehensive income (loss) - Change in unrecognized pension costs, net of tax: | |||||||||||
Pension experience gain (loss), net of tax provision (benefit) of $82, $195 and $(534) for the years ended June 30, 2014, 2013 and 2012, respectively | 152 | 346 | (874 | ) | |||||||
Amortization of unrecognized net actuarial loss, net of tax benefit of $47, $66 and $16 for the years ended June 30, 2014, 2013 and 2012, respectively | 81 | 117 | 27 | ||||||||
Pro rata recognition of lump-sum settlements, net of tax provision of $31 for the year ended June 30, 2014 | 54 | — | — | ||||||||
Other comprehensive income (loss), net of tax | 287 | 463 | (847 | ) | |||||||
Comprehensive income | $ | 13,274 | $ | 13,933 | $ | 9,000 | |||||
See Notes to consolidated financial statements.
F-5
SPARTON CORPORATION AND SUBSIDIARIES
CONSOLIDATED STATEMENTS OF CASH FLOWS
(Dollars in thousands)
For the year ended June 30, | |||||||||||
2014 | 2013 | 2012 | |||||||||
Cash Flows from Operating Activities: | |||||||||||
Net income | $ | 12,987 | $ | 13,470 | $ | 9,847 | |||||
Adjustments to reconcile net income to net cash provided by operating activities: | |||||||||||
Depreciation | 4,700 | 3,186 | 1,379 | ||||||||
Amortization of intangible assets | 3,423 | 1,575 | 435 | ||||||||
Deferred income tax expense (benefit) | (976 | ) | (159 | ) | 3,894 | ||||||
Stock-based compensation expense | 1,662 | 1,128 | 943 | ||||||||
EPA related - net environmental remediation | 4,238 | — | — | ||||||||
Gross profit effect of capitalized profit in inventory from acquisition | 337 | 566 | — | ||||||||
Gain on sale of investment | — | — | (127 | ) | |||||||
Excess tax benefit from stock-based compensation | (522 | ) | (211 | ) | (376 | ) | |||||
Other | 247 | 112 | 248 | ||||||||
Changes in operating assets and liabilities, net of business acquisitions: | |||||||||||
Accounts receivable | 4,886 | (12,318 | ) | (5,722 | ) | ||||||
Inventories and cost of contracts in progress | 1,484 | (1,491 | ) | 3,650 | |||||||
Prepaid expenses and other assets | 419 | 452 | (90 | ) | |||||||
Performance based payments on customer contracts | (17,706 | ) | (4,165 | ) | 12,285 | ||||||
Accounts payable and accrued expenses | (2,728 | ) | 789 | 551 | |||||||
Net cash provided by operating activities | 12,451 | 2,934 | 26,917 | ||||||||
Cash Flows from Investing Activities: | |||||||||||
Purchase of Onyx | — | (45,438 | ) | — | |||||||
Purchase of certain assets of Creonix | 105 | (2,100 | ) | — | |||||||
Purchase of certain assets and liabilities of Aydin Displays | (15,502 | ) | — | — | |||||||
Purchase of Beckwood | (15,346 | ) | — | — | |||||||
Purchase of Aubrey, net of acquired cash | (4,817 | ) | — | — | |||||||
Purchases of property, plant and equipment | (3,501 | ) | (3,872 | ) | (4,244 | ) | |||||
Proceeds from sale of property, plant and equipment | 69 | 275 | 275 | ||||||||
Proceeds from sale of investment | — | — | 1,750 | ||||||||
Net cash used in investing activities | (38,992 | ) | (51,135 | ) | (2,219 | ) | |||||
Cash Flows from Financing Activities: | |||||||||||
Borrowings of long-term debt | 70,000 | 39,000 | — | ||||||||
Repayments of long-term debt | (40,623 | ) | (29,140 | ) | (135 | ) | |||||
Payment of debt financing costs | — | (555 | ) | — | |||||||
Repurchase of stock | (1,559 | ) | (2,360 | ) | (2,997 | ) | |||||
Proceeds from the exercise of stock options | 144 | 180 | 458 | ||||||||
Excess tax benefit from stock-based compensation | 522 | 211 | 376 | ||||||||
Net cash provided by (used in) financing activities | 28,484 | 7,336 | (2,298 | ) | |||||||
Net increase (decrease) in cash and cash equivalents | 1,943 | (40,865 | ) | 22,400 | |||||||
Cash and cash equivalents at beginning of year | 6,085 | 46,950 | 24,550 | ||||||||
Cash and cash equivalents at end of year | $ | 8,028 | $ | 6,085 | $ | 46,950 | |||||
Supplemental disclosure of cash flow information: | |||||||||||
Cash paid for interest | $ | 631 | $ | 415 | $ | 350 | |||||
Cash paid for income taxes | $ | 7,065 | $ | 2,525 | $ | 1,244 | |||||
Supplemental disclosure of non-cash investing activities: | |||||||||||
Accounts receivable recognized in relation to purchase consideration adjustment | $ | 252 | $ | 302 | $ | — | |||||
See Notes to consolidated financial statements.
F-6
SPARTON CORPORATION AND SUBSIDIARIES
CONSOLIDATED STATEMENTS OF SHAREHOLDERS’ EQUITY
(Dollars in thousands)
Common Stock | Capital In Excess of Par Value | Retained Earnings | Accumulated Other Comprehensive Loss | Total Shareholders’ Equity | ||||||||||||||||||
Shares | Amount | |||||||||||||||||||||
Balance at June 30, 2011 | 10,236,484 | $ | 12,796 | $ | 20,635 | $ | 42,487 | $ | (871 | ) | $ | 75,047 | ||||||||||
Cumulative impact of change in accounting principle | — | — | — | 153 | — | 153 | ||||||||||||||||
Balance at June 30, 2011 - as adjusted | 10,236,484 | 12,796 | 20,635 | 42,640 | (871 | ) | 75,200 | |||||||||||||||
Issuance of stock | 160,641 | 201 | (201 | ) | — | — | — | |||||||||||||||
Forfeiture of restricted stock | (13,290 | ) | (17 | ) | 17 | — | ||||||||||||||||
Repurchase of stock | (368,068 | ) | (460 | ) | (2,537 | ) | (2,997 | ) | ||||||||||||||
Exercise of stock options | 89,992 | 112 | 346 | — | — | 458 | ||||||||||||||||
Stock-based compensation | — | — | 943 | — | — | 943 | ||||||||||||||||
Excess tax benefit from stock-based compensation | — | — | 376 | — | — | 376 | ||||||||||||||||
Comprehensive income, net of tax | — | — | — | 9,847 | (847 | ) | 9,000 | |||||||||||||||
Balance at June 30, 2012 | 10,105,759 | 12,632 | 19,579 | 52,487 | (1,718 | ) | 82,980 | |||||||||||||||
Issuance of stock | 159,433 | 199 | (199 | ) | — | — | — | |||||||||||||||
Forfeiture of restricted stock | (50,530 | ) | (63 | ) | 63 | — | — | — | ||||||||||||||
Repurchase of stock | (148,722 | ) | (186 | ) | (2,174 | ) | — | — | (2,360 | ) | ||||||||||||
Exercise of stock options | 29,776 | 37 | 143 | — | — | 180 | ||||||||||||||||
Stock-based compensation | — | — | 1,128 | — | — | 1,128 | ||||||||||||||||
Excess tax benefit from stock-based compensation | — | — | 211 | — | — | 211 | ||||||||||||||||
Comprehensive income, net of tax | — | — | — | 13,470 | 463 | 13,933 | ||||||||||||||||
Balance at June 30, 2013 | 10,095,716 | 12,619 | 18,751 | 65,957 | (1,255 | ) | 96,072 | |||||||||||||||
Issuance of stock | 96,664 | 121 | (121 | ) | — | — | — | |||||||||||||||
Forfeiture of restricted stock | (3,344 | ) | (4 | ) | 4 | — | — | — | ||||||||||||||
Repurchase of stock | (76,880 | ) | (96 | ) | (1,463 | ) | — | — | (1,559 | ) | ||||||||||||
Exercise of stock options | 16,875 | 21 | 123 | — | — | 144 | ||||||||||||||||
Stock-based compensation | — | — | 1,662 | — | — | 1,662 | ||||||||||||||||
Excess tax benefit from stock-based compensation | — | — | 522 | — | — | 522 | ||||||||||||||||
Comprehensive income, net of tax | — | — | — | 12,987 | 287 | 13,274 | ||||||||||||||||
Balance at June 30, 2014 | 10,129,031 | $ | 12,661 | $ | 19,478 | $ | 78,944 | $ | (968 | ) | $ | 110,115 | ||||||||||
See Notes to consolidated financial statements.
F-7
SPARTON CORPORATION AND SUBSIDIARIES
NOTES TO CONSOLIDATED FINANCIAL STATEMENTS
(1) Business
Sparton Corporation and subsidiaries (the “Company” or “Sparton”) has been in continuous existence since 1900. It was last reorganized in 1919 as an Ohio corporation. The Company is a provider of design, development, and manufacturing services for complex electromechanical devices, as well as sophisticated engineered products complimentary to the same electromechanical value stream. The Company serves the Medical & Biotechnology, Military & Aerospace and Industrial & Commercial markets through three reportable business segments; Medical Device (“Medical”), Complex Systems (“CS”) and Defense & Security Systems (“DSS”). Financial information by segment is presented in Note 16. All of the Company's facilities are certified to one or more of the ISO/AS standards, including ISO 9001, AS9100 or ISO 13485, with most having additional certifications based on the needs of the customers they serve. The Company's products and services include offerings for Original Equipment Manufacturers (“OEM”) and Emerging Technology (“ET”) customers that utilize microprocessor-based systems which include transducers, printed circuit boards and assemblies, sensors, and electromechanical components, as well as development and design engineering services relating to these product sales. Sparton also develops and manufactures sonobuoys, anti-submarine warfare (“ASW”) devices used by the United States Navy and other free-world countries. Many of the physical and technical attributes in the production of sonobuoys are similar to those required in the production of the Company's other electrical and electromechanical products and assemblies.
(2) Summary of Significant Accounting Policies
Basis of presentation and principles of consolidation — The consolidated financial statements include the accounts of Sparton Corporation and subsidiaries and have been prepared in accordance with accounting principles generally accepted in the United States of America (“GAAP”). All significant intercompany accounts and transactions have been eliminated in consolidation. Certain reclassifications of prior year amounts have been made to conform to the current year presentation. Subsequent events have been evaluated through the date these financial statements were issued.
Use of estimates — Management of the Company has made a number of estimates, judgments and assumptions relating to the reporting of assets and liabilities and the disclosure of contingent liabilities at the dates of the consolidated balance sheets and revenue and expense during the reporting periods to prepare these consolidated financial statements in conformity with GAAP. Actual results could differ from those estimates.
Cash and cash equivalents — Cash and cash equivalents include cash on hand, demand deposits and money market funds with original maturities of three months or less. Cash equivalents are stated at cost which approximates fair value.
Accounts receivable, credit practices, and allowances for doubtful accounts — Accounts receivable are customer obligations generally due under normal trade terms for the industry. Credit terms are granted and periodically revised based on evaluations of the customers’ financial condition. The Company performs ongoing credit evaluations of its customers and although the Company does not generally require collateral, letters of credit or cash advances may be required from customers in order to support accounts receivable in certain circumstances. The Company maintains an allowance for doubtful accounts on receivables for estimated losses resulting from the inability of its customers to make required payments. The allowance is estimated primarily based on information known about specific customers with respect to their ability to make payments, and future expectations of conditions that might impact the collectability of accounts. When management determines that it is probable that an account will not be collected, all or a portion of the amount is charged against the allowance for doubtful accounts.
Inventories and costs of contracts in progress — Inventories are valued at the lower of cost (first-in, first-out basis) or market and include costs related to long-term contracts as disclosed below. Inventories, other than contract costs, are principally raw materials and supplies. Certain United States Government contracts allow Sparton to submit performance based billings, which are then applied against inventories purchased and manufacturing costs incurred by the Company throughout its performance under these contracts. Inventories were reduced by performance based payments from the U.S. government for costs incurred related to long-term contracts, thereby establishing inventory to which the U.S. government then has title, of approximately $8.0 million and $15.2 million, respectively, at June 30, 2014 and 2013. At June 30, 2014 and 2013, current liabilities include performance based payments of $3.2 million and $20.9 million, respectively, on government contracts. As these payments are in excess of cost, there is no inventory to which the government would claim title and, therefore, no offset to inventory has been made.
F-8
Customer orders are based upon forecasted quantities of product manufactured for shipment over defined periods. Raw material inventories are purchased to fulfill these customer requirements. Within these arrangements, customer demands for products frequently change, sometimes creating excess and obsolete inventories. The Company regularly reviews raw material inventories by customer for both excess and obsolete quantities. Wherever possible, the Company attempts to recover its full cost of excess and obsolete inventories from customers or, in some cases, through other markets. When it is determined that the Company’s carrying cost of such excess and obsolete inventories cannot be recovered in full, a charge is taken against income for the difference between the carrying cost and the estimated realizable amount. These cost adjustments for excess and obsolete inventory create a new cost basis for the inventory. The Company recorded inventory write-downs totaling approximately $0.5 million, $0.6 million and $0.7 million for the years ended June 30, 2014, 2013 and 2012, respectively. These charges are included in cost of goods sold for the periods presented. If inventory that has previously been impaired is subsequently sold, the amount of reduced cost basis is reflected as cost of goods sold. The Company experienced minimal subsequent sales of excess and obsolete inventory during the three years ended June 30, 2014 that resulted in higher gross margins due to previous write-downs. Such sales and the impact of those sales on gross margin were not material to the years presented.
Property, plant and equipment, net — Property, plant and equipment are stated at cost less accumulated depreciation. Major improvements and upgrades are capitalized while ordinary repair and maintenance costs are expensed as incurred. Depreciation is provided over estimated useful lives on both straight-line and accelerated methods. Estimated useful lives generally range from 5 to 50 years for buildings and improvements, 3 to 16 years for machinery and equipment and 3 to 5 years for test equipment.
Other assets — Other non-current assets consist of the following at June 30, 2014 and 2013 (in thousands):
June 30, 2014 | June 30, 2013 | ||||||
Deferred engineering and design costs - non-current | $ | 1,700 | $ | — | |||
Environmental remediation - indemnification asset | 1,509 | — | |||||
Favorable leasehold - net | 492 | — | |||||
Deferred financing fees, net | 375 | 494 | |||||
Other | 351 | 296 | |||||
Total other non-current assets | $ | 4,427 | $ | 790 | |||
Engineering and design costs on long-term contracts not otherwise immediately reimbursed are deferred and recognized ratably over related revenue streams. At June 30, 2014, deferred engineering and design costs totaled approximately $2.4 million of which approximately $0.7 million was reflected in prepaid expenses and other current assets.
For a discussion of the Company's environmental remediation - indemnification asset, see Note 11.
The Company acquired a favorable leasehold in relation to its acquisition of Aydin Displays. The favorable leasehold is being amortized on a straight-line basis over the five year life of the lease and related amortization is reflected primarily within cost of goods sold on the consolidated statement of income.
Costs incurred in connection with the Company’s current Credit Facility of approximately $0.6 million were deferred and are amortized to interest expense over the five year term of the facility. Approximately, $0.1 million, $0.1 million and $0.3 million of amortization of these loan costs as well as the previous revolving-credit facility's loan costs were recognized and reported as interest expense for the years ended June 30, 2014, 2013 and 2012, respectively.
Goodwill and intangible assets — The Company tests for possible goodwill impairment annually or more often should events or changes in circumstances indicate the carry value of the goodwill may not be recoverable. The test is conducted at the reporting unit level. Sparton has three reportable business segments (Medical, Complex Systems, and DSS). In fiscal years 2014, 2013 and 2012, Medical, Complex Systems and DSS each consist of a single reporting unit. In fiscal 2014, goodwill resided within each of the Company's reporting units and testing was done on each unit. For fiscal years 2013 and 2012, all of the Company’s goodwill resided within the Medical reporting unit and goodwill impairment testing was conducted on this single reporting unit.
The Company may elect to perform a qualitative assessment for its annual goodwill impairment test. If the qualitative assessment indicates that it is more likely than not that the fair value of a reporting unit is less than its carrying amount, or if Sparton elects to not perform a qualitative assessment, then the Company would be required to perform a quantitative impairment test for goodwill.
F-9
A quantitative impairment analysis is a two-step process. First, the Company determines the fair value of the reporting unit and compares it to its carrying value. The fair value of reporting units is determined based on a weighting of both projected discounted future results and comparative market multiples. The projected discounted future results (discounted cash flow approach) is based on assumptions that are consistent with the Company’s estimates of future growth and the strategic plan used to manage the underlying business. Factors requiring significant judgment include assumptions related to future revenue growth rates, operating margins, terminal growth rates and discount factors, amongst other considerations. Second, if the carrying value of a reporting unit exceeds its estimated fair value, an impairment loss is recognized for any excess of the carrying value of the reporting unit’s goodwill over the implied fair value of that goodwill. The implied fair value of goodwill is determined by allocating the fair value of the reporting unit in a manner similar to a purchase price allocation. The residual fair value after this allocation is the implied fair value of the reporting unit goodwill. The Company’s fair value estimates related to its goodwill impairment analyses are based on Level 3 inputs within the fair value hierarchy as described below in this note under “Fair value measurements.” Determining the fair value of any reporting unit and intangible asset is judgmental in nature and involves the use of significant estimates and assumptions. The Company bases its fair value estimates on assumptions believed to be reasonable, but which are unpredictable and inherently uncertain. Actual future results may differ from those estimates. Circumstances that may lead to future impairment of goodwill include, but are not limited to, unforeseen decreases in future performance or industry demand, as well as further loss of a significant customer or program in excess of future incremental new business wins. The next annual goodwill impairment review is expected to be performed during the fourth quarter of fiscal 2015.
The Company's fiscal 2014 quantitative annual tests of goodwill related to the Medical, Complex Systems and DSS reporting units did not indicate that the related goodwill was impaired. In fiscal 2013, the Company elected to perform a qualitative assessment for its annual goodwill impairment test. Based on the Company's fiscal 2013 qualitative assessment of goodwill, the Company concluded that it was more likely than not that the fair value of its Medical segment was greater than its carrying amount, and therefore no further testing was required. The Company’s fiscal 2012 quantitative annual tests of goodwill related to its Medical reporting unit did not indicate that the related goodwill was impaired.
The Company’s intangible assets other than goodwill represent the values assigned to customer relationships acquired in conjunction with the Company’s purchases of Astro, Byers Peak, Onyx, Creonix, Aydin and Beckwood, values assigned to non-compete agreements acquired in conjunction with the Company’s purchase of Onyx, Beckwood and Aubrey, and values assigned to trademarks/tradenames and unpatented technology acquired in conjunction with the Company's purchase of Aydin. At June 30, 2014, Aydin customer relationships of approximately $1.3 million are included in the DSS segment, Creonix and Beckwood customer relationships of approximately $9.3 million are included within the Complex Systems segment. All remaining customer relationships intangible assets of $8.3 million are included within the Medical segment. The Beckwood non-compete intangible assets of $0.3 million reside in the Complex Systems segment, while Aubrey's non-compete intangible assets of $0.1 million reside in the Medical segment. Aydin's trademarks/tradenames of approximately $0.2 million and unpatented technology of approximately $0.5 million reside in the DSS segment. The impairment test for these intangible assets is conducted when impairment indicators are present. The Company continually evaluates whether events or circumstances have occurred that would indicate the remaining estimated useful lives of its intangible assets warrant revision or that the remaining balance of such assets may not be recoverable. The Company uses an estimate of the related undiscounted cash flows over the remaining life of the asset in measuring whether the asset is recoverable. If the carrying amount of an asset exceeds its estimated undiscounted future cash flows, an impairment charge would be recognized for the amount that the carrying amount of the asset exceeds the fair value of the asset. The Company’s fair value estimates related to its intangible assets impairment analyses are based on Level 3 inputs within the fair value hierarchy as described below in this note under “Fair value measurements.”
The customer relationships acquired in conjunction with the Company’s purchase of Astro, Byers Peak, Onyx, Creonix, and Beckwood are being amortized using an accelerated methodology over 10 years, while the customer relationships acquired in conjunction with the Company's purchase of Aydin are being amortized using an accelerated methodology over 15 years. The Company’s non-compete agreements are being amortized on a straight-line basis over five years for Beckwood and two years for Aubrey as the ratable decline in value over time is most consistent with the contractual nature of these assets. Aydin's trademarks/tradenames are being amortized on a straight-line basis over 10 years, while Aydin's unpatented technology is being amortized using an accelerated methodology over 7 years.
Impairment of long-lived assets — The Company reviews other long-lived assets that are not held for sale for impairment whenever events or changes in circumstances indicate that the carrying amount of an asset may not be recoverable. Impairment is determined by comparing the carrying value of the assets to their estimated future undiscounted cash flows. If such assets are considered to be impaired, the impairment to be recognized is measured by the amount by which the carrying amount of the asset group exceeds the fair value of the asset group. Assets to be disposed of are reported at the lower of the carrying amount or fair value less costs to sell and are reviewed at least quarterly.
F-10
Stock-based compensation — The Company measures the cost of employee and director services received in exchange for an award of equity-based securities using the fair value of the award on the date of the grant. The Company recognizes that cost on a straight-line basis over the period that the award recipient is required to provide service to the Company in exchange for the award and, for certain awards, subject to the probability that related performance targets will be met (see Note 12).
Earnings per share — Basic earnings per share is based on the weighted average number of common shares and participating securities outstanding during the period. Diluted earnings per share include the dilutive effect of additional potential common shares issuable under our stock-based compensation plans and are determined using the treasury stock method. Unvested restricted stock awards, which contain non-forfeitable rights to dividends whether paid or unpaid, are included in the number of shares outstanding for both basic and diluted earnings per share calculations. In the event of a net loss, unvested restricted stock awards are excluded from the calculation of both basic and diluted loss per share (see Note 13).
Income taxes - Income taxes are accounted for under the asset and liability method. Deferred tax assets and liabilities are recognized for the future tax consequences attributable to differences between the financial statement amounts of assets and liabilities and their respective tax bases and operating loss and tax credit carry forwards. Deferred tax assets and liabilities are measured using enacted tax rates expected to apply to taxable income in future years in which those temporary differences are expected to be recovered or settled. The effect on deferred tax assets and liabilities of a change in tax rate is recognized in income in the period that includes the enactment date. Deferred tax assets are reduced through the establishment of a valuation allowance at the time, based upon available evidence, it becomes more likely than not that the deferred tax assets will not be realized.
The Company recognizes the tax benefit from an uncertain tax position only if it is more likely than not that the tax position will be sustained on examination by the taxing authorities, based on the technical merits of the position. The tax benefits recognized in the consolidated financial statements from such a position are measured based on the largest benefit that has a greater than 50% likelihood of being realized upon ultimate resolution. Management also assesses whether uncertain tax positions, as filed, could result in the recognition of a liability for possible interest and penalties. The Company's policy is to include interest and penalties related to unrecognized tax benefits as a component of income tax expense.
ERAPSCO Agreement — Sparton is partner to a 50/50 joint venture (“JV”) with UnderSea Sensor Systems, Inc. (“USSI”), the only other major producer of U.S. derivative sonobuoys. USSI’s parent company is Ultra Electronics Holdings PLC, based in the United Kingdom. The JV operates under the name ERAPSCO and allows DSS and USSI to combine their own unique and complementary backgrounds to jointly develop and produce U.S. derivative sonobuoy designs for the U.S. Navy as well as foreign countries friendly to the U.S. In concept, and in practice, ERAPSCO serves as a pass-through entity maintaining no funds or assets. While the JV provides the opportunity to maximize efficiencies in the design and development of the related sonobuoys, both venture companies function independently as subcontractors; therefore, there is no separate entity to be accounted for or consolidated. The Board of Directors of ERAPSCO has the responsibility for the overall management and operation of the JV. The six member board consists of equal representation (full time employees) from both JV partners for three year terms. Manpower for ERAPSCO, specifically a president, vice president, general manager, contract administrator and financial manager, are similarly assigned by the JV partners for rotating three year terms and the costs of these assigned individuals are borne by the party assigning the personnel. In response to a customer request for proposal (“RFP”) that ERAPSCO will bid on, the Board of Directors of ERAPSCO approves both the composition of a response to the RFP and the composite bid to be submitted to the customer. The Board of Directors strives to divide the aggregate contract awards at a 50/50 share ratio. Each JV partner bears the costs it incurs associated with the preparation and submission of proposals. Each JV partner submits to ERAPSCO a proposal for the estimated price of performing that portion of the RFP applicable to it. Upon award of a contract to the JV, separate subcontracts are generated between ERAPSCO and each of the JV partners defining the responsibilities and compensation for each JV partner. These subcontracts contain terms and conditions consistent with the prime contract. Each JV partner is responsible to ERAPSCO for the successful execution of its respective scope of work under its subcontract and each JV partner is individually accountable for the profit or losses sustained in the execution of the subcontract against its respective bid. In some instances, either DSS or USSI handles the complete production and delivery of sonobuoys to ERAPSCO's customer. In other instances, either DSS or USSI starts the production and ship completed subassemblies to the other party for additional processing before being delivered to the customers. Under ERAPSCO, individual contract risk exposures are reduced, while the likelihood of achieving U.S. Navy and other ASW objectives is enhanced. ERAPSCO has been in existence for approximately twenty-six years and historically, the agreed upon products included under the JV were generally developmental or sonobuoys with low volume demand. Seven years ago, the JV expanded to include all future sonobuoy development and substantially all U.S. derivative sonobuoy products for customers outside of the United States. The JV was further expanded three years later to include all sonobuoy products for the U.S. Navy beginning with U.S. Navy's 2010 fiscal year contracts.
F-11
Revenue recognition — The Company’s net sales are comprised primarily of product sales, with supplementary revenues earned from engineering and design services. Standard contract terms are FOB shipping point. Revenue from product sales is generally recognized upon shipment of the goods; service revenue is recognized as the service is performed or under the percentage of completion method, depending on the nature of the arrangement. Long-term contracts related to DSS sonobuoy sales to the U.S. Navy and foreign government customers that require lot acceptance testing recognize revenue under the units-of-production percentage of completion method. The Company additionally has certain other long-term contracts that are accounted for under the units shipped percentage-of-completion method. Certain upfront engineering costs in relation to certain of these long-term contracts are capitalized and recognized over the life of the contract. At June 30, 2014 and 2013, current liabilities include payments in excess of costs of $3.2 million and $20.9 million, respectively, on government contracts. As noted above, sales related to these billings are recognized based upon units completed and are not recognized at the time of billings. A provision for the entire amount of a loss on a contract is charged to operations as soon as the loss is identified and the amount is reasonably determinable. Shipping and handling costs are included in cost of goods sold.
Advertising Costs — The Company expenses advertising costs as they are incurred. Advertising expense was approximately $0.2 million, $0.5 million and $0.5 million for the years ended June 30, 2014, 2013 and 2012, respectively.
Research and development expenditures — Internal research and development expenses reflect costs incurred for the internal development of technologies for use in navigation, heading and positioning systems applications. These costs include salaries and related expenses, contract labor and consulting costs, materials and the cost of certain research and development specific equipment. The Company incurred $1.2 million, $1.3 million and $1.3 million of internally funded research and development expenses during the years ended June 30, 2014, 2013 and 2012, respectively. Customer funded research and development costs, which are usually part of a larger production agreement, totaled approximately $9.7 million, $10.4 million and $8.6 million for the years ended June 30, 2014, 2013 and 2012, respectively.
Fair value measurements — Fair value estimates and assumptions and methods used to estimate the fair value of the Company’s assets and liabilities are made in accordance with the requirements of the Financial Accounting Standards Board (the “FASB”), Accounting Standards Codification (“ASC”) Topic 820, “Fair Value Measurements and Disclosures” (“ASC 820”).
ASC 820 clarifies that fair value is an exit price, representing the amount that would be received to sell an asset or paid to transfer a liability in an orderly transaction between market participants. As such, fair value is a market-based measurement that should be determined based on assumptions that market participants would use in pricing an asset or liability. As a basis for considering such assumptions, ASC 820 establishes a three-tier value hierarchy, which prioritizes the inputs used in measuring fair value as follows: Level 1 are observable inputs such as quoted prices in active markets; Level 2 are inputs other than the quoted prices in active markets that are observable either directly or indirectly; and Level 3 are unobservable inputs in which there is little or no market data, which require the Company to develop its own assumptions. This hierarchy requires the Company to use observable market data, when available, and to minimize the use of unobservable inputs when determining fair value. As of June 30, 2014, the Company has no assets or liabilities which it measures and carries on its balance sheet at fair value on a recurring basis.
The Company’s long-term debt instruments, consisting of borrowings under the Company's credit facility at June 30, 2014, are carried at historical cost. The fair value of the Company's credit facility debt at June 30, 2014 approximated its carry value of $41.0 million as the rates on these borrowings are variable in nature. See “Goodwill and intangible assets” above in this note and Note 7 for discussions of the Company’s non-recurring fair value measurement of goodwill and intangible assets. The fair value of accounts receivable and accounts payable approximated their carrying values at both June 30, 2014 and 2013.
Market risk exposure — The Company manufactures its products in the United States and Vietnam. Sales of the Company’s products are in the U.S. and foreign markets. The Company is subject to foreign currency exchange rate risk relating to intercompany activity and balances and to receipts from customers and payments to suppliers in foreign currencies. Adjustments related to the remeasurement of the Company's Vietnamese financial statements into U.S. dollars are included in current earnings. As a result, the Company's financial results could be affected by factors such as changes in foreign currency exchange rates or economic conditions in the domestic and foreign markets in which the Company operates. However, minimal third party receivables and payables are denominated in foreign currency and the related market risk exposure is considered to be immaterial.
F-12
The Company's revolving credit line, when drawn upon, is subject to future interest rate fluctuations which could potentially have a negative impact on cash flows of the Company. The Company had $41.0 million outstanding under its credit facility at June 30, 2014. A prospective increase of 100 basis points in the interest rate applicable to the Company's outstanding borrowings under its credit facility would result in an increase of approximately $0.4 million in our annual interest expense. The Company is not party to any currency exchange or interest rate protection agreements as of June 30, 2014. For a further description on Sparton’s debt, see Note 8.
New accounting standards — In July 2013, the Financial Accounting Standards Board (the "FASB") issued authoritative guidance under Accounting Standards Update No. 2013-11 ("ASU 2013-11"), which provides guidance on the financial statement presentation of an unrecognized tax benefit when a net operating loss (“NOL”) carryforward, a similar tax loss, or a tax credit carryforward exists. ASU 2013-11 requires entities to present an unrecognized tax benefit as a reduction of a deferred tax asset for a NOL or tax credit carryforward whenever the NOL or tax credit carryforward would be available to reduce the additional taxable income or tax due if the tax position is disallowed. This accounting standard update requires entities to assess whether to net the unrecognized tax benefit with a deferred tax asset as of the reporting date. ASU 2013-11 will be effective for the Company’s first quarter of fiscal 2015. The adoption of this guidance is not expected to have a significant impact on the Company's consolidated financial statements.
In May 2014, the FASB issued Accounting Standards Update No. 2014-09 ("ASU 2014-09"), which amends guidance for revenue recognition. Under the new standard, revenue will be recognized when control of the promised goods or services is transferred to customers in an amount that reflects the consideration to which the Company expects to be entitled in exchange for those goods and services. The standard creates a five-step model that will generally require companies to use more judgment and make more estimates than under current guidance when considering the terms of contracts along with all relevant facts and circumstances. These include the identification of customer contracts and separating performance obligations, the determination of transaction price that potentially includes an estimate of variable consideration, allocating the transaction price to each separate performance obligation, and recognizing revenue in line with the pattern of transfer. The standard also requires extensive additional disclosures to provide greater insight into revenues recognized and deferred, including quantitative and qualitative information about significant judgments and changes in those judgments made to determine the timing and amount of revenues recognized. ASU 2014-09 is effective for annual reporting periods beginning after December 15, 2016, including interim periods within that reporting period. Early adoption is not permitted. Companies have the option of using either a full or modified retrospective approach in applying this standard. The Company is currently in the process of evaluating the impact of adoption on its consolidated financial statements.
(3) Change in Accounting Principle
In the first quarter of fiscal 2014, the Company voluntarily changed its revenue recognition policy related to DSS sonobuoy sales to the U.S. Navy and foreign government customers under long-term contracts that require lot acceptance testing. The new policy continues to recognize revenue under the percentage of completion method, but changes the measurement of progress under these contracts from a completed units accepted basis (whereby revenue was recognized for each lot of sonobuoys produced when that lot was formally accepted by the customer) to a units-of-production basis (whereby revenue is recognized when production and internal testing of each lot of sonobuoys is completed). The Company now has significant experience in producing sonobuoys to customer specifications and internal testing to assess compliance with those specifications and, as such, now has an adequate history of continuous customer acceptance of all sonobuoys produced. Accordingly, the Company believes the new method is preferable primarily because it eliminates delays in revenue and related cost of goods sold recognition due to timing of customer testing and acceptance delays. Such delays commonly occur due to customer circumstances that are unrelated to the product produced. Under the new policy, the revenue and related costs of goods sold of these manufactured sonobuoy lots will more closely match the period in which the product was produced and the related revenue earned, thereby better reflecting the economic activity of the DSS segment. Additionally, this new method provides better matching of periodic operating expenses incurred during production.
F-13
For the year ended June 30, 2014, this change in accounting policy increased DSS and consolidated net sales and gross profit by $5.1 million and $2.0 million, respectively, basic income per share and diluted income per share by $0.12. The following tables present the effects of the retrospective application of this voluntary change in accounting principle (Dollars in thousands, except share amounts):
Consolidated Statement of Income Data: | ||||||||||||
For the Year Ended June 30, 2013 | ||||||||||||
As Originally Reported (a) | Adjustment | As Restated | ||||||||||
Net sales | $ | 266,015 | $ | (1,388 | ) | $ | 264,627 | |||||
Cost of goods sold | 220,413 | (1,221 | ) | 219,192 | ||||||||
Gross profit | 45,602 | (167 | ) | 45,435 | ||||||||
Income before provision for income taxes | 16,339 | (167 | ) | 16,172 | ||||||||
Provision for (benefit from) income taxes | 2,763 | (61 | ) | 2,702 | ||||||||
Net income | 13,576 | (106 | ) | 13,470 | ||||||||
Income per share of common stock - Basic | 1.33 | (0.01 | ) | 1.32 | ||||||||
Income per share of common stock - Diluted | 1.33 | (0.01 | ) | 1.32 | ||||||||
Weighted average shares outstanding - Basic | 10,193,530 | 10,193,530 | ||||||||||
Weighted average shares outstanding - Diluted | 10,228,687 | 10,228,687 | ||||||||||
Consolidated Statement of Income Data: | ||||||||||||
For the Year Ended June 30, 2012 | ||||||||||||
As Originally Reported | Adjustment | As Restated | ||||||||||
Net sales | $ | 223,577 | $ | 2,878 | $ | 226,455 | ||||||
Cost of goods sold | 185,075 | 2,348 | 187,423 | |||||||||
Gross profit | 38,502 | 530 | 39,032 | |||||||||
Income before provision for income taxes | 14,586 | 530 | 15,116 | |||||||||
Provision for income taxes | 5,078 | 191 | 5,269 | |||||||||
Net income | 9,508 | 339 | 9,847 | |||||||||
Income per share of common stock - Basic | 0.93 | 0.04 | 0.97 | |||||||||
Income per share of common stock - Diluted | 0.93 | 0.03 | 0.96 | |||||||||
Weighted average shares outstanding - Basic | 10,174,176 | 10,174,176 | ||||||||||
Weighted average shares outstanding - Diluted | 10,208,810 | 10,208,810 | ||||||||||
Consolidated Balance Sheet Data: | ||||||||||||
As of June 30, 2013 | ||||||||||||
As Originally Reported (a) | Adjustment | As Restated | ||||||||||
Inventories | $ | 46,334 | $ | — | $ | 46,334 | ||||||
Deferred income taxes | 3,167 | (216 | ) | 2,951 | ||||||||
Performance based payments on customer contracts | 21,504 | (602 | ) | 20,902 | ||||||||
Retained earnings | 65,571 | 386 | 65,957 | |||||||||
(a) | Fiscal 2013 statement of income and balance sheet data have been adjusted to reflect a measurement period retrospective elimination of the previously recognized gain on acquisition recorded in the fourth quarter of fiscal 2013 relating to Creonix, LLC. See Note 4 for a further discussion. |
F-14
(4) Acquisitions
Fiscal Year 2015
Electronic Manufacturing Technology, LLC. — On July 9, 2014, the Company completed the acquisition of Electronic Manufacturing Technology, LLC. (“eMT”). The purchase price of $18.5 million is subject to a final working capital adjustment and was financed through the use of borrowings under the Company's Credit Facility. The acquired business, which will be part of the Company's Complex Systems segment and which is expected to add $25 million (unaudited) in projected annualized revenue, is engaged in the contract services business of manufacturing electromechanical controls and electronic assemblies. Their customer profile includes international Fortune 1000 manufacturers of highly reliable industrial excimer laser products, laser eye surgery sub-assemblies, target simulators for space and aviation systems, power modules for computerized tomography products, test systems for commercial aerospace OEMs, and toll road antennas and control boxes. The transaction includes an approximate $2.4 million escrowed holdback which is available to fund any potential post-closing working capital adjustment and potential seller indemnification obligations in relation to the acquisition agreement.
The initial accounting for the acquisition is not complete pending detailed analyses of the facts and circumstances that existed as of the acquisition date.
Fiscal Year 2014
Aubrey Group, Inc. — On March 17, 2014, the Company completed the acquisition of Aubrey Group, Inc. ("Aubrey”), located in Irvine, CA, in a $5.3 million all-cash transaction, subject to certain post-closing adjustments and financed through the use of borrowings under the Company's Credit Facility. Additional consideration of approximately $0.6 million was paid at closing for cash of the business in excess of net customer deposits held by the Aubrey. At June 30, 2014, the Company has recognized accounts receivable of $0.3 million as consideration to be returned in relation to a post-closing working capital adjustment, which is expected to be settled in the first quarter of the Company's fiscal 2015 year. The transaction includes an approximate $0.5 million escrowed holdback which is available to fund any potential post-closing working capital adjustment and potential seller indemnification obligations in relation to the acquisition agreement.
The acquired business, a design and manufacturing company, which is part of the Medical segment and which is expected to add $8 million (unaudited) in annualized revenue, develops new products for OEMs in the Medical and Biotechnological markets. Inventors, entrepreneurs, and industry leading OEMs utilize Aubrey's design and engineering teams to develop innovative solutions in a timely manner in their efforts to deliver their new products into the marketplace faster and more cost effectively.
F-15
The following table represents the allocation of the total consideration to assets acquired and liabilities assumed in the acquisition of Aubrey based on Sparton’s estimate of their respective fair values at the acquisition date (in thousands):
Total purchase consideration: | |||
Cash | $ | 5,300 | |
Additional cash consideration paid for cash of the business in excess of net customer deposits | 573 | ||
Accounts receivable recognized for post-closing working capital adjustment | (252 | ) | |
Total purchase consideration | $ | 5,621 | |
Assets acquired and liabilities assumed: | |||
Cash | $ | 1,056 | |
Accounts receivable, net | 680 | ||
Inventories | 184 | ||
Deferred income taxes | 4 | ||
Other current assets | 22 | ||
Property, plant and equipment | 221 | ||
Intangible asset - non-compete agreements | 140 | ||
Goodwill | 4,510 | ||
Deferred income taxes - non-current | 290 | ||
Accounts payable | (173 | ) | |
Other current liabilities | (1,313 | ) | |
Total assets acquired and liabilities assumed | $ | 5,621 | |
The Aubrey acquisition has resulted in approximately $4.5 million of goodwill, which is not expected to be deductible for tax purposes and has been assigned entirely to the Company's Medical segment. The Company believes that goodwill primarily relates to strategic fit, resulting synergies and the acquired workforce that this business brings to existing operations. The non-compete agreements are being amortized using a straight-line methodology over two years.
Included in the Company’s Consolidated Statements of Income for the year ended June 30, 2014 are net sales of approximately $2.2 million and loss before provision for income taxes of approximately $0.3 million, since the March 17, 2014 acquisition of Aubrey.
The Company incurred legal, professional and other costs related to this acquisition aggregating approximately $0.3 million. These costs were recognized as selling and administrative expenses in the year ended June 30, 2014 and reflected as non-segment corporate and other unallocated costs.
Beckwood Services, Inc. — On December 11, 2013, the Company completed the acquisition of Beckwood Services, Inc. ("Beckwood”), located in Plaistow, N.H., in a $15.3 million all-cash transaction financed through the use of cash on hand and borrowings under the Company's Credit Facility. The transaction includes an approximate $1.5 million escrowed holdback which is available to fund potential seller indemnification obligations in relation to the acquisition agreement.
The acquired business, which is part of the Company's Complex Systems segment and which is expected to add $18 million (unaudited) in annualized revenue, develops electronic or electro-mechanical controls and electronic assemblies. Their customer profile includes international Fortune 1000 manufacturers of industrial control systems, analytical instruments, measuring and detecting equipment and military, defense and Homeland Security equipment.
F-16
The following table represents the allocation of the total consideration to assets acquired and liabilities assumed in the acquisition of Beckwood based on Sparton’s estimate of their respective fair values at the acquisition date (in thousands):
Total purchase consideration: | |||
Cash | $ | 15,300 | |
Additional cash consideration for post-closing working capital adjustment | 46 | ||
Total purchase consideration | $ | 15,346 | |
Assets acquired and liabilities assumed: | |||
Accounts receivable, net | $ | 1,157 | |
Inventories | 2,075 | ||
Deferred income taxes | 108 | ||
Other current assets | 122 | ||
Property, plant and equipment | 83 | ||
Intangible asset - customer relationships | 10,000 | ||
Intangible asset - non-compete agreements | 280 | ||
Goodwill | 6,731 | ||
Other long-term assets | 8 | ||
Accounts payable | (866 | ) | |
Deferred income taxes - non-current | (3,761 | ) | |
Other current liabilities | (591 | ) | |
Total assets acquired and liabilities assumed | $ | 15,346 | |
The Beckwood acquisition has resulted in approximately $6.7 million of goodwill, which is not expected to be deductible for tax purposes and has been assigned entirely to the Company’s Complex Systems segment. The Company believes goodwill primarily relates to strategic fit, resulting synergies and the acquired workforce that this business brings to existing operations. The fair values of acquired identifiable intangible assets have been determined to be Level 3 under the fair value hierarchy and have been estimated based on projected future cash flows and customer attrition rates, discounted using an estimated weighted average cost of capital. The customer relationships are being amortized using an accelerated methodology over ten years. The non-compete agreements are being amortized using a straight-line methodology over five years.
Included in the Company’s Consolidated Statements of Income for the year ended June 30, 2014 are net sales of approximately $9.5 million and income before provision for income taxes of approximately $0.2 million, since the December 11, 2013 acquisition of Beckwood.
The Company incurred legal, professional and other costs related to this acquisition aggregating approximately $0.2 million for the year ended June 30, 2014. These costs were recognized as selling and administrative expenses and reflected as non-segment corporate and other unallocated costs.
Aydin Displays, Inc. — On August 30, 2013, the Company completed the acquisition of certain assets and liabilities of Aydin Displays, Inc. ("Aydin Displays" or “Aydin”), located in Birdsboro, PA, in a $15.5 million all-cash transaction, after settlement of a $0.5 million working capital adjustment during the third quarter of the Company's fiscal 2014 year. The transaction was financed through the use of borrowings under the Company's Credit Facility. Additional acquisition consideration of up to $6.6 million is contingent upon Aydin attaining certain performance thresholds during the twelve month period following the transaction. The transaction includes an approximate $1.2 million escrowed holdback which is available to fund potential seller indemnification obligations in relation to the acquisition agreement.
The acquired business, which is part of the Company's DSS segment and which is expected to add $18 million (unaudited) in annualized revenue, develops enhanced flat panel display and touch-screen solutions with application-critical performance criteria including ruggedization, high resolution, color accuracy, response/refresh times, sunlight readability and other criteria such as magnetic interference and emanations security for the Military & Aerospace and Civil Marine markets. These products are currently specified in the U.S. Navy P8A Poseidon ASW aircraft behind-the-cockpit control center, the command and control centers of many U.S. Navy ships, Federal Aviation Administration air traffic control systems, and cockpit command centers for various civil marine applications. The acquired business will continue to operate as Aydin Displays.
F-17
The following table represents the allocation of the total consideration to assets acquired and liabilities assumed in the acquisition of Aydin based on Sparton’s estimate of their respective fair values at the acquisition date (in thousands):
Total purchase consideration: | |||
Cash | $ | 15,000 | |
Additional cash consideration for post-closing working capital adjustment | 502 | ||
Total purchase consideration | $ | 15,502 | |
Assets acquired and liabilities assumed: | |||
Accounts receivable, net | $ | 2,279 | |
Inventories | 6,601 | ||
Other current assets | 895 | ||
Property, plant and equipment | 582 | ||
Intangible asset - customer relationships | 1,500 | ||
Intangible asset - trade names and trademarks | 180 | ||
Intangible asset - unpatented technology | 650 | ||
Goodwill | 2,181 | ||
Other long-term assets - favorable leasehold | 590 | ||
Other long-term assets | 1,702 | ||
Accounts payable | (1,215 | ) | |
Other current liabilities | (443 | ) | |
Total assets acquired and liabilities assumed | $ | 15,502 | |
Additional acquisition consideration of up to $6.6 million is contingent upon Aydin attaining certain performance thresholds. The Company has assigned no fair value to this contingent liability. The Aydin acquisition has resulted in approximately $2.2 million of goodwill, which is expected to be deductible for tax purposes and has been assigned entirely to the Company’s DSS segment. The Company believes goodwill primarily relates to strategic fit, resulting synergies and the acquired workforce that this business brings to existing operations. The fair values of acquired identifiable intangible assets have been determined to be Level 3 under the fair value hierarchy and have been estimated based on projected future cash flows and customer attrition rates, discounted using an estimated weighted average cost of capital. The customer relationships are being amortized using an accelerated methodology over fifteen years. Trade names and trademarks are being amortized using a straight-line methodology over ten years. The unpatented technology is being amortized using an accelerated methodology over seven years. The favorable leasehold is reflected in other long-term assets on the consolidated balance sheet and is being amortized on a straight-line basis over the five year life of the lease. Amortization related to Aydin unpatented technology and favorable leasehold is reflected primarily within cost of goods sold on the consolidated statement of income.
Included in the Company’s Consolidated Statements of Income for the year ended June 30, 2014 are net sales of approximately $14.3 million and income before provision for income taxes of approximately $0.9 million, since the August 30, 2013 acquisition of Aydin.
The Company incurred legal, professional and other costs related to this acquisition aggregating approximately $0.3 million for the year ended June 30, 2014, respectively. These costs were recognized as selling and administrative expenses and reflected as non-segment corporate and other unallocated costs.
Fiscal Year 2013
Creonix, LLC — On June 6, 2013, the Company completed the acquisition of certain assets related to the contract manufacturing business of Creonix, LLC (“Creonix”) in a $2.0 million all-cash transaction, after settlement of a $0.1 million working capital adjustment during the second quarter of the Company's fiscal 2014 year. The transaction was financed through the use of borrowings under the Company's credit facility.
The acquired business, which is reported in the Company's Complex Systems segment, provided the Company with the capability of cable and wire harness engineering and assembly. Additionally, the acquisition provided further expansion into the Industrial and Military & Aerospace markets, diversified Sparton's customer base and increased utilization of the Company's existing assets through the consolidation of this business into Complex Systems's Brooksville, Florida plant. Creonix primarily manufactures products and components for battery monitoring, high speed optical imaging, neuromuscular incapacitation, imaging and wiring assemblies for military applications, and electrical grid transformer protection systems.
F-18
During the fiscal year ended June 30, 2014, the Company finalized the inventory adjustment under the Creonix asset purchase agreement resulting in a decrease in the previously recorded related receivable from the seller. This measurement period increase in total purchase consideration resulted in the retrospective elimination of the previously recognized gain on acquisition recorded in the fourth quarter of fiscal 2013 of less than $0.1 million and resulted in the recognition of approximately $0.1 million of goodwill. The Company's June 30, 2013 balance sheet has been recast to reflect this adjustment. The following table presents the final allocation of the total consideration to assets acquired and liabilities assumed from Creonix based on Sparton’s estimate of their respective fair values at the acquisition date (in thousands):
Total purchase consideration: | |||
Cash | $ | 2,100 | |
Reduction in cash consideration in relation to working capital adjustment | (105 | ) | |
Total purchase consideration | $ | 1,995 | |
Assets acquired and liabilities assumed: | |||
Inventories | $ | 1,321 | |
Equipment | 304 | ||
Intangible assets — customer relationships | 270 | ||
Goodwill | 100 | ||
Total assets acquired and liabilities assumed | $ | 1,995 | |
Onyx EMS, LLC — On November 15, 2012, the Company completed the acquisition of Onyx EMS, LLC (“Onyx”) in a $43.25 million all-cash transaction, subject to certain post-closing adjustments, which was financed through the use of Company cash and borrowings under the Company's credit facility. Additional consideration of $2.19 million was paid in relation to a post-closing working capital adjustment, which was settled in the Company's fiscal 2013 third quarter.
The acquired business, which is reported in the Company's Medical segment, provided further expansion regionally into the Minneapolis medical device corridor, diversified the Company's customer base through both existing programs and a strong business development pipeline, and increased the number of complex sub-assembly and full device programs within Sparton. Additionally, Onyx brought long-term customers which can utilize Sparton's expanded list of service offerings such as our low cost country footprint in Vietnam and full engineering design capabilities. Onyx primarily manufactures medical devices for OEM and ET companies, including products for cardiovascular diagnostics, hearing assistance, patient temperature and warming, point-of-care diagnostics, and surgical equipment used in intraosseous medicine. Onyx also produces products such as precision measurement instruments for monitoring air quality and pollution, commercial fire and smoke alarm systems, sensing tools, test fixtures, and complex LED assemblies.
Pro Forma Results — The following table summarizes, on a pro forma basis, the combined results of operations of the Company and the acquired businesses of Aubrey, Beckwood and Aydin as though the acquisitions had occurred as of July 1, 2012 and Creonix and Onyx as though the acquisitions had occurred as of July 1, 2011. The pro forma amounts presented are not necessarily indicative of either the actual consolidated results had the acquisitions occurred as of July 1, 2012 and 2011, respectively, or of future consolidated operating results (in thousands, except per share amounts):
For the Year Ended | |||||||
June 30, 2014 | June 30, 2013 | ||||||
Net sales | $ | 350,984 | $ | 337,214 | |||
Income before provision for income taxes | $ | 18,984 | $ | 17,547 | |||
Net income | $ | 12,371 | $ | 14,329 | |||
Net income per share — basic | $ | 1.22 | $ | 1.41 | |||
Net income per share — diluted | $ | 1.22 | $ | 1.40 | |||
Pro forma results presented above primarily reflect: (1) incremental depreciation relating to fair value adjustments to property, plant and equipment; (2) amortization adjustments relating to fair value estimates of intangible assets; (3) elimination of interest expense relating to debt paid off in conjunction with the transaction; (4) incremental interest expense on assumed indebtedness and amortization of capitalized financing costs incurred in connection with the transactions; and 5) additional cost of goods sold relating to the capitalization of gross profit recognized in the year of acquisition as part of purchase accounting recognized for purposes of the pro forma as if it was recognized during the preceding year. Pro forma adjustments described above have been tax effected using Sparton's effective rate during the respective periods.
F-19
(5) Inventories and Cost of Contracts in Progress, net
The following are the major classifications of inventory, net of interim billings, at June 30, 2014 and 2013 (in thousands):
June 30, 2014 | June 30, 2013 | ||||||
Raw materials | $ | 40,535 | $ | 43,550 | |||
Work in process | 10,609 | 10,170 | |||||
Finished goods | 10,188 | 7,793 | |||||
Total inventory and cost of contracts in progress, gross | 61,332 | 61,513 | |||||
Inventory to which the U.S. government has title due to interim billings | (7,960 | ) | (15,179 | ) | |||
Total inventory and cost of contracts in progress, net | $ | 53,372 | $ | 46,334 | |||
(6) Property, Plant and Equipment, net
Property, plant and equipment, net consists of the following at June 30, 2014 and 2013 (in thousands):
June 30, 2014 | June 30, 2013 | ||||||
Land and land improvements | $ | 1,429 | $ | 1,405 | |||
Buildings and building improvements | 25,779 | 24,920 | |||||
Machinery and equipment | 29,480 | 27,183 | |||||
Construction in progress | 1,893 | 767 | |||||
Total property, plant and equipment | 58,581 | 54,275 | |||||
Less accumulated depreciation | (30,058 | ) | (25,371 | ) | |||
Total property, plant and equipment, net | $ | 28,523 | $ | 28,904 | |||
(7) Goodwill and Other Intangible Assets
Goodwill represents the excess of purchase price over the fair value of the net assets acquired in conjunction with the Company’s purchases of Astro Instrumentation, LLC (“Astro”) in May 2006, Byers Peak, Incorporated (“Byers Peak”) in March 2011, Onyx EMS, LLC ("Onyx") in November 2012, Creonix in June 2013, Aydin in August 2013, Beckwood in December 2013 and Aubrey in March 2014. Goodwill related to Astro, Byers Peak, Onyx and Aubrey are reflected within the Company’s Medical operating segment. During the year ended June 30, 2011, the Company recognized a $13.2 million impairment of goodwill related to the acquisition of Astro. Goodwill related to Creonix and Beckwood are reflected within the Company's Complex Systems operating segment. Goodwill related to Aydin Displays is reflected within the Company's DSS operating segment. Changes in the carrying value of goodwill for the years ended June 30, 2014 and 2013 and the ending composition of goodwill as of June 30, 2014 and June 30, 2013 are as follows (in thousands):
F-20
June 30, 2014 | |||||||||||||||
Medical | CS | DSS | Total | ||||||||||||
Goodwill, beginning of period | $ | 14,667 | $ | 100 | $ | — | $ | 14,767 | |||||||
Additions to goodwill during the period | 4,510 | 6,731 | 2,181 | 13,422 | |||||||||||
Goodwill, end of period | $ | 19,177 | $ | 6,831 | $ | 2,181 | $ | 28,189 | |||||||
June 30, 2013 | |||||||||||||||
Medical | CS | DSS | Total | ||||||||||||
Goodwill, beginning of period | $ | 7,472 | $ | — | $ | — | $ | 7,472 | |||||||
Additions to goodwill during the period | 7,195 | 100 | — | 7,295 | |||||||||||
Goodwill, end of period | $ | 14,667 | $ | 100 | $ | — | $ | 14,767 | |||||||
June 30, 2014 | |||||||||||||||
Medical | CS | DSS | Total | ||||||||||||
Acquired Goodwill | $ | 32,330 | $ | 6,831 | $ | 2,181 | $ | 41,342 | |||||||
Accumulated impairment | (13,153 | ) | — | — | (13,153 | ) | |||||||||
Goodwill | $ | 19,177 | $ | 6,831 | $ | 2,181 | $ | 28,189 | |||||||
June 30, 2013 | |||||||||||||||
Medical | CS | DSS | Total | ||||||||||||
Acquired Goodwill | $ | 27,820 | $ | 100 | $ | — | $ | 27,920 | |||||||
Accumulated impairment | (13,153 | ) | — | — | (13,153 | ) | |||||||||
Goodwill | $ | 14,667 | $ | 100 | $ | — | $ | 14,767 | |||||||
Other intangible assets represent the values assigned to customer relationships acquired in conjunction with the Company’s purchases of Astro, Byers Peak, Onyx, Creonix, Aydin and Beckwood, values assigned to non-compete agreements acquired in conjunction with the Company’s purchase of Onyx, Beckwood, and Aubrey and values assigned to trademarks and tradenames and unpatented technology acquired with the Company's purchase of Aydin. The amortization periods, gross carrying amounts, accumulated amortization, accumulated impairments and net carrying values of intangible assets at June 30, 2014 and June 30, 2013 are as follows (in thousands):
Original Amortization Period in Months | Gross Carrying Amount | Accumulated Amortization | Accumulated Impairments | Net Carrying Value | ||||||||||||||
June 30, 2014 | ||||||||||||||||||
Amortized intangible assets: | ||||||||||||||||||
Non-compete agreements | 24 - | 60 | $ | 420 | $ | (46 | ) | $ | — | $ | 374 | |||||||
Customer relationships | 120 - | 180 | 29,870 | (7,220 | ) | (3,663 | ) | 18,987 | ||||||||||
Trademarks/Tradenames | 120 | 180 | (15 | ) | — | 165 | ||||||||||||
Unpatented technology | 84 | 650 | (135 | ) | 515 | |||||||||||||
$ | 31,120 | $ | (7,416 | ) | $ | (3,663 | ) | $ | 20,041 | |||||||||
June 30, 2013 | ||||||||||||||||||
Amortized intangible assets: | ||||||||||||||||||
Non-compete agreements | 12 | $ | 358 | $ | (274 | ) | $ | — | $ | 84 | ||||||||
Customer relationships | 120 - | 180 | 18,370 | (4,078 | ) | (3,663 | ) | 10,629 | ||||||||||
$ | 18,728 | $ | (4,352 | ) | $ | (3,663 | ) | $ | 10,713 | |||||||||
F-21
Sparton did not incur any significant costs to renew or alter the term of its intangible assets during the year ended June 30, 2014. Amortization expense for the years ended June 30, 2014, 2013 and 2012 were approximately $3.4 million, $1.6 million and $0.4 million, respectively. A portion of the 2014 amortization expense is included in cost of goods sold on the income statement. Aggregate amortization expense relative to existing intangible assets for the periods shown is currently estimated to be as follows (in thousands):
Fiscal Year Ending June 30, | |||
2015 | $ | 4,043 | |
2016 | 3,581 | ||
2017 | 3,084 | ||
2018 | 2,640 | ||
2019 | 2,168 | ||
Thereafter | 4,525 | ||
Total | $ | 20,041 | |
(8) Debt
Debt consists of the following at June 30, 2014 and 2013 (in thousands):
June 30, 2014 | June 30, 2013 | ||||||
Industrial revenue bonds, face value | $ | — | $ | 1,623 | |||
Less unamortized purchase discount | — | (84 | ) | ||||
Industrial revenue bonds, carrying value | — | 1,539 | |||||
Borrowings under Credit Facility | 41,000 | 10,000 | |||||
Total long-term debt | 41,000 | 11,539 | |||||
Less: current portion | (900 | ) | (136 | ) | |||
Long-term debt, net of current portion | $ | 40,100 | $ | 11,403 | |||
Current maturities of long-term debt at June 30, 2014 reflects the current portions of the Company’s Aquisition Facility. Short term debt at June 30, 2013 reflects the current portion of the Company's industrial revenue bonds.
Industrial Revenue Bonds
In connection with its acquisition of Astro in May 2006, the Company assumed repayment of principal and interest on bonds originally issued to Astro by the State of Ohio. These bonds are Ohio State Economic Development Revenue Bonds, series 2002-4. Astro originally entered into the loan agreement with the State of Ohio for the issuance of these bonds to finance the construction of the Company’s Ohio operating facility. The principal amount, including premium, was issued in 2002 and totaled approximately $2.9 million. These bonds have interest rates which vary, dependent on the maturity date of the bonds ranging from 5.00% to 5.45%. Due to an increase in interest rates since the original issuance of the bonds, a discount amounting to approximately $0.2 million on the date of assumption by Sparton was recorded.
In June, 2014, the Company redeemed all of its remaining outstanding Industrial Revenue Bonds.
Credit Facility
On November 15, 2012, the Company replaced its previous revolving line-of-credit facility with a new $65.0 million credit facility with BMO Harris Bank N.A., consisting of a $35.0 million revolving line-of-credit facility (the “Revolving Credit”) to support the Company’s working capital needs and other general corporate purposes, and a $30.0 million acquisition loan commitment (the “Acquisition Facility” and together with the Revolving Credit, the “Credit Facility”) to finance permitted acquisitions. The Credit Facility expires on November 15, 2017, is secured by substantially all assets of the Company and provides for up to an additional $35 million in uncommitted loans available for additional Revolving Credit loans or Acquisition loans. In July 2014, the Company exercised the accordian feature of its Credit Facility increasing lender commitments under the Facility by $35.0 million to a total of $100.0 million.
F-22
Advances under the Acquisition Facility are available until November 15, 2014. Loans under the Acquisition Facility amortize in two tranches, such that loans outstanding on November 15, 2013 began amortizing in quarterly installments equal to 2.5% of the principal amount outstanding on such date, and advances made after November 15, 2013 and outstanding on November 15, 2014 begin amortizing on the same basis. Advances outstanding under the Acquisition Facility at June 30, 2014 were $18.0 million, of which $0.9 million was reflected as current on the consolidated balance sheet.
Outstanding borrowings under the Credit Facility bear interest, at the Company’s option, at either LIBOR, fixed for interest periods of one, two, three or six month periods, plus 1.25% to 2.00%, or at the bank’s base rate, as defined, plus 0.25% to 1.00%, based upon the Company’s Total Funded Debt/EBITDA Ratio, as defined. The Company is also required to pay commitment fees on unused portions of the Credit Facility ranging from 0.25% to 0.375%, based on the Company’s Total Funded Debt/EBITDA Ratio, as defined. The effective interest rate on outstanding borrowings under the Credit Facility was 1.65% at June 30, 2014.
As a condition of the Credit Facility, the Company is subject to certain customary covenants, which it was in compliance with at June 30, 2014. The Company had $41.0 million of borrowings drawn against the Credit Facility at June 30, 2014 and additionally had certain letters of credit outstanding totaling $0.6 million.
(9) Income Taxes
Income (loss) before income taxes by country consists of the following amounts (in thousands):
For the year ended June 30, | |||||||||||
2014 | 2013 | 2012 | |||||||||
United States | $ | 18,915 | $ | 15,239 | $ | 14,102 | |||||
Vietnam | 691 | 936 | 1,031 | ||||||||
Canada | (4 | ) | (3 | ) | (17 | ) | |||||
$ | 19,602 | $ | 16,172 | $ | 15,116 | ||||||
The provision for income taxes consists of the following components (in thousands):
For the year ended June 30, | |||||||||||
2014 | 2013 | 2012 | |||||||||
Current: | |||||||||||
United States | $ | 6,913 | $ | 2,346 | $ | 1,294 | |||||
Vietnam | 134 | 85 | 81 | ||||||||
Canada | — | — | — | ||||||||
State and local | 544 | 430 | — | ||||||||
7,591 | 2,861 | 1,375 | |||||||||
Deferred: | |||||||||||
United States | (852 | ) | (14 | ) | 3,626 | ||||||
Vietnam | 7 | — | — | ||||||||
Canada | — | — | — | ||||||||
State and local | (131 | ) | (145 | ) | 268 | ||||||
(976 | ) | (159 | ) | 3,894 | |||||||
$ | 6,615 | $ | 2,702 | $ | 5,269 | ||||||
F-23
The consolidated effective income tax rate differs from the statutory U.S. federal tax rate for the following reasons and by the following percentages:
For the year ended June 30, | ||||||||
2014 | 2013 | 2012 | ||||||
Statutory U.S. federal income tax rate | 35.0 | % | 34.0 | % | 34.0 | % | ||
Significant increases (reductions) resulting from: | ||||||||
Changes in valuation allowance | — | — | 2.1 | |||||
Domestic production activities deduction | (2.7 | ) | (2.1 | ) | — | |||
Vietnam tax rate differences | (0.7 | ) | (1.4 | ) | (1.8 | ) | ||
State and local income taxes, net of federal benefit | 2.3 | 1.8 | 1.8 | |||||
Canadian worthless stock and bad debt deduction | — | (12.5 | ) | — | ||||
Other | (0.2 | ) | (3.1 | ) | (1.2 | ) | ||
Effective income tax rate | 33.7 | % | 16.7 | % | 34.9 | % | ||
Significant components of deferred income tax assets and liabilities at June 30, 2014 and 2013, are as follows (in thousands):
June 30, 2014 | June 30, 2013 | ||||||
Deferred tax assets: | |||||||
Intangible assets | $ | — | $ | 1,598 | |||
Goodwill | 906 | 1,500 | |||||
Environmental remediation | 2,458 | 1,143 | |||||
Inventories | 2,694 | 2,238 | |||||
Employment and compensation accruals | 1,090 | 916 | |||||
Capital loss carryover | 263 | 255 | |||||
State tax carryovers | 236 | 172 | |||||
Canadian tax benefits | 2,063 | 2,063 | |||||
Pension liability | — | 151 | |||||
Restructuring accruals | — | 16 | |||||
Other | 1,303 | 849 | |||||
Gross deferred tax assets | 11,013 | 10,901 | |||||
Less valuation allowance | (2,456 | ) | (2,403 | ) | |||
Total deferred tax assets | 8,557 | 8,498 | |||||
Deferred tax liabilities: | |||||||
Property, plant and equipment | (1,296 | ) | (1,068 | ) | |||
Intangible assets | (1,397 | ) | — | ||||
Pension asset | (16 | ) | — | ||||
Other | (843 | ) | (404 | ) | |||
Gross deferred tax liabilities | (3,552 | ) | (1,472 | ) | |||
Net deferred tax assets | $ | 5,005 | $ | 7,026 | |||
Net deferred income tax assets are included in the balance sheets at June 30, 2014 and 2013, as follows (in thousands):
June 30, 2014 | June 30, 2013 | ||||||
U.S. net deferred income tax assets, current | $ | 3,813 | $ | 2,951 | |||
U.S. net deferred income tax assets, non-current | 1,192 | 4,075 | |||||
$ | 5,005 | $ | 7,026 | ||||
F-24
In preparing the Company's consolidated financial statements, management has assessed the likelihood that its deferred income tax assets will be realized from future taxable income. In evaluating the ability to recover its deferred income tax assets, management considers all available evidence, positive and negative, including the Company's operating results, ongoing tax planning and forecasts of future taxable income on a jurisdiction by jurisdiction basis. A valuation allowance is established if it is determined that it is more likely than not that some portion or all of the net deferred income tax assets will not be realized. Management exercises significant judgment in determining the Company's provisions for income taxes, its deferred income tax assets and liabilities and its future taxable income for purposes of assessing its ability to utilize any future tax benefit from its deferred income tax assets.
Although management believes that its tax estimates are reasonable, the ultimate tax determination involves significant judgments that could become subject to audit by tax authorities in the ordinary course of business. As of each reporting date management considers new evidence, both positive and negative, that could impact management's view with regards to future realization of deferred tax assets.
The Company has deferred tax assets of $0.2 million and $0.2 million related to Federal and state net operating losses, respectively, which will expire beginning in 2031 and 2029, respectively. For financial reporting purposes, valuation allowances related to capital loss carryovers and state income tax carryovers are approximately $0.3 million and approximately $0.1 million, respectively, as of both June 30, 2014 and 2013, which will expire beginning in 2017 and 2029, respectively. In prior years, a valuation allowance was established for the deferred tax asset related to the Company's prior Canadian operations. These deferred tax assets totaled $2.1 million at both June 30, 2014 and 2013 and a full valuation allowance was recorded against the deferred tax asset at both dates.
The Company's Vietnam operations are subject to a four-year tax holiday from the time the entity began to generate taxable income through 2015, which provides a preferential tax rate of 15% due to involvement in encouraged investments projects in Vietnam. The Company additionally received a 30% tax incentive during calendar years 2011 and 2012, which was available to companies with less than 300 employees. The Company's Vietnamese operations resulted in taxable income in each of the years ended June 30, 2014, 2013, 2012, and 2011. Due to the Vietnam tax holiday and incentives associated with these operations, no tax expense was recorded in fiscal 2011 or 2010. The dollar effects on the Company's net income resulting from the Vietnam tax holiday and incentives for the fiscal years ended June 30, 2014, 2013 and 2012 were $0.1 million, $0.1 million and $0.1 million, respectively. The effects on basic and diluted earnings per share for the fiscal years ended June 30, 2014, 2013 and 2012 were $0.01, $0.01 and $0.01, respectively.
During fiscal 2013, the Company recognized a $2.1 million income tax benefit for a worthless stock and bad debt deduction with respect to its investments and advances to its 100% owned Canadian subsidiary, Sparton of Canada, Ltd. Sparton of Canada, Ltd. is the legal entity that held the Company's Canadian operations until these operations were ceased during fiscal 2009.
The Company had successor tax liability with respect to the Onyx shares acquired during fiscal 2013. The Company identified approximately $0.1 million, net of federal benefit, of uncertain tax positions for certain state income tax liabilities related to periods prior to the business combination. At acquisition, management made the determination that it was more likely than not that the full benefit of tax positions would not be sustained on examination and accordingly, established a liability for unrecognized tax benefits of $0.2 million as of June 30, 2013. During fiscal 2014, the Company settled certain of these uncertain tax positions with taxing authorities and changed its assessment regarding the determination that it is more-likely-than-not that the remaining tax position will be sustained upon examination.
The following presents a roll forward of the Company's liability for unrecognized tax benefits (in thousands):
For the year ended June 30, | |||||||||||
2014 | 2013 | 2012 | |||||||||
Balance, beginning of period | $ | 159 | $ | — | $ | — | |||||
Acquired tax positions | — | 159 | — | ||||||||
Reductions due to settlements and payments | (30 | ) | — | — | |||||||
Reductions related to prior-year tax positions | (129 | ) | — | — | |||||||
Balance, end of period | $ | — | $ | 159 | $ | — | |||||
The Company's income tax returns are subject to audit by federal, state, and local governments, generally up to three to four years after the returns are filed. These returns could be subject to material adjustments or differing interpretations of the
F-25
tax laws. The Company has not been notified by any major federal, state or local government that it will be subject to examination and open years include fiscal years 2008 through 2014.
(10) Employee Retirement Benefit Plans
Defined Benefit Pension Plan
As of June 30, 2014, 363 employees and retirees of the Company were covered by a defined benefit pension plan. Effective April 1, 2009, participation and the accrual of benefits in this pension plan were frozen, at which time all participants became fully vested and all remaining prior service costs were recognized. The components of net periodic pension expense for the years ended June 30, 2014, 2013 and 2012 were as follows (in thousands):
For the year ended June 30, | |||||||||||
2014 | 2013 | 2012 | |||||||||
Service cost | $ | — | $ | — | $ | — | |||||
Interest cost | 355 | 343 | 417 | ||||||||
Expected return on plan assets | (524 | ) | (514 | ) | (560 | ) | |||||
Amortization of prior service cost | — | — | — | ||||||||
Amortization of unrecognized net actuarial loss | 128 | 183 | 43 | ||||||||
Net periodic benefit (income) cost | (41 | ) | 12 | (100 | ) | ||||||
Pro rata recognition of lump-sum settlements | 85 | — | — | ||||||||
Total periodic pension (income) expense | $ | 44 | $ | 12 | $ | (100 | ) | ||||
The weighted average assumptions used to determine benefit obligations and net periodic benefit cost for fiscal 2014, 2013 and 2012 were as follows:
Benefit Obligation | Benefit Cost | ||||||||||||||||
2014 | 2013 | 2012 | 2014 | 2013 | 2012 | ||||||||||||
Discount rate (1) | 4.35 | % | 4.75 | % | 4.25 | % | 4.75 | % | 4.25 | % | 5.50 | % | |||||
Rate of compensation increase (2) | — | % | — | % | — | % | — | % | — | % | — | % | |||||
Expected long-term rate on plan assets (3) | 7.50 | % | 7.50 | % | 7.50 | % | 7.50 | % | 7.50 | % | 7.50 | % | |||||
(1) | The Company determines its assumption for the discount rate on an index of high-quality corporate bond yields and matching-funding yield curve analysis. |
(2) | The rate of compensation increase for calculation of the benefit obligation is 0.0% due the freezing of the plan as of April 1, 2009. |
(3) | The expected long-term rate of return for plan assets is based on analysis of historical data and future expectations relevant to the investments and consistency with the assumed rate of inflation implicit in the market. |
F-26
At June 30, 2014 and 2013, as a result of the fiscal 2009 plan curtailment, the accumulated benefit obligation is equal to the projected benefit obligation. The following tables summarize the changes in benefit obligations, plan assets and funded status of the plan at June 30, 2014 and 2013 (in thousands):
June 30, 2014 | June 30, 2013 | ||||||
Change in prepaid benefit cost: | |||||||
Prepaid benefit cost at beginning of fiscal year | $ | 1,543 | $ | 1,372 | |||
Net periodic benefit income (cost) for fiscal year | 41 | (12 | ) | ||||
Employer contributions to plan | 59 | 183 | |||||
Prepaid benefit cost at end of fiscal year | $ | 1,643 | $ | 1,543 | |||
Change in projected benefit obligation: | |||||||
Projected benefit obligation at beginning of fiscal year | $ | 8,166 | $ | 8,827 | |||
Service cost | — | — | |||||
Interest cost | 355 | 343 | |||||
Actuarial experience and changes in assumptions | 389 | (320 | ) | ||||
Benefits paid | (803 | ) | (684 | ) | |||
Projected benefit obligation at end of fiscal year | $ | 8,107 | $ | 8,166 | |||
Change in plan assets: | |||||||
Fair value of plan assets at beginning of fiscal year | $ | 7,748 | $ | 7,514 | |||
Employer contributions | 59 | 183 | |||||
Actual return on plan assets | 1,147 | 735 | |||||
Benefits paid | (803 | ) | (684 | ) | |||
Fair value of plan assets at end of fiscal year | $ | 8,151 | $ | 7,748 | |||
Amounts recognized in the Consolidated Balance Sheets: | |||||||
Pension asset | $ | 44 | $ | — | |||
Current portion of pension liability | — | (144 | ) | ||||
Pension liability — non-current portion | — | (274 | ) | ||||
Funded status — total balance sheet asset (liability) | $ | 44 | $ | (418 | ) | ||
The Company’s policy is to fund the plan based upon legal requirements and tax regulations. For fiscal 2015, based upon current actuarial calculations and assumptions, no cash contributions are anticipated. Anticipated contributions, if any, are reflected as a current portion of the pension liability. During the years ended June 30, 2014, 2013 and 2012, approximately $0.1 million, $0.2 million and $0.3 million, respectively, was contributed to the pension plan.
Pension related amounts recognized in other comprehensive income (loss), excluding tax effects, for the years ended June 30, 2014, 2013 and 2012 are as follows (in thousands):
For the year ended June 30, | |||||||||||
2014 | 2013 | 2012 | |||||||||
Amortization of prior service cost | $ | — | $ | — | $ | — | |||||
Amortization of unrecognized net actuarial loss | 128 | 183 | 43 | ||||||||
Pro rata recognition of lump-sum settlements | 85 | — | — | ||||||||
Net actuarial gain (loss) | 234 | 541 | (1,408 | ) | |||||||
Total recognized in other comprehensive income (loss) | $ | 447 | $ | 724 | $ | (1,365 | ) | ||||
F-27
The amounts in accumulated other comprehensive loss on the consolidated balance sheets, excluding tax effects, that have not yet been recognized as components of net periodic benefit cost at June 30, 2014 and 2013 are as follows (in thousands):
June 30, 2014 | June 30, 2013 | ||||||
Accumulated other comprehensive loss: | |||||||
Net actuarial loss | $ | 1,513 | $ | 1,961 | |||
Net prior service cost | — | — | |||||
Total | $ | 1,513 | $ | 1,961 | |||
The estimated amount that will be amortized from accumulated other comprehensive loss, pre-tax, into net periodic pension cost in fiscal 2015 is expected to total approximately $0.1 million, consisting of amortization of unrecognized actuarial loss as well as lump sum settlement charges.
Expected benefit payments for the defined benefit pension plan for the next ten fiscal years are as follows (in thousands):
Fiscal Year Ended June 30, | |||
2015 | $ | 947 | |
2016 | 808 | ||
2017 | 643 | ||
2018 | 605 | ||
2019 | 520 | ||
2019 – 2022 | 2,358 | ||
Total | $ | 5,881 | |
The Company’s investment policy related to pension plan assets is based on a review of the actuarial and funding characteristics of the plan. Capital market risk and return opportunities are also considered. The investment policy’s primary objective is to achieve a long-term rate of return consistent with the actuarially determined requirements of the plan, as well as maintaining an asset level sufficient to meet the plan’s benefit obligations. A target allocation range between asset categories has been established to enable flexibility in investment, allowing for a better alignment between the long-term nature of pension plan liabilities, invested assets, and current and anticipated market returns on those assets.
Below is a summary of pension plan asset allocations as of June 30, 2014 and 2013, by asset category:
Weighted Average Allocation For the Year Ended June 30, | |||||||
Target | 2014 | 2013 | |||||
Equity securities | 40%-70% | 61 | % | 56 | % | ||
Fixed income (debt) securities | 30%-60% | 37 | % | 43 | % | ||
Cash and cash equivalents | 0%-10% | 2 | % | 1 | % | ||
100 | % | 100 | % | ||||
F-28
The fair value of all the defined benefit pension plan assets is based on quoted prices in active markets for identical assets which are considered Level 1 inputs within the fair value hierarchy described in Note 2. The total estimated fair value of plan assets by asset class at June 30, 2014 and 2013 were as follows (in thousands):
June 30, 2014 | June 30, 2013 | ||||||
Asset Class: | |||||||
Equity securities: | |||||||
Directly held corporate stock — Large Cap | $ | 2,152 | $ | 2,477 | |||
Registered investment companies — Large Cap | 1,336 | 192 | |||||
Registered investment companies — Mid-Cap Growth | 343 | 278 | |||||
Registered investment companies — Small-Cap | 318 | 402 | |||||
Registered investment companies — International | 873 | 995 | |||||
Fixed income (debt) securities: | |||||||
Registered investment companies — Intermediate Bond | 2,990 | 3,291 | |||||
Cash and cash equivalents | 139 | 113 | |||||
Total assets measured at fair value | $ | 8,151 | $ | 7,748 | |||
Defined Contribution Plans
Substantially all of the Company’s U.S. employees are eligible to participate in the Company’s 401(k) defined contribution plan. The plan allows employees to contribute up to 100% of their eligible compensation up to a maximum amount allowed by law and provides that the Company may, at its discretion, make matching contributions, profit sharing contributions or qualified non-elective contributions. During each of the years ended June 30, 2014, 2013 and 2012, the Company matched 50% of participants’ contributions up to 6% of their eligible compensation.
Under the plan, at the election of the participant, both employee and employer contributions may be invested in any of the available investment options, which include Sparton common stock. As of June 30, 2014, approximately 122,000 shares of Sparton common stock were held in the 401(k) plan. Amounts expensed related to the Company’s matching contributions and administrative expenses for the plan were approximately $1.2 million, $0.9 million and $0.7 million for the years ended June 30, 2014, 2013 and 2012, respectively. As of June 30, 2014, plan assets totaled approximately $37.7 million.
(11) Commitments and Contingencies
Operating Leases — The Company is obligated under operating lease agreements for a portion of its production machinery and data processing equipment. Such leases, some of which are non-cancelable and in many cases include purchase or renewal options, expire at various dates and typically provide for monthly payments over a fixed term in equal, non-escalating amounts. Generally, the Company is responsible for maintenance, insurance and taxes relating to these leased assets. The Company is additionally obligated under operating lease agreements for its corporate headquarters in Schaumburg, Illinois, its design center in Plymouth, Minnesota and its manufacturing plants in Frederick, Colorado and Plaistow, New Hampshire. Each of these leases provide for escalating minimum monthly base rental payments, require the Company to provide for maintenance, insurance and property taxes in addition to minimum monthly base rental and include renewal options. At June 30, 2014, the future minimum annual lease payments under these agreements are as follows (in thousands):
June 30, | |||
2015 | $ | 1,251 | |
2016 | 1,200 | ||
2017 | 904 | ||
2018 | 368 | ||
2019 | 281 | ||
Thereafter | 225 | ||
Total | $ | 4,229 | |
F-29
Rent expense was approximately $1.5 million, $1.4 million and $2.1 million for the years ended June 30, 2014, 2013 and 2012, respectively. Included in rent expense for the years ended June 30, 2014, 2013 and 2012 was approximately $0.3 million, $0.2 million and $0.2 million, respectively, of contingent rent expense primarily relating to the Company’s corporate headquarters in Schaumburg, Illinois and its Frederick, Colorado facility.
Environmental Remediation — Sparton has been involved with ongoing environmental remediation since the early 1980’s related to one of its former manufacturing facilities, located in Albuquerque, New Mexico (“Coors Road”). Although the Company entered into a long-term lease of the Coors Road property that was accounted for as a sale of property during fiscal 2010, it remains responsible for the remediation obligations related to its past operation of this facility. During the fourth quarter of fiscal 2014, Sparton completed a review of its remediation plan, which included remediation methods currently in use, desired outcomes, progress to date, anticipated progress over the next sixteen years, and estimated costs to complete the remediation plan by fiscal 2030, following the terms of a March 2000 consent decree. The Company’s minimum cost estimate is based upon existing technology and excludes certain legal costs, which are expensed as incurred. The Company’s estimate includes equipment and operating and maintenance costs for onsite and offsite pump and treat containment systems, as well as continued onsite and offsite monitoring. It also includes periodic reporting requirements. During this latest review, the Company found: additional concentrations of contaminants on-site that required clean-up actions previously not included within the remediation plan; progress to date on the removal of certain other on-site contaminants was taking place slower than previously anticipated; and that certain efficiencies regarding periodic reporting were not being realized as had been previously anticipated. The discovery of additional on-site contaminants, slower than expected removal rates of other on-site contaminants, and continued high periodic reporting costs added significant additional costs to the remediation project that are expected to continue for a number of years. As a result, the remaining estimated minimum future undiscounted costs of this financial liability increased to $8.2 million at June 30, 2014, thereby requiring a $4.2 million non-cash charge against operations in the fourth quarter of fiscal 2014. This charge is net of United States Department of Energy (“DOE”) reimbursements of $1.5 million expected to take place in future years, under the fiscal 2003 agreement between the Company and the DOE, as further explained below. Of the $8.2 million financial liability, $0.6 million is classified as a current liability and included on the balance sheet in other accrued expenses.
In fiscal 2003, Sparton reached an agreement with the United States Department of Energy (“DOE”) and others to recover certain remediation costs. Under the settlement terms, Sparton received cash and obtained some degree of risk protection as the DOE agreed to reimburse Sparton for 37.5% of certain future environmental expenses in excess of $8.4 million incurred from the date of settlement, of which approximately $5.3 million has been expended as of June 30, 2014 toward the $8.4 million threshold. It is expected that the DOE reimbursements will commence in the years after fiscal 2020. At June 30, 2014, the Company recognized a $1.5 million long-term asset in relation to these expected reimbursements. The $1.5 million DOE receivable is included in other non-current assets on the balance sheet. Uncertainties associated with environmental remediation contingencies are pervasive and often result in wide ranges of reasonably possible outcomes. Estimates developed in the early stages of remediation can vary significantly. Normally a finite estimate of cost does not become fixed and determinable at a specific point in time. Rather, the costs associated with environmental remediation become estimable over a continuum of events and activities that help to frame and define a liability. Factors which cause uncertainties for the Company include, but are not limited to, the effectiveness of the current work plans in achieving targeted results and proposals of regulatory agencies for desired methods and outcomes. It is possible that cash flows and results of operations could be materially affected by the impact of changes associated with the ultimate resolution of this contingency. At June 30, 2014, the Company estimates that it is reasonably possible, but not probable, that future environmental remediation costs associated with the Company’s past operations at the Coors Road property, in excess of amounts already recorded, could be up to $3.1 million before income taxes over the next sixteen years, with such amount expected to be offset by related reimbursement from the DOE of $1.0 million.
The Company and its subsidiaries are also involved in certain existing compliance issues with the EPA and various state agencies, including being named as a potentially responsible party at several sites. Potentially responsible parties (“PRP“s) can be held jointly and severally liable for the clean-up costs at any specific site. The Company’s past experience, however, has indicated that when it has contributed relatively small amounts of materials or waste to a specific site relative to other PRPs, its ultimate share of any clean-up costs has been minor. Based upon available information, the Company believes it has contributed only small amounts to those sites in which it is currently viewed as a PRP and that reasonably possible losses related to these compliance issues are immaterial.
U.S. Government Audits — Federal government agencies, including the Defense Contract Audit Agency (“DCAA”) and the Defense Contract Management Agency (“DCMA”), routinely audit and evaluate government contracts and government contractors’ administrative processes and systems. These agencies review the Company’s performance on contracts, pricing practices, cost structure, financial capability and compliance with applicable laws, regulations and standards. They also review the adequacy of the Company’s internal control systems and policies, including the Company’s purchasing, accounting, estimating, compensation and management information processes and systems.
F-30
DCAA has completed its most recent review of the Company's two Cost Accounting Standards Disclosure Statements for the Company and DSS. Corrective actions relating to this review have been implemented and during the fourth quarter of fiscal 2014, the Company received an adequate determination for both Disclosure Statements from DCMA.
Other — In addition to the foregoing, from time to time, the Company is involved in various legal proceedings relating to claims arising in the ordinary course of business. The Company is not currently a party to any other such legal proceedings, the adverse outcome of which, individually or in the aggregate, is expected to have a material adverse effect on our business, financial condition or results of operations.
(12) Stock-Based Compensation
The Company has two long-term incentive plans. The Sparton Corporation Stock Incentive Plan, as amended and restated (the “2001 Plan”) was approved by the Company’s shareholders on October 24, 2001. The Sparton Corporation 2010 Long-Term Incentive Plan (the “2010 Plan”) was approved by the Company’s shareholders on October 28, 2009.
2001 Plan. Under the 2001 Plan, the Company may grant to employees and non-employee directors incentive and non-qualified stock options, stock appreciation rights, restricted stock and other stock-based awards. All of the stock options issued to date under the 2001 Plan have either three, five or ten-year lives with either immediate vesting or vesting on an annual basis over four years beginning one year after grant date. Restricted stock awards granted to date to employees under the 2001 Plan vest annually over periods ranging from approximately 2.5 to 4.0 years, in some cases subject to achievement of certain financial performance metrics in addition to the service requirements. Unrestricted stock awards granted to date under the 2001 Plan represent annual stock grants to directors as a component of their overall compensation. The 2001 Plan’s termination date with respect to the granting of new awards was October 24, 2011. The total number of shares authorized to be granted under the 2001 Plan was 970,161 shares of the Company’s common stock, which equals the number of underlying awards previously made under the 2001 Plan.
2010 Plan. Under the 2010 Plan, the Company may grant to employees, officers and directors of the Company or its subsidiaries incentive and non-qualified stock options, stock appreciation rights, restricted stock or restricted stock units, performance awards and other stock-based awards, including grants of shares. Restricted stock awards granted to date to employees under the 2010 Plan vest annually over four years, subject to achievement of certain financial performance metrics in addition to the service requirements. Unrestricted stock awards granted to date under the 2010 Plan represent annual stock grants to directors as a component of their overall compensation. The 2010 Plan has a term of ten years. The total number of shares that may be awarded under the 2010 Plan is 1,000,000 shares of common stock, of which amount, 499,099 shares remain available for awards as of June 30, 2014.
The Company did not grant any stock options during the years ended June 30, 2014, 2013 or 2012.
The following table shows stock-based compensation expense by type of share-based award for the years ended June 30, 2014, 2013 and 2012 included in the consolidated statements of income (in thousands):
For the year ended June 30, | |||||||||||
2014 | 2013 | 2012 | |||||||||
Fair value expense of stock option awards | $ | — | $ | — | $ | — | |||||
Restricted stock | 1,662 | 1,128 | 943 | ||||||||
Total stock-based compensation | $ | 1,662 | $ | 1,128 | $ | 943 | |||||
The following table shows the total remaining unrecognized compensation cost related to restricted stock grants and the fair value expense of stock option awards, as well as the weighted average remaining required service period over which such costs will be recognized as of June 30, 2014:
Total Remaining Unrecognized Compensation Cost (in thousands) | Weighted Average Remaining Required Service Period (in years) | |||||
Fair value expense of stock option awards | $ | — | — | |||
Restricted stock | 1,368 | 1.88 | ||||
$ | 1,368 | 1.88 | ||||
F-31
The following is a summary of activity for the year-ended June 30, 2014 related to the Company’s stock options granted under its long-term incentive plans:
Number of Options | Weighted- Average Exercise Price | |||||
Options outstanding as of June 30, 2013 | 55,418 | $ | 8.56 | |||
Granted | — | — | ||||
Exercised | (16,875 | ) | 8.54 | |||
Forfeited | — | — | ||||
Expired | — | — | ||||
Options outstanding and exercisable as of June 30, 2014 | 38,543 | $ | 8.57 | |||
Stock options outstanding at June 30, 2014 all have an exercise price of $8.57. The aggregate intrinsic value and weighted average remaining contractual life of options outstanding at June 30, 2014 is approximately $0.7 million and 0.83 years, respectively. In general, the Company’s policy is to issue new shares upon exercise of stock options. The intrinsic value of options exercised during the years ended June 30, 2014, 2013 and 2012 was $0.3 million, $0.2 million and $0.4 million, respectively.
The following is a summary of activity for the year-ended June 30, 2014 related to shares granted under the Company’s long-term incentive plans:
Shares | Weighted Average Grant Date Fair Value | |||||
Restricted shares at June 30, 2013 | 311,253 | $ | 8.34 | |||
Granted | 96,664 | 21.99 | ||||
Vested | (87,576 | ) | 8.54 | |||
Forfeited | (3,344 | ) | 14.39 | |||
Restricted shares at June 30, 2014 | 316,997 | $ | 12.38 | |||
The total fair value of restricted stock vested in the years ended June 30, 2014, 2013 and 2012 was $1.6 million, $1.0 million and $0.7 million, respectively.
(13) Earnings Per Share Data
Earnings per share calculations, including weighted average number of shares of common stock outstanding used in calculating basic and diluted income per share, for the years ended June 30, 2014, 2013 and 2012 are as follows:
For the year ended June 30, | |||||||||||
2014 | 2013 | 2012 | |||||||||
Net income (in thousands) | $ | 12,987 | $ | 13,470 | $ | 9,847 | |||||
Weighted average shares outstanding — Basic | 10,109,915 | 10,193,530 | 10,174,176 | ||||||||
Net effect of dilutive stock options | 31,480 | 35,157 | 34,634 | ||||||||
Weighted average shares outstanding — Diluted | 10,141,395 | 10,228,687 | 10,208,810 | ||||||||
Net income per share: | |||||||||||
Basic | $ | 1.28 | $ | 1.32 | $ | 0.97 | |||||
Diluted | $ | 1.28 | $ | 1.32 | $ | 0.96 | |||||
For the years ended June 30, 2014, 2013 and 2012, 316,997, 311,253 and 305,850, respectively, unvested restricted shares were included in determining both basic and diluted earnings per share. There were no potential shares of common stock issuable upon exercise of stock options excluded from diluted income per share computations because none would be anti-dilutive for the years ended June 30, 2014, 2013 and 2012.
F-32
(14) Stock Repurchase Plan
On May 1, 2013, the Company’s Board of Directors approved a repurchase by the Company of up to $3.0 million of shares of its common stock over a 12-month period. The Company has been authorized to purchase shares from time to time in open market, block transactions and privately negotiated transactions at prices deemed appropriate by management, depending on market conditions, applicable laws and other factors. The stock repurchase program does not require the Company to repurchase any specific number of shares and can be modified, extended or terminated by the Board of Directors at any time.
Pursuant to this stock repurchase program, during the three months ended September 30, 2013, the Company purchased 47,119 shares of its common stock at an average price of $18.51 per share for approximately $0.9 million. Previously, during the year ended June 30, 2013, the Company purchased 128,158 shares of its common stock at an average price of $16.55 per share for approximately $2.1 million. Total shares purchased pursuant to this stock repurchase program total 175,277 at an average price of $17.08. Shares purchased under the plan were cancelled upon repurchase. As of June 30, 2014, all authorized funds under the stock repurchase program have been expended.
(15) Restructuring Activities
Creonix Acquisition Related Restructuring
In conjunction with the fiscal 2013 Creonix acquisition, the Company consolidated the Creonix operations into the Company’s Brooksville, Florida facility. These integration activities consisted primarily of approximately $0.2 million of workforce severance and retention costs, less than $0.1 million of production transfer costs and less than $0.1 million of facility closing costs. Inception to date restructuring charges recognized within the Complex Systems segment of approximately $0.2 million were incurred as of September 30, 2013 related to these acquisition related restructuring activities. The Company does not expect to recognize any additional costs related to these restructuring activities. All cash expenditures related to these activities have been made as of June 30, 2014.
Summary of Restructuring Charges
The table below summarizes the nature and amount of all restructuring actions for the year ended June 30, 2014 (in thousands):
Workforce Reduction (principally severance and retention bonuses) | Production Transfer | Facility Closing | Total | ||||||||||||
Accrual balance at June 30, 2013 | 44 | — | — | 44 | |||||||||||
Restructuring charges | 111 | 68 | 9 | 188 | |||||||||||
Less: cash payments | (155 | ) | (68 | ) | (9 | ) | (232 | ) | |||||||
Restructuring reversals | — | — | — | — | |||||||||||
Accrual balance at June 30, 2014 | $ | — | $ | — | $ | — | $ | — | |||||||
(16) Business Segments
The Company is a provider of complex and sophisticated electromechanical devices with capabilities that include concept development, design and manufacturing engineering, production, distribution, and field service. Reportable segments are defined as components of an enterprise about which separate financial information is available that is evaluated regularly by the chief operating decision maker, or group, in assessing performance and allocating resources. The Company serves the Medical & Biotechnology, Military & Aerospace and Industrial & Commercial markets through three reportable business segments; Medical Device (“Medical”), Complex Systems (“CS”) and Defense & Security Systems (“DSS”).
The Company uses an internal management reporting system, which provides important financial data to evaluate performance and allocate the Company's resources on a segment basis. Net sales are attributed to the segment in which the product is manufactured or service is performed. A segment's performance is evaluated based upon its operating income (loss). A segment's operating income (loss) includes its gross profit on sales less its selling and administrative expenses, including allocations of certain corporate operating expenses. Certain corporate operating expenses are allocated to segment results based on the nature of the service provided. Other corporate operating expenses, including certain administrative, financial and
F-33
human resource activities as well as items such as interest expense, interest income, other income (expense) and income tax expense (benefit), are not allocated to operations and are excluded from segment profit. These costs are not allocated to the segments, as management excludes such costs when assessing the performance of the segments. Inter-segment transactions are generally accounted for at amounts that approximate arm's length transactions. Identifiable assets by segments are those assets that are used in each segment's operations. The accounting policies for each of the segments are the same as for the Company taken as a whole.
Medical segment operations are comprised of contract design, manufacturing, and aftermarket repair and refurbishment of sophisticated medical and biotechnology devices and sub-assemblies. Customers include industry leaders, emerging technologies companies and start-ups. In manufacturing devices for its customers, this business unit follows specific design and manufacturing processes to assure product reliability and safety in accordance with Food and Drug Administration (“FDA”) guidelines and approvals. This group specializes in technologies, systems and processes required by medical OEM and ET customers primarily in the diagnostic, therapeutic, surgical and laboratory device segments of the medical and biotechnology marketplaces. The Medical segment also includes some non-medical customers.
Complex Systems segment operations are comprised of manufacturing and aftermarket repair and refurbishment of sophisticated printed circuit card assemblies, sub-assemblies, full product assemblies, and cable/wire harnesses. Customers include military and aerospace, as well as industrial and commercial OEM's. In manufacturing for its customers, this segment adheres to very strict military and aerospace specifications in addition to product and process certifications. Customers are primarily engaged in applications that include: flight controls, industrial and military control systems, cockpit displays, fuel system controls, secure communications, early warning detection, security systems, satellite communications, and audio. The CS segment also includes some medical customers.
Defense & Security Systems segment operations are comprised of design, development and production of products for both domestic and foreign defense as well as commercial needs. Sparton designs and manufactures anti-submarine warfare ("ASW") devices known as sonobuoys for the U.S. Navy and foreign governments that meet Department of State licensing requirements. This segment also performs an engineering development function for the United States military and prime defense contractors for advanced technologies ultimately leading to future defense products as well as replacements for existing products. The sonobuoy product line is built to stringent military specifications. These products are restricted by International Tariff and Arms Regulations (“ITAR”) and qualified by the U.S. Navy, which limits opportunities for competition. Sparton is also a provider of ruggedized flat panel display systems for military panel PC workstations, air traffic control and industrial applications. Ruggedized displays are manufactured for prime contractors to specific military grade specifications. Additionally, this business unit internally develops and markets commercial products for underwater acoustics and microelectromechanical (“MEMS”)-based inertial measurement.
F-34
Operating results and certain other financial information about the Company’s three reportable segments for the years ended June 30, 2014, 2013 and 2012 and as of June 30, 2014 and June 30, 2013 were as follows (in thousands):
For the year ended June 30, 2014 | |||||||||||||||||||||||
Medical | CS | DSS | Corporate and Other Unallocated | Eliminations | Total | ||||||||||||||||||
Sales (a) | $ | 162,648 | $ | 83,119 | $ | 109,134 | $ | — | $ | (18,762 | ) | $ | 336,139 | ||||||||||
Gross profit | 25,190 | 9,230 | 30,033 | — | — | 64,453 | |||||||||||||||||
Operating income (loss) | 12,561 | 4,106 | 19,943 | (16,721 | ) | — | 19,889 | ||||||||||||||||
Selling and administrative expenses | 10,499 | 3,950 | 8,750 | 12,499 | — | 35,698 | |||||||||||||||||
Internal research and development expenses | — | — | 1,169 | — | — | 1,169 | |||||||||||||||||
Restructuring charges | — | 188 | — | — | — | 188 | |||||||||||||||||
Depreciation/amortization | 4,820 | 1,756 | 1,149 | 398 | — | 8,123 | |||||||||||||||||
Capital expenditures | 872 | 540 | 1,090 | 999 | — | 3,501 | |||||||||||||||||
For the year ended June 30, 2013 | |||||||||||||||||||||||
Medical | CS | DSS | Corporate and Other Unallocated | Eliminations | Total | ||||||||||||||||||
Sales (a) | $ | 146,873 | $ | 60,649 | $ | 75,430 | $ | — | $ | (18,325 | ) | $ | 264,627 | ||||||||||
Gross profit | 21,287 | 6,388 | 17,760 | — | — | 45,435 | |||||||||||||||||
Operating income (loss) | 11,602 | 3,553 | 11,525 | (10,639 | ) | — | 16,041 | ||||||||||||||||
Selling and administrative expenses | 8,114 | 2,776 | 4,935 | 10,626 | — | 26,451 | |||||||||||||||||
Internal research and development expenses | — | — | 1,300 | — | — | 1,300 | |||||||||||||||||
Restructuring charges | — | 55 | — | — | — | 55 | |||||||||||||||||
Depreciation/amortization | 3,258 | 645 | 626 | 232 | — | 4,761 | |||||||||||||||||
Capital expenditures | 1,369 | 1,197 | 996 | 310 | — | 3,872 | |||||||||||||||||
For the year ended June 30, 2012 | |||||||||||||||||||||||
Medical | CS | DSS | Corporate and Other Unallocated | Eliminations | Total | ||||||||||||||||||
Sales (a) | $ | 110,894 | $ | 53,609 | $ | 76,980 | $ | — | $ | (15,028 | ) | $ | 226,455 | ||||||||||
Gross profit | 15,242 | 5,762 | 18,028 | — | — | 39,032 | |||||||||||||||||
Operating income (loss) | 8,685 | 2,985 | 12,945 | (9,540 | ) | — | 15,075 | ||||||||||||||||
Selling and administrative expenses | 6,152 | 2,777 | 3,790 | 9,513 | — | 22,232 | |||||||||||||||||
Internal research and development expenses | — | — | 1,293 | — | — | 1,293 | |||||||||||||||||
Restructuring charges | (30 | ) | — | — | (38 | ) | — | (68 | ) | ||||||||||||||
Depreciation/amortization | 704 | 565 | 461 | 84 | — | 1,814 | |||||||||||||||||
Capital expenditures | 288 | 947 | 1,318 | 1,691 | — | 4,244 | |||||||||||||||||
As of June 30, 2014 | |||||||||||||||||||||||
Medical | CS | DSS | Corporate and Other Unallocated | Eliminations | Total | ||||||||||||||||||
Total assets | $ | 91,348 | $ | 53,643 | $ | 35,033 | $ | 18,956 | $ | — | $ | 198,980 | |||||||||||
F-35
As of June 30, 2013 | |||||||||||||||||||||||
Medical | CS | DSS | Corporate and Other Unallocated | Eliminations | Total | ||||||||||||||||||
Total assets | $ | 95,776 | $ | 36,039 | $ | 16,952 | $ | 17,155 | $ | — | $ | 165,922 | |||||||||||
(a) | Intercompany sales primarily represent CS production of circuit boards that are then utilized in DSS product sales. These intercompany sales are eliminated in consolidation. |
(17) Business, Geographic and Sales Concentration
Sales to individual customers in excess of 10% of total net sales for the years ended June 30, 2014, 2013 and 2012 were as follows:
For the year ended June 30, | ||||||||
2014 | 2013 | 2012 | ||||||
U.S. Navy (a) | 19 | % | 20 | % | 21 | % | ||
Fenwal Blood Technologies (b) | 14 | % | 20 | % | 15 | % | ||
Siemens Diagnostics (c) | * | * | 11 | % | ||||
(*)Denotes sales were below 10% of total.
(a) | Sales to the United States Navy, including those made through the Company’s ERAPSCO joint venture, are included in the results of the Company’s DSS segment. |
(b)Sales to Fenwal Blood Technologies are included in the results of the Company’s Medical segment.
(c)Sales to Siemens Diagnostics are included in the results of the Company’s Medical segment.
Net sales were made to customers located in the following countries (in thousands):
For the year ended June 30, | |||||||||||
2014 | 2013 | 2012 | |||||||||
United States | $ | 295,966 | $ | 234,855 | $ | 182,534 | |||||
Other foreign countries (a) | 40,173 | 29,772 | 43,921 | ||||||||
Consolidated total | $ | 336,139 | $ | 264,627 | $ | 226,455 | |||||
(a) | No other single country or currency zone accounted for 10% or more of export sales in the fiscal years ended June 30, 2014, 2013, or 2012. |
ASW devices and related engineering contract services to the U.S. government and foreign countries contributed approximately $92.8 million (28%), $73.8 million (28%) and $76.3 million (34%), respectively, to total net sales for the fiscal years ended June 30, 2014, 2013 and 2012.
The Company’s investment in property, plant and equipment, which are located in the United States and Vietnam, are summarized, net of accumulated depreciation, as follows (in thousands):
As of June 30, 2014 | As of June 30, 2013 | ||||||
United States | $ | 26,092 | $ | 26,331 | |||
Vietnam | 2,431 | 2,573 | |||||
Consolidated total | $ | 28,523 | $ | 28,904 | |||
F-36
(18) Quarterly Results of Operations (Unaudited) (In thousands, except per share amounts):
Quarter | |||||||||||||||
1st | 2nd | 3rd | 4th | ||||||||||||
Year ended June 30, 2014 | |||||||||||||||
Net sales | $ | 74,198 | $ | 84,562 | $ | 83,931 | $ | 93,448 | |||||||
Gross profit | 12,194 | 14,977 | 16,426 | 20,856 | |||||||||||
Net income | 2,286 | 3,484 | 4,246 | 2,971 | |||||||||||
Income per share - Basic | 0.23 | 0.34 | 0.42 | 0.29 | |||||||||||
Income per share - Diluted | 0.23 | 0.34 | 0.42 | 0.29 | |||||||||||
Year ended June 30, 2013 | |||||||||||||||
Net sales | $ | 50,801 | $ | 67,254 | $ | 65,148 | $ | 81,424 | |||||||
Gross profit | 8,000 | 12,095 | 10,125 | 15,215 | |||||||||||
Net income | 1,457 | 4,841 | 1,536 | 5,636 | |||||||||||
Income per share - Basic | 0.14 | 0.47 | 0.15 | 0.55 | |||||||||||
Income per share - Diluted | 0.14 | 0.47 | 0.15 | 0.55 | |||||||||||
(19) Subsequent Event
On July 9, 2014, the Company completed the acquisition of Electronic Manufacturing Technology, LLC. (“eMT”). The purchase price of $18.5 million is subject to a final working capital adjustment and was financed through the use of borrowings under the Company's Credit Facility. The acquired business, which will be part of the Company's Complex Systems segment and which is expected to add $25 million (unaudited) in projected annualized revenue, is engaged in the contract services business of manufacturing electromechanical controls and electronic assemblies. Their customer profile includes international Fortune 1000 manufacturers of highly reliable industrial excimer laser products, laser eye surgery sub-assemblies, target simulators for space and aviation systems, power modules for computerized tomography products, test systems for commercial aerospace OEMs, and toll road antennas and control boxes.
The initial accounting for the acquisition is not complete pending detailed analyses of the facts and circumstances that existed as of the acquisition date.
F-37
SCHEDULE II — VALUATION AND QUALIFYING ACCOUNTS
(In thousands)
Years Ended June 30,
Balance at Beginning of Period | Additions Charged to Costs and Expenses | Allowance for Losses Acquired | Write-Offs/ Dispositions | Balance at End of Period | |||||||||||||||
2014 | |||||||||||||||||||
Allowance for losses on accounts receivable | $ | 61 | $ | 87 | $ | 57 | $ | (79 | ) | $ | 126 | ||||||||
2013 | |||||||||||||||||||
Allowance for losses on accounts receivable | $ | 146 | $ | 128 | $ | 54 | $ | (267 | ) | $ | 61 | ||||||||
2012 | |||||||||||||||||||
Allowance for losses on accounts receivable | $ | 65 | $ | 91 | $ | — | $ | (10 | ) | $ | 146 | ||||||||
F-38
INDEX TO EXHIBITS
Exhibit Number | Description |
3.1 | Second Amended Articles of Incorporation of the Registrant, incorporated herein by reference from the Registrant’s Proxy Statement on Form DEF 14A filed with the SEC on September 21, 2010. |
3.2 | Amended and Restated Code of Regulations of the Registrant, incorporated herein by reference from the Registrant’s Proxy Statement on Form DEF 14A filed with the SEC on September 21, 2010. |
3.3 | Amendment to Amended and Restated Code of Regulations of the Registrant, incorporated by reference from Exhibit 99.1 to the Registrant's Current Report on Form 8-K filed with the SEC on October 26, 2012. |
10.1 | Credit and Guaranty Agreement dated November 15, 2012, entered into between B.M.O. Harris Bank, N.A., and the Borrowers, incorporated by reference from Exhibit 10.1 to the Registrant’s Current Report on Form 8-K filed with the SEC on November 19, 2012. |
10.2 | Consent and Amendment No. 1 to Credit and Guaranty Agreement dated August 30, 2013 among the Company, its subsidiaries and B.M.O. Harris Bank, N.A. and the Borrowers, incorporated by reference from Exhibit 10.2 to the Registrant's Annual Report on Form 10-K filed with the SEC on September 3, 2013. |
10.3 | Consent and Amendment No. 2 to Credit and Guaranty Agreement dated July 9, 2014 among the Company, its subsidiaries and B.M.O. Harris Bank, N.A. and the Borrowers, incorporated by reference from Exhibit 10.1 to the Registrant's Current Report on Form 10-K filed with the SEC on July 11, 2014. |
10.4† | Sparton Short-Term Incentive Plan, incorporated by reference from Exhibit 10.1 to the Registrant’s Current Report on Form 8-K filed with the SEC on July 1, 2009. |
10.5† | 2010 Long-Term Stock Option Incentive Plan, incorporated by reference from Exhibit 10.1 to the Registrant’s Current Report on Form 8-K filed with the SEC on September 11, 2009. |
10.6† | Amendment to the Sparton Corporation 2010 Long-Term Incentive Plan dated June 24, 2010, incorporated by reference from Exhibit 10.21 to the Registrant’s Annual Report on Form 10-K filed with the SEC on September 7, 2011. |
10.7*† | Second Amendment to the Sparton Corporation 2010 Long-Term Incentive Plan dated June 24, 2010. |
10.8† | Form of Grant of Restricted Stock under Sparton Corporation’s Long-Term Incentive Plan, incorporated by reference from Exhibit 10.9 to the Registrant's Annual Report on Form 10-K filed with the SEC on September 5, 2012. |
10.9† | Employment Agreement dated June 30, 2014, by and between the Company and Cary B. Wood, incorporated by reference from Exhibit 10.1 to the Registrant’s Current Report on Form 8-K filed with the SEC on July 1, 2014. |
10.10† | Employment Agreement dated November 6, 2012 by and between the Company and Mark Schlei, incorporated by reference from Exhibit 10.1 to the Registrant’s Current Report on Form 8-K filed with the SEC on November 13, 2012. |
10.11† | Executive Employment Agreement, effective as of January 5, 2009, by and between the Company and Gordon Madlock, incorporated by reference from Exhibit 10.1 to the Registrant’s Current Report on Form 8-K filed with the SEC on January 29, 2009. |
10.12† | First Amendment to Executive Employment Agreement, effective as of September 17, 2012, by and between the Company and Gordon Madlock, incorporated by reference from Exhibit 10.4 to the Registrant’s Current Report on Form 8-K filed with the SEC on September 18, 2012. |
10.13† | Employment Agreement dated January 5, 2009 by and between the Company and Michael Osborne, incorporated by reference from Exhibit 10.20 to the Registrant’s Annual Report on Form 10-K filed with the SEC on September 7, 2011. |
10.14† | First Amendment to Executive Employment Agreement, effective as of September 17, 2012, by and between the Company and Michael Osborne, incorporated by reference from Exhibit 10.3 to the Registrant’s Current Report on Form 8-K filed with the SEC on September 18, 2012. |
Exhibit Number | Description |
10.15† | Employment Agreement dated December 8, 2008 by and between the Company and Steven Korwin, incorporated by reference from Exhibit 10.19 to the Registrant’s Annual Report on Form 10-K filed with the SEC on September 7, 2011. |
10.16† | First Amendment to Executive Employment Agreement, effective as of September 17, 2012, by and between the Company and Steven Korwin, incorporated by reference from Exhibit 10.2 to the Registrant’s Current Report on Form 8-K filed with the SEC on September 18, 2012. |
10.17 | Lease Extension and Amendment Agreement dated May 1, 2010 between Sparton Technology, Inc. and 9621 Coors, L.L.C., guaranteed by Albuquerque Motor Company, Inc., incorporated by reference from Exhibit 10.1 to the Registrant’s Current Report on Form 8-K filed with the SEC on May 6, 2010. |
10.18 | Option Agreement dated May 1, 2010 by and between Sparton Technology, Inc. and 9621 Coors, L.L.C., guaranteed by Albuquerque Motor Company, Inc., incorporated by reference from Exhibit 10.2 to the Registrant’s Current Report on Form 8-K filed with the SEC on May 6, 2010. |
10.19 | Unit Purchase Agreement dated November 2, 2012 between Everett Smith Group, Ltd. and Sparton Onyx, LLC, incorporated by reference from Exhibit 10.1 to the Registrant’s Current Report on Form 8-K filed with the SEC on November 7, 2012. |
10.20*1 | Solicitation, Offer and Award with an effective date of July 16, 2014 issued by the Naval Warfare Center to ERAPSCO. |
10.21*1 | Amendment of Solicitation/Modification of Contract with an effective date of July 28, 2014 issued by the Naval Warfare Center to ERAPSCO. |
10.22*1 | Amendment of Solicitation/Modification of Contract with an effective date of August 25, 2014 issued by the Naval Warfare Center to ERAPSCO. |
10.23*1 | Order for Supplies or Services with an effective date of July 17, 2014 issued by the Naval Warfare Center to ERAPSCO. |
10.24*1 | Amendment of Solicitation/Modification of Contract with an effective date of August 5, 2014 2014 issued by the Naval Warfare Center to ERAPSCO. |
10.25*1 | Subcontract with an effective date of July 17, 2014 between Sparton DeLeon Springs, LLC and ERAPSCO. |
21.1* | Subsidiaries of Sparton Corporation. |
23.1* | Consent of BDO USA, LLP. |
31.1* | Chief Executive Officer certification under Section 302 of the Sarbanes-Oxley Act of 2002. |
31.2* | Chief Financial Officer certification under Section 302 of the Sarbanes-Oxley Act of 2002. |
32.1* | Chief Executive Officer and Chief Financial Officer certification pursuant to 18 U.S.C. Section 1350, as adopted pursuant to Section 906 of the Sarbanes-Oxley Act of 2002. |
101.INS** | XBRL Instance Document. |
101.SCH** | XBRL Taxonomy Extension Schema Document. |
101.CAL** | XBRL Taxonomy Calculation Linkbase Document. |
101.DEF** | XBRL Taxonomy Extension Definition Linkbase Document. |
101.LAB** | XBRL Taxonomy Extension Label Linkbase Document. |
101.PRE** | XBRL Taxonomy Extension Presentation Linkbase Document. |
* Filed herewith.
† Indicates management contract or compensatory arrangement.
** XBRL (Extensible Business Reporting Language) information is deemed not filed or part of a registration statement or
prospectus for purposes of sections 11 or 12 of the Securities Act of 1933, is deemed not filed for purposes of
Section 18 of the Securities Exchange Act of 1934, and otherwise is not subject to liability under these sections.
1 Confidential treatment has been requested with respect to the redacted portions of this exhibit.