Attached files
Table of Contents
UNITED STATES
SECURITIES AND EXCHANGE COMMISSION
Washington, D.C. 20549
FORM 10-K
(Mark One)
| x | ANNUAL REPORT PURSUANT TO SECTION 13 OR 15 OF THE SECURITIES EXCHANGE ACT OF 1934 |
For the fiscal year ended: June 30, 2011
Or
| ¨ | TRANSITION REPORT PURSUANT TO SECTION 13 OR 15 OF THE SECURITIES EXCHANGE ACT OF 1934 |
For the transition period from to
Commission File Numbers 1-1000
Sparton Corporation
(Exact name of registrant as specified in its charter)
| Ohio | 38-1054690 | |
| (State or other jurisdiction of incorporation or organization) |
(I.R.S. Employer Identification No.) |
425 N. Martingale Road, Suite 2050
Schaumburg, Illinois 60173
(Address of principal executive offices)
Registrant’s telephone number, including area code: (847) 762-5800
Securities registered pursuant to Section 12(b) of the Act:
| Title of each class |
Name of each exchange on which registered | |
| Common Stock, par value $1.25 per share | New York Stock Exchange |
Securities registered pursuant to Section 12(g) of the Act:
None
Indicate by check mark if the registrant is a well-known seasoned issuer, as defined in Rule 405 of the Securities Act. Yes ¨ No x
Indicate by check mark if the registrant is not required to file reports pursuant to Section 13 or Section 15(d) of the Act. Yes ¨ No x
Indicate by check mark whether the registrant (1) has filed all reports required to be filed by Section 13 or 15(d) of the Securities Exchange Act of 1934 during the preceding 12 months (or for such shorter period that the registrant was required to file such reports), and (2) has been subject to such filing requirements for the past 90 days. Yes x No ¨
Indicate by check mark whether the registrant has submitted electronically and posted on its corporate website, if any, every Interactive Data File required to be submitted and posted pursuant to Rule 405 of Regulation S-T (§232.405 of this chapter) during the preceding 12 months (or such shorter period that the registrant was required to submit and post such files). Yes ¨ No ¨
Indicate by check mark if disclosure of delinquent filers pursuant to Item 405 of Regulation S-K is not contained herein, and will not be contained, to the best of registrant’s knowledge, in definitive proxy or information statements incorporated by reference in Part III of this Form 10-K or any amendment to this Form 10-K. ¨
Indicate by check mark whether the registrant is a large accelerated filer, an accelerated filer, a non-accelerated filer, or a smaller reporting company. See definitions of “large accelerated filer,” “accelerated filer,” and “smaller reporting company” in Rule 12b-2 of the Exchange Act. (Check one):
| Large accelerated filer ¨ | Accelerated filer x | Non-accelerated filer ¨ | Smaller reporting company ¨ |
Indicate by check mark whether the registrant is a shell company (as defined in Rule 12b-2 of the Act). Yes ¨ No x
The aggregate market value of the voting and non-voting common equity held by non-affiliates computed by reference to the price at which the common equity was last sold (based on the closing price on the New York Stock Exchange) as of December 31, 2010 (the last business day of the registrant’s most recently completed second fiscal quarter) was approximately $77,981,000. For purposes of this computation, affiliates of the registrant include the registrant’s executive officers and directors and their respective affiliates as of December 31, 2010.
Indicate by check mark whether the registrant has filed all documents and reports required to be filed by Section 12, 13 or 15(d) of the Securities Exchange Act of 1934 subsequent to the distribution of securities under a plan confirmed by a court. Yes ¨ No ¨
As of August 31, 2011, there were 10,236,484 shares of common stock, $1.25 par value per share, outstanding.
Documents Incorporated by Reference
Part III incorporates information by reference to the registrant’s definitive proxy statement for its 2011 Annual Meeting of Shareholders to be filed with the Securities and Exchange Commission within 120 days after the end of the fiscal year.
Table of Contents
2
Table of Contents
FORWARD-LOOKING STATEMENTS
This Annual Report on Form 10-K contains statements about future events and expectations that are “forward-looking statements.” We may also make forward-looking statements in our other reports filed with the SEC, in materials delivered to our shareholders and in press releases. These statements relate to future events or our future financial performance and involve known and unknown risks, uncertainties and other factors that may cause our actual results, levels of activity, performance or achievements to be materially different from any future results, levels of activity, performance or achievements expressed or implied by these forward-looking statements. In some cases, you can identify forward-looking statements by terminology such as “may,” “will,” “should,” “expects,” “intends,” “plans,” “anticipates,” “believes,” “estimates,” “predicts,” “potential,” or the negative use of these terms or other comparable terminology that convey the uncertainty of future events or outcomes. Although we believe these forward-looking statements are reasonable, they are based on a number of assumptions concerning future conditions, any or all of which may ultimately prove to be inaccurate. These forward-looking statements are based on management’s views and assumptions at the time originally made, and we undertake no obligation to update these statements whether as a result of new information or future events. There can be no assurance that our expectations, projections or views will materialize, and you should not place undue reliance on these forward-looking statements. Any statement in this report that is not a statement of historical fact may be deemed to be a forward-looking statement and subject to the safe harbor created by the Private Securities Litigation Reform Act of 1995.
3
Table of Contents
| ITEM 1. | BUSINESS |
General
Sparton Corporation and subsidiaries (the “Company” or “Sparton”) has been in continuous existence since 1900. It was last reorganized in 1919 as an Ohio corporation. The Company is a provider of complex and sophisticated electromechanical devices with capabilities that include concept development, industrial design, design and manufacturing engineering, production, distribution, and field service. The Company operates through three reportable business segments; Medical Device (“Medical”), Complex Systems (“CS”), formerly called Electronic Manufacturing Services (“EMS”), and Defense & Security Systems (“DSS”), which serves Defense, Security Systems, Navigation and Exploration markets. The electromechanical device end markets that Sparton, as a whole, serves are in Medical, Military & Aerospace and Industrial & Instrumentation. Effective beginning in fiscal 2010, the Company reports its operating results under these three reportable business segments. Prior to fiscal 2010, all of our operating units were aggregated into one line of business, EMS. Fiscal 2009 information presented herein reflects this change to segment reporting. Financial information by segment is presented in Note 15, Business Segments, of the Notes to Consolidated Financial Statements included in this Annual Report on Form 10-K. All of the Company’s facilities are registered to ISO standards, including 9001 or 13485, with most having additional certifications. The Company’s products and services include products for Original Equipment Manufacturers (“OEM”) and Emerging Technology (“ET”) customers that are microprocessor-based systems that include transducers, printed circuit boards and assemblies, sensors, and electromechanical components, as well as development and design engineering services relating to these product sales. Sparton also develops and manufactures sonobuoys, anti-submarine warfare (“ASW”) devices used by the United States Navy and other free-world countries. Many of the physical and technical attributes in the production of sonobuoys are similar to those required in the production of the Company’s other electrical and electromechanical products and assemblies.
The Company’s website address is www.sparton.com. Information contained on our website is not part of this Annual Report on Form 10-K. Our website provides public access to, among other items, the Annual Report on Form 10-K, Quarterly Reports on Form 10-Q, Quarterly Earnings Releases, News Releases, Governance Guidelines, and the Code of Ethics, as well as various Board of Director committee charters. Upon request, the Company provides, free of charge, copies of its periodic and current reports (e.g., Forms 10-K, 10-Q and 8-K) and amendments to such reports that are filed with the Securities and Exchange Commission (“SEC”), as well as the Board of Director committee charters. Reports are available as soon as reasonably practicable after such reports are filed with or furnished to the SEC, either at the Company’s website, through a link to the SEC’s website or upon request through the Company’s Shareholders Relations Department.
Medical Segment
Medical Device operations, with locations in Ohio and Colorado, are comprised of contract development, design, production and distribution of complex and sophisticated medical related electromechanical devices for customers with specialized needs, specifically in the design and manufacturing process, to assure product reliability and safety in accordance with Food and Drug Administration (“FDA”) guidelines and approvals. This group specializes in systems and procedures targeted to the requirements of medical OEM and ET customers primarily in the In Vitro Diagnostic and Therapeutic Device segments of the Medical Device market space.
Our Medical segment’s objective is to be the preferred contract design and manufacturer of medical devices/instruments for market leading OEM’s as well as emerging technologies. The market is driven by providing the total solution concept, at a competitive price to the customer. Our market advantage is our experience and knowledge of the market, breadth of services that we offer, and the referral relationships which have developed
4
Table of Contents
over the past 20 years. The major corporations on the customer side want to focus their time and energy supporting their major profit areas of consumables and new innovation through research and development. In addition, many companies are outsourcing certain engineering activities finding it costly and inefficient to have full time engineers available for new product development which cycles with new projects every three to five years. This is the niche that has proven to be successful to Sparton Medical.
The contract manufacturing of highly complex medical instrumentation is a fairly young industry with no dominate player in the market. In the past, large Printed Circuit Board contract manufacturers have sold their “box build” capabilities and have been very successful. The industry has continued to grow with more companies developing Printed Circuit Board Assembly (“PCBA”) capabilities and others entering the market via mergers and acquisitions of smaller companies. This has led to stronger competition with larger companies that have the financial resources to offer the services that the customers are requiring. Customers will assume that quality will be 100% and will drive their decisions based on pricing and services offered that best fit their total solutions needs.
The understanding of the medical market needs is critical for our success. We are well positioned with our engineering development, reliability engineering, manufacturing/testing, and service support services to meet our current organic growth plans. Additional growth may be gained through an acquisition strategy employed to expand our market reach and footprint into other geographic areas of the U.S.
On August 6, 2010, the Company completed the acquisition of certain assets related to the contract manufacturing business of Delphi Medical Systems, LLC (“Delphi Medical” or “Delphi”) in an approximate $8.4 million all-cash transaction. The acquired business, which is reported in the Company’s Medical segment, provides a new and diversified customer base and provides Sparton with a geographic presence in the western United States. Delphi Medical primarily manufactures OEM medical devices including blood separation equipment, spinal surgery products and 3-D eye mapping devices. It also provides engineering and manufacturing support to a market-leading environmental sensor company whose markets include meteorology, weather critical operations and controlled environment applications.
On March 4, 2011, the Company completed the acquisition of certain assets and assumption of certain liabilities of Byers Peak, Incorporated (“Byers Peak”) in an approximate $4.1 million all-cash transaction. The acquired business, which is reported in the Company’s Medical segment, provides further expansion into the therapeutic device market, diversifies Sparton’s customer base, and further expands the Company’s geographic reach into the western United States. Additionally, the acquisition increases Sparton’s offerings with the inclusion of field service and refurbishment capabilities. Byers Peak primarily manufactures medical devices for OEM and emerging technology companies in the Therapeutic device market, including devices for surgical navigation, RF energy generation, arterial disease, and kidney dialysis. It also has a field service and installation group that primarily provides water filtration and disinfection systems for the medical industry as well as device refurbishment programs. Additionally, Byers Peak provides electromechanical device manufacturing support for a limited number of customers outside of the medical industry.
Medical sales to Siemens Diagnostics accounted for 18%, 21% and 17% of consolidated revenue for the fiscal years ended June 30, 2011, 2010 and 2009, respectively. Fenwal Blood Technologies, which became a customer with the Delphi acquisition, contributed 12% of consolidated revenue during the year ended June 30, 2011. The loss of either Siemens Diagnostics or Fenwal Blood Technologies as a customer could have a material adverse financial effect on the Company. See Item 1A. Risk Factors, “We are dependent on a few large customers; the loss of such customers or reduction in their demand could substantially harm our business and operating results” for a further discussion regarding these customers. While the overall relationships with the Siemens Diagnostics and Fenwal Blood Technologies are important to Sparton, the contracts with these companies are such as ordinarily accompany the kind of business conducted by Sparton and the Company does not believe that it is substantially dependent on any individual contract or agreement with these customers. The contractual arrangements entered into with Siemens Diagnostics and Fenwal Blood Technologies are represented
5
Table of Contents
by master agreements which include certain master terms and conditions of Sparton’s relationship with these customers. These agreements do not commit the customers to any specific volume of purchases. Moreover, these terms can be amended in appropriate circumstances. Thus, until these customers submit a purchase order to Sparton, there is no guarantee of any revenue to Sparton. Rather than depending on these contracts for revenue, the Company accepts purchase orders from these customers which determine volume and delivery requirements. Medical backlog was approximately $42.3 million and $14.0 million at June 30, 2011 and 2010, respectively. A majority of the June 30, 2011 Medical backlog is currently expected to be realized within the next 12 months.
As a medical device manufacturer, Sparton Medical Systems operates in a heavily regulated environment. Despite efforts to harmonize domestic and international regulations, inconsistencies still exist. Quality Management System requirements are generally compatible but device approval, licensing and environmental requirements vary widely and change frequently. RoHS (Restriction of Hazardous Substances) and REACH (Registration, Evaluation and Authorization of Chemicals) directives are among the more recent regulatory challenges. Similar environmental regulations are expected from other countries and the United States. Non-compliance risks range from variance notifications to production/shipping prevention depending upon the agency and form of non-compliance.
Complex Systems Segment
Sparton’s Complex Systems Business Unit, with locations in Florida and Vietnam, provides multiple industries with complex electronics systems offering end-to-end development and manufacturing solutions focused on high expectations of quality and delivery performance through a global footprint. As a vertically integrated business unit, we assist in providing our customers with seamless development of circuit card assemblies for integration into electro-mechanical solutions. Complex Systems has a diverse and highly skilled group of engineers that focus on maximizing efficiency and cost containment at the various steps in the design, engineering, and manufacturing process. These electronic specialists act as an intelligent source and ideal partner for development firms and OEMs. This business unit is a trusted source and supplier for low to medium volume/high complexity commercial and military aerospace applications, medical devices, telecommunications, energy, and industrial controls. Current portfolio of product line applications include: flight controls, cock pit displays, fuel system controls, secure communications, early warning detection, diagnostics systems, security systems, detection systems, lighting, satellite communications, audio, nuclear detection, inventory control, and defense.
Complex Systems provides to its customers support services that include engineering services, design, material management, obsolescence analysis and management, documentation development, and process improvement. Our engineering services, led by our rapid prototype and pilot build process, offer our customers a high quality product that can quickly be placed into their channels of distribution. Once a product has been proven viable, we offer domestic and low cost country manufacturing and distribution solutions.
The segment strives to exceed customers’ expectations of low cost with high delivery and quality performance. As these attributes are demanded by CS customers that produce the aforementioned products, Complex Systems strives to exceed those expectations through utilization of contemporary management tools to ascertain the effectiveness of all business operating systems. This has allowed Complex Systems to gain competitive traction in the market place.
Competitors in our market segments are much larger in size and typically operate in a medium to higher volume sector. These competitors, however, typically do not provide low-volume, high-mix legacy services that Sparton can provide, as this remains our niche in the market. Other EMS providers of comparable size to Sparton’s Complex Systems Business Unit are forecasted to modestly grow by leading industry experts. OEM’s in our market segments are continually driving costs out of their respective businesses through outsourcing strategies, allowing opportunity for Sparton to capture additional value add opportunities.
Sparton Complex Systems continues to engage in ongoing strategic initiatives to expand market awareness of Sparton capabilities. As we continue to execute to our growth strategy, we anticipated adding additional resources in
6
Table of Contents
Marketing Services, Business Development, and Program Administration services. We further intend to expand our web presence and continue direct participation in trade shows and networking forums. We are also engaged with local and regional economic development authorities. We continue to gain traction in this area as partnerships have developed with higher educational institutions research and development programs and county and regional economic leadership teams. Our Vietnam location continues to be engaged with the local government authority assisting North American Companies seeking to conduct business in Vietnam. These additional efforts will allow focused marketing for each of our identified markets optimizing our ability to selectively target new customers.
Complex Systems backlog was approximately $29.5 million and $29.1 million at June 30, 2011 and 2010, respectively. A majority of the June 30, 2011 Complex Systems backlog is currently expected to be realized within the next 12 months.
The majority of Sparton’s Complex Systems customers are in regulated industries where strict adherence to regulations is required such as Federal Drug Administration (“FDA”), International Tariff and Arms Regulations (“ITAR”), Federal Aviation Administration (“FAA”). These requirements are highly technical in nature and require strict adherence and documentation related to operational processes and documentation. Sparton’s quality system provides us the ability to service such markets, differentiating Sparton from some potential competitors which lack such systems.
DSS Segment
DSS operations, located in Florida, are comprised of design, development and production of products for a number of technologically significant programs aimed at fulfilling defense and commercial needs. Specializing in the development and production of complex electromechanical equipment, DSS designs and manufactures sonobuoys, anti-submarine warfare (“ASW”) devices used by the U.S. Navy and foreign governments. This business unit also performs an engineering development function for the United States military and prime defense contractors on advanced technologies targeted as future defense products as well as replacement of current systems. The sonobuoy product line is built to the customer’s demanding specifications. These products are ITAR restricted, which limits opportunities for competition.
DSS is partner to a 50/50 joint venture agreement (“JV”) with UnderSea Sensor Systems, Inc. (“USSI”), the only other major producer of sonobuoys to the free world. USSI’s parent company is Ultra Electronics Holdings PLC, based in the United Kingdom. The joint venture arrangement operates under the name ERAPSCO and allows Sparton and USSI to consolidate their own unique and complementary backgrounds to jointly develop and produce U.S. derivative sonobuoy designs for the U.S. Navy as well as foreign countries. In concept, and in practice, ERAPSCO serves as a pass-through entity with no funds or assets. While the joint venture agreement provides the opportunity to maximize efficiencies in the design and development of the related sonobuoys, both venture companies function independently as subcontractors; therefore, there is no separate entity to be accounted for or consolidated. The Board of Directors of ERAPSCO has the responsibility for the overall management and operation of the JV. The six (6) member board consists of equal representation (full time employees) from both JV partners for three (3) year terms. Manpower for ERAPSCO, specifically a general manager role, contract administrator role and financial manager role, is similarly assigned by the JV partners for rotating three year terms and the costs of these assigned individuals are borne by the party assigning the personnel. In response to a customer request for proposal (“RFP”) that ERAPSCO will bid on, the Board of Directors of ERAPSCO determines both the composition of a response to the RFP and the composite bid to be submitted to the customer. The Board of Directors strives to divide the aggregate contract awards at a 50/50 share ratio. Each joint venture partner bears the costs it incurs associated with the preparation and submission of proposals. Each JV partner submits to ERAPSCO a proposal for the estimated cost of performing that portion of the RFP applicable to it. Upon award of a contract to the JV, separate subcontracts are generated between ERAPSCO and each of the JV partners defining the responsibilities and compensation for each JV partner. These subcontracts contain terms and conditions consistent with the prime contract. Each JV partner is responsible for
7
Table of Contents
the successful performance of its bid to the JV for its respective scope of work and each JV partner is responsible for profit or losses sustained in the execution of the subcontract against its respective bid. Under ERAPSCO, individual contract risk exposures are reduced, while the likelihood of achieving U.S. Navy and other ASW objectives is enhanced. ERAPSCO has been in existence for approximately twenty years and historically, the agreed upon products included under the joint venture agreement were generally developmental or sonobuoys with low volume demand. Four years ago, the Company’s ERAPSCO arrangement was expanded to include additional products for U.S. customers and substantially all U.S. derivative sonobuoy products for customers outside of the United States. Beginning with the U.S. Government 2011 fiscal year contracts, all U.S. sonobuoy products are now bid and executed through ERAPSCO, completing the joint venture expansion which now includes sales of all U.S. derivative sonobuoys worldwide.
While the ERAPSCO agreement provides certain benefits to Sparton as described above, the Company does not believe that it is substantially dependent upon this agreement to conduct its business. If in the future, Sparton determines that this commercial arrangement is no longer beneficial, the Company has the ability to terminate the joint venture in relation to future business awards and return to independent bidding for U.S. Navy and foreign government ASW awards.
New internally funded products are under development for sale as commercial products to the navigation and underwater acoustic systems market. Markets for these products include autonomous underwater and ground vehicles, as well as unattended aerial vehicles as our product offerings grow. The principal example of such products is a family of precision electronic compasses for applications such as navigation and mineral or petroleum exploration. Competition among companies that build these products is intense and dynamic. As such, development of our commercial products requires the identification of sustainable competitive advantages (“SCA”) prior to investment to ensure there is a viable market for our products. Each new product must advance the technology available to the market enough to overcome the inherent inertia preventing potential customers from switching from competitors products. Likewise, existing products are evaluated periodically to ensure their SCA is still maintained and if not, either redesign or end-of-life occurs. The expansion of our commercial product lines leverages the intrinsic engineering talent at DSS and capitalizes on the sonobuoy product volumes to provide technological as well as economies of scale advantages.
Sonobuoy and related engineering services, including sales to the U.S. Navy, accounted for approximately 33%, 36% and 19% of consolidated revenue for the fiscal years ended June 30, 2011, 2010 and 2009, respectively. Sales to the U.S Navy, including subcontract sales through ERAPSCO, accounted for 30%, 28% and 14% of consolidated revenue for the fiscal years ended June 30, 2011, 2010 and 2009, respectively. The U.S. Navy issues multiple contracts annually for its sonobuoy and engineering requirements. The loss of U.S. Navy sonobuoy sales would have a material adverse financial effect on the Company. While the overall relationship with the U.S. Navy is important to Sparton, the contracts with the U.S. Navy, including subcontracts through ERAPSCO, are such as ordinarily accompany the kind of business conducted by Sparton and the Company does not believe that it is substantially dependent on any individual contract or agreement with this customer other than the Subcontract effective June 20, 2011 between Sparton Electronics, Florida, Inc. and ERAPSCO that is filed as an exhibit to this Annual Report on Form 10-K (the “Subcontract”). Pursuant to the Subcontract, DSS will supply sonobuoys to the U.S. Navy through ERAPSCO for a total contract value of approximately $32.2 million to Sparton Electronics.
DSS backlog was approximately $65.5 million and $69.6 million at June 30, 2011 and 2010, respectively. A majority of the June 30, 2011 DSS backlog is currently expected to be realized within the next 12 to 16 months.
United States Government contracts allow Sparton to submit advance billings, which are then applied against inventories purchased and manufacturing costs incurred by the Company throughout its performance under these contracts. Inventories were reduced by advance billings to the U.S. government for costs incurred related to long-term contracts, thereby establishing inventory to which the U.S. government then has title, of approximately $9.0 million and $7.4 million, respectively, at June 30, 2011 and 2010. At June 30, 2011 and
8
Table of Contents
2010, current liabilities include advance billings of $13.0 million and $21.6 million, respectively, on government contracts. As these billings are in excess of cost, there is no inventory to which the government would claim title and, therefore, no offset to inventory has been made.
DSS’s business is affected by numerous laws and regulations relating to the award, administration and performance of U.S. Government contracts. The U.S. Government generally has the ability to terminate DSS contracts, in whole or in part, without prior notice, for convenience or for default based on performance. If any of these U.S. Government contracts were terminated for convenience, Sparton would generally be protected by provisions covering reimbursement for costs incurred on the contracts and profit on those costs, but not the anticipated profit that would have been earned had the contract been completed.
Other
Non-sonobuoy related manufacturing and services are sold primarily through a direct sales force. In addition, our divisional and executive management teams are an integral part of our sales and marketing teams.
While overall sales can fluctuate during the year in each of our segments, such fluctuations do not reflect a seasonal pattern or tendency.
Materials for our operations are generally available from a variety of worldwide sources, except for selected components. Access to competitively priced materials is critical to success in our businesses. In certain markets, the volume purchasing power of our larger competitors creates a cost advantage for them. The Company has encountered availability and extended lead time issues on some electronic components due to strong market demand, and this condition resulted in higher prices and late deliveries. However, the Company does not expect to encounter significant long-term problems in obtaining sufficient raw materials. The risk of material obsolescence in our businesses is less significant than that which exists in many other markets since raw materials and component parts are generally purchased only upon receipt of a customer’s order. However, excess material resulting from order lead-time is a risk factor due to potential order cancellation or design changes by customers.
During fiscal 2011, the Company incurred internally funded research and development expenses of $1.1 million for the internal development of technologies for use in navigation, oil and gas exploration and port security. These efforts relate to our DSS segment. During fiscal 2010 and 2009, the Company incurred no expenditures for research and development (R&D) not funded by customers. Customer funded R&D costs, which are usually part of a larger production agreement, totaled approximately $9.1 million, $10.0 million and $4.4 million for the years ended June 30, 2011, 2010 and 2009, respectively, all of which relates to our DSS segment.
Sparton earns revenues from United States based customers as well as foreign country based customers. Additionally, the Company has a manufacturing facility in Vietnam. Financial information regarding the Company’s geographic sales concentration and locations of long-lived assets is presented in Note 16, Business, Geographic and Sales Concentration, of the Notes to Consolidated Financial Statements included in this Annual Report on Form 10-K.
At June 30, 2011, Sparton employed 1,013 people, including 140 contractors. None of the Company’s employees are represented by a labor union. The Company considers employee relations to be good.
9
Table of Contents
Executive Officers of the Registrant
Information with respect to executive officers of the Registrant is set forth below. The positions have been held for the periods noted.
| Cary B. Wood |
Chief Executive Officer since November 2008 and President since April 2009. Previously Mr. Wood held the position of Chief Operating Officer for Citation Corporation in Novi, MI since August 2004. (Age 44) | |
| Gregory A. Slome |
Senior Vice President and Chief Financial Officer since April 2009. Previously, Mr. Slome was an independent financial contractor since November 2007. Prior to that date, Mr. Slome was Director of Treasury and International Finance, U.S. Robotics Corporation since July 2000. (Age 48) | |
| Gordon B. Madlock |
Senior Vice President, Operations since January 2009. Previously, Mr. Madlock held the position of Senior Vice President of Operations for Citation Corporation in Novi, MI since September 1999. (Age 53) | |
| Michael W. Osborne |
Senior Vice President, Corporate and Business Development since January 2009. Previously, Mr. Osborne held the position of Vice President, Operations at The Niven Marketing Group in Carol Stream, IL since January 2006. Prior to that date, Mr. Osborne held the position of Vice President, Operations & Engineering at Gardner Bender in Milwaukee, WI since March 2004. (Age 40) | |
| Steven M. Korwin |
Senior Vice President, Quality, Engineering and Information Systems since September 2010 and Senior Vice President, Quality and Engineering since September 2009. Previously, Mr. Korwin held the position of Group Vice President, Electronic Manufacturing Services since December 2008. Prior to that date, Mr. Korwin held the position of Vice President of Quality and Engineering for Citation Corporation in Novi, MI since October 2005. (Age 48) | |
| Lawrence R. Brand |
Vice President, Human Resources since May 2011. Previously, Mr. Brand held the position of Director, Corporate Human Resources since February 2010. Prior to that date, Mr. Brand held the position of Senior Manager, Human Resources for Fellowes, Inc. in Itasca, IL since November 2004. (Age 44) | |
| Jake Rost |
Vice President/General Manager, Medical Business Unit since March 2011. Prior to that date, Mr. Rost held the position of Vice President, Business Development for Byers Peak since January 2007. (Age 42) | |
| Duane K. Stierhoff |
Vice President/General Manager, Medical Device Operations since June 2006. Prior to that date, Mr. Stierhoff held the position of Vice President Operations at Astro Instrumentation, LLC in Strongsville, OH. (Age 56) | |
| James M. Lackemacher |
Vice President/General Manager, Defense and Security Systems Business Unit since April 2005. Previously Mr. Lackemacher held the position of Director of Government Engineering since September 2003. (Age 49) | |
| Robert L. Grimm II |
Vice President/General Manager, Complex Systems Business Unit since July 2010. Previously Mr. Grimm held the position of General Manager, Electronic Manufacturing Services since January 2009. Prior to that date, Mr. Grimm held the position of General Manager for Citation Corporation in Novi, Michigan. (Age 45) | |
There are no family relationships among the persons named above. All officers are elected annually and serve at the discretion of the Board of Directors.
10
Table of Contents
| ITEM 1A. | RISK FACTORS |
We operate in a changing economic, political and technological environment that presents numerous risks, many of which are driven by factors that we cannot control or predict. The following discussion, as well as our “Critical Accounting Policies and Estimates” and “Management’s Discussion and Analysis” in Item 7, highlight some of these risks. The terms “Sparton,” “the Company,” “we,” “us,” and “our” refer to Sparton Corporation and subsidiaries.
The industry is extremely competitive and we depend on continued outsourcing by OEMs.
The Complex Systems and Medical industries in general are highly fragmented and intensely competitive. Our contract manufacturing services are available from many sources, and we compete with numerous domestic and foreign firms. Within Sparton’s target market, the high-mix, low- to medium-volume sector of the Complex Systems and Medical industries, there are substantially fewer competitors, but competition remains strong. Some competitors have substantially greater manufacturing, R&D, marketing or financial resources and, in some cases, have more geographically diversified international operations. Sparton expects competition to intensify further as more companies enter our target markets and our customers consolidate. In the future, increased competition from large electronic component manufacturers that are selling, or may begin to sell, electronics manufacturing services may occur. Future growth will depend on new outsourcing opportunities, and could be limited by OEMs performing such functions internally or delaying their decision to outsource.
DSS is partner to a 50/50 joint venture agreement with USSI, the only other major producer of sonobuoys to the free world. If USSI were to terminate this joint venture, DSS would be required to return to independent bidding for U.S. Navy and other foreign country sonobuoy business. If this was to happen, it is possible that the Company’s future results could be negatively impacted. Starting with the 2014 U.S. Government fiscal year, the U.S. Navy will open up its sonobuoy contract bidding process potentially allowing additional competitors to vie for this business. While the Company believes that there are significant barriers to entry into the sonobuoy market, if a new competitor was able to successfully develop the necessary technical capabilities and gain entry into the market space, the Company’s future results could be negatively impacted.
In some cases, Sparton may not be able to offer prices as low as some competitors for a host of reasons. For example, those competitors may have lower cost structures for their services, they may be willing to accept business at lower margins in order to utilize more of their excess capacity, or they may be willing to take on business at low or even zero gross margins to gain entry into the Company’s markets. Upon the occurrence of any of these events, our net sales would likely decline. Periodically, we may be operating at a cost disadvantage compared to some competitors with greater direct buying power. As a result, competitors may have a competitive advantage and obtain business from our customers.
Principal competitive factors in our targeted markets are believed to be quality, reliability, the ability to meet delivery schedules, customer service, technological sophistication, geographic location and price. During periods of recession in the Complex Systems and Medical industries, our competitive advantages in the areas of adaptive manufacturing and responsive customer service may be of reduced importance due to increased price sensitivity. We also expect our competitors to continue to improve the performance of their current products or services, to reduce their current products or service sales prices and to introduce new products or services that may offer greater performance and improved pricing. Any of these could cause a decline in sales, loss of market acceptance of our products or services, profit margin compression, or loss of market share.
Our operating results are subject to general economic conditions and may vary significantly from period to period due to a number of factors.
We are subject to inflation, interest rate changes, availability of capital markets, consumer spending rates, the effects of governmental plans to manage economic conditions and other national and global economic occurrences beyond our control. Such factors, economic weakness, and constrained customer spending have resulted in the past, and may result in the future, in decreased revenue, gross margin, earnings or growth rates.
11
Table of Contents
We can experience significant fluctuations in our annual and quarterly results of operations. In addition to general economic conditions, other factors that contribute to these fluctuations are our effectiveness in managing the manufacturing processes and costs in order to decrease manufacturing expenses, as well as the level of capacity utilization of our manufacturing facilities and associated fixed costs. The timing of our sonobuoy sales to the U.S. Navy is dependent upon access to the test range and successful passage of product tests performed by the U.S. Navy. Additionally, we rely on our customers’ demands, which can and do change dramatically, sometimes with little notice. Such factors also could affect our results of operations in the future.
Start-up costs and inefficiencies related to new or transferred programs can adversely affect our operating results and may not be recoverable.
Start-up costs, the management of labor and equipment resources in connection with new programs and new customer relationships and the need to estimate the extent and timing of required resources can adversely affect our profit margins and operating results. These factors are particularly evident with the introduction of new products and programs. The effects of these start-up costs and inefficiencies can also occur when new facilities are opened or programs are transferred from one facility to another.
If new programs or customer relationships are terminated or delayed, our operating results may be harmed, particularly in the near term. We may not be able to recoup our start-up costs or quickly replace these anticipated new program revenues.
We depend on limited or single source suppliers for some critical components; the inability to obtain components as required, with favorable purchase terms, could harm our business.
A significant portion of our costs are related to electronic components purchased to produce our products. In some cases our customers dictate that we purchase particular components from a single or limited number of suppliers. Supply shortages for a particular component can delay production, and thus delay shipments to customers and the associated revenue of all products using that component. This could cause the Company to experience a reduction in sales, increased inventory levels and costs, and could adversely affect relationships with existing and prospective customers. In the past, we have secured sufficient allocations of constrained components so that revenue was not materially impacted. If we are unable to procure necessary components under favorable purchase terms, including at favorable prices and with the order lead times needed for the efficient and profitable operation of our factories, our results of operations could suffer. The Company believes that alternative suppliers are available to provide the components, including unique components, necessary to manufacture our customers’ products.
We are dependent on a few large customers; the loss of such customers or reduction in their demand could substantially harm our business and operating results.
For the fiscal year ended June 30, 2011, our six largest customers, including the U.S. Navy, accounted for approximately 75% of total net sales. The U.S. Navy, a DSS customer through the Company’s ERAPSCO agreement, represented 30% of our total net sales in the same period. Siemens Diagnostics and Fenwal Blood Technologies, both Medical customers, contributed 18% and 12%, respectively, of total net sales in fiscal 2011. We expect to continue to depend upon a relatively small number of customers, but we cannot ensure that present or future large customers will not terminate, significantly change, reduce, or delay their manufacturing arrangements with us. Because our major customers represent such a large part of our business, the loss of any of our major customers or reduced sales to these customers could negatively impact our business.
During the fourth quarter of fiscal 2011, Siemens notified the Company that it intends to dual source two of its larger programs with the Company beginning in fiscal 2012. Annual sales related to these programs aggregated approximately $27.8 million in fiscal 2011. While the Company cannot estimate the ultimate impact that this dual sourcing will have on its future annual sales, unless overall sales related to these programs increase,
12
Table of Contents
this dual sourcing is expected to have an adverse impact on fiscal 2012 sales from the Company’s Ohio facility. Related in part to this event and in conjunction with the Company’s annual goodwill impairment analysis, the Company recorded impairments of $13.2 million and $3.7 million against its goodwill and customer relationships intangible asset, respectively, related to its Ohio reporting unit. See Item 7. Management’s Discussion and Analysis of Financial Condition and Results of Operations — Critical Accounting Policies and Estimates — Goodwill and Intangible Assets for a further description of these impairments.
Additionally, the U.S. Navy generally has the ability to terminate DSS contracts, in whole or in part, without prior notice, for convenience or for default based on performance. If any of these U.S. Navy contracts were to be terminated for convenience, Sparton would generally be protected by provisions covering reimbursement for costs incurred on the contracts and profit on those costs, but not the anticipated profit that would have been earned had the contract been completed.
We rely on the continued growth and financial stability of our customers, including our major customers. Adverse changes in the end markets they serve can reduce demand from our customers in those markets and/or make customers in these end markets more price sensitive. Furthermore, mergers or restructurings among our customers or our customers’ customers could increase concentration or reduce total demand as the combined entities rationalize their business and consolidate their suppliers. Future developments, particularly in those end markets which account for more significant portions of our revenues, could harm our business and our results of operations.
Sparton also generates large accounts receivable in connection with electronic contract manufacturing. If one or more of our customers experiences financial difficulty and is unable to pay for the services provided, our operating results and financial condition could be adversely affected. If our customers seek bankruptcy protection, they could act to terminate all or a portion of their business with us, originate new business with our competitors and terminate or assign our long-term supply agreements. Any loss of revenue from our major customers, including the non-payment or late payment of our invoices, could materially adversely affect our business, results of operations and financial condition.
Congressional budgetary constraints or reallocations can reduce our government sales.
Our U.S. Government contracts have many inherent risks that could adversely impact our financial results. Future governmental sales could be affected by a change in defense spending by the U.S. Government, or by changes in spending allocation that could result in one or more of our programs being reduced, delayed or terminated, which could adversely affect our financial results. The Company’s U.S. governmental sales are funded by the federal budget. Changes in negotiations for program funding levels or unforeseen world events can interrupt the funding for a program or contract. The timing of sonobuoy sales to the U.S. Navy is dependent upon access to their test facilities and successful passage of their product tests. Reduced governmental budgets have made access to the test range less predictable and less frequent than in the past, which has impacted the consistency or predictability of our reported revenues.
Customer cancellations, reductions, or delays could adversely affect our operating results.
We generally do not obtain long-term purchase commitments from our customers. Customers may cancel orders, delay the delivery of orders or release orders for fewer products than we previously anticipated for a variety of reasons, including decreases in demand for their products and services. Such changes by a significant customer, by a group of customers, or by a single customer whose production is material to an individual facility could seriously harm results of operations in that period. In addition, since much of our costs and operating expenses are relatively fixed, a reduction in customer demand would adversely affect our margins and operating income. Although we are always seeking new opportunities, we cannot be assured that we will be able to replace deferred, reduced or cancelled orders.
13
Table of Contents
Our inability to forecast the level of customer orders with much certainty makes it difficult to schedule production and maximize utilization of manufacturing capacity. Additionally, we are often required to place materials orders from vendors, some of which are non-cancelable, based on an expected level of customer volume. At June 30, 2011, non-cancelable purchase orders with vendors totaled approximately $29.6 million. If actual demand is higher than anticipated, we may be required to increase staffing and other expenses in order to meet such demand of our customers. Alternatively, anticipated orders from our customers may be delayed or fail to materialize, thereby adversely affecting our results of operations. Such customer order fluctuations and deferrals have had a material adverse effect on us in the past, and we may experience similar effects in the future.
Such order changes could cause a delay in the repayment to us for inventory expenditures we incurred in preparation for the customer’s orders or, in certain circumstances, require us to return the inventory to our suppliers, resell the inventory to another customer or continue to hold the inventory. In some cases, excess material resulting from longer order lead time is a risk due to the potential of order cancellation or design changes by customers. Additionally, dramatic changes in circumstances for a customer could also negatively impact the carrying value of our inventory for that customer.
The Company and its customers may be unable to keep current with technological changes.
Our customers participate in markets that have rapidly changing technology, evolving industry standards, frequent new product introductions, and relatively short product life cycles. The introduction of products embodying new technologies or the emergence of new industry standards can render existing products obsolete or unmarketable. Our success depends upon our customers’ ability to enhance existing products and to develop and introduce new products, on a timely and cost-effective basis, that keep pace with technological developments and emerging industry standards, and address increasingly sophisticated customer requirements. There is no assurance that our customers will do so, and any failure to do so could substantially harm our customers and us.
Additionally, our future success will depend upon our ability to maintain and enhance our own technological capabilities, develop and market manufacturing services which meet changing customer needs, and successfully anticipate or respond to technological changes in manufacturing processes on a cost-effective and timely basis. If we are unable to do so, business, financial condition and operating results could be materially adversely affected.
Our growth strategies could be ineffective due to the risks of further acquisitions.
Our growth strategy has included acquiring complementary businesses. We could fail to identify, finance or complete suitable acquisitions on acceptable terms and prices. Acquisition efforts could increase a number of risks, including diversion of management’s attention, difficulties in integrating systems and operations, potential loss of key employees and customers of the acquired companies and exposure to unanticipated liabilities. Our discovery of, or failure to discover, material issues during due diligence investigations of acquisition targets, either before closing with regard to potential risks of the acquired operations, or after closing with regard to the timely discovery of breaches of representations or warranties, could materially harm our business.
Our current use of advance billings within Government contracts may not continue.
Our current contracts with the U.S. Navy include provisions for certain billing and collection of funds from the Government in advance of related inventory purchases and incurrence of manufacturing expenses. These contractual provisions are an integral part of our capital and liquidity profile. While we have other sources of liquidity including, but not limited to, our operations, existing cash balances and our revolving line-of-credit, and we believe we have sufficient liquidity for our anticipated needs over the next 12 months, no assurances regarding liquidity can be made. The discontinuance of advance billing provisions from future U.S. Navy contracts would require us to fund the working capital requirements related to these contracts from other sources and otherwise could materially adversely impact our business, results of operations and financial condition.
14
Table of Contents
Fluctuations in foreign currency exchange rates could increase operating costs.
A portion of the Company’s operations and some customers are in foreign locations. As a result, transactions may occur in currencies other than the U.S. dollar. Currency exchange rates fluctuate on a daily basis as a result of a number of factors and cannot be easily predicted. Volatility in the U.S. dollar could seriously harm our business, operating results and financial condition. The primary impact of currency exchange fluctuations is on the adjustments related to the translation of the Company’s Vietnamese financial statements into U.S. dollars, which are included in current earnings, as well as impacting the cash, receivables, payables, property and equipment of our operating entities. The Company currently does not use financial instruments to hedge foreign currency fluctuation and unexpected expenses could occur from future fluctuations in exchange rates.
Failure to attract and retain key personnel and skilled associates could hurt operations.
Our success depends to a large extent upon the continued services of key management personnel. While we have employment contracts in place with several of our executive officers, we nevertheless cannot be assured that we will retain our key employees, and the loss of service of any of these officers or key management personnel could have a material adverse effect on our business growth and operating results.
Our future success will require an ability to attract and retain qualified employees. Competition for such key personnel is intense, and we cannot be assured that we will be successful in attracting and retaining such personnel. Changes in the cost of providing pension and other employee benefits, including changes in health care costs, investment returns on plan assets, and discount rates used to calculate pension and related liabilities, could lead to increased costs in any of our operations.
We are involved in legal proceedings and unfavorable decisions could materially affect us.
Our business activities expose us to risks of litigation with respect to our customers, suppliers, creditors, shareholders, product liability, or environmental-related matters. We may incur significant expense to defend or otherwise address current or future claims. Any litigation, even a claim without merit, could result in substantial costs and diversion of resources, and could have a material adverse effect on our business and results of operations.
Adverse regulatory developments could harm our business.
Our business operates in heavily regulated environments. We must manage the risk of changes in or adverse actions under applicable law or in our regulatory authorizations, licenses and permits, governmental security clearances, government procurement regulations or other legal rights in order to operate our business, manage our work force, or import and export goods and services as needed. We also face the risk of other adverse regulatory actions, compliance costs, or governmental sanctions.
The efficiency of our operations could be adversely affected by disruptions to our Information Technology (IT) Services, including implementation of our new enterprise resource planning (“ERP”) system.
We rely in part on various IT systems to manage our operations and to provide analytical information to management. These systems are vulnerable to, among other things, damage and interruption from power loss or natural disasters, computer system and network failures, loss of telecommunication services, physical and electronic loss of data, security breaches and computer viruses. Any inefficiencies or production down-times resulting from such disruptions could have a negative impact on our ability to meet customers’ orders, resulting in a delay or decrease to our revenue and a reduction to our operating margins. Further, we are in the process of implementing a new ERP system. While we believe we are effectively managing the implementation, there are risks involved in the rollout of an enterprise wide project. Any disruption to our financial or other systems as a result of the ERP rollout could have a material adverse impact on our business.
15
Table of Contents
Business disruptions could seriously harm our business and results of operations.
Increased international political instability, evidenced by threats and occurrence of terrorist attacks, conflicts in the Middle East and Asia, and strained international relations arising from these conflicts, may hinder our ability to do business. The political environment in communist countries can contribute to the threat of instability. While we have not been adversely affected as yet due to this exposure, one of our facilities is based in Vietnam, which is a communist country. These events may continue to have an adverse impact on the U.S. and world economies, particularly customer confidence and spending, which in turn could affect our revenue and results of operations. The impact of these events on the volatility of the U.S. and world financial markets could increase the volatility of our securities and may limit the capital resources available to us, our customers and our suppliers.
Our operations could be subject to natural disasters and other business disruptions, including earthquakes, power shortages, telecommunications failures, water shortages, tsunamis, floods, hurricanes, fires, and other natural or manmade disasters, which could seriously harm our financial condition and increase our expenses. In the past, hurricanes have adversely impacted the performance of two of our production facilities located in Florida.
We have a production facility outside Ho Chi Minh City, Vietnam, which is in an area previously affected by avian flu. To the best of our knowledge, concerns about the spread of various types of flu have not affected our employees or operations. However, our production could be severely impacted by an epidemic spread of these or other forms of flu. These factors could also affect our suppliers and customers, and results of operations.
Changes in the securities laws and regulations have increased, and are likely to continue to increase our costs.
The Sarbanes-Oxley Act and more recently the Dodd-Frank Wall Street Reform and Consumer Protection Act (the “Dodd-Frank Act”) required or will require changes in some of our corporate governance, securities disclosure and compliance practices. In response to the requirements of the Sarbanes-Oxley Act, the SEC and the New York Stock Exchange (“NYSE”) promulgated new rules on a variety of subjects. Similar rules are expected to be promulgated in relation to the Dodd-Frank Act. Compliance with these new rules has increased and may increase further our legal, financial and accounting costs. We expect some level of increased costs related to these new regulations to continue indefinitely. While preparation and consulting costs are anticipated to decline, continuous review and audit costs related to these regulations may increase. However, absent significant changes in related rules (which we cannot assure), we anticipate these costs may decline somewhat in future years as we become more efficient in our compliance processes. We also expect these developments to make it more difficult and more expensive to obtain director and officer liability insurance, and we may be forced to accept reduced coverage or incur substantially higher costs to obtain coverage. Likewise, these developments may make it more difficult for us to attract and retain qualified members of our Board of Directors or qualified management personnel.
If we are unable to maintain effective internal control over our financial reporting, investors could lose confidence in the reliability of our financial statements, which could result in a reduction in the value of our common stock.
As required by Section 404 of the Sarbanes-Oxley Act, the SEC adopted rules requiring public companies to include a report of management on the company’s internal control over financial reporting in their annual reports on Form 10-K. The report must contain an assessment by management of the effectiveness of our internal control over financial reporting. In addition, the independent registered public accounting firm auditing a company’s financial statements must attest to and report on the effectiveness of the company’s internal control over financial reporting, if the Company’s public equity float remains above certain thresholds.
16
Table of Contents
We are continuing our comprehensive efforts to comply with Section 404 of the Sarbanes-Oxley Act. If we are unable to maintain effective internal control over financial reporting, this could lead to a failure to meet our reporting obligations to the SEC which, in turn, could result in an adverse reaction in the financial markets due to a loss of confidence in the reliability of our financial statements.
We are subject to a variety of environmental laws, which expose us to potential liability.
Our operations are regulated under a number of federal, state, provincial, local and foreign environmental laws and regulations, which govern, among other things, the discharge of hazardous materials into the air and water, as well as the handling, storage and disposal of such materials. These laws and regulations include the Clean Air Act, the Clean Water Act, the Resource, Conservation and Recovery Act and the Comprehensive Environmental Response, Compensation and Liability Act, as well as analogous state and foreign laws. Compliance with these environmental laws is a significant consideration for us because we use various hazardous materials in our manufacturing processes. We may be liable under environmental laws for the cost of cleaning up properties we own or operate if they are or become contaminated by the release of hazardous materials, regardless of whether we caused the release, even if we fully comply with applicable environmental laws. In the event of contamination or violation of environmental laws, we could be held liable for damages including fines, penalties and the costs of remedial actions and could also be subject to revocation of our discharge permits. Any such penalties or revocations could require us to cease or limit production at one or more of our facilities, thereby harming our business. In addition, such regulations could restrict our ability to expand our facilities or could require us to acquire costly equipment, or to incur other significant expenses to comply with environmental regulations, including expenses associated with the recall of any non-compliant product.
Sparton has been involved with ongoing environmental remediation since the early 1980’s related to one of its former manufacturing facilities, located in Albuquerque, New Mexico. At June 30, 2011, Sparton had accrued approximately $4.2 million as its estimate of the remaining minimum future undiscounted financial liability with respect to this matter. Uncertainties associated with environmental remediation contingencies are pervasive and often result in wide ranges of reasonably possible outcomes. Estimates developed in the early stages of remediation can vary significantly. Normally a finite estimate of cost does not become fixed and determinable at a specific point in time. Rather, the costs associated with environmental remediation become estimable over a continuum of events and activities that help to frame and define a liability. Factors which cause uncertainties for the Company include, but are not limited to, the effectiveness of the current work plans in achieving targeted results and proposals of regulatory agencies for desired methods and outcomes. It is possible that cash flows and results of operations could be materially affected by the impact of changes associated with the ultimate resolution of this contingency. At June 30, 2011, the Company estimates that it is reasonably possible, but not probable, that future environmental remediation costs associated with the Company’s past operations at the Coors Road property, in excess of amounts already recorded and net of DOE reimbursement, could be up to $1.9 million before income taxes over the next approximately twenty years. See Item 3 — “Legal Proceedings” of this Annual Report on Form 10-K.
Operations outside of the United States may be affected by legal and regulatory risks, and government reviews, inquiries or investigations could harm the Company’s business.
The Company’s operations in Vietnam and the business it conducts outside the United States are subject to risks relating to compliance with legal and regulatory requirements in the United States as well as in local jurisdictions. Additionally, there is a risk of potentially higher incidence of fraud or corruption in certain foreign jurisdictions and greater difficulty in maintaining effective internal controls. From time to time, the Company may conduct internal investigations and compliance reviews to ensure that the Company is in compliance with applicable laws and regulations. Additionally, the Company could be subject to inquiries or investigations by government and other regulatory bodies. Any determination that the Company’s operations or activities are not in compliance with United States laws, including the Foreign Corrupt Practices Act, or various international laws and regulations could expose the Company to significant fines, penalties or other sanctions that may harm the business and reputation of the Company.
17
Table of Contents
Certain shareholders have significant control and shares eligible for public sale could adversely affect the share price.
As of June 30, 2011, the directors, executive officers and 5% shareholders beneficially owned or controlled an aggregate of approximately 38% of our common stock. Accordingly, certain persons have significant influence over the election of our Board of Directors, the approval or disapproval of any other matters requiring shareholder approval, and the affairs and policies of Sparton. Such voting power could also have the effect of deterring or preventing a change in control of the Company that might otherwise be beneficial to other shareholders. Conversely, such voting power could have the effect of deterring or preventing a change in control of the Company that might otherwise be detrimental to other shareholders. In addition, substantially all of the outstanding shares of common stock are freely tradable without restriction or further registration. Sales of substantial amounts of common stock by shareholders, or even the potential for such sales, may cause the market price to decline and could impair the ability to raise capital through the sale of equity securities.
In the future, we may need additional funding, which could be raised through issuances of equity securities. We also have the right to issue shares upon such terms and conditions and at such prices as our Board of Directors may establish. Such offerings would dilute the ownership interest of existing shareholders and could cause a dilution of the net tangible book value of such shares.
At June 30, 2011, there were options outstanding for the purchase of 220,341 shares of common stock of the Company, all of which options were vested and exercisable. Holders of our common stock could suffer dilution if outstanding common stock options are exercised in excess of the number of shares repurchased by Sparton.
Market volatility may have an adverse impact on our pension costs associated with our defined benefit plan.
The recent volatility and uncertainty in the global financial market has resulted in the Company making significant cash contributions to our pension plan in recent years. For a further discussion of the Sparton Corporation Pension Plan, see “Pension Obligations” in the Critical Accounting Policies and Estimates section in Part II, Item 7 of this report and Note 9, Employee Retirement Benefits Plans, of the “Notes to Consolidated Financial Statements” in this Annual Report on Form 10-K. Notwithstanding the actions recently taken to reduce the costs of the plan, if the global financial market continues to be unstable or declines further, we may be required to make further contributions to the pension plan in future periods. These contributions, if made, would negatively impact our liquidity, cash flows, and financial position.
The tightened credit market, both nationally and globally, may adversely affect the availability of funds to us for working capital, liquidity requirements, and other purposes, which may adversely affect our cash flows and financial condition.
We anticipate that our revolving line-of-credit facility will be a component of our available working capital during fiscal 2012. For a summary of our banking arrangements, see Note 7, Debt, of the “Notes to Consolidated Financial Statements” in this Annual Report on Form 10-K. If the turmoil in the credit market continues or intensifies, we may have difficulty maintaining a line-of-credit on similar or more favorable terms, which could adversely affect our liquidity, cash flows, and results of operations. There are no assurances we will always have access to a line-of-credit or that the line-of-credit would always be sufficient for all purposes. Additionally, if vendors of electronic components restricted or reduced credit extended to us for purchase of raw materials as a result of general market conditions, the vendor’s credit status, or our financial position, it could adversely affect liquidity, cash flows, and results of operations.
Our stock price may be volatile, and the stock is thinly traded, which may cause investors to lose most or part of their investment in our common stock.
The stock market may experience volatility that is often unrelated to the operating performance of any particular company or companies. If market-sector or industry-based fluctuations occur, our stock price could decline regardless of our actual operating performance, and investors could lose a substantial part of their investments.
18
Table of Contents
Moreover, if an active public market for our common stock is not sustained in the future, it may be difficult to resell such stock. Generally, our stock is thinly traded. When trading volumes are low, a relatively small buy or sell order can result in a relatively large change in the trading price of our common stock and investors may not be able to sell their securities at a favorable price. In addition, should the vested and exercisable stock options be exercised and the resulting common shares simultaneously sold (to fund the cost of the exercise and the related taxes associated with the stock sale), our stock price could be significantly adversely impacted.
| ITEM 1B. | UNRESOLVED STAFF COMMENTS |
None.
| ITEM 2. | PROPERTIES |
The following is a listing of Sparton’s principal properties as of June 30, 2011. Except as described below, Sparton owns all of these properties. These facilities provide a total of approximately 513,000 square feet of manufacturing and administrative space. There are manufacturing and office facilities at each location. Reflective of the current economic environment, Sparton’s manufacturing facilities are underutilized. Underutilized percentages vary by plant; however, ample space exists to accommodate expected growth. Sparton believes these facilities are suitable for its operations.
| Segment/Location |
Square Feet | Ownership | ||||||
| Medical Segment: |
||||||||
| Strongsville, Ohio |
60,000 | Owned | ||||||
| Frederick, Colorado |
65,000 | Leased | ||||||
| Complex Systems Segment: |
||||||||
| Brooksville, Florida |
136,000 | Owned | ||||||
| Thuan An District, Binh Duong Province, Vietnam (Outside of Ho Chi Minh City) |
55,000 | Owned | ||||||
| DSS Segment: |
||||||||
| De Leon Springs, Florida |
197,000 | Owned | ||||||
| Corporate Office: |
||||||||
| Schaumburg, Illinois |
8,000 | Leased | ||||||
The Company’s Frederick, Colorado facility has approximately 6 years remaining on its initial lease term. The lease provides the Company the option to extend the term up to an additional five years.
While the Company owns the building and other assets in Vietnam, the land is occupied under a long-term lease covering approximately 40 years. This lease is prepaid, with the cost amortized over the term of the lease, and carried in other long-term assets on our balance sheet.
The Company is additionally leasing approximately 30,000 square feet of manufacturing and administrative space in connection with its acquisition of Byers Peak, Incorporated (“Byers Peak”) in March 2011. This lease has an initial term of six months with options to extend the lease up to an additional eighteen months and is needed to facilitate the transition of the Byers Peak business to the Frederick, Colorado facility. The Company expects to have this transition completed by the end of the Company’s fiscal 2012 second quarter and be able to terminate the lease at that time.
As of June 30, 2011, substantially all of our assets, including real estate, are pledged as collateral to secure any potential borrowings under our revolving line of credit (see Note 7, Debt, of the “Notes to Consolidated Financial Statements” in this Annual Report on Form 10-K).
19
Table of Contents
| ITEM 3. | LEGAL PROCEEDINGS |
Environmental Remediation
Sparton has been involved with ongoing environmental remediation since the early 1980’s related to one of its former manufacturing facilities, located in Albuquerque, New Mexico (“Coors Road”). Although the Company entered into a long-term lease of the Coors Road property that was accounted for as a sale of property during fiscal 2010 (see Note 2, Summary of Significant Accounting Policies, Net, of the “Notes to Consolidated Financial Statements” in this Annual Report on Form 10-K), it remains responsible for the remediation obligations related to its past operation of this facility. At June 30, 2011, Sparton had accrued approximately $4.2 million as its estimate of the remaining minimum future undiscounted financial liability with respect to this matter, of which approximately $0.4 million is classified as a current liability and included on the balance sheet in other accrued expenses. The Company’s minimum cost estimate is based upon existing technology and excludes certain legal costs, which are expensed as incurred. The Company’s estimate includes equipment and operating and maintenance costs for onsite and offsite pump and treat containment systems, as well as continued onsite and offsite monitoring. It also includes periodic reporting requirements.
On October 15, 2009, approximately $3.1 million of cash was utilized to establish a trust, the Sparton Corporation Financial Assurance Trust, for remediation activity. The funds were held in Sparton’s name and were invested with Sparton receiving the benefit of the investment return. As of June 30, 2010, approximately $3.2 million was held in this trust and reflected as restricted cash on the consolidated balance sheet. These funds were available for use against the expected remediation liability. The trust was established to meet the United States Environmental Protection Agency’s (“EPA”) financial assurance requirements for the fiscal year ended June 30, 2010, with trust funds to be drawn upon only should Sparton not continue to meet its financial remediation requirements. The trust was to remain in place until the Company could again satisfy the EPA financial assurance requirements through compliance with financial ratios, as was previously attained on an annual basis until fiscal year 2009. Based on the Company’s financial results for fiscal year 2010, the Company was again in compliance with the financial ratios and dissolved the trust during October 2010.
In fiscal 2003, Sparton reached an agreement with the United States Department of Energy (“DOE”) and others to recover certain remediation costs. Under the settlement terms, Sparton received cash and obtained some degree of risk protection as the DOE agreed to reimburse Sparton for 37.5% of certain future environmental expenses in excess of $8.4 million incurred from the date of settlement, if any, of which approximately $3.6 million has been expended as of June 30, 2011 toward the $8.4 million threshold. Uncertainties associated with environmental remediation contingencies are pervasive and often result in wide ranges of reasonably possible outcomes. Estimates developed in the early stages of remediation can vary significantly. Normally a finite estimate of cost does not become fixed and determinable at a specific point in time. Rather, the costs associated with environmental remediation become estimable over a continuum of events and activities that help to frame and define a liability. Factors which cause uncertainties for the Company include, but are not limited to, the effectiveness of the current work plans in achieving targeted results and proposals of regulatory agencies for desired methods and outcomes. It is possible that cash flows and results of operations could be materially affected by the impact of changes associated with the ultimate resolution of this contingency. At June 30, 2011, the Company estimates that it is reasonably possible, but not probable, that future environmental remediation costs associated with the Company’s past operations at the Coors Road property, in excess of amounts already recorded and net of DOE reimbursement, could be up to $1.9 million before income taxes over the next approximately twenty years.
The Company and its subsidiaries are also involved in certain existing compliance issues with the EPA and various state agencies, including being named as a potentially responsible party at several sites. Potentially responsible parties (“PRP”s) can be held jointly and severally liable for the clean-up costs at any specific site. The Company’s past experience, however, has indicated that when it has contributed relatively small amounts of materials or waste to a specific site relative to other PRPs, its ultimate share of any clean-up costs has been minor. Based upon available information, the Company believes it has contributed only small amounts to those sites in which it is currently viewed as a PRP.
20
Table of Contents
Customer Relationships
The Company had an action before the U.S. Court of Federal Claims to recover damages arising out of an alleged infringement by the U.S. Navy of certain patents held by Sparton and used in the production of sonobuoys. Pursuant to an agreement between the Company and counsel conducting the litigation, a significant portion of the claim will be retained by the Company’s counsel in contingent fees if the litigation is successfully concluded. A trial of the matter was conducted by the court in April 2008, with a decision against Sparton filed in August 2009 and published in September 2009. In October 2009, an appeal of this unfavorable decision was filed with the Federal Circuit Court of Appeals. Based on this decision, management believes that the Company’s ability to obtain any recovery with respect to the claim is remote.
Litigation
On August 9, 2009, Sparton and certain subsidiaries were named as defendants in a wrongful death suit, alleging that a defective transmission shifter assembly in a 1996 Chrysler automobile caused a July 2007 death. The suit also named Chrysler LLC, Dura Automotive Systems, Inc., and Chandler Motors Company as defendants. The suit was filed in Pontotoc County Circuit Court in Mississippi. Sparton has not manufactured automotive shifter assemblies for Chrysler since December 1996, when it sold its KPI Group subsidiary to Dura Automotive Systems, Inc. The plaintiff sought damages for economic loss, pain and suffering, and loss of companionship, as well as punitive damages. After Sparton filed a motion for summary judgment, and after plaintiff took the deposition of a Chrysler representative who testified that Sparton had nothing to do with the design of any shifters KPI may have manufactured, plaintiff consented to the entry of judgment for Sparton on all claims. An order dismissing all claims against Sparton with prejudice was submitted to the Court and was entered on August 10, 2011, thereby closing this litigation against Sparton.
Other
In addition to the foregoing, from time to time, the Company is involved in various legal proceedings relating to claims arising in the ordinary course of business. The Company is not currently a party to any other such legal proceedings, the adverse outcome to which, individually or in the aggregate, is expected to have a material adverse effect on our business, financial condition or results of operations.
| ITEM 4. | [REMOVED AND RESERVED] |
21
Table of Contents
| ITEM 5. | MARKET FOR REGISTRANT’S COMMON EQUITY, RELATED STOCKHOLDER MATTERS AND ISSUER PURCHASES OF EQUITY SECURITIES |
Market Information. Our common stock is traded on the New York Stock Exchange (“NYSE”) under the symbol “SPA”.
The table below sets forth the high and low closing prices of our common stock as reported by the NYSE for each quarter during the last two years:
| Quarter | ||||||||||||||||
| 1st | 2nd | 3rd | 4th | |||||||||||||
| Year Ended June 30, 2011 |
||||||||||||||||
| High |
$ | 6.09 | $ | 8.37 | $ | 9.00 | $ | 10.22 | ||||||||
| Low |
$ | 4.78 | $ | 6.08 | $ | 7.63 | $ | 7.68 | ||||||||
| Year Ended June 30, 2010 |
||||||||||||||||
| High |
$ | 4.40 | $ | 6.47 | $ | 6.74 | $ | 6.00 | ||||||||
| Low |
$ | 2.60 | $ | 4.00 | $ | 5.60 | $ | 4.95 | ||||||||
Holders. As of August 31, 2011, there were 448 record holders of our common stock. The number of record holders does not include beneficial owners whose shares are held in the names of banks, brokers, nominees or other fiduciaries.
Dividends. We have not paid dividends on our common stock during either fiscal 2011 or fiscal 2010. Other than in fiscal 2006, the Company has not declared or paid cash dividends on our common stock for many years. In addition, our credit facility prohibits us from declaring or paying any dividends on our capital stock without obtaining prior approval from our credit facility provider.
Securities Authorized for Issuance Under Equity Compensation Plans. See our disclosure below in “Part III, Item 12. Security Ownership of Certain Beneficial Owners and Management Related Stockholder Matters.”
Unregistered Sales of Equity Securities and Use of Proceeds. None.
Performance Graph. The performance graph below compares the cumulative total shareholder return on our common stock for the past five years against the cumulative total return of a broad market index (Russell 2000 Index) and a peer group index, which is composed of Aerovironment, Inc., Analogic Corporation, API Technologies Corp., Astronics Corporation, Benchmark Electronics, Inc., CTS Corporation, Ducommun Incorporated, HEI, Inc., IEC Electronics Corp., ION Geophysical Corporation, Plexus Corp., Raven Industries, Inc., SigmaTron International, Inc., SMTC Corporation, Sypris Solutions, Inc. and Ultra Electronics Holdings. Previously, the Company used the S&P 500 Composite Index as its broad market index comparative and the Electronics Component of the NASDAQ as its more specific industry index comparative. The Company changed its comparative broad market index because it believes that the Russell 2000 Index is a more meaningful proxy for the overall marketplace than the S&P 500 Composite Index. The comparative peer group was selected based on a review of publicly available information about these companies and the Company’s determination that they are engaged in electronics manufacturing businesses similar to that of the Company or its reportable operating segments. The Company also believes that this peer group is a more meaningful comparative than the industry index used in the previous year.
The graph assumes that $100.00 was invested in our common stock and in each index on June 30, 2006. The total return for the common stock and the indices used assumes the reinvestment of dividends, if any. The comparisons in the graph below are based upon historical data and are not indicative of, nor intended to forecast, future performance of our common stock.
22
Table of Contents
Comparison of Cumulative Total Return
Among Sparton Corporation,
Russell 2000 Index, Peer Group Index,
S&P 500 Index and NASDAQ Electronics Component Index
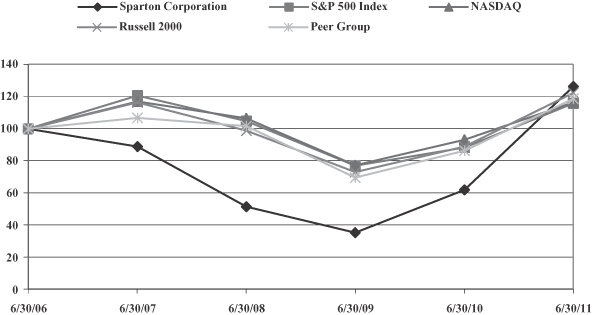
| 06/30/06 | 06/30/07 | 06/30/08 | 6/30/09 | 06/30/10 | 6/30/11 | |||||||||||||||||||
| Sparton Corporation |
100.00 | 88.94 | 51.88 | 35.82 | 62.14 | 126.25 | ||||||||||||||||||
| Russell 2000 Index |
100.00 | 116.43 | 98.78 | 73.17 | 88.89 | 122.15 | ||||||||||||||||||
| Peer Group |
100.00 | 106.78 | 101.55 | 69.97 | 86.36 | 118.67 | ||||||||||||||||||
| S&P 500 Index |
100.00 | 120.59 | 104.77 | 77.30 | 88.46 | 115.61 | ||||||||||||||||||
| NASDAQ Electronics Component Index |
100.00 | 116.80 | 106.44 | 77.55 | 93.33 | 116.37 | ||||||||||||||||||
23
Table of Contents
| ITEM 6. | SELECTED FINANCIAL DATA |
The following table sets forth a summary of selected financial data for the last five fiscal years. This selected financial data should be read in conjunction with “Management’s Discussion and Analysis of Financial Condition and Results of Operations” and our Audited Consolidated Financial Statements and, in each case, any related notes thereto included elsewhere in this report. ($ in thousands, except share data)
| 2011 (a) | 2010 | 2009 | 2008 | 2007 | ||||||||||||||||
| Operating Results: |
||||||||||||||||||||
| Net sales |
$ | 203,352 | $ | 173,977 | $ | 221,871 | $ | 229,806 | $ | 200,086 | ||||||||||
| Cost of goods sold |
170,184 | 147,394 | 205,985 | 218,216 | 194,145 | |||||||||||||||
|
|
|
|
|
|
|
|
|
|
|
|||||||||||
| Gross profit |
33,168 | 26,583 | 15,886 | 11,590 | 5,941 | |||||||||||||||
| Selling and administrative expenses |
20,842 | 18,205 | 18,851 | 19,106 | 17,948 | |||||||||||||||
| Internal research and development expenses |
1,110 | — | — | — | — | |||||||||||||||
| Restructuring/impairment charges |
75 | 4,076 | 7,008 | 181 | — | |||||||||||||||
| Gain on acquisition |
(2,550 | ) | — | — | — | — | ||||||||||||||
| Gain on sale of property, plant and equipment |
(139 | ) | (3,119 | ) | (10 | ) | (977 | ) | (89 | ) | ||||||||||
| Impairment of intangible asset |
3,663 | — | — | — | — | |||||||||||||||
| Impairment of goodwill |
13,153 | — | — | — | — | |||||||||||||||
| Other operating expenses |
843 | 1,699 | 1,294 | 483 | 278 | |||||||||||||||
|
|
|
|
|
|
|
|
|
|
|
|||||||||||
| Operating income (loss) |
(3,829 | ) | 5,722 | (11,257 | ) | (7,203 | ) | (12,196 | ) | |||||||||||
| Other expense, net |
(114 | ) | (198 | ) | (2,709 | ) | (734 | ) | (180 | ) | ||||||||||
|
|
|
|
|
|
|
|
|
|
|
|||||||||||
| Income (loss) before income taxes |
(3,943 | ) | 5,524 | (13,966 | ) | (7,937 | ) | (12,376 | ) | |||||||||||
| Provision for (benefit from) income taxes |
(11,404 | ) | (1,916 | ) | 1,787 | 5,201 | (4,607 | ) | ||||||||||||
|
|
|
|
|
|
|
|
|
|
|
|||||||||||
| Net income (loss) |
$ | 7,461 | $ | 7,440 | $ | (15,753 | ) | $ | (13,138 | ) | $ | (7,769 | ) | |||||||
|
|
|
|
|
|
|
|
|
|
|
|||||||||||
| Weighted-Average Common Shares Outstanding: |
||||||||||||||||||||
| Common stock — basic |
10,217,494 | 9,972,409 | 9,811,635 | 9,811,507 | 9,817,972 | |||||||||||||||
| Common stock — diluted |
10,255,368 | 9,972,409 | 9,811,635 | 9,811,507 | 9,817,972 | |||||||||||||||
| Per Share of Common Stock — Income (Loss): |
||||||||||||||||||||
| Common stock — basic |
$ | 0.73 | $ | 0.75 | $ | (1.61 | ) | $ | (1.34 | ) | $ | (0.79 | ) | |||||||
| Common stock — diluted |
$ | 0.73 | $ | 0.75 | $ | (1.61 | ) | $ | (1.34 | ) | $ | (0.79 | ) | |||||||
| Shareholders’ equity — Per Share |
$ | 7.33 | $ | 6.30 | $ | 5.52 | $ | 7.22 | $ | 8.81 | ||||||||||
| Cash Dividends — Per Share |
$ | — | $ | — | $ | — | $ | — | $ | — | ||||||||||
| Other Financial Data: |
||||||||||||||||||||
| Total assets |
$ | 122,609 | $ | 119,861 | $ | 155,002 | $ | 142,726 | $ | 137,008 | ||||||||||
| Working capital |
$ | 51,323 | $ | 37,730 | $ | 32,898 | $ | 41,581 | $ | 52,989 | ||||||||||
| Working capital ratio |
2.22:1 | 1.82:1 | 1.38:1 | 1.74:1 | 2.62:1 | |||||||||||||||
| Debt |
$ | 1,796 | $ | 1,917 | $ | 22,959 | $ | 25,588 | $ | 17,011 | ||||||||||
| Shareholders’ equity |
$ | 75,047 | $ | 64,269 | $ | 54,895 | $ | 70,860 | $ | 86,480 | ||||||||||
| (a) | The operating results of the Medical businesses acquired from Delphi Medical Systems, LLC and Byers Peak, Incorporated have been included in the Company’s consolidated financial results since the date of acquisitions on August 6, 2010 and March 4, 2011, respectively. |
24
Table of Contents
| ITEM 7. | MANAGEMENT’S DISCUSSION AND ANALYSIS OF FINANCIAL CONDITION AND RESULTS OF OPERATIONS |
The following is an analysis of the Company’s results of operations, liquidity and capital resources and should be read in conjunction with the Consolidated Financial Statements and notes related thereto included in this Annual Report on Form 10-K. To the extent that the following Management’s Discussion and Analysis contains statements which are not of a historical nature, such statements are forward-looking statements which involve risks and uncertainties. These risks include, but are not limited to the risks and uncertainties discussed in “Item 1A Risk Factors” in this Annual Report on Form 10-K. The following discussion and analysis should be read in conjunction with the Forward Looking Statements and “Item 1A Risk Factors” each included in this Annual Report on Form 10-K.
Business Overview
General
Sparton is a provider of complex and sophisticated electromechanical devices with capabilities that include concept development, industrial design, design and manufacturing engineering, production, distribution, and field service. In fiscal 2009, management initiated a full evaluation of our operations, including operating structure. This evaluation resulted in changes in fiscal 2010 to our analysis of how the components of Sparton’s business contribute to consolidated operating results and the overall level of desegregation of reported financial data, including the nature and number of operating segments, disclosure of segment information and the consistency of such information with internal management reports. The Company operates through three reportable business segments; Medical Device (“Medical”), Complex Systems (“CS”), formerly called Electronic Manufacturing Services (“EMS”), and Defense & Security Systems (“DSS”), which serves Defense, Security Systems, Navigation and Exploration markets. The electromechanical device end markets that Sparton, as a whole, serves are in Medical, Military & Aerospace and Industrial & Instrumentation. Effective for fiscal 2010, we report our operating results under these three reportable business segments. Prior to fiscal 2010, all of our operating units were aggregated into one line of business, EMS. The prior period presented herein reflects this change to segment reporting.
All of the Company’s facilities are registered to ISO standards, including 9001 or 13485, with most having additional certifications. The Company’s products and services include products for Original Equipment Manufacturers (“OEM”) and Emerging Technology (“ET”) customers that are microprocessor-based systems that include transducers, printed circuit boards and assemblies, sensors, and electromechanical components, as well as development and design engineering services relating to these product sales. Sparton also develops and manufactures sonobuoys, anti-submarine warfare (“ASW”) devices used by the United States Navy and other free-world countries. Many of the physical and technical attributes in the production of sonobuoys are similar to those required in the production of the Company’s other electrical and electromechanical products and assemblies.
The Company uses an internal management reporting system, which provides important financial data to evaluate performance and allocate the Company’s resources on a market segment basis. Net sales for segments are attributed to the segment in which the product is manufactured or service is performed. A segment’s performance is evaluated based upon its operating income (loss). A segment’s operating income (loss) includes its gross profit on sales less its selling and administrative expenses, but excludes some corporate and other unallocated items such as, interest expense, interest income, other income (expense) and income tax expense (benefit). Corporate and other unallocated costs primarily represent corporate administrative expenses related to those administrative, financial and human resource activities which are not allocated to operations and excluded from segment profit. These costs are not allocated to the segments, as management excludes such costs when assessing the performance of the segments. Inter-segment transactions are generally accounted for at amounts that approximate arm’s length transactions. The accounting policies for each of the segments are the same as for the Company taken as a whole.
25
Table of Contents
Medical Segment
Medical operations are comprised of contract development, design, production and distribution of complex and sophisticated medical related electromechanical devices for customers with specialized needs, specifically in the design and manufacturing process, to assure product reliability and safety in accordance with Food and Drug Administration (“FDA”) guidelines and approvals. This group specializes in systems and procedures targeted to the requirements of medical OEM and ET customers primarily in the In Vitro Diagnostic and Therapeutic Device segments of the Medical Device market space.
Complex Systems Segment
Complex Systems operations provides multiple industries with complex electronics systems offering end-to-end development and manufacturing solutions focused on high expectations of quality and delivery performance through a global footprint. As a vertically integrated business unit, this segment assists in providing its customers with seamless development of circuit card assemblies for integration into electro-mechanical solutions. By focusing on maximizing efficiency and cost containment at the various steps in the design, engineering, and manufacturing process, Complex Systems acts as an intelligent source and ideal partner for development firms and OEMs. This business unit is a supplier for low to medium volume/high complexity commercial and military aerospace applications, medical devices, telecommunications, energy, and industrial controls. Its current portfolio of product line applications include: flight controls, cock pit displays, fuel system controls, secure communications, early warning detection, diagnostics systems, security systems, detection systems, lighting, satellite communications, audio, nuclear detection, inventory control, and defense.
DSS Segment
DSS operations are comprised of design, development and production of products for a number of technologically significant programs aimed at fulfilling defense and commercial needs. Specializing in the development and production of complex electromechanical equipment, Sparton designs and manufactures sonobuoys, ASW devices used by the U.S. Navy and foreign governments. This business unit also performs an engineering development function for the United States military and prime defense contractors on advanced technologies targeted as future defense products as well as replacement of current systems. The sonobuoy product line is built to the customer’s demanding specifications. These products are restricted by International Tariff and Arms Regulations (“ITAR”), which limits opportunities for competition. Additionally, this business unit internally develops and markets commercial products based on its navigation and underwater acoustic knowledge and the intrinsic skill sets of its technical staff.
Risks and Uncertainties
Sparton, as a high-mix, low to medium volume supplier, provides rapid product turnaround for customers. High-mix describes customers needing multiple product types with generally low to medium volume manufacturing runs. As a contract manufacturer with customers in a variety of markets, the Company has substantially less visibility of end user demand and, therefore, forecasting sales can be problematic. Customers may cancel their orders, change production quantities and/or reschedule production for a number of reasons. Depressed economic conditions may result in customers delaying delivery of product, or the placement of purchase orders for lower volumes than previously anticipated. Unplanned cancellations, reductions, or delays by customers may negatively impact the Company’s results of operations. As many of the Company’s costs and operating expenses are relatively fixed within given ranges of production, a reduction in customer demand can disproportionately affect the Company’s gross margins and operating income. The majority of the Company’s sales have historically come from a limited number of customers. Significant reductions in sales to, or a loss of, one of these customers could materially impact our operating results if the Company were not able to replace those sales with new business.
26
Table of Contents
Other risks and uncertainties that may affect our operations, performance, growth forecasts and business results include, but are not limited to, timing and fluctuations in U.S. and/or world economies, sharp volatility of world financial markets over a short period of time, competition in the overall contract manufacturing business, availability of production labor and management services under terms acceptable to the Company, Congressional budget outlays for sonobuoy development and production, Congressional legislation, uncertainties associated with the outcome of litigation, changes in the interpretation of environmental laws and the uncertainties of environmental remediation and customer labor and work strikes. Further risk factors are the availability and cost of materials, as well as non-cancelable purchase orders we have committed to in relation to customer forecasts that can be subject to change. A number of events can impact these risks and uncertainties, including potential escalating utility and other related costs due to natural disasters, as well as political uncertainties such as the unrest in Africa and the Middle East. The February 2011 earthquake, tsunami and resultant nuclear disaster in Japan had the potential to cause availability and pricing issues relating to certain materials used within the Company’s products. The Company currently does not believe that the effects of these events will have a material impact on its business. Additional trends, risks and uncertainties that have arisen recently include dependence on key personnel, the impact on the Company’s pension plan and risks surrounding the Company’s recent acquisitions as well as uncertainties surrounding the global economy and U.S. healthcare legislation and the effects of those uncertainties on OEM behavior, including heighted inventory management, product development cycles and outsourcing strategies. Finally, the Sarbanes-Oxley Act of 2002, and more recently the Dodd-Frank Act have required or will require changes in, and formalization of, some of the Company’s corporate governance and compliance practices. The SEC and the New York Stock Exchange have also passed or will pass related rules and regulations requiring additional compliance activities. Compliance with these rules has increased administrative costs and may increase these costs further in the future. A further discussion of the Company’s risk factors has been included in Part I, Item 1(a), “Risk Factors”, of this Annual Report on Form 10-K. Management cautions readers not to place undue reliance on forward-looking statements, which are subject to influence by the enumerated risk factors as well as unanticipated future events.
Acquisition of Delphi Medical
On August 6, 2010, the Company completed the acquisition of certain assets related to the contract manufacturing business of Delphi Medical Systems, LLC (“Delphi Medical” or “Delphi”). The purchase price was approximately $8.6 million, including additional consideration paid during the three months ended December 31, 2010 related to determination of the final inventory value. Total cash consideration paid of approximately $8.4 million, including a $2.0 million escrowed holdback, was net of approximately $0.2 million for the assumption of retained employee accruals and was financed entirely through the use of Company cash. The purchase agreement provides for the recovery from Delphi Medical of an amount up to $2.0 million, deposited in escrow at closing, for certain excess and obsolete inventory remaining on-hand at the end of the 18 month period from closing. These escrowed funds are additionally available for payment of potential seller indemnification obligations in relation to the agreement.
The acquired business, also now referred to as Sparton Medical Systems (“SMS”) Colorado, which is reported in the Company’s Medical segment, has added revenue from a new and diversified customer base and provides Sparton with a geographic presence in the western United States. Delphi Medical primarily manufactures OEM medical devices including blood separation equipment, spinal surgery products and 3-D eye mapping devices. It also provides engineering and manufacturing support to a market-leading environmental sensor company whose markets include meteorology, weather critical operations and controlled environment applications.
27
Table of Contents
The following table summarizes, on a pro forma basis, the results of operations of the acquired contract manufacturing business of Delphi Medical as though the acquisition had occurred as of July 1, 2009. The pro forma amounts presented are not necessarily indicative of either the actual consolidated results had the acquisition occurred as of July 1, 2009 or of future consolidated operating results (in thousands):
| For the Years Ended June 30, | ||||||||||||||||
| 2011 | 2010 | |||||||||||||||
| Pre Acquisition |
Post Acquisition |
SMS Colorado Pro Forma |
SMS Colorado Pro Forma |
|||||||||||||
| Sales |
$ | 3,451 | $ | 39,004 | $ | 42,455 | $ | 30,733 | ||||||||
| Gross profit |
$ | 85 | $ | 5,856 | $ | 5,941 | $ | 123 | ||||||||
| Gain on acquisition |
$ | — | $ | (2,550 | ) | $ | (2,550 | ) | $ | — | ||||||
| Operating income (loss) |
$ | (85 | ) | $ | 5,741 | $ | 5,656 | $ | (1,612 | ) | ||||||
| Income (loss) before provision for (benefit from) income taxes |
$ | (77 | ) | $ | 6,019 | $ | 5,942 | $ | (973 | ) | ||||||
| Net income (loss) |
$ | (77 | ) | $ | 6,019 | $ | 5,942 | $ | (973 | ) | ||||||
Sparton did not identify any material intangible assets in this acquisition. Sparton has determined that the fair value of the assets acquired and liabilities assumed related to this acquisition exceed the total purchase consideration and as a result the Company recorded a gain on acquisition of $2.4 million in the three months ended September 30, 2010. The gain was subsequently increased by $0.2 million based on adjustments to the opening inventory valuation. Sparton believes it was able to purchase this contract manufacturing business from Delphi Medical significantly below its fair value due to Delphi’s desire to liquidate this asset in a timely manner and focus on its core business.
The Company incurred legal, professional and other costs related to this acquisition aggregating approximately $0.2 million. These costs were recognized as non-segment selling and administrative expenses of approximately $0.1 million and $0.1 million in the years ended June 30, 2011 and 2010, respectively. These expenses are not reflected in the above table.
On August 6, 2010 and concurrent with the acquisition of Delphi Medical, the Company entered into leases for two facilities housing the operations of this contract manufacturing business. During the year ended June 30, 2011, the Company initiated and completed the consolidation of the operations into one facility, and terminated the lease for the building which the Company exited.
Acquisition of Byers Peak
On March 4, 2011, the Company completed the acquisition of certain assets and assumption of certain liabilities of Byers Peak, Incorporated (“Byers Peak”) in an approximate $4.1 million all-cash transaction, after certain working capital adjustments. The transaction was financed through the use of Company cash and included an approximate $0.4 million holdback which is available to fund potential seller indemnification obligations in relation to the agreement.
The acquired business, also now referred to as BP Colorado, which is reported in the Company’s Medical segment, provides further expansion into the therapeutic device market, diversifies Sparton’s customer base, and further expands the Company’s geographic reach into the western United States. Additionally, the acquisition increases Sparton’s offerings with the inclusion of field service and refurbishment capabilities. Byers Peak primarily manufactures medical devices for OEM and emerging technology companies in the Therapeutic device market, including devices for surgical navigation, RF energy generation, non-invasive pain relief, arterial disease, and kidney dialysis. It also has a field service and installation group that primarily provides water filtration and disinfection systems for the medical industry as well as device refurbishment programs. Additionally, Byers Peak provides electromechanical device manufacturing support for a limited number of customers outside of the medical industry.
28
Table of Contents
The following table summarizes, on a pro forma basis, the results of operations of the acquired contract manufacturing business of Byers Peak as though the acquisition had occurred as of July 1, 2009. The pro forma amounts presented are not necessarily indicative of either the actual consolidated results had the acquisition occurred as of July 1, 2009 or of future consolidated operating results (in thousands):
| For the Years Ended June 30, | ||||||||||||||||
| 2011 | 2010 | |||||||||||||||
| Pre Acquisition |
Post Acquisition |
BP Colorado Pro Forma |
BP Colorado Pro Forma |
|||||||||||||
| Sales |
$ | 6,613 | $ | 3,316 | $ | 9,929 | $ | 8,313 | ||||||||
| Gross profit |
$ | 790 | $ | 226 | $ | 1,016 | $ | 1,241 | ||||||||
| Operating income (loss) |
$ | (103 | ) | $ | (63 | ) | $ | (166 | ) | $ | 162 | |||||
| Income (loss) before provision for (benefit from) income taxes |
$ | (103 | ) | $ | (63 | ) | $ | (166 | ) | $ | 162 | |||||
| Net income (loss) |
$ | (103 | ) | $ | (63 | ) | $ | (166 | ) | $ | 162 | |||||
Total purchase consideration was allocated to the tangible and identifiable intangible assets acquired and liabilities assumed based on their estimated fair values at the acquisition date. The Byers Peak acquisition resulted in approximately $1.5 million of goodwill, which is expected to be deductible for tax purposes and which was assigned entirely to the Company’s Medical segment. The Company believes goodwill primarily relates to the complementary strategic fit, resulting synergies and the acquired workforce that this business brings to existing operations. The acquired identifiable intangible assets, aggregating approximately $1.5 million, include customer relationships of $1.3 million and non-compete agreements of approximately $0.2 million. The fair values of acquired identifiable intangible assets were determined to be Level 3 under the fair value hierarchy and were estimated based on future cash flows and customer attrition rates, discounted using an estimated weighted average cost of capital. The customer relationships are being amortized using an accelerated methodology over ten years. The non-compete agreements are being amortized on a straight-line basis over two years as the ratable decline in value over time is most consistent with the contractual nature of these assets.
The Company incurred legal, professional and other costs related to this acquisition aggregating approximately $0.1 million. These costs were recognized as non-segment selling and administrative expenses in the year ended June 30, 2011. These expenses are not reflected in the above table.
On March 4, 2011 and concurrent with the acquisition of Byers Peak, the Company entered into a six month sublease for the facility housing the operations of this contract manufacturing business. The Company may, at its option, extend the term of this sublease for an additional eighteen month period. In conjunction with the Byers Peak acquisition, the Company has begun to consolidate the Byers Peak operations into the Company’s Frederick, Colorado facility. These restructuring activities are expected to be materially complete by the end of the Company’s fiscal 2012 second quarter.
29
Table of Contents
Consolidated Results of Operations
Summary
The major elements affecting net income (loss) for the year ended June 30, 2011 as compared to the year ended June 30, 2010 were as follows (in millions):
| Net income fiscal 2010 |
$ | 7.4 | ||||||
| Increased gross profit from acquired Medical businesses |
$ | 6.1 | ||||||
| Decreased gross profit on Strongsville Medical programs |
(1.8 | ) | ||||||
| Increased gross profit on Complex Systems programs |
2.7 | |||||||
| Decreased gross profit on DSS programs |
(0.4 | ) | ||||||
| Increased selling and administrative expenses |
(2.6 | ) | ||||||
| Increased internal research and development expenses |
(1.1 | ) | ||||||
| Decreased restructuring/impairment charges |
4.0 | |||||||
| Gain on acquisition |
2.6 | |||||||
| Lower gain on sale of property, plant and equipment |
(3.0 | ) | ||||||
| Impairment of intangible asset |
(3.7 | ) | ||||||
| Impairment of goodwill |
(13.2 | ) | ||||||
| Decreased carrying costs for closed facilities |
0.9 | |||||||
| Increased income tax benefit |
9.5 | |||||||
| Other, net |
0.1 | |||||||
|
|
|
|||||||
| Net change |
0.1 | |||||||
|
|
|
|||||||
| Net income fiscal 2011 |
$ | 7.5 | ||||||
|
|
|
Fiscal 2011 was impacted by:
| • | Incremental gross profit on Medical programs acquired from Delphi Medical and Byers Peak. |
| • | Decreased year-to-date gross profit on Medical programs from the Strongsville, Ohio facility due to decreased volume and related capacity utilization, unfavorable product mix and customer pricing adjustments, partially offset by various cost reduction initiatives. |
| • | Increased gross profit on Complex Systems programs due mainly to improved performance, favorable product mix, completion in fiscal 2010 of plant closures and consolidations and an aggressive continuous improvement program, partially offset by a decrease in sales volume. |
| • | Decreased gross profit on DSS programs due to decreases in sonobuoy sales to foreign governments and in engineering sales revenue, partially offset by higher U.S. Navy sonobuoy production in the current year and increased digital compass sales. |
| • | Increased selling and administrative expenses for the year reflecting additional expenses related to the Company’s Colorado facilities and increased business development expenses, partially offset by reduced information technology expenses. In addition, selling and administrative expenses were further impacted by charges from an unfavorable arbitration award related to a dispute with a disengaged customer, partially offset by reduced selling and administrative expenses resulting from the completion of the consolidation of Complex Systems facilities during fiscal 2010. |
| • | Internal research and development expenses of approximately $1.1 million in the year ended June 30, 2011 compared to none in fiscal 2010. |
| • | Restructuring/impairment charges of $0.1 million in the year ended June 30, 2011 compared to $4.1 million in fiscal 2010. |
| • | A small gain on sale of property, plant and equipment in fiscal 2011 compared to the $3.1 million fiscal 2010 gain on sale of the Company’s Bluewater Road property in Albuquerque, New Mexico. |
30
Table of Contents
| • | Fiscal 2011 impairment of intangible asset related to customer relationships acquired in conjunction with the Company’s purchase of Astro Instrumentation, LLC (“Astro”) in May 2006. |
| • | Fiscal 2011 impairment of goodwill relating to the Company’s purchase of Astro. |
| • | Reduced closed facility carrying costs due to sales of properties. |
| • | Fiscal 2011 reinstatement of deferred tax assets compared to fiscal 2010 income tax benefit related to a change in income tax carryback regulations. |
Presented below are more detailed comparative data and discussions regarding our consolidated and reportable segment results of operations for the year ended June 30, 2011 compared to the year ended June 30, 2010 and the year ended June 30, 2010 compared to the year ended June 30, 2009.
For the Year ended June 30, 2011 compared to the Year ended June 30, 2010
The following table presents consolidated statement of operations data as a percentage of net sales for the years ended June 30, 2011 and 2010 (dollars in thousands):
| 2011 | 2010 | |||||||||||||||
| Total | % of Sales | Total | % of Sales | |||||||||||||
| Net sales |
$ | 203,352 | 100.0 | % | $ | 173,977 | 100.0 | % | ||||||||
| Cost of goods sold |
170,184 | 83.7 | 147,394 | 84.7 | ||||||||||||
|
|
|
|
|
|
|
|
|
|||||||||
| Gross profit |
33,168 | 16.3 | 26,583 | 15.3 | ||||||||||||
| Selling and administrative expenses |
20,842 | 10.3 | 18,205 | 10.5 | ||||||||||||
| Internal research and development expenses |
1,110 | 0.5 | — | — | ||||||||||||
| Restructuring/impairment charges |
75 | 0.0 | 4,076 | 2.3 | ||||||||||||
| Gain on acquisition |
(2,550 | ) | (1.2 | ) | — | — | ||||||||||
| Gain on sale of property, plant and equipment, net |
(139 | ) | (0.1 | ) | (3,119 | ) | (1.8 | ) | ||||||||
| Impairment of intangible asset |
3,663 | 1.8 | — | — | ||||||||||||
| Impairment of goodwill |
13,153 | 6.5 | — | — | ||||||||||||
| Other operating expense, net |
843 | 0.4 | 1,699 | 1.0 | ||||||||||||
|
|
|
|
|
|
|
|
|
|||||||||
| Operating income (loss) |
(3,829 | ) | (1.9 | ) | 5,722 | 3.3 | ||||||||||
| Total other expense, net |
(114 | ) | (0.0 | ) | (198 | ) | (0.1 | ) | ||||||||
|
|
|
|
|
|
|
|
|
|||||||||
| Income (loss) before benefit from income taxes |
(3,943 | ) | (1.9 | ) | 5,524 | 3.2 | ||||||||||
| Benefit from income taxes |
(11,404 | ) | (5.6 | ) | (1,916 | ) | (1.1 | ) | ||||||||
|
|
|
|
|
|
|
|
|
|||||||||
| Net income |
$ | 7,461 | 3.7 | % | $ | 7,440 | 4.3 | % | ||||||||
|
|
|
|
|
|
|
|
|
|||||||||
The following table presents net sales by reportable segment for the years ended June 30, 2011 and 2010 (in thousands):
| 2011 | 2010 | |||||||||||||||||||
| Total | % of Total | Total | % of Total | % Change | ||||||||||||||||
| SEGMENT |
||||||||||||||||||||
| Medical |
$ | 98,028 | 48 | % | $ | 64,424 | 37 | % | 52 | % | ||||||||||
| Complex Systems |
49,835 | 25 | 57,423 | 33 | (13 | ) | ||||||||||||||
| DSS |
69,720 | 34 | 63,853 | 37 | 9 | |||||||||||||||
| Eliminations |
(14,231 | ) | (7 | ) | (11,723 | ) | (7 | ) | 21 | |||||||||||
|
|
|
|
|
|
|
|
|
|||||||||||||
| Totals |
$ | 203,352 | 100 | % | $ | 173,977 | 100 | % | 17 | |||||||||||
|
|
|
|
|
|
|
|
|
|||||||||||||
31
Table of Contents
The following table presents gross profit and gross profit as a percent of net sales by reportable segment for the years ended June 30, 2011 and 2010 (in thousands):
| 2011 | 2010 | |||||||||||||||
| Total | GP% | Total | GP% | |||||||||||||
| SEGMENT |
||||||||||||||||
| Medical |
$ | 12,938 | 13 | % | $ | 8,603 | 13 | % | ||||||||
| Complex Systems |
4,835 | 10 | 2,133 | 4 | ||||||||||||
| DSS |
15,395 | 22 | 15,847 | 25 | ||||||||||||
|
|
|
|
|
|||||||||||||
| Totals |
$ | 33,168 | 16 | $ | 26,583 | 15 | ||||||||||
|
|
|
|
|
|||||||||||||
The following table presents operating income (loss) and operating income (loss) as a percent of net sales for the years ended June 30, 2011 and 2010 (in thousands):
| 2011 | 2010 | |||||||||||||||
| Total | % of Sales | Total | % of Sales | |||||||||||||
| SEGMENT |
||||||||||||||||
| Medical |
$ | (8,011 | ) | (8 | )% | $ | 4,600 | 7 | % | |||||||
| Complex Systems |
1,586 | 3 | (2,150 | ) | (4 | ) | ||||||||||
| DSS |
10,869 | 16 | 13,150 | 21 | ||||||||||||
| Corporate and other unallocated |
(8,273 | ) | — | (9,878 | ) | — | ||||||||||
|
|
|
|
|
|||||||||||||
| Totals |
$ | (3,829 | ) | (2 | ) | $ | 5,722 | 3 | ||||||||
|
|
|
|
|
|||||||||||||
Medical
Medical sales in the year ended June 30, 2011 included $42.3 million of additional sales from the acquisitions of certain assets related to the contract manufacturing businesses of Delphi Medical and Byers Peak. Excluding these fiscal year 2011 incremental sales, legacy Medical sales decreased approximately $8.7 million in the year ended June 30, 2011 as compared with the prior year. This decrease in comparable sales was primarily due to decreased sales to two customers. Sales to one customer decreased by $4.8 million, reflecting the suspension of production during fiscal 2011 to make product enhancement modifications. The product enhancement modifications were made, however, the Company cannot predict at what level sales for this product will continue. Sales to another customer decreased by $3.8 million, reflecting this customer’s disengagement during fiscal 2011. Several other customers in the aggregate accounted for the remaining sales variance. Medical sales are dependent on a small number of key strategic customers. Siemens Diagnostics contributed 18% and 21% of consolidated company net sales during the years ended June 30, 2011 and 2010, respectively. Fenwal Blood Technologies, which became a customer with the Delphi acquisition, contributed 12% of consolidated company net sales during the year ended June 30, 2011. During the fourth quarter of fiscal 2011, Siemens notified the Company that it intends to dual source two of its larger programs with the Company beginning in fiscal 2012. Annual sales related to these programs aggregated approximately $27.8 million in fiscal 2011. While the Company cannot estimate the ultimate impact that this dual sourcing will have on its future annual sales, unless overall sales related to these programs increase, this dual sourcing is expected to have an adverse impact on fiscal 2012 sales from the Company’s Ohio facility. Medical backlog was approximately $42.3 million at June 30, 2011 compared to approximately $14.0 million at June 30, 2010, reflecting added backlog from the Company’s fiscal 2011 business acquisitions. Commercial orders, in general, may be rescheduled or cancelled without significant penalty, and, as a result, may not be a meaningful measure of future sales. A majority of the June 30, 2011 Medical backlog is currently expected to be realized in the next 12 months.
Gross profit varies from period to period and can be affected by a number of factors, including product mix, production efficiencies, capacity utilization, and costs associated with new program introduction. The gross profit
32
Table of Contents
percentage on Medical sales remained consistent at 13% for each of the years ended June 30, 2011 and 2010, respectively. These comparable margins on Medical sales reflect decreased capacity utilization at the Company’s Strongsville, Ohio facility, certain unfavorable product mix between the two periods and the loss of certain favorable materials pricing benefits in the prior year to customer pricing adjustments. These downward pressures on gross margin were offset by greater operating efficiencies resulting from the Company’s continued implementation of Lean Enterprise and its cost management efforts. Gross profit percentage on sales from the businesses acquired during fiscal 2011 was 14% for the period since acquisition.
Selling and administrative expenses relating to the Medical segment were $6.0 million and $3.5 million for the years ended June 30, 2011 and 2010, respectively. Reflected in the year ended June 30, 2011 are increased direct and allocated expenses related to the Company’s recent acquisitions of $2.7 million. Decreased selling and administrative expenses from the Ohio facility reflect lower bad debt expense and a decrease in allocated corporate selling and administrative expenses to the Ohio facility in the current fiscal year, partially offset by increased business development efforts in the current fiscal year and $0.4 million in charges related to an unfavorable arbitration award related to a dispute with a disengaged customer.
Restructuring/impairment charges relating to the Medical segment were $0.1 million for the year ended June 30, 2011 and related to the workforce reduction and facility consolidations at the Company’s Colorado facilities. No restructuring/impairment charges relating to the Medical segment were recognized in the prior year period. For a further discussion of the restructuring activity see Note 14, Restructuring Activities, of the “Notes to Consolidated Financial Statements” in this Annual Report on Form 10-K.
On August 6, 2010, the Company completed the acquisition of certain assets related to the contract manufacturing business of Delphi Medical. The Company determined that the fair value of the assets acquired and liabilities assumed related to this acquisition exceeded the total purchase consideration and as a result the Company recorded a gain on acquisition of $2.6 million during the year ended June 30, 2011. For a further discussion of this acquisition, see Note 3, Acquisitions, of the “Notes to Consolidated Financial Statements” in this Annual Report on Form 10-K.
In conjunction with its annual test of goodwill, the Company recorded a non-cash impairment charge of approximately $13.2 million during the fourth quarter of fiscal 2011 related to its Ohio reporting unit. The impairment reflects various downward trends in volume within the Company’s Ohio reporting unit, which was acquired in fiscal 2006, including the impact of a customer disengagement and Siemens’ fiscal 2011 fourth quarter notification of its intent to dual source certain programs with us as part of an overall dual sourcing strategy for certain of its critical programs. As a result of these downward trends in volume, the Company also recorded a non-cash impairment charge of approximately $3.7 million during the fourth quarter of fiscal 2011 related to its customer relationships intangible asset acquired with its Ohio Medical business in fiscal 2006. No impairments of goodwill or identifiable intangible assets occurred during fiscal 2010. See below in “Critical Accounting Policies and Estimates — Goodwill and Intangible Assets” for a complete discussion regarding these impairment charges and the contributing reasons.
Complex Systems
CS sales for the year ended June 30, 2011 decreased approximately $7.6 million as compared with last year. This decrease primarily reflects decreased sales to three customers, whose combined decrease totaled approximately $12.3 million from the prior year period. Sparton completed its disengagement with one of these customers, Honeywell, during the three months ended December 31, 2009. The decreases in sales to the remaining two customers reflect the year over year loss of certain programs with these customers and production delays due to customer engineering design changes. Partially offsetting these decreases, sales to another customer increased by approximately $1.1 million. CS sales include intercompany sales resulting primarily from the production of circuit boards that are then utilized in DSS product sales. Intercompany sales increased approximately $2.5 million in fiscal 2011 as compared to the prior year. These intercompany sales are eliminated
33
Table of Contents
in consolidation. Several other customers in the aggregate accounted for the remaining sales variance. One customer, Goodrich, contributed 9% and 13% of consolidated Company net sales during the years ended June 30, 2011 and 2010, respectively. CS backlog was approximately $29.5 million at June 30, 2011. Commercial orders, in general, may be rescheduled or cancelled without significant penalty, and, as a result, may not be a meaningful measure of future sales. A majority of the June 30, 2011 CS backlog is currently expected to be realized in the next 12 months.
The gross profit percentage on CS sales increased to 10% for the year ended June 30, 2011 compared to 4% for the year ended June 30, 2010. The year over year comparison reflects favorable product mix due to increased DSS product sales, improved performance, completion of the consolidation of CS operations in fiscal 2010 and an aggressive continuous improvement program, partially offset by the overall decrease in sales volume.
Selling and administrative expenses relating to the CS segment were $3.3 million for each of the years ended June 30, 2011 and 2010 as decreased expenses related to the consolidation of CS facilities during fiscal 2010 and decreased allocated corporate selling and administrative expenses were offset by increased business development and safety efforts in the current fiscal year.
Restructuring/impairment charges relating to the CS segment were $1.0 million for the year ended June 30, 2010. No restructuring/impairment charges relating to the CS segment were recognized in the current year period. For a further discussion of the restructuring activity see Note 14, Restructuring Activities, of the “Notes to Consolidated Financial Statements” in this Annual Report on Form 10-K.
DSS
DSS sales for the year ended June 30, 2011 increased by $5.9 million from the prior fiscal year, reflecting higher U.S. Navy sonobuoy production in the current year period and increased digital compass sales. Partially offsetting these increases were decreases in sonobuoy sales to foreign governments and in engineering sales revenue. Total sales to the U.S. Navy, including those through ERAPSCO, in the year ended June 30, 2011 and 2010 were approximately $61.7 million and $48.3 million, or 30% and 28%, respectively, of consolidated Company net sales for those year. Sonobuoy sales to foreign governments were $4.9 million and $13.9 million in the years ended June 30, 2011 and 2010, respectively. DSS backlog was approximately $65.5 million at June 30, 2011. A majority of the June 30, 2011 DSS backlog is currently expected to be realized within the next 12 to 16 months.
The gross profit percentage on DSS sales for the year ended June 30, 2011 was 22% compared to 25% for the year ended June 30, 2010. Gross profit percentage was adversely affected in the current year period by decreased sales to foreign governments as compared to the prior year period, partially offset by favorable product mix on increased U.S. Navy sonobuoy sales.
Selling and administrative expenses relating to the DSS segment were $3.4 million and $2.7 million for the years ended June 30, 2011 and 2010, respectively, reflecting increased direct selling and administrative expenses due to increased business development efforts in the current fiscal period.
Internal research and development expenses reflect costs incurred for the internal development of technologies for use in navigation, oil and gas exploration and port security. These costs include salaries and related expenses, contract labor and consulting costs, materials and the cost of certain research and development specific equipment. The Company incurred $1.1 million of internally funded research and development expenses in the year ended June 30, 2011. No internally funded research and development expense was recognized in fiscal 2010.
34
Table of Contents
Corporate and Other Unallocated
Total corporate selling and administrative expenses were $14.5 million and $14.7 million for the years ended June 30, 2011 and 2010, respectively, reflecting decreased information technology expenses, partially offset by increased business development expenses and fiscal 2011 legal, professional and travel expenses relating to acquisitions. Of these costs, $6.4 million and $6.0 million, respectively, were allocated to segment operations in these periods. Allocations of corporate selling and administrative expenses are based on the nature of the service provided and can fluctuate from period to period.
Other operating expenses were $0.3 million and $1.2 million for the years ended June 30, 2011 and 2010, respectively. These expenses primarily represent ongoing costs related to closed facilities and facilities held for sale. The Company sold its last remaining idled facility in February 2011.
Non-segment related restructuring/impairment charges were $3.1 million for the year ended June 30, 2010 and were related to relocation of the Company’s corporate office. No non-segment restructuring/impairment charges were recognized in the current year. For a further discussion of the restructuring activity see Note 14, Restructuring Activities, of the “Notes to Consolidated Financial Statements” in this Annual Report on Form 10-K.
Gain on sales of property, plant and equipment for the years ended June 30, 2011 and 2010 were $0.1 million and $3.1 million, respectively. The fiscal 2011 gain primarily reflects the gain on sale of the Company’s Bluewater Road property in Albuquerque, New Mexico. See Note 5, Property, Plant and Equipment, net, of the “Notes to Consolidated Financial Statements” in this Annual Report on Form 10-K for a further discussion of this sale. The fiscal 2010 gain reflects the gain on sale of our Coors Road property.
Interest expense consists of interest and fees on our outstanding debt and revolving credit facility (see Note 7, Debt, of the “Notes to Consolidated Financial Statements” in this Annual Report on Form 10-K), including amortization of financing costs. Interest expense was $0.7 million for the year ended June 30, 2011 compared to $0.8 million for the year ended June 30, 2010. The decrease primarily reflects the repayment of the Company’s line-of-credit and bank term debt with available cash on August 14, 2009.
The Company is responsible for income taxes within each jurisdiction in which it operates. The Company recorded an income tax benefit of approximately $11.4 million for the year ended June 30, 2011 compared to an income tax benefit of approximately $1.9 million for the year ended June 30, 2010. The fiscal 2011 income tax benefit reflects the June 30, 2011 reinstatement of approximately $11.7 million of deferred tax assets as the Company now believes it is more likely than not that it will be able to utilize these tax benefits in future periods. The fiscal 2010 benefit reflects the release of $2.3 million of deferred tax asset valuation allowance in relation to tax regulation changes related to carryback provisions. See Note 8, Income Taxes, of the “Notes to Consolidated Financial Statements” in this Annual Report on Form 10-K.
Due to the factors described above, the Company reported net income of $7.5 million ($0.73 per share, basic and diluted) for the year ended June 30, 2011, compared to net income of $7.4 million ($0.75 per share, basic and diluted) for the prior fiscal year.
35
Table of Contents
For the Year ended June 30, 2010 compared to the Year ended June 30, 2009
The following table presents consolidated statement of operations data as a percentage of net sales for the years ended June 30, 2010 and 2009 (dollars in thousands):
| 2010 | 2009 | |||||||||||||||
| Total | % of Sales | Total | % of Sales | |||||||||||||
| Net sales |
$ | 173,977 | 100.0 | % | $ | 221,871 | 100.0 | % | ||||||||
| Cost of goods sold |
147,394 | 84.7 | 205,985 | 92.8 | ||||||||||||
|
|
|
|
|
|
|
|
|
|||||||||
| Gross profit |
26,583 | 15.3 | 15,886 | 7.2 | ||||||||||||
| Selling and administrative expenses |
18,205 | 10.5 | 18,851 | 8.5 | ||||||||||||
| Restructuring/impairment charges |
4,076 | 2.3 | 7,008 | 3.2 | ||||||||||||
| Gain on sale of property, plant and equipment, net |
(3,119 | ) | (1.8 | ) | (10 | ) | — | |||||||||
| Other operating expense, net |
1,699 | 1.0 | 1,294 | 0.6 | ||||||||||||
|
|
|
|
|
|
|
|
|
|||||||||
| Operating income |
5,722 | 3.3 | (11,257 | ) | (5.1 | ) | ||||||||||
| Total other expense, net |
(198 | ) | (0.1 | ) | (2,709 | ) | (1.2 | ) | ||||||||
|
|
|
|
|
|
|
|
|
|||||||||
| Income before provision for (benefit from) income taxes |
5,524 | 3.2 | (13,966 | ) | (6.3 | ) | ||||||||||
| Provision for (benefit from) income taxes |
(1,916 | ) | (1.1 | ) | 1,787 | 0.8 | ||||||||||
|
|
|
|
|
|
|
|
|
|||||||||
| Net income (loss) |
$ | 7,440 | 4.3 | % | $ | (15,753 | ) | (7.1 | )% | |||||||
|
|
|
|
|
|
|
|
|
|||||||||
The following table presents net sales by reportable segment for the years ended June 30, 2010 and 2009 (in thousands):
| 2010 | 2009 | |||||||||||||||||||
| Total | % of Total | Total | % of Total | % Change | ||||||||||||||||
| SEGMENT |
||||||||||||||||||||
| Medical |
$ | 64,424 | 37 | % | $ | 64,393 | 29 | % | 0 | % | ||||||||||
| Complex Systems |
57,423 | 33 | 127,002 | 57 | (55 | ) | ||||||||||||||
| DSS |
63,853 | 37 | 42,289 | 19 | 51 | |||||||||||||||
| Eliminations |
(11,723 | ) | (7 | ) | (11,813 | ) | (5 | ) | (1 | ) | ||||||||||
|
|
|
|
|
|
|
|
|
|||||||||||||
| Totals |
$ | 173,977 | 100 | % | $ | 221,871 | 100 | % | (22 | ) | ||||||||||
|
|
|
|
|
|
|
|
|
|||||||||||||
The following table presents gross profit and gross profit as a percent of net sales by reportable segment for the years ended June 30, 2010 and 2009 (in thousands):
| 2010 | 2009 | |||||||||||||||
| Total | GP% | Total | GP% | |||||||||||||
| SEGMENT |
||||||||||||||||
| Medical |
$ | 8,603 | 13 | % | $ | 7,793 | 12 | % | ||||||||
| Complex Systems |
2,133 | 4 | 1,448 | 1 | ||||||||||||
| DSS |
15,847 | 25 | 6,645 | 16 | ||||||||||||
|
|
|
|
|
|||||||||||||
| Totals |
$ | 26,583 | 15 | $ | 15,886 | 7 | ||||||||||
|
|
|
|
|
|||||||||||||
36
Table of Contents
The following table presents operating income (loss) and operating income (loss) as a percent of net sales for the years ended June 30, 2010 and 2009 (in thousands):
| 2010 | 2009 | |||||||||||||||
| Total | % of Sales | Total | % of Sales | |||||||||||||
| SEGMENT |
||||||||||||||||
| Medical |
$ | 4,600 | 7 | % | $ | 3,731 | 6 | % | ||||||||
| Complex Systems |
(2,150 | ) | (4 | ) | (9,893 | ) | (8 | ) | ||||||||
| DSS |
13,150 | 21 | 4,093 | 10 | ||||||||||||
| Corporate and other unallocated |
(9,878 | ) | — | (9,188 | ) | — | ||||||||||
|
|
|
|
|
|||||||||||||
| Totals |
$ | 5,722 | 3 | $ | (11,257 | ) | (5 | ) | ||||||||
|
|
|
|
|
|||||||||||||
Medical
Medical sales remained consistent in the year ended June 30, 2010 as compared with the prior year, reflecting increases and decreases in volume from various customers. The year over year results reflect increased sales volume to one customer of $3.6 million, as it increased sales on new products. In addition, another customer contributed $1.7 million of sales above the same period in the prior year, as it acquired product and resumed production from a developer that was in bankruptcy during fiscal 2009. Sales volume to a third customer contributed $2.6 million of the increase over the prior year as its product received FDA approval. Offsetting these year over year increases, sales to two customers decreased by $2.6 million and $2.7 million, respectively, reflecting customer disengagements in fiscal 2009 and fiscal 2010, respectively. Several other customers in the aggregate accounted for the remaining sales variance. Siemens Diagnostics contributed 21% and 17% of consolidated Company net sales during the years ended June 30, 2010 and 2009, respectively.
Gross profit varies from period to period and can be affected by a number of factors, including product mix, production efficiencies, capacity utilization, and costs associated with new program introduction. The gross profit percentage on Medical sales increased to 13% from 12% for the years ended June 30, 2010 and 2009, respectively. This improvement in margins on Medical sales was due in part to favorable product mix and increased manufacturing efficiencies resulting from continued implementation of Lean Enterprise. In addition, changes from the recent consolidation of manufacturing operations allowed for the realization of greater operating efficiencies.
Complex Systems
CS sales for the year ended June 30, 2010 decreased approximately $69.6 million as compared with the prior year. This decrease reflects decreased sales to four customers, whose combined decrease totaled approximately $62.0 million for the year. Sparton disengaged with two of these customers as of June 30, 2009. Sparton completed its disengagement with a third customer, Honeywell, during the three months ended December 31, 2009. Honeywell contributed 2% and 19% of consolidated Company net sales during the years ended June 30, 2010 and 2009, respectively. The decrease in sales to the fourth customer reflects the loss of certain programs with this customer. Partially offsetting these decreases, sales to another customer, Goodrich, increased by approximately $4.4 million. Goodrich contributed 13% and 8% of consolidated Company net sales during the years ended June 30, 2010 and 2009, respectively. Several other customers in the aggregate accounted for the remaining sales variance. CS sales include intercompany sales resulting primarily from the production of circuit boards that are then utilized in DSS product sales. These intercompany sales are eliminated in consolidation.
The gross profit percentage on CS sales increased to 4% from 1% for the years ended June 30, 2010 and 2009, respectively. The improvement in gross profit was mainly attributable to the reduced overhead costs, including lower pension costs, associated with the plant closings and the consolidation of CS operations, as well as to the termination of certain unprofitable customer contracts, partially offset by the overall decrease in sales volume. Margin was also favorably impacted by improved performance and price increases to certain customers.
37
Table of Contents
DSS
DSS sales for the year ended June 30, 2010 were significantly above the prior fiscal year, showing an increase of $21.6 million, reflecting higher U.S. Navy product volume due to successful sonobuoy lot acceptance testing as well as an increase in the awarded annual Navy contracts in production and reflecting increased sonobuoy sales to foreign governments in the current fiscal year. Increased engineering sales revenue also contributed to the increase. Total sales to the U.S. Navy in the years ended June 30, 2010 and 2009 was approximately $48.3 million and $30.7 million, or 28% and 14%, respectively, of consolidated Company net sales for those periods. Sonobuoy sales to foreign governments were $13.9 million and $10.8 million in the years ended June 30, 2010 and 2009, respectively.
The gross profit percentage on DSS sales increased to 25% from 16% for the years ended June 30, 2010 and 2009, respectively. The improvement in gross margin reflects increased foreign sonobuoy sales which generated increased margins due to an improved pricing structure. Additionally, gross profit percentage was favorably affected by incurrence of minimal rework costs as a result of successful sonobuoy drop tests in the current year, reflecting improvement in production efficiency and the Company’s continued implementation of Lean Enterprise. Margin was also positively impacted by a significant increase in overall sales volume from the prior year.
Corporate and Other Unallocated
Segmented operating income (loss) includes both direct segment selling and administrative expenses as well as an allocation of certain corporate selling and administrative expenses. On a consolidated basis, selling and administrative expenses for the year ended June 30, 2010 decreased by approximately $0.6 million, compared to the prior year, reflecting decreased costs resulting from facility closings and cost reduction activities, legal fees in fiscal 2009 related to Electropac litigation, partially offset by increased expenses related to the Company’s short-term incentive plan and stock-based compensation. Total corporate selling and administrative expenses were $14.7 million and $14.9 million for the years ended June 30, 2010 and 2009, respectively. Of these costs, $6.1 million and $7.4 million, respectively, were allocated to segment operations in these periods. Allocations of corporate selling and administrative expenses are based on the nature of the service provided and can fluctuate from period to period.
Other operating expenses were $1.2 million and $0.8 million for the years ended June 30, 2010 and 2009, respectively. Expenses in both years primarily represent ongoing carrying costs for facilities held for sale, which are expected to decrease in future periods with the sale of the Jackson, Michigan and London, Ontario, Canada facilities in June 2010.
Restructuring/impairment charges were $4.1 million and $7.0 million for the years ended June 30, 2010 and 2009, respectively, of which $1.0 million and $6.0 million were included in the CS operating results for those periods. For a further discussion of the restructuring activity see Note 14, Restructuring Activities, of the “Notes to Consolidated Financial Statements” in this Annual Report on Form 10-K.
Gain on sale of property plant and equipment for the year ended June 30, 2010 reflects the gain on sale of our Coors Road property. See Note 2, Summary of Significant Accounting Policies, of the “Notes to Consolidated Financial Statements” in this Annual Report on Form 10-K for a further discussion of this sale.
Interest expense consists of interest and fees on our outstanding debt and revolving credit facility (see Note 7, Debt, of the “Notes to Consolidated Financial Statements” in this Annual Report on Form 10-K), including amortization of deferred financing costs. Interest expense was $0.8 million for the year ended June 30, 2010 compared to $1.6 million for the year ended June 30, 2009. The decrease primarily reflects the repayment of the Company’s line-of-credit and bank term debt with available cash on August 14, 2009.
38
Table of Contents
The fiscal 2010 year reflects a gain on sale of investment of $0.2 million from the sale of part of the Company’s interest in Cybernet Systems Corporation (“Cybernet”). See Note 2, Summary of Significant Accounting Policies, of the “Notes to Consolidated Financial Statements” in this Annual Report on Form 10-K for a further discussion of this sale. Translation adjustments, not related to cost of goods sold, along with gains and losses from foreign currency transactions, in the aggregate, amounted to losses of $23 thousand and $1.5 million for the years ended June 30, 2010 and 2009, respectively. The Canadian dollar experienced significant volatility against the U.S. dollar during the year ended June 30, 2009. With the closure of the Canadian facility, however, the impact in fiscal 2010 has not been significant and it is anticipated that future periods will not be significant. Other income was $0.4 million for each of the years ended June 30, 2010 and 2009.
The Company is responsible for income taxes within each jurisdiction in which it operates. The Company recorded an income tax benefit of approximately $1.9 million for the year ended June 30, 2010, compared to expense of $1.8 million for the prior year. The fiscal 2010 benefit reflects the release of $2.3 million of deferred tax asset valuation allowance in relation to recent tax regulation changes related to carryback provisions. See Note 8, Income Taxes, of the “Notes to Consolidated Financial Statements” in this Annual Report on Form 10-K for a further discussion of income taxes.
Due to the factors described above, the Company reported net income of $7.4 million ($0.75 per share, basic and diluted) for the year ended June 30, 2010, compared to a net loss of $15.8 million ($(1.61) per share, basic and diluted) for fiscal 2009.
Liquidity and Capital Resources
Certain of the Company’s DSS contracts allow for billings to occur when certain milestones under the applicable program are reached, independent of the amount shipped by Sparton as of such date. These advance billings reduce the amount of cash that would otherwise be required during the performance of these contracts. As of June 30, 2011 and June 30, 2010, $13.0 million and $21.6 million, respectively, of billings in excess of costs were received. The Company currently expects to meet its liquidity needs through a combination of sources including, but not limited to, operations, existing cash balances, its revolving line-of-credit, anticipated continuation of advance billings on certain DSS contracts and improvement in inventory management. With the above sources providing the expected cash flows, the Company currently believes that it will have sufficient liquidity for our anticipated needs over the next 12 months, but no assurances regarding liquidity can be made.
Operating activities provided $2.5 million, $19.9 million and $38.3 million of net cash flows in fiscal 2011, 2010 and 2009, respectively. Excluding changes in working capital, operating activities provided $13.2 million and $10.2 million in fiscal 2011 and 2010, respectively, and used $6.8 million in fiscal 2009, reflecting the Company’s relative operating performance during those years and for fiscal 2010 additionally reflecting income taxes recovered from net operating loss carrybacks. Working capital used $10.7 million in fiscal 2011 and provided $9.6 million and $45.1 million of net cash flows in fiscal 2010 and 2009, respectively. Fiscal 2011 working capital related cash flows primarily reflect funding of production related to U.S. Navy contracts during the year in excess of advance billings received, the initial working capital funding related the Company’s newly acquired Frederick, Colorado facility as well as a funding of a pension contribution during the period. Fiscal 2010 working capital related cash flows reflect reduced working capital requirements related to lower sales volumes due to customer disengagements, the closing of facilities and the Company’s continued inventory management efforts, offset by the funding of production related to U.S. Navy contracts during the year in excess of advance billings received as well as cash outlays relating to restructuring activities and a pension contribution made in the first quarter of fiscal 2010. Fiscal 2009 working capital related cash flows primarily reflect a decrease in inventories, primarily due to the Company’s focus on reducing the level of inventory carried and certain customer disengagements, as well as cash receipts from U.S. Government interim billings in excess of production costs.
39
Table of Contents
Cash flows used in investing activities in fiscal 2011, 2010 and 2009 totaled $8.5 million, $3.6 million and $2.2 million, respectively. Fiscal 2011 reflects the acquisition of certain assets related to the contract manufacturing business of Delphi Medical. The consideration paid of $8.4 million is net of assumed employee accrual adjustments. Fiscal 2011 also reflects the approximate $4.1 million acquisition of certain assets and assumption of certain liabilities of Byers Peak. These two purchases were financed entirely through the use of Company cash. Fiscal years 2010 and 2009 each reflect the payment of contingent purchase consideration to the prior owners of Astro Instrumentation, LLC (“Astro”). Fiscal 2010 also reflects the utilization of $3.1 million to establish a trust, the Sparton Corporation Financial Assurance Trust, related to environmental remediation activities at one of Sparton’s former facilities. The funds were held in Sparton’s name and were invested with Sparton receiving the benefit of the investment return. Investment returns on the funds during the year ended June 30, 2010 totaled approximately $0.1 million. These funds were available for use to satisfy the expected remediation liability reflected in the June 30, 2010 balance sheet. Fiscal 2011 reflects the Company’s dissolution of the trust during October 2010. For further discussion of this remediation activity, see “Part I, Item 3. Legal Proceedings.” Capital expenditures for the years ended June 30, 2011, 2010 and 2009 were approximately $3.2 million, $1.5 million and $1.2 million, respectively. Proceeds from the sale of property, plant and equipment for the years ended June 30, 2011, 2010 and 2009 were approximately $4.0 million, $3.1 million and $0.0 million, respectively. Fiscal 2011 proceeds from the sale of property, plant and equipment primarily represent the February 2011 sale of the Company’s Bluewater Road property in Albuquerque, New Mexico. Fiscal 2010 proceeds from the sale of property, plant and equipment related to the closings and sales of its Jackson, Michigan and London, Ontario, Canada facilities and the long-term lease of its Coors Road property in Albuquerque, New Mexico. In addition, fiscal 2010 reflects proceeds from the sale of a portion of the Company’s interest in Cybernet totaling approximately $0.5 million.
Cash flows provided by (used in) financing activities in fiscal 2011, 2010 and 2009 totaled $0.1 million, $(21.9 million) and $(2.7 million), respectively. The primary uses of cash from financing activities in fiscal 2011, 2010 and 2009 were the repayment of debt. Fiscal 2010 and 2009 also reflects the payment of financing fees related to the Company’s new revolving credit facility. The primary source of cash from financing activities in fiscal 2009 was from increased borrowings on the Company’s bank line-of-credit facility. In the year ended June 30, 2010, the Company paid off the existing balance on its line-of-credit facility totaling $15.5 million, and the $3.4 million remaining balance on its term loan, with National City Bank. Fiscal 2011 also reflects tax benefits in excess of recorded stock-based compensation.
As of June 30, 2011, the Company’s bank line-of-credit facility totaled $20.0 million, subject to certain collateral restrictions, with no borrowings against the available funds. The Company did have certain letters of credit outstanding against this facility totaling $0.5 million at June 30, 2011. This bank debt is subject to certain customary covenants which the Company was in compliance with at June 30, 2011. The maturity date for this line-of-credit is August 14, 2012. The Company also has approximately $1.8 million of industrial revenue bonds outstanding at June 30, 2011. See Note 7, Debt, of the “Notes to Consolidated Financial Statements” in this Annual Report on Form 10-K for a further discussion of the Company’s debt.
During fiscal 2009, management initiated a full evaluation of the Company’s operations and long-term business strategy. As a result, during the third quarter of fiscal 2009, management began to implement a formal turnaround plan focused on returning Sparton to profitability and the assurance of the Company’s viability. These measures were designed to reduce operating costs, increase efficiencies, and improve our competitive position in response to excess capacity, the prevailing economy and the need to optimize manufacturing resources. These restructuring activities included, among other actions, plant consolidation and closures, workforce reductions, customer contract disengagements, and changes in employee pension and health care benefits. During fiscal 2011, the Company took certain cost reduction actions in relation to its acquisition of certain assets related to the contract manufacturing business of Delphi Medical. These actions included a workforce reduction at the Colorado location and the consolidation of the Colorado manufacturing facilities from two to one. All of these restructuring activities are substantially completed as of June 30, 2011. In conjunction with the Byers Peak acquisition, the Company intends to consolidate the Byers Peak operations into the Company’s Frederick
40
Table of Contents
Colorado facility. These restructuring activities, which are expected to consist primarily of production moving costs, began in the Company’s fiscal 2011 fourth quarter and are expected to be materially complete by the end of the Company’s fiscal 2012 second quarter. The Company expects to incur less than $0.1 million of additional costs related to restructuring activities and has remaining restructuring related cash payments of approximately $0.2 million to be made during fiscal 2012.
On August 24, 2011, the Company’s Board of Directors approved a repurchase by Spartan Corporation of up to $3,000,000 of shares of its common stock over the next 24 months in open market, block transactions and privately negotiated transactions.
Commitments and Contingencies
Please see “Part I, Item 3. Legal Proceedings” for a discussion regarding our commitments and contingencies.
Contractual Obligations
Future minimum contractual cash obligations for the next five years and in the aggregate at June 30, 2011, are as follows (dollars in thousands):
| Payments Due By Period | ||||||||||||||||||||
| Total | Less than 1 Year |
2-3 Years | 4-5 Years | More than 5 Years |
||||||||||||||||
| Contractual obligations: |
||||||||||||||||||||
| Debt |
$ | 1,899 | $ | 136 | $ | 286 | $ | 317 | $ | 1,160 | ||||||||||
| Cash interest (1) |
638 | 99 | 178 | 148 | 213 | |||||||||||||||
| Operating leases (2) |
5,052 | 1,732 | 1,594 | 1,108 | 618 | |||||||||||||||
| Environmental liabilities |
4,222 | 459 | 567 | 534 | 2,662 | |||||||||||||||
| Pension contributions |
347 | 306 | 41 | — | — | |||||||||||||||
| Non-cancelable purchase orders |
29,564 | 29,564 | — | — | — | |||||||||||||||
|
|
|
|
|
|
|
|
|
|
|
|||||||||||
| Total |
$ | 41,722 | $ | 32,296 | $ | 2,666 | $ | 2,107 | $ | 4,653 | ||||||||||
|
|
|
|
|
|
|
|
|
|
|
|||||||||||
| (1) | Cash interest reflects interest payments on our Industrial Revenue Bonds discussed below. |
| (2) | Does not include payments due under renewals to the original lease terms. |
Debt — The Company’s debt currently consists of Ohio State Economic Development Revenue Bonds, series 2002-4 (“Industrial Revenue Bonds”). These bonds have interest rates which vary, dependent on the maturity date of the bonds ranging from 5.00% to 5.45%. The bonds carry certain sinking fund requirements generally obligating the Company to deposit funds into a sinking fund. The sinking fund requires the Company to make monthly deposits of one twelfth of the annual obligation plus accrued interest. The Company also has an irrevocable letter of credit in the amount of approximately $0.3 million, which is renewable annually, to secure repayment of a portion of the bonds.
The Company also has a revolving line of credit which it currently has not drawn upon. See Note 7, Debt, of the “Notes to Consolidated Financial Statements” in this Annual Report on Form 10-K of this report for a further discussion of this line of credit.
Operating leases — See Note 10, Commitments and Contingencies, of the “Notes to Consolidated Financial Statements” in this Annual Report on Form 10-K for further discussion of operating leases.
Environmental liabilities — See Note 10, Commitments and Contingencies, of the “Notes to Consolidated Financial Statements” in this Annual Report on Form 10-K of this report for a description of the accrual for environmental remediation. Of the $4.2 million total, $0.4 million is classified as a current liability and $3.8 million is classified as a long-term liability, both of which are included on the balance sheet as of June 30, 2011.
Pension liability — See Note 9, Employee Retirement Benefit Plans, of the “Notes to Consolidated Financial Statements” in this Annual Report on Form 10-K of this report for additional pension information.
41
Table of Contents
Non-cancelable purchase orders — Binding orders the Company has placed with suppliers that are subject to quality and performance requirements.
Off-Balance Sheet Arrangements
The Company has standby letters of credit outstanding of approximately $0.5 million at June 30, 2011, principally to support the Industrial Revenue bonds assumed from Astro and an operating lease agreement. Approximately $0.3 million is a letter of credit related to the Industrial Revenue bonds discussed above. Other than these standby letters of credit and the operating lease commitments included above, we have no off-balance sheet arrangements that would have a current or future material effect on our financial condition, changes in financial condition, revenue, expense, results of operations, liquidity, capital expenditures or capital resources.
Inflation
We believe that inflation has not had a significant impact in the past and is not likely to have a significant impact in the foreseeable future on our results of operations.
CRITICAL ACCOUNTING POLICIES AND ESTIMATES
The preparation of our consolidated financial statements in conformity with accounting principles generally accepted in the United States of America (“GAAP”) requires management to make estimates, judgments and assumptions that affect the amounts reported as assets, liabilities, revenues and expenses, and related disclosure of contingent assets and liabilities. Estimates are regularly evaluated and are based on historical experience and on various other assumptions believed to be reasonable under the circumstances. Actual results could differ from those estimates. In many cases, the accounting treatment of a particular transaction is specifically dictated by GAAP and does not require management’s judgment in application. There are also areas in which management’s judgment in selecting among available alternatives would not produce a materially different result. The Company believes that of its significant accounting policies discussed in Note 2 to the Consolidated Financial Statements, which is included in Item 8, the following involve a higher degree of judgment and complexity. Senior management has reviewed these critical accounting policies and related disclosures with the audit committee of Sparton’s Board of Directors.
Environmental Contingencies
One of Sparton’s former manufacturing facilities, located in Albuquerque, New Mexico (Coors Road), has been the subject of ongoing investigations and remediation efforts conducted with the EPA under the Resource Conservation and Recovery Act (“RCRA”). As discussed in Note 10, Commitments and Contingencies, of the “Notes to Consolidated Financial Statements” in this Annual Report on Form 10-K, Sparton has accrued its estimate of the minimum future non-discounted financial liability. The estimate was developed using existing technology and excludes legal and related consulting costs. The minimum cost estimate includes equipment, operating and monitoring costs for both onsite and offsite remediation. Sparton recognizes certain legal costs in the periods incurred and reviews its EPA accrual activity quarterly. Uncertainties associated with environmental remediation contingencies are pervasive and often result in wide ranges of reasonably possible outcomes. Estimates developed in the early stages of remediation can vary significantly. Normally a finite estimate of cost does not become fixed and determinable at a specific point in time. Rather, the costs associated with environmental remediation become estimable over a continuum of events and activities that help to frame and define a liability. Factors which cause uncertainties for the Company include, but are not limited to, the effectiveness of the current work plans in achieving targeted results and proposals of regulatory agencies for desired methods and outcomes. It is possible that cash flows and results of operations could be materially affected by the impact of changes associated with the ultimate resolution of this contingency. At June 30, 2011, the Company estimates that it is reasonably possible, but not probable, that future environmental remediation
42
Table of Contents
costs associated with the Company’s past operations at the Coors Road property, in excess of amounts already recorded and net of DOE reimbursement, could be up to $1.9 million before income taxes over the next approximately twenty years.
Government Contract Cost Estimates
Government production contracts are accounted for based on completed units accepted with respect to revenue recognition and their estimated average cost per unit regarding costs. Losses for the entire amount of the contract are recognized in the period when such losses are determinable. Significant judgment is exercised in determining estimated total contract costs including, but not limited to, cost experience to date, estimated length of time to contract completion, costs for materials, production labor and support services to be expended and known issues on remaining units to be completed. In addition, estimated total contract costs can be significantly affected by changing test routines and procedures, resulting design modifications and production rework from these changing test routines and procedures, and limited range access for testing these design modifications and rework solutions. Estimated costs developed in the early stages of contracts can change, sometimes significantly, as the contracts progress, and events and activities take place. Changes in estimates can also occur when new designs are initially placed into production. The Company formally reviews its costs incurred-to-date and estimated costs to complete on all significant contracts at least quarterly and revised estimated total contract costs are reflected in the financial statements. Advance billings in excess of inventoried costs are included in current liabilities. Depending upon the circumstances, it is possible that the Company’s financial position, results of operations and cash flows could be materially affected by changes in estimated costs to complete on one or more significant government contracts.
Commercial Inventory Valuation
Valuation of commercial customer inventories requires a significant degree of judgment. These valuations are influenced by the Company’s experience to date with both customers and other markets, prevailing market conditions for raw materials, contractual terms and customers’ ability to satisfy these obligations, environmental or technological materials obsolescence, changes in demand for customer products, and other factors resulting in acquiring materials in excess of customer product demand. Contracts with some commercial customers may be based upon estimated quantities of product manufactured for shipment over estimated time periods. Raw material inventories are purchased to fulfill these customer requirements. Within these arrangements, customer demand for products frequently changes, sometimes creating excess and obsolete inventories.
The Company regularly reviews raw material inventories by customer for both excess and obsolete quantities. Wherever possible, the Company attempts to recover its full cost of excess and obsolete inventories from customers or, in some cases, through other markets. When it is determined that the Company’s carrying cost of such excess and obsolete inventories cannot be recovered in full, a charge is taken against income for the difference between the carrying cost and the estimated realizable amount. The Company’s cost adjustments for excess and obsolete inventory is specific to individual parts. As a result, the adjustments create a new cost basis for those parts. The Company recorded inventory write-downs totaling approximately $0.2 million, $1.5 million and $3.0 million for the years ended June 30, 2011, 2010 and 2009, respectively. These charges are included in cost of goods sold for the periods presented. If inventory that has previously been impaired is subsequently sold, the amount of reduced cost basis is reflected as cost of goods sold. The Company experienced minimal subsequent sales of excess and obsolete inventory during the three years ended June 30, 2011 that resulted in higher gross margins due to previous write-downs. Such sales and the impact of those sales on gross margin were not material to the years presented. If assumptions the Company has used to value its inventory deteriorate in the future, additional write-downs may be required.
Allowance for Probable Losses on Receivables
The accounts receivable balance is recorded net of allowances for amounts not expected to be collected from customers. The allowance is estimated based on historical experience of write-offs, the level of past due
43
Table of Contents
amounts, information known about specific customers with respect to their ability to make payments, and future expectations of conditions that might impact the collectability of accounts. Accounts receivable are generally due under normal trade terms for the industry. Credit is granted, and credit evaluations are periodically performed, based on a customer’s financial condition and other factors. Although the Company does not generally require collateral, cash in advance or letters of credit may be required from customers in certain circumstances, including some foreign customers. When management determines that it is probable that an account will not be collected, it is charged against the allowance for probable losses. The Company reviews the adequacy of its allowance monthly. The allowance for doubtful accounts considered necessary was approximately $0.1 million and $0.5 million at June 30, 2011 and 2010, respectively. If the financial condition of customers were to deteriorate, resulting in an impairment of their ability to make payment, additional allowances may be required. Given the Company’s significant balance of government receivables and letters of credit from foreign customers, collection risk is considered minimal. Historically, uncollectible accounts have generally been insignificant, have generally not exceeded management’s expectations, and the allowance is deemed adequate.
Pension Obligations
The Company calculates the cost of providing pension benefits under the provisions of FASB Accounting Standards Codification (“ASC”) Topic 715, “Compensation — Retirement Benefits”, (“ASC Topic 715”). The key assumptions required within the provisions of ASC Topic 715 are used in making these calculations. The most significant of these assumptions are the discount rate used to value the future obligations and the expected return on pension plan assets. The discount rate is consistent with market interest rates on high-quality, fixed income investments. The expected return on assets is based on long-term returns and assets held by the plan, which is influenced by historical averages. If actual interest rates and returns on plan assets materially differ from the assumptions, future adjustments to the financial statements would be required. While changes in these assumptions can have a significant effect on the pension benefit obligation and the unrecognized gain or loss accounts disclosed in the Notes to the Consolidated Financial Statements, the effect of changes in these assumptions is not expected to have the same relative effect on net periodic pension expense in the near term. While these assumptions may change in the future based on changes in long-term interest rates and market conditions, there are no known expected changes in these assumptions as of June 30, 2011. As indicated above, to the extent the assumptions differ from actual results, there would be a future impact on the financial statements. The extent to which this will result in future expense is not determinable at this time as it will depend upon a number of variables, including trends in interest rates and the actual return on plan assets. The annual actuarial valuation of the pension plan is completed at the end of each fiscal year. Based on these valuations, net periodic pension expense prior to curtailment and settlement expenses for fiscal 2011 was calculated to be $0.2 million compared to $0.5 million and $1.0 million for fiscal 2010 and fiscal 2009, respectively.
Effective April 1, 2009, participation and the accrual of benefits in the Company’s pension plan were frozen, at which time all participants became fully vested. As a result of this freeze, an approximate $0.3 million curtailment charge was recognized during the year ended June 30, 2009, related to the acceleration of all remaining prior service costs previously being amortized over future periods. In addition, lump-sum benefit distributions during fiscal 2011, fiscal 2010 and fiscal 2009 exceeded plan service and interest costs, resulting in lump-sum settlement charges of approximately $0.1million, $0.8 million and $1.1 million also being recognized during the respective years. These settlement charges resulted from several business and economic factors that have affected the measurement of the plan’s projected benefit obligation in recent years, including the recent management actions described above, changes in the plan’s benefit formula, the timing of participants’ retirement, changes in assumed interest rates, variation in investment returns, and the amounts of lump-sum distributions paid. The components of net periodic pension expense are detailed in Note 9, Employee Retirement Benefit Plans, of the “Notes to Consolidated Financial Statements” in this Annual Report on Form 10-K.
44
Table of Contents
Business Combinations
The Company accounts for business combinations under the acquisition method of accounting in accordance with ASC Topic 805, “Business Combinations”. Accordingly, the Company recognizes amounts for identifiable assets acquired and liabilities assumed equal to their estimated acquisition date fair values. Transaction and integration costs associated with business combinations are expensed as incurred. Any excess of the acquisition price over the estimated fair value of net assets acquired is recorded as goodwill while any excess of the estimated fair value of net assets acquired over the acquisition price is recorded in current earnings as a gain.
The Company makes various assumptions in estimating the fair values of assets acquired and liabilities assumed. As fair value is a market-based measurement, it is determined based on the assumptions that market participants would use. The most significant assumptions typically relate to the estimated fair values of inventory and intangible assets, including customer lists and non-compete agreements. Management arrives at estimates of fair value based upon assumptions it believes to be reasonable. These estimates are based on historical experience and information obtained from the management of the acquired business and is inherently uncertain. Critical estimates in valuing certain intangible assets include but are not limited to: future expected discounted cash flows from customer relationships and contracts assuming similar product platforms and completed projects; the acquired company’s market position, as well as assumptions about the period of time the acquired customer relationships will continue to generate revenue streams; and attrition and discount rates. Unanticipated events and circumstances may occur which may affect the accuracy or validity of such assumptions, estimates or actual results, particularly with respect to amortization periods assigned to identifiable intangible assets.
Valuation of Property, Plant and Equipment
The Company records an impairment charge on our investment in property, plant and equipment that we hold and use in our operations if and when management determines that the related carrying values may not be recoverable. If one or more impairment indicators are deemed to exist, Sparton will measure any impairment of these assets based on current independent appraisals or a projected discounted cash flow analysis using a discount rate determined by management to be commensurate with the risk inherent in our business model. Our estimates of cash flows require significant judgment based on our historical and anticipated operating results and are subject to many factors.
During the years ended June 30, 2010 and 2009, the Company recognized impairment charges of approximately $1.4 million and $2.1 million, respectively, related to the restructuring related activities, primarily related to the closures of the Company’s Jackson, Michigan, London, Ontario, Canada and Albuquerque, New Mexico facilities.
Goodwill and Intangible Assets
The Company tests for possible goodwill impairment annually or more often should events or changes in circumstances indicate the carry value of the goodwill may not be recoverable. The test is conducted at the reporting unit level. Sparton has three reportable business segments (Medical, Complex Systems, and DSS). Complex Systems and DSS each consist of a single reporting unit. Medical, within which all of the Company’s goodwill resides, consists of two reporting units: (i) the Company’s Ohio business purchased from Astro during fiscal 2006 and holding the goodwill related to the Astro purchase; and (ii) the Company’s Colorado businesses acquired from Delphi and Byers Peak during fiscal 2011 and holding the goodwill related to the Byers Peak acquisition. For fiscal 2011, goodwill impairment testing was conducted on these two Medical segment reporting units. The impairment analysis is a two step process. The first step is to identify a potential impairment by comparing the fair value of a reporting unit with its carrying value. If the fair value of the reporting unit exceeds the carrying value of the net assets assigned to the reporting unit, goodwill is considered not impaired and the Company is not required to perform further testing. If the carrying value of the net assets assigned to the reporting unit exceeds the fair value of the reporting unit, then management will perform the second step of the
45
Table of Contents
impairment test in order to determine the implied fair value of the goodwill of the reporting unit. If the carrying value of a reporting unit’s goodwill exceeds its implied fair value, then the Company would record an impairment loss equal to the difference.
Sparton determines the fair value of its reporting units, with the assistance of an independent valuation firm, based upon a combination of the income approach (discounted cash flow method) and market approach (market comparable model) methodologies. In concluding on the fair value estimates of its reporting units, the income approach is given a 75% weighting and the market approach is given a 25% weighting based on the quality and suitability of information available in performing the income approach, relative to the market approach.
The income approach methodology utilized in estimating the fair value of the Company’s reporting units for purposes of the goodwill impairment testing requires various judgmental assumptions about revenues, operating margins, growth rates, working capital requirements and appropriate discount rate. In determining those judgmental assumptions, Sparton considers a variety of data, including, for each reporting unit, its annual budget for the upcoming year, its longer-term business plan, anticipated future cash flows, market data, and historical cash flow growth rates. The key assumptions used to estimate the fair value of the Company’s reporting units under the discounted cash flow method are: (i) projected revenue growth over a five-year period; (ii) projected operating margins over a five-year period; (iii) projected terminal growth rate; and (iv) a weighted-average cost of capital.
Under the market approach, the value of each of the Company’s reporting units is estimated by comparing it to publicly-traded firms in similar lines of business and geographic markets. The market approach takes into account, among other things, the market value of total invested capital to earnings before interest, taxes, depreciation and amortization (EBITDA) multiples of comparable companies. The selected multiples are then applied to the reporting unit’s projected EBITDA to arrive at an indicated range of value.
The Company’s fiscal 2011 annual test of goodwill related to its Colorado reporting unit did not indicate that the related goodwill was impaired. The Company determined that the fair value of the reporting unit substantially exceeded its carrying value, having exceeded its carrying value by approximately 126%.
The Company’s fiscal 2010 annual test of goodwill related to its Ohio reporting unit did not indicate that the related goodwill was impaired. The Company determined at that time that the fair value of the reporting unit substantially exceeded its carrying value, having exceeded its carrying value by approximately 30%. The Company’s fiscal 2011 annual test of goodwill related to its Ohio reporting unit did indicate that the related goodwill was impaired. The Company determined that the carrying value of the reporting unit exceeded its fair value, requiring Sparton to compare the carrying value of this goodwill to its implied fair value, which resulted in a non-cash impairment charge of approximately $13.2 million being recorded during the fourth quarter of fiscal 2011 to record this asset at its fair value of $6.0 million.
The drop in fair value between fiscal 2010 and fiscal 2011 reflects various downward trends in volume within the Company’s Ohio reporting unit, which was acquired in fiscal 2006, including the impact of a customer disengagement and Siemens’ fiscal 2011 fourth quarter notification of its intent to dual source certain programs with us as part of an overall dual sourcing strategy for certain of its critical programs. The Company’s assumptions used to estimate the fair value of the Medical segment’s Ohio reporting unit in fiscal 2011 reflect the Company’s current outlook for this reporting unit and reflect the effects of the events and uncertainties mentioned above, including but not limited to, lower expected revenues and lower expected operating margins than reflected in the Company’s fiscal 2010 goodwill impairment analysis. Determining the fair value of any reporting unit and intangible asset is judgmental in nature and involves the use of significant estimates and assumptions. The Company bases its fair value estimates on assumptions believed to be reasonable, but which are unpredictable and inherently uncertain. Actual future results may differ from those estimates. Circumstances that may lead to future impairment of goodwill include, but are not limited to, unforeseen decreases in future performance or industry demand, as well as further loss of a significant customer or program in excess of future incremental new business wins. The next annual goodwill impairment reviews are expected to be performed during the fourth quarter of fiscal 2012.
46
Table of Contents
The Company’s intangible assets other than goodwill represent the values assigned to customer relationships acquired in conjunction with the Company’s purchases of Astro and Byers Peak and values assigned to non-compete agreements acquired in conjunction with the Company’s purchase of Byers Peak. All of the Company’s intangible assets are included within the Medical segment. The impairment test for these intangible assets is conducted when impairment indicators are present. The Company continually evaluates whether events or circumstances have occurred that would indicate the remaining estimated useful lives of its intangible assets warrant revision or that the remaining balance of such assets may not be recoverable. The Company uses an estimate of the related undiscounted cash flows over the remaining life of the asset in measuring whether the asset is recoverable. If the carrying amount of an asset exceeds its estimated undiscounted future cash flows, an impairment charge would be recognized for the amount that the carrying amount of the asset exceeds the fair value of the asset.
As noted above, during the fourth quarter of fiscal 2011, the Company was notified by Siemens that it intends to dual source two of its larger programs with the Company beginning in fiscal 2012. Siemens was acquired as a customer in conjunction with the Company’s purchase of Astro and as such Sparton considered Siemens’ dual sourcing of these two programs to be an impairment indicator requiring impairment review of the related intangible asset. This impairment review, which was conducted during the fourth quarter of fiscal 2011, concluded that the carrying value of this intangible asset was not fully recoverable and consequently a non-cash impairment charge of approximately $3.7 million was recorded during the fourth quarter of fiscal 2011 to record this asset at its fair value of $0.7 million. The other business events and uncertainties described above in relation to the Medical segment’s Ohio reporting unit were also contributing factors to the Astro customer relationship impairment charge. As part of the impairment review, the estimated remaining useful life of this asset was evaluated with the Company determining that no change was warranted.
During fiscal 2011 and in previous years, the customer relationships acquired in conjunction with the Company’s purchase of Astro have been amortizing on a straight-line basis over 15 years. The straight-line method has been used to amortize these identified intangible assets because the Company believed that the expected undiscounted cash flows were reasonably consistent with a ratable decline in value over time. Beginning in fiscal 2012, the remaining customer relationships acquired in conjunction with the Company’s purchase of Astro will be amortized using an accelerated methodology on its remaining life as the Company now believes that this more reasonably reflects the expected future undiscounted cash flows of the asset. The customer relationships acquired in conjunction with the Company’s purchase of Byers Peak are also being amortized using an accelerated methodology over ten years. The Company’s non-compete agreements are being amortized on a straight-line basis over two years as the ratable decline in value over time is most consistent with the contractual nature of these assets.
Income Taxes
As part of the process of preparing our consolidated financial statements we are required to estimate our taxes in each of the jurisdictions in which we operate. This process involves management estimating the actual current tax expense together with assessing temporary differences resulting from differing treatment of items for tax and accounting purposes. These differences result in deferred tax assets and liabilities, which are included within the consolidated balance sheets. We must then assess the likelihood that the deferred tax assets will be recovered from future taxable income and to the extent recovery is not likely, we must establish a valuation allowance. Future taxable income depends on the ability to generate income in excess of allowable deductions. To the extent we establish a valuation allowance or change this allowance in a period, an expense/benefit is recorded within the tax provision in the consolidated statement of operations.
In 2010 and 2009, the Company recorded valuation allowances against substantially all of its net deferred tax assets as management believed that the realization of the deferred tax assets related to the net operating loss carryovers and the other net temporary timing differences while possible, was not more likely than not. In 2011, the Company restored a large portion of the deferred tax assets as the Company now believes that the realization
47
Table of Contents
of the remaining net operating loss carryovers and the other net temporary timing differences is more likely than not, based on achieved levels of profitability over the past two fiscal years combined with the expectation of future profitability. In making these decisions to both record a valuation allowance and restore the net deferred tax assets, the Company considered all available positive and negative evidence, including future reversals of taxable temporary differences, projected future taxable income, tax planning strategies, and recent financial results.
Significant management judgment is required in determining our provision for income taxes, our deferred tax assets and liabilities and any valuation allowance recorded against net deferred tax assets. In the event that actual results differ from these estimates or we adjust these estimates in future periods, we may need to change the valuation allowance that could materially impact our financial condition and results of operations.
In addition, significant judgment and estimates would be required in determining how to account for uncertain tax positions the Company might take in the next twelve months. The Company believes its income tax filing positions and deductions will be sustained on audit and does not anticipate any adjustments that will result in a material adverse effect on the Company’s financial condition, results of operations or cash flow. Pursuant to FASB ASC Topic 740, no liability has been recorded for uncertain tax positions.
Stock-Based Compensation
ASC Topic 718, “Share-Based Payment”, requires significant judgment and the use of estimates in the assumptions for the model used to value the share-based payment awards, including stock price volatility, and expected option terms. In addition, expected forfeiture rates for the share-based awards must be estimated. Because of our small number of option grants during our history, we are limited in our historical experience to use as a basis for these assumptions. While we believe that the assumptions and judgments used in our estimates are reasonable, actual results may differ from these estimates under different assumptions or conditions.
New Accounting Pronouncements
In July 2010, the FASB issued Accounting Standards Update (“ASU”) No. 2010-20, “Disclosures about the Credit Quality of Financing Receivables and the Allowance for Credit Losses”, (“ASU 2010-20”). This update enhances the disclosure requirements about the credit quality and related allowance for credit losses of financing receivables. ASU 2010-20 was effective for Sparton in the second quarter of fiscal 2011. The adoption of this disclosure guidance did not have a significant impact on the Company’s consolidated financial statements.
In December 2010, the FASB issued ASU No. 2010-29, “Business Combinations (Topic 805): Disclosure of Supplementary Pro Forma Information for Business Combinations”, which specifies that when a public company completes a business combination(s), the company should disclose revenue and earnings of the combined entity as though the business combination(s) occurred as of the beginning of the comparable prior annual reporting period. This standard also expands the supplemental pro forma disclosures under Topic 805 to include a description of the nature and amount of material, nonrecurring pro forma adjustments directly attributable to the business combination included in the pro forma revenue and earnings. The requirements in this standard are effective for business combinations that occur on or after the beginning of the first annual reporting period beginning on or after December 15, 2010. The Company will apply the provisions of ASU 2010-29 on a prospective basis. The adoption of this guidance is not expected to have a significant impact on the Company’s consolidated financial statements.
In May 2011, the FASB issued ASU No. 2011-04, “Fair Value Measurement (Topic 820): Amendments to Achieve Common Fair Value Measurement and Disclosure Requirements in U.S. GAAP and IFRSs”, which is intended to improve comparability of fair value measurements presented and disclosed in financial statements prepared in accordance with U.S. generally accepted accounting principles and International Financial Reporting Standards. This standard clarifies the application of existing fair value measurement requirements including
48
Table of Contents
(1) the application of the highest and best use valuation premise, (2) the methodology to measure the fair value of an instrument classified in a reporting entity’s shareholders’ equity, (3) disclosure requirements for quantitative information on Level 3 fair value measurements and (4) guidance on measuring the fair value of financial instruments managed within a portfolio. In addition, the standard requires additional disclosures of the sensitivity of fair value to changes in unobservable inputs for Level 3 securities. This standard is effective for interim and annual reporting periods ending on or after December 15, 2011. The adoption of this guidance is not expected to have a significant impact on the Company’s consolidated financial statements.
In June 2011, the FASB issued ASU No. 2011-05, “Presentation of Comprehensive Income”, which requires that comprehensive income be presented either in a single continuous statement of comprehensive income or in two separate but consecutive statements. The standard also requires entities to disclose on the face of the financial statements reclassification adjustments for items that are reclassified from other comprehensive income to net earnings. This standard no longer allows companies to present components of other comprehensive income only in the statement of equity. This standard is effective for interim and annual reporting periods ending on or after December 15, 2011. The adoption of this guidance is not expected to have a significant impact on the Company’s consolidated financial statements other than the prescribed change in presentation.
| ITEM 7A. | QUANTITATIVE AND QUALITATIVE DISCLOSURES ABOUT MARKET RISK |
The Company manufactures its products in the United States and Vietnam. We ceased manufacturing in Canada during the fourth quarter of fiscal 2009. Sales are to the U.S. as well as other foreign markets. The Company is potentially subject to foreign currency exchange rate risk relating to intercompany activity and balances and to receipts from customers and payments to suppliers in foreign currencies. Also, adjustments related to the translation of the Company’s Vietnamese financial statements into U.S. dollars are included in current earnings. As a result, the Company’s financial results could be affected by factors such as changes in foreign currency exchange rates or economic conditions in the domestic and foreign markets in which the Company operates. However, minimal third party receivables and payables are denominated in foreign currency and the related market risk exposure is considered to be immaterial. Historically, foreign currency gains and losses related to intercompany activity and balances have not been significant. However, due to the greater volatility of the Canadian dollar, the impact of transaction and translation losses increased in fiscal 2009. With the closure of the Canadian facility, however, the impact in fiscal 2011 and fiscal 2010 has not been significant and it is anticipated that future periods will not be significant.
The Company’s revolving credit line, if drawn upon, is subject to future interest rate fluctuations which could potentially have a negative impact on cash flows of the Company. The Company is not party to any currency exchange or interest rate protection agreements as of June 30, 2011.
| ITEM 8. | FINANCIAL STATEMENTS AND SUPPLEMENTARY DATA |
Our financial statements required by this item are submitted as a separate section of this Annual Report on Form 10-K. See “Index to Consolidated Financial Statements,” commencing on page F-1 hereof.
| ITEM 9. | CHANGES IN AND DISAGREEMENTS WITH ACCOUNTANTS ON ACCOUNTING AND FINANCIAL DISCLOSURE |
None.
49
Table of Contents
| ITEM 9A. | CONTROLS AND PROCEDURES |
Evaluation of Disclosure Controls and Procedures
Each of our Chief Executive Officer and Chief Financial Officer has evaluated the effectiveness of our disclosure controls and procedures (as such term is defined in Rules 13a-15(e) and 15d-15(e) under the Securities and Exchange Act of 1934) as of the end of the period covered by this Annual Report. Based on such evaluation, such officers have concluded that, as of the end of the period covered by this Annual Report, our disclosure controls and procedures are effective.
There have been no changes in our internal control over financial reporting (as such term is defined in Rules 13a-15(f) and 15d-15(f) under the Securities and Exchange Act of 1934) during the quarter ended June 30, 2011 that have materially affected, or are reasonably likely to materially affect, our internal control over financial reporting.
50
Table of Contents
Management Report on Internal Control over Financial Reporting
Our management is responsible for establishing and maintaining adequate internal control over financial reporting. Our internal control system was designed to provide reasonable assurance to our management and board of directors regarding the reliability of financial reporting and the preparation of financial statements for external purposes in accordance with generally accepted accounting principles.
Any internal control system, no matter how well designed, has inherent limitations and may not prevent or detect misstatements. Accordingly, even those systems determined to be effective can provide only reasonable assurance with respect to financial statement preparation and presentation.
We acquired Byers Peak, Incorporated (“Byers Peak”) on March 4, 2011. Because of the late date of the acquisition within the Company’s fiscal year, management was unable to perform the necessary level of documentation and testing to provide a formal report assessing the effectiveness of Byers Peak’s internal control over financial reporting. Therefore, management has excluded from the evaluation of internal control over financial reporting the internal controls of Byers Peak as permitted by Securities and Exchange Commission Staff interpretive guidance for newly acquired businesses.
Our management conducted an assessment of the effectiveness of our internal control over financial reporting as of June 30, 2011. This assessment was based on the criteria set forth by the Committee of Sponsoring Organizations of the Treadway Commission, or COSO, in Internal Control — Integrated Framework. Based on this assessment, management believes that, as of June 30, 2011, our internal control over financial reporting was effective.
BDO USA, LLP, our independent registered public accounting firm, issued an attestation report on the effectiveness of our internal control over financial reporting. Their report appears below.
| /S/ CARY B. WOOD |
/S/ GREGORY A. SLOME | |||
| Cary B. Wood President and Chief Executive Officer September 7, 2011 |
Gregory A. Slome Senior Vice President and Chief Financial Officer September 7, 2011 |
51
Table of Contents
REPORT OF INDEPENDENT REGISTERED PUBLIC ACCOUNTING FIRM
To the Board of Directors and Shareholders of
Sparton Corporation
Schaumburg, Illinois
We have audited Sparton Corporation’s internal control over financial reporting as of June 30, 2011, based on criteria established in Internal Control — Integrated Framework issued by the Committee of Sponsoring Organizations of the Treadway Commission (the COSO criteria). Sparton Corporation’s management is responsible for maintaining effective internal control over financial reporting and for its assessment of the effectiveness of internal control over financial reporting, included in the accompanying Item 9A, Management Report on Internal Control Over Financial Reporting. Our responsibility is to express an opinion on the Company’s internal control over financial reporting based on our audit.
We conducted our audit in accordance with the standards of the Public Company Accounting Oversight Board (United States). Those standards require that we plan and perform the audit to obtain reasonable assurance about whether effective internal control over financial reporting was maintained in all material respects. Our audit included obtaining an understanding of internal control over financial reporting, assessing the risk that a material weakness exists, and testing and evaluating the design and operating effectiveness of internal control based on the assessed risk. Our audit also included performing such other procedures as we considered necessary in the circumstances. We believe that our audit provides a reasonable basis for our opinion.
A company’s internal control over financial reporting is a process designed to provide reasonable assurance regarding the reliability of financial reporting and the preparation of financial statements for external purposes in accordance with generally accepted accounting principles. A company’s internal control over financial reporting includes those policies and procedures that (1) pertain to the maintenance of records that, in reasonable detail, accurately and fairly reflect the transactions and dispositions of the assets of the company; (2) provide reasonable assurance that transactions are recorded as necessary to permit preparation of financial statements in accordance with generally accepted accounting principles, and that receipts and expenditures of the company are being made only in accordance with authorizations of management and directors of the company; and (3) provide reasonable assurance regarding prevention or timely detection of unauthorized acquisition, use, or disposition of the company’s assets that could have a material effect on the financial statements.
Because of its inherent limitations, internal control over financial reporting may not prevent or detect misstatements. Also, projections of any evaluation of effectiveness to future periods are subject to the risk that controls may become inadequate because of changes in conditions, or that the degree of compliance with the policies or procedures may deteriorate.
As indicated in the accompanying Item 9A, Management Report on Internal Control over Financial Reporting, management’s assessment of and conclusion on the effectiveness of internal control over financial reporting did not include the internal controls of Byers Peak, Incorporated (Byers Peak), which was acquired on March 4, 2011, and which is included in the consolidated balance sheet of Sparton Corporation as of June 30, 2011, and the related consolidated statements of operations, cash flows and shareholders’ equity for the year then ended. Byers Peak constituted 1.6% and 0.8% of net sales and net income, respectively, for the year then ended. Management did not assess the effectiveness of internal control over financial reporting of Byers Peak because of the timing of the acquisition which was completed on March 4, 2011. Our audit of internal control over financial reporting of Sparton Corporation also did not include an evaluation of the internal control over financial reporting of Byers Peak.
In our opinion, Sparton Corporation maintained, in all material respects, effective internal control over financial reporting as of June 30, 2011, based on the COSO criteria.
52
Table of Contents
We also have audited, in accordance with the standards of the Public Company Accounting Oversight Board (United States), the consolidated balance sheets of Sparton Corporation as of June 30, 2011 and 2010, and the related consolidated statements of operations, cash flows and shareholders’ equity for each of the three years in the period ended June 30, 2011, and our report dated September 7, 2011 expressed an unqualified opinion thereon.
/s/ BDO USA, LLP
Grand Rapids, Michigan
September 7, 2011
| ITEM 9B. | OTHER INFORMATION |
None.
53
Table of Contents
| ITEM 10. | DIRECTORS, EXECUTIVE OFFICERS AND CORPORATE GOVERNANCE |
Directors and Executive Officers of the Registrant — Information with respect to directors is included in the Company’s Proxy Statement for the 2011 Annual Meeting of Shareholders under “Election of Directors” and is incorporated herein by reference. Information concerning executive officers is set forth in Part I, Item 1 of this Annual Report on Form 10-K.
Audit Committee Financial Expert — Information with respect to the audit committee financial expert is included in the Company’s Proxy Statement for the 2011 Annual Meeting of Shareholders under the heading “Corporate Governance and Board Matters – Board Leadership Structure and Board and Committee Information” and is incorporated herein by reference.
Identification and Composition of the Audit Committee — Information with respect to the identification and composition of the audit committee is included in the Company’s Proxy Statement for the 2011 Annual Meeting of Shareholders under the heading “Corporate Governance and Board Matters – Board Leadership Structure and Board and Committee Information” and is incorporated herein by reference.
Compliance with Section 16(a) of the Exchange Act — Information with respect to the compliance with Section 16(a) of the Exchange Act is included in the Company’s Proxy Statement under the heading “Section 16(a) Beneficial Ownership Reporting Compliance” and is incorporated herein by reference.
Code of Business Conduct and Ethics — Information with respect to the Company’s Corporate Governance Guidelines and the Code of Business Conduct and Ethics (which applies to all officers and employees of the Company) is available at the Company’s website www.sparton.com under the heading “Investor Relations”. This information is also available free of charge upon request from the Company’s Shareholder Relations department at the corporate address. The Company’s Code of Ethics as currently in effect (together with any amendments that may be adopted from time to time) is posted on the website. To the extent any waiver is granted with respect to the Code of Ethics that requires disclosure under applicable SEC rules, such waiver will also be posted on the website.
| ITEM 11. | EXECUTIVE COMPENSATION |
The information required by Item 11 is included in the Company’s Proxy Statement for the 2011 Annual Meeting of Shareholders under the heading “Executive Officer and Director Compensation” and is incorporated herein by reference.
| ITEM 12. | SECURITY OWNERSHIP OF CERTAIN BENEFICIAL OWNERS AND MANAGEMENT AND RELATED STOCKHOLDER MATTERS |
Information on ownership of the Company’s common stock by management and certain other beneficial owners is included under “Principal Shareholders” and “Security Ownership of Management” in our Proxy Statement relating to our 2011 Annual Meeting of Shareholders and is incorporated herein by reference.
Information with respect to the Company’s equity compensation plans is included in the Company’s Proxy Statement for the 2011 Annual Meeting of Shareholders under “Executive Officer and Director Compensation” and is incorporated herein by reference.
54
Table of Contents
| ITEM 13. | CERTAIN RELATIONSHIPS AND RELATED TRANSACTIONS, AND DIRECTOR INDEPENDENCE |
The information required by Item 13 is included in the Company’s Proxy Statement for the 2011 Annual Meeting of Shareholders under “Certain Relationships and Related Person Transactions” and is incorporated herein by reference.
| ITEM 14. | PRINCIPAL ACCOUNTING FEES AND SERVICES |
The information required by Item 14 is included in the Company’s Proxy Statement under “Advisory Vote on Appointment of Independent Registered Public Accountants” and is incorporated herein by reference.
55
Table of Contents
| ITEM 15. | EXHIBITS, FINANCIAL STATEMENT SCHEDULES |
| (a) | The following documents are filed as part of this Annual Report on Form 10-K: |
| 1. | Financial Statements |
See the Index to Consolidated Financial Statements on page F-1.
| 2. | Financial Statement Schedules. |
See the Index to Consolidated Financial Statements on page F-1
| 3. | See the Exhibit Index following the financial statements. |
| (b) | See the Exhibit Index following the financial statements. |
| (c) | Financial Statement Schedules. See (a) 2 above. |
56
Table of Contents
Pursuant to the requirements of Section 13 or 15(d) of the Securities Exchange Act of 1934, the registrant has duly caused this report to be signed on its behalf by the undersigned, thereunto duly authorized.
| Sparton Corporation | ||
| By: |
/S/ CARY B. WOOD | |
| Cary B. Wood President and Chief Executive Officer | ||
| Date: September 7, 2011 | ||
Pursuant to the requirements of the Securities Exchange Act of 1934, this report has been signed below by the following persons on behalf of the registrant and in the capacities and on the dates indicated.
| Name |
Title |
Date | ||
| /S/ DAVID P. MOLFENTER David P. Molfenter |
Director, Chairman of the Board of Directors |
September 7, 2011 | ||
| /S/ CARY B. WOOD Cary B. Wood |
Director, President and |
September 7, 2011 | ||
| /S/ JAMES D. FAST James D. Fast |
Director |
September 7, 2011 | ||
| /S/ JOSEPH J. HARTNETT Joseph J. Hartnett |
Director |
September 7, 2011 | ||
| /S/ WILLIAM I. NOECKER William I. Noecker |
Director |
September 7, 2011 | ||
| /S/ DOUGLAS R. SCHRANK Douglas R. Schrank |
Director |
September 7, 2011 | ||
| /S/ W. PETER SLUSSER W. Peter Slusser |
Director |
September 7, 2011 | ||
| /S/ JAMES R. SWARTWOUT James R. Swartwout |
Director |
September 7, 2011 | ||
| /S/ GREGORY A. SLOME Gregory A. Slome |
Senior Vice President and |
September 7, 2011 | ||
57
Table of Contents
SPARTON CORPORATION AND SUBSIDIARIES
INDEX TO CONSOLIDATED FINANCIAL STATEMENTS AND SCHEDULE
F-1
Table of Contents
REPORT OF INDEPENDENT REGISTERED PUBLIC ACCOUNTING FIRM
To the Board of Directors and Shareholders of
Sparton Corporation
Schaumburg, Illinois
We have audited the accompanying consolidated balance sheets of Sparton Corporation and subsidiaries as of June 30, 2011 and 2010, and the related consolidated statements of operations, cash flows and shareholders’ equity for each of the three years in the period ended June 30, 2011. In connection with our audits of the financial statements, we have also audited the financial statement schedule listed in the accompanying index. These financial statements and schedule are the responsibility of the Company’s management. Our responsibility is to express an opinion on these financial statements and schedule based on our audits.
We conducted our audits in accordance with the standards of the Public Company Accounting Oversight Board (United States). Those standards require that we plan and perform the audit to obtain reasonable assurance about whether the financial statements are free of material misstatement. An audit includes examining, on a test basis, evidence supporting the amounts and disclosures in the financial statements, assessing the accounting principles used and significant estimates made by management, as well as evaluating the overall presentation of the financial statements and schedule. We believe that our audits provide a reasonable basis for our opinion.
In our opinion, the consolidated financial statements referred to above present fairly, in all material respects, the financial position of Sparton Corporation and subsidiaries as of June 30, 2011 and 2010, and the results of its operations and its cash flows for each of the three years in the period ended June 30, 2011, in conformity with accounting principles generally accepted in the United States of America.
Also, in our opinion, the financial statement schedule, when considered in relation to the basic consolidated financial statements taken as a whole, presents fairly, in all material respects, the information set forth therein.
We also have audited, in accordance with the standards of the Public Company Accounting Oversight Board (United States), Sparton Corporation’s internal control over financial reporting as of June 30, 2011, based on criteria established in Internal Control — Integrated Framework issued by the Committee of Sponsoring Organizations of the Treadway Commission (COSO) and our report dated September 7, 2011 expressed an unqualified opinion thereon.
/s/ BDO USA, LLP
Grand Rapids, Michigan
September 7, 2011
F-2
Table of Contents
SPARTON CORPORATION AND SUBSIDIARIES
CONSOLIDATED BALANCE SHEETS
(In thousands, except share and per share amounts)
| June 30, 2011 |
June 30, 2010 |
|||||||
| Assets | ||||||||
| Current Assets: |
||||||||
| Cash and cash equivalents |
$ | 24,550 | $ | 30,589 | ||||
| Restricted cash |
— | 3,162 | ||||||
| Accounts receivable, net of allowance for doubtful accounts of $65 and $532, respectively |
23,896 | 17,967 | ||||||
| Inventories and cost of contracts in progress, net |
38,752 | 26,514 | ||||||
| Income taxes receivable |
305 | 296 | ||||||
| Deferred income taxes |
4,417 | 57 | ||||||
| Property held for sale |
— | 3,900 | ||||||
| Prepaid expenses and other current assets |
1,491 | 1,449 | ||||||
|
|
|
|
|
|||||
| Total current assets |
93,411 | 83,934 | ||||||
| Property, plant and equipment, net |
11,395 | 8,924 | ||||||
| Goodwill |
7,472 | 19,141 | ||||||
| Other intangible assets, net |
2,053 | 4,803 | ||||||
| Deferred income taxes — non-current |
5,740 | — | ||||||
| Other non-current assets |
2,538 | 3,059 | ||||||
|
|
|
|
|
|||||
| Total assets |
$ | 122,609 | $ | 119,861 | ||||
|
|
|
|
|
|||||
| Liabilities and Shareholders’ Equity | ||||||||
| Current Liabilities: |
||||||||
| Current portion of long-term debt |
$ | 126 | $ | 121 | ||||
| Accounts payable |
16,608 | 13,045 | ||||||
| Accrued salaries and wages |
5,626 | 5,737 | ||||||
| Accrued health benefits |
980 | 989 | ||||||
| Current portion of pension liability |
306 | 1,139 | ||||||
| Restructuring accrual |
118 | 233 | ||||||
| Advance billings on customer contracts |
13,021 | 21,595 | ||||||
| Other accrued expenses |
5,303 | 3,345 | ||||||
|
|
|
|
|
|||||
| Total current liabilities |
42,088 | 46,204 | ||||||
| Deferred income taxes — non-current |
— | 1,579 | ||||||
| Pension liability — non-current portion |
41 | 1,980 | ||||||
| Long-term debt — non-current portion |
1,670 | 1,796 | ||||||
| Environmental remediation — non-current portion |
3,763 | 4,033 | ||||||
|
|
|
|
|
|||||
| Total liabilities |
47,562 | 55,592 | ||||||
|
|
|
|
|
|||||
| Commitments and contingencies |
||||||||
| Shareholders’ Equity: |
||||||||
| Preferred stock, no par value; 200,000 shares authorized; none outstanding |
— | — | ||||||
| Common stock, $1.25 par value; 15,000,000 shares authorized, 10,236,484 and 10,200,534 shares outstanding, respectively |
12,796 | 12,751 | ||||||
| Capital in excess of par value |
20,635 | 19,864 | ||||||
| Retained earnings |
42,487 | 35,026 | ||||||
| Accumulated other comprehensive loss |
(871 | ) | (3,372 | ) | ||||
|
|
|
|
|
|||||
| Total shareholders’ equity |
75,047 | 64,269 | ||||||
|
|
|
|
|
|||||
| Total liabilities and shareholders’ equity |
$ | 122,609 | $ | 119,861 | ||||
|
|
|
|
|
|||||
See Notes to consolidated financial statements.
F-3
Table of Contents
SPARTON CORPORATION AND SUBSIDIARIES
CONSOLIDATED STATEMENTS OF OPERATIONS
(Dollars in thousands, except share data)
| For the Year Ended June 30, | ||||||||||||
| 2011 | 2010 | 2009 | ||||||||||
| Net sales |
$ | 203,352 | $ | 173,977 | $ | 221,871 | ||||||
| Cost of goods sold |
170,184 | 147,394 | 205,985 | |||||||||
|
|
|
|
|
|
|
|||||||
| Gross profit |
33,168 | 26,583 | 15,886 | |||||||||
|
|
|
|
|
|
|
|||||||
| Operating expense: |
||||||||||||
| Selling and administrative expenses |
20,842 | 18,205 | 18,851 | |||||||||
| Internal research and development expenses |
1,110 | — | — | |||||||||
| Amortization of intangible assets |
545 | 467 | 492 | |||||||||
| Restructuring/impairment charges |
75 | 4,076 | 7,008 | |||||||||
| Gain on acquisition |
(2,550 | ) | — | — | ||||||||
| Gain on sale of property, plant and equipment, net |
(139 | ) | (3,119 | ) | (10 | ) | ||||||
| Impairment of intangible asset |
3,663 | — | — | |||||||||
| Impairment of goodwill |
13,153 | — | — | |||||||||
| Other operating expenses |
298 | 1,232 | 802 | |||||||||
|
|
|
|
|
|
|
|||||||
| Total operating expense |
36,997 | 20,861 | 27,143 | |||||||||
|
|
|
|
|
|
|
|||||||
| Operating income (loss) |
(3,829 | ) | 5,722 | (11,257 | ) | |||||||
| Other income (expense): |
||||||||||||
| Interest expense |
(706 | ) | (844 | ) | (1,568 | ) | ||||||
| Interest income |
151 | 85 | 28 | |||||||||
| Gain on sale of investment |
— | 201 | — | |||||||||
| Canadian translation adjustment |
5 | (23 | ) | (1,483 | ) | |||||||
| Other, net |
436 | 383 | 314 | |||||||||
|
|
|
|
|
|
|
|||||||
| Total other expense, net |
(114 | ) | (198 | ) | (2,709 | ) | ||||||
|
|
|
|
|
|
|
|||||||
| Income (loss) before provision for (benefit from) income taxes |
(3,943 | ) | 5,524 | (13,966 | ) | |||||||
| Provision for (benefit from) income taxes |
(11,404 | ) | (1,916 | ) | 1,787 | |||||||
|
|
|
|
|
|
|
|||||||
| Net income (loss) |
$ | 7,461 | $ | 7,440 | $ | (15,753 | ) | |||||
|
|
|
|
|
|
|
|||||||
| Income (loss) per share of common stock: |
||||||||||||
| Basic |
$ | 0.73 | $ | 0.75 | $ | (1.61 | ) | |||||
|
|
|
|
|
|
|
|||||||
| Diluted |
$ | 0.73 | $ | 0.75 | $ | (1.61 | ) | |||||
|
|
|
|
|
|
|
|||||||
| Weighted average shares of common stock outstanding: |
||||||||||||
| Basic |
10,217,494 | 9,972,409 | 9,811,635 | |||||||||
|
|
|
|
|
|
|
|||||||
| Diluted |
10,255,368 | 9,972,409 | 9,811,635 | |||||||||
|
|
|
|
|
|
|
|||||||
See Notes to consolidated financial statements.
F-4
Table of Contents
SPARTON CORPORATION AND SUBSIDIARIES
CONSOLIDATED STATEMENTS OF CASH FLOWS
(In thousands)
| For the Year Ended June 30, | ||||||||||||
| 2011 | 2010 | 2009 | ||||||||||
| Cash Flows from Operating Activities: |
||||||||||||
| Net income (loss) |
$ | 7,461 | $ | 7,440 | $ | (15,753 | ) | |||||
| Adjustments to reconcile net income (loss) to net cash provided by operating activities: |
||||||||||||
| Depreciation and amortization |
1,611 | 1,463 | 1,886 | |||||||||
| Deferred income tax expense (benefit) |
(11,276 | ) | 418 | 1,883 | ||||||||
| Pension expense |
372 | 1,331 | 2,451 | |||||||||
| Stock-based compensation expense |
646 | 505 | 196 | |||||||||
| Non-cash restructuring/impairment charges |
— | 2,129 | 2,112 | |||||||||
| Gain on acquisition |
(2,550 | ) | — | — | ||||||||
| Gain on sale of property, plant and equipment, net |
(139 | ) | (3,119 | ) | (10 | ) | ||||||
| Gain on sale of investment |
— | (201 | ) | — | ||||||||
| Impairment of intangible asset |
3,663 | — | — | |||||||||
| Impairment of goodwill |
13,153 | — | — | |||||||||
| Excess tax benefit from stock-based compensation |
(145 | ) | — | — | ||||||||
| Other |
348 | 275 | 429 | |||||||||
| Changes in operating assets and liabilities, net of business acquisitions: |
||||||||||||
| Accounts receivable |
(4,595 | ) | 20,196 | (7,944 | ) | |||||||
| Income taxes receivable |
(9 | ) | (296 | ) | — | |||||||
| Inventories and cost of contracts in progress |
77 | 11,921 | 24,838 | |||||||||
| Prepaid expenses and other assets |
140 | 689 | 804 | |||||||||
| Advance billings on customer contracts |
(8,574 | ) | (3,508 | ) | 25,102 | |||||||
| Accounts payable and accrued expenses |
2,273 | (19,387 | ) | 2,316 | ||||||||
|
|
|
|
|
|
|
|||||||
| Net cash provided by operating activities |
2,456 | 19,856 | 38,310 | |||||||||
|
|
|
|
|
|
|
|||||||
| Cash Flows from Investing Activities: |
||||||||||||
| Purchase of certain assets of Delphi Medical |
(8,419 | ) | — | — | ||||||||
| Purchase of certain assets of Byers Peak |
(4,140 | ) | — | — | ||||||||
| Additional goodwill from Astro acquisition |
— | (2,476 | ) | (1,057 | ) | |||||||
| Change in restricted cash |
3,162 | (3,162 | ) | — | ||||||||
| Purchases of property, plant and equipment |
(3,177 | ) | (1,535 | ) | (1,227 | ) | ||||||
| Proceeds from sale of property, plant and equipment |
4,039 | 3,057 | 48 | |||||||||
| Proceeds from sale of investment |
— | 525 | — | |||||||||
| Other |
— | — | 4 | |||||||||
|
|
|
|
|
|
|
|||||||
| Net cash used in investing activities |
(8,535 | ) | (3,591 | ) | (2,232 | ) | ||||||
|
|
|
|
|
|
|
|||||||
| Cash Flows from Financing Activities: |
||||||||||||
| Net short-term bank borrowings (repayments) |
— | (15,500 | ) | 2,000 | ||||||||
| Repayments of long-term debt |
(130 | ) | (5,551 | ) | (4,630 | ) | ||||||
| Payment of debt financing costs |
— | (886 | ) | (115 | ) | |||||||
| Proceeds from the exercise of stock options |
25 | — | — | |||||||||
| Excess tax benefit from stock-based compensation |
145 | — | — | |||||||||
|
|
|
|
|
|
|
|||||||
| Net cash provided by (used in) financing activities |
40 | (21,937 | ) | (2,745 | ) | |||||||
|
|
|
|
|
|
|
|||||||
| Net increase (decrease) in cash and cash equivalents |
(6,039 | ) | (5,672 | ) | 33,333 | |||||||
| Cash and cash equivalents at beginning of year |
30,589 | 36,261 | 2,928 | |||||||||
|
|
|
|
|
|
|
|||||||
| Cash and cash equivalents at end of year |
$ | 24,550 | $ | 30,589 | $ | 36,261 | ||||||
|
|
|
|
|
|
|
|||||||
| Supplemental disclosure of cash flow information: |
||||||||||||
| Cash paid for interest |
$ | 365 | $ | 535 | $ | 1,494 | ||||||
|
|
|
|
|
|
|
|||||||
| Cash paid (received) for income taxes |
$ | (94 | ) | $ | (2,039 | ) | $ | 243 | ||||
|
|
|
|
|
|
|
|||||||
| Supplemental disclosure of non-cash investing activities: |
||||||||||||
| Accrued expenses incurred for the acquisition of Astro |
$ | — | $ | — | $ | 1,029 | ||||||
|
|
|
|
|
|
|
|||||||
See Notes to consolidated financial statements.
F-5
Table of Contents
SPARTON CORPORATION AND SUBSIDIARIES
CONSOLIDATED STATEMENTS OF SHAREHOLDERS’ EQUITY
(Dollars in thousands, except share data)
| Common Stock | Capital In Excess of Par Value |
Retained Earnings |
Accumulated Other Comprehensive Loss |
Total Shareholders’ Equity |
||||||||||||||||||||
| Shares | Amount | |||||||||||||||||||||||
| Balance at June 30, 2008 |
9,811,507 | $ | 12,264 | $ | 19,650 | $ | 43,593 | $ | (4,647 | ) | $ | 70,860 | ||||||||||||
| Issuance of stock |
140,000 | 175 | (175 | ) | — | — | — | |||||||||||||||||
| Stock-based compensation expense |
— | — | 196 | — | — | 196 | ||||||||||||||||||
| Effect of changing the pension plan measurement date, net of tax |
— | — | — | (254 | ) | (144 | ) | (398 | ) | |||||||||||||||
| Comprehensive loss, net of tax: |
||||||||||||||||||||||||
| Net loss |
— | — | — | (15,753 | ) | — | (15,753 | ) | ||||||||||||||||
| Change in unrecognized pension costs |
— | — | — | — | (10 | ) | (10 | ) | ||||||||||||||||
|
|
|
|||||||||||||||||||||||
| Comprehensive loss |
(15,763 | ) | ||||||||||||||||||||||
|
|
|
|
|
|
|
|
|
|
|
|
|
|||||||||||||
| Balance at June 30, 2009 |
9,951,507 | 12,439 | 19,671 | 27,586 | (4,801 | ) | 54,895 | |||||||||||||||||
| Issuance of stock |
249,027 | 312 | (312 | ) | — | — | — | |||||||||||||||||
| Stock-based compensation expense |
— | — | 505 | — | — | 505 | ||||||||||||||||||
| Comprehensive income, net of tax: |
||||||||||||||||||||||||
| Net income |
— | — | — | 7,440 | — | 7,440 | ||||||||||||||||||
| Change in unrecognized pension costs |
— | — | — | — | 1,429 | 1,429 | ||||||||||||||||||
|
|
|
|||||||||||||||||||||||
| Comprehensive income |
8,869 | |||||||||||||||||||||||
|
|
|
|
|
|
|
|
|
|
|
|
|
|||||||||||||
| Balance at June 30, 2010 |
10,200,534 | 12,751 | 19,864 | 35,026 | (3,372 | ) | 64,269 | |||||||||||||||||
| Issuance of stock |
30,950 | 39 | (39 | ) | — | — | — | |||||||||||||||||
| Exercise of stock options |
5,000 | 6 | 19 | — | — | 25 | ||||||||||||||||||
| Stock-based compensation expense |
— | — | 646 | — | — | 646 | ||||||||||||||||||
| Excess tax benefit of stock-based compensation |
— | — | 145 | — | — | 145 | ||||||||||||||||||
| Comprehensive income, net of tax: |
||||||||||||||||||||||||
| Net income |
— | — | — | 7,461 | — | 7,461 | ||||||||||||||||||
| Change in unrecognized pension costs |
— | — | — | — | 2,501 | 2,501 | ||||||||||||||||||
|
|
|
|||||||||||||||||||||||
| Comprehensive income |
9,962 | |||||||||||||||||||||||
|
|
|
|
|
|
|
|
|
|
|
|
|
|||||||||||||
| Balance at June 30, 2011 |
10,236,484 | $ | 12,796 | $ | 20,635 | $ | 42,487 | $ | (871 | ) | $ | 75,047 | ||||||||||||
|
|
|
|
|
|
|
|
|
|
|
|
|
|||||||||||||
See Notes to consolidated financial statements.
F-6
Table of Contents
SPARTON CORPORATION AND SUBSIDIARIES
NOTES TO CONSOLIDATED FINANCIAL STATEMENTS
(1) Business
Sparton Corporation and subsidiaries (the “Company” or “Sparton”) has been in continuous existence since 1900. It was last reorganized in 1919 as an Ohio corporation. The Company is a provider of complex and sophisticated electromechanical devices with capabilities that include concept development, industrial design, design and manufacturing engineering, production, distribution, and field service. The Company operates through three reportable business segments; Medical Device (“Medical”), Complex Systems (“CS”), formerly called Electronic Manufacturing Services (“EMS”), and Defense & Security Systems (“DSS”), which serves Defense, Security Systems, and Navigation and Exploration markets. The electromechanical device end markets that Sparton, as a whole, serves are in Medical, Military & Aerospace and Industrial & Instrumentation. Effective beginning in fiscal 2010, the Company reports its operating results under these three reportable business segments. Prior to fiscal 2010, all of our operating units were aggregated into one line of business, EMS. Fiscal 2009 information presented herein reflects this change to segment reporting. Financial information by segment is presented in Note 15. All of the Company’s facilities are registered to ISO standards, including 9001 or 13485, with most having additional certifications. The Company’s products and services include products for Original Equipment Manufacturers (“OEM”) and Emerging Technology (“ET”) customers that are microprocessor-based systems that include transducers, printed circuit boards and assemblies, sensors, and electromechanical components, as well as development and design engineering services relating to these product sales. Sparton also develops and manufactures sonobuoys, anti-submarine warfare (“ASW”) devices, used by the United States Navy and other free-world countries. Many of the physical and technical attributes in the production of sonobuoys are similar to those required in the production of the Company’s other electrical and electromechanical products and assemblies.
(2) Summary of Significant Accounting Policies
Basis of presentation and principles of consolidation — The consolidated financial statements include the accounts of Sparton Corporation and subsidiaries and have been prepared in accordance with accounting principles generally accepted in the United States of America (“GAAP”). All significant intercompany accounts and transactions have been eliminated in consolidation. Certain reclassifications of prior year amounts have been made to conform to the current year presentation. Subsequent events have been evaluated through the date these financial statements were issued.
Use of estimates — Management of the Company has made a number of estimates, judgments and assumptions relating to the reporting of assets and liabilities and the disclosure of contingent liabilities at the dates of the consolidated balance sheets and revenue and expense during the reporting periods to prepare these consolidated financial statements in conformity with GAAP. Actual results could differ from those estimates.
Cash and cash equivalents — Cash and cash equivalents include cash on hand, demand deposits and money market funds with original maturities of three months or less. Cash equivalents are stated at cost which approximates fair value.
Accounts receivable, credit practices, and allowances for doubtful accounts — Accounts receivable are customer obligations generally due under normal trade terms for the industry. Credit terms are granted and periodically revised based on evaluations of the customers’ financial condition. The Company performs ongoing credit evaluations of its customers and although the Company does not generally require collateral, letters of credit or cash advances may be required from customers in order to support accounts receivable in certain circumstances.
F-7
Table of Contents
The Company maintains an allowance for doubtful accounts on receivables for estimated losses resulting from the inability of its customers to make required payments. The allowance is estimated primarily based on information known about specific customers with respect to their ability to make payments, and future expectations of conditions that might impact the collectability of accounts. When management determines that it is probable that an account will not be collected, all or a portion of the amount is charged against the allowance for doubtful accounts.
Inventories and costs of contracts in progress — Inventories are valued at the lower of cost (first-in, first-out basis) or market and include costs related to long-term contracts as disclosed below. Inventories, other than contract costs, are principally raw materials and supplies.
United States Government contracts allow Sparton to submit advance billings, which are then applied against inventories purchased and manufacturing costs incurred by the Company throughout its performance under these contracts. Inventories were reduced by advance billings to the U.S. government for costs incurred related to long-term contracts, thereby establishing inventory to which the U.S. government then has title, of approximately $9.0 million and $7.4 million, respectively, at June 30, 2011 and 2010. At June 30, 2011 and 2010, current liabilities include advance billings of $13.0 million and $21.6 million, respectively, on government contracts. As these billings are in excess of cost, there is no inventory to which the government would claim title and, therefore, no offset to inventory has been made.
Customer orders are based upon forecasted quantities of product manufactured for shipment over defined periods. Raw material inventories are purchased to fulfill these customer requirements. Within these arrangements, customer demands for products frequently change, sometimes creating excess and obsolete inventories. The Company regularly reviews raw material inventories by customer for both excess and obsolete quantities. Wherever possible, the Company attempts to recover its full cost of excess and obsolete inventories from customers or, in some cases, through other markets. When it is determined that the Company’s carrying cost of such excess and obsolete inventories cannot be recovered in full, a charge is taken against income for the difference between the carrying cost and the estimated realizable amount. The Company’s cost adjustments for excess and obsolete inventory is specific to individual parts. As a result, the adjustments create a new cost basis for those parts. The Company recorded inventory write-downs totaling approximately $0.2 million, $1.5 million and $3.0 million for the years ended June 30, 2011, 2010 and 2009, respectively. These charges are included in cost of goods sold for the periods presented. If inventory that has previously been impaired is subsequently sold, the amount of reduced cost basis is reflected as cost of goods sold. The Company experienced minimal subsequent sales of excess and obsolete inventory during the three years ended June 30, 2011 that resulted in higher gross margins due to previous write-downs. Such sales and the impact of those sales on gross margin were not material to the years presented.
Property, plant and equipment, net — Property, plant and equipment are stated at cost less accumulated depreciation. Major improvements and upgrades are capitalized while ordinary repair and maintenance costs are expensed as incurred. Depreciation is provided over estimated useful lives on both straight-line and accelerated methods. Estimated useful lives generally range from 5 to 50 years for buildings and improvements, 3 to 16 years for machinery and equipment and 3 to 5 years for test equipment.
Other assets — Other non-current assets consist of the following at June 30, 2011 and 2010 (in thousands):
| June 30, 2011 |
June 30, 2010 |
|||||||
| Deferred financing fees, net |
$ | 367 | $ | 706 | ||||
| Cost method investment in Cybernet Systems Corporation |
1,623 | 1,623 | ||||||
| Coors Road long-term lease receivable |
242 | 468 | ||||||
| Other |
306 | 262 | ||||||
|
|
|
|
|
|||||
| Total other non-current assets |
$ | 2,538 | $ | 3,059 | ||||
|
|
|
|
|
|||||
F-8
Table of Contents
Costs incurred in connection with the Company’s revolving line-of-credit of approximately $1.0 million were deferred and are amortized to interest expense over the three year term of the facility. Approximately $0.3 million of amortization of these loan costs was recognized and reported as interest expense for each of the years ended June 30, 2011 and 2010.
In June 1999, the Company purchased a 14% interest in Cybernet Systems Corporation (“Cybernet”), a developer of hardware, software, next-generation network computing, and robotics products. Through January 2010, the investment was accounted for under the equity method, which required the Company to record its share of Cybernet’s income or loss in Sparton’s statements of operations with a corresponding increase or decrease in the investment account on Sparton’s balance sheets. In February 2010, the Company sold approximately $0.3 million, or approximately 17%, of its interest in Cybernet, resulting in a remaining interest of less than 12%. The Company received approximately $0.5 million for this interest resulting in an approximate gain of $0.2 million during the year ended June 30, 2010. In conjunction with the sale, Sparton reassessed the accounting treatment of its remaining investment in Cybernet and concluded that, due to the change in ownership percentage and the evolution of the relationship between Sparton and Cybernet as a result of the then recent change in Sparton management, it no longer is able to exercise significant influence over Cybernet. Accordingly, beginning February 2010, the Company accounts for its investment in Cybernet under the cost method.
During fiscal 2010, the Company entered into a long-term lease agreement in relation to its Coors Road property in Albuquerque, New Mexico. The 50-year lease agreement provides for one upfront payment of approximately $2.5 million and an additional approximate $0.8 million paid over three years in a series of equal annual payments. Ownership will transfer at the end of the lease term, or earlier at the option of the lessee, but in no event sooner than the completion of the installment payments and only if the tenant is not in default under the lease. The transaction was accounted for as a sale of real estate with full profit recognition and resulted in a gain on sale of property of approximately $3.1 million recognized in the year ended June 30, 2010. On April 1, 2011, the Company received the first of the annual payments of approximately $0.3 million. The $0.6 million of remaining future payments due have been discounted for the imputation of interest, resulting in a discounted receivable of approximately $0.5 million. Approximately $0.3 million of this discounted receivable is due within the next 12 months and therefore is included in prepaid expenses and other current assets on the balance sheets at June 30, 2011 and 2010.
Goodwill and intangible assets — The Company tests for possible goodwill impairment annually or more often should events or changes in circumstances indicate the carry value of the goodwill may not be recoverable. The test is conducted at the reporting unit level. Sparton has three reportable business segments (Medical, Complex Systems, and DSS). Complex Systems and DSS each consist of a single reporting unit. Medical, within which all of the Company’s goodwill resides, consists of two reporting units: (i) the Company’s Ohio business purchased from Astro Instrumentation, LLC (“Astro”) during fiscal 2006 and holding the goodwill related to the Astro purchase; and (ii) the Company’s Colorado businesses acquired from Delphi Medical Systems, LLC (“Delphi Medical” or “Delphi”) and Byers Peak, Incorporated (“Byers Peak”) during fiscal 2011and holding the goodwill related to the Byers Peak acquisition. For fiscal 2011, goodwill impairment testing was conducted on these two Medical segment reporting units. The impairment analysis is a two step process. First, the Company determines the fair value of the reporting unit and compares it to its carrying value. The fair value of reporting units is determined based on a weighting of both projected discounted future results and comparative market multiples. The projected discounted future results (discounted cash flow approach) is based on assumptions that are consistent with the Company’s estimates of future growth and the strategic plan used to manage the underlying business. Factors requiring significant judgment include assumptions related to future revenue growth rates, operating margins, terminal growth rates and discount factors, amongst other considerations. Second, if the carrying value of a reporting unit exceeds its estimated fair value, an impairment loss is recognized for any excess of the carrying value of the reporting unit’s goodwill over the implied fair value of that goodwill. The implied fair value of goodwill is determined by allocating the fair value of the reporting unit in a manner similar to a purchase price allocation. The residual fair value after this allocation is the implied fair value of the reporting unit goodwill. The Company’s fair value estimates related to its goodwill impairment analyses are based on
F-9
Table of Contents
Level 3 inputs within the fair value hierarchy as described below in this note under “Fair value measurements.” Determining the fair value of any reporting unit and intangible asset is judgmental in nature and involves the use of significant estimates and assumptions. The Company bases its fair value estimates on assumptions believed to be reasonable, but which are unpredictable and inherently uncertain. Actual future results may differ from those estimates. Circumstances that may lead to future impairment of goodwill include, but are not limited to, unforeseen decreases in future performance or industry demand, as well as further loss of a significant customer or program in excess of future incremental new business wins. The next annual goodwill impairment reviews are expected to be performed during the fourth quarter of fiscal 2012.
The Company’s fiscal 2011 annual test of goodwill related to its Colorado reporting unit did not indicate that the related goodwill was impaired. While the Company’s fiscal 2010 annual test of goodwill related to its Ohio reporting unit did not indicate that the related goodwill was impaired, its fiscal 2011 annual test of goodwill related to its Ohio reporting unit did indicate that the related goodwill was impaired. The Company determined that the carrying value of the reporting unit exceeded its fair value, requiring Sparton to compare the carrying value of this goodwill to its implied fair value, which resulted in a non-cash impairment charge of approximately $13.2 million being recorded during the fourth quarter of fiscal 2011 to record this asset at its fair value of $6.0 million.
This impairment reflects various downward trends in volume within the Company’s Ohio reporting unit, which was acquired in fiscal 2006, including the impact of a customer disengagement and Siemens’ fiscal 2011 fourth quarter notification of its intent to dual source certain programs with us as part of an overall dual sourcing strategy for certain of its critical programs. The Company’s assumptions used to estimate the fair value of the Medical segment’s Ohio reporting unit in fiscal 2011 reflect the Company’s current outlook for this reporting unit and reflect the effects of the events and uncertainties mentioned above, including but not limited to, lower expected revenues and lower expected operating margins than reflected in the Company’s fiscal 2010 goodwill impairment analysis.
The Company’s intangible assets other than goodwill represent the values assigned to customer relationships acquired in conjunction with the Company’s purchases of Astro and Byers Peak and values assigned to non-compete agreements acquired in conjunction with the Company’s purchase of Byers Peak. All of the Company’s intangible assets are included within the Medical segment. The impairment test for these intangible assets is conducted when impairment indicators are present. The Company continually evaluates whether events or circumstances have occurred that would indicate the remaining estimated useful lives of its intangible assets warrant revision or that the remaining balance of such assets may not be recoverable. The Company uses an estimate of the related undiscounted cash flows over the remaining life of the asset in measuring whether the asset is recoverable. If the carrying amount of an asset exceeds its estimated undiscounted future cash flows, an impairment charge would be recognized for the amount that the carrying amount of the asset exceeds the fair value of the asset. The Company’s fair value estimates related to its intangible assets impairment analyses are based on Level 3 inputs within the fair value hierarchy as described below in this note under “Fair value measurements.”
As noted above, during the fourth quarter of fiscal 2011, the Company was notified by Siemens that it intends to dual source two of its larger programs with the Company beginning in fiscal 2012. Siemens was acquired as a customer in conjunction with the Company’s purchase of Astro and as such Sparton considered Siemens’ dual sourcing of these two programs to be an impairment indicator requiring impairment review of the related intangible asset. This impairment review, which was conducted during the fourth quarter of fiscal 2011, concluded that the carrying value of this intangible asset was not fully recoverable and consequently a non-cash impairment charge of approximately $3.7 million was recorded during the fourth quarter of fiscal 2011 to record this asset at its fair value of $0.7 million. The other business events and uncertainties described above in relation to the Medical segment’s Ohio reporting unit were also contributing factors to the Astro customer relationship impairment charge. As part of the impairment review, the estimated remaining useful life of this asset was evaluated with the Company determining that no change was warranted.
F-10
Table of Contents
During fiscal 2011 and in previous years, the customer relationships acquired in conjunction with the Company’s purchase of Astro have been amortizing on a straight-line basis over 15 years. The straight-line method has been used to amortize these identified intangible assets because the Company believed that the expected undiscounted cash flows were reasonably consistent with a ratable decline in value over time. Beginning in fiscal 2012, the remaining customer relationships acquired in conjunction with the Company’s purchase of Astro will be amortized using an accelerated methodology on its remaining life as the Company now believes that this more reasonably reflects the expected future undiscounted cash flows of the asset. The customer relationships acquired in conjunction with the Company’s purchase of Byers Peak Incorporated are also being amortized using an accelerated methodology over ten years. The Company’s non-compete agreements are being amortized on a straight-line basis over two years as the ratable decline in value over time is most consistent with the contractual nature of these assets.
Impairment of long-lived assets — The Company reviews other long-lived assets that are not held for sale for impairment whenever events or changes in circumstances indicate that the carrying amount of an asset may not be recoverable. Assets to be disposed of are reported at the lower of the carrying amount or fair value less costs to sell and are reviewed at least quarterly. Impairment is determined by comparing the carrying value of the assets to their estimated future undiscounted cash flows. If such assets are considered to be impaired, the impairment to be recognized is measured by the amount by which the carrying amount of the asset group exceeds the fair value of the asset group. During the years ended June 30, 2010 and 2009, the Company recognized impairment charges of approximately $1.4 million and $2.1 million, respectively, related to restructuring activities, primarily the closures of the Company’s Albuquerque, New Mexico, Jackson, Michigan and London, Ontario, Canada facilities (see Notes 5 and 14).
Stock-based compensation — The Company measures the cost of employee and director services received in exchange for an award of equity-based securities using the fair value of the award on the date of the grant. The Company recognizes that cost on a straight-line basis over the period that the award recipient is required to provide service to the Company in exchange for the award and, for certain awards, subject to the probability that related performance targets will be met (see Note 11).
Earnings (loss) per share — Basic earnings (loss) per share is based on the weighted average number of common shares and participating securities outstanding during the period. Diluted earnings per share include the dilutive effect of additional potential common shares issuable under our stock-based compensation plans and are determined using the treasury stock method. Unvested restricted stock awards, which contain non-forfeitable rights to dividends whether paid or unpaid, are included in the number of shares outstanding for both basic and diluted earnings per share calculations. In the event of a net loss, unvested restricted stock awards are excluded from the calculation of both basic and diluted loss per share (see Note 12).
Income taxes — The Company is required to estimate its taxes in each of the jurisdictions of operation which involves management estimating the actual current tax expense together with assessing temporary differences resulting from differing treatment of items for tax and accounting purposes. These differences result in deferred tax assets and liabilities. Deferred income taxes are based on enacted income tax rates in effect on the dates temporary differences between the tax and accounting bases of assets and liabilities are expected to reverse and tax credit carryforwards are utilized. The Company must then assess the likelihood that the deferred tax assets will be recovered from future taxable income and to the extent realization is not more likely than not, the Company must establish a valuation allowance. Future taxable income depends on the ability to generate income in excess of allowable deductions. To the extent the Company establishes a valuation allowance or increases this allowance in a period, an expense is recorded within the tax provision in the consolidated statements of operations. Significant management judgment is required in determining the Company’s provision for income taxes, its deferred tax assets and liabilities and any valuation allowance recorded against net deferred tax assets.
ERAPSCO Agreement — The Company is partner to a 50/50 joint venture agreement (“JV”) with UnderSea Sensor Systems, Inc. (“USSI”), the only other major producer of sonobuoys to the free world. USSI’s parent company is Ultra Electronics Holdings PLC, based in the United Kingdom. The joint venture arrangement
F-11
Table of Contents
operates under the name ERAPSCO and allows Sparton and USSI to consolidate their own unique and complementary backgrounds to jointly develop and produce U.S. derivative sonobuoy designs for the U.S. Navy as well as foreign countries. In concept, and in practice, ERAPSCO serves as a pass-through entity with no funds or assets. While the joint venture agreement provides the opportunity to maximize efficiencies in the design and development of the related sonobuoys, both venture companies function independently as subcontractors; therefore, there is no separate entity to be accounted for or consolidated. The Board of Directors of ERAPSCO has the responsibility for the overall management and operation of the JV. The six (6) member board consists of equal representation (full time employees) from both JV partners for three (3) year terms. Manpower for ERAPSCO, specifically a general manager role, contract administrator role and financial manager role, is similarly assigned by the JV partners for rotating three year terms and the costs of these assigned individuals are borne by the party assigning the personnel. In response to a customer request for proposal (“RFP”) that ERAPSCO will bid on, the Board of Directors of ERAPSCO determines both the composition of a response to the RFP and the composite bid to be submitted to the customer. The Board of Directors strives to divide the aggregate contract awards at a 50/50 share ratio. Each joint venture partner bears the costs it incurs associated with the preparation and submission of proposals. Each JV partner submits to ERAPSCO a proposal for the estimated cost of performing that portion of the RFP applicable to it. Upon award of a contract to the JV, separate subcontracts are generated between ERAPSCO and each of the JV partners defining the responsibilities and compensation for each JV partner. These subcontracts contain terms and conditions consistent with the prime contract. Each JV partner is responsible for the successful performance of its bid to the JV for its respective scope of work and each JV partner is responsible for profit or losses sustained in the execution of the subcontract against its respective bid. Under ERAPSCO, individual contract risk exposures are reduced, while the likelihood of achieving U.S. Navy and other ASW objectives is enhanced. ERAPSCO has been in existence for approximately twenty years and historically, the agreed upon products included under the joint venture agreement were generally developmental or sonobuoys with low volume demand. Four years ago, the Company’s ERAPSCO arrangement was expanded to include additional products for U.S. customers and substantially all U.S. derivative sonobuoy products for customers outside of the United States. Beginning with the U.S. Government 2011 fiscal year contracts, all U.S. sonobuoy products are now bid and executed through ERAPSCO, completing the joint venture expansion which now includes sales of all U.S. derivative sonobuoys worldwide.
Revenue recognition — The Company’s net sales are comprised primarily of product sales, with supplementary revenues earned from engineering and design services. Standard contract terms are FOB shipping point. Revenue from product sales is generally recognized upon shipment of the goods; service revenue is recognized as the service is performed or under the percentage of completion method, depending on the nature of the arrangement. Costs and fees billed under cost-reimbursement-type contracts are recorded as sales. Long-term contracts relate principally to government defense contracts and related ERAPSCO subcontracts for sonobuoy production. These government defense contracts and related subcontracts are accounted for based on completed units accepted and their estimated average contract cost per unit. At June 30, 2011 and 2010, current liabilities include billings in excess of costs of $13.0 million and $21.6 million, respectively, on government contracts. Sales related to these billings are recognized based upon completed units accepted and are not recognized at the time of billings. A provision for the entire amount of a loss on a contract is charged to operations as soon as the loss is identified and the amount is reasonably determinable. Shipping and handling costs are included in cost of goods sold.
Advertising Costs — The Company expenses advertising costs as they are incurred. For the years ended June 30, 2011, 2010 and 2009, advertising expense was approximately $0.4 million, $0.3 million and $0.1 million, respectively.
Research and development expenditures — Internal research and development expenses reflect costs incurred for the internal development of technologies for use in navigation, oil and gas exploration and port security. These costs include salaries and related expenses, contract labor and consulting costs, materials and the cost of certain research and development specific equipment. The Company incurred $1.1 million of internally
F-12
Table of Contents
funded research and development expenses during the year ended June 30, 2011. No internally funded research and development expense was incurred during either of the years ended June 30, 2010 or 2009. Customer funded research and development costs, which are usually part of a larger production agreement, totaled approximately $9.1 million, $10.0 million and $4.4 million for the years ended June 30, 2011, 2010 and 2009, respectively.
Fair value measurements — Fair value estimates and assumptions and methods used to estimate the fair value of the Company’s assets and liabilities are made in accordance with the requirements of the Financial Accounting Standards Board (the “FASB”), Accounting Standards Codification (“ASC”) Topic 820, “Fair Value Measurements and Disclosures” (“ASC 820”).
ASC 820 clarifies that fair value is an exit price, representing the amount that would be received to sell an asset or paid to transfer a liability in an orderly transaction between market participants. As such, fair value is a market-based measurement that should be determined based on assumptions that market participants would use in pricing an asset or liability. As a basis for considering such assumptions, ASC 820 establishes a three-tier value hierarchy, which prioritizes the inputs used in measuring fair value as follows: Level 1 are observable inputs such as quoted prices in active markets; Level 2 are inputs other than the quoted prices in active markets that are observable either directly or indirectly; and Level 3 are unobservable inputs in which there is little or no market data, which require the Company to develop its own assumptions. This hierarchy requires the Company to use observable market data, when available, and to minimize the use of unobservable inputs when determining fair value. As of June 30, 2011, the Company has no assets or liabilities which it measures and carries on its balance sheet at fair value on a recurring basis.
The Company’s long-term debt instruments, consisting of industrial revenue bonds at June 30, 2011, are carried at historical cost. As of June 30, 2011 and 2010, the fair value of the industrial revenue bonds was approximately $2.2 million and $2.3 million, respectively compared to carrying values of approximately $1.8 million and $1.9 million, respectively. These fair values were derived from discounted cash flow analyses based on the terms of the contracts and observable market data, including adjustment for nonperformance risk. The Company has determined that it is not practicable to estimate the fair value of its cost method investment in Cybernet. Factors in this determination include the investment being a private company, the portfolio of patents owned by Cybernet which are difficult to value and the materiality of the investment in Cybernet to the Company. There have been no identified events or changes in circumstances that the Company views may have a significant adverse effect on the fair value of this investment. See “Goodwill and intangible assets” above in this note for a discussion of the Company’s non-recurring fair value measurement of goodwill and intangible assets. The fair value of accounts receivable and accounts payable approximated their carrying values at both June 30, 2011 and 2010.
Market risk exposure — The Company manufactures its products in the United States and Vietnam. It ceased manufacturing in Canada during the fourth quarter of fiscal 2009. Sales of the Company’s products are in the U.S. and foreign markets. The Company is subject to foreign currency exchange rate risk relating to intercompany activity and balances and to receipts from customers and payments to suppliers in foreign currencies. Also, adjustments related to the translation of the Company’s Vietnamese financial statements into U.S. dollars are included in current earnings. As a result, the Company’s financial results could be affected by factors such as changes in foreign currency exchange rates or economic conditions in the domestic and foreign markets in which the Company operates. However, minimal third party receivables and payables are denominated in foreign currency and the related market risk exposure is considered to be immaterial. Historically, foreign currency gains and losses have not been significant. However, due to the greater volatility of the Canadian dollar, the impact of transaction and translation losses significantly increased in fiscal 2009. With the closure of the Canadian facility, however, the impact in fiscal 2011 and 2010 has not been significant and it is anticipated that future periods will not be significant.
For purposes of translating the financial statements of the Company’s Vietnamese and former Canadian operations, the U.S. dollar is considered the functional currency. Related translation adjustments, along with gains and losses from foreign currency transactions, are included in other income (expense), net and, in the aggregate, amounted to approximately $0.0 million, $(0.0 million) and $(1.4 million) for the fiscal years ended June 30, 2011, 2010 and 2009, respectively.
F-13
Table of Contents
The Company currently does not have financial instruments that are subject to interest rate risk. Historically, the Company has not experienced material gains or losses due to such interest rate changes. If used, the Company’s revolving line-of-credit facility would subject the Company to interest rate risk, which would adversely impact results of operations should the interest rate significantly increase. For a further discussion on Sparton’s debt, see Note 7.
New accounting standards — In July 2010, the FASB issued Accounting Standards Update (“ASU”) No. 2010-20, “Disclosures about the Credit Quality of Financing Receivables and the Allowance for Credit Losses”, (“ASU 2010-20”). This update enhances the disclosure requirements about the credit quality and related allowance for credit losses of financing receivables. ASU 2010-20 was effective for Sparton in the second quarter of fiscal 2011. The adoption of this disclosure guidance did not have a significant impact on the Company’s consolidated financial statements.
In December 2010, the FASB issued ASU No. 2010-29, “Business Combinations (Topic 805): Disclosure of Supplementary Pro Forma Information for Business Combinations”, which specifies that when a public company completes a business combination(s), the company should disclose revenue and earnings of the combined entity as though the business combination(s) occurred as of the beginning of the comparable prior annual reporting period. This standard also expands the supplemental pro forma disclosures under Topic 805 to include a description of the nature and amount of material, nonrecurring pro forma adjustments directly attributable to the business combination included in the pro forma revenue and earnings. The requirements in this standard are effective for business combinations that occur on or after the beginning of the first annual reporting period beginning on or after December 15, 2010. The Company will apply the provisions of ASU 2010-29 on a prospective basis. The adoption of this guidance is not expected to have a significant impact on the Company’s consolidated financial statements.
In May 2011, the FASB issued ASU No. 2011-04, “Fair Value Measurement (Topic 820): Amendments to Achieve Common Fair Value Measurement and Disclosure Requirements in U.S. GAAP and IFRSs”, which is intended to improve comparability of fair value measurements presented and disclosed in financial statements prepared in accordance with U.S. generally accepted accounting principles and International Financial Reporting Standards. This standard clarifies the application of existing fair value measurement requirements including (1) the application of the highest and best use valuation premise, (2) the methodology to measure the fair value of an instrument classified in a reporting entity’s shareholders’ equity, (3) disclosure requirements for quantitative information on Level 3 fair value measurements and (4) guidance on measuring the fair value of financial instruments managed within a portfolio. In addition, the standard requires additional disclosures of the sensitivity of fair value to changes in unobservable inputs for Level 3 securities. This standard is effective for interim and annual reporting periods ending on or after December 15, 2011. The adoption of this guidance is not expected to have a significant impact on the Company’s consolidated financial statements.
In June 2011, the FASB issued ASU No. 2011-05, “Presentation of Comprehensive Income”, which requires that comprehensive income be presented either in a single continuous statement of comprehensive income or in two separate but consecutive statements. The standard also requires entities to disclose on the face of the financial statements reclassification adjustments for items that are reclassified from other comprehensive income to net earnings. This standard no longer allows companies to present components of other comprehensive income only in the statement of equity. This standard is effective for interim and annual reporting periods beginning after December 15, 2011. The adoption of this guidance is not expected to have a significant impact on the Company’s consolidated financial statements other than the prescribed change in presentation.
(3) Acquisitions
Delphi Medical’s Contract Manufacturing Business — On August 6, 2010, the Company completed the acquisition of certain assets related to the contract manufacturing business of Delphi Medical Systems, LLC (“Delphi Medical” or “Delphi”). The purchase price was approximately $8.6 million, including additional
F-14
Table of Contents
consideration paid during the three months ended December 31, 2010 related to determination of the final inventory value. Total cash consideration paid of approximately $8.4 million, including a $2.0 million escrowed holdback, was net of approximately $0.2 million for the assumption of retained employee accruals and was financed entirely through the use of Company cash. The purchase agreement provides for the recovery from Delphi Medical of an amount up to $2.0 million, deposited in escrow at closing, for certain excess and obsolete inventory remaining on-hand at the end of the 18 month period from closing. These escrowed funds are additionally available for payment of potential seller indemnification obligations in relation to the agreement.
The acquired business, which is reported in the Company’s Medical segment, has added revenue from a new and diversified customer base and provides Sparton with a geographic presence in the western United States. Delphi Medical primarily manufactures OEM medical devices including blood separation equipment, spinal surgery products and 3-D eye mapping devices. It also provides engineering and manufacturing support to a market-leading environmental sensor company whose markets include meteorology, weather critical operations and controlled environment applications.
The following table represents the allocation of the total consideration to assets acquired and liabilities assumed from Delphi Medical based on Sparton’s estimate of their respective fair values (in thousands):
| Total purchase consideration |
$ | 8,419 | ||
| Assets acquired and liabilities assumed: |
||||
| Inventory |
10,806 | |||
| Equipment |
360 | |||
| Employee accruals assumed |
(197 | ) | ||
|
|
|
|||
| Total assets acquired and liabilities assumed |
10,969 | |||
|
|
|
|||
| Gain on acquisition |
$ | 2,550 | ||
|
|
|
|||
Sparton did not identify any material intangible assets in this acquisition. Sparton has determined that the fair value of the assets acquired and liabilities assumed related to this acquisition exceed the total purchase consideration and as a result the Company recorded a gain on acquisition of $2.4 million in the three months ended September 30, 2010. The gain was subsequently increased by $0.2 million based on adjustments to the opening inventory valuation. Sparton believes it was able to purchase this contract manufacturing business from Delphi Medical significantly below its fair value due to Delphi’s desire to liquidate this asset in a timely manner and focus on its core business.
Included in the Company’s Consolidated Statements of Operations for the year ended June 30, 2011 are net sales of approximately $39.0 million and income before provision for income taxes of approximately $6.0 million (including the $2.6 million gain on acquisition) resulting from the acquisition of Delphi Medical since August 6, 2010.
The Company incurred legal, professional and other costs related to this acquisition aggregating approximately $0.2 million. These costs were recognized as non-segment selling and administrative expenses of approximately $0.1 million and $0.1 million in the years ended June 30, 2011 and 2010, respectively.
On August 6, 2010 and concurrent with the acquisition of Delphi Medical, the Company entered into leases for two facilities housing the operations of this contract manufacturing business. During the year ended June 30, 2011, the Company initiated and completed the consolidation of the operations into one facility, and terminated the lease for the building which the Company exited.
Byers Peak — On March 4, 2011, the Company completed the acquisition of certain assets and assumption of certain liabilities of Byers Peak, Incorporated (“Byers Peak”) in an approximate $4.1 million all-cash
F-15
Table of Contents
transaction, after certain working capital adjustments. The transaction was financed through the use of Company cash and included an approximate $0.4 million holdback which is available to fund potential seller indemnification obligations in relation to the agreement.
The acquired business, which is reported in the Company’s Medical segment, provides further expansion into the therapeutic device market, diversifies Sparton’s customer base, and further expands the Company’s geographic reach into the western United States. Additionally, the acquisition increases Sparton’s offerings with the inclusion of field service and refurbishment capabilities. Byers Peak primarily manufactures medical devices for OEM and emerging technology companies in the Therapeutic device market, including devices for surgical navigation, RF energy generation, non-invasive pain relief, arterial disease, and kidney dialysis. It also has a field service and installation group that primarily provides water filtration and disinfection systems for the medical industry as well as device refurbishment programs. Additionally, Byers Peak provides electromechanical device manufacturing support for a limited number of customers outside of the medical industry.
The following table represents the allocation of the total consideration to assets acquired and liabilities assumed from Byers Peak based on Sparton’s estimate of their respective fair values (in thousands):
| Total purchase consideration |
$ | 4,140 | ||
|
|
|
|||
| Assets acquired and liabilities assumed: |
||||
| Accounts receivable, net |
$ | 1,334 | ||
| Inventory |
1,509 | |||
| Intangible assets — customer relationships |
1,300 | |||
| Intangible assets — non-compete agreements |
158 | |||
| Goodwill |
1,484 | |||
| Accounts payable |
(629 | ) | ||
| Customer deposits |
(973 | ) | ||
| Other current liabilities |
(43 | ) | ||
|
|
|
|||
| Total assets acquired and liabilities assumed |
$ | 4,140 | ||
|
|
|
Total purchase consideration was allocated to the tangible and identifiable intangible assets acquired and liabilities assumed based on their estimated fair values at the acquisition date. The Byers Peak acquisition resulted in approximately $1.5 million of goodwill, which is expected to be deductible for tax purposes and which was assigned entirely to the Company’s Medical segment. The Company believes goodwill primarily relates to the complementary strategic fit, resulting synergies and the acquired workforce that this business brings to existing operations. The fair values of acquired identifiable intangible assets were determined to be Level 3 under the fair value hierarchy and were estimated based on future cash flows and customer attrition rates, discounted using an estimated weighted average cost of capital. The customer relationships are being amortized using an accelerated methodology over ten years. The non-compete agreements are being amortized on a straight-line basis over two years as the ratable decline in value over time is most consistent with the contractual nature of these assets.
Included in the Company’s Consolidated Statements of Operations for the year ended June 30, 2011 are net sales of approximately $3.3 million and loss before provision for income taxes of approximately $0.1 million resulting from the acquisition of Byers Peak since March 4, 2011.
The Company incurred legal, professional and other costs related to this acquisition aggregating approximately $0.1 million. These costs were recognized as non-segment selling and administrative expenses during the year ended June 30, 2011.
On March 4, 2011 and concurrent with the acquisition of Byers Peak, the Company entered into a six month sublease for the facility housing the operations of this contract manufacturing business. The Company may, at its
F-16
Table of Contents
option, extend the term of this sublease for an additional eighteen month period. In conjunction with the Byers Peak acquisition, the Company has begun to consolidate the Byers Peak operations into the Company’s Frederick, Colorado facility. These restructuring activities are expected to be materially complete by the end of the Company’s fiscal 2012 second quarter.
Pro Forma Results — The following table summarizes, on a pro forma basis, the combined results of operations of the Company and the acquired contract manufacturing businesses of Delphi Medical and Byers Peak as though the acquisitions had occurred as of July 1, 2009. The pro forma amounts presented are not necessarily indicative of either the actual consolidated results had the acquisition occurred as of July 1, 2009 or of future consolidated operating results (in thousands, except per share amounts):
| For the Years Ended | ||||||||
| June 30, 2011 | June 30, 2010 | |||||||
| Net sales |
$ | 213,416 | $ | 213,023 | ||||
| Income (loss) before benefit from income taxes |
$ | (4,123 | ) | $ | 4,713 | |||
| Net income |
$ | 7,281 | $ | 6,629 | ||||
| Net income per share — basic |
$ | 0.71 | $ | 0.66 | ||||
| Net income per share — diluted |
$ | 0.71 | $ | 0.66 | ||||
(4) Inventories and Cost of Contracts in Progress, net
The following are the major classifications of inventory, net of interim billings, at June 30, 2011 and 2010 (in thousands):
| June 30, 2011 |
June 30, 2010 |
|||||||
| Raw materials |
$ | 35,695 | $ | 23,524 | ||||
| Work in process |
7,819 | 3,611 | ||||||
| Finished goods |
4,239 | 6,790 | ||||||
|
|
|
|
|
|||||
| Total inventory and cost of contracts in progress, gross |
47,753 | 33,925 | ||||||
| Inventory to which the U.S. government has title due to interim billings |
(9,001 | ) | (7,411 | ) | ||||
|
|
|
|
|
|||||
| Total inventory and cost of contracts in progress, net |
$ | 38,752 | $ | 26,514 | ||||
|
|
|
|
|
|||||
(5) Property, Plant and Equipment, net
Property, plant and equipment, net consists of the following at June 30, 2011 and 2010 (in thousands):
| June 30, 2011 |
June 30, 2010 |
|||||||
| Land and land improvements |
$ | 1,235 | $ | 1,235 | ||||
| Buildings and building improvements |
15,604 | 14,514 | ||||||
| Machinery and equipment |
14,250 | 12,342 | ||||||
| Construction in progress |
1,114 | 574 | ||||||
|
|
|
|
|
|||||
| Total property, plant and equipment |
32,203 | 28,665 | ||||||
| Less accumulated depreciation |
(20,808 | ) | (19,741 | ) | ||||
|
|
|
|
|
|||||
| Total property, plant and equipment, net |
$ | 11,395 | $ | 8,924 | ||||
|
|
|
|
|
|||||
At June 30, 2010, the Company had for sale its Bluewater Road property in Albuquerque, New Mexico and classified this property as Property held for sale. During February 2011, the Company sold its Bluewater Road property for approximately $4.2 million, resulting in a gain on sale of property, after commissions and closing
F-17
Table of Contents
costs, of approximately $0.1 million. During the fiscal years ended June 30, 2010 and 2009, based on third party appraisals, the Company recognized impairment charges of approximately $1.1 million and $0.8 million, respectively, related to this property to reduce the carrying value in accordance with ASC Topic 360, “Property, Plant and Equipment.” The non-segment impairment charges are included in Restructuring/impairment charges on the consolidated statements of operations and the reduction in carrying value recorded this property at estimated fair value less costs to sell in anticipation of its future sale.
Included in construction in progress at June 30, 2011 is approximately $0.5 million related to the expected implementation of a new enterprise resource planning system to be put into service in fiscal 2012.
(6) Goodwill and Other Intangible Assets
Changes in the carrying value of goodwill and ending composition of goodwill are as follows (in thousands):
| June 30, 2011 |
June 30, 2010 |
|||||||
| Goodwill, beginning of period |
$ | 19,141 | $ | 17,694 | ||||
| Additions to goodwill during the period |
1,484 | 1,447 | ||||||
| Impairment losses during the period |
(13,153 | ) | — | |||||
|
|
|
|
|
|||||
| Goodwill, end of period |
$ | 7,472 | $ | 19,141 | ||||
|
|
|
|
|
|||||
| June 30, 2011 |
June 30, 2010 |
|||||||
| Acquired Goodwill |
$ | 20,625 | $ | 19,141 | ||||
| Accumulated impairment |
(13,153 | ) | — | |||||
|
|
|
|
|
|||||
| Goodwill |
$ | 7,472 | $ | 19,141 | ||||
|
|
|
|
|
|||||
Sparton did not incur any significant costs to renew or alter the term of any of its intangible assets during the year ended June 30, 2011. The weighted average amortization period, gross carrying amount, accumulated amortization and net carrying value of intangible assets at June 30, 2011 and 2010 are as follows (in thousands):
| June 30, 2011 | ||||||||||||||||||||
| Amortization Period in Months |
Gross Carrying Amount |
Accumulated Amortization |
Accumulated Impairments |
Net Carrying Value |
||||||||||||||||
| Amortized intangible assets: |
||||||||||||||||||||
| Non-compete agreements |
24 | $ | 158 | $ | (26 | ) | $ | — | $ | 132 | ||||||||||
| Customer relationships |
120-180 | 7,900 | (2,316 | ) | (3,663 | ) | 1,921 | |||||||||||||
|
|
|
|
|
|
|
|
|
|||||||||||||
| $ | 8,058 | $ | (2,342 | ) | $ | (3,663 | ) | $ | 2,053 | |||||||||||
|
|
|
|
|
|
|
|
|
|||||||||||||
| June 30, 2010 | ||||||||||||||||||||
| Amortized intangible assets: |
||||||||||||||||||||
| Customer relationships |
180 | $ | 6,600 | $ | — | $ | (1,797 | ) | $ | 4,803 | ||||||||||
F-18
Table of Contents
Amortization expense for each of the years ended June 30, 2011, 2010 and 2009 was approximately $0.5 million. Aggregate amortization expense relative to existing intangible assets for the periods shown is currently estimated to be as follows (in thousands):
| Fiscal Year Ending June 30, |
||||
| 2012 |
$ | 435 | ||
| 2013 |
372 | |||
| 2014 |
283 | |||
| 2015 |
247 | |||
| 2016 |
210 | |||
| Thereafter |
506 | |||
|
|
|
|||
| Total |
$ | 2,053 | ||
|
|
|
|||
(7) Debt
Short-term debt maturities and revolving line of credit — Short-term debt at June 30, 2011 and 2010 reflects the current portion of the Company’s industrial revenue bonds of approximately $0.1 million.
The Company has $20 million of maximum borrowing availability, subject to certain collateral restrictions, under a revolving line-of-credit facility (the “Facility”) provided in August 2009 by National City Business Credit, Inc. (now PNC Bank, National Association) to support working capital needs and other general corporate purposes. The line-of-credit facility is secured by substantially all of the assets of the Company. Outstanding borrowings bear interest at a variable rate defined as the Bank’s minimum base rate plus a specified margin, each component of which is determined separately for domestic and Eurodollar rate loans. The Facility was amended in March 2011 to reduce the interest rates on domestic and Eurodollar rate based loans, which at June 30, 2011 would have ranged from 3.19% to 5.25% per annum. Prior to the Facility amendment, the Company was subject to higher rates, with a minimum rate of 7% per annum. As a condition of the Facility, the Company is subject to certain customary covenants, which it was in compliance with at June 30, 2011. The Company had no borrowings drawn against the Facility during the years ended June 30, 2011 and 2010, however it did have certain letters of credit outstanding totaling $0.5 million. The maturity date for the line-of-credit is August 14, 2012. The Company’s prior line of credit was retired on August 14, 2009.
Long-term debt — Long-term debt consists of the following at June 30, 2011 and 2010 (in thousands):
| June 30, 2011 |
June 30, 2010 |
|||||||
| Industrial revenue bonds, face value |
$ | 1,899 | $ | 2,029 | ||||
| Less unamortized purchase discount |
(103 | ) | (112 | ) | ||||
|
|
|
|
|
|||||
| Industrial revenue bonds, carrying value |
1,796 | 1,917 | ||||||
| Less: current portion |
(126 | ) | (121 | ) | ||||
|
|
|
|
|
|||||
| Long-term debt, net of current portion |
$ | 1,670 | $ | 1,796 | ||||
|
|
|
|
|
|||||
Industrial Revenue Bonds
In connection with its acquisition of Astro in May 2006, the Company assumed repayment of principal and interest on bonds originally issued to Astro by the State of Ohio. These bonds are Ohio State Economic Development Revenue Bonds, series 2002-4. Astro originally entered into the loan agreement with the State of Ohio for the issuance of these bonds to finance the construction of the Company’s Ohio operating facility. The principal amount, including premium, was issued in 2002 and totaled approximately $2.9 million. These bonds have interest rates which vary, dependent on the maturity date of the bonds ranging from 5.00% to 5.45%. Due to an increase in interest rates since the original issuance of the bonds, a discount amounting to approximately $0.2 million on the date of assumption by Sparton was recorded.
F-19
Table of Contents
The bonds carry certain sinking fund requirements generally obligating the Company to make monthly deposits of one twelfth of the annual obligation plus accrued interest. The purchase discount is being amortized ratably over the remaining term of the bonds. Amortization expense for the years ended June 30, 2011, 2010 and 2009 was approximately $9,000, $10,000 and $9,000, respectively. The Company also has an irrevocable letter of credit in the amount of approximately $0.3 million, which is renewable annually, to secure repayment of a portion of the bonds.
Scheduled principal maturities on these bonds for each of the five years succeeding June 30, 2011 and thereafter are summarized as follows ($ in thousands):
| Year ending June 30, |
Face Amount |
Amortization of Purchase Discount |
Carrying Value |
Stated Interest Rate |
||||||||||||
| 2012 |
$ | 136 | $ | 10 | $ | 126 | 5.00 | % | ||||||||
| 2013 |
140 | 9 | 131 | 5.00 | ||||||||||||
| 2014 |
146 | 10 | 136 | 5.00 | ||||||||||||
| 2015 |
156 | 9 | 147 | 5.00 | ||||||||||||
| 2016 |
161 | 10 | 151 | 5.45 | ||||||||||||
| 2017 – 2022 |
1,160 | 55 | 1,105 | 5.45 | ||||||||||||
|
|
|
|
|
|
|
|||||||||||
| $ | 1,899 | $ | 103 | $ | 1,796 | |||||||||||
|
|
|
|
|
|
|
|||||||||||
Notes Payable — Former Owners of Astro
Two notes payable with initial principal of $3.75 million each, totaling $7.5 million, were payable to the sellers of Astro, which is now operated under the Medical segment. These notes were repaid over four years, in aggregate semi-annual payments of principal and interest in the combined amount of approximately $1.1 million on June 1 and December 1 of each year. Payments commenced on December 1, 2006. These notes each bore interest at 5.5% per annum. The notes were proportionately secured by the stock of Astro. On June 1, 2010, the Company made the final payments in satisfaction of these notes.
Bank Term Loan
The bank term loan, provided by National City Bank with an original principal of $10.0 million, was being repaid over five years, with quarterly principal payments of $0.5 million which commenced September 1, 2006. This loan bore interest at the variable rate of LIBOR plus 500 basis points, with interest calculated and paid quarterly along with the principal payment. The debt was secured by substantially all assets of the Company. On August 14, 2009, the Company paid off this term loan with a cash payment in connection with the Facility.
(8) Income Taxes
Income (loss) before income taxes by country consists of the following amounts (in thousands):
| For the Year Ended June 30, | ||||||||||||
| 2011 | 2010 | 2009 | ||||||||||
| United States |
$ | (5,072 | ) | $ | 6,039 | $ | (9,930 | ) | ||||
| Canada |
10 | (922 | ) | (3,921 | ) | |||||||
| Vietnam |
1,119 | 407 | (115 | ) | ||||||||
|
|
|
|
|
|
|
|||||||
| $ | (3,943 | ) | $ | 5,524 | $ | (13,966 | ) | |||||
|
|
|
|
|
|
|
|||||||
F-20
Table of Contents
The provision (credit) for income taxes consists of the following components (in thousands):
| For the Year Ended June 30, | ||||||||||||
| 2011 | 2010 | 2009 | ||||||||||
| Current: |
||||||||||||
| United States |
$ | — | $ | (2,334 | ) | $ | — | |||||
| Canada |
(128 | ) | — | (96 | ) | |||||||
| State and local |
— | — | — | |||||||||
|
|
|
|
|
|
|
|||||||
| (128 | ) | (2,334 | ) | (96 | ) | |||||||
| Deferred: |
||||||||||||
| United States |
(10,762 | ) | 418 | 1,035 | ||||||||
| Canada |
— | — | 848 | |||||||||
| State and local |
(514 | ) | — | — | ||||||||
|
|
|
|
|
|
|
|||||||
| (11,276 | ) | 418 | 1,883 | |||||||||
|
|
|
|
|
|
|
|||||||
| $ | (11,404 | ) | $ | (1,916 | ) | $ | 1,787 | |||||
|
|
|
|
|
|
|
|||||||
The consolidated effective income tax (credit) rate differs from the statutory U.S. federal tax rate for the following reasons and by the following percentages:
| For the Year Ended June 30, | ||||||||||||
| 2011 | 2010 | 2009 | ||||||||||
| Statutory U.S. federal income tax (credit) rate |
(34.0 | )% | 34.0 | % | (34.0 | )% | ||||||
| Significant increases (reductions) resulting from: |
||||||||||||
| Changes in valuation allowance |
(242.0 | ) | (69.2 | ) | 45.7 | |||||||
| Canadian tax benefits |
(3.2 | ) | — | — | ||||||||
| Foreign (income) loss with no tax (expense) benefit |
(9.6 | ) | (2.5 | ) | 0.3 | |||||||
| State and local income taxes, net of federal benefit |
(1.3 | ) | — | — | ||||||||
| Other |
0.9 | 3.0 | 0.8 | |||||||||
|
|
|
|
|
|
|
|||||||
| Effective income tax (credit) rate |
(289.2 | )% | (34.7 | )% | 12.8 | % | ||||||
|
|
|
|
|
|
|
|||||||
F-21
Table of Contents
Significant components of deferred income tax assets and liabilities at June 30, 2011 and 2010, are as follows (in thousands):
| June 30, 2011 |
June 30, 2010 |
|||||||
| Deferred tax assets: |
||||||||
| U.S. net operating loss carryovers |
$ | 2,257 | $ | 5,364 | ||||
| Impairment of intangible asset |
1,246 | — | ||||||
| Impairment of goodwill |
4,472 | — | ||||||
| Environmental remediation |
1,435 | 1,543 | ||||||
| Inventories |
1,513 | 921 | ||||||
| Employment and compensation accruals |
672 | 708 | ||||||
| State tax carryovers |
328 | 559 | ||||||
| Canadian tax benefits |
2,062 | 2,193 | ||||||
| Equity investment |
299 | 299 | ||||||
| Pension liability |
449 | 1,183 | ||||||
| Restructuring accruals |
30 | 71 | ||||||
| Property, plant and equipment impairment |
— | 649 | ||||||
| Other |
592 | 388 | ||||||
|
|
|
|
|
|||||
| Gross deferred tax assets |
15,355 | 13,878 | ||||||
| Less valuation allowance |
(2,373 | ) | (13,091 | ) | ||||
|
|
|
|
|
|||||
| Total deferred tax assets |
12,982 | 787 | ||||||
| Deferred tax liabilities: |
||||||||
| Property, plant and equipment |
(509 | ) | (569 | ) | ||||
| Pension costs |
(331 | ) | (122 | ) | ||||
| Goodwill and other intangibles |
(1,928 | ) | (1,483 | ) | ||||
| Other |
(57 | ) | (135 | ) | ||||
|
|
|
|
|
|||||
| Gross deferred tax liabilities |
(2,825 | ) | (2,309 | ) | ||||
|
|
|
|
|
|||||
| Net deferred tax assets (liabilities) |
$ | 10,157 | $ | (1,522 | ) | |||
|
|
|
|
|
|||||
Net deferred income tax liabilities are included in the balance sheets at June 30, 2011 and 2010, as follows (in thousands):
| June 30, 2011 |
June 30, 2010 |
|||||||
| U.S. net deferred income tax assets, current |
$ | 4,417 | $ | 57 | ||||
| U.S. net deferred income tax assets (liabilities), non-current |
5,740 | (1,579 | ) | |||||
|
|
|
|
|
|||||
| $ | 10,157 | $ | (1,522 | ) | ||||
|
|
|
|
|
|||||
In 2010 and 2009, the Company recorded valuation allowances against substantially all of its net deferred tax assets as management believed that the realization of the deferred tax assets related to the net operating loss carryovers and the other net temporary timing differences while possible, was not more likely than not. In 2011, the Company restored a large portion of the deferred tax assets as the Company now believed that the realization of the remaining net operating loss carryovers and the other net temporary timing differences is more likely than not. In making these decisions to both record a valuation allowance and restore the net deferred tax assets, the Company considered all available positive and negative evidence, including future reversals of taxable temporary differences, projected future taxable income, tax planning strategies, and recent financial results. For U.S. income tax purposes, approximately $6.6 million of net operating loss carryovers are available to offset future Federal taxable income as of June 30, 2011, of which $4.7 million and $1.9 million expire in 2029 and 2028,
F-22
Table of Contents
respectively. For state income tax purposes, the Company also has approximately $4.9 million of net operating loss carryovers, of which $1.7 million expire in 2029, $3.1 million expire in 2028 and $0.1 million expire in 2027. For financial reporting purposes, valuation allowances related to state income tax carryovers and stock options in the amounts of $0.1 million and $0.2 million, respectively, have been established as of June 30, 2011 and are included within the total valuation amount. The excess tax benefit of $0.2 million related to stock options reporting will be credited to “capital in excess of par value” in the year that the net operating loss carryovers are fully utilized.
As a result of new tax legislation enacted in November 2009, the Company elected to carry back a portion of its fiscal 2008 accumulated net operating loss to fiscal 2003, with this carryback generating a federal income tax refund of $1.7 million. In addition, the Internal Revenue Service issued an industry directive providing guidance for extending the carryback period to ten years for losses related to environmental remediation. The Company elected to carryback its remediation losses from fiscal years 2006 through 2009, generating a federal income tax refund of $0.6 million. As of June 30, 2010, the Company has received $2.0 million of the $2.3 million in refund claims. In conjunction with these carryback tax filings, the Company released $2.3 million of its deferred tax asset valuation allowance in 2010.
In prior years, a valuation allowance was established for the deferred tax asset related to the Canadian operations. As of June 30, 2011 and 2010, the deferred tax assets totaled $2.1 million and $2.2 million, respectively. Due to the decision to cease Canadian operations, a full valuation allowance was recorded and has not been released. The Company elected to carry back a portion of its fiscal 2009 Canadian net operating loss to fiscal 2008, with this carryback generating a Canadian income tax refund of $0.1 million. In conjunction with this carryback filing, the Company released $0.1 million of its Canadian deferred tax asset valuation allowance.
The Company’s operations in Vietnam are subject to a four-year tax holiday from the time the entity begins to generate taxable income, with the possible extension to an eight-year tax holiday. Without the extension of the holiday to eight years, the Vietnamese facility’s taxable income will be subject to a tax rate of 12.5% (or 50% of the normal income state rate) for fiscal years 2012 to 2015. From 2016 forward, the tax rate will be at the full 25%. The Company’s Vietnamese operations resulted in taxable income in 2011 and 2010, and no taxable income in 2009. Due to the Vietnam tax holiday associated with this facility, no tax expense was recorded for fiscal 2011 or 2010, and no benefit is available to be recognized for 2009.
The deferred tax asset valuation allowance in fiscal 2011, 2010 and 2009 includes (decreases) increases of $(1.1 million), $(0.5 million), and $0.2 million, respectively, which amounts were allocated directly to shareholders’ equity against deferred taxes related to unrecognized pension costs as (recoveries)/charges to the components of accumulated other comprehensive loss.
Based on its evaluation, the Company has concluded that there are no significant uncertain tax positions requiring recognition in the Company’s financial statements. The Company’s evaluation was performed for the fiscal years 2007 through 2011, the years which remain subject to examination by major tax jurisdictions as of June 30, 2011. The Company does not expect the total amount of unrecognized tax benefits to increase in the next twelve months. It is possible that the Company may from time to time be assessed interest or penalties by major tax jurisdictions, although any such assessments historically have been minimal and immaterial to our financial results. Any assessment for interest and/or penalties would be classified in the financial statements as selling and administrative expenses. The Company does not have any amounts accrued for interest and penalties at June 30, 2011, and is not aware of any claims for such amounts by federal, state or foreign taxing authorities.
F-23
Table of Contents
(9) Employee Retirement Benefit Plans
Defined Benefit Pension Plan
As of June 30, 2011, approximately 400 employees and retirees of the Company are covered by a defined benefit pension plan. Effective April 1, 2009, participation and the accrual of benefits in this pension plan were frozen, at which time all participants became fully vested. As a result of this freeze, an approximate $0.3 million curtailment charge was recognized during the year ended June 30, 2009, related to the acceleration of all remaining prior service costs previously being amortized over future periods. In addition, lump-sum benefit distributions during fiscal years 2011, 2010 and 2009 exceeded plan service and interest costs, resulting in lump-sum settlement charges of approximately $0.1 million, $0.8 million and $1.1 million also being recognized during the respective years.
The components of net periodic pension expense for the years ended June 30, 2011, 2010 and 2009 were as follows (in thousands):
| For the Year Ended June 30, | ||||||||||||
| 2011 | 2010 | 2009 | ||||||||||
| Service cost |
$ | — | $ | — | $ | 350 | ||||||
| Interest cost |
447 | 575 | 651 | |||||||||
| Expected return on plan assets |
(438 | ) | (403 | ) | (474 | ) | ||||||
| Amortization of prior service cost |
— | — | 69 | |||||||||
| Amortization of unrecognized net actuarial loss |
235 | 374 | 389 | |||||||||
|
|
|
|
|
|
|
|||||||
| Net periodic benefit cost |
244 | 546 | 985 | |||||||||
| Curtailment charge |
— | — | 333 | |||||||||
| Pro rata recognition of lump-sum settlements |
128 | 785 | 1,133 | |||||||||
|
|
|
|
|
|
|
|||||||
| Total periodic pension expense |
$ | 372 | $ | 1,331 | $ | 2,451 | ||||||
|
|
|
|
|
|
|
|||||||
The weighted average assumptions used to determine benefit obligations and net periodic benefit cost for fiscal 2011, 2010 and 2009 were as follows:
| Benefit Obligation | Benefit Cost | |||||||||||||||||||||||
| 2011 | 2010 | 2009 | 2011 | 2010 | 2009 | |||||||||||||||||||
| Discount rate (1) |
5.50 | % | 5.50 | % | 6.40 | % | 5.50 | % | 6.40 | % | 6.75 | % | ||||||||||||
| Rate of compensation increase (2) |
0.00 | % | 0.00 | % | 0.00 | % | 0.00 | % | 0.00 | % | 4.00 | % | ||||||||||||
| Expected long-term rate on plan assets (3) |
7.50 | % | 7.50 | % | 7.50 | % | 7.50 | % | 7.50 | % | 7.50 | % | ||||||||||||
| (1) | In fiscal 2009, a discount rate of 6.50% was used through February 28, 2009, the date the plan was frozen; a discount rate of 6.75% was used the remainder of fiscal 2009. The Company determines its assumption for the discount rate on an index of high-quality corporate bond yields and matching-funding yield curve analysis. |
| (2) | As of June 30, 2009, the rate of compensation increase for calculation of the benefit obligation was 0.0% due the freezing of the plan as of April 1, 2009. |
| (3) | The expected long-term rate of return for plan assets is based on analysis of historical data and future expectations relevant to the investments and consistency with the assumed rate of inflation implicit in the market. |
Prior to July 1, 2008, March 31 was used as the measurement date for the defined benefit plan. In accordance with the measurement date requirements of ASC 715-20, “Compensation — Retirement Benefits — Defined Benefit Plans”, beginning with fiscal 2009, a June 30 measurement date was elected for our defined benefit pension plan using a 15 month net periodic benefit cost based on the March 31, 2008 actuarial valuation (“alternative transition method”). Accordingly, one-fifth of the net periodic benefit cost for such 15-month
F-24
Table of Contents
period, net of tax, was allocated as a direct adjustment to retained earnings in the amount of approximately $0.3 million in accordance with the transition provisions of the standard to reflect the change in measurement dates. In addition, to the extent the net periodic benefit cost included amortization of unrecognized actuarial losses and prior service cost, which were previously recognized as a component of accumulated other comprehensive loss at June 30, 2008, at that date there was also a direct charge to accumulated other comprehensive loss, net of tax, of approximately $0.1 million.
At June 30, 2011 and 2010, as a result of the fiscal 2009 plan curtailment, the accumulated benefit obligation is equal to the projected benefit obligation. The following tables summarize the changes in benefit obligations, plan assets and funded status of the plan at June 30, 2011 and 2010 (in thousands):
| June 30, 2011 |
June 30, 2010 |
|||||||
| Change in prepaid (accrued) benefit cost: |
||||||||
| Prepaid (accrued) benefit cost at beginning of fiscal year |
$ | 360 | $ | (266 | ) | |||
| Net periodic benefit cost for fiscal year |
(244 | ) | (546 | ) | ||||
| Pro rata recognition of lump-sum settlements |
(128 | ) | (785 | ) | ||||
| Employer contributions to plan |
984 | 1,957 | ||||||
|
|
|
|
|
|||||
| Prepaid benefit cost at end of fiscal year |
$ | 972 | $ | 360 | ||||
|
|
|
|
|
|||||
| Change in projected benefit obligation: |
||||||||
| Projected benefit obligation at beginning of fiscal year |
$ | 9,008 | $ | 10,194 | ||||
| Service cost |
— | — | ||||||
| Interest cost |
447 | 575 | ||||||
| Actuarial experience and changes in assumptions |
(155 | ) | 525 | |||||
| Benefits paid |
(1,084 | ) | (2,286 | ) | ||||
|
|
|
|
|
|||||
| Projected benefit obligation at end of fiscal year |
$ | 8,216 | $ | 9,008 | ||||
|
|
|
|
|
|||||
| Change in plan assets: |
||||||||
| Fair value of plan assets at beginning of fiscal year |
$ | 5,889 | $ | 5,036 | ||||
| Employer contributions |
984 | 1,957 | ||||||
| Actual return on plan assets |
2,080 | 1,182 | ||||||
| Benefits paid |
(1,084 | ) | (2,286 | ) | ||||
|
|
|
|
|
|||||
| Fair value of plan assets at end of fiscal year |
$ | 7,869 | $ | 5,889 | ||||
|
|
|
|
|
|||||
| Amounts recognized in the Consolidated Balance Sheets: |
||||||||
| Current portion of pension liability |
$ | (306 | ) | $ | (1,139 | ) | ||
| Pension liability — non-current portion |
(41 | ) | (1,980 | ) | ||||
|
|
|
|
|
|||||
| Funded status — total balance sheet liability |
$ | (347 | ) | $ | (3,119 | ) | ||
|
|
|
|
|
|||||
The Company’s policy is to fund the plan based upon legal requirements and tax regulations. For fiscal 2012, based upon current actuarial calculations and assumptions, a cash contribution of approximately $0.3 million, reflective of required funding and discretionary funding is anticipated to ensure funding levels are in excess of 80%. These anticipated contributions are reflected as the current portion of the pension liability as of June 30, 2011. During the years ended June 30, 2011 and 2010, approximately $1.0 million and $2.0 million, respectively, was contributed to the pension plan, reflective of required funding and discretionary funding to ensure funding levels are in excess of 80%.
F-25
Table of Contents
Pension related amounts recognized in other comprehensive income (loss), excluding tax effects, for the years ended June 30, 2011, 2010 and 2009 are as follows (in thousands):
| For the Year Ended June 30, |
||||||||||||
| 2011 | 2010 | 2009 | ||||||||||
| Amortization of prior service cost |
$ | — | $ | — | $ | 69 | ||||||
| Amortization of unrecognized net actuarial loss |
235 | 374 | 389 | |||||||||
| Curtailment charge |
— | — | 333 | |||||||||
| Pro rata recognition of lump-sum settlements |
128 | 785 | 1,133 | |||||||||
| Net actuarial gain (loss) |
1,797 | 254 | (1,810 | ) | ||||||||
|
|
|
|
|
|
|
|||||||
| Total recognized in other comprehensive income (loss) |
$ | 2,160 | $ | 1,413 | $ | 114 | ||||||
|
|
|
|
|
|
|
|||||||
The amounts in accumulated other comprehensive loss on the consolidated balance sheets, excluding tax effects, that have not yet been recognized as components of net periodic benefit cost at June 30, 2011 and 2010 are as follows (in thousands):
| June 30, 2011 |
June 30, 2010 |
|||||||
| Accumulated other comprehensive loss: |
||||||||
| Net actuarial loss |
$ | 1,319 | $ | 3,479 | ||||
| Net prior service cost |
— | — | ||||||
|
|
|
|
|
|||||
| Total |
$ | 1,319 | $ | 3,479 | ||||
|
|
|
|
|
|||||
The estimated amount that will be amortized from accumulated other comprehensive loss, pre-tax, into net periodic pension cost in fiscal 2012 is expected to total approximately $0.4 million, consisting of amortization of unrecognized actuarial loss as well as lump sum settlement charges.
Expected benefit payments for the defined benefit pension plan for the next ten fiscal years are as follows (in thousands):
| Fiscal Year Ended June 30, |
||||
| 2012 |
$ | 860 | ||
| 2013 |
877 | |||
| 2014 |
811 | |||
| 2015 |
772 | |||
| 2016 |
714 | |||
| 2017 – 2021 |
2,733 | |||
|
|
|
|||
| Total |
$ | 6,767 | ||
|
|
|
|||
The Company’s investment policy related to pension plan assets is based on a review of the actuarial and funding characteristics of the plan. Capital market risk and return opportunities are also considered. The investment policy’s primary objective is to achieve a long-term rate of return consistent with the actuarially determined requirements of the plan, as well as maintaining an asset level sufficient to meet the plan’s benefit obligations. A target allocation range between asset categories has been established to enable flexibility in investment, allowing for a better alignment between the long-term nature of pension plan liabilities, invested assets, and current and anticipated market returns on those assets.
F-26
Table of Contents
Below is a summary of pension plan asset allocations as of June 30, 2011 and 2010, by asset category:
| Weighted Average
Allocation For the Year Ended June 30, |
||||||||||||
| Target | 2011 | 2010 | ||||||||||
| Equity securities |
40-70 | % | 61 | % | 64 | % | ||||||
| Fixed income (debt) securities |
30-60 | % | 26 | % | 31 | % | ||||||
| Cash and cash equivalents |
0-10 | % | 13 | % | 5 | % | ||||||
|
|
|
|
|
|||||||||
| 100 | % | 100 | % | |||||||||
|
|
|
|
|
|||||||||
The fair value of all the defined benefit pension plan assets is based on quoted prices in active markets for identical assets which are considered Level 1 inputs within the fair value hierarchy described in Note 2. The total estimated fair value of plan assets by asset class at June 30, 2011 and 2010 were as follows (in thousands):
| June 30, 2011 |
June 30, 2010 |
|||||||
| Asset Class: |
||||||||
| Equity securities: |
||||||||
| Directly held corporate stock — Sparton (a) |
$ | 1,873 | $ | 1,254 | ||||
| Directly held corporate stock — Large Cap |
1,512 | 1,243 | ||||||
| Registered investment companies — Mid-Cap Value |
205 | 189 | ||||||
| Registered investment companies — Mid-Cap Growth |
221 | 192 | ||||||
| Registered investment companies — Small-Cap |
309 | 253 | ||||||
| Registered investment companies — International |
719 | 610 | ||||||
| Fixed income (debt) securities: |
||||||||
| Registered investment companies — Intermediate Bond |
2,018 | 1,840 | ||||||
| Cash and cash equivalents |
1,012 | 308 | ||||||
|
|
|
|
|
|||||
| Total assets measured at fair value |
$ | 7,869 | $ | 5,889 | ||||
|
|
|
|
|
|||||
| (a) | Shares of Sparton stock held by the defined benefit pension plan at June 30, 2011 and 2010 were 183,259 and 249,259, respectively. |
Defined Contribution Plans
Substantially all of the Company’s U.S. employees are eligible to participate in the Company’s 401(k) defined contribution plan. The plan allows employees to contribute up to 100% of their eligible compensation up to a maximum amount allowed by law and provides that the Company may, at its discretion, make matching contributions, profit sharing contributions or qualified non-elective contributions. Prior to April 1, 2009, the plan provided for Company matching of 50% of participants’ basic contributions on up to 6% of their eligible compensation. Effective April 1, 2009, the Company suspended its matching contribution in the Sparton Corporation 401(k) plan. Matching contributions were reinstated effective February 1, 2010, with the Company again matching 50% of participants’ basic contributions on up to 6% of their eligible compensation.
At the election of the participant, both employee and employer contributions may be invested in any of the available investment options under the plan, which election options include Sparton common stock. An employee’s total investment in Sparton common stock is subject to a 20% limitation of the total value of the participant’s account. As of June 30, 2011, approximately 162,000 shares of Sparton common stock were held in the 401(k) plan. Amounts expensed related to the Company’s matching contributions and administrative expenses for the plan were approximately $0.5 million, $0.2 million and $0.6 million for the years ended June 30, 2011, 2010 and 2009, respectively. As of June 30, 2011, plan assets totaled approximately $22.7 million.
F-27
Table of Contents
(10) Commitments and Contingencies
Operating Leases — The Company is obligated under operating lease agreements for a portion of its production machinery and data processing equipment. Such leases, some of which are non-cancelable and in many cases include purchase or renewal options, expire at various dates and typically provide for monthly payments over a fixed term in equal, non- escalating amounts. Generally, the Company is responsible for maintenance, insurance and taxes relating to these leased assets. The Company is additionally obligated under operating lease agreements for its corporate headquarters in Schaumburg, Illinois and its manufacturing plant in Frederick, Colorado. Each of these leases provide for escalating minimum monthly base rental payments, require the Company to provide for maintenance, insurance and property taxes in addition to minimum monthly base rental and include renewal options. At June 30, 2011, the future minimum annual lease payments under these agreements are as follows (in thousands):
| June 30, |
||||
| 2012 |
$ | 1,732 | ||
| 2013 |
982 | |||
| 2014 |
612 | |||
| 2015 |
610 | |||
| 2016 |
498 | |||
| Thereafter |
618 | |||
|
|
|
|||
| Total |
$ | 5,052 | ||
|
|
|
|||
Rent expense was approximately $2.7 million, $3.6 million and $5.6 million, respectively, for the years ended June 30, 2011, 2010 and 2009. Included in rent expense for the years ended June 30, 2011 and 2010 was approximately $0.2 million and $0.1 million, respectively, of contingent rent expense primarily relating to the Company’s corporate headquarters in Schaumburg, Illinois and, in the case of fiscal 2011, its Frederick, Colorado facility.
Environmental Remediation — Sparton has been involved with ongoing environmental remediation since the early 1980’s related to one of its former manufacturing facilities, located in Albuquerque, New Mexico (“Coors Road”). Although the Company entered into a long-term lease of the Coors Road property that was accounted for as a sale of property during fiscal 2010, it remains responsible for the remediation obligations related to its past operation of this facility. At June 30, 2011, Sparton had accrued approximately $4.2 million as its estimate of the remaining minimum future undiscounted financial liability with respect to this matter, of which approximately $0.4 million is classified as a current liability and included on the balance sheet in other accrued expenses. The Company’s minimum cost estimate is based upon existing technology and excludes certain legal costs, which are expensed as incurred. The Company’s estimate includes equipment and operating and maintenance costs for onsite and offsite pump and treat containment systems, as well as continued onsite and offsite monitoring. It also includes periodic reporting requirements.
On October 15, 2009, approximately $3.1 million of cash was utilized to establish a trust, the Sparton Corporation Financial Assurance Trust, for remediation activity. The funds were held in Sparton’s name and were invested with Sparton receiving the benefit of the investment return. As of June 30, 2010, approximately $3.2 million was held in this trust and reflected as restricted cash on the consolidated balance sheet. These funds were available for use against the expected remediation liability. The trust was established to meet the United States Environmental Protection Agency’s (“EPA”) financial assurance requirements for the fiscal year ended June 30, 2010, with trust funds to be drawn upon only should Sparton not continue to meet its financial remediation requirements. The trust was to remain in place until the Company could again satisfy the EPA financial assurance requirements through compliance with financial ratios, as was previously attained on an annual basis until fiscal year 2009. Based on the Company’s financial results for fiscal year 2010, the Company was again in compliance with the financial ratios and dissolved the trust during October 2010.
F-28
Table of Contents
In fiscal 2003, Sparton reached an agreement with the United States Department of Energy (“DOE”) and others to recover certain remediation costs. Under the settlement terms, Sparton received cash and obtained some degree of risk protection as the DOE agreed to reimburse Sparton for 37.5% of certain future environmental expenses in excess of $8.4 million incurred from the date of settlement, if any, of which approximately $3.6 million has been expended as of June 30, 2011 toward the $8.4 million threshold. Uncertainties associated with environmental remediation contingencies are pervasive and often result in wide ranges of reasonably possible outcomes. Estimates developed in the early stages of remediation can vary significantly. Normally a finite estimate of cost does not become fixed and determinable at a specific point in time. Rather, the costs associated with environmental remediation become estimable over a continuum of events and activities that help to frame and define a liability. Factors which cause uncertainties for the Company include, but are not limited to, the effectiveness of the current work plans in achieving targeted results and proposals of regulatory agencies for desired methods and outcomes. It is possible that cash flows and results of operations could be materially affected by the impact of changes associated with the ultimate resolution of this contingency. At June 30, 2011, the Company estimates that it is reasonably possible, but not probable, that future environmental remediation costs associated with the Company’s past operations at the Coors Road property, in excess of amounts already recorded and net of DOE reimbursement, could be up to $1.9 million before income taxes over the next approximately twenty years.
The Company and its subsidiaries are also involved in certain existing compliance issues with the EPA and various state agencies, including being named as a potentially responsible party at several sites. Potentially responsible parties (“PRP”s) can be held jointly and severally liable for the clean-up costs at any specific site. The Company’s past experience, however, has indicated that when it has contributed relatively small amounts of materials or waste to a specific site relative to other PRPs, its ultimate share of any clean-up costs has been minor. Based upon available information, the Company believes it has contributed only small amounts to those sites in which it is currently viewed as a PRP.
Customer Relationships — The Company had an action before the U.S. Court of Federal Claims to recover damages arising out of an alleged infringement by the U.S. Navy of certain patents held by Sparton and used in the production of sonobuoys. Pursuant to an agreement between the Company and counsel conducting the litigation, a significant portion of the claim will be retained by the Company’s counsel in contingent fees if the litigation is successfully concluded. A trial of the matter was conducted by the court in April 2008, with a decision against Sparton filed in August 2009 and published in September 2009. In October 2009, an appeal of this unfavorable decision was filed with the Federal Circuit Court of Appeals. Based on this decision, management believes that the Company’s ability to obtain any recovery with respect to the claim is remote.
Litigation — On August 9, 2009, Sparton and certain subsidiaries were named as defendants in a wrongful death suit, alleging that a defective transmission shifter assembly in a 1996 Chrysler automobile caused a July 2007 death. The suit also named Chrysler LLC, Dura Automotive Systems, Inc., and Chandler Motors Company as defendants. The suit was filed in Pontotoc County Circuit Court in Mississippi. Sparton has not manufactured automotive shifter assemblies for Chrysler since December 1996, when it sold its KPI Group subsidiary to Dura Automotive Systems, Inc. The plaintiff sought damages for economic loss, pain and suffering, and loss of companionship, as well as punitive damages. After Sparton filed a motion for summary judgment, and after plaintiff took the deposition of a Chrysler representative who testified that Sparton had nothing to do with the design of any shifters KPI may have manufactured, plaintiff consented to the entry of judgment for Sparton on all claims. An order dismissing all claims against Sparton with prejudice was submitted to the Court and was entered on August 10, 2011, thereby closing this litigation against Sparton.
Other — In addition to the foregoing, from time to time, the Company is involved in various legal proceedings relating to claims arising in the ordinary course of business. The Company is not currently a party to any other such legal proceedings, the adverse outcome to which, individually or in the aggregate, is expected to have a material adverse effect on our business, financial condition or results of operations.
F-29
Table of Contents
(11) Stock-Based Compensation
The Company has two long-term incentive plans. The Sparton Corporation Stock Incentive Plan, as amended and restated (the “2001 Plan”) was approved by the Company’s shareholders on October 24, 2001. The Sparton Corporation 2010 Long-Term Incentive Plan (the “2010 Plan”) was approved by the Company’s shareholders on October 28, 2009.
2001 Plan. Under the 2001 Plan, the Company may grant to employees and non-employee directors incentive or non-qualified stock options, stock appreciation rights, restricted stock and other stock-based awards. All of the stock options issued to date under the 2001 Plan have either three, five or ten-year lives with either immediate vesting or vesting on an annual basis over four years beginning one year after grant date. Restricted stock awards granted to date to employees under the 2001 Plan vest annually over periods ranging from approximately 2.5 to 3.5 years. Unrestricted stock awards granted to date under the 2001 Plan represent annual stock grants to directors as a component of their overall compensation. The 2001 Plan’s termination date with respect to the granting of new awards is October 24, 2011. The total number of shares that may be granted under the 2001 Plan is 970,161 shares of the Company’s common stock, of which amount, 70,700 shares remain available for awards as of June 30, 2011.
2010 Plan. Under the 2010 Plan, the Company may grant to employees, officers and directors of the Company or its subsidiaries incentive and non-qualified stock options, stock appreciation rights, restricted stock or restricted stock units, performance awards and other stock-based awards, including grants of shares. Restricted stock awards granted to date to employees under the 2010 Plan vest annually over four years, subject to achievement of certain financial performance metrics in addition to the service requirements. The 2010 Plan has a term of ten years. The total number of shares that may be awarded under the 2010 Plan is 1,000,000 shares of common stock, of which amount, 777,973 shares remain available for awards as of June 30, 2011.
The Company did not grant any stock options during the years ended June 30, 2011 or 2009. During the year ended June 30, 2010, the Company awarded an aggregate of 111,250 stock options to certain members of management at an exercise price of $5.00. The stock options were immediately exercisable. The closing price of the Company’s stock on the date of grant was $4.59. The fair value of each grant is estimated at the grant date using the Black-Scholes option pricing method. The table below outlines the assumptions used for the options granted during the year ended June 30, 2010:
| Weighted Average | ||||
| Risk free interest rate |
1.25 | % | ||
| Volatility |
78.10 | % | ||
| Dividend yield |
0.00 | % | ||
| Expected life in years |
3.00 | |||
| Fair value price |
$ | 2.25 | ||
The risk-free interest rate was determined using the then implied yield currently available for zero-coupon U.S. government issues with a remaining term equal to the expected life of the stock options. The expected volatility assumption used in the Black-Scholes option pricing models was based on the historical volatility of the Company’s common stock. The Company does not currently intend to pay cash dividends and thus has assumed a 0% dividend yield. The Company estimates the expected life for stock options based on expected future exercise patterns.
F-30
Table of Contents
The following table shows stock-based compensation expense by type of share-based award for the years ended June 30, 2011, 2010 and 2009 included in the consolidated statements of operations (in thousands):
| For the Year ended June 30, 2011 |
For the Year ended June 30, 2010 |
For the Year ended June 30, 2009 |
||||||||||
| Fair value expense of stock option awards |
$ | — | $ | 276 | $ | 32 | ||||||
| Restricted stock |
646 | 229 | 164 | |||||||||
|
|
|
|
|
|
|
|||||||
| Total stock-based compensation |
$ | 646 | $ | 505 | $ | 196 | ||||||
|
|
|
|
|
|
|
|||||||
The following table shows the total remaining unrecognized compensation cost related to restricted stock grants and the fair value expense of stock option awards, as well as the weighted average remaining required service period over which such costs will be recognized as of June 30, 2011:
| Total Remaining Unrecognized Compensation Cost (in thousands) |
Weighted Average Remaining Required Service Period (in years) |
|||||||
| Fair value expense of stock option awards |
$ | 0 | 0.00 | |||||
| Restricted stock |
640 | 2.11 | ||||||
|
|
|
|
|
|||||
| $ | 640 | 2.11 | ||||||
|
|
|
|
|
|||||
The following is a summary of activity for the year-ended June 30, 2011 related to the Company’s stock options granted under its long-term incentive plans:
| Number of Options |
Weighted- Average Exercise Price |
|||||||
| Options outstanding as of June 30, 2010 |
269,796 | $ | 6.89 | |||||
| Granted |
— | — | ||||||
| Exercised |
(5,000 | ) | 5.00 | |||||
| Forfeited |
(44,455 | ) | 7.60 | |||||
| Expired |
— | — | ||||||
|
|
|
|
|
|||||
| Options outstanding as of June 30, 2011 |
220,341 | $ | 6.79 | |||||
|
|
|
|
|
|||||
| Exercisable June 30, 2011 |
220,341 | $ | 6.79 | |||||
|
|
|
|
|
|||||
The following is a summary of options outstanding and exercisable at June 30, 2011:
| Options Outstanding | Options Exercisable | |||||||||||||||||||||||||||||||
| Range of Exercise |
Number Outstanding |
Weighted Average Remaining Contractual Life (in years) |
Weighted Average Exercise Price |
Aggregate Intrinsic Value (in thousands) |
Number Exercisable |
Weighted Average Remaining Contractual Life (in years) |
Weighted Average Exercise Price |
Aggregate Intrinsic Value (in thousands) |
||||||||||||||||||||||||
| $5.00-$6.52 |
115,840 | 1.47 | $ | 5.19 | 115,840 | 1.47 | $ | 5.19 | ||||||||||||||||||||||||
| $8.48-$8.57 |
104,501 | 4.04 | 8.56 | 104,501 | 4.04 | 8.56 | ||||||||||||||||||||||||||
|
|
|
|
|
|
|
|
|
|||||||||||||||||||||||||
| 220,341 | 2.68 | $ | 6.79 | $ | 756 | 220,341 | 2.68 | $ | 6.79 | $ | 756 | |||||||||||||||||||||
|
|
|
|
|
|
|
|
|
|||||||||||||||||||||||||
F-31
Table of Contents
All stock options outstanding at June 30, 2011 are vested. In general, the Company’s policy is to issue new shares upon exercise of stock options. The intrinsic value of options exercised during the year ended June 30, 2011 was $17,600. No options were exercised during the years ended June 30, 2010 or 2009.
The following is a summary of activity for the year-ended June 30, 2011 related to shares granted under the Company’s long-term incentive plans:
| Shares | Weighted Average Grant Date Fair Value |
|||||||
| Restricted shares at June 30, 2010 |
262,095 | $ | 4.55 | |||||
| Granted |
30,950 | 7.92 | ||||||
| Vested |
(49,218 | ) | 3.97 | |||||
| Forfeited |
— | — | ||||||
|
|
|
|
|
|||||
| Restricted shares at June 30, 2011 |
243,827 | $ | 5.09 | |||||
|
|
|
|
|
|||||
The total fair value of restricted stock vested in the years ended June 30, 2011, 2010 and 2009 was $0.4 million, $0.4 million and $0.1 million, respectively.
(12) Earnings (Loss) Per Share Data
Earnings per share calculations, including weighted average number of shares of common stock outstanding used in calculating basic and diluted income (loss) per share, for the years ended June 30, 2011, 2010 and 2009 are as follows:
| For the Year Ended June 30, | ||||||||||||
| 2011 | 2010 | 2009 | ||||||||||
| Net income (loss) (in thousands) |
$ | 7,461 | $ | 7,440 | $ | (15,753 | ) | |||||
| Weighted average shares outstanding — Basic |
10,217,494 | 9,972,409 | 9,811,635 | |||||||||
| Net effect of dilutive stock options |
37,874 | — | — | |||||||||
|
|
|
|
|
|
|
|||||||
| Weighted average shares outstanding — Diluted |
10,255,368 | 9,972,409 | 9,811,635 | |||||||||
|
|
|
|
|
|
|
|||||||
| Net income (loss) per share: |
||||||||||||
| Basic |
$ | 0.73 | $ | 0.75 | $ | (1.61 | ) | |||||
|
|
|
|
|
|
|
|||||||
| Diluted |
$ | 0.73 | $ | 0.75 | $ | (1.61 | ) | |||||
|
|
|
|
|
|
|
|||||||
For the years ended June 30, 2011 and 2010, 243,827 and 262,095, respectively, unvested restricted shares were included in determining both basic and diluted earnings per share. For the year ended June 30, 2009, 93,334 unvested restricted shares were excluded in determining both basic and diluted earnings per share. Potential shares of common stock issuable upon exercise of stock options excluded from diluted income (loss) per share computations because their inclusion would be anti-dilutive were 104,501, 269,796 and 184,127 for the years ended June 30, 2011, 2010 and 2009, respectively. For the year ended June 30, 2009, basic and diluted loss per share are the same because the inclusion of the incremental potential shares of common stock from any assumed exercise of stock options is anti-dilutive due to the net loss reported for that year.
F-32
Table of Contents
(13) Comprehensive Income (Loss)
Comprehensive loss, which includes all changes in the Company’s equity during the period except transactions with shareholders, consisted of the following for the years ended June 30, 2011, 2010 and 2009 (in thousands):
| For the Year Ended June 30, | ||||||||||||
| 2011 | 2010 | 2009 | ||||||||||
| Net income (loss) |
$ | 7,461 | $ | 7,440 | $ | (15,753 | ) | |||||
| Other comprehensive income (loss), net of tax |
||||||||||||
| Pension experience gain (loss), net of tax (a) |
2,080 | 257 | (1,482 | ) | ||||||||
| Other change in unrecognized pension costs, net of tax (b) |
421 | 1,172 | 1,472 | |||||||||
|
|
|
|
|
|
|
|||||||
| 2,501 | 1,429 | (10 | ) | |||||||||
|
|
|
|
|
|
|
|||||||
| Comprehensive income (loss) |
$ | 9,962 | $ | 8,869 | $ | (15,763 | ) | |||||
|
|
|
|
|
|
|
|||||||
| (a) | Pension experience gains (losses) during fiscal 2011, 2010 and 2009 are net of tax expense (benefit) of $0.6 million, $0.1 million and $(0.8 million), respectively, offset by the effect of allocations of $(0.9 million), $(0.1 million) and $0.0 million, respectively, related to (decreases) increases in the deferred tax valuation allowance, as described further in Note 8. |
| (b) | Other change in unrecognized pension costs during fiscal 2011, 2010 and 2009 are net of tax expense of $0.1 million, $0.4 million and $0.8 million, respectively, offset by the effect of allocations of $(0.2 million), $(0.4 million) and $0.2 million, respectively, related to (decreases) increases in the deferred tax valuation allowance, as described further in Note 8. |
(14) Restructuring Activities
2009 Restructuring Plan
During fiscal 2009, management initiated a full evaluation of the Company’s operations and long-term business strategy. As a result, in the third quarter of fiscal 2009, management began to implement a formal turnaround plan focused on returning Sparton to profitability and the assurance of the Company’s viability (the “2009 Restructuring Plan”). These measures were designed to reduce operating costs, increase efficiencies, and improve Sparton’s competitive position in response to excess capacity, the prevailing economy and the need to optimize manufacturing resources. These restructuring activities included, among other actions, plant consolidations, closures and sales, workforce reductions, customer contract disengagements, changes in employee pension and health care benefits and relocation of the Company’s corporate office. Restructuring/impairment charges of approximately $11.1 million have been incurred as of June 30, 2011 related to these activities of which approximately $0.0 million, $7.0 million and $0.1 million were related to the Medical, CS and DSS segments, respectively. The Company does not expect to recognize any additional costs related to these activities. Expected remaining cash expenditures related to the 2009 Restructuring Plan of approximately $0.1 million primarily represent future lease payments and are expected to be paid out by the end of fiscal year 2012.
Delphi Medical Contract Manufacturing Business Acquisition Related Restructuring
During the first quarter of fiscal 2011, the Company took certain cost reduction actions in relation to its acquisition of certain assets related to the contract manufacturing business of Delphi Medical (the “2011 Colorado Restructuring Plan”). These actions included a workforce reduction at the Colorado location and the consolidation of the Colorado manufacturing facilities from two to one. Restructuring/impairment charges recognized within the Medical segment of approximately $0.1 million have been incurred as of June 30, 2011 related to these acquisition related restructuring activities. The Company does not expect to recognize any additional costs related to these activities. All cash expenditures related to the 2011 Colorado Restructuring Plan have been made as of June 30, 2011.
F-33
Table of Contents
Byers Peak Acquisition Related Restructuring
In conjunction with the Byers Peak acquisition, the Company intends to consolidate the Byers Peak operations into the Company’s Frederick, Colorado facility. These restructuring activities, which are expected to consist primarily of production moving costs began in the Company’s fourth quarter and are expected to be materially complete by the end of the Company’s fiscal 2012 second quarter. Restructuring/impairment charges recognized within the Medical segment of less than $0.1 million have been incurred as of June 30, 2011 related to these acquisition related restructuring activities. The Company expects to incur less than $0.1 million additional costs and has remaining restructuring related cash payments of approximately $0.1 million to be paid out during the first and second quarters of fiscal 2012.
Summary of Restructuring Charges
The table below summarizes the nature and amount of all restructuring actions for the years ended June 30, 2011, 2010 and 2009 (in thousands):
| Workforce Reduction (principally severance and retention bonuses) |
Facility Closing |
Lease Termination |
Production Transfer |
Total | ||||||||||||||||
| Accrual balance at June 30, 2008 |
$ | — | $ | — | $ | — | $ | — | $ | — | ||||||||||
| Restructuring charges |
2,318 | 24 | 2,202 | 352 | 4,896 | |||||||||||||||
| Less: cash payments |
(1,943 | ) | (24 | ) | (212 | ) | (352 | ) | (2,531 | ) | ||||||||||
| Restructuring reversals |
— | — | — | — | — | |||||||||||||||
|
|
|
|
|
|
|
|
|
|
|
|||||||||||
| Accrual balance at June 30, 2009 |
375 | — | 1,990 | — | 2,365 | |||||||||||||||
| Restructuring charges |
350 | 1,188 | 409 | — | 1,947 | |||||||||||||||
| Less: cash payments |
(718 | ) | (1,175 | ) | (2,186 | ) | — | (4,079 | ) | |||||||||||
| Restructuring reversals |
— | — | — | — | — | |||||||||||||||
|
|
|
|
|
|
|
|
|
|
|
|||||||||||
| Accrual balance at June 30, 2010 |
7 | 13 | 213 | — | 233 | |||||||||||||||
| Restructuring charges |
62 | 13 | — | — | 75 | |||||||||||||||
| Less: cash payments |
(69 | ) | (26 | ) | (95 | ) | — | (190 | ) | |||||||||||
| Restructuring reversals |
— | — | — | — | — | |||||||||||||||
|
|
|
|
|
|
|
|
|
|
|
|||||||||||
| Accrual balance at June 30, 2011 |
$ | — | $ | — | $ | 118 | $ | — | $ | 118 | ||||||||||
|
|
|
|
|
|
|
|
|
|
|
|||||||||||
During the years ended June 30, 2010 and 2009, approximately $1.4 million and $2.1 million, respectively, of impairment related to property, plant and equipment was recorded. Additionally, during the fiscal year 2010, the Company sold its Jackson, Michigan and London, Ontario, Canada properties for an aggregate loss of approximately $0.8 million. The impairments and loss on sales in these periods related to facility closings and are reflected in restructuring/impairment charges within those respective periods.
Given the significance of, and the timing of the execution of such activities, accounting for the expected cost of these actions can involve periodic reassessments of estimates made at the time the original decisions were made. We continually evaluate the adequacy of the remaining liabilities under our restructuring initiatives. Although we believe that these estimates accurately reflect the costs of our restructuring plans, actual results may differ, thereby requiring us to periodically record additional provisions or reverse a portion of such provisions.
(15) Business Segments
Reportable segments are defined as components of an enterprise about which separate financial information is available that is evaluated regularly by the chief operating decision maker, or group, in assessing performance and allocating resources.
F-34
Table of Contents
The Company uses an internal management reporting system, which provides important financial data to evaluate performance and allocate the Company’s resources on a segment basis. Net sales are attributed to the segment in which the product is manufactured or service is performed. A segment’s performance is evaluated based upon its operating income (loss). A segment’s operating income (loss) includes its gross profit on sales less its selling and administrative expenses, including allocations of certain corporate operating expenses, but excludes some corporate and other unallocated items such as, interest expense, interest income, other income (expense) and income tax expense (benefit). Allocations of certain corporate operating expenses are allocated based on the nature of the service provided. Corporate and other unallocated costs primarily represent corporate administrative expenses related to those administrative, financial and human resource activities which are not allocated to operations and excluded from segment profit. These costs are not allocated to the segments, as management excludes such costs when assessing the performance of the segments. Inter-segment transactions are generally accounted for at amounts that approximate arm’s length transactions. Identifiable assets by segments are those assets that are used in each segment’s operations. The accounting policies for each of the segments are the same as for the Company taken as a whole.
In fiscal 2009, management initiated a full evaluation of our operations, including operating structure. This evaluation resulted in changes in fiscal 2010 to our analysis of how the components of Sparton’s business contribute to consolidated operating results and the overall level of desegregation of reported financial data, including the nature and number of operating segments, disclosure of segment information and the consistency of such information with internal management reports. The Company operates through three reportable business segments; Medical Device (“Medical”), Complex Systems (“CS”), formerly called Electronic Manufacturing Services (“EMS”), and Defense & Security Systems (“DSS”), which serves Defense, Security Systems, Navigation and Exploration markets. The electromechanical device end markets that Sparton, as a whole, serves are in Medical, Military & Aerospace and Industrial & Instrumentation. Effective for fiscal 2010, Sparton reports its operating results under these three reportable business segments. Prior to fiscal 2010, all of the Company’s operating units were aggregated into one line of business, EMS. The fiscal 2009 prior period presented herein reflects this change to segment reporting.
Medical Device (“Medical”) operations are comprised of contract development, design, production and distribution of complex and sophisticated medical related electromechanical devices for customers with specialized needs, specifically in the design and manufacturing process, to assure product reliability and safety in accordance with Food and Drug Administration (“FDA”) guidelines and approvals. This group specializes in systems and procedures targeted to the requirements of medical OEM and ET customers primarily in the In Vitro Diagnostic and Therapeutic Device segments of the Medical Device market space.
Complex Systems (“CS”) operations provides multiple industries with complex electronics systems offering end-to-end development and manufacturing solutions focused on high expectations of quality and delivery performance through a global footprint. As a vertically integrated business unit, this segment assists in providing its customers with seamless development of circuit card assemblies for integration into electro-mechanical solutions. By focusing on maximizing efficiency and cost containment at the various steps in the design, engineering, and manufacturing process, Complex Systems acts as an intelligent source and ideal partner for development firms and OEMs. This business unit is a supplier for low to medium volume/high complexity commercial and military aerospace applications, medical devices, telecommunications, energy, and industrial controls. Its current portfolio of product line applications include: flight controls, cock pit displays, fuel system controls, secure communications, early warning detection, diagnostics systems, security systems, detection systems, lighting, satellite communications, audio, nuclear detection, inventory control, and defense.
Defense & Security Systems (“DSS”) operations are comprised of design, development and production of products for a number of technologically significant programs aimed at fulfilling defense and commercial needs. Specializing in the development and production of complex electromechanical equipment, Sparton designs and
F-35
Table of Contents
manufactures sonobuoys, ASW devices used by the U.S. Navy and foreign governments. This business unit also performs an engineering development function for the United States military and prime defense contractors on advanced technologies targeted as future defense products as well as replacement of current systems. The sonobuoy product line is built to the customer’s demanding specifications. These products are restricted by International Tariff and Arms Regulations (“ITAR”), which limits opportunities for competition. Additionally, this business unit internally develops and markets commercial products based on its navigation and underwater acoustic knowledge and the intrinsic skill sets of its technical staff.
Operating results and certain other financial information about the Company’s three reportable segments for the years ended June 30, 2011, 2010 and 2009 and as of June 30, 2011 and June 30, 2010 were as follows (in thousands):
| For the Year Ended June 30, 2011 | ||||||||||||||||||||||||
| Medical | CS | DSS | Corporate and Other Unallocated |
Eliminations | Total | |||||||||||||||||||
| Sales (a) |
$ | 98,028 | $ | 49,835 | $ | 69,720 | $ | — | $ | (14,231 | ) | $ | 203,352 | |||||||||||
| Gross profit |
$ | 12,938 | $ | 4,835 | $ | 15,395 | $ | — | $ | — | $ | 33,168 | ||||||||||||
| Operating income (loss) |
$ | (8,011 | ) | $ | 1,586 | $ | 10,869 | $ | (8,273 | ) | $ | — | $ | (3,829 | ) | |||||||||
| Selling and administrative expenses |
$ | 6,031 | $ | 3,289 | $ | 3,416 | $ | 8,106 | $ | — | $ | 20,842 | ||||||||||||
| Internal research and development expenses |
$ | — | $ | — | $ | 1,110 | $ | — | $ | — | $ | 1,110 | ||||||||||||
| Restructuring/impairment charges |
$ | 107 | $ | (22 | ) | $ | — | $ | (10 | ) | $ | — | $ | 75 | ||||||||||
| Gain on acquisition |
$ | (2,550 | ) | $ | — | $ | — | $ | — | $ | — | $ | (2,550 | ) | ||||||||||
| Gain on sale of property, plant and equipment |
$ | — | $ | (18 | ) | $ | — | $ | (121 | ) | $ | — | $ | (139 | ) | |||||||||
| Impairment of intangible asset |
$ | 3,663 | $ | — | $ | — | $ | — | $ | — | $ | 3,663 | ||||||||||||
| Impairment of goodwill |
$ | 13,153 | $ | — | $ | — | $ | — | $ | — | $ | 13,153 | ||||||||||||
| Depreciation/amortization |
$ | 793 | $ | 498 | $ | 249 | $ | 71 | $ | — | $ | 1,611 | ||||||||||||
| Capital expenditures |
$ | 45 | $ | 1,189 | $ | 1,385 | $ | 558 | $ | — | $ | 3,177 | ||||||||||||
| For the Year Ended June 30, 2010 | ||||||||||||||||||||||||
| Medical | CS | DSS | Corporate and Other Unallocated |
Eliminations | Total | |||||||||||||||||||
| Sales (a) |
$ | 64,424 | $ | 57,423 | $ | 63,853 | $ | — | $ | (11,723 | ) | $ | 173,977 | |||||||||||
| Gross profit |
$ | 8,603 | $ | 2,133 | $ | 15,847 | $ | — | $ | — | $ | 26,583 | ||||||||||||
| Operating income (loss) |
$ | 4,600 | $ | (2,150 | ) | $ | 13,150 | $ | (9,878 | ) | $ | — | $ | 5,722 | ||||||||||
| Selling and administrative expenses |
$ | 3,536 | $ | 3,292 | $ | 2,697 | $ | 8,680 | $ | — | $ | 18,205 | ||||||||||||
| Restructuring/impairment charges |
$ | — | $ | 993 | $ | — | $ | 3,083 | $ | — | $ | 4,076 | ||||||||||||
| Gain on sale of property, plant and equipment |
$ | — | $ | (32 | ) | $ | — | $ | (3,087 | ) | $ | — | $ | (3,119 | ) | |||||||||
| Depreciation/amortization |
$ | 635 | $ | 620 | $ | 157 | $ | 51 | $ | — | $ | 1,463 | ||||||||||||
| Capital expenditures |
$ | 143 | $ | 917 | $ | 332 | $ | 143 | $ | — | $ | 1,535 | ||||||||||||
F-36
Table of Contents
| For the Year Ended June 30, 2009 | ||||||||||||||||||||||||
| Medical | CS | DSS | Corporate and Other Unallocated |
Eliminations | Total | |||||||||||||||||||
| Sales (a) |
$ | 64,393 | $ | 127,002 | $ | 42,289 | $ | — | $ | (11,813 | ) | $ | 221,871 | |||||||||||
| Gross profit |
$ | 7,793 | $ | 1,448 | $ | 6,645 | $ | — | $ | — | $ | 15,886 | ||||||||||||
| Operating income (loss) |
$ | 3,731 | $ | (9,893 | ) | $ | 4,093 | $ | (9,188 | ) | $ | — | $ | (11,257 | ) | |||||||||
| Selling and administrative expenses |
$ | 3,570 | $ | 5,315 | $ | 2,481 | $ | 7,485 | $ | — | $ | 18,851 | ||||||||||||
| Restructuring/impairment charges |
$ | — | $ | 6,017 | $ | 71 | $ | 920 | $ | — | $ | 7,008 | ||||||||||||
| Gain on sale of property, plant and equipment |
$ | — | $ | (10 | ) | $ | — | $ | — | $ | — | $ | (10 | ) | ||||||||||
| Depreciation/amortization |
$ | 649 | $ | 1,024 | $ | 210 | $ | 3 | $ | — | $ | 1,886 | ||||||||||||
| Capital expenditures |
$ | — | $ | 1,102 | $ | 120 | $ | 5 | $ | — | $ | 1,227 | ||||||||||||
| As of June 30, 2011 | ||||||||||||||||||||||||
| Medical | CS | DSS | Corporate and Other Unallocated |
Eliminations | Total | |||||||||||||||||||
| Total assets |
$ | 51,251 | $ | 24,642 | $ | 7,872 | $ | 38,844 | $ | — | $ | 122,609 | ||||||||||||
| As of June 30, 2010 | ||||||||||||||||||||||||
| Medical | CS | DSS | Corporate and Other Unallocated |
Eliminations | Total | |||||||||||||||||||
| Total assets |
$ | 46,695 | $ | 25,219 | $ | 5,980 | $ | 41,967 | $ | — | $ | 119,861 | ||||||||||||
| (a) | CS sales include intercompany sales resulting primarily from the production of circuit boards that are then utilized in DSS product sales. These intercompany sales are eliminated in consolidation. |
(16) Business, Geographic and Sales Concentration
Sales to individual customers in excess of 10% of total net sales for the years ended June 30, 2011, 2010 and 2009 were as follows:
| For the Year Ended June 30, | ||||||||||||
| 2011 | 2010 | 2009 | ||||||||||
| U.S. Navy (a) |
30 | % | 28 | % | 14 | % | ||||||
| Siemens Diagnostic (b) |
18 | % | 21 | % | 17 | % | ||||||
| Fenwal Blood Technologies (c) |
12 | % | * | * | ||||||||
| Goodrich (d) |
* | 13 | % | * | ||||||||
| Honeywell (e) |
* | * | 19 | % | ||||||||
| (*) | Denotes sales were below 10% of total. |
| (a) | Sales to the United States Navy, including those made through the Company’s ERAPSCO agreement, are included in the results of the Company’s DSS segment. |
| (b) | Sales to Siemens Diagnostics are included in the results of the Company’s Medical segment. See Note 2 for more information regarding Siemens Diagnostics. |
| (c) | Sales to Fenwal Blood Technologies are included in the results of the Company’s Medical segment. |
| (d) | Sales to Goodrich are included in the results of the Company’s CS segment. |
| (e) | Sales to Honeywell are included in the results of the Company’s CS segment. In March 2009, the Company terminated its sales agreement with Honeywell, an aerospace customer with several facilities to which it supplied product. Disengagement procedures and the winding down of contracts were completed in the second quarter of fiscal 2010. |
F-37
Table of Contents
Net sales were made to customers located in the following countries (in thousands):
| For the Year Ended June 30, | ||||||||||||
| 2011 | 2010 | 2009 | ||||||||||
| United States |
$ | 172,646 | $ | 137,377 | $ | 167,782 | ||||||
| Ireland |
23,078 | 21,258 | 21,102 | |||||||||
| Canada |
91 | 72 | 15,525 | |||||||||
| Other foreign countries (a) |
7,537 | 15,270 | 17,462 | |||||||||
|
|
|
|
|
|
|
|||||||
| Consolidated total |
$ | 203,352 | $ | 173,977 | $ | 221,871 | ||||||
|
|
|
|
|
|
|
|||||||
| (a) | No other single country accounted for 10% or more of export sales in the fiscal years ended June 30, 2011, 2010, or 2009. |
ASW devices and related engineering contract services to the U.S. government and foreign countries contributed approximately $66.5 million (33%), $62.6 million (36%) and $41.6 million (19%), respectively, to total net sales for the fiscal years ended June 30, 2011, 2010 and 2009.
The Company’s investment in property, plant and equipment, which are located in the United States and Vietnam, are summarized, net of accumulated depreciation, as follows (in thousands):
| As of June 30, 2011 |
As of June 30, 2010 |
|||||||
| United States (a) |
$ | 8,775 | $ | 6,572 | ||||
| Vietnam |
2,620 | 2,352 | ||||||
|
|
|
|
|
|||||
| Consolidated total |
$ | 11,395 | $ | 8,924 | ||||
|
|
|
|
|
|||||
| (a) | Property, plant and equipment located in the United States excludes assets held-for-sale in New Mexico of approximately $3.9 million at June 30, 2010 as further described in Note 5. |
(17) Quarterly Results of Operations (Unaudited) (In thousands, except per share data):
| Quarter | ||||||||||||||||
| 1st (a) | 2nd | 3rd | 4th | |||||||||||||
| Year Ended June 30, 2011 |
||||||||||||||||
| Net sales |
$ | 45,767 | $ | 46,331 | $ | 50,352 | $ | 60,902 | ||||||||
| Gross profit |
7,026 | 7,547 | 8,202 | 10,393 | ||||||||||||
| Net income (loss) |
4,230 | 1,435 | 2,523 | (727 | ) | |||||||||||
| Basic and diluted net income (loss) per share |
0.41 | 0.14 | 0.25 | (0.07 | ) | |||||||||||
| Year Ended June 30, 2010 |
||||||||||||||||
| Net sales |
$ | 48,104 | $ | 47,223 | $ | 38,637 | $ | 40,013 | ||||||||
| Gross profit |
7,420 | 8,141 | 5,515 | 5,507 | ||||||||||||
| Net income |
1,405 | 3,248 | 689 | 2,098 | ||||||||||||
| Basic and diluted net income per share |
0.14 | 0.33 | 0.07 | 0.21 | ||||||||||||
| (a) | Fiscal 2011 first quarter net income and earnings per share amounts have been adjusted to reflect the finalization of the gain on acquisition of certain assets of the contract manufacturing business of Delphi Medical. See Note 3. |
(18) Subsequent Event:
On August 24, 2011 the Company’s Board of Directors approved a repurchase by Sparton Corporation of up to $3,000,000 of shares of its common stock over the next 24 months in open market, block transactions and privately negotiated transactions.
F-38
Table of Contents
SCHEDULE II — VALUATION AND QUALIFYING ACCOUNTS
(In thousands)
Years Ended June 30,
| Balance at Beginning of Period |
Additions Charged to Costs and Expenses |
Addition Charged to Other Accounts |
Write-Offs/ Dispositions |
Balance at End of Period |
||||||||||||||||
| 2011 |
||||||||||||||||||||
| Allowance for losses on accounts receivable |
$ | 532 | $ | 224 | $ | — | $ | (691 | ) | $ | 65 | |||||||||
| 2010 |
||||||||||||||||||||
| Allowance for losses on accounts receivable |
$ | 534 | $ | 133 | $ | — | $ | (135 | ) | $ | 532 | |||||||||
| 2009 |
||||||||||||||||||||
| Allowance for losses on accounts receivable |
$ | 258 | $ | 444 | $ | — | $ | (168 | ) | $ | 534 | |||||||||
F-39
Table of Contents
INDEX TO EXHIBITS
| Exhibit |
Description | |
| 3.1 | Second Amended Articles of Incorporation of the Registrant, incorporated herein by reference from the Registrant’s Proxy Statement on Form DEF 14A filed with the SEC on September 21, 2010. | |
| 3.2 | Amended and Restated Code of Regulations of the Registrant, incorporated herein by reference from the Registrant’s Proxy Statement on Form DEF 14A filed with the SEC on September 21, 2010. | |
| 10.1 | Amended and Restated Revolving Credit and Security Agreement dated August 14, 2009 among the Company, its subsidiaries and National City Business Credit, Inc., incorporated by reference from Exhibit 10.1 to the Registrant’s Current Report on Form 8-K filed with the SEC on August 18, 2009. | |
| 10.2 | Post-closing Agreement dated August 14, 2009 among the Company, its subsidiaries and National City Business Credit, Inc., incorporated by reference from Exhibit 10.2 to the Registrant’s Current Report on Form 8-K filed with the SEC on August 18, 2009. | |
| 10.3† | Long-Term Incentive Plan, incorporated by reference from Exhibit 10.1 to the Registrant’s Current Report on Form 8-K filed with the SEC on September 11, 2009. | |
| 10.4 | Lease Extension and Amendment Agreement dated May 1, 2010 between Sparton Technology, Inc. and 9621 Coors, L.L.C., guaranteed by Albuquerque Motor Company, Inc., incorporated by reference from Exhibit 10.1 to the Registrant’s Current Report on Form 8-K filed with the SEC on May 6, 2010. | |
| 10.5 | Option Agreement dated May 1, 2010 by and between Sparton Technology, Inc. and 9621 Coors, L.L.C., guaranteed by Albuquerque Motor Company, Inc., incorporated by reference from Exhibit 10.2 to the Registrant’s Current Report on Form 8-K filed with the SEC on May 6, 2010. | |
| 10.6 | Asset Purchase Agreement dated July 9, 2010 between Delphi Medical Systems, LLC and Sparton Medical Systems Colorado, LLC, incorporated by reference from Exhibit 10.1 to the Registrant’s Current Report on Form 8-K filed with the SEC on July 12, 2010. | |
| 10.7 | Asset Purchase Agreement dated December 8, 2010 between Coven Holdings LLC and Sparton Technology, Inc., incorporated by reference from Exhibit 10.1 to the Registrant’s Current Report on Form 8-K filed with the SEC on December 14, 2010. | |
| 10.8† | Employment Agreement dated November 6, 2008, by and between the Company and Cary B. Wood, incorporated by reference from Exhibit 10.2 to the Registrant’s Current Report on Form 8-K filed with the SEC on November 13, 2008. | |
| 10.9† | Employment Agreement dated March 30, 2009 by and between the Company and Greg Slome, incorporated by reference from Exhibit 10.1 to the Registrant’s Current Report on Form 8-K filed with the SEC on March 31, 2009. | |
| 10.10† | Executive Employment Agreement, effective as of January 5, 2009, by and between the Company and Gordon Madlock, incorporated by reference from Exhibit 10.2 to the Registrant’s Current Report on Form 8-K filed with the SEC on January 29, 2009. | |
| 10.11* | Amendment No. 2 to Amended and Restated Revolving Credit and Security Agreement dated March 3, 2011 among the Company, its subsidiaries and PNC Bank, National Association. | |
| 10.12*1 | Award/contract with an effective date of April 8, 2011 issued by the Naval Warfare Center to ERAPSCO. | |
| 10.13*1 | Amendment of Solicitation/Modification of Contract with an effective date of May 5, 2011 issued by the Naval Warfare Center to ERAPSCO. | |
| 10.14*1 | Amendment of Solicitation/Modification of Contract with an effective date of June 20, 2011 issued by the Naval Warfare Center to ERAPSCO. | |
Table of Contents
| Exhibit |
Description | |
| 10.15*1 | Amendment of Solicitation/Modification of Contract with an effective date of July 25, 2011 issued by the Naval Warfare Center to ERAPSCO. | |
| 10.16*1 | Amendment of Solicitation/Modification of Contract with an effective date of August 18, 2011 issued by the Naval Warfare Center to ERAPSCO. | |
| 10.17*1 | Subcontract with an effective date of April 8, 2011 between Sparton Electronics Florida, Inc. and ERAPSCO. | |
| 10.18*1 | Subcontract Modification with an effective date of June 20, 2011 between Sparton Electronics Florida, Inc. and ERAPSCO. | |
| 10.19*† | Employment Agreement dated December 8, 2008 by and between the Company and Steven M. Korwin. | |
| 10.20*† | Employment Agreement dated January 5, 2009 by and between the Company and Michael W. Osborne. | |
| 10.21*† | Amendment to the Sparton Corporation 2010 Long-Term Incentive Plan dated June 24, 2010. | |
| 10.22† | Employment Agreement dated August 24, 2011, by and between the Company and Cary B. Wood, incorporated by reference from Exhibit 10.1 to the Registrant’s Current Report on Form 8-K filed with the SEC on August 29, 2011. | |
| 21.1* | Subsidiaries of Sparton Corporation | |
| 23.1* | Consent of BDO USA, LLP | |
| 31.1* | Chief Executive Officer certification under Section 302 of the Sarbanes-Oxley Act of 2002. | |
| 31.2* | Chief Financial Officer certification under Section 302 of the Sarbanes-Oxley Act of 2002. | |
| 32.1* | Chief Executive Officer and Chief Financial Officer certification pursuant to 18 U.S.C. Section 1350, as adopted pursuant to Section 906 of the Sarbanes-Oxley Act of 2002. | |
| * | Filed herewith. |
| † | Indicates management contract or compensatory arrangement. |
| 1 | Confidential treatment has been requested with respect to the redacted portions of this exhibit. |