Attached files
| file | filename |
|---|---|
| 8-K - 8-K - SPARTON CORP | d592934d8k.htm |
| EX-99.1 - EX-99.1 - SPARTON CORP | d592934dex991.htm |
 Fiscal Year-End Financial
Results Conference Call
September 4, 2013
Exhibit 99.2 |
 2
Safe Harbor Statement
Safe Harbor Statement
Certain statements herein constitute forward-looking statements within the
meaning of the Securities Act of 1933, as
amended
and
the
Securities
Exchange
Act
of
1934,
as
amended.
When
used
herein,
words
such
as
“believe,”
“expect,”
“anticipate,”
“project,”
“plan,”
“estimate,”
“will”
or “intend”
and similar words or expressions as they relate
to the Company or its management constitute forward-looking statements. These
forward-looking statements reflect our
current
views
with
respect
to
future
events
and
are
based
on
currently
available
financial,
economic
and
competitive data and our current business plans. The Company is under no obligation
to, and expressly disclaims any obligation to, update or alter its
forward-looking statements whether as a result of such changes, new
information, subsequent events or otherwise. Actual results could vary materially
depending on risks and uncertainties that may affect our operations,
markets, prices and other factors. Important factors that could cause actual
results to differ materially from those forward-looking statements include those contained under the heading
of risk factors and in the management’s discussion and analysis contained from
time-to-time in the Company’s filings with the Securities and
Exchange Commission. Adjusted EBITDA and related reconciliation presented
here represents earnings before interest, taxes, depreciation and
amortization as adjusted for restructuring/impairment charges, gross profit effects of capitalized profit in
inventory from acquisition and acquisition contingency settlement, and gain on sale
of investment. The Company believes Adjusted EBITDA is commonly used by
financial analysts and others in the industries in which the Company
operates and, thus, provides useful information to investors. The Company does not intend, nor should
the reader consider, Adjusted EBITDA an alternative to net income, net cash
provided by operating activities or any other items calculated in accordance
with GAAP. The Company's definition of Adjusted EBITDA may not be comparable
with Adjusted EBITDA as defined by other companies. Accordingly, the measurement has limitations
depending on its use.
Related to Onyx, adjusted gross profit and adjusted operating income exclude the
gross profit effect of capitalized profit in inventory from acquisition and
unusual write-downs of inventory and accounts receivable related to an
Onyx customer (“Augustine”) which was excluded from the acquisition.
Adjusted EBITDA related to Onyx represents
operating
income
before
depreciation
and
amortization
as
adjusted
for
the
gross
profit
effect
of
capitalized profit in inventory from acquisition and unusual write-downs of
inventory and accounts receivable related to an Onyx customer
(“Augustine”) which was excluded from the acquisition. |
 3
•
4
th
Quarter Highlights
•
Fiscal 2013 Highlights
•
Fiscal 2013 Year-End Financial Results
•
4
th
Quarter Segmented Operating Results
•
Liquidity & Capital Resources
•
Acquisition Updates
•
Fiscal 2013 Summary
•
Fiscal 2014 Outlook
•
Q & A
Today’s Agenda
Today’s Agenda |
 4
•
Awarded
26
new
business
programs
with
potential
annualized
sales
of
$12 million.
•
Completed the acquisition of certain assets of Creonix, LLC.
•
Quarter end sales backlog of approximately $200 million, including
approximately $32 million from the Company’s newly acquired business.
•
Onyx
resulted
in
net
sales
of
$13.1
million,
operating
income
of
$0.6
million and adjusted EBITDA of $1.7 million.
•
Added to the Russell 2000 Index.
4
th
Quarter Highlights |
 5
•
Awarded a total of 71 new business programs in our contract services
business with potential annualized sales of $39 million.
•
Entered into a new five year banking agreement with BMO Harris Bank
providing $65 million of committed credit facilities. The new facility also
includes a $35 million accordion feature which could raise the total
facility to $100 million.
•
Recognized a $2.1 million income tax benefit with respect to the
Company’s investments in and advances to its 100% owned Canadian
subsidiary.
•
Onyx had net sales of $31.2 million, adjusted operating income of $0.1
million and adjusted EBITDA of $3.3 million.
Year-End Highlights
Year-End Highlights |
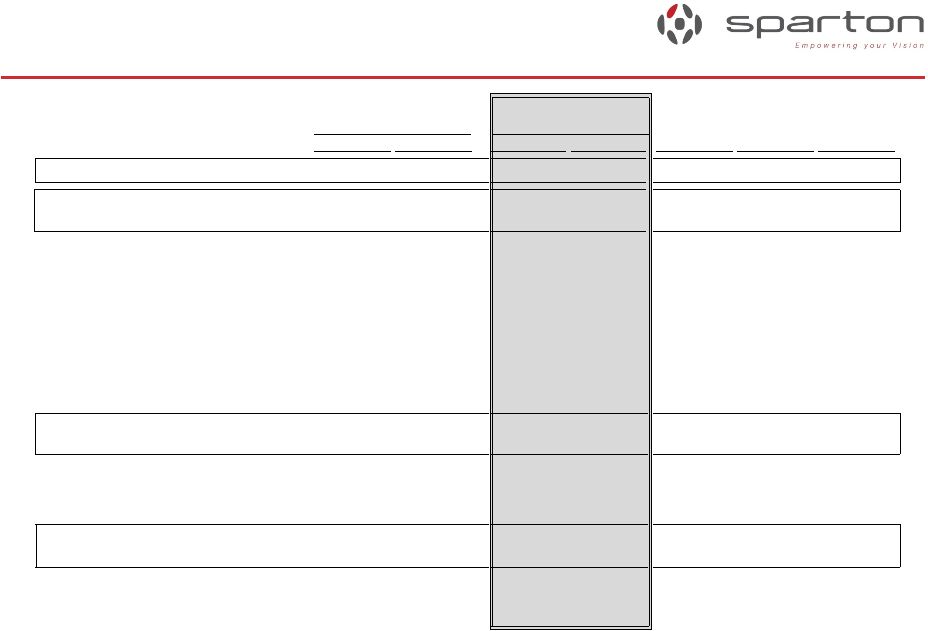 6
Consolidated Financial Results
Consolidated Financial Results
Fiscal 2013
Fiscal 2013
(Adjusted)
(Adjusted)
(Adjusted)
2013
2012
2013
2012
Net Sales
$ 266,015
$ 223,577
$ 266,015
$ 223,577
$ 42,438
$ 31,189
$ 11,249
Gross Profit
45,602
38,502
46,168
38,396
7,772
4,381
3,391
17.1%
17.2%
17.4%
17.2%
14.0%
Selling and Administrative Expense
26,451
22,232
26,451
22,232
(4,219)
2,495
(1,724)
9.9%
9.9%
9.9%
9.9%
Internal R&D Expense
1,300
1,293
1,300
1,293
(7)
-
(7)
Amortization of intangible assets
1,575
435
1,575
435
(1,140)
1,198
58
Restructuring/impairment charges
55
(68)
-
-
-
-
-
Other operating expense, net
13
65
13
65
52
-
52
Operating Income
16,270
14,545
16,829
14,371
2,458
688
1,770
6.1%
6.5%
6.3%
6.4%
2.2%
Income Before Provision For Income Tax
16,401
14,586
16,960
14,285
2,675
688
1,987
Provision For Income Taxes
2,963
5,078
5,015
4,973
(42)
227
(269)
Net Income
$ 13,638
$ 9,508
$ 11,945
$ 9,312
$ 2,633
$ 461
$ 2,172
5.1%
4.3%
4.5%
4.2%
Income per Share (Basic)
$ 1.34
$ 0.93
$ 1.17
$ 0.92
$ 0.25
$ 0.25
Income per Share (Diluted)
$ 1.33
$ 0.93
$ 1.17
$ 0.91
$ 0.26
$ 0.26
($ in 000’s, except per share)
(adjusted removes certain gains and charges, including imputing taxes at 32%
effective rates for FY2013 and FY2012, respectively) Onyx
Legacy YoY
Variance
(Reported)
(Adjusted)
Fiscal ended June 30,
Fiscal ended June 30,
Total YoY
Variance |
 7
Consolidated Financial Results
Consolidated Financial Results
Adjusted EBITDA
Adjusted EBITDA
2013
2012
Net Income
$ 13,638
$ 9,508
$ 4,130
Interest expense
518
696
(178)
Interest income
(102)
(94)
(8)
Provision for income taxes
2,763
5,078
(2,315)
Depreciation and amortization
4,761
1,814
2,947
Restructuring/impairment charges
55
(68)
123
Gain on acquisition
(62)
-
(62)
Gross profit effect of acquisition
1
566
-
566
Gross profit effect of acquisition
2
-
(106)
106
Gain on sale of investment
-
(127)
127
Adjusted EBITDA
$ 22,137
$ 16,701
$ 5,436
8.3%
7.5%
Onyx adjusted EBITDA
$ 3,291
$ 3,291
Adjusted EBITDA without Onyx
$ 18,846
$ 16,701
$ 2,145
8.0%
7.5%
1 -
Gross profit effect of capitalized profit in inventory from acquisition
2 -
Gross profit effect of acquisition contingency settlement
Fiscal ended June 30,
YoY
Variance
$
- |
 8
Sales Results
Sales Results
Medical Sales
Medical Sales
SEGMENT
2013
% of Total
2012
% Change
2013
% of Total
2012
% Change
Medical
(with Onyx)
$ 44,871
51%
$ 28,361
58%
$ 146,873
55%
$ 110,894
32%
Complex Systems
$ 17,761
20%
$ 15,688
13%
$ 60,649
23%
$ 53,609
13%
DSS
29,292
34%
20,976
40%
76,818
29%
74,102
4%
Eliminations
(4,788)
-5%
(3,699)
29%
(18,325)
-7%
(15,028)
22%
Totals
$ 87,136
100%
$ 61,326
42%
$ 266,015
100%
$ 223,577
19%
SEGMENT
2013
% of Total
2012
% Change
2013
% of Total
2012
% Change
$ 31,771
43%
$ 28,361
12%
$ 115,684
49%
$ 110,894
4%
Complex Systems
$ 17,761
24%
$ 15,688
13%
$ 60,649
26%
$ 53,609
13%
DSS
29,292
40%
20,976
40%
76,818
33%
74,102
4%
Eliminations
(4,788)
-6%
(3,699)
29%
(18,325)
-8%
(15,028)
22%
Totals
$ 74,036
100%
$ 61,326
21%
$ 234,826
100%
$ 223,577
5%
($ in 000’s)
Medical
(without Onyx)
SALES
(with Onyx)
3 months ended June 30,
Fiscal year ended June 30,
SALES
(without Onyx)
3 months ended June 30,
Fiscal year ended June 30, |
 9
Gross Profit Results
Gross Profit Results
Medical Gross Profit
Medical Gross Profit
SEGMENT
2013
GP %
2012
GP %
2013
GP %
2012
GP %
Medical
(with Onyx)
$ 7,410
16.5%
$ 4,152
14.6%
$ 21,853
14.9%
$ 15,136
13.6%
Complex Systems
1,974
11.1%
2,435
15.5%
6,388
10.5%
5,762
10.7%
DSS
7,555
25.8%
5,674
27.0%
17,927
23.3%
17,498
23.6%
Totals
$ 16,939
19.4%
$ 12,261
20.0%
$ 46,168
17.4%
$ 38,396
17.2%
SEGMENT
2013
GP %
2012
GP %
2013
GP %
2012
GP %
$ 5,464
17.2%
$ 4,152
14.6%
$ 17,472
15.1%
$ 15,136
13.6%
Complex Systems
1,974
11.1%
2,435
15.5%
6,388
10.5%
5,762
10.7%
DSS
7,555
25.8%
5,674
27.0%
17,927
23.3%
17,498
23.6%
Totals
$ 14,993
20.3%
$ 12,261
20.0%
$ 41,787
17.8%
$ 38,396
17.2%
($ in 000’s)
Medical
(without Onyx)
ADJUSTED GROSS MARGIN
(with Onyx)
3 months ended June 30,
Fiscal year ended June 30,
GROSS MARGIN
(without Onyx)
3 months ended June 30,
Fiscal year ended June 30, |
 10
Sales & Gross Profit Results
Sales & Gross Profit Results
Complex Systems
Complex Systems
SEGMENT
2013
% of Total
2012
% Change
2013
% of Total
2012
% Change
Medical
(with Onyx)
$
44,871
51%
$
28,361
58%
$ 146,873
55%
$ 110,894
32%
Complex Systems
17,761
20%
15,688
13%
60,649
23%
53,609
13%
DSS
29,292
34%
20,976
40%
76,818
29%
74,102
4%
Eliminations
(4,788)
-5%
(3,699)
29%
(18,325)
-7%
(15,028)
22%
Totals
$
87,136
100%
$ 61,326
42%
$ 266,015
100%
$ 223,577
19%
SEGMENT
2013
GP %
2012
GP %
2013
GP %
2012
GP %
Medical
(with Onyx)
$ 7,410
16.5%
$ 4,152
14.6%
$ 21,853
14.9%
$ 15,136
13.6%
Complex Systems
1,974
11.1%
2,435
15.5%
6,388
10.5%
5,762
10.7%
DSS
7,555
25.8%
5,674
27.0%
17,927
23.3%
17,498
23.6%
Totals
$ 16,939
19.4%
$ 12,261
20.0%
$ 46,168
17.4%
$ 38,396
17.2%
($ in 000’s)
3 months ended June 30,
3 months ended June 30,
Fiscal year ended June 30,
Fiscal year ended June 30,
SALES
ADJUSTED GROSS MARGIN |
 11
Sales & Gross Profit Results
Sales & Gross Profit Results
Defense & Security Systems
Defense & Security Systems
SEGMENT
2013
% of Total
2012
% Change
2013
% of Total
2012
% Change
Medical
(with Onyx)
$ 44,871
51%
$ 28,361
58%
$ 146,873
55%
$ 110,894
32%
Complex Systems
17,761
20%
15,688
13%
60,649
23%
53,609
13%
DSS
29,292
34%
20,976
40%
76,818
29%
74,102
4%
Eliminations
(4,788)
-5%
(3,699)
29%
(18,325)
-7%
(15,028)
22%
Totals
$ 87,136
100%
$ 61,326
42%
$ 266,015
100%
$ 223,577
19%
SEGMENT
2013
GP %
2012
GP %
2013
GP %
2012
GP %
Medical
(with Onyx)
$ 7,410
16.5%
$ 4,152
14.6%
$ 21,853
14.9%
$ 15,136
13.6%
Complex Systems
1,974
11.1%
2,435
15.5%
6,388
10.5%
5,762
10.7%
DSS
7,555
25.8%
5,674
27.0%
17,927
23.3%
17,498
23.6%
Totals
$ 16,939
19.4%
$ 12,261
20.0%
$ 46,168
17.4%
$ 38,396
17.2%
($ in 000’s)
3 months ended June 30,
3 months ended June 30,
Fiscal year ended June 30,
Fiscal year ended June 30,
SALES
ADJUSTED GROSS MARGIN |
 12
Liquidity & Capital Resources
Liquidity & Capital Resources
($ in '000)
Jun-12
Sep-12
Dec-12
Mar-13
Jun-13
Credit Revolver
-
-
14,000
13,000
10,000
IRB (Ohio)
1,669
1,637
1,604
1,572
1,539
Total
1,669
1,637
15,604
14,572
11,539
($ in '000)
Jun-12
Sep-12
Dec-12
Mar-13
Jun-13
Net Inventory
35,102
38,467
45,367
46,928
46,334
Debt
Inventory
($ in '000)
Jun-12
Sep-12
Dec-12
Mar-13
Jun-13
Cash and equivalents
46,950
43,096
6,066
4,358
6,085
LOC Availability
16,277
16,012
51,000
52,000
55,000
Total
63,227
59,108
57,066
56,358
61,085
Cash Availability |
 13
•
Creonix
–
Closed transaction on June 6, 2013
–
Manufactures
complex
electromechanical
devices
and
engineers
and
manufactures
cables and wire harnesses for the Industrial and Military & Aerospace
markets –
$12 million of revenue
–
Purchase inventory and equipment for $2.1 million
–
Consolidating into the Brooksville location by the end of December
•
Aydin Displays
–
Closed transaction on August 30, 2013
–
Develops enhanced flat panel display and touch-screen solutions with
application- critical performance criteria for the Military &
Aerospace and Civil Marine. –
$18 million of revenue
–
$15
million
purchase
price
plus
a
potential
$6.6
million
earnout
within
12
months
–
Financials reported within DSS segment
Acquisition Updates
Acquisition Updates |
 14
•
DSS’s fourth quarter sales influenced the quarter and year’s results and
is not reflective of an annualized run rate
•
Onyx’s strong performance in the fourth quarter reflects the strategic
importance of this acquisition
•
Acquisition of Creonix is a great example of increased utilization of our
existing assets
•
Continue to search for acquisitions that satisfy a strategic initiative
•
Complex Systems has returned to an acceptable level of profitability
Fiscal 2013 Summary
Fiscal 2013 Summary |
 15
•
Implementation of the strategic growth plan
–
Continue to grow organically
–
Maintain our level of investment in internal research & development to
commercially extend our product lines
–
Continue to enable our engineering workforce to develop new and innovative
proprietary solutions for our end markets
–
Continue to seek out complementary and compatible acquisitions
–
Further leverage Viet Nam as a low cost country alternative and in-region
provider •
Focus on sustained profitability
–
Continue margin improvements across the entire company
–
Increase capacity utilization
–
Continue additional improvements in operating performance through lean and quality
efforts
•
Complete the integration of Creonix and Aydin Displays
Fiscal 2014 Outlook
Fiscal 2014 Outlook |
 16
Q & A |