Attached files
| file | filename |
|---|---|
| 8-K - FORM 8-K - Nuverra Environmental Solutions, Inc. | d582619d8k.htm |
Exhibit 99.1
Investor Presentation
August 2013
Nuverra Environmental Solutions
ABOUT FORWARD-LOOKING STATEMENTS:
This presentation may contain “forward-looking statements” within the meaning of the safe harbor provisions of the United States Private Securities Litigation Reform Act of 1995. Words such as “expect,” “estimate,” “project,” “budget,” “forecast,” “anticipate,” “intend,” “plan,” “may,” “will,” “could,” “should,” “believes,” “predicts,” “potential,” “continue,” and similar expressions are intended to identify such forward-looking statements. Forward-looking statements in the presentation include, without limitation forecasts of growth, revenues, and adjusted EBITDA, and other matters that involve known and unknown risks, uncertainties and other factors that may cause results, levels of activity, performance or achievements to differ materially from results expressed or implied by this press release. Such risk factors include, among others: difficulties encountered in acquiring and integrating businesses, including Thermo Fluids Inc. and Badlands Power Fuels, LLC; whether certain markets grow as anticipated; and the competitive and regulatory environment. Additional risks and uncertainties are set forth in the Company’s Annual Report on Form 10-K for the fiscal year ended December 31, 2012, as well as the Company’s other reports filed with the United States Securities and Exchange Commission, which are available at http://www.sec.gov/ as well as the Company’s web site at http://www.nuverra.com/. As a result of the foregoing considerations and the other limitations of non-GAAP measures described elsewhere herein, you are cautioned not to place undue reliance on these forward-looking statements, which speak only as of the date of this presentation. All forward-looking statements are qualified in their entirety by this cautionary statement. The Company undertakes no obligation to publicly update or revise any forward-looking statements, whether as a result of new information, future events or otherwise.
ABOUT NON-GAAP FINANCIAL MEASURES:
This presentation contains non-GAAP financial measures as defined by the rules and regulations of the SEC. A non-GAAP financial measure is a numerical measure of a company’s historical or future financial performance, financial position or cash flows that excludes amounts, or is subject to adjustments that have the effect of excluding amounts, that are included in the most directly comparable measure calculated and presented in accordance with GAAP in the statements of operations, balance sheets, or statements of cash flows of Nuverra; or includes amounts, or is subject to adjustments that have the effect of including amounts, that are excluded from the most directly comparable measure so calculated and presented. For a reconciliation of these non-GAAP financial measures to their comparable GAAP financial measures please see the Appendix to this presentation.
These non-GAAP financial measures are provided because our management uses these financial measures in maintaining and evaluating our ongoing financial results and trends. Management uses this non-GAAP information as an indicator of business performance, and evaluates overall management with respect to such indicators. Management believes that excluding items such as acquisition expenses, amortization of intangible assets and stock-based compensation, among other items that are inconsistent in amount and frequency (as with acquisition and earn-out expenses), or determined pursuant to complex formulas that incorporate factors, such as market volatility, that are beyond our control (as with stock-based compensation), for purposes of calculating these non-GAAP financial measures facilitates a more meaningful evaluation of our current operating performance and comparisons to the past and future operating performance. We believe that providing non-GAAP financial measures such as EBITDA, and Adjusted EBITDA, in addition to related GAAP financial measures, provides investors with greater transparency to the information used by our management in its financial and operational decision-making. EBITDA represents net income (loss) before interest expense, net, income tax (benefit) provision, depreciation and amortization. Adjusted EBITDA represents EBITDA as further adjusted for items that management does not consider reflective of our core operating performance. EBITDA and Adjusted EBITDA are supplemental measures of our performance and our ability to service debt that are not required by, or presented in accordance with, GAAP. EBITDA and Adjusted EBITDA are not measurements of our financial performance under GAAP and should not be considered as alternatives to net income or any other performance measures derived in accordance with GAAP, or as alternatives to cash flow from operating activities as measures of our liquidity. In addition, our measurements of EBITDA and Adjusted EBITDA may not be comparable to similarly titled measures of other companies, limiting their usefulness as a comparative measure.
Nuverra Environmental Solutions
Nuverra Environmental Solutions
Business Overview
Nuverra Environmental Solutions
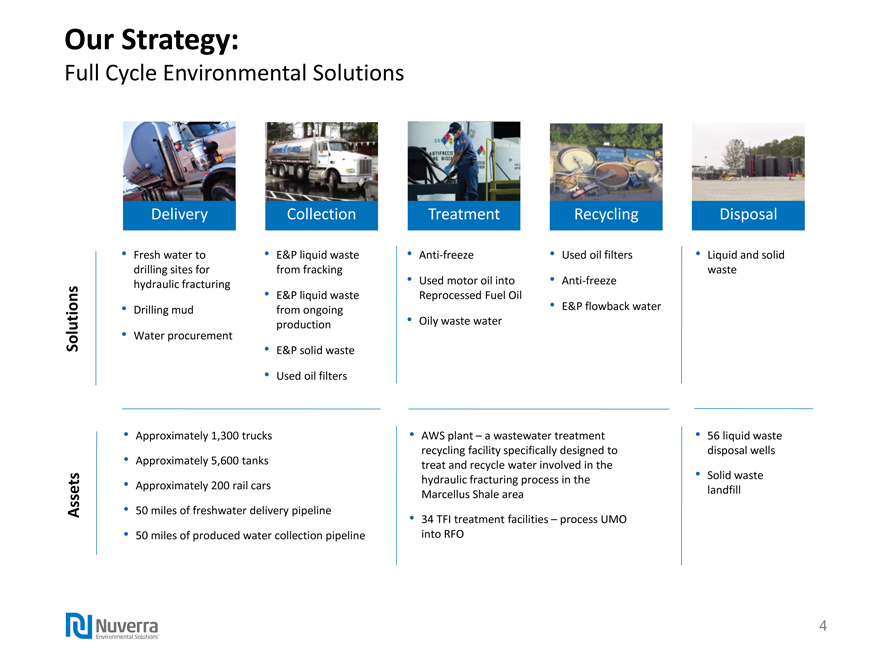
Our Strategy:
Full Cycle Environmental Solutions
Solutions
Delivery
Fresh water to
drilling sites for
hydraulic fracturing
Drilling mud
Water procurement
Collection
E&P liquid waste from fracking
E&P liquid waste from ongoing production
E&P solid waste
Used oil filters
Treatment
Anti-freeze
Used motor oil into Reprocessed Fuel Oil
Oily waste water
Recycling
Used oil filters
Anti-freeze
E&P flowback water
Disposal
Liquid and solid waste
Assets
Approximately 1,300 trucks
Approximately 5,600 tanks
Approximately 200 rail cars
50 miles of freshwater delivery pipeline
50 miles of produced water collection pipeline
AWS plant – a wastewater treatment recycling facility specifically designed to treat and recycle water involved in the hydraulic fracturing process in the Marcellus Shale area
34 TFI treatment facilities – process UMO into RFO
56 liquid waste disposal wells
Solid waste landfill
Nuverra Environmental Solutions
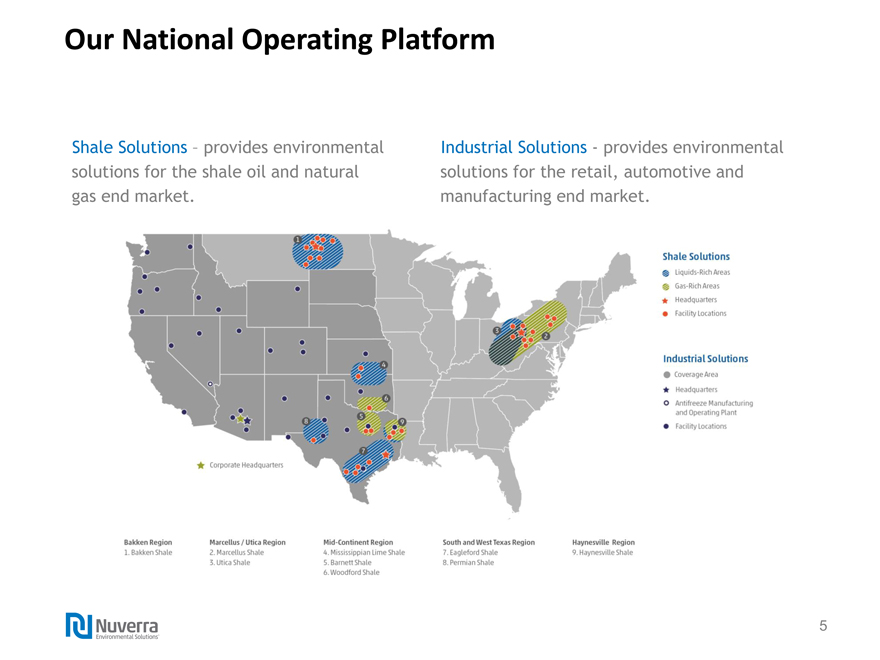
Our National Operating Platform
Shale Solutions - provides environmental solutions for the shale oil and natural gas end market.
Industrial Solutions - provides environmental solutions for the retail, automotive and manufacturing end market.
Shale Solutions
Liquid-Rich Areas
Gas-Rich Areas
Headquarters
Facility Locations
Industrial Solutions
Coverage Area
Headquarters
Antifreeze Manufacturing
Facility Locations
Corporate Headquarters
Bakken Region
1. Bakken Shale
Marcellus / Ultica Region
2. Marcellus Shale
3. Ultra Shale
Mid-Continent Region
4. Mississippian Lima Shale
5. Barnett Shale
6. Woodford Shale
South and West Texas Region
7. Eagleford Shale
8. Permian Shale
Haynesville Region
9. Haynesville shale
Nuverra Environmental Solutions
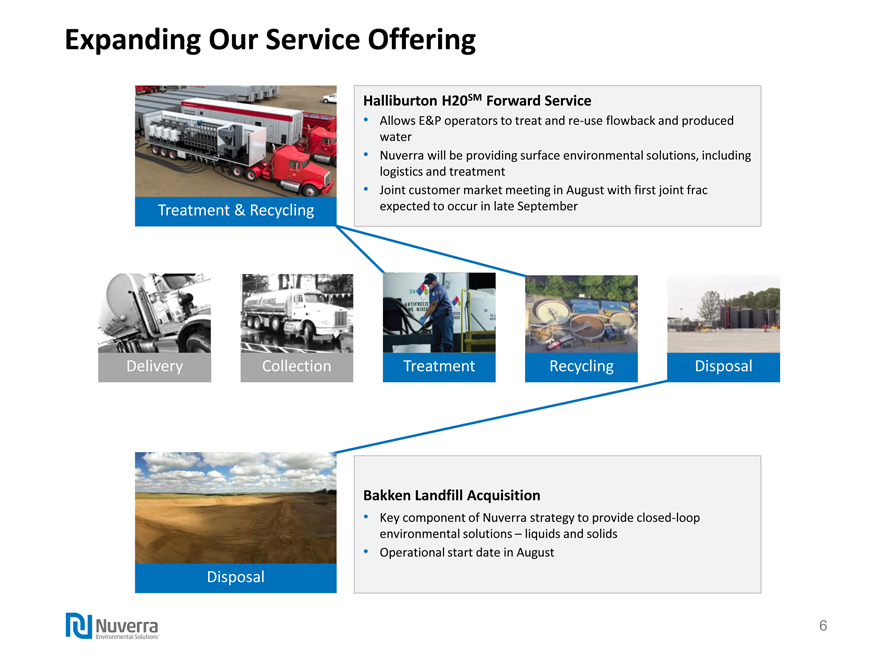
Expanding Our Service Offering
Treatment & Recycling
Halliburton H20SM Forward Service
Allows E&P operators to treat and re-use flowback and produced water
Nuverra will be providing surface environmental solutions, including logistics and treatment
Joint customer market meeting in August with first joint frac expected to occur in late September
Delivery Collection Treatment Recycling Disposal
Disposal
Bakken Landfill Acquisition
Key component of Nuverra strategy to provide closed-loop environmental solutions – liquids and solids
Operational start date in August
Nuverra
Environmental SolutionsTM
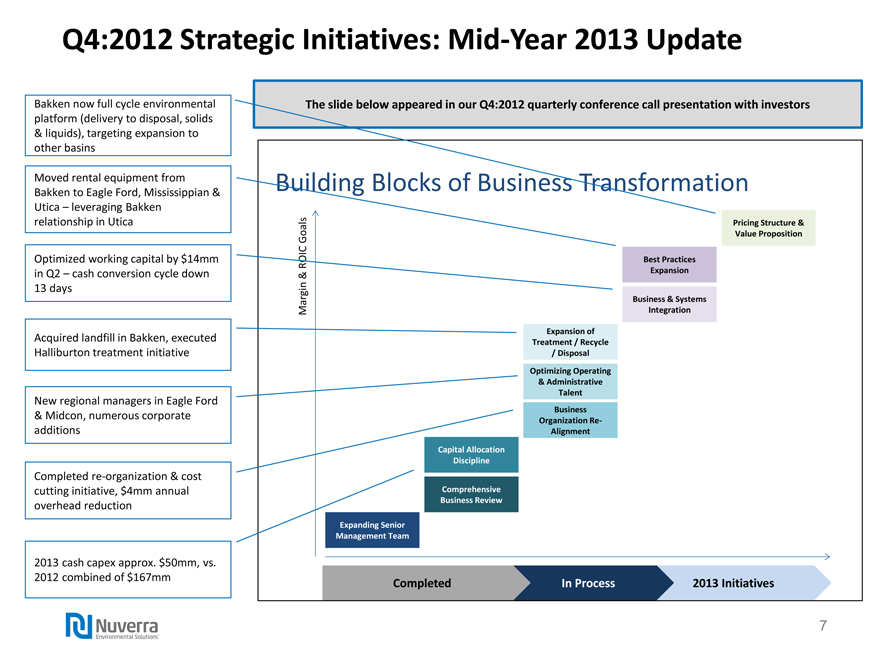
Q4:2012 Strategic Initiatives: Mid-Year 2013 Update
The slide below appeared in our Q4:2012 quarterly conference call presentation with investors
Bakken now full cycle environmental platform (delivery to disposal, solids & liquids), targeting expansion to other basins
Moved rental equipment from Bakken to Eagle Ford, Mississippian & Utica – leveraging Bakken relationship in Utica
Optimized working capital by $14mm in Q2 – cash conversion cycle down 13 days
Acquired landfill in Bakken, executed Halliburton treatment initiative
New regional managers in Eagle Ford & Midcon, numerous corporate additions
Completed re-organization & cost cutting initiative, $4mm annual overhead reduction
2013 cash capex approx. $50mm, vs. 2012 combined of $167mm
Building Blocks of Business Transformation
Margin & ROIC Goals
Pricing Structure & Value Proposition
Best Practices
Expansion
Business & Systems
Integration
Expansion of Treatment / Recycle / Disposal
Optimizing Operating & Administrative
Talent
Business
Organization Re-
Alignment
Capital Allocation
Discipline
Comprehensive
Business Review
Expanding Senior
Management Team
Completed
In Process
2013 Initiatives
Nuverra 7
Environmental SolutionsTM
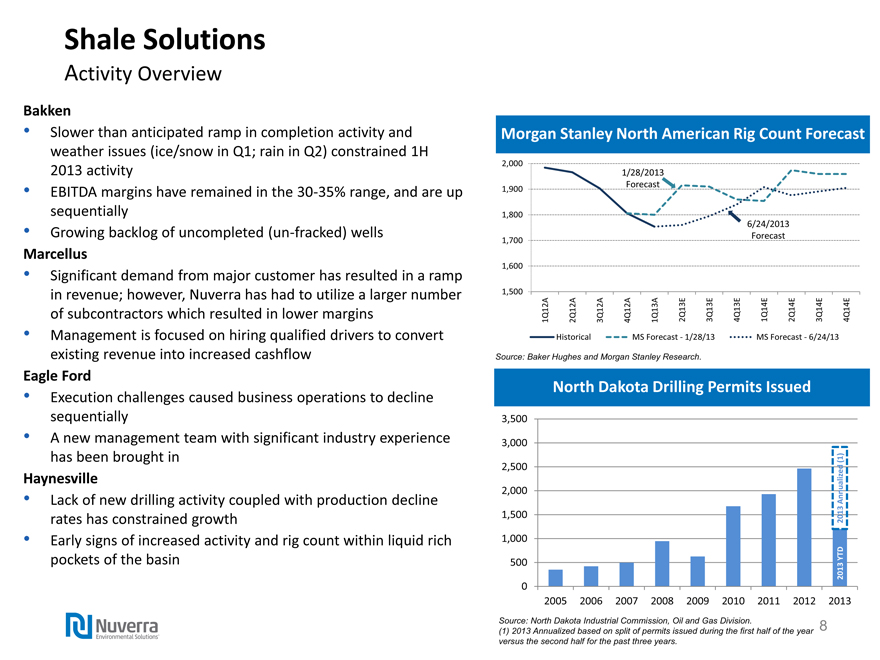
Shale Solutions
Activity Overview
Bakken
Slower than anticipated ramp in completion activity and weather issues (ice/snow in Q1; rain in Q2) constrained 1H 2013 activity
EBITDA margins have remained in the 30-35% range, and are up sequentially
Growing backlog of uncompleted (un-fracked) wells
Marcellus
Significant demand from major customer has resulted in a ramp in revenue; however, Nuverra has had to utilize a larger number of subcontractors which resulted in lower margins
Management is focused on hiring qualified drivers to convert existing revenue into increased cashflow
Eagle Ford
Execution challenges caused business operations to decline sequentially
A new management team with significant industry experience has been brought in
Haynesville
Lack of new drilling activity coupled with production decline rates has constrained growth
Early signs of increased activity and rig count within liquid rich pockets of the basin
Morgan Stanley North American Rig Count Forecast
2,000
1/28/2013
1,900
Forecast
1,800
6/24/2013
1,700
Forecast
1,600
1,500
1Q12A 2Q12A 3Q12A 4Q12A 1Q13A 2Q13E 3Q13E 4Q13E 1Q14E 2Q14E 3Q14E 4Q14E
Historical MS Forecast - 1/28/13 MS Forecast - 6/24/13
Source: Baker Hughes and Morgan Stanley Research.
North Dakota Drilling Permits Issued
3,500
3,000
2,500
2,000
1,500
1,000
500
0 2013 YTD
2013 Annualized (1)
2005 2006 2007 2008 2009 2010 2011 2012 2013
Source: North Dakota Industrial Commission, Oil and Gas Division.
(1) 2013 Annualized based on split of permits issued during the first half of the year versus the second half for the past three years.
Nuverra 8
Environmental SolutionsTM
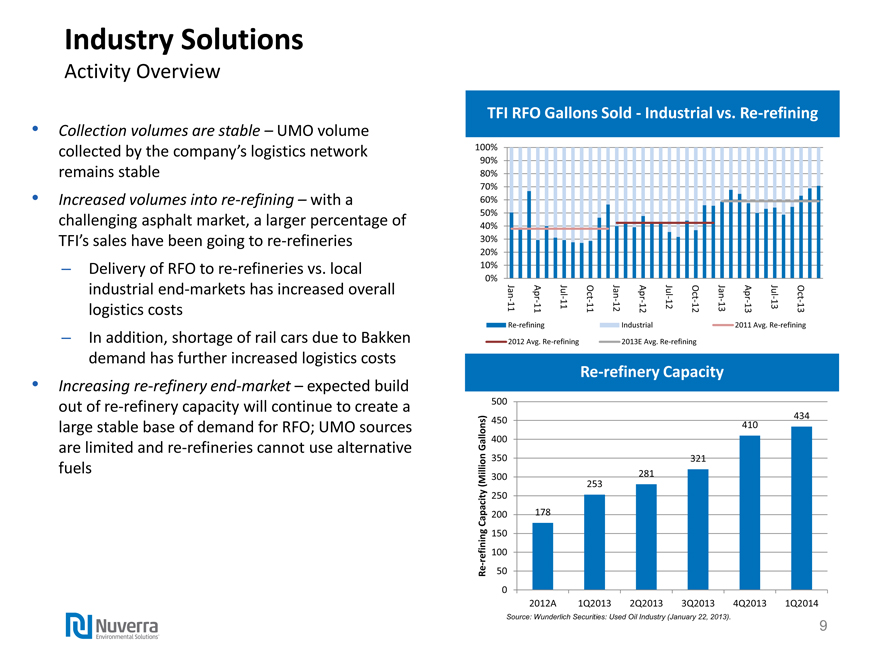
Industry Solutions
Activity Overview
Collection volumes are stable – UMO volume collected by the company’s logistics network remains stable
Increased volumes into re-refining – with a challenging asphalt market, a larger percentage of TFI’s sales have been going to re-refineries
Delivery of RFO to re-refineries vs. local industrial end-markets has increased overall logistics costs
In addition, shortage of rail cars due to Bakken demand has further increased logistics costs
Increasing re-refinery end-market – expected build out of re-refinery capacity will continue to create a large stable base of demand for RFO; UMO sources are limited and re-refineries cannot use alternative fuels
TFI RFO Gallons Sold - Industrial vs. Re-refining
100%
90%
80%
70%
60%
50%
40%
30%
20%
10%
0%
Oct-13
Jul-13
Apr-13
Jan-13
Oct-12
Jul-12
Apr-12
Jan-12
Oct-11
Jul-11
Apr-11
Jan-11
Re-refining
2012 Avg. Re-refining
Industrial
2013E Avg. Re-refining
2011 Avg. Re-refining
Re-refinery Capacity
Re-refining Capacity (Million Gallons)
500
450
434
410
400
350
321
300
281
253
250
200
178
150
100
50
0
2012A 1Q2013 2Q2013 3Q2013 4Q2013 1Q2014
Source: Wunderlich Securities: Used Oil Industry (January 22, 2013).
Nuverra 9
Environmental SolutionsTM
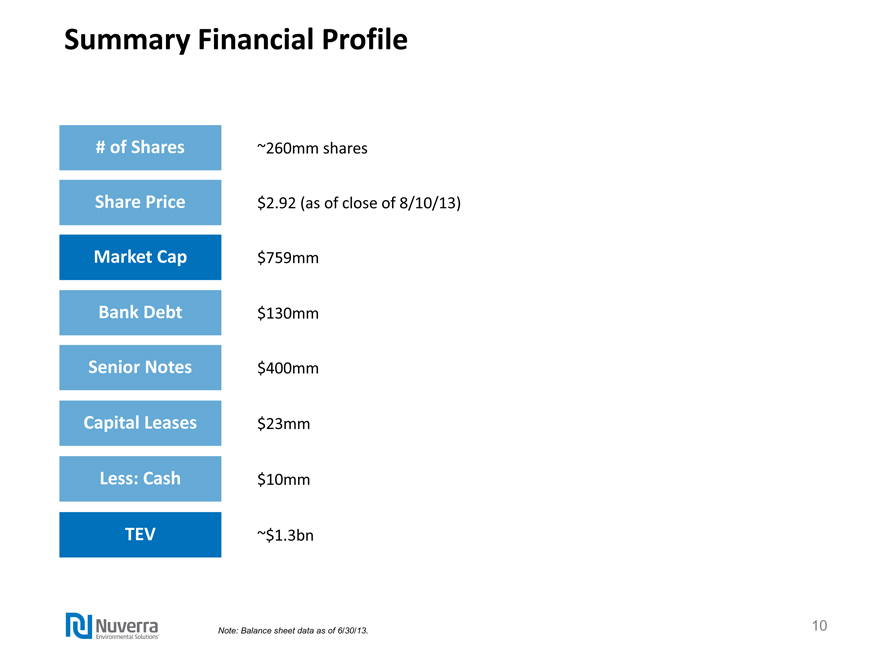
Summary Financial Profile
# of Shares ~260mm shares
Share Price $2.92 (as of close of 8/10/13)
Market Cap $759mm
Bank Debt $130mm
Senior Notes $400mm
Capital Leases $23mm
Less: Cash $10mm
TEV $1.3bn
Note: Balance sheet data as of 6/30/13.
Nuverra 10
Environmental SolutionsTM
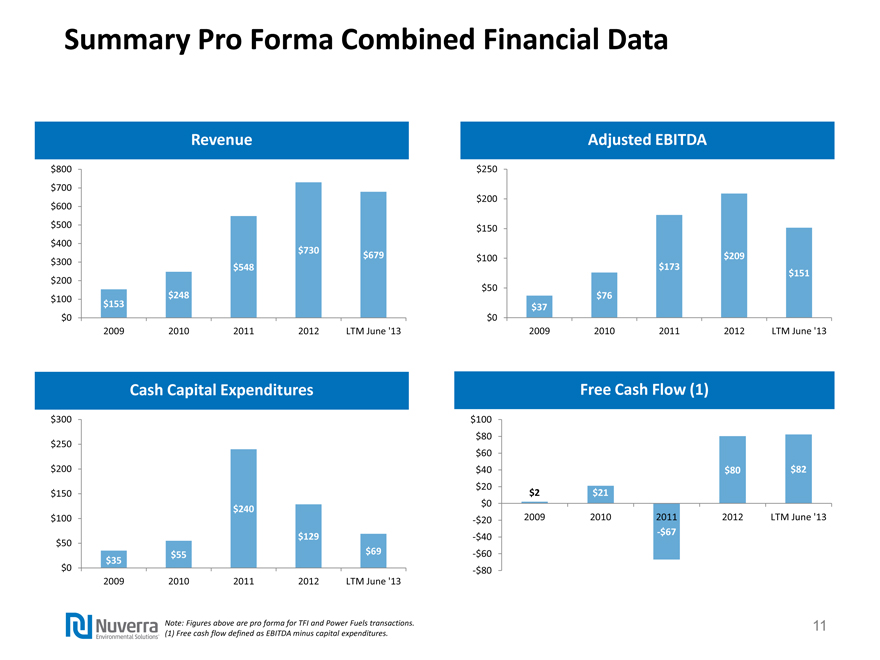
Summary Pro Forma Combined Financial Data
Revenue
$800
$700
$600
$500
$400
$730
$679
$300
$548
$200
$100
$248
$153
$0
2009 2010 2011 2012 LTM June ‘13
Cash Capital Expenditures
$300
$250
$200
$150
$240
$100
$129
$50
$55
$69
$35
$0
2009
2010
2011
2012
LTM June ‘13
Adjusted EBITDA
$250
$200
$150
$100
$209
$173
$151
$50
$76
$37
$0
2009
2010
2011
2012
LTM June ‘13
Free Cash Flow (1)
$100
$80
$60
$40
$80
$82
$20
$2
$21
$0
-$20
2009
2010
2011
2012
LTM June ‘13
-$40
-$67
-$60
-$80
Note: Figures above are pro forma for TFI and Power Fuels transactions. (1) Free cash flow defined as EBITDA minus capital expenditures.
Nuverra 11
Environmental SolutionsTM
Nuverra
Environmental SolutionsTM
Appendix
Nuverra
Environmental Solutions
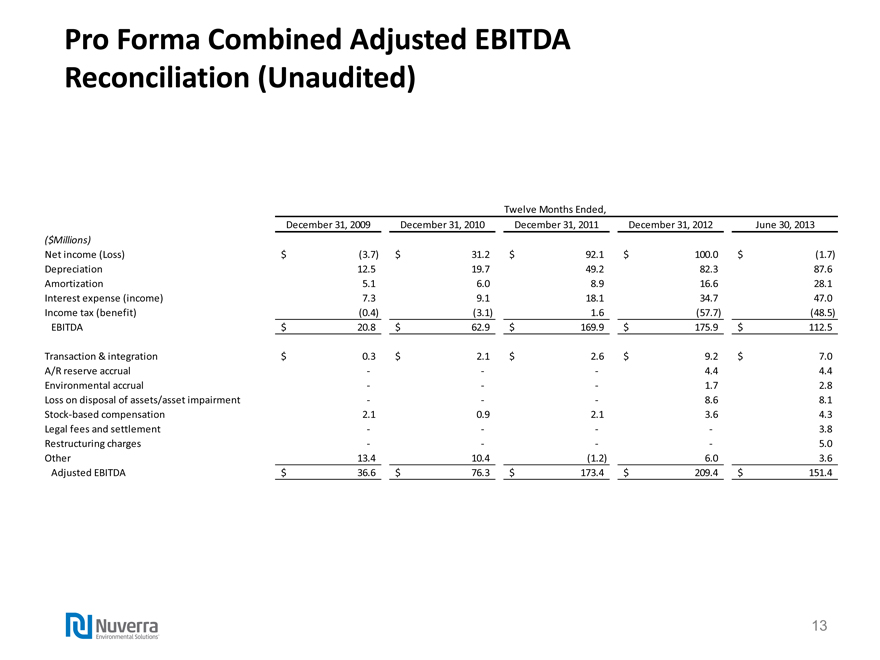
Pro Forma Combined Adjusted EBITDA
Reconciliation (Unaudited)
Twelve Months Ended,
December 31, 2009 December 31, 2010 December 31, 2011 December 31, 2012 June 30, 2013
($Millions)
Net income (Loss) $ (3.7) $ 31.2 $ 92.1 $ 100.0 $ (1.7)
Depreciation 12.5 19.7 49.2 82.3 87.6
Amortization 5.1 6.0 8.9 16.6 28.1
Interest expense (income) 7.3 9.1 18.1 34.7 47.0
Income tax (benefit) (0.4) (3.1) 1.6 (57.7) (48.5)
EBITDA $ 20.8 $ 62.9 $ 169.9 $ 175.9 $ 112.5
Transaction & integration $ 0.3 $ 2.1 $ 2.6 $ 9.2 $ 7.0
A/R reserve accrual - - - 4.4 4.4
Environmental accrual - - - 1.7 2.8
Loss on disposal of assets/asset impairment - - - 8.6 8.1
Stock-based compensation 2.1 0.9 2.1 3.6 4.3
Legal fees and settlement - - - - 3.8
Restructuring charges - - - - 5.0
Other 13.4 10.4 (1.2) 6.0 3.6
Adjusted EBITDA $ 36.6 $ 76.3 $ 173.4 $ 209.4 $ 151.4
Nuverra 13
Environmental SolutionsTM