Attached files
| file | filename |
|---|---|
| 8-K - 8-K - STERLING BANCORP | a13-15819_18k.htm |
Exhibit 99.1
|
|
Investor Presentation June 2013 |
|
|
Forward Looking Statements The information presented herein contains forward looking statements within the meaning of the Private Securities Litigation Reform Act of 1995 regarding Provident New York Bancorp and Sterling Bancorp’s expectations or predictions of future financial or business performance or conditions. Forward-looking statements are typically identified by words such as “believe,” “expect,” “anticipate,” “intend,” “target,” “estimate,” “continue,” “positions,” “prospects” or “potential,” by future conditional verbs such as “will,” “would,” “should,” “could” or “may”, or by variations of such words or by similar expressions. Such forward-looking statements include, but are not limited to, statements about the benefits of the business combination transaction involving Provident and Sterling, including future financial and operating results, the combined company’s plans, objectives, expectations and intentions and other statements that are not historical facts. These forward-looking statements are subject to numerous assumptions, risks and uncertainties which change over time. Forward-looking statements speak only as of the date they are made and we assume no duty to update forward-looking statements. In addition to factors previously disclosed in Provident’s and Sterling’s reports filed with the Securities and Exchange Commission, the following factors among others, could cause actual results to differ materially from forward-looking statements: ability to obtain regulatory approvals and meet other closing conditions to the merger, including approval by Provident and Sterling shareholders, on the expected terms and schedule; delay in closing the merger; difficulties and delays in integrating the Provident and Sterling businesses or fully realizing cost savings and other benefits; business disruption following the proposed transaction; changes in asset quality and credit risk; the inability to sustain revenue and earnings growth; changes in interest rates and capital markets; inflation; customer borrowing, repayment, investment and deposit practices; customer disintermediation; the introduction, withdrawal, success and timing of business initiatives; competitive conditions; the inability to realize cost savings or revenues or to implement integration plans and other consequences associated with mergers, acquisitions and divestitures; economic conditions; changes in Provident’s stock price before closing, including as a result of the financial performance of Sterling prior to closing; the reaction to the transaction of the companies’ customers, employees and counterparties; and the impact, extent and timing of technological changes, capital management activities, and other actions of the Federal Reserve Board and legislative and regulatory actions and reforms. Annualized, pro forma, projected and estimated numbers are used for illustrative purpose only, are not forecasts and may not reflect actual results. 1 |
|
|
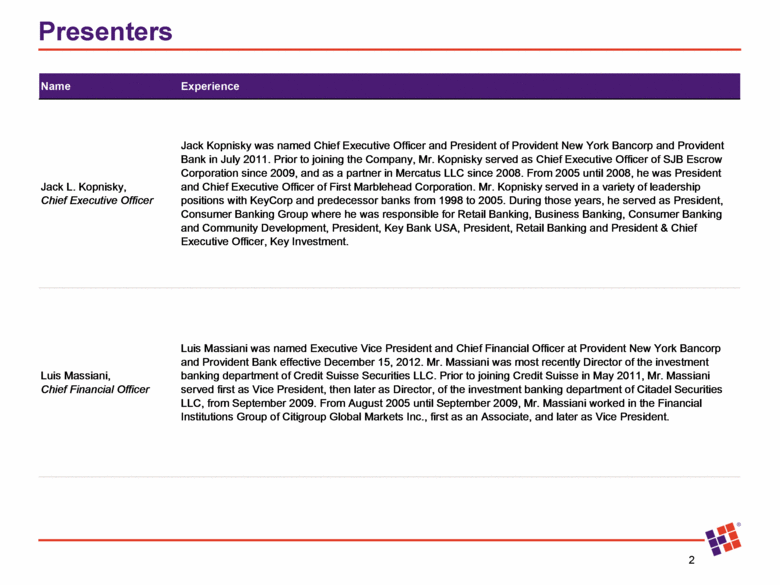
Presenters 2 Name Experience Jack L. Kopnisky, Chief Executive Officer Jack Kopnisky was named Chief Executive Officer and President of Provident New York Bancorp and Provident Bank in July 2011. Prior to joining the Company, Mr. Kopnisky served as Chief Executive Officer of SJB Escrow Corporation since 2009, and as a partner in Mercatus LLC since 2008. From 2005 until 2008, he was President and Chief Executive Officer of First Marblehead Corporation. Mr. Kopnisky served in a variety of leadership positions with KeyCorp and predecessor banks from 1998 to 2005. During those years, he served as President, Consumer Banking Group where he was responsible for Retail Banking, Business Banking, Consumer Banking and Community Development, President, Key Bank USA, President, Retail Banking and President & Chief Executive Officer, Key Investment. Luis Massiani, Chief Financial Officer Luis Massiani was named Executive Vice President and Chief Financial Officer at Provident New York Bancorp and Provident Bank effective December 15, 2012. Mr. Massiani was most recently Director of the investment banking department of Credit Suisse Securities LLC. Prior to joining Credit Suisse in May 2011, Mr. Massiani served first as Vice President, then later as Director, of the investment banking department of Citadel Securities LLC, from September 2009. From August 2005 until September 2009, Mr. Massiani worked in the Financial Institutions Group of Citigroup Global Markets Inc., first as an Associate, and later as Vice President. |
|
|
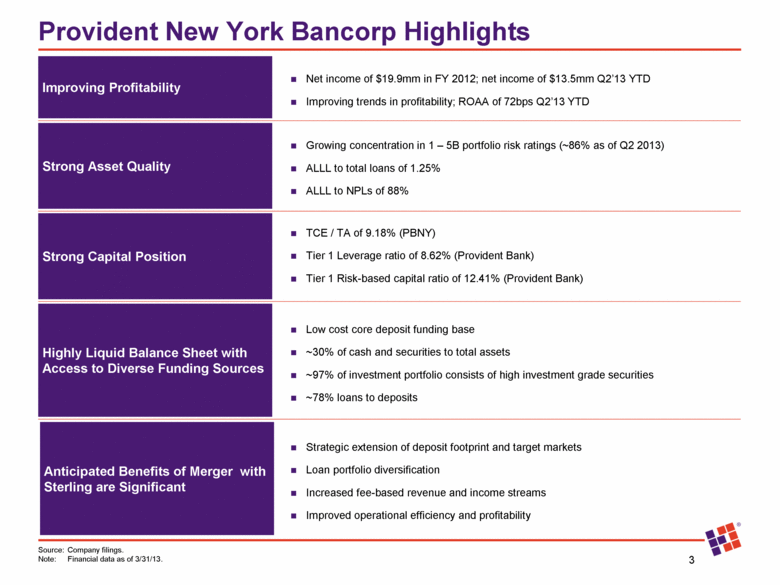
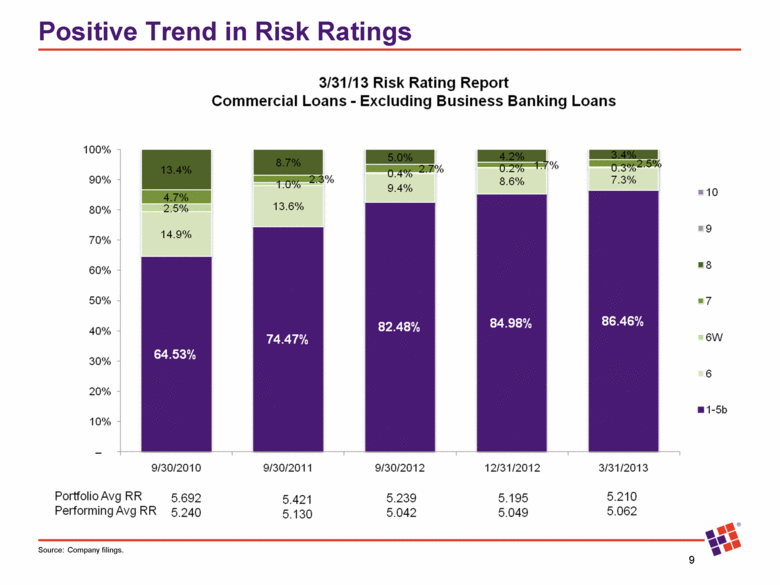
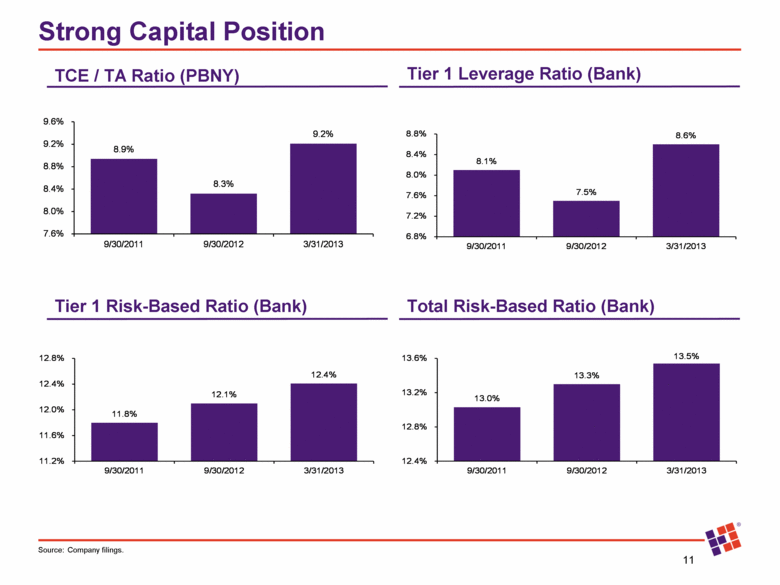
Provident New York Bancorp Highlights 3 Source: Company filings. Note: Financial data as of 3/31/13. Improving Profitability Strong Asset Quality Strong Capital Position Highly Liquid Balance Sheet with Access to Diverse Funding Sources Anticipated Benefits of Merger with Sterling are Significant Net income of $19.9mm in FY 2012; net income of $13.5mm Q2’13 YTD Improving trends in profitability; ROAA of 72bps Q2’13 YTD Growing concentration in 1 – 5B portfolio risk ratings (~86% as of Q2 2013) ALLL to total loans of 1.25% ALLL to NPLs of 88% TCE / TA of 9.18% (PBNY) Tier 1 Leverage ratio of 8.62% (Provident Bank) Tier 1 Risk-based capital ratio of 12.41% (Provident Bank) Low cost core deposit funding base ~30% of cash and securities to total assets ~97% of investment portfolio consists of high investment grade securities ~78% loans to deposits Strategic extension of deposit footprint and target markets Loan portfolio diversification Increased fee-based revenue and income streams Improved operational efficiency and profitability |
|
|
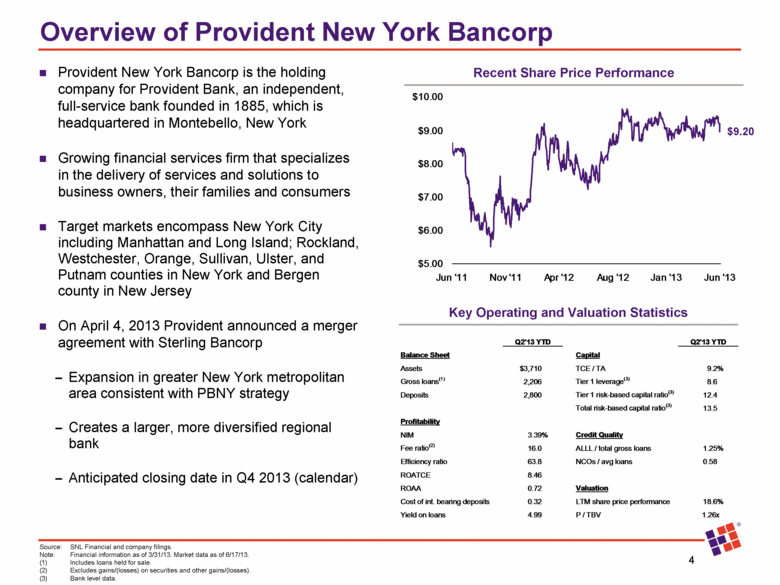
Overview of Provident New York Bancorp 4 Provident New York Bancorp is the holding company for Provident Bank, an independent, full-service bank founded in 1885, which is headquartered in Montebello, New York Growing financial services firm that specializes in the delivery of services and solutions to business owners, their families and consumers Target markets encompass New York City including Manhattan and Long Island; Rockland, Westchester, Orange, Sullivan, Ulster, and Putnam counties in New York and Bergen county in New Jersey On April 4, 2013 Provident announced a merger agreement with Sterling Bancorp Expansion in greater New York metropolitan area consistent with PBNY strategy Creates a larger, more diversified regional bank Anticipated closing date in Q4 2013 (calendar) Source: SNL Financial and company filings. Note: Financial information as of 3/31/13. Market data as of 6/17/13. (1) Includes loans held for sale. (2) Excludes gains/(losses) on securities and other gains/(losses). (3) Bank level data. Recent Share Price Performance Key Operating and Valuation Statistics $9.20 Jun '11 Nov '11 Apr '12 Aug '12 Jan '13 Jun '13 $5.00 $6.00 $7.00 $8.00 $9.00 $10.00 Q2'13 YTD Q2'13 YTD Balance Sheet Capital Assets $3,710 TCE / TA 9.2% Gross loans (1) 2,206 Tier 1 leverage (3) 8.6 Deposits 2,800 Tier 1 risk-based capital ratio (3) 12.4 Total risk-based capital ratio (3) 13.5 Profitability NIM 3.39% Credit Quality Fee ratio (2) 16.0 ALLL / total gross loans 1.25% Efficiency ratio 63.8 NCOs / avg loans 0.58 ROATCE 8.46 ROAA 0.72 Valuation Cost of int. bearing deposits 0.32 LTM share price performance 18.6% Yield on loans 4.99 P / TBV 1.26x |
|
|
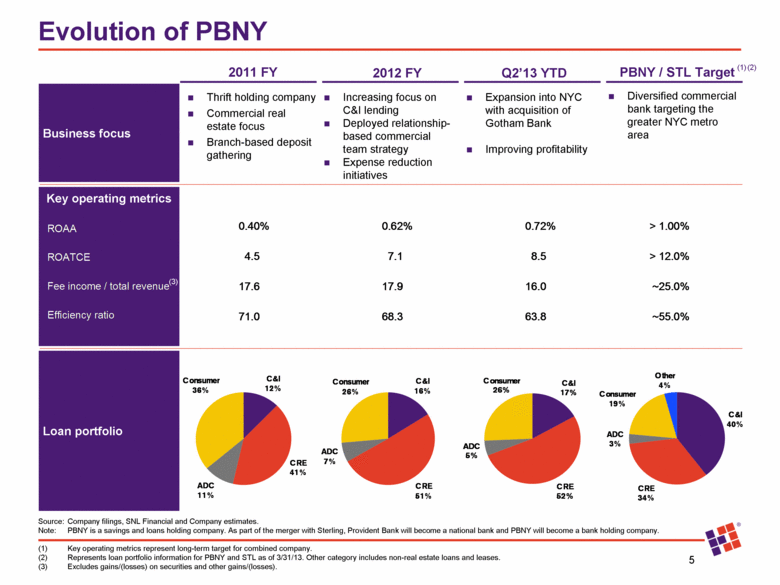
Evolution of PBNY 5 Business focus Thrift holding company Commercial real estate focus Branch-based deposit gathering Loan portfolio (1) Key operating metrics represent long-term target for combined company. (2) Represents loan portfolio information for PBNY and STL as of 3/31/13. Other category includes non-real estate loans and leases. (3) Excludes gains/(losses) on securities and other gains/(losses). Key operating metrics 2011 FY 2012 FY Q2’13 YTD PBNY / STL Target Increasing focus on C&I lending Deployed relationship-based commercial team strategy Expense reduction initiatives Expansion into NYC with acquisition of Gotham Bank Improving profitability Diversified commercial bank targeting the greater NYC metro area (1) (2) Source: Company filings, SNL Financial and Company estimates. Note: PBNY is a savings and loans holding company. As part of the merger with Sterling, Provident Bank will become a national bank and PBNY will become a bank holding company. (2) (3) ROAA ROATCE Fee income / total revenue Efficiency ratio C&I 12% CRE 41% ADC 11% Consumer 36% C&I 17% CRE 52% ADC 5% Consumer 26% C&I 40% CRE 34% ADC 3% Consumer 19% Other 4% 0.40% 0.62% 0.72% > 1.00% 4.5 7.1 8.5 > 12.0% 17.6 17.9 16.0 ~25.0% 71.0 68.3 63.8 ~55.0% C&I 16% CRE 51% ADC 7% Consumer 26% |
|
|
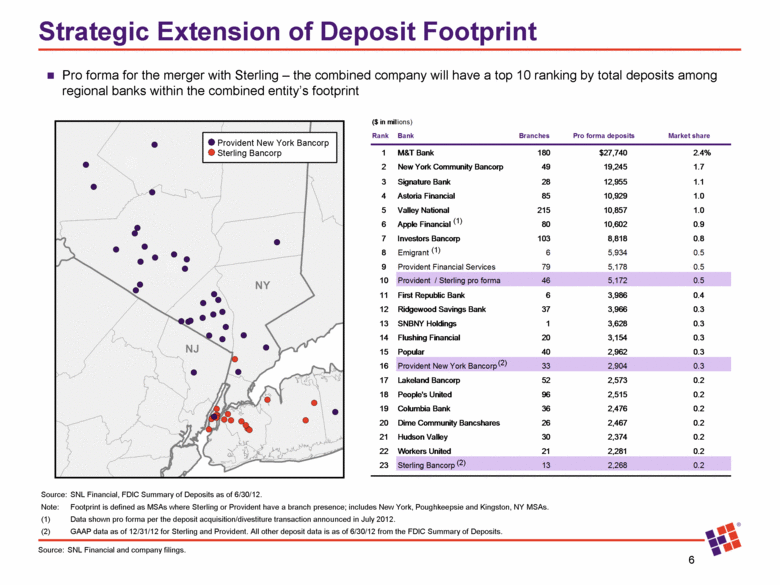
Strategic Extension of Deposit Footprint 6 Provident New York Bancorp Sterling Bancorp Pro forma for the merger with Sterling – the combined company will have a top 10 ranking by total deposits among regional banks within the combined entity’s footprint Source: SNL Financial, FDIC Summary of Deposits as of 6/30/12. Note: Footprint is defined as MSAs where Sterling or Provident have a branch presence; includes New York, Poughkeepsie and Kingston, NY MSAs. Data shown pro forma per the deposit acquisition/divestiture transaction announced in July 2012. GAAP data as of 12/31/12 for Sterling and Provident. All other deposit data is as of 6/30/12 from the FDIC Summary of Deposits. (2) (2) (1) (1) Source: SNL Financial and company filings. ($ in millions) Rank Bank Branches Pro forma deposits Market share 1 M&T Bank 180 $27,740 2.4% 2 New York Community Bancorp 49 19,245 1.7 3 Signature Bank 28 12,955 1.1 4 Astoria Financial 85 10,929 1.0 5 Valley National 215 10,857 1.0 6 Apple Financial 80 10,602 0.9 7 Investors Bancorp 103 8,818 0.8 8 Emigrant 6 5,934 0.5 9 Provident Financial Services 79 5,178 0.5 10 Provident / Sterling pro forma 46 5,172 0.5 11 First Republic Bank 6 3,986 0.4 12 Ridgewood Savings Bank 37 3,966 0.3 13 SNBNY Holdings 1 3,628 0.3 14 Flushing Financial 20 3,154 0.3 15 Popular 40 2,962 0.3 16 Provident New York Bancorp 33 2,904 0.3 17 Lakeland Bancorp 52 2,573 0.2 18 People's United 96 2,515 0.2 19 Columbia Bank 36 2,476 0.2 20 Dime Community Bancshares 26 2,467 0.2 21 Hudson Valley 30 2,374 0.2 22 Workers United 21 2,281 0.2 23 Sterling Bancorp 13 2,268 0.2 |
|
|
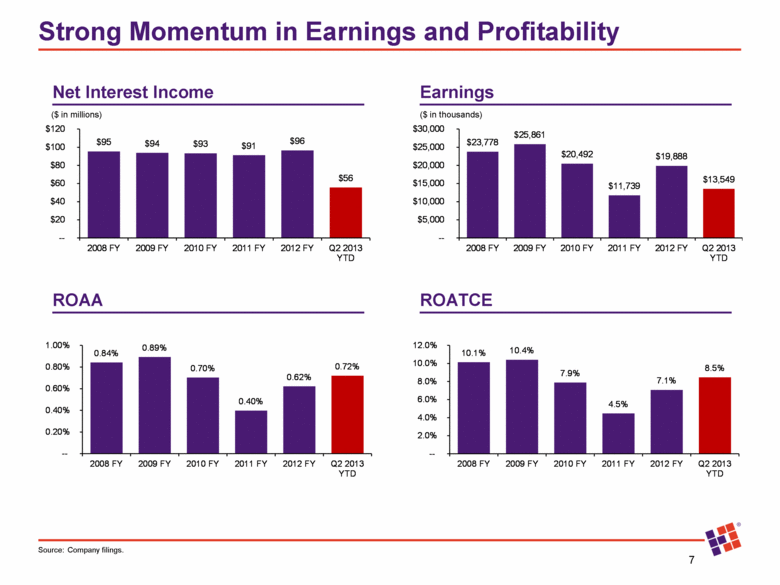
Strong Momentum in Earnings and Profitability 7 Earnings Net Interest Income ROATCE ROAA Source: Company filings. ($ in millions) ($ in thousands) $95 $94 $93 $91 $96 $56 -- $20 $40 $60 $80 $100 $120 2008 FY 2009 FY 2010 FY 2011 FY 2012 FY Q2 2013 YTD $23,778 $25,861 $20,492 $11,739 $19,888 $13,549 -- $5,000 $10,000 $15,000 $20,000 $25,000 $30,000 2008 FY 2009 FY 2010 FY 2011 FY 2012 FY Q2 2013 YTD 0.84% 0.89% 0.70% 0.40% 0.62% 0.72% -- 0.20% 0.40% 0.60% 0.80% 1.00% 2008 FY 2009 FY 2010 FY 2011 FY 2012 FY Q2 2013 YTD |
|
|
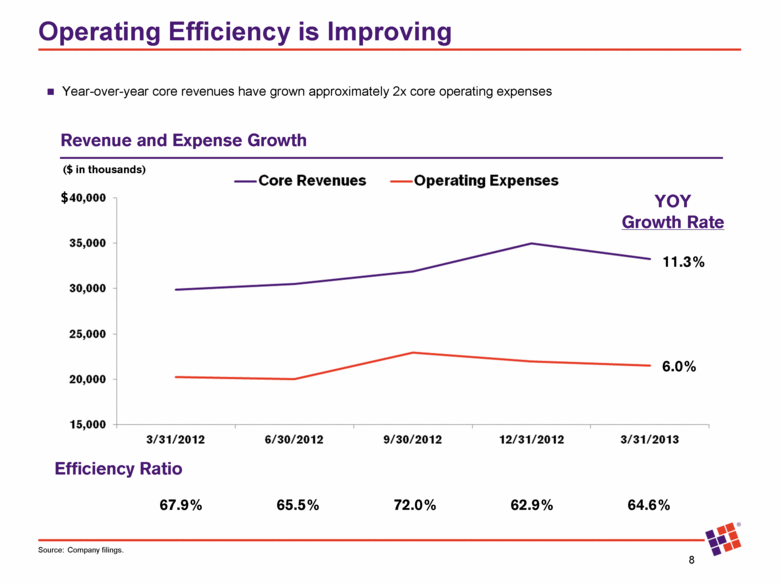
Operating Efficiency is Improving 8 11.3% 6.0% Efficiency Ratio Revenue and Expense Growth 67.9% 65.5% 72.0% 62.9% 64.6% $ ($ in thousands) YOY Growth Rate Year-over-year core revenues have grown approximately 2x core operating expenses Source: Company filings. |
|
|
Positive Trend in Risk Ratings 9 Source: Company filings. – 3/31/13 Risk Rating Report Commercial Loans - Excluding Business Banking Loans Portfolio Avg RR Performing Avg RR 5.692 5.240 5.421 5.130 5.239 5.042 5.195 5.049 5.210 5.062 |
|
|
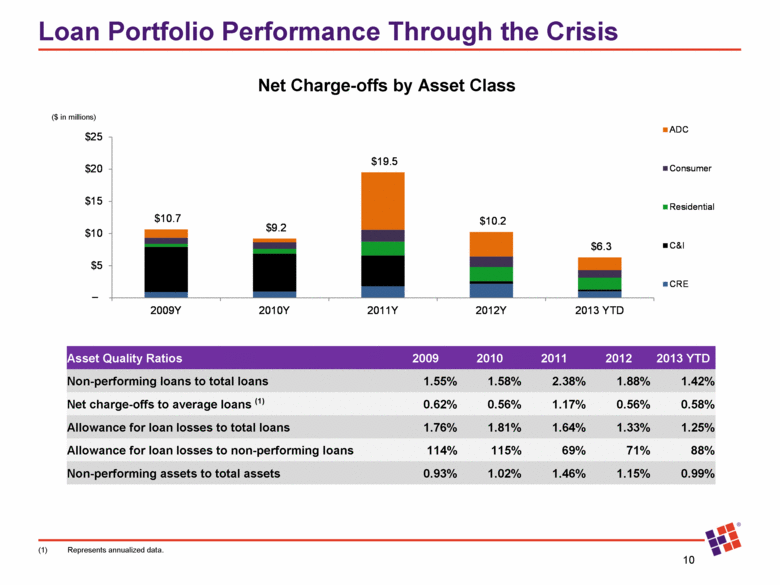
Loan Portfolio Performance Through the Crisis 10 Asset Quality Ratios 2009 2010 2011 2012 2013 YTD Non-performing loans to total loans 1.55% 1.58% 2.38% 1.88% 1.42% Net charge-offs to average loans (1) 0.62% 0.56% 1.17% 0.56% 0.58% Allowance for loan losses to total loans 1.76% 1.81% 1.64% 1.33% 1.25% Allowance for loan losses to non-performing loans 114% 115% 69% 71% 88% Non-performing assets to total assets 0.93% 1.02% 1.46% 1.15% 0.99% (1) Represents annualized data. ($ in millions) – Net Charge-offs by Asset Class $10.7 $9.2 $19.5 $10.2 $6.3 $0 $5 $10 $15 $20 $25 2009Y 2010Y 2011Y 2012Y 2013 YTD ADC Consumer Residential C&I CRE 0 10,000 20,000 30,000 40,000 50,000 60,000 3/31/2012 6/30/2012 9/30/2012 12/31/2012 3/31/2013 ADC Consumer Residential C&I CRE |
|
|
Strong Capital Position 11 TCE / TA Ratio (PBNY) Tier 1 Leverage Ratio (Bank) Source: Company filings. Total Risk-Based Ratio (Bank) Tier 1 Risk-Based Ratio (Bank) 13.0% 13.3% 13.5% 12.4% 12.8% 13.2% 13.6% 9/30/2011 9/30/2012 3/31/2013 8.9% 8.3% 9.2% 7.6% 8.0% 8.4% 8.8% 9.2% 9.6% 9/30/2011 9/30/2012 3/31/2013 11.8% 12.1% 12.4% 11.2% 11.6% 12.0% 12.4% 12.8% 9/30/2011 9/30/2012 3/31/2013 8.1% 7.5% 8.6% 6.8% 7.2% 7.6% 8.0% 8.4% 8.8% 9/30/2011 9/30/2012 3/31/2013 |
|
|
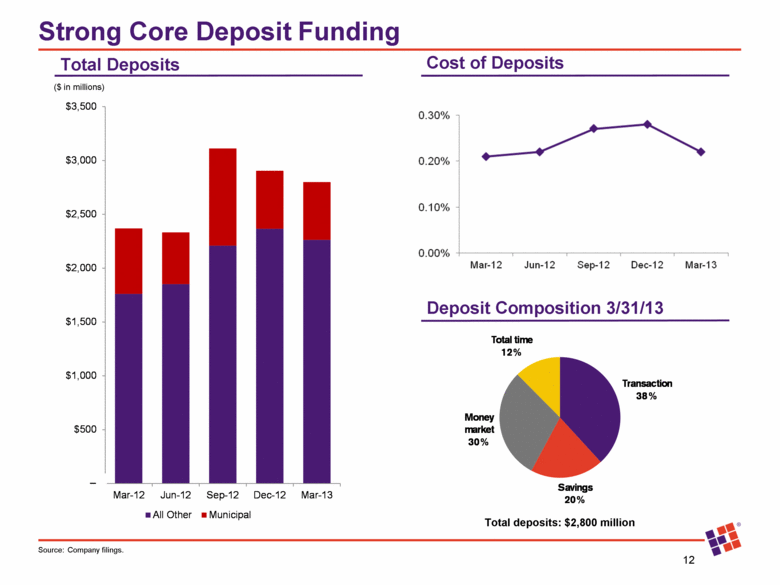
Strong Core Deposit Funding 12 Total Deposits Deposit Composition 3/31/13 Cost of Deposits ($ in millions) Source: Company filings. Total deposits: $2,800 million – Transaction 38% Savings 20% Money market 30% Total time 12% $0 $500 $1,000 $1,500 $2,000 $2,500 $3,000 $3,500 Mar-12 Jun-12 Sep-12 Dec-12 Mar-13 All Other Municipal |
|
|
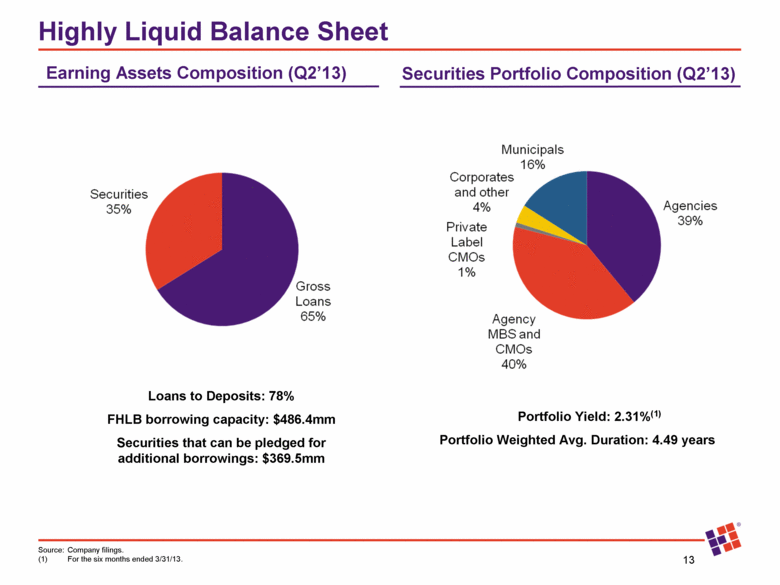
Highly Liquid Balance Sheet 13 Earning Assets Composition (Q2’13) Securities Portfolio Composition (Q2’13) Source: Company filings. (1) For the six months ended 3/31/13. Portfolio Yield: 2.31%(1) Portfolio Weighted Avg. Duration: 4.49 years Loans to Deposits: 78% FHLB borrowing capacity: $486.4mm Securities that can be pledged for additional borrowings: $369.5mm |
|
|
14 Overview of Merger with Sterling Bancorp |
|
|
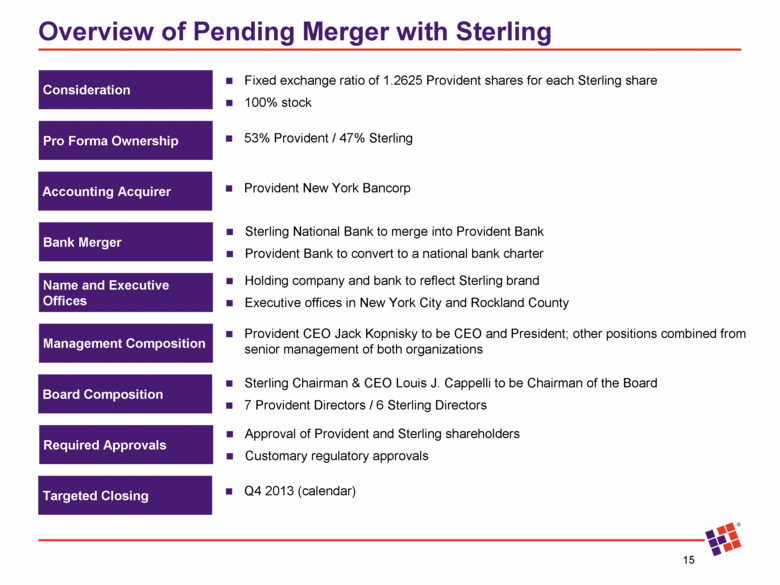
Overview of Pending Merger with Sterling 15 Consideration Pro Forma Ownership Accounting Acquirer Bank Merger Name and Executive Offices Management Composition Board Composition Targeted Closing Fixed exchange ratio of 1.2625 Provident shares for each Sterling share 100% stock 53% Provident / 47% Sterling Provident New York Bancorp Sterling National Bank to merge into Provident Bank Provident Bank to convert to a national bank charter Holding company and bank to reflect Sterling brand Executive offices in New York City and Rockland County Provident CEO Jack Kopnisky to be CEO and President; other positions combined from senior management of both organizations Sterling Chairman & CEO Louis J. Cappelli to be Chairman of the Board 7 Provident Directors / 6 Sterling Directors Q4 2013 (calendar) Required Approvals Approval of Provident and Sterling shareholders Customary regulatory approvals |
|
|
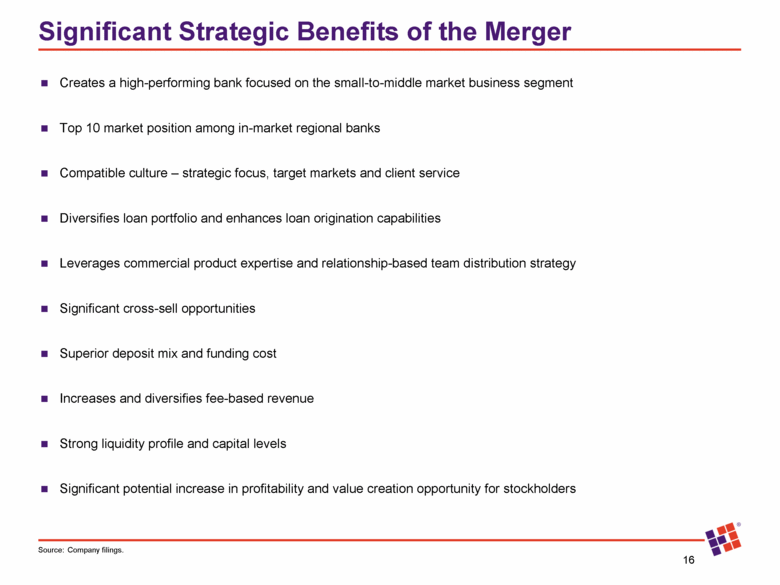
Significant Strategic Benefits of the Merger 16 Creates a high-performing bank focused on the small-to-middle market business segment Top 10 market position among in-market regional banks Compatible culture – strategic focus, target markets and client service Diversifies loan portfolio and enhances loan origination capabilities Leverages commercial product expertise and relationship-based team distribution strategy Significant cross-sell opportunities Superior deposit mix and funding cost Increases and diversifies fee-based revenue Strong liquidity profile and capital levels Significant potential increase in profitability and value creation opportunity for stockholders Source: Company filings. |
|
|
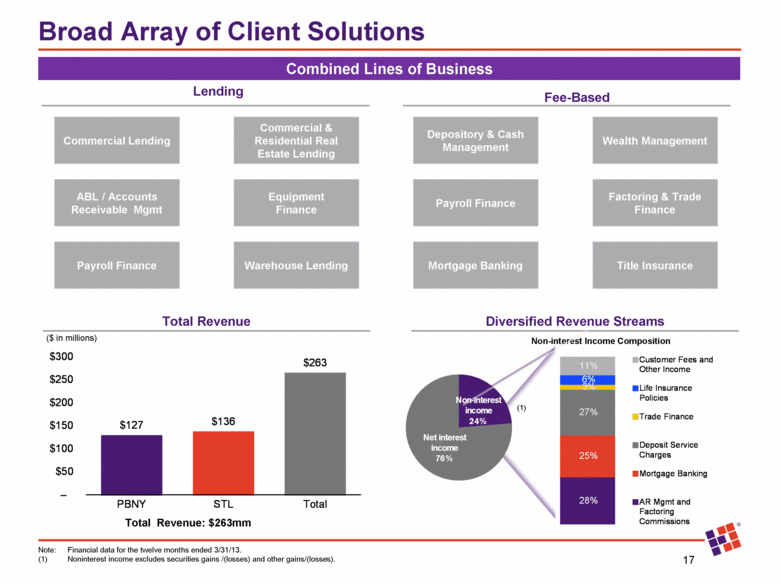
17 Combined Lines of Business Diversified Revenue Streams Total Revenue Commercial Lending Commercial & Residential Real Estate Lending Depository & Cash Management ABL / Accounts Receivable Mgmt Equipment Finance Payroll Finance Payroll Finance Warehouse Lending Mortgage Banking Non-interest Income Composition Total Revenue: $263mm Wealth Management Factoring & Trade Finance Title Insurance Fee-Based Lending ($ in millions) (1) Broad Array of Client Solutions – Note: Financial data for the twelve months ended 3/31/13. (1) Noninterest income excludes securities gains /(losses) and other gains/(losses). Non - interest income 24% Net interest income 76% $127 $136 $263 $0 $50 $100 $150 $200 $250 $300 PBNY STL Total 28% 25% 27% 3% 6% 11% Customer Fees and Other Income Life Insurance Policies Trade Finance Deposit Service Charges Mortgage Banking AR Mgmt and Factoring Commissions |
|
|
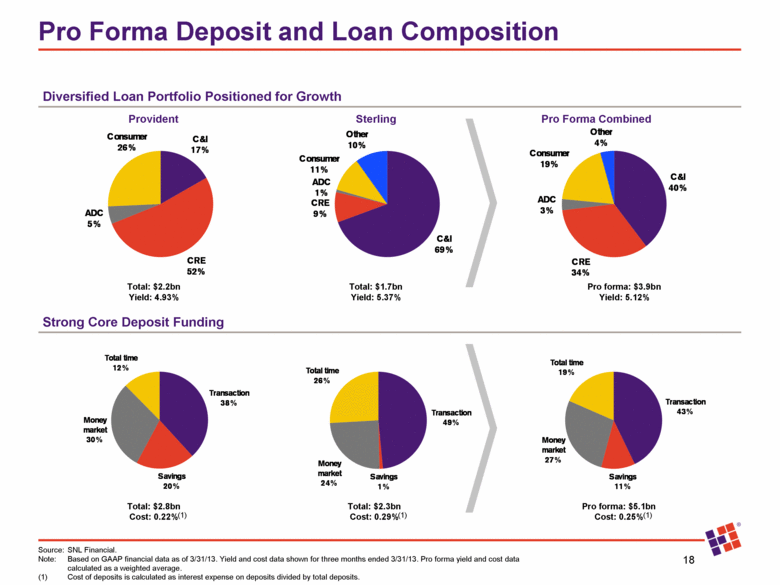
Pro Forma Deposit and Loan Composition 18 Strong Core Deposit Funding Diversified Loan Portfolio Positioned for Growth Provident Sterling Pro Forma Combined Source: SNL Financial. Note: Based on GAAP financial data as of 3/31/13. Yield and cost data shown for three months ended 3/31/13. Pro forma yield and cost data calculated as a weighted average. (1) Cost of deposits is calculated as interest expense on deposits divided by total deposits. Pro forma: $5.1bn Cost: 0.25% Total: $2.3bn Cost: 0.29% Total: $2.8bn Cost: 0.22% Pro forma: $3.9bn Yield: 5.12% Total: $1.7bn Yield: 5.37% Total: $2.2bn Yield: 4.93% (1) (1) (1) C&I 40% CRE 34% ADC 3% Consumer 19% Other 4% C&I 17% CRE 52% ADC 5% Consumer 26% Transaction 38% Savings 20% Money market 30% Total time 12% Transaction 43% Savings 11% Money market 27% Total time 19% C&I 69% CRE 9% ADC 1% Consumer 11% Other 10% Transaction 49% Savings 1% Money market 24% Total time 26% |
|
|
19 Appendix |
|
|
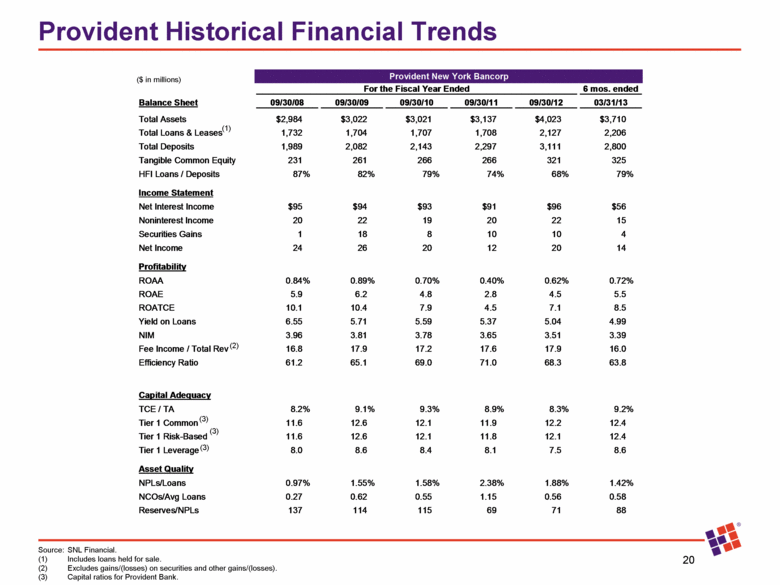
Provident Historical Financial Trends 20 Source: SNL Financial. (1) Includes loans held for sale. (2) Excludes gains/(losses) on securities and other gains/(losses). (3) Capital ratios for Provident Bank. ($ in millions) (1) (3) (3) (3) (2) Provident New York Bancorp For the Fiscal Year Ended 6 mos. ended Balance Sheet 09/30/08 09/30/09 09/30/10 09/30/11 09/30/12 03/31/13 Total Assets $2,984 $3,022 $3,021 $3,137 $4,023 $3,710 Total Loans & Leases 1,732 1,704 1,707 1,708 2,127 2,206 Total Deposits 1,989 2,082 2,143 2,297 3,111 2,800 Tangible Common Equity 231 261 266 266 321 325 HFI Loans / Deposits 87% 82% 79% 74% 68% 79% Income Statement Net Interest Income $95 $94 $93 $91 $96 $56 Noninterest Income 20 22 19 20 22 15 Securities Gains 1 18 8 10 10 4 Net Income 24 26 20 12 20 14 Profitability ROAA 0.84% 0.89% 0.70% 0.40% 0.62% 0.72% ROAE 5.9 6.2 4.8 2.8 4.5 5.5 ROATCE 10.1 10.4 7.9 4.5 7.1 8.5 Yield on Loans 6.55 5.71 5.59 5.37 5.04 4.99 NIM 3.96 3.81 3.78 3.65 3.51 3.39 Fee Income / Total Rev 16.8 17.9 17.2 17.6 17.9 16.0 Efficiency Ratio 61.2 65.1 69.0 71.0 68.3 63.8 Capital Adequacy TCE / TA 8.2% 9.1% 9.3% 8.9% 8.3% 9.2% Tier 1 Common 11.6 12.6 12.1 11.9 12.2 12.4 Tier 1 Risk-Based 11.6 12.6 12.1 11.8 12.1 12.4 Tier 1 Leverage 8.0 8.6 8.4 8.1 7.5 8.6 Asset Quality NPLs/Loans 0.97% 1.55% 1.58% 2.38% 1.88% 1.42% NCOs/Avg Loans 0.27 0.62 0.55 1.15 0.56 0.58 Reserves/NPLs 137 114 115 69 71 88 |
|
|
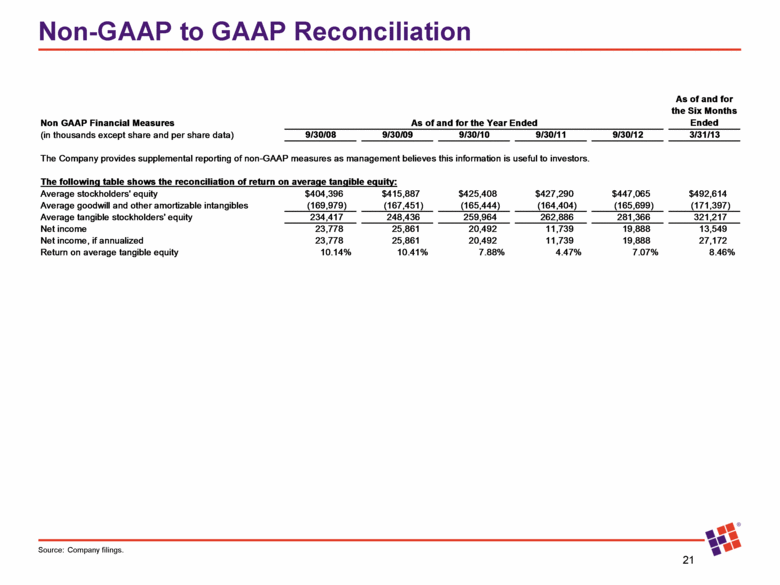
Non-GAAP to GAAP Reconciliation 21 Source: Company filings. Non GAAP Financial Measures As of and for the Year Ended As of and for the Six Months Ended 9/30/08 9/30/09 9/30/10 9/30/11 9/30/12 3/31/13 The Company provides supplemental reporting of non-GAAP measures as management believes this information is useful to investors. The following table shows the reconciliation of return on average tangible equity: Average stockholders' equity $404,396 $415,887 $425,408 $427,290 $447,065 $492,614 Average goodwill and other amortizable intangibles (169,979) (167,451) (165,444) (164,404) (165,699) (171,397) Average tangible stockholders' equity 234,417 248,436 259,964 262,886 281,366 321,217 Net income 23,778 25,861 20,492 11,739 19,888 13,549 Net income, if annualized 23,778 25,861 20,492 11,739 19,888 27,172 Return on average tangible equity 10.14% 10.41% 7.88% 4.47% 7.07% 8.46% (in thousands except share and per share data) |
|
|
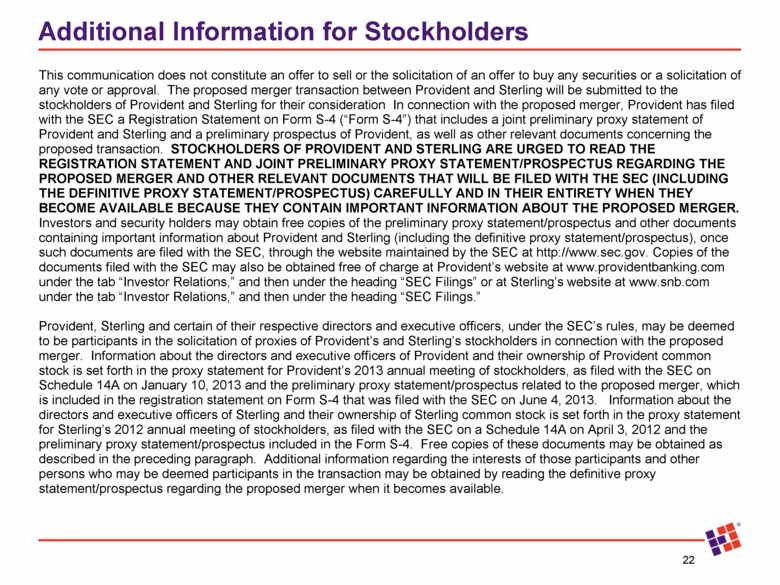
Additional Information for Stockholders 22 This communication does not constitute an offer to sell or the solicitation of an offer to buy any securities or a solicitation of any vote or approval. The proposed merger transaction between Provident and Sterling will be submitted to the stockholders of Provident and Sterling for their consideration In connection with the proposed merger, Provident has filed with the SEC a Registration Statement on Form S-4 (“Form S-4”) that includes a joint preliminary proxy statement of Provident and Sterling and a preliminary prospectus of Provident, as well as other relevant documents concerning the proposed transaction. STOCKHOLDERS OF PROVIDENT AND STERLING ARE URGED TO READ THE REGISTRATION STATEMENT AND JOINT PRELIMINARY PROXY STATEMENT/PROSPECTUS REGARDING THE PROPOSED MERGER AND OTHER RELEVANT DOCUMENTS THAT WILL BE FILED WITH THE SEC (INCLUDING THE DEFINITIVE PROXY STATEMENT/PROSPECTUS) CAREFULLY AND IN THEIR ENTIRETY WHEN THEY BECOME AVAILABLE BECAUSE THEY CONTAIN IMPORTANT INFORMATION ABOUT THE PROPOSED MERGER. Investors and security holders may obtain free copies of the preliminary proxy statement/prospectus and other documents containing important information about Provident and Sterling (including the definitive proxy statement/prospectus), once such documents are filed with the SEC, through the website maintained by the SEC at http://www.sec.gov. Copies of the documents filed with the SEC may also be obtained free of charge at Provident’s website at www.providentbanking.com under the tab “Investor Relations,” and then under the heading “SEC Filings” or at Sterling’s website at www.snb.com under the tab “Investor Relations,” and then under the heading “SEC Filings.” Provident, Sterling and certain of their respective directors and executive officers, under the SEC’s rules, may be deemed to be participants in the solicitation of proxies of Provident’s and Sterling’s stockholders in connection with the proposed merger. Information about the directors and executive officers of Provident and their ownership of Provident common stock is set forth in the proxy statement for Provident’s 2013 annual meeting of stockholders, as filed with the SEC on Schedule 14A on January 10, 2013 and the preliminary proxy statement/prospectus related to the proposed merger, which is included in the registration statement on Form S-4 that was filed with the SEC on June 4, 2013. Information about the directors and executive officers of Sterling and their ownership of Sterling common stock is set forth in the proxy statement for Sterling’s 2012 annual meeting of stockholders, as filed with the SEC on a Schedule 14A on April 3, 2012 and the preliminary proxy statement/prospectus included in the Form S-4. Free copies of these documents may be obtained as described in the preceding paragraph. Additional information regarding the interests of those participants and other persons who may be deemed participants in the transaction may be obtained by reading the definitive proxy statement/prospectus regarding the proposed merger when it becomes available. |

