Attached files
| file | filename |
|---|---|
| EX-32 - EXHIBIT 32 - STERLING BANCORP | ex32.htm |
| EX-31.2 - EXHIBIT 31.2 - STERLING BANCORP | ex31_2.htm |
| EX-31.1 - EXHIBIT 31.1 - STERLING BANCORP | ex31_1.htm |
UNITED
STATES SECURITIES AND EXCHANGE COMMISSION
Washington,
D.C. 20549
FORM
10-K
x ANNUAL
REPORT PURSUANT TO SECTION 13 OR 15(d) OF THE SECURITIES EXCHANGE ACT OF
1934
For
the Fiscal Year Ended September 30, 2009
OR
o
TRANSITION REPORT PURSUANT TO SECTION 13 or 15(d) OF THE SECURITIES EXCHANGE ACT
OF 1934
For the
transition period from _______________ to ____________________
Commission
File Number: 0-25233
|
PROVIDENT
NEW YORK BANCORP
|
|
(Exact
name of Registrant as Specified in its
Charter)
|
|
Delaware
|
80-0091851
|
|
|
(State
or Other Jurisdiction of Incorporation on Organization)
|
(IRS
Employer Identification Number)
|
|
|
400 Rella Blvd., Montebello, New
York
|
10901
|
|
|
(Address
of Principal Executive Office)
|
(Zip
Code)
|
|
(845) 369-8040
|
|
(Registrant’s
Telephone Number including Area
Code)
|
Securities
Registered Pursuant to Section 12(b) of the Act:
|
Title of Class
|
Name of Each Exchange
On Which Registered
|
|
|
Common
Stock, par value $0.01 per share
|
The
NASDAQ Global Select Market
|
Securities
Registered Pursuant to Section 12(g) of the Act: None
Indicate
by check mark if the Registrant is a well-known seasonal issuer, as defined in
Rule 405 of the Securities Act YES o NO þ
Indicate
by check mark if the Registrant is not required to file reports pursuant to
Section 13 or 15(d) of the
Act. YES o NO þ
Indicate
by check mark whether the Registrant (1) has filed all reports required to be
filed by Section 13 or 15(d)
of the Securities Exchange Act of
1934 during the preceding twelve months (or for such shorter period that the
Registrant was required to file such reports) and (2) has been
subject to such filing requirements for the past 90
days YES þ NO o
Indicate
by check mark whether the registrant has submitted electronically and posted on
its corporate Web site, if any, every Interactive Data File
required to be submitted and posted pursuant to Rule 405 of Regulation S-T (§
232.405 of this chapter) during the preceding 12 months
(or for shorter period that the registrant was required to submit and post such
files) YES o NO o
Indicate
by check mark if disclosure of delinquent filers pursuant to Item 405 of Regulation S-K is
not contained herein, and will not be contained,
to the best of Registrant’s knowledge, in definitive proxy or information
statements incorporated by reference in Part III of this Form 10-K
or any amendments to this Form 10-K. þ
Indicate
by check mark whether the Registrant is a large accelerated filer, an
accelerated filer, or a non-accelerated filer – See definition of “accelerated
and large accelerated filer” in Rule 12b-2 of the Exchange Act (check
one).
|
Large
Accelerated Filer o
|
Accelerated
Filer þ
|
Non-Accelerated
Filer o
|
Smaller
Reporting Company o
|
Indicate
by check mark whether the registrant is a shell company (as defined in Rule
12b-2 of the Exchange
Act). YES o
NO þ
The
aggregate market value of the voting stock held by non-affiliates of the
Registrant, computed by reference to the closing price of the common stock as of
March 31, 2009 was $336,229,101.
As of
December 4, 2009 there were outstanding 39,251,384 shares of the Registrant’s
common stock.
DOCUMENT
INCORPORATED BY REFERENCE
Proxy
Statement for the Annual Meeting of Stockholders (Part III) to be filed within
120 days after the end of the Registrant’s fiscal year ended September 30,
2009.
PROVIDENT NEW YORK BANCORP
FORM
10-K TABLE OF CONTENTS
September
30, 2009
|
PART
I
|
1
|
|
|
ITEM
1.
|
1
|
|
|
ITEM
1A.
|
30
|
|
|
ITEM
1B.
|
35
|
|
|
ITEM
2.
|
35
|
|
|
ITEM
3.
|
36
|
|
|
ITEM
4.
|
36
|
|
|
PART
II
|
36
|
|
|
ITEM
5.
|
36
|
|
|
ITEM
6.
|
39
|
|
|
ITEM
7.
|
42
|
|
|
ITEM
7A.
|
56
|
|
|
ITEM
8.
|
57
|
|
|
ITEM
9.
|
108
|
|
|
ITEM
9A.
|
108
|
|
|
ITEM
9B.
|
108
|
|
|
PART
III
|
108
|
|
|
ITEM
10.
|
108
|
|
|
ITEM
11.
|
108
|
|
|
ITEM
12.
|
109
|
|
|
ITEM
13.
|
109
|
|
|
ITEM
14.
|
109
|
|
|
PART
IV
|
109
|
|
|
ITEM
15.
|
109
|
|
|
112
|
||
PART I
ITEM
1. Business
Provident
New York Bancorp
Provident
New York Bancorp (“Provident Bancorp” or the “Company”) is a Delaware
corporation that owns all of the outstanding shares of common stock of Provident
Bank (the “Bank”). At September 30, 2009, Provident Bancorp had, on a
consolidated basis, assets of $3.0 billion, deposits of $2.1 billion and
stockholders’ equity of $427.5 million. As of September 30, 2009, Provident
Bancorp had 39,547,207 shares of common stock outstanding.
Provident
Bank
Provident
Bank, an independent, full-service community bank founded in 1888, is
headquartered in Montebello, New York and is the principal bank subsidiary of
Provident Bancorp. With $3.0 billion in assets and 536 full-time equivalent
employees, Provident Bank accounts for substantially all of Provident Bancorp’s
consolidated assets and net income. We operate 33 branches which serve the
Hudson Valley region, including 32 branches located in Rockland, Orange,
Sullivan, Ulster, Westchester and Putnam Counties in New York, and one branch in
Bergen County, New Jersey which operates under the name Towncenter Bank, a
division of Provident Bank, New York. Provident Bank offers a complete line of
commercial, community business (small business) and retail banking products and
services.
We also
offer deposit services to municipalities located in the State of New York
through Provident Bank’s wholly-owned subsidiary, Provident Municipal
Bank.
Provest
Services Corporation I is a wholly-owned subsidiary of Provident Bank, holding
an investment in a limited partnership that operates an assisted-living
facility. A percentage of the units in the facility are for low-income
individuals. Provest Services Corp. II is a wholly-owned subsidiary of Provident
Bank that has engaged a third-party provider to sell annuities, life and health
insurance products to Provident Bank’s customers. Through September 30, 2009,
the activities of these subsidiaries have had an insignificant effect on our
consolidated financial condition and results of operations. Provident REIT, Inc.
and WSB Funding are subsidiaries in the form of real estate investment trust and
hold both residential and commercial real estate loans.
Provident
Bank’s website (www.providentbanking.com) contains a direct link to the
Company’s filings with the Securities and Exchange Commission, including copies
of annual reports on Form 10-K, quarterly reports on Form 10-Q, current reports
on Form 8-K and amendments to these filings, as well as ownership reports on
Forms 3, 4 and 5 filed by the Company’s directors and executive
officers. Copies may also be obtained, without charge, by written
request to Provident New York Bancorp Investor Relations, 400 Rella Boulevard,
Montebello, New York 10901, Attention: Miranda Grimm. Provident
Bank’s website is not part of this Annual Report on Form 10-K.
Non-Bank
Subsidiaries
In
addition to Provident Bank, the Company owns Hardenburgh Abstract Company of
Orange County, Inc. (“Hardenburgh’) that was acquired in connection with the
acquisition of Warwick Community Bancorp (“WSB”) and Hudson Valley Investment
Advisors, LLC, an investment advisory firm that generates investment management
fees. Hardenburgh had gross revenue from title insurance policies and
abstracts of $1.0 million and net income of $156,000 in 2009, and Hudson Valley
Investment Advisors, LLC generated $2.0 million in fee income in 2009 and net
income of $317,000.
Provident
Municipal Bank
Provident
Municipal Bank, a wholly-owned subsidiary of Provident Bank, is a New York
State-chartered commercial bank which is engaged in the business of accepting
deposits from municipalities in our market area. New York State law requires
municipalities located in the State of New York to deposit funds with commercial
banks, effectively forbidding these municipalities from depositing funds with
savings banks, including federally chartered savings associations, such as
Provident Bank.
Forward-Looking
Statements
From time
to time the Company has made and may continue to make written or oral
forward-looking statements regarding our outlook or expectations for earnings,
revenues, expenses, capital levels, asset quality or other future financial or
business performance, strategies or expectations, or the impact of legal,
regulatory or supervisory matters on our business operations or
performance. This Annual Report on Form 10-K also includes
forward-looking statements. With respect to all such forward-looking
statements, you should review our Risk Factors discussion in Item 1A. and our
Cautionary Statement Regarding Forward-Looking Information included in Item
7.
Market
Area
Provident
Bank is an independent community bank offering a broad range of financial
services to businesses and individuals as an alternative to money center and
large regional banks in our market area. At September 30, 2009, our 33
full-service banking offices consisted of 12 offices in Rockland County, New
York, 14 offices in Orange County, New York, and 6 offices in contiguous Ulster,
Putnam, Westchester and Sullivan Counties, New York. There is one
office located in Lodi, New Jersey operating as Towncenter Bank, a division of
Provident Bank, New York. Our primary market for deposits is
currently concentrated around the areas where our full-service banking offices
are located.
Our
primary lending area consists of Rockland and Orange Counties as well as
contiguous counties. Rockland and Orange Counties represent a suburban area with
a broad employment base. These counties also serve as bedroom communities for
nearby New York City and other suburban areas including Westchester County and
northern New Jersey. According to data published by the Federal Deposit
Insurance Corporation (“FDIC”) as of June 30, 2009, Provident Bank holds the #2
share of deposits in Rockland County and #3 share of deposits in Orange County,
and overall has the combined #3 share of deposits in Rockland and Orange
Counties, New York.
Management
Strategy
We
operate as an independent community bank that offers a broad range of
customer-focused financial services as an alternative to large regional,
multi-state and international banks in our market area. Management has invested
in the infrastructure and staffing to support our strategy of serving the
financial needs of businesses, individuals and municipalities in our market area
focusing on core deposit generation and quality loan growth which provides a
favorable platform for long-term sustainable growth. Highlights of management’s
business strategy are as follows:
Operating as a
Community Bank.
As an independent community bank, we emphasize the local nature of our
decision-making to respond more effectively to the needs of our customers while
providing a full range of financial services to the businesses, individuals, and
municipalities in our market area. We offer a broad range of financial products
to meet the changing needs of the marketplace, including internet banking, cash
management services and, on a selective basis, sweep accounts. In addition, we
offer asset management services to meet the investing needs of individuals,
corporations and not-for-profit entities. As a result, we are able to provide,
at the local level, the financial services required to meet the needs of the
majority of existing and potential customers in our market.
Enhancing
Customer Service.
We are committed to providing superior customer service as a way to
differentiate us from our competition. As part of our commitment to service, we
have been engaged in Sunday banking since 1995. In addition, we offer multiple
access channels to our customers, including our branch and ATM network, internet
banking, our Customer Care Telephone Center and our Automated Voice Response
system. We reinforce in our employees a commitment to customer service through
extensive training, recognition programs and measurement of service standards.
In 2006, we launched our Service Excellence Program designed to maintain the
highest level of service to our customer base.
Growing and
maintaining a Diversified Loan Portfolio. We offer a broad range of
loan products to commercial businesses, real estate owners, developers and
individuals. To support this activity, we maintain commercial, consumer and
residential loan departments staffed with experienced professionals to promote
the continued growth and prudent management of loan assets. We have experienced
consistent and significant growth in our commercial loan portfolio while
continuing to provide our residential mortgage and consumer lending services. As
a result, we believe that we have developed a high quality diversified loan
portfolio with a favorable mix of loan types, maturities and
yields.
Expanding our
Banking Franchise.
Management intends to continue the expansion of the banking franchise and
to increase the number of customers served and products used by businesses and
consumers in our market area. Our strategy is to deliver exceptional customer
service, which depends on up-to-date technology and multiple access channels, as
well as courteous personal contact from a trained and motivated workforce. This
approach has resulted in a relatively high level of core deposits, which drives
our overall cost of funds. Management intends to maintain this strategy, which
will require ongoing investment in banking locations and technology to support
exceptional service levels for Provident Bank’s customers. Recent
expansion efforts have been focused on Westchester County.
Lending
Activities
General. We originate commercial
real estate loans, commercial business loans and acquisition, development and
construction loans (collectively referred to as the “commercial loan
portfolio”). We also originate in our market area fixed-rate and adjustable-rate
(“ARM”) residential mortgage loans collateralized by one- to four-family
residential real estate, and consumer loans such as home equity lines of credit,
homeowner loans and personal loans. We retain most of the loans we originate,
although we may sell longer-term one- to four-family residential loans and
participations in some commercial loans.
Commercial Real
Estate Lending.
We originate real estate loans secured predominantly by first liens on
commercial real estate. The commercial properties are predominantly
non-residential properties such as office buildings, shopping centers, retail
strip centers, industrial and warehouse properties and, to a lesser extent, more
specialized properties such as churches, mobile home parks, restaurants and
motel/hotels. We may, from time to time, purchase commercial real estate loan
participations. We target commercial real estate loans with initial principal
balances between $1.0 million and $15.0 million. At September 30,
2009, loans secured by commercial real estate totaled $554.5 million, or 32.6%
of our total loan portfolio and consisted of 1,038 loans outstanding, although
there are a large number of loans with balances substantially greater than the
average. Substantially all of our commercial real estate loans are
secured by properties located in our primary market area.
The
majority of our commercial real estate loans are written as five-year
adjustable-rate or ten-year fixed-rate mortgages and typically have balloon
maturities up to ten years. Amortization on these loans is typically
based on 20-year payout schedules. Margins generally range from 200
basis points to 300 basis points above the applicable Federal Home Loan Bank
advance rate.
In the
underwriting of commercial real estate loans, we generally lend up to 75% of the property’s
appraised value. Decisions to lend are based on the economic
viability of the property and the creditworthiness of the
borrower. In evaluating a proposed commercial real estate loan, we
primarily emphasize the ratio of the property’s projected net cash flow to the
loan’s debt service requirement (generally targeting a ratio of 120%), computed
after deduction for a vacancy factor and property expenses we deem
appropriate. In addition, a personal guarantee of the loan or a
portion thereof is generally required from the principal(s) of the
borrower. We require title insurance insuring the priority of our
lien, fire and extended coverage casualty insurance, and flood insurance, if
appropriate, in order to protect our security interest in the underlying
property. In addition, business interruption insurance or other
insurance may be required.
Commercial
real estate loans generally carry higher interest rates and have shorter terms
than one-to four-family residential mortgage loans. Commercial real
estate loans entail significant additional credit risks compared to one- to
four-family residential mortgage loans, as they typically involve large loan
balances concentrated with single borrowers or groups of related borrowers. In
addition, the payment experience on loans secured by income-producing properties
typically depends on the successful operation of the related real estate project
and thus may be subject to a greater extent to adverse conditions in the real
estate market and in the general economy. For commercial real estate
loans in which the borrower is the primary occupant, repayment experience also
depends on the successful operation of the borrower’s underlying
business.
Commercial
Business Loans.
We make various types of secured and unsecured commercial loans to
customers in our market area for the purpose of financing equipment acquisition,
expansion, working capital and other general business purposes. The
term of these loans generally range from less than one year to seven
years. The loans are either negotiated on a fixed-rate basis or carry
adjustable interest rates indexed to a lending rate that is determined
internally, or a short-term market rate index. At September 30, 2009,
we had 2,337 commercial business loans outstanding with an aggregate balance of
$242.6 million, or 14.2% of the total loan
portfolio. As of September 30, 2009, the average commercial business
loan balance was approximately $247,000 although there are a large number of
loans with balances substantially greater than this average.
Commercial
credit decisions are based upon a credit assessment of the loan
applicant. A determination is made as to the applicant’s ability to
repay in accordance with the proposed terms as well as an overall assessment of
the risks involved. An evaluation is made of the applicant to
determine character and capacity to manage. Personal guarantees of
the principals are generally required, except in the case of not-for-profit
corporations. In addition to an evaluation of the loan applicant’s
financial statements, a determination is made of the probable adequacy of the
primary and secondary sources of repayment to be relied upon in the
transaction. Credit agency reports of the applicant’s credit history
supplement the analysis of the applicant’s creditworthiness. Checking
with other banks and trade investigations may also be
conducted. Collateral supporting a secured transaction also is
analyzed to determine its marketability. For small business loans and
lines of credit, generally those not exceeding $400,000, we use a credit scoring
system that enables us to process the loan requests more quickly and
efficiently. Commercial business loans generally bear higher interest
rates than residential loans of like duration because they involve a higher risk
of default since their repayment is generally dependent on the successful
operation of the borrower’s business and the sufficiency of collateral, if
any.
One- to
Four-Family Real Estate Lending. We offer
conforming and non-conforming, fixed-rate and adjustable-rate residential
mortgage loans with maturities of up to 30 years and maximum loan amounts
generally up to $1.1 million. This portfolio totaled $460.7 million,
or 27.0% of our total loan portfolio at September 30, 2009.
We offer
both fixed- and adjustable-rate conventional mortgage loans with terms of 10 to
30 years that are fully amortizing with monthly or bi-weekly loan
payments. One- to four-family residential mortgage loans are
generally underwritten according to Fannie Mae and Freddie Mac guidelines for
loans they designate as “A” or “A-“. Loans that conform to such
guidelines are referred to as “conforming loans.” We generally
originate both fixed-rate and ARM loans in amounts up to the maximum conforming
loan limits as established by Fannie Mae and Freddie Mac, which are currently
$417,000 for single-family homes or higher in certain areas up to $2.5 million.
Private mortgage insurance is generally required for loans with loan-to-value
ratios in excess of 80%. We sold substantially all conforming fixed
rate 1-4 family residential loans originated in fiscal 2009, totaling $48.7
million.
We also
originate loans above conforming limits, referred to as “jumbo loans,” which
have been underwritten to substantially the same credit standards as conforming
loans, which are generally eligible for sale to various firms that specialize in
the purchase of such non-conforming loans. During the past year, the
market for jumbo loans has been erratic with many of the normal outlets unable
to purchase this type of loan; consequently, no loans were sold during fiscal
2009.
We also
originate loans other than jumbo loans that are not saleable to Fannie Mae or
Freddie Mac, but which we deem to be acceptable risks. The amount of such loans
originated for fiscal 2009 was $8.1 million, all of which were retained in our
loan portfolio.
We
actively monitor our interest rate risk position to determine the desirable
level of investment in fixed-rate mortgages. Depending on market interest rates
and our capital and liquidity position, we may retain all of our newly
originated longer term fixed-rate residential mortgage loans, or from time to
time we may decide to sell all or a portion of such loans in the secondary
mortgage market to government sponsored entities such as Fannie Mae and Freddie
Mac or other purchasers. Our bi-weekly one- to four-family residential mortgage
loans that are retained in our portfolio result in shorter repayment schedules
than conventional monthly mortgage loans, and are repaid through an automatic
deduction from the borrower’s savings or checking account. As of September 30,
2009, bi-weekly loans totaled $146.0 million, or 31.7% of our residential loan
portfolio. We retain the servicing rights on a large majority of loans sold to
generate fee income and reinforce our commitment to customer service, although
we may also sell non-conforming loans to mortgage banking companies, generally
on a servicing-released basis. As of September 30, 2009, loans serviced for
others, excluding loan participations, totaled $106.0 million.
We
currently offer several ARM loan products secured by residential properties with
rates that are fixed for a period ranging from six months to ten years. After
the initial term, if the loan is not already refinanced, the interest rate on
these loans generally reset every year based upon a contractual spread or margin
above the average yield on U.S. Treasury securities, adjusted to a constant
maturity of one year, as published weekly by the Federal Reserve Board and
subject to certain periodic and lifetime limitations on interest rate changes.
Many of the borrowers who select these loans have shorter-term credit needs than
those who select long-term, fixed-rate loans. ARM loans generally pose different
credit risks than fixed-rate loans primarily because the underlying debt service
payments of the borrowers rise as interest rates rise, thereby increasing the
potential for default. At September 30, 2009, our ARM portfolio included
$4.5 million in
loans that re-price every six months, $29.9 million in loans that re-price once
a year, $6.3 million in loans that re-price periodically after an initial
fixed-rate period of one year or more and $104,000 that re-price based upon
other miscellaneous re-pricing terms. Our adjustable rate loans do
not have interest-only or negative amortization features. We do not
nor have we in the past originated “subprime” loans, loans to borrowers with
subprime credit scores combined with either high loan to value or high debt to
income ratios.
We
require title insurance on all of our one- to four-family mortgage loans, and we
also require that borrowers maintain fire and extended coverage or all risk
casualty insurance (and, if appropriate, flood insurance) in an amount at least
equal to the lesser of the loan balance or the replacement cost of the
improvements, but in any event in an amount calculated to avoid the effect of
any coinsurance clause. Nearly all residential first mortgage loans are required
to have a mortgage escrow account from which disbursements are made for real
estate taxes and for hazard and flood insurance.
Acquisition,
Development and Construction Loans. We originate land
acquisition, development and construction (“ADC”) loans to builders in our
market area. These loans totaled $193.8 million, or 11.4% of our total loan
portfolio at September 30, 2009. Acquisition loans help finance the purchase of
land intended for further development, including single-family houses,
multi-family housing, and commercial income property. In some cases, we may make
an acquisition loan before the borrower has received approval to develop the
land as planned. In general, the maximum loan-to-value ratio for a land
acquisition loan is 50% of the appraised value of the property, although for
certain borrowers we deem to be our lowest risk, higher loan-to-value ratios may
be allowed. We also make development loans to builders in our market area to
finance improvements to real estate, consisting mostly of single-family
subdivisions, typically to finance the cost of utilities, roads, sewers and
other development costs. Builders generally rely on the sale of single-family
homes to repay development loans, although in some cases the improved building
lots may be sold to another builder. The maximum amount loaned is generally
limited to the cost of the improvements plus limited approval of soft costs. In
general, we do not originate loans with interest reserves. A portion
of our ADC loans acquired through the purchase of participations do carry
interest reserves. The total loans with interest reserves at September 30, 2009
were $77.4 million. Advances are made in accordance with a schedule
reflecting the cost of the improvements.
We also
make construction loans to area builders, often in conjunction with development
loans. In the case of residential subdivisions, these loans finance the cost of
completing homes on the improved property. Advances on construction loans are
made in accordance with a schedule reflecting the cost of construction.
Repayment of construction loans on residential subdivisions is normally expected
from the sale of units to individual purchasers. In the case of income-producing
property, repayment is usually expected from permanent financing upon completion
of construction. We commit to provide the permanent mortgage financing on most
of our construction loans on income-producing property.
Land
acquisition, development and construction lending exposes us to greater credit
risk than permanent mortgage financing. The repayment of land acquisition,
development and construction loans depends upon the sale of the property to
third parties or the availability of permanent financing upon completion of all
improvements. In the event we make an acquisition loan on property that is not
yet approved for the planned development, there is the risk that approvals will
not be granted or will be delayed. These events may adversely affect the
borrower and the collateral value of the property. Development and construction
loans also expose us to the risk that improvements will not be completed on time
in accordance with specifications and projected costs. In addition, the ultimate
sale or rental of the property may not occur as anticipated. In
recent years as a result of the economic downturn, most projects have performed
behind schedule, requiring the borrowers to carry these projects for a longer
time frame than was originally contemplated when we approved the credit
facilities. As a result many of the borrowers have been utilizing
other sources to maintain debt service or have been unable to maintain debt
service requirements. With current market conditions, the Bank is
currently not considering unapproved land loans, and new acquisition,
development and construction loans are being underwritten based on the current
market.
Consumer
Loans. We
originate a variety of consumer and other loans, including homeowner loans, home
equity lines of credit, new and used automobile loans, and personal unsecured
loans, including fixed-rate installment loans and variable lines of credit. As
of September 30, 2009, consumer loans totaled $251.5 million, or 14.8% of the
total loan portfolio.
At
September 30, 2009, the largest group of consumer loans consisted of $235.1
million of loans secured by junior liens on residential properties. We offer
fixed-rate, fixed-term second mortgage loans, referred to as homeowner loans,
and we also offer adjustable-rate home equity lines of credit. As of September
30, 2009, homeowner loans totaled $54.9 million or 3.2% of our total loan
portfolio. The disbursed portion of home equity lines of credit totaled $180.2
million, or 10.6% of our total loan portfolio at September 30, 2009, with $151.0
million remaining undisbursed.
Other
consumer loans include personal loans and loans secured by new or used
automobiles. As of September 30, 2009, these loans totaled $16.4 million, or 1%
of our total loan portfolio. We originate consumer loans directly to our
customers or on an indirect basis through selected dealerships. We require
borrowers to maintain collision insurance on automobiles securing consumer
loans, with us listed as loss payee. Personal loans also include
secured and unsecured installment loans for other purposes. Unsecured
installment loans, which include most personal loans, generally have shorter
terms than secured consumer loans, and generally have higher interest rates than
rates charged on secured installment loans with comparable terms. We
also offer overdraft lines of credit on an unsecured basis, outstanding balances
on these loans totaled $5.1 million with additional undrawn lines totaling $15.4
million.
Our
procedures for underwriting consumer loans include an assessment of an
applicant’s credit history and the ability to meet existing obligations and
payments on the proposed loan. Although an applicant’s creditworthiness is a
primary consideration, the underwriting process also includes a comparison of
the value of the collateral security, if any, to the proposed loan
amount. We generally lend at an 80% loan to value ratio for home
equity loans, but will go to 90% loan to value with a strong loan profile and
higher pricing.
Consumer
loans generally entail greater risk than residential mortgage loans,
particularly in the case of consumer loans that are unsecured or secured by
assets that tend to depreciate rapidly, such as automobiles. In addition, the
repayment of consumer loans depends on the borrowers’ continued financial
stability, as repayment historically has been more likely to be adversely
affected by job loss, divorce, illness or personal bankruptcy than a single
family mortgage loan.
Loan Portfolio
Composition. The following table sets forth the composition of
our loan portfolio, excluding loans held for sale, by type of loan at the dates
indicated.
|
September
30,
|
||||||||||||||||||||||||||||||||||||||||
|
2009
|
2008
|
2007
|
2006
|
2005
|
||||||||||||||||||||||||||||||||||||
|
Amount
|
Percent
|
Amount
|
Percent
|
Amount
|
Percent
|
Amount
|
Percent
|
Amount
|
Percent
|
|||||||||||||||||||||||||||||||
|
(Dollars
in thousands)
|
||||||||||||||||||||||||||||||||||||||||
|
One-
to four-family residential mortgage loans
|
$ | 460,729 | 27.0 | % | $ | 513,381 | 29.6 | % | $ | 500,825 | 30.6 | % | $ | 462,996 | 31.4 | % | $ | 456,794 | 33.5 | % | ||||||||||||||||||||
|
Commercial
real estate loans
|
554,550 | 32.6 | 554,811 | 32.0 | 535,003 | 32.8 | 529,607 | 35.9 | 497,936 | 36.6 | ||||||||||||||||||||||||||||||
|
Commercial
business loans
|
242,628 | 14.2 | 243,642 | 14.1 | 207,156 | 12.6 | 160,823 | 10.9 | 148,825 | 10.9 | ||||||||||||||||||||||||||||||
|
Acquisition,
development, construction
|
193,828 | 11.4 | 170,979 | 9.9 | 153,074 | 9.3 | 96,656 | 6.6 | 66,710 | 4.9 | ||||||||||||||||||||||||||||||
|
Total
commercial loans
|
991,006 | 58.2 | 969,432 | 56.0 | 895,233 | 54.7 | 787,086 | 53.4 | 713,471 | 52.4 | ||||||||||||||||||||||||||||||
|
Home
equity lines of credit
|
180,205 | 10.6 | 166,491 | 9.6 | 162,669 | 9.9 | 149,862 | 10.2 | 134,997 | 9.9 | ||||||||||||||||||||||||||||||
|
Homeowner
loans
|
54,941 | 3.2 | 58,569 | 3.4 | 59,705 | 3.6 | 55,968 | 3.8 | 40,221 | 3.0 | ||||||||||||||||||||||||||||||
|
Other
consumer loans
|
16,376 | 1.0 | 23,680 | 1.4 | 19,626 | 1.2 | 17,646 | 1.2 | 16,590 | 1.2 | ||||||||||||||||||||||||||||||
|
Total
consumer loans
|
251,522 | 14.8 | 248,740 | 14.4 | 242,000 | 14.7 | 223,476 | 15.2 | 191,808 | 14.1 | ||||||||||||||||||||||||||||||
|
Total
loans
|
1,703,257 | 100.0 | % | 1,731,553 | 100.0 | % | 1,638,058 | 100.0 | % | 1,473,558 | 100.0 | % | 1,362,073 | 100.0 | % | |||||||||||||||||||||||||
|
Allowance
for loan losses
|
(30,050 | ) | (23,101 | ) | (20,389 | ) | (20,373 | ) | (21,047 | ) | ||||||||||||||||||||||||||||||
|
Total
loans, net
|
$ | 1,673,207 | $ | 1,708,452 | $ | 1,617,669 | $ | 1,453,185 | $ | 1,341,026 | ||||||||||||||||||||||||||||||
Loan Portfolio
Maturities and Yields. The following table
summarizes the scheduled repayments of our loan portfolio at September 30, 2009.
Demand loans, loans having no stated repayment schedule or maturity, and
overdraft loans are reported as being due in one year or less.
|
Residential
Mortgage
|
Commercial
Real Estate
|
Commercial
Business
|
Construction
(1)
|
Consumer
|
Total
|
|||||||||||||||||||||||||||||||||||||||||||
|
Amount
|
Weighted
Average Rate
|
Amount
|
Weighted
Average Rate
|
Amount
|
Weighted
Average Rate
|
Amount
|
Weighted
Average Rate
|
Amount
|
Weighted
Average Rate
|
Amount
|
Weighted
Average Rate
|
|||||||||||||||||||||||||||||||||||||
|
(Dollars
in thousands)
|
||||||||||||||||||||||||||||||||||||||||||||||||
|
Due
During the Years
|
||||||||||||||||||||||||||||||||||||||||||||||||
|
Ending
September 30,
|
||||||||||||||||||||||||||||||||||||||||||||||||
|
2010
|
$ | 5,706 | 6.84 | % | $ | 44,899 | 5.27 | % | $ | 94,734 | 3.96 | % | $ | 130,165 | 4.05 | % | $ | 4,357 | 4.44 | % | $ | 279,861 | 4.27 | % | ||||||||||||||||||||||||
|
2011
to 2014
|
11,060 | 5.57 | 174,239 | 5.90 | 60,897 | 6.32 | 57,383 | 3.92 | 35,260 | 6.14 | 338,839 | 5.65 | ||||||||||||||||||||||||||||||||||||
|
2014
and beyond
|
443,963 | 5.81 | 335,412 | 6.65 | 86,997 | 4.78 | 6,280 | 3.02 | 211,905 | 3.77 | 1,084,557 | 5.85 | ||||||||||||||||||||||||||||||||||||
|
Total
|
$ | 460,729 | 5.82 | % | $ | 554,550 | 6.30 | % | $ | 242,628 | 4.84 | % | $ | 193,828 | 3.98 | % | $ | 251,522 | 4.11 | % | $ | 1,703,257 | 5.55 | % | ||||||||||||||||||||||||
|
(1)
|
Includes
land acquisition and development
loans.
|
The
following table sets forth the scheduled repayments of fixed- and
adjustable-rate loans at September 30, 2009 that are contractually due after
September 30, 2010.
|
Fixed
|
Adjustable
|
Total
|
||||||||||
|
(Dollars
in thousands)
|
||||||||||||
|
Residential
mortgage loans
|
$ | 414,158 | $ | 40,865 | $ | 455,023 | ||||||
|
Commercial
real estate loans
|
234,815 | 274,836 | 509,651 | |||||||||
|
Commercial
business loans
|
59,633 | 88,261 | 147,894 | |||||||||
|
Construction
loans
|
666 | 62,997 | 63,663 | |||||||||
|
Total
commercial loans
|
295,114 | 426,094 | 721,208 | |||||||||
|
Consumer
loans
|
74,921 | 172,244 | 247,165 | |||||||||
|
Total
loans
|
$ | 784,193 | $ | 639,203 | $ | 1,423,396 | ||||||
Loan
Originations, Purchases, Sales and Servicing. While we originate both
fixed-rate and adjustable-rate loans, our ability to generate each type of loan
depends upon borrower demand, market interest rates, borrower preference for
fixed versus adjustable-rate loans, and the interest rates offered on each type
of loan by other lenders in our market area. These include competing banks,
savings banks, credit unions, mortgage banking companies, life insurance
companies and similar financial services firms. Loan originations are derived
from a number of sources, including branch office personnel, existing customers,
borrowers, builders, attorneys, real estate broker referrals and walk-in
customers.
Our loan
origination and sales activity may be adversely affected by a rising interest
rate environment or period of falling house prices that typically results in
decreased loan demand, while declining interest rates may stimulate increased
loan demand, as well as being impacted by the level of unemployment and housing
sale activity. Accordingly, the volume of loan origination, the mix of fixed and
adjustable-rate loans, and the profitability of this activity can vary from
period to period. One- to four-family residential mortgage loans are generally
underwritten to current Fannie Mae and Freddie Mac seller/servicer guidelines,
and closed on standard Fannie Mae/Freddie Mac documents. If such loans are sold,
the sales are conducted generally using standard Fannie Mae/Freddie Mac purchase
contracts and master commitments as applicable. One- to four-family mortgage
loans may be sold to Fannie Mae or Freddie Mac on a non-recourse basis whereby
foreclosure losses are generally the responsibility of the purchaser and not
Provident Bank. Consistent with its long-standing credit policies,
Provident Bank does not originate or hold subprime mortgage loans. We
also hold no subprime loans through our investment portfolio.
We are a
qualified loan servicer for both Fannie Mae and Freddie Mac. Our policy
generally has been to retain the servicing rights for all conforming loans sold.
We therefore continue to collect payments on the loans, maintain tax escrows and
applicable fire and flood insurance coverage, and supervise foreclosure
proceedings, if necessary. We retain a portion of the interest paid by the
borrower on the loans as consideration for our servicing
activities.
Loan
Approval/Authority and Underwriting. We have four levels of
lending authority beginning with the Board of Directors. The Board grants
lending authority to the Director Loan Committee, the members of which are
Directors. The Director Loan Committee, in turn, may grant authority to the
Management Loan Committee and individual loan officers. In addition, designated
members of management may grant authority to individual loan officers up to
specified limits. Our lending activities are subject to written policies
established by the Board. These policies are reviewed periodically.
The
Director Loan Committee may approve loans in accordance with applicable loan
policies, up to the limits established in our policy governing loans to one
borrower. This policy places limits on the aggregate dollar amount of credit
that may be extended to any one borrower and related entities. Loans exceeding
the maximum loan-to-one borrower limit described below require approval by the
Board of Directors. The Management Loan Committee may approve loans up to an
aggregate of $2 million to any one borrower and group of related borrowers. Two
loan officers with sufficient loan authority acting together may approve loans
up to $1 million. The maximum individual authority to approve an unsecured loan
is $50,000, however, for credit-scored small business loans; the maximum
individual authority is $100,000.
We have
established a risk rating system for our commercial business loans, commercial
and multi-family real estate loans, and acquisition, development and
construction loans to builders. The risk rating system assesses a variety of
factors to rank the risk of default and risk of loss associated with the loan.
These ratings are performed by commercial credit personnel who do not have
responsibility for loan originations. We determine our maximum
loan-to-one-borrower limits based upon the rating of the loan. The large
majority of loans fall into three categories. The maximum for the best-rated
borrowers is $20 million, $15 million
for the next group of borrowers and $12 million for the third group. Sublimits
apply based on reliance on any single property, and for commercial business
loans. On occasion, the Board of Directors may approve higher exposure limits
for loans to one borrower in an amount not to exceed the legal lending limit of
the Bank. The Board may also authorize the Director Loan Committee to approve
loans for specific borrowers up to a designated Board approved limit in excess
of the policy limit, for that borrower.
In
connection with our residential and commercial real estate loans, we generally
require property appraisals to be performed by independent appraisers who are
approved by the Board. Appraisals are then reviewed by the appropriate loan
underwriting areas. Under certain conditions, appraisals may not be required for
loans under $250,000 or in other limited circumstances. We also require title
insurance, hazard insurance and, if indicated, flood insurance on property
securing mortgage loans. Title insurance is not required for consumer loans
under $100,000, such as home equity lines of credit and homeowner loans and in
connection with certain residential mortgage refinances.
Loan Origination
Fees and Costs.
In addition to interest earned on loans, we also receive loan origination
fees. Such fees vary with the volume and type of loans and commitments made, and
competitive conditions in the mortgage markets, which in turn respond to the
demand and availability of money. We defer loan origination fees and costs, and
amortize such amounts as an adjustment to yield over the term of the loan by use
of the level yield method. Deferred loan origination costs (net of
deferred fees) were $1.7 million at September 30, 2009.
To the
extent that originated loans are sold with servicing retained, we capitalize a
mortgage servicing asset at the time of the sale. The capitalized
amount is amortized thereafter (over the period of estimated net servicing
income) as a reduction of servicing fee income. The unamortized amount is fully
charged to income when loans are prepaid. Originated mortgage
servicing rights with an amortized cost of $840,315 are included in other assets
at September 30, 2009. See also Notes 2 and 5 of the “Notes to
Consolidated Financial Statements”.
Loans to One
Borrower. At
September 30, 2009, our five largest aggregate amounts loaned to any one
borrower and certain related interests (including any unused lines of credit)
consisted of secured and unsecured financing of $22.9 million, $22.8 million,
$19.7 million, $19.6 million and $18.2 million. See “Regulation -
Regulation of Provident Bank - Loans to One Borrower” for a discussion of
applicable regulatory limitations.
Delinquent
Loans, Other Real Estate Owned and Classified Assets
Collection
Procedures for Residential and Commercial Mortgage Loans and Consumer
Loans. A computer-generated late notice is sent by the 16th
day after the payment due date on a loan requesting the payment due plus any
late charge that was assessed. Accounts are distributed to a collector or
account officer to contact borrowers, determine the reason for delinquency and
arrange for payment, and accounts are monitored electronically for receipt of
payments. If payments are not received within 30 days of the original due date,
a letter demanding payment of all arrearages is sent and contact efforts are
continued. If payment is not received within 60 days of the due date, loans are
generally accelerated and payment in full is demanded. Failure to pay within 90
days of the original due date generally results in legal action, notwithstanding
ongoing collection efforts. Unsecured consumer loans are generally charged-off
after 120 days. For commercial loans, procedures vary depending upon individual
circumstances.
Loans Past Due
and Non-Performing Assets. Loans are reviewed on a
regular basis, and are placed on non-accrual status when either principal or
interest is 90 days or more past due, unless well secured and in the process of
collection. In addition, loans are placed on non-accrual status when, in the
opinion of management, there is sufficient reason to question the borrower’s
ability to continue to meet principal or interest payment obligations. Interest
accrued and unpaid at the time a loan is placed on non-accrual status is
reversed from interest income related to current year income and charged to the
allowance for loan losses with respect to income that was recorded in the prior
fiscal year. Interest payments received on non-accrual loans are not recognized
as income unless warranted based on the borrower’s financial condition and
payment record. At September 30, 2009, we had non-accrual loans of $21.9 million
and $4.6 million of loans 90 days past due and still accruing interest, which
were well secured and in the process of collection. At September 30, 2008 we had
non-accrual loans of $13.6 and $3.3 million of loans 90 days past due and still
accruing interest.
Real
estate acquired as a result of foreclosure or by deed in lieu of foreclosure is
classified as real estate owned (“REO”) until such time as it is
sold.
When real
estate is acquired through foreclosure or by deed in lieu of foreclosure, it is
recorded at the lower of book value or fair value less cost to sell. If the fair
value of the property is less than the loan balance, the difference is charged
against the allowance for loan losses. At September 30, 2009 we had three REO
properties with a recorded balance of $1.7 million. In addition,
$674,000 in loan balances was considered troubled debt
restructures.
Loan Portfolio
Delinquencies. The following table sets forth certain information with
respect to our loan portfolio delinquencies at the dates indicated.
|
Loans Delinquent For
|
||||||||||||||||||||||||
|
30-89
Days
|
90
Days and Over & non-accrual
|
Total
|
||||||||||||||||||||||
|
Number
|
Amount
|
Number
|
Amount
|
Number
|
Amount
|
|||||||||||||||||||
|
(Dollars
in thousands)
|
||||||||||||||||||||||||
|
At September 30, 2009
|
||||||||||||||||||||||||
|
One-
to four- family
|
2 | $ | 390 | 31 | $ | 7,319 | 33 | $ | 7,709 | |||||||||||||||
|
Commercial
real estate
|
2 | 398 | 24 | 6,803 | 26 | 7,201 | ||||||||||||||||||
|
ADC
|
1 | 366 | 21 | 11,308 | 22 | 11,674 | ||||||||||||||||||
|
Commercial
business
|
18 | 999 | 8 | 457 | 26 | 1,456 | ||||||||||||||||||
|
Consumer
|
22 | 494 | 13 | 582 | 35 | 1,076 | ||||||||||||||||||
|
Total
|
45 | $ | 2,647 | 97 | $ | 26,469 | 142 | $ | 29,116 | |||||||||||||||
|
At September 30, 2008
|
||||||||||||||||||||||||
|
One-
to four- family
|
19 | $ | 4,106 | 19 | $ | 4,218 | 38 | $ | 8,324 | |||||||||||||||
|
Commercial
real estate
|
8 | 1,666 | 12 | 3,832 | 20 | 5,498 | ||||||||||||||||||
|
ADC
|
- | - | 9 | 5,596 | 9 | 5,596 | ||||||||||||||||||
|
Commercial
business
|
29 | 1,318 | 35 | 2,811 | 64 | 4,129 | ||||||||||||||||||
|
Consumer
|
43 | 435 | 41 | 421 | 84 | 856 | ||||||||||||||||||
|
Total
|
99 | $ | 7,525 | 116 | $ | 16,878 | 215 | $ | 24,403 | |||||||||||||||
|
At September 30, 2007
|
||||||||||||||||||||||||
|
One-
to four- family
|
28 | $ | 4,829 | 15 | $ | 1,899 | 43 | $ | 6,728 | |||||||||||||||
|
Commercial
real estate
|
31 | 3,387 | 8 | 2,586 | 39 | 5,973 | ||||||||||||||||||
|
ADC
|
- | - | 2 | 689 | 2 | 689 | ||||||||||||||||||
|
Commercial
business
|
9 | 357 | 19 | 1,683 | 28 | 2,040 | ||||||||||||||||||
|
Consumer
|
49 | 835 | 30 | 401 | 79 | 1,236 | ||||||||||||||||||
|
Total
|
117 | $ | 9,408 | 74 | $ | 7,258 | 191 | $ | 16,666 | |||||||||||||||
|
At September 30, 2006
|
||||||||||||||||||||||||
|
One-
to four- family
|
43 | $ | 4,502 | 10 | $ | 1,102 | 53 | $ | 5,604 | |||||||||||||||
|
Commercial
real estate
|
15 | 1,098 | 6 | 2,980 | 21 | 4,078 | ||||||||||||||||||
|
Commercial
business
|
- | - | 12 | 489 | 12 | 489 | ||||||||||||||||||
|
Consumer
|
54 | 521 | 42 | 453 | 96 | 974 | ||||||||||||||||||
|
Total
|
112 | $ | 6,121 | 70 | $ | 5,024 | 182 | $ | 11,145 | |||||||||||||||
|
At September 30, 2005
|
||||||||||||||||||||||||
|
One-
to four- family
|
49 | $ | 6,126 | 6 | $ | 1,070 | 55 | $ | 7,196 | |||||||||||||||
|
Commercial
real estate
|
25 | 1,372 | 3 | 92 | 28 | 1,464 | ||||||||||||||||||
|
Commercial
business
|
11 | 264 | 3 | 120 | 14 | 384 | ||||||||||||||||||
|
Consumer
|
87 | 679 | 22 | 359 | 109 | 1,038 | ||||||||||||||||||
|
Total
|
172 | $ | 8,441 | 34 | $ | 1,641 | 206 | $ | 10,082 | |||||||||||||||
Non-Performing
Assets. The
table below sets forth the amounts and categories of our non-performing assets
at the dates indicated.
|
September
30,
|
||||||||||||||||||||||||||||||||||||
|
2009
|
2008
|
2007
|
2006
|
2005(1)
|
||||||||||||||||||||||||||||||||
|
(Dollars
in thousands)
|
||||||||||||||||||||||||||||||||||||
|
90
days past due and still
accruing
|
Non-Accrual
|
90
days past due and still
accruing
|
Non-Accrual
|
90
days past due and still
accruing
|
Non-Accrual
|
90
days past due and still
accruing
|
Non-Accrual
|
Non-Accrual
|
||||||||||||||||||||||||||||
|
Non-performing
loans:
|
||||||||||||||||||||||||||||||||||||
|
One-
to four- family
|
$ | 2,894 | $ | 4,425 | $ | 2,487 | $ | 1,731 | $ | 1,899 | $ | - | $ | 629 | $ | 472 | $ | 65 | ||||||||||||||||||
|
Commercial
real estate
|
977 | 5,826 | 732 | 3,100 | 1,487 | 1,099 | 613 | 2,367 | - | |||||||||||||||||||||||||||
|
Commercial
|
478 | 10,830 | - | 2,811 | 46 | 1,637 | 30 | 459 | 120 | |||||||||||||||||||||||||||
|
Acquisition,
land and development
|
- | 457 | - | 5,596 | 45 | 644 | - | - | - | |||||||||||||||||||||||||||
|
Consumer
|
211 | 371 | 70 | 351 | 272 | 129 | 310 | 144 | 27 | |||||||||||||||||||||||||||
|
Total
non-performing loans
|
$ | 4,560 | $ | 21,909 | $ | 3,289 | $ | 13,589 | $ | 3,749 | $ | 3,509 | $ | 1,582 | $ | 3,442 | $ | 212 | ||||||||||||||||||
|
Real
estate owned:
|
1,712 | 84 | 139 | 87 | 92 | |||||||||||||||||||||||||||||||
|
Troubled
Debt Restructures
|
674 | - | - | - | - | |||||||||||||||||||||||||||||||
|
Total
non-performing assets
|
$ | 28,855 | $ | 16,962 | $ | 7,397 | $ | 5,111 | $ | 304 | ||||||||||||||||||||||||||
|
Ratios:
|
||||||||||||||||||||||||||||||||||||
|
Non-performing
loans to total loans
|
1.55 | % | 0.97 | % | 0.44 | % | 0.34 | % | 0.12 | % | ||||||||||||||||||||||||||
|
Non-performing
assets to total assets
|
0.95 | % | 0.57 | % | 0.26 | % | 0.18 | % | 0.07 | % | ||||||||||||||||||||||||||
|
(1)
|
The
Company had no 90 days past due and accruing loans at September 30,
2005.
|
For the
year ended September 30, 2009, gross interest income that would have been
recorded had the non-accrual loans at the end of the year remained on accrual
status throughout the year amounted to $1.4 million. Interest income actually
recognized on such loans totaled $724,000.
Classification of
Assets. Our
policies, consistent with regulatory guidelines, provide for the classification
of loans and other assets that are considered to be of lesser quality as
substandard, doubtful, or loss assets. An asset is considered substandard if it
is inadequately protected by the current net worth and paying capacity of the
obligor or of the collateral pledged, if any. Substandard assets include those
characterized by the distinct possibility that the bank will sustain some loss
if the deficiencies are not corrected. Assets classified as “doubtful” have all
of the weaknesses inherent in those classified as “substandard” with the added
characteristic that the weaknesses present make collection or liquidation in
full, on the basis of currently existing facts, conditions, and values, highly
questionable and improbable. Assets classified as “loss” are those considered
uncollectible and of such little value that their continuance as assets is not
warranted and are either charged off or the subject of a specific reserve.
Assets that do not expose us to risk sufficient to warrant classification in one
of the aforementioned categories, but which possess potential weaknesses that
deserve our close attention, designated as “special mention”. As of
September 30, 2009, we had $47.8 million of assets designated as “special
mention”.
Our
determination as to the classification of our assets and the amount of our loss
allowances are subject to review by our regulatory agencies, which can order the
establishment of additional loss allowances. Management regularly reviews our
asset portfolio to determine whether any assets require classification in
accordance with applicable regulations. On the basis of management’s review of
our assets at September 30, 2009, classified assets consisted of substandard
assets of $89.9 million and no loans were classified as
doubtful.
Allowance for
Loan Losses. We
provide for loan losses based on the allowance method. Accordingly, all loan
losses are charged to the related allowance and all recoveries are credited to
it. Additions to the allowance for loan losses are provided by charges to income
based on various factors which, in management’s judgment, deserve current
recognition in estimating probable incurred losses. Management regularly reviews
the loan portfolio and makes provisions for loan losses in order to maintain the
allowance for loan losses in accordance with accounting principles generally
accepted in the United States of America. The allowance for loan losses consists
of amounts specifically allocated to non-performing loans and other criticized
or classified loans (if any), as well as allowances determined for each major
loan category. After we establish a provision for loans that are known to be
non-performing, criticized or classified, we calculate a percentage to apply to
the remaining loan portfolio to estimate the probable incurred losses inherent
in that portion of the portfolio. When the loan portfolio increases, therefore,
the percentage calculation results in a higher dollar amount of estimated
probable incurred losses than would be the case without the increase, and when
the loan portfolio decreases, the percentage calculation results in a lower
dollar amount of estimated probable incurred losses than would be the case
without the decrease. These percentages are determined by management, based on
historical loss experience for the applicable loan category, and are adjusted to
reflect our evaluation of:
|
·
|
levels
of, and trends in, delinquencies and
non-accruals;
|
|
·
|
trends
in volume and terms of loans;
|
|
·
|
effects
of any changes in lending policies and
procedures;
|
|
·
|
experience,
ability, and depth of lending management and
staff;
|
|
·
|
national
and local economic trends and
conditions;
|
|
·
|
concentrations
of credit by such factors as location, industry, inter-relationships, and
borrower; and
|
|
·
|
for
commercial loans, trends in risk
ratings.
|
Of the
major parts of our loan portfolio, we consider, land acquisition, development
and construction loans, commercial real estate loans, and commercial business
loans to be the higher risk categories. We consider
one-to-four family mortgage loans to be a lower risk
category. Although, we offer unsecured consumer loans and overdraft
protection lines of credit, which are higher risk in nature, they constitute a
modest percentage of our loan portfolio.
Land
acquisition, development and construction lending is considered higher risk and
exposes us to greater credit risk than permanent mortgage financing. The
repayment of land acquisition, development and construction loans depends upon
the sale of the property to third parties or the availability of permanent
financing upon completion of all improvements. In the event we make an
acquisition loan on property that is not yet approved for the planned
development, there is the risk that approvals will not be granted or will be
delayed. These events may adversely affect the borrower and the collateral value
of the property. Development and construction loans also expose us to the risk
that improvements will not be completed on time in accordance with
specifications and projected costs. In addition, the ultimate sale or rental of
the property may not occur as anticipated. All of these factors are
considered as part of the underwriting, structuring and pricing of the
loan.
Commercial
real estate loans subject us to the risks that the property securing the loan
may not generate sufficient cash flow to service the debt or the borrower may
use the cash flow for other purposes. In addition, the foreclosure
process, if necessary may be slow and properties may deteriorate in the
process. The market values are also subject to a wide variety of
factors, including general economic conditions, industry specific factors,
environmental factors, interest rates and the availability and terms of
credit.
Commercial
business lending is also higher risk because repayment depends on the successful
operation of the business which is subject to a wide range of risks and
uncertainties. In addition, the ability to successfully liquidate
collateral, if any, is subject to a variety of risks because we must gain
control of assets used in the borrower’s business before foreclosing which we
cannot be assured of doing, and the value in a foreclosure sale or other means
of liquidation is subject to downward pressure.
When we
evaluate residential mortgage loans and equity loans we weigh both the credit
capacity of the borrower and the collateral value of the home. As
unemployment and underemployment increases, and liquidity reserves if any,
diminish, the credit capacity of the borrower decreases, which increases our
risk. Also, after a period of years of stable or increasing home
values in our market, home prices have declined from a high in 2005 and
2006. We are exposed to risk in both our first mortgage and equity
lending programs due to declines in values in recent years. We are
also exposed to risk because the time to foreclose is significant and has become
longer under current conditions.
The
carrying value of loans is periodically evaluated and the allowance is adjusted
accordingly. While management uses the best information available to make
evaluations, future adjustments to the allowance may be necessary if conditions
differ substantially from the information used in making the evaluations. In
addition, as an integral part of their examination process, our regulatory
agencies periodically review the allowance for loan losses. Such agencies may
require us to recognize additions to the allowance based on their judgments of
information available to them at the time of their examination.
Allowance for
Loan Losses by Year. The following table sets forth activity
in our allowance for loan losses for the years indicated.
|
At or For Years Ended September
30,
|
||||||||||||||||||||
|
2009
|
2008
|
2007
|
2006
|
2005
|
||||||||||||||||
|
(Dollars
in thousands)
|
||||||||||||||||||||
|
Balance
at beginning of year
|
$ | 23,101 | $ | 20,389 | $ | 20,373 | $ | 21,047 | $ | 16,648 | ||||||||||
|
Transfer
to reserve for contingent loan commitments
|
- | - | - | (395 | ) | (256 | ) | |||||||||||||
|
Charge-offs:
|
||||||||||||||||||||
|
One-
to four- family
|
(461 | ) | (97 | ) | - | - | (23 | ) | ||||||||||||
|
Commercial
real estate
|
(902 | ) | (627 | ) | - | - | - | |||||||||||||
|
ADC
|
(1,515 | ) | - | - | - | - | ||||||||||||||
|
Commercial
business
|
(7,271 | ) | (3,596 | ) | (2,164 | ) | (1,509 | ) | (750 | ) | ||||||||||
|
Consumer
|
(1,140 | ) | (609 | ) | (329 | ) | (327 | ) | (380 | ) | ||||||||||
|
Total
charge-offs
|
(11,289 | ) | (4,929 | ) | (2,493 | ) | (1,836 | ) | (1,153 | ) | ||||||||||
|
Recoveries:
|
||||||||||||||||||||
|
One-
to four- family
|
2 | - | - | - | - | |||||||||||||||
|
ADC
|
200 | - | - | - | - | |||||||||||||||
|
Commercial
business
|
249 | 291 | 581 | 236 | 69 | |||||||||||||||
|
Consumer
|
187 | 150 | 128 | 121 | 109 | |||||||||||||||
|
Total
recoveries
|
638 | 441 | 709 | 357 | 178 | |||||||||||||||
|
Net
charge-offs
|
(10,651 | ) | (4,488 | ) | (1,784 | ) | (1,479 | ) | (975 | ) | ||||||||||
|
Allowance
recorded in acquisitions
|
- | - | - | 4,880 | ||||||||||||||||
|
Provision
for loan losses
|
17,600 | 7,200 | 1,800 | 1,200 | 750 | |||||||||||||||
|
Balance
at end of year
|
$ | 30,050 | $ | 23,101 | $ | 20,389 | $ | 20,373 | $ | 21,047 | ||||||||||
|
Ratios:
|
||||||||||||||||||||
|
Net
charge-offs to average loans outstanding
|
0.62 | % | 0.28 | % | 0.12 | % | 0.11 | % | 0.08 | % | ||||||||||
|
Allowance
for loan losses to non-performing loans
|
114 | % | 137 | % | 281 | % | 406 | % | 1283 | % | ||||||||||
|
Allowance
for loan losses to total loans
|
1.76 | % | 1.33 | % | 1.24 | % | 1.38 | % | 1.55 | % | ||||||||||
Allocation of
Allowance for Loan Losses. The following tables
set forth the allowance for loan losses allocated by loan category, the total
loan balances by category (excluding loans held for sale), and the percent of
loans in each category to total loans at the dates indicated. The allowance for
loan losses allocated to each category is not necessarily indicative of future
losses in any particular category and does not restrict the use of the allowance
to absorb losses in other categories.
|
September 30,
|
||||||||||||||||||||||||||||||||||||
|
2009
|
2008
|
2007
|
||||||||||||||||||||||||||||||||||
|
Allowance for Loan Losses
|
Loan Balances by Category
|
Percent of Loans in Each Category to Total
Loans
|
Allowance for Loan Losses
|
Loan Balances by Category
|
Percent of Loans in Each Category to Total
Loans
|
Allowance for Loan Losses
|
Loan Balances by Category
|
Percent of Loans in Each Category to Total
Loans
|
||||||||||||||||||||||||||||
|
(Dollars
in thousands)
|
||||||||||||||||||||||||||||||||||||
|
One-
to four- family
|
$ | 3,106 | $ | 460,729 | 27.0 | % | $ | 1,494 | $ | 513,381 | 29.6 | % | $ | 668 | $ | 500,825 | 30.6 | % | ||||||||||||||||||
|
Commercial
real estate
|
7,695 | 554,550 | 32.6 | 5,793 | 554,811 | 32.0 | 8,157 | 535,003 | 32.7 | |||||||||||||||||||||||||||
|
Commercial
business
|
8,928 | 242,628 | 14.2 | 7,051 | 243,642 | 14.1 | 5,223 | 207,156 | 12.6 | |||||||||||||||||||||||||||
|
ADC
|
7,680 | 193,828 | 11.4 | 6,841 | 170,979 | 9.9 | 4,743 | 153,074 | 9.3 | |||||||||||||||||||||||||||
|
Consumer
|
2,641 | 251,522 | 14.8 | 1,922 | 248,740 | 14.4 | 1,598 | 242,000 | 14.8 | |||||||||||||||||||||||||||
|
Total
|
$ | 30,050 | $ | 1,703,257 | 100.0 | % | $ | 23,101 | $ | 1,731,553 | 100.0 | % | $ | 20,389 | $ | 1,638,058 | 100.0 | % | ||||||||||||||||||
|
September 30,
|
||||||||||||||||||||||||
|
2006
|
2005
|
|||||||||||||||||||||||
|
Allowance for Loan Losses
|
Loan Balances by Category
|
Percent of Loans in Each Category to Total
Loans
|
Allowance for Loan Losses
|
Loan Balances by Category
|
Percent of Loans in Each Category to Total
Loans
|
|||||||||||||||||||
|
(Dollars
in thousands)
|
||||||||||||||||||||||||
|
One-
to four- family
|
$ | 765 | $ | 462,996 | 31.4 | % | $ | 503 | $ | 456,794 | 33.5 | % | ||||||||||||
|
Commercial
real estate
|
9,382 | 529,607 | 35.9 | 10,662 | 497,936 | 36.6 | ||||||||||||||||||
|
Commercial
business
|
5,461 | 160,823 | 10.9 | 5,851 | 148,825 | 10.9 | ||||||||||||||||||
|
ADC
|
2,862 | 96,656 | 6.6 | 2,343 | 66,710 | 4.9 | ||||||||||||||||||
|
Consumer
|
1,903 | 223,476 | 15.2 | 1,688 | 191,808 | 14.1 | ||||||||||||||||||
|
Total
|
$ | 20,373 | $ | 1,473,558 | 100.0 | % | $ | 21,047 | $ | 1,362,073 | 100.0 | % | ||||||||||||
Securities
Investments
Our
securities investment policy is established by our Board of Directors. This
policy dictates that investment decisions be made based on the safety of the
investment, liquidity requirements, potential returns, cash flow targets, and
consistency with our interest rate risk management strategy. The Board’s
Asset/Liability Committee oversees our investment program and evaluates on an
ongoing basis our investment policy and objectives. Our chief financial officer,
or our chief financial officer acting with our chief executive officer, is
responsible for making securities portfolio decisions in accordance with
established policies. Our chief financial officer, chief executive officer and
certain other executive officers have the authority to purchase and sell
securities within specific guidelines established by the investment policy. In
addition, all transactions are reviewed by the Board’s Asset/Liability Committee
at least quarterly.
Our
current investment policy generally permits securities investments in debt
securities issued by the U.S. government and U.S. agencies, municipal bonds, and
corporate debt obligations, as well as investments in preferred and common stock
of government agencies and government sponsored enterprises such as Fannie Mae,
Freddie Mac and the Federal Home Loan Bank of New York (federal agency
securities) and, to a lesser extent, other equity securities. Securities in
these categories are classified as “investment securities” for financial
reporting purposes. The policy also permits investments in mortgage-backed
securities, including pass-through securities issued and guaranteed by Fannie
Mae, Freddie Mac and Ginnie Mae as well as collateralized mortgage obligations
(“CMOs”) issued or backed by securities issued by these government agencies.
Also permitted are investments in securities issued or backed by the Small
Business Administration, privately issued mortgage-backed securities and CMOs,
and asset-backed securities collateralized by auto loans, credit card
receivables, and home equity and home improvement loans. Our current investment
strategy uses a risk management approach of diversified investing in fixed-rate
securities with short- to intermediate-term maturities, as well as
adjustable-rate securities, which may have a longer term to maturity. The
emphasis of this approach is to increase overall investment securities yields
while managing interest rate and credit risk.
FASB ASC
Topic #320, Investments, Debt and Equity securities requires that, at the time
of purchase, we designate a security as held to maturity, available for sale, or
trading, depending on our ability to hold and our intent. Securities available
for sale are reported at fair value, while securities held to maturity are
reported at amortized cost. We do not have a trading portfolio.
Government and
Agency Securities.
At September 30, 2009, we held government and agency securities available
for sale with a fair value of $207.8 million, consisting primarily of agency
obligations with maturities less than five years. While these securities
generally provide lower yields than other investments such as mortgage-backed
securities, our current investment strategy is to maintain investments in such
instruments to the extent appropriate for liquidity purposes and as collateral
for borrowings.
Corporate and
Municipal Bonds.
At September 30, 2009, we held $25.8 million in corporate debt
securities. Corporate bonds have a higher risk of default due to adverse changes
in the creditworthiness of the issuer. In recognition of this risk, our policy
limits investments in corporate bonds to securities with maturities of ten years
or less and rated “A” or better by at least one nationally recognized rating
agency at time of purchase, and to a total investment of no more than $5.0
million per issuer and a total corporate bond portfolio limit of $40.0 million.
The policy also limits investments in municipal bonds to securities with
maturities of 20 years or less and rated as investment grade by at least one
nationally recognized rating agency at the time of purchase, and favors issues
that are insured, however we also purchase securities that are issued by local
government entities within our service area. Such local entity obligations
generally are not rated, and are subject to internal credit reviews. In
addition, the policy generally imposes an investment limitation of $5.0 million
per municipal issuer and a total municipal bond portfolio limit of 10% of assets. At September
30, 2009, we held $204.8 million in bonds issued
by states and political subdivisions, $31.4 million of which were classified as
held to maturity at amortized cost and are unrated and $167.6 million of which
were classified as available for sale at fair value. At September 30,
2009 we held $5.4 million in obligations that were rated less than “A”, but
still investment grade.
Equity
Securities. At
September 30, 2009, our equity securities available for sale had a fair value of
$885,000. We also held $23.2 million (at cost) of Federal Home Loan
Bank of New York (“FHLBNY”) common stock, a portion of which must be held as a
condition of membership in the Federal Home Loan Bank System, with the remainder
held as a condition to our borrowing under the Federal Home Loan Bank advance
program. Dividends on FHLBNY stock recorded in the year ended September 30, 2009
amounted to $1.2 million. We held no preferred shares of Freddie Mac
or Fannie Mae for the year ended September 30, 2009. We also held no
“auction rate securities” or “pooled trust preferred securities” during the year
ended September 30, 2009.
Mortgage-Backed
Securities. We
purchase mortgage-backed securities in order to: (i) generate positive interest
rate spreads with minimal administrative expense; (ii) lower credit risk as a
result of the guarantees provided by Freddie Mac and Fannie Mae; (iii) increase
liquidity, and (iv) maintain our status as a thrift for charter and income tax
purposes. We invest primarily in mortgage-backed securities issued or sponsored
by Freddie Mac, Fannie Mae and Ginnie Mae or private issuers for CMOs. To a
lesser extent, we also invest in securities backed by agencies of the U.S.
Government, such as Ginnie Mae. At September 30, 2009, our mortgage-backed
securities portfolio totaled $437 million, consisting of $430.5 million
available for sale at fair value and $6.5 million held to maturity at amortized
cost. The total mortgage-backed securities portfolio includes CMOs of $66.9
million, consisting of $66 million available for sale at fair value and $860
thousand held to maturity at amortized cost. Within this total, $11.2
million at amortized cost and $10.4 fair value were issued by private issuers.
The remaining mortgage-backed securities of $370.1 million were pass-through
securities, consisting of $364.5 million available for sale at fair value and
$5.6 million held to maturity at amortized cost.
Mortgage-backed
securities are created by pooling mortgages and issuing a security
collateralized by the pool of mortgages with an interest rate that is less than
the interest rate on the underlying mortgages. Mortgage-backed securities
typically represent a participation interest in a pool of single-family or
multi-family mortgages, although most of our mortgage-backed securities are
collateralized by single-family mortgages. The issuers of such securities
(generally U.S. Government agencies and government sponsored enterprises,
including Fannie Mae, Freddie Mac and Ginnie Mae) pool and resell the
participation interests in the form of securities to investors, such as us, and
guarantee the payment of principal and interest to these investors. Investments
in mortgage-backed securities involve a risk in addition to the guarantee of
repayment of principal outstanding that actual prepayments will be greater or
less than the prepayment rate estimated at the time of purchase, which may
require adjustments to the amortization of any premium or accretion of any
discount relating to such instruments, thereby affecting the net yield and
duration of such securities. We review prepayment estimates for our
mortgage-backed securities at purchase to ensure that prepayment assumptions are
reasonable considering the underlying collateral for the securities at issue and
current interest rates, and to determine the yield and estimated maturity of the
mortgage-backed securities portfolio. Periodic reviews of current prepayment
speeds are performed in order to ascertain whether prepayment estimates require
modification that would cause amortization or accretion
adjustments. As a result of our reviews, we anticipated an
acceleration of prepayments. Management sold $453.2 million in
mortgage backed securities and realized $16.7 million in gains on the
sales. Such proceeds were reinvested in securities with yields which
were lower than the recorded yields of the securities sold and a more
diversified risk profile.
A portion
of our mortgage-backed securities portfolio is invested in CMOs or
collateralized mortgage obligations, including Real Estate Mortgage Investment
Conduits (“REMICs”), backed by Fannie Mae and Freddie Mac and certain private
issuers. CMOs and REMICs are types of debt securities issued by a
special-purpose entity that aggregates pools of mortgages and mortgage-backed
securities and creates different classes of securities with varying maturities
and amortization schedules, as well as a residual interest, with each class
possessing different risk characteristics. The cash flows from the underlying
collateral are generally divided into “tranches” or classes that have descending
priorities with respect to the distribution of principal and interest cash
flows, while cash flows on pass-through mortgage-backed securities are
distributed pro rata to all security holders. Our practice is to limit
fixed-rate CMO investments primarily to the early-to-intermediate tranches,
which have the greatest cash flow stability. Floating rate CMOs are purchased
with emphasis on the relative trade-offs between lifetime rate caps, prepayment
risk, and interest rates.
Available for
Sale Portfolio. The following table
sets forth the composition of our available for sale portfolio at the dates
indicated.
|
September 30,
|
||||||||||||||||||||||||
|
2009
|
2008
|
2007
|
||||||||||||||||||||||
|
Amortized Cost
|
Fair Value
|
Amortized Cost
|
Fair Value
|
Amortized Cost
|
Fair Value
|
|||||||||||||||||||
|
(Dollars
in thousands)
|
||||||||||||||||||||||||
|
Investment
Securities:
|
||||||||||||||||||||||||
|
U.S.
Government securities
|
$ | 20,893 | $ | 21,076 | $ | - | $ | - | $ | - | $ | - | ||||||||||||
|
Federal
agency obligations
|
186,301 | 186,700 | 30,022 | 30,041 | 84,005 | 83,857 | ||||||||||||||||||
|
Corporate
Bonds
|
25,245 | 25,823 | ||||||||||||||||||||||
|
State
and municipal securities
|
158,007 | 167,584 | 159,334 | 149,601 | 140,026 | 139,338 | ||||||||||||||||||
|
Equity
securities
|
1,145 | 885 | 1,146 | 1,030 | 105 | 111 | ||||||||||||||||||
|
Total
investment securities available for sale
|
391,591 | 402,068 | 190,502 | 180,672 | 224,136 | 223,306 | ||||||||||||||||||
|
Mortgage-Backed
Securities:
|
||||||||||||||||||||||||
|
Pass-through
securities:
|
||||||||||||||||||||||||
|
Fannie
Mae
|
238,723 | 243,063 | 385,138 | 384,672 | 383,308 | 378,384 | ||||||||||||||||||
|
Freddie
Mac
|
92,885 | 94,506 | 189,113 | 189,989 | 152,972 | 152,253 | ||||||||||||||||||
|
Ginnie
Mae
|
26,586 | 26,929 | 2,300 | 2,300 | 2,877 | 2,838 | ||||||||||||||||||
|
CMOs
and REMICs
|
66,784 | 66,017 | 34,521 | 34,055 | 38,249 | 38,216 | ||||||||||||||||||
|
Total
mortgage-backed securities available for sale
|
424,978 | 430,515 | 611,072 | 611,016 | 577,406 | 571,691 | ||||||||||||||||||
|
Total
securities available for sale
|
$ | 816,569 | $ | 832,583 | $ | 801,574 | $ | 791,688 | $ | 801,542 | $ | 794,997 | ||||||||||||
At
September 30, 2009, our available for sale federal agency securities portfolio,
at fair value, totaled $207.8 million, or 6.9% of total assets. Of the federal
agency portfolio, based on amortized cost, none had maturities of one year or
less, and $167.2 million had maturities of between five and ten years and a
weighted average yield of 2.2%. The agency securities
portfolio currently includes primarily callable debentures.
State and
municipal securities portfolio, available for sale, based on amortized cost, had
$3.7 million in securities with a final maturity of one year or less and a
weighted average yield of 3.3%; $17.2 million maturing in one to five years with
a weighted average yield of 3.6%; $60.5 million maturing in five to ten years
with a weighted average yield of 3.9% and $76.7 million maturing in greater than
ten years with a weighted average yield of 4.1%. Equity securities available for
sale at September 30, 2009 had a fair value of $885,000.
At
September 30, 2009, $364.5 million of our available for sale mortgage-backed
securities, at fair value, consisted of pass-through securities, which totaled
12.1% of total assets and $66 million of CMO securities, at fair value. The
total amortized cost of these pass- through securities was $358.2 million and
consisted of $238.7 million, $92.9 million and $26.6 million of Fannie Mae,
Freddie Mac and Ginnie Mae MBS, respectively, with respective weighted averages
yields of 7.9%, 3.2% and 0.9%. At the same date, the fair value of
our available for sale CMO portfolio totaled $66 million, or 2.2% of total
assets, and consisted of CMOs issued by government sponsored agencies such as
Fannie Mae, Freddie Mac and $10.4 million sold by private party issuers. The
amortized costs of these CMOs result in a weighted average yield of 2.8%. We own
both fixed-rate and floating-rate CMOs. The underlying mortgage collateral for
our portfolio of CMOs available for sale at September 30, 2009 had contractual
maturities of over ten years. However, as with mortgage-backed pass-through
securities, the actual maturity of a CMO may be less than its stated contractual
maturity due to prepayments of the underlying mortgages and the terms of the CMO
tranche owned.
Held to Maturity
Portfolio. The
following table sets forth the composition of our held to maturity portfolio at
the dates indicated.
|
September 30,
|
||||||||||||||||||||||||
|
2009
|
2008
|
2007
|
||||||||||||||||||||||
|
Amortized
Cost
|
Fair Value
|
Amortized Cost
|
Fair Value
|
Amortized Cost
|
Fair Value
|
|||||||||||||||||||
|
(Dollars
in thousands)
|
||||||||||||||||||||||||
|
Investment
Securities:
|
||||||||||||||||||||||||
|
State
and municipal securities
|
$ | 37,162 | $ | 38,055 | $ | 32,604 | $ | 32,391 | $ | 23,078 | $ | 23,187 | ||||||||||||
|
Other
|
1,000 | 1,034 | 58 | 60 | 57 | 60 | ||||||||||||||||||
|
Total
investment securities held to maturity
|
38,162 | 39,089 | 32,662 | 32,451 | 23,135 | 23,247 | ||||||||||||||||||
|
Mortgage-Backed
Securities:
|
||||||||||||||||||||||||
|
Pass-through
securities:
|
||||||||||||||||||||||||
|
Fannie
Mae
|
2,713 | 2,823 | 4,929 | 4,987 | 6,540 | 6,527 | ||||||||||||||||||
|
Freddie
Mac
|
2,834 | 2,916 | 4,297 | 4,335 | 6,398 | 6,402 | ||||||||||||||||||
|
Ginnie
Mae
|
45 | 44 | 87 | 89 | 148 | 152 | ||||||||||||||||||
|
CMOs
and REMICs
|
860 | 866 | 1,038 | 1,037 | 1,225 | 1,256 | ||||||||||||||||||
|
Total
mortgage-backed securities held to maturity
|
6,452 | 6,649 | 10,351 | 10,448 | 14,311 | 14,337 | ||||||||||||||||||
|
Total
securities held to maturity
|
$ | 44,614 | $ | 45,738 | $ | 43,013 | $ | 42,899 | $ | 37,446 | $ | 37,584 | ||||||||||||
At
September 30, 2009, our held to maturity mortgage-backed securities portfolio
totaled $6.5 million at amortized cost, consisting of: none with contractual
maturities of one year or less and $1.3 million with a weighted average yield of
5.2% and contractual maturities within five years and $0.6 million with a
weighted average yield of 6.1% and contractual maturities of five to ten years
and $4.5 million with a weighted average yield of 3.5% with contractual
maturities of greater than ten years; CMOs of $0.9 million are included in this
portfolio. While the contractual maturity of the CMOs underlying collateral is
greater than ten years, the actual period to maturity of the CMOs may be shorter
due to prepayments on the underlying mortgages and the terms of the CMO tranche
owned.
State and
municipal securities totaled $37.2 million at amortized cost (primarily unrated
obligations) and consisted of $21.1 million, with a final maturity of one year
or less and a weighted average yield of 3.0%; $8.7 million, maturing in one to
five years, with a weighted average yield of 4.0%; $1.7 million maturing in five
to ten years, with a weighted average yield of 4.5% and $5.6 million, maturing
in greater than ten years, with a weighted average yield of
4.3%.
Portfolio
Maturities and Yields. The following table summarizes the composition and
maturities of the investment debt securities portfolio and the mortgage backed
securities portfolio at September 30, 2009. Maturities are based on the final
contractual payment dates, and do not reflect the impact of prepayments or early
redemptions that may occur. State and municipal securities yields have not been
adjusted to a tax-equivalent basis.
|
One
Year or Less
|
More
than One Year through Five Years
|
More
than Five Years through Ten Years
|
More
than Ten Years
|
Total
Securities
|
||||||||||||||||||||||||||||||||||||||||
|
Amortized
Cost
|
Weighted
Average Yield
|
Amortized
Cost
|
Weighted
Average Yield
|
Amortized
Cost
|
Weighted
Average Yield
|
Amortized
Cost
|
Weighted
Average Yield
|
Amortized
Cost
|
Fair
Value
|
Weighted
Average Yield
|
||||||||||||||||||||||||||||||||||
|
(Dollars
in thousands)
|
||||||||||||||||||||||||||||||||||||||||||||
|
Available
for Sale:
|
||||||||||||||||||||||||||||||||||||||||||||
|
Mortgage-Backed
Securities
|
||||||||||||||||||||||||||||||||||||||||||||
|
Fannie
Mae
|
$ | 1,652 | 3.72 | % | $ | 10,487 | 3.36 | % | $ | 75,997 | 3.57 | % | $ | 150,587 | 4.42 | % | $ | 238,723 | $ | 243,063 | 4.10 | % | ||||||||||||||||||||||
|
Freddie
Mac
|
899 | 3.83 | 4,864 | 3.97 | 21,402 | 3.61 | 65,720 | 4.36 | 92,885 | 94,506 | 4.16 | |||||||||||||||||||||||||||||||||
|
Ginnie
Mae
|
1 | 5.93 | - | - | 18 | 4.35 | 26,567 | 4.40 | 26,586 | 26,929 | 4.40 | |||||||||||||||||||||||||||||||||
|
CMOs
and REMICs
|
- | - | - | - | 11,163 | 3.36 | 55,621 | 2.63 | 66,784 | 66,017 | 2.75 | |||||||||||||||||||||||||||||||||
|
Total
|
2,552 | 3.76 | 15,351 | 3.55 | 108,580 | 3.56 | 298,495 | 4.07 | 424,978 | 430,515 | 3.87 | |||||||||||||||||||||||||||||||||
|
Investment
Securities
|
||||||||||||||||||||||||||||||||||||||||||||
|
U.S.
Government and agency securities
|
- | - | - | - | 167,154 | 2.20 | 40,040 | 1.69 | 207,194 | 207,776 | 2.10 | |||||||||||||||||||||||||||||||||
|
Corporate
|
- | - | 25,245 | 3.76 | - | - | - | - | 25,245 | 25,823 | 3.76 | |||||||||||||||||||||||||||||||||
|
Equity securities
|
1,145 | - | - | - | - | - | - | - | 1,145 | 885 | - | |||||||||||||||||||||||||||||||||
|
State
and municipal
|
3,678 | 3.30 | 17,174 | 3.58 | 60,499 | 3.95 | 76,656 | 4.11 | 158,007 | 167,584 | 3.97 | |||||||||||||||||||||||||||||||||
|
Total
|
4,823 | 0.43 | 42,419 | 3.69 | 227,653 | 2.66 | 116,696 | 3.28 | 391,591 | 402,068 | 2.79 | |||||||||||||||||||||||||||||||||
|
Total
debt securities available for sale
|
$ | 7,375 | 0.71 | % | $ | 57,770 | 3.65 | % | $ | 336,233 | 2.95 | % | $ | 415,191 | 3.85 | % | $ | 816,569 | $ | 832,583 | 3.34 | % | ||||||||||||||||||||||
|
Held
to Maturity:
|
||||||||||||||||||||||||||||||||||||||||||||
|
Mortgage-Backed
Securities
|
||||||||||||||||||||||||||||||||||||||||||||
|
Fannie
Mae
|
$ | - | - | % | $ | 1,003 | 5.42 | % | $ | - | - | % | $ | 1,710 | 4.38 | % | $ | 2,713 | $ | 2,823 | 4.76 | % | ||||||||||||||||||||||
|
Freddie
Mac
|
- | - | 247 | 4.00 | 635 | 6.10 | 1,952 | 3.73 | 2,834 | 2,916 | 4.29 | |||||||||||||||||||||||||||||||||
|
Ginnie
Mae
|
- | - | 44 | 7.86 | - | - | - | - | 44 | 44 | 7.86 | |||||||||||||||||||||||||||||||||
|
CMOs
and REMICs
|
- | - | - | - | - | - | 861 | 1.43 | 861 | 867 | 1.43 | |||||||||||||||||||||||||||||||||
|
Total
|
- | - | 1,294 | 5.23 | 635 | 6.10 | 4,523 | 3.54 | 6,452 | 6,650 | 4.13 | |||||||||||||||||||||||||||||||||
|
Investment
Securities
|
||||||||||||||||||||||||||||||||||||||||||||
|
State
and municipal securities
|
21,089 | 3.04 | 8,748 | 4.01 | 1,743 | 4.52 | 5,582 | 4.34 | 37,162 | 38,055 | 4.34 | |||||||||||||||||||||||||||||||||
|
Other
|
- | - | 1,000 | 3.16 | - | - | - | - | 1,000 | 1,034 | 3.16 | |||||||||||||||||||||||||||||||||
|
Total
|
21,089 | 3.04 | 9,748 | 3.92 | 1,743 | 4.52 | 5,582 | 4.34 | 38,162 | 39,089 | 4.31 | |||||||||||||||||||||||||||||||||
|
Total
debt securities held to maturity
|
$ | 21,089 | 3.04 | % | $ | 11,042 | 4.07 | % | $ | 2,378 | 4.95 | % | $ | 10,105 | 3.98 | % | $ | 44,614 | $ | 45,739 | 4.18 | % | ||||||||||||||||||||||
Sources
of Funds
General. Deposits, borrowings,
repayments and prepayments of loans and securities, proceeds from sales of loans
and securities, proceeds from maturing securities and cash flows from operations
are the primary sources of our funds for use in lending, investing and for other
general purposes.
Deposits. We offer a variety of
deposit accounts with a range of interest rates and terms. Our deposit accounts
consist of savings accounts, NOW accounts, checking accounts, money market
accounts, club accounts, certificates of deposit and IRAs and other qualified
plan accounts. We provide a variety of commercial checking accounts and other
products for businesses. In addition, we provide low-cost checking account
services for low-income customers.
At
September 30, 2009, our deposits totaled $2.1 billion. Interest-bearing deposits
totaled $1.6 billion, and non-interest-bearing demand deposits totaled $492
million. NOW, savings and money market deposits totaled $1.1 billion at
September 30, 2009. Also at that date, we had a total of $495.0 million in
certificates of deposit, of which $439.6 million had maturities of one year or
less. Although we have a significant portion of our deposits in shorter-term
certificates of deposit, our management monitors activity on these accounts and,
based on historical experience and our current pricing strategy, we believe we
will retain a large portion of such accounts upon maturity, although we may have
to match competitive rates to retain many of these accounts.
Our
deposits are obtained predominantly from the areas in which our branch offices
are located. We rely on our favorable locations, customer service and
competitive pricing to attract and retain these deposits. While we accept
certificates of deposit in excess of $100,000 for which we may provide
preferential rates, we do not actively solicit such deposits as they are more
difficult to retain than core deposits. Our limited purpose commercial bank
subsidiary, Provident Municipal Bank, accepts municipal deposits. Municipal time
accounts (certificates of deposit) are generally obtained through a bidding
process, and tend to carry higher average interest rates than retail
certificates of deposit of similar term. The Company had $20.6
million (including certificates of deposit account registers service (CDAR’s)
reciprocal CDs of $10.6 million) and $16.6 million of brokered deposits as of
September 30, 2009 and 2008, respectively.
Distribution of
Deposit Accounts by Type. The following table sets forth the
distribution of total deposit accounts, by account type, at the dates
indicated.
|
For the year ended September
30,
|
||||||||||||||||||||||||
|
2009
|
2008
|
2007
|
||||||||||||||||||||||
|
Amount
|
Percent
|
Amount
|
Percent
|
Amount
|
Percent
|
|||||||||||||||||||
|
(Dollars
in thousands)
|
||||||||||||||||||||||||
|
Demand
deposits:
|
||||||||||||||||||||||||
|
Retail
|
$ | 169,122 | 8.1 | % | $ | 162,161 | 8.1 | % | $ | 162,518 | 9.5 | % | ||||||||||||
|
Commercial
& municipal
|
323,112 | 15.5 | 325,729 | 16.4 | 201,213 | 11.7 | ||||||||||||||||||
|
Total
demand deposits
|
492,234 | 23.6 | 487,890 | 24.5 | 363,731 | 21.2 | ||||||||||||||||||
|
Business
& municipal NOW deposits
|
225,046 | 10.8 | 217,462 | 10.9 | 51,679 | 3.0 | ||||||||||||||||||
|
Personal
NOW deposits
|
127,595 | 6.1 | 115,442 | 5.8 | 110,858 | 6.5 | ||||||||||||||||||
|
Savings
deposits
|
357,814 | 17.2 | 335,986 | 16.9 | 346,430 | 20.2 | ||||||||||||||||||
|
Money
market deposits
|
384,632 | 18.5 | 306,504 | 15.4 | 277,793 | 16.2 | ||||||||||||||||||
|
Subtotal
|
1,587,321 | 76.2 | 1,463,284 | 73.5 | 1,150,491 | 67.1 | ||||||||||||||||||
|
Certificates
of deposit
|
494,961 | 23.8 | 525,913 | 26.5 | 563,193 | 32.9 | ||||||||||||||||||
|
Total
deposits
|
$ | 2,082,282 | 100.0 | % | $ | 1,989,197 | 100.0 | % | $ | 1,713,684 | 100.0 | % | ||||||||||||
As of
September 30, 2009 and September 30, 2008 the Company had $470.2 million and
$460.8 million, respectively, in municipal deposits. Of these
amounts, $201,000 and $242,300 were deposits related to school district tax
deposits due on September 30, 2009 and 2008, respectively, which we generally
retain only for a short period. The following table sets forth the
distribution of average deposit accounts by account category with the average
rates paid at the dates indicated.
|
September
30,
|
||||||||||||||||||||||||||||||||||||
|
2009
|
2008
|
2007
|
||||||||||||||||||||||||||||||||||
|
Average
Balance
|
Interest
|
Average
Rate Paid
|
Average
Balance
|
Interest
|
Average
Rate Paid
|
Average Balance
|
Interest
|
Average
Rate Paid
|
||||||||||||||||||||||||||||
|
(Dollars
in thousands)
|
||||||||||||||||||||||||||||||||||||
|
Non
interest bearing deposits
|
$ | 380,571 | - | - | $ | 351,995 | - | - | $ | 347,956 | - | - | ||||||||||||||||||||||||
|
NOW
deposits
|
232,164 | $ | 670 | 0.29 | % | 189,524 | $ | 1,015 | 0.54 | % | 153,869 | $ | 622 | 0.40 | % | |||||||||||||||||||||
|
Savings
deposits(1)
|
366,355 | 758 | 0.21 | % | 356,854 | 1,243 | 0.35 | % | 377,079 | 1,930 | 0.51 | % | ||||||||||||||||||||||||
|
Money
market deposits
|
374,507 | 2,707 | 0.72 | % | 285,119 | 5,299 | 1.86 | % | 252,925 | 6,671 | 2.64 | % | ||||||||||||||||||||||||
|
Certificates of
deposit
|
577,723 | 14,240 | 2.46 | % | 556,973 | 20,787 | 3.73 | % | 600,422 | 27,216 | 4.53 | % | ||||||||||||||||||||||||
|
Total
interest bearing deposits
|
1,550,749 | $ | 18,375 | 1.18 | % | 1,388,470 | $ | 28,344 | 2.04 | % | 1,384,295 | $ | 36,439 | 2.63 | % | |||||||||||||||||||||
|
Total
deposits
|
$ | 1,931,320 | $ | 1,740,465 | $ | 1,732,251 | ||||||||||||||||||||||||||||||
|
(1)
Includes club accounts and mortgage escrow
balances.
|
Certificates of
Deposit by Interest Rate Range. The following table sets forth
information concerning certificates of deposit by interest rate ranges at the
dates indicated.
|
At September 30, 2009
|
||||||||||||||||||||||||||||||||
|
Period to Maturity
|
||||||||||||||||||||||||||||||||
|
Less
than One
|
One
to Two
|
Two
to Three
|
More
than Three
|
Percent
of
|
Total at September 30,
|
|||||||||||||||||||||||||||
|
Year
|
Years
|
Years
|
Years
|
Total
|
Total
|
2008
|
2007
|
|||||||||||||||||||||||||
|
(Dollars
in thousands)
|
||||||||||||||||||||||||||||||||
|
Interest
Rate Range:
|
||||||||||||||||||||||||||||||||
|
2.00%
and below
|
$ | 315,349 | $ | 6,479 | $ | 346 | $ | 500 | $ | 322,674 | 65.2 | % | $ | 5,869 | $ | - | ||||||||||||||||
|
2.01%
to 3.00%
|
58,855 | 4,177 | 4,764 | 4,687 | 72,483 | 14.6 | % | 422,672 | 3,929 | |||||||||||||||||||||||
|
3.01%
to 4.00%
|
60,797 | 5,822 | 2,282 | 8,819 | 77,720 | 15.7 | % | 28,556 | 27,124 | |||||||||||||||||||||||
|
4.01%
to 5.00%
|
4,641 | 2,450 | 3,383 | 10,965 | 21,439 | 4.3 | % | 66,726 | 426,792 | |||||||||||||||||||||||
|
5.01%
to 6.00%
|
- | 154 | 177 | 314 | 645 | 0.1 | % | 2,080 | 105,348 | |||||||||||||||||||||||
|
6.01%
and above
|
- | - | - | - | - | 0.0 | % | 10 | - | |||||||||||||||||||||||
|
Total
|
$ | 439,642 | $ | 19,082 | $ | 10,952 | $ | 25,285 | $ | 494,961 | 100 | % | $ | 525,913 | $ | 563,193 | ||||||||||||||||
Certificates of Deposit by Time to
Maturity. The following table sets forth certificates of deposit by time
remaining until maturity as of September 30, 2009.
|
Maturity
|
||||||||||||||||||||
|
3
months or
|
Over
3 to 6
|
Over
6 to 12
|
Over
12
|
|||||||||||||||||
|
Less
|
Months
|
Months
|
Months
|
Total
|
||||||||||||||||
|
(Dollars
in thousands)
|
||||||||||||||||||||
|
Certificates
of deposit less than $100,000
|
$ | 121,273 | $ | 104,361 | $ | 67,419 | $ | 41,190 | $ | 334,243 | ||||||||||
|
Certificates
of deposit of $100,000 or more (¹)
|
91,590 | 33,433 | 21,567 | 14,128 | 160,718 | |||||||||||||||
| $ | 212,863 | $ | 137,794 | $ | 88,986 | $ | 55,318 | $ | 494,961 | |||||||||||
____________________
|
(¹)
|
The
weighted interest rates for these accounts, by maturity period, are 1.61%
for 3 months or less; 2.03% for 3 to 6 months; 0.12% for 6 to 12 months;
and 3.35% for over 12 months. The overall weighted average interest rate
for accounts of $100,000 or more was
1.59%
|
Short-term
Borrowings. Our short-term borrowings (less than one year) consist of advances,
repurchase agreements and overnight borrowings. At September 30, 2009, we had
access to additional Federal Home Loan Bank advances of up to an additional $200
million on a collateralized basis. The following table sets forth information
concerning balances and interest rates on our short-term borrowings at the dates
and for the years indicated.
|
At
or For the Years Ended September 30,
|
||||||||||||
|
2009
|
2008
|
2007
|
||||||||||
|
(Dollars
in thousands)
|
||||||||||||
|
Balance
at end of year
|
$ | 62,677 | $ | 153,893 | $ | 376,753 | ||||||
|
Average
balance during year
|
91,985 | 257,942 | 418,363 | |||||||||
|
Maximum
outstanding at any month end
|
293,608 | 372,021 | 556,457 | |||||||||
|
Weighted
average interest rate at end of year
|
4.09 | % | 2.16 | % | 5.13 | % | ||||||
|
Average
interest rate during year
|
3.38 | % | 3.50 | % | 5.35 | % | ||||||
Competition
We face
significant competition in both originating loans and attracting deposits. The
New York metropolitan area has a high concentration of financial institutions,
many of which are significantly larger institutions with greater financial
resources than us, and many of which are our competitors to varying degrees. Our
competition for loans comes principally from commercial banks, savings banks,
mortgage banking companies, credit unions, insurance companies and other
financial service companies. Our most direct competition for deposits has
historically come from commercial banks, savings banks and credit unions. We
face additional competition for deposits from non-depository competitors such as
the mutual fund industry, securities and brokerage firms and insurance
companies. We have emphasized personalized banking and the advantage of local
decision-making in our banking business and this strategy appears to have been
well received in our market area. We do not rely on any individual, group, or
entity for a material portion of our deposits. Given the turmoil that
has existed in the financial markets and related credit dislocations, many banks
have been aggressively seeking deposits by utilizing interest rates which lack
correlation to the current federal funds market. Although we have not
done so in the past, net interest income could be adversely affected should
competitive pressures cause us to increase our interest rates paid on deposits
in order to maintain our market share.
Employees
As of
September 30, 2009, we had 494 full-time employees and 84 part-time employees.
The employees are not represented by a collective bargaining unit and we
consider our relationship with our employees to be good.
Regulation
General
As a
savings and loan holding company, Provident Bancorp and its federal savings bank
subsidiary, Provident Bank, are supervised and regulated by the Office of Thrift
Supervision (“OTS”). As a state-chartered, insured bank, Provident
Municipal Bank is regulated by the New York State Department of Banking and the
Federal Deposit Insurance Corporation (“FDIC”). Because it is an
FDIC-insured institution, Provident Bank also is subject to regulation by the
FDIC. Provident Bank’s relationship with its depositors and borrowers
also is regulated to a great extent by both federal and state laws, especially
in matters concerning the ownership of deposit accounts and the form and content
of Provident Bank’s loan documents. As a regulated financial services
firm, our relationships and good standing with regulators are of fundamental
importance to the continuation and growth of our businesses. The OTS, SEC, and
other regulators have broad enforcement powers, and powers to approve, deny, or
refuse to act upon our applications or notices to conduct new activities,
acquire or divest businesses or assets, or reconfigure existing
operations.
Provident
Bancorp and its subsidiaries are subject to numerous governmental regulations,
some of which are summarized below. These summaries are not complete
and you should refer to these laws and regulations for more
information. There are numerous rules governing the regulation of
financial services institutions and their holding companies. Accordingly, the
following discussion is general in nature and does not purport to be complete or
to describe all of the laws and regulations that apply to us. Failure to comply
with applicable laws and regulations could result in a range of sanctions and
enforcement actions, including the imposition of civil money penalties, formal
agreements and cease and desist orders. Applicable laws and
regulations may change in the future and any such change could have a material
adverse impact on Provident Bancorp, Provident Bank or Provident Municipal
Bank.
In
addition, Provident Bancorp and its subsidiaries are subject to examination by
regulators, which results in examination reports and ratings (which are not
publicly available) that can impact the conduct and growth of our businesses.
These examinations consider not only compliance with applicable laws and
regulations, but also capital levels, asset quality and risk, management ability
and performance, earnings, liquidity, and various other factors. An examination
downgrade by any of our federal bank regulators potentially can result in the
imposition of significant limitations on our activities and growth. These
regulatory agencies generally have broad discretion to impose restrictions and
limitations on the operations of a regulated entity where the agencies
determine, among other things, that such operations are unsafe or unsound, fail
to comply with applicable law or are otherwise inconsistent with laws and
regulations or with the supervisory policies of these agencies. This supervisory
framework could materially impact the conduct, growth and profitability of our
operations.
Holding
Company Regulation
Provident
Bancorp is a unitary savings and loan holding company because it owns only one
savings association. The OTS has supervisory and enforcement
authority over Provident Bancorp and its non-bank subsidiaries. Among other
things, this authority permits the OTS to restrict or prohibit activities that
are determined to be a risk to Provident Bank.
Provident
Bancorp must generally limit its activities to those permissible for (i)
financial holding companies under the Bank Holding Company Act, or (ii) multiple
savings and loan holding companies under the Savings and Loan Holding Company
Act. Activities in which a financial holding company may engage are
those considered financial in nature or those incidental or complementary to
financial activities. These activities include lending, trust and
investment advisory activities, insurance agency activities, and securities and
insurance underwriting activities. Activities permitted to multiple
savings and loan holding companies include certain real estate investment
activities, and other activities permitted to bank holding companies under the
Bank Holding Company Act.
Federal
law prohibits Provident Bancorp, directly or indirectly, or through one or more
subsidiaries, from acquiring control of another savings association or a savings
and loan holding company, without prior written approval of the OTS. It also
prohibits the acquisition or retention of, with specified exceptions, more than
5% of the voting
shares of a savings association or savings and loan holding company that is not
already a subsidiary, without prior written approval of the OTS. In evaluating
applications for acquisition, the OTS must consider the financial and managerial
resources and future prospects of the company and association involved, the
effect of the acquisition on the association, the risk to the Deposit Insurance
Fund, the convenience and needs of the community to be served, and competitive
factors.
As a
public company with securities registered under the Securities Exchange Act of
1934, Provident Bancorp also is subject to that statute and to the
Sarbanes-Oxley Act.
Dividends
Provident
Bancorp is a legal entity separate and distinct from its savings association and
other subsidiaries, and its principal sources of funds are cash dividends paid
by these subsidiaries. OTS regulations limit the amount of capital
distributions, including cash dividends, stock repurchases, and other
transactions charged to the institution’s capital account, that can be made by
Provident Bank. Furthermore, because Provident Bank is a subsidiary
of a holding company, it must file a notice with the OTS at least 30 days before
Provident Bank’s Board of Directors declares a dividend or approves a capital
distribution. This notice may be denied if the OTS finds
that:
|
·
|
the
savings association would be undercapitalized or worse following the
distribution;
|
|
·
|
the
proposed capital distribution raises safety and soundness
concerns;
|
|
·
|
or
the capital distribution would violate a prohibition contained in any
statute, regulation, agreement with the OTS, or OTS-imposed
condition.
|
Provident
Bank must file an application (rather than a notice) with the OTS if, among
other things, the total amount of all capital distributions, including the
proposed distribution, for the calendar year exceeds the institution’s net
income for that year, plus retained net income for the preceding two
years.
As of
October 1, 2009, the maximum amount of dividends that could be declared by
Provident Bank for fiscal 2010, without regulatory approval, is net income for
calendar year 2010, plus $14.8 million. Provident Bank paid $9.4
million in dividends to the Company during October 2009, reducing the $14.8
million to $5.4 million.
Capital
Requirements
As a
savings and loan holding company, Provident Bancorp is not currently subject to
any regulatory capital requirements. However, as a federal savings
association, Provident Bank is subject to OTS capital
requirements. The OTS regulations require savings associations to
meet three minimum capital standards: at least an 8% risk-based capital ratio, a
4% leverage ratio (3% for institutions receiving the highest supervisory
rating), and at least a 1.5% tangible capital
ratio.
The OTS’
risk-based capital standards require a savings association to maintain at least
a Tier 1 (core) capital ratio to risk-weighted assets of at least 4%, and a
total (core plus supplementary) capital ratio to risk-weighted assets of at
least 8%. To determine these ratios, the regulations define core
capital as common stockholders’ equity (including retained earnings), certain
non-cumulative perpetual preferred stock and related surplus, and minority
interests in equity accounts of fully consolidated subsidiaries, less
intangibles other than certain mortgage servicing rights and credit card
relationships. Supplementary capital is defined as including cumulative
perpetual preferred stock, mandatory convertible securities, subordinated debt,
intermediate preferred stock, allowance for loan and lease losses up to a
maximum of 1.25% of
risk-weighted assets, and up to 45% of net unrealized gains
on available-for-sale equity securities with readily determinable fair market
values. The amount of supplementary capital included as part of total capital
cannot exceed 100% of core capital. In determining the amount of
risk-weighted assets, all assets, including certain off-balance sheet assets,
are multiplied by a risk-weight factor ranging from 0% to 100%, assigned by the
OTS capital regulation based on the risks inherent in the type of
asset.
The OTS’
leverage ratio is defined as the ratio of core capital to adjusted total
assets. The tangible capital ratio is defined as the ratio of
tangible capital (the components of which are very similar to those of core
capital) to adjusted total assets.
As an
FDIC-insured bank, Provident Municipal Bank is subject to the risk-based capital
and leverage capital requirements of the FDIC. These requirements are
similar to the OTS risk-based capital and leverage capital requirements
described above.
In
addition to the foregoing, the OTS, the FDIC and other federal banking agencies
possess broad powers under current federal law to take “prompt corrective
action” in connection with depository institutions that do not meet minimum
capital requirements. For this purpose, the law establishes five
capital categories for insured depository institution: “well-capitalized”,
“adequately capitalized,” “undercapitalized,” “significantly undercapitalized”
and “critically undercapitalized.” To be considered “well
capitalized,” an institution must maintain a total risk-based capital ratio of
10% or greater, a Tier 1 risk-based capital ratio of 6% or greater, a leverage
capital ratio of 5% or greater, and not be subject to any order or written
directive to meet and maintain a specific capital level for any capital
measure. An “adequately capitalized” institution must have a Tier 1
capital ratio of at least 4%, a total capital ratio of at least 8%, and a
leverage capital ratio of at least 4%.
If an
institution fails to meet these capital requirements, progressively more severe
restrictions are placed on the institution’s operations, management and capital
distributions, depending on the capital category in which an institution is
placed. Any institution that is “adequately capitalized” is, absent a
waiver from the FDIC, prohibited from accepting or renewing brokered
deposits. Any institution that is determined to be
“undercapitalized,” “significantly undercapitalized,” or “critically
undercapitalized” is required to raise additional capital and may not accept or
renew brokered deposits. In addition, numerous mandatory supervisory
actions become immediately applicable to the insured depository institution,
including, but not limited to, restrictions on growth, investment activities,
capital distributions, and affiliate transactions. The federal banking agencies
also may take any one of a number of discretionary supervisory actions against
undercapitalized institutions, including the replacement of senior executive
officers and directors. The agencies also may appoint a receiver or
conservator for a savings association that is “critically
undercapitalized”.
At
September 30, 2009, the capital of Provident Bank and Provident Municipal Bank
exceeded all applicable capital requirements, and each met the requirements to
be treated as a “well-capitalized” institution.
Deposit
Insurance
The FDIC
insures deposit accounts in Provident Bank and Provident Municipal Bank
generally up to a maximum of $100,000 per separately-insured depositor, and up
to a maximum of $250,000 per separately-insured depositor for certain retirement
accounts. As FDIC-insured depository institutions, Provident Bank and
Provident Municipal Bank are required to pay deposit insurance premiums based on
the risk each institution poses to the Deposit Insurance
Fund. Currently, the annual FDIC assessment rate ranges from $0.05 to
$0.43 per $100 of insured deposits, based on the institution’s relative risk to
the Deposit Insurance Fund, as measured by the institution’s regulatory capital
position and other supervisory factors. The FDIC also has the
authority to raise or lower assessment rates on insured deposits, subject to
limits, and to impose special additional assessments.
The
$100,000 limit on insured deposits has been increased temporarily to $250,000,
matching the limit on qualified retirement accounts, through December 31,
2013. In addition, under the FDIC’s Temporary Liquidity Guaranty
Program (“TLGP”), non-interest bearing transaction deposit accounts and
interest–bearing transaction accounts paying 50 basis points or less will be
fully insured above and beyond the $250,000 limit through June 30,
2010. While this unlimited insurance coverage is in effect, covered
deposits in excess of the $250,000 limit are subject to a surcharge of $0.10 per
$100 of deposits by the FDIC.
In
February 2009, the FDIC substantially increased the quarterly initial base
assessment rates as of the second quarter of 2009. In May 2009, the FDIC imposed
a 5 basis point special assessment on each institution’s assets (excluding Tier
1 capital) as reported on the institution’s report of condition as of June 30,
2009, up to a maximum special assessment amount of one tenth of one percent of
the institution’s assessment base for the second quarter 2009 risk-based
assessment. On September 29, 2009, the FDIC issued a notice of proposed
rulemaking that would require insured depository institutions to prepay, on
December 30, 2009, their estimated quarterly risk-based assessments for the
fourth quarter of 2009 and for all of 2010, 2011 and 2012, together with their
quarterly risk-based assessment for the third quarter of 2009. Such
action was approved on November 12, 2009.
In
addition, the FDIC collects funds from insured institutions sufficient to pay
interest on debt obligations of the Financing Corporation
(FICO). FICO is a government-sponsored entity that was formed to
borrow the money necessary to carry out the closing and ultimate disposition of
failed thrift institutions by the Resolution Trust Corporation.
For the
quarter ended September 30, 2009, the annualized FICO assessment was equal to
$0.0104 for each $100 of insured domestic deposits maintained at an
institution. We were allocated $27,000 in DIF assessment credits as
of January 1, 2009. There were no remaining DIF assessment credits at
September 30, 2009.
Regulation
of Provident Bank
Business
Activities. As a
federal savings association, Provident Bank derives its deposit, lending and
investment powers from the Home Owners’ Loan Act and the regulations of the OTS.
Under these laws and regulations, Provident Bank may offer any type of deposit
accounts, make or invest in mortgage loans secured by residential and commercial
real estate, make and invest in commercial and consumer loans, certain types of
debt securities and certain other loans and assets, subject in certain cases to
certain limits. Provident Bank also may establish and operate subsidiaries that
engage in activities permissible for Provident Bank, as well as service
corporation subsidiaries that engage in activities not permissible for Provident
Bank to engage in directly (such as real estate investment, and securities and
insurance brokerage). Pursuant to this authority, Provident Bank
operates certain subsidiaries, including Provest Services Corp., which holds an
investment in a limited partnership that operates an assisted living facility;
Provest Services Corp. II, through which Provident Bank offers annuities and
insurance products to its customers. Provident Bank also controls
Provident REIT, Inc. and WSB Funding to hold residential and commercial real
estate loans. Certain of Provident Bank’s subsidiaries are subject to
separate regulatory requirements, such as those applicable to insurance agencies
and investment advisors. Hardenburgh Abstract Company of Orange
County Inc., a title insurance company; and Hudson Valley Investment Advisors,
LLC, an investment advisory firm are subsidiaries of Provident New York
Bancorp.
Qualified Thrift
Lender Test. As
a federal savings association, Provident Bank must meet the qualified thrift
lender (“QTL”) test. Under the QTL test, Provident Bank must maintain at least
65% of its
“portfolio assets” in “qualified thrift investments” in at least nine months of
the most recent 12-month period. “Portfolio assets” generally means total assets
of a savings association, less the sum of certain specified liquid assets,
goodwill and other intangible assets, and the value of property used in the
conduct of the savings association’s business. “Qualified thrift
investments” are primarily mortgage loans and securities, and other investments
related to housing, home equity loans, credit card loans, education loans and
other consumer loans up to a certain percentage of assets. Provident
Bank also may satisfy the QTL test by qualifying as a “domestic building and
loan association” as defined in the Internal Revenue Code of 1986. If
Provident Bank were to fail the QTL test, it would be required to either convert
to a bank charter or operate under specified restrictions.
At
September 30, 2009, Provident Bank maintained approximately 81.6% of its portfolio assets
in qualified thrift investments, and satisfied the QTL test.
Loans to One
Borrower.
Provident Bank generally may not make loans or extend credit to a single
or related group of borrowers in excess of 15% of unimpaired capital
and surplus on an unsecured basis. An additional amount may be loaned, up to 10%
of unimpaired capital and surplus, if the loan is secured by readily marketable
collateral, which generally does not include real estate. As of September 30,
2009, Provident Bank was in compliance with the loans-to-one-borrower
limitations.
Transactions with
Affiliates.
Provident Bank is subject to restrictions on transactions with affiliates
that are the same as those applicable to commercial banks under Sections 23A and
23B of the Federal Reserve Act, as well as certain additional restrictions
imposed on federal savings associations by the Home Owners’ Loan
Act. The term “affiliate” under these laws means any company that
controls or is under common control with a savings association and includes
Provident Bancorp and its non-bank subsidiaries. Transactions between
Provident Bank and certain affiliates are restricted to an aggregate percentage
of Provident Bank’s capital, and in general must be collateralized with certain
specified assets. The Home Owners’ Loan Act further prohibit a
savings association from lending to any affiliate that is engaged in activities
not permissible for a bank holding company and from purchasing or investing in
securities issued by any affiliate other than with respect to shares of a
subsidiary. Permissible transactions with affiliates must be on terms
that are as favorable to the savings association as comparable transactions with
non-affiliates.
Provident
Bank also is restricted in its ability to extend credit to its directors,
executive officers and 10% shareholders, as well as to entities controlled by
such persons, to the same extent as such restrictions apply to commercial
banks. Extensions of credit to insiders must (i) be made on terms
that are substantially the same as, and follow credit underwriting procedures
that are not less stringent than, those prevailing for comparable transactions
with unaffiliated persons; (ii) not involve more than the normal risk of
repayment or present other unfavorable features; and (iii) not exceed certain
limitations on the amount of credit extended to such persons, individually and
in the aggregate. In addition, extensions of credit in excess of certain limits
must be approved by Provident Bank’s Board of Directors.
Safety and
Soundness Regulations. Federal law
requires each federal banking agency to prescribe certain safety and soundness
standards for all insured depository institutions. These standards relate to,
among other things, internal controls, information systems, and audit systems;
loan documentation; credit underwriting; interest rate risk exposure; asset
growth; compensation; and other operational and managerial standards as the
agency deems appropriate. The federal banking agencies adopted Interagency
Guidelines Establishing Standards for Safety and Soundness to implement the
safety and soundness requirements of federal law. The guidelines set forth the
safety and soundness standards that the federal banking agencies use to identify
and address problems at insured depository institutions before capital becomes
impaired. If the appropriate federal banking agency determines that an
institution fails to meet any standard prescribed by the guidelines, the agency
may require the institution to submit to the agency an acceptable plan to
achieve compliance with the standard. If a deficiency persists, the agency must
issue an order that requires the institution to correct the deficiency, in
addition to taking other statutorily-mandated or discretionary
actions.
Enforcement. The OTS has primary
enforcement responsibility over federal savings associations such as Provident
Bank, and has the authority to bring enforcement action against all
“institution-affiliated parties,” including controlling stockholders and
attorneys, appraisers, and accountants who knowingly or recklessly participate
in wrongful action likely to have a significant adverse effect on an insured
institution. Formal enforcement action may range from the issuance of a capital
directive or cease and desist order, to removal of officers or directors of the
institution, receivership, conservatorship, or the termination of deposit
insurance. Civil money penalties may be imposed for a wide range of violations
and actions. The FDIC also has the authority to recommend to the Director of the
OTS that enforcement action be taken with respect to a particular savings
association. If action is not taken by the OTS, the FDIC has
authority to take action under specified circumstances.
Community
Reinvestment Act and Fair Lending Laws. All savings associations
have a responsibility under the Community Reinvestment Act (“CRA”) and related
regulations of the OTS to help meet the credit needs of their communities,
including low-and moderate-income neighborhoods, consistent with safe and sound
operations. The OTS is required to assess the savings association’s record of
compliance with the CRA, and to assign one of four possible ratings to an
institution’s CRA performance, including “outstanding,” “satisfactory,” “needs
to improve,” and “substantial noncompliance.” The Equal Credit
Opportunity Act and the Fair Housing Act also prohibit lenders from
discriminating in their lending practices on the basis of characteristics
specified in those statutes. A savings association’s failure to comply with the
provisions of the CRA could, at a minimum, result in regulatory restrictions on
its activities. The failure to comply with the Equal Credit Opportunity Act and
the Fair Housing Act could result in enforcement actions by the OTS, as well as
other federal regulatory agencies and the Department of Justice. Provident Bank
received an “outstanding” Community Reinvestment Act rating in its most recent
federal examination.
Federal Home Loan
Bank System.
Provident Bank is a member of the Federal Home Loan Bank System, which
consists of 12 regional Federal Home Loan Banks. The Federal Home Loan Bank
System provides a central credit facility primarily for member institutions. As
a member of the Federal Home Loan Bank of New York, Provident Bank is required
to acquire and hold shares of capital stock in the Federal Home Loan Bank of New
York in an amount at least equal to 1 % of the aggregate principal amount of its
unpaid residential mortgage loans and similar obligations at the beginning of
each year, or 1/20 of its borrowings from the Federal Home Loan Bank, whichever
is greater. As of September 30, 2009, Provident Bank was in compliance with this
requirement.
Other
Regulations. Provident Bank is subject to federal consumer
protection statutes and regulations promulgated under these laws, including, but
not limited to, the:
|
·
|
Truth-In-Lending
Act, governing disclosures of credit terms to consumer borrowers; Home
Mortgage Disclosure Act, requiring financial institutions to provide
certain information about home mortgage and refinanced loans; Equal Credit
Opportunity Act, prohibiting discrimination on the basis of race, creed or
other prohibited factors in extending
credit;
|
|
·
|
Fair
Credit Reporting Act, governing the provision of consumer information to
credit reporting agencies and the use of consumer
information;
|
|
·
|
Fair
Debt Collection Act, governing the manner in which consumer debts may be
collected by collection agencies;
and
|
|
·
|
Electronic
Funds Transfer Act, governing automatic deposits to and withdrawals from
deposit accounts and customers’ rights and liabilities arising from the
use of automated teller machines and other electronic banking
services.
|
Provident
Bank also is subject to federal laws protecting the confidentiality of consumer
financial records, and limiting the ability of the institution to share
non-public personal information with third parties.
Finally,
Provident Bank is subject to extensive anti-money laundering provisions and
requirements, which require the institution to have in place a comprehensive
customer identification program and an anti-money laundering program and
procedures. These laws and regulations also prohibit financial
institutions from engaging in business with foreign shell banks; require
financial institutions to have due diligence procedures and, in some cases,
enhanced due diligence procedures for foreign correspondent and private banking
accounts; and improve information sharing between financial institutions and the
U.S. government. Provident Bank has established policies and
procedures intended to comply with these provisions.
Recent
Regulatory Initiatives
Capital Purchase
Program. Under the Capital Purchase Program (“CPP”) announced
by the U.S. Department of the Treasury on October 14, 2008, as part of the
Troubled Asset Relief Program (“TARP”), Treasury committed to invest up to $250
billion in eligible institutions in the form of non-voting senior preferred
stock. Although Treasury agreed to purchase up to $58.4 million of
Provident Bancorp non-voting preferred stock, the Company decided not to
participate in the program.
TLGP. Provident
Bancorp and Provident Bank participate in the TLGP. As a result,
Provident Bank’s non-interest-bearing transaction deposits accounts (such as
business checking accounts) and interest bearing transaction accounts paying 50
basis points or less, and IOLA accounts will be fully insured through June 30,
2010, as described above under the heading “Deposit
Insurance.” In addition the FDIC has guaranteed all newly
issued senior unsecured debt (e.g., promissory notes, unsubordinated unsecured
notes and commercial paper) up to prescribed limits issued by participating
entities between October 14, 2008 and October 31, 2009. For eligible debt issued
by that date, the FDIC will provide the guarantee coverage until the earlier of
the maturity date of the debt or December 31, 2012. Provident Bank
issued $51.5 million senior unsecured debt in a pooled security in February
2009. This debt matures in February 2012. Provident
prepaid $1.00 of insurance premiums for each $100 (on a per annum basis) of debt
that was guaranteed. Additionally, the FDIC has established an emergency debt
guarantee facility through April 30, 2010, through which institutions that are
unable to issue non-guaranteed debt to replace maturing senior unsecured debt
because of market disruptions or other circumstances beyond their control may
apply on a case-by-case basis to issue FDIC-guaranteed senior unsecured debt.
The FDIC guarantee of any debt issued under this emergency facility would expire
the earlier of the maturity date or December 31, 2012, and the guarantee would
be subject to an annualized assessment rate equal to a minimum of 300 basis
points.
ITEM
1A. Risk Factors
Recent
Legislation in Response to Market and Economic Conditions May Significantly
Affect Our Operations, Financial Condition, and Earnings.
Instability
and volatility in the credit markets has led to the adoption of legislation and
regulatory actions which have the potential to significantly affect financial
institutions and holding companies, including us.
In
response to this financial crisis affecting the banking system and financial
markets, the United States Congress enacted the Emergency Economic Stabilization
Act of 2008 and the American Recovery and Reinvestment Act of 2009. Under these
and other laws and government actions:
|
|
·
|
the
U.S. Department of the Treasury, or “Treasury,” has provided capital to
financial institutions and adopted programs to facilitate and finance the
purchase of problem assets and finance asset-backed securities via the
Troubled Assets Relief Program, or
“TARP”;
|
|
|
·
|
the
FDIC has temporarily increased the limits on federal deposit insurance
with the exception of depository institutions who have voluntarily opted
out of the program and has also provided availability of temporary
liquidity guarantee, or “TLG”, of all FDIC-insured institutions and their
affiliates’ debt, as well as deposits in noninterest-bearing transaction
deposit accounts; and
|
|
|
·
|
the
federal government has undertaken various forms of economic stimulus,
including assistance to homeowners in restructuring mortgage payments on
qualifying loans.
|
TARP and
the TLG are winding down, and the effects of this wind-down cannot be
predicted.
In
addition, the federal government is considering various proposals for a
comprehensive reform of the financial services industry and markets and
coordinating reforms with other countries. There can be no assurance that these
various initiatives or any other future legislative or regulatory initiatives
will be successful at improving economic conditions globally, nationally or in
our markets, or that the measures adopted will not have adverse consequences.
These new laws, regulations, and changes will increase our FDIC insurance
premiums and may also increase our costs of regulatory compliance and of doing
business, and otherwise affect our operations. At this time, we
cannot fully determine the extent of these effects, or any other effects, on us
caused by these and future laws and regulations. However, they may
significantly affect the markets in which we do business, the markets for and
value of our investments, and our ongoing operations, costs and
profitability.
Difficult
Market Conditions Have Adversely Affected Our Industry.
We are
operating in a challenging and uncertain economic environment, including
generally uncertain national and local conditions. Financial
institutions continue to be affected by sharp declines in the real estate market
and constrained financial markets. Dramatic declines in the housing
market over the past two years, with falling home prices and increasing
foreclosure, unemployment and under-employment, have negatively impacted the
credit performance of mortgage loans and resulted in significant write-downs of
asset values by financial institutions, including government-sponsored entities
as well as major commercial and investment banks. These write-downs,
initially of mortgage-backed securities but spreading to credit default swaps
and other derivative and cash securities, in turn, have caused many financial
institutions to seek additional capital, to merge with larger and stronger
institutions and, in some cases, to fail. Reflecting concern about
the stability of the financial markets generally and the strength of
counterparties, many lenders and institutional investors have reduced or ceased
providing funding to borrowers, including to other financial
institutions. This market turmoil and tightening of credit have led
to an increased level of commercial and consumer delinquencies, lack of consumer
confidence, increased market volatility and widespread reduction of business
activity generally. The resulting economic pressure on consumers and
lack of confidence in the financial markets may adversely affect our business,
financial condition and results of operations. A worsening of these
conditions would likely exacerbate the adverse effects of these difficult market
conditions on us and others in the financial services industry. In
particular, we may face the following risks in connection with these
events:
|
·
|
We
expect to face increased regulation of our industry, and compliance with
such regulation may increase our costs, limit our ability to pursue
business opportunities, and increase compliance
challenges.
|
|
·
|
Our
ability to assess the creditworthiness of our customers or to estimate the
values of our assets may be impaired if the models and approaches we use
become less predictive of future behaviors, valuations, assumptions or
estimates. The process we use to estimate losses inherent in our credit
exposure or estimate the value of certain assets requires difficult,
subjective, and complex judgments, including forecasts of economic
conditions and how these economic predictions might impair the ability of
our borrowers to repay their loans or impact the value of assets, which
may no longer be capable of accurate estimation which may, in turn, impact
the reliability of the process.
|
|
·
|
Competition
in our industry could intensify as a result of the increasing
consolidation of financial services companies in connection with current
market conditions.
|
|
·
|
We
may be required to pay significantly higher FDIC premiums because market
developments have significantly depleted the insurance fund of the FDIC
and reduced the ratio of reserves to insured deposits. In May 2009, the
FDIC approved an increase in deposit insurance premiums, including a
one-time special assessment on deposits as of June 30, 2009 and a
provision allowing the FDIC to impose additional special assessments on
the expanded assessment base for the third and fourth quarters of calendar
year 2009. These actions will significantly increase our noninterest
expense in our fiscal year 2010 and in future years as long as the
increased premiums remain in place.
|
A further
deterioration in economic conditions or a prolonged delay in economic recovery
areas could result in the following consequences, any of which could have a
material adverse effect on our business:
|
|
·
|
Loan
delinquencies may increase further;
|
|
|
·
|
Problem
assets and foreclosures may increase
further;
|
|
|
·
|
Demand
for our products and services may
decline;
|
|
|
·
|
Collateral
for loans made by us, especially real estate, may decline further in
value, in turn reducing a customer’s borrowing power, and reducing the
value of assets and collateral associated with our loans;
and
|
|
|
·
|
Investments
in mortgage-backed securities may decline in value as a result of
performance of the underlying loans or the diminution of the value of the
underlying real estate collateral.
|
The
Congressional and State response to the current economic and credit crisis could
have an adverse effect on our business.
Federal
and state legislators and regulators are expected to pursue increased regulation
of how banks are operated and how loans are originated, purchased, and sold as a
result of the current economic and credit crisis. Changes in regulations
applicable to the operation of depository institutions, such as regulations
limiting certain fees applicable to deposit accounts or credit cards, could
limit important sources of revenue for Provident Bank. Additionally, changes in
the regulations applicable to FDIC deposit insurance, including expiration of
temporary measures taken by the FDIC during the financial crisis, could reduce
the amounts of insurance or circumstances in which insurance is available with
respect to deposit accounts, which may negatively affect our ability to attract
and retain deposits. Changes in the lending market and secondary markets for
loans and related congressional and regulatory responses may also affect how
Provident Bank makes and underwrites loans, buys and sells such loans in
secondary markets, and otherwise conducts its business. We are unable to predict
whether any legislative or regulatory initiatives will be implemented, what form
they will take, or whether such initiatives or actions, once they are initiated
or taken, will thereafter continue to change. Any such actions could affect us
in substantial and unpredictable ways and could have an adverse effect on our
business, financial condition and results of operations.
Lack
of Consumer Confidence in Financial Institutions May Decrease Our Level of
Deposits.
Our level
of deposits may be affected by lack of consumer confidence in financial
institutions, which have caused fewer depositors to be willing to maintain
deposits that are not FDIC-insured accounts. That may cause
depositors to withdraw deposits and place them in other institutions or to
invest uninsured funds in investments perceived as being more secure, such as
securities issued by the United States Treasury. These consumer
preferences may cause us to be forced to pay higher interest rates to retain
deposits and may constrain liquidity as we seek to meet funding needs caused by
reduced deposit levels.
An
Inadequate Allowance for Loan Losses Would Negatively Impact Our Results of
Operations.
We are
exposed to the risk that our customers will be unable to repay their loans
according to their terms and that any collateral securing the payment of their
loans will not be sufficient to avoid losses. Credit losses are
inherent in the lending business and could have a material adverse effect on our
operating results. Volatility and deterioration in the broader
economy may also increase our risk of credit losses. The
determination of an appropriate level of allowance for loan losses is an
inherently uncertain process and is based on numerous
assumptions. The amount of future losses is susceptible to changes in
economic, operating and other conditions, including changes in interest rates,
that may be beyond our control, and charge-offs may exceed current
estimates. We evaluate the collectability of our loan portfolio and
provide an allowance for loan losses that we believe is adequate based upon such
factors as, including, but not limited to: the risk characteristics of various
classifications of loans; previous loan loss experience; specific loans that
have loss potential; delinquency trends; the estimated fair market value of the
collateral; current economic conditions; the views of our regulators; and
geographic and industry loan concentrations. If any of our evaluations are
incorrect and borrower defaults result in losses exceeding our allowance for
loan losses, our results of operations could be significantly and adversely
affected. We cannot assure you that our allowance will be adequate to
cover probable loan losses inherent in our portfolio.
The
Need to Account for Assets at Market Prices May Adversely Affect Our Results of
Operations.
We report
certain assets, including investments and securities, at fair
value. Generally, for assets that are reported at fair value we use
quoted market prices or valuation models that utilize market data inputs to
estimate fair value. Because we carry these assets on our books at their fair
value, we may incur losses even if the asset in question presents minimal credit
risk. Given the continued disruption in the capital markets, we may
be required to recognize other-than-temporary impairments in future periods with
respect to securities in our portfolio. The amount and timing of any
impairment recognized will depend on the severity and duration of the decline in
fair value of the securities and our estimation of the anticipated recovery
period.
Acquisition,
Development, and Construction (ADC) Loans, Commercial, Real Estate and
Commercial and Industrial Loans Expose us to Increased Risk.
At
September 30, 2009, our portfolio of commercial real estate loans totaled $554.5
million, or 32.5% of total loans, our commercial and industrial business loan
portfolio totaled $242.6 million, or 14.2% of total loans, and our portfolio of
acquisition, development and construction loans (ADC) totaled $193.8 million, or
11.4% of total loans. We plan to continue to emphasize the origination of these
types of loans. These loans are subject to a variety of risks as described in
the section entitled “Allowance for Loan Losses”. In addition, many
of our borrowers also have more than one commercial real estate, commercial
business or ADC loan outstanding with us. Consequently, an adverse development
with respect to one loan or one credit relationship may expose us to
significantly greater risk of loss.
Changes
in the Value of Goodwill and Intangible Assets Could Reduce Our
Earnings.
We are
required by U.S. generally accepted accounting principles to test goodwill and
other intangible assets for impairment at least annually. Testing for impairment
of goodwill and intangible assets involves the identification of reporting units
and the estimation of fair values. The estimation of fair values involves a high
degree of judgment and subjectivity in the assumptions used. As of September 30,
2009, if our goodwill and intangible assets were fully impaired and we were
required to charge-off all of our goodwill, the pro forma reduction to our
stockholders’ equity would be approximately $4.26 per share. Using a
discount rate of 12% and a terminal multiple of 14 times expected earnings, the
net present value of Provident New York Bancorp shares exceeded recorded book
value by 6% as of September 30, 2009. Further declines in the value
of bank stocks and the fair value of banks in general would make it more likely
that we would have to record an impairment of goodwill.
Our
Continuing Concentration of Loans in Our Primary Market Area May Increase Our
Risk.
Our
success depends primarily on the general economic conditions in the counties in
which we conduct business, and in the New York metropolitan area in general.
Unlike large banks that are more geographically diversified, we provide banking
and financial services to customers primarily in Rockland and Orange Counties,
New York. We also have a branch presence in Ulster, Sullivan, Westchester and
Putnam Counties in New York and in Bergen County, New Jersey. The local economic
conditions in our market area have a significant impact on our loans, the
ability of the borrowers to repay these loans and the value of the collateral
securing these loans. A significant decline in general economic conditions
caused by inflation, recession, unemployment or other factors beyond our
control, would affect the local economic conditions and could adversely affect
our financial condition and results of operations.
Changes
in Market Interest Rates Could Adversely Affect Our Financial Condition and
Results of Operations.
Our
financial condition and result of operations are significantly affected by
changes in market interest rates. Our results of operations substantially depend
on our net interest income, which is the difference between the interest income
that we earn on our interest-earning assets and the interest expense that we pay
on our interest-bearing liabilities. Our interest-bearing liabilities generally
reprice or mature more quickly than our interest-earning assets. If rates
increase rapidly as a result of an improving economy, we may have to increase
the rates paid on our deposits and borrowed funds more quickly than loans and
investments reprice, resulting in a negative impact on interest spreads and net
interest income. In addition, the impact of rising rates could be compounded if
deposit customers move funds from savings accounts back to higher rate
certificate of deposit accounts. Conversely, should market interest rates
continue to fall below current levels, our net interest margin could also be
negatively affected, as competitive pressures could keep us from further
reducing rates on our deposits, and prepayments and curtailments on assets may
continue. Such movements may cause a decrease in our interest rate spread and
net interest margin. Average funding costs have declined in
2009 to 1.52% in response to Federal Reserve Bank interest rate
cuts. Average wholesale funding costs, as measured by the cost of
borrowings, decreased from 4.87% in 2007 to 3.64% in 2009. These
decreases outpaced the tax equivalent average yield on earning assets, which
decreased from 6.29% in 2007 to 5.28% in 2009. The overall
result was that tax equivalent net interest income has increased from $87.9
million in 2007 to $99.0 million in 2008 and decreased to $97.9 million in
2009. A decline in net interest margin may occur, offsetting a
portion, or all gains in net interest income generated from an increasing volume
of assets, if competitive market pressures limit our ability to reduce liability
costs as the level of short-term interest rates decrease, or liability costs
increase in response to increasing short-term rates. In this regard,
we have $227.5 million in structured/convertible advances with
FHLB. The advances have interest rates that are below the level of
comparable fixed term borrowings at the time of issue. If interest
rates rise, the borrowings may be called, whereby the funds would need to be
converted at potentially higher interest rates.
We also
are subject to reinvestment risk associated with changes in interest rates.
Changes in interest rates may affect the average life of loans and
mortgage-related securities. Decreases in interest rates often result in
increased prepayments of loans and mortgage-related securities, as borrowers
refinance their loans to reduce borrowings costs. Under these circumstances, we
are subject to reinvestment risk to the extent that we are unable to reinvest
the cash received from such prepayments in loans or other investments that have
interest rates that are comparable to the interest rates on existing loans and
securities. Additionally, increases in interest rates may decrease loan demand
and/or may make it more difficult for borrowers to repay adjustable rate
loans.
Changes
in interest rates also affect the value of our interest earning assets and in
particular our securities portfolio. Generally, the value of securities
fluctuates inversely with changes in interest rates. At September 30, 2009, our
investment and mortgage-backed securities available for sale totaled $832.6
million. Unrealized gains on securities available for sale, net of tax, amounted
to $9.5 million and are reported as part of other comprehensive income, included
as a separate component of stockholders’ equity. Further, decreases in the fair
value of securities available for sale, therefore, could have an adverse effect
on stockholders’ equity.
Our
ability to pay dividends is subject to regulatory limitations and other
limitations which may affect our ability to pay dividends to our
stockholders.
Provident
Bancorp is a separate legal entity from its subsidiary, Provident Bank, and does
not have significant operations of its own. The availability of dividends from
Provident Bank is limited by various statutes and regulations. It is possible,
depending upon the financial condition of Provident Bank and other factors that
the OTS, Provident Bank’s primary regulator, could assert that payment of
dividends or other payments may result in an unsafe or unsound practice. If
Provident Bank is unable to pay dividends to Provident Bancorp, we may not be
able to pay dividends on our common stock. Consequently, the inability to
receive dividends from Provident Bank could adversely affect our financial
condition, results of operations and prospects.
A Breach of Information Security
Could Negatively Affect Our Earnings.
Increasingly,
we depend upon data processing, communication and information exchange on a
variety of computing platforms and networks, and over the internet. We cannot be
certain all our systems are entirely free from vulnerability to attack, despite
safeguards we have instituted. In addition, we rely on the services of a variety
of vendors to meet our data processing and communication needs. Disruptions to
our vendors’ systems may arise from events that are wholly or partially beyond
our vendors’ control (including, for example, computer viruses or electrical or
telecommunications outages). If information security is breached,
despite the controls we have instituted, information can be lost or
misappropriated, resulting in financial loss or costs to us or damages to
others. These costs or losses could materially exceed the amount of insurance
coverage, if any, which would adversely affect our earnings.
We
Are Subject to Extensive Regulatory Oversight.
We and
our subsidiaries are subject to extensive regulation and
supervision. Regulators have intensified their focus on bank lending
criteria and controls, and on the USA PATRIOT Act’s anti-money laundering and
Bank Secrecy Act compliance requirements. There is also increased
scrutiny of our compliance with the rules enforced by the Office of Foreign
Assets Control. In order to comply with regulations, guidelines and
examination procedures in the anti-money laundering area, we have been required
to adopt new policies and procedures and to install new systems. We cannot be
certain that the policies, procedures and systems we have in place are
flawless. Therefore, there is no assurance that in every instance we
are in full compliance with these requirements. Our failure to comply
with these and other regulatory requirements can lead to, among other remedies,
administrative enforcement actions, and legal proceedings.
Failure
to comply with applicable laws and regulations also could result in a range of
sanctions and enforcement actions, including the imposition of civil money
penalties, formal agreements and cease and desist orders. In addition, the OTS
and the FDIC have specific authority to take “prompt corrective action,”
depending on our capital level. Currently, we are considered “well-capitalized”
for prompt corrective action purposes. If we were to drop to the “adequately
capitalized” level, the OTS could restrict our ability to take brokered
deposits. If we were to fall to the lower capital levels – “undercapitalized,”
“significantly undercapitalized” and “critically undercapitalized” – we would be
required to raise additional capital and also would be subject to progressively
more severe restrictions on our operations, management and capital
distributions; replacement of senior executive officers and directors; and, if
we became “critically undercapitalized,” to the appointment of a conservator or
receiver.
In
addition, recently enacted, proposed and future legislation and regulations have
had, will continue to have or may have significant impact on the financial
services industry. Regulatory or legislative changes could make
regulatory compliance more difficult or expensive for us, could cause us to
change or limit some of our products and services or the way we operate our
business, and could limit our ability to pursue business
opportunities.
We
Are Subject to Competition from Both Banks and Non-Banking
Companies.
The
financial services industry, including commercial banking, is highly
competitive, and we encounter strong competition for deposits, loans and other
financial services in our market area. Our principal competitors include
commercial banks, other savings banks and savings and loan associations, mutual
funds, money market funds, finance companies, trust companies, insurers, leasing
companies, credit unions, mortgage companies, real estate investment trusts
(REITs), private issuers of debt obligations, venture capital firms, and
suppliers of other investment alternatives, such as securities firms. Many of
our non-bank competitors are not subject to the same degree of regulation as we
are and have advantages over us in providing certain services. Many of our
competitors are significantly larger than we are and have greater access to
capital and other resources. Also, our ability to compete effectively is
dependent on our ability to adapt successfully to technological changes within
the banking and financial services industry.
Various Factors May Make Takeover
Attempts More Difficult to Achieve.
Our Board
of Directors has no current intention to sell control of Provident Bancorp.
Provisions of our certificate of incorporation and bylaws, federal regulations,
Delaware law and various other factors may make it more difficult for companies
or persons to acquire control of Provident Bancorp without the consent of our
Board of Directors. One may want a take over attempt to succeed because, for
example, a potential acquirer could offer a premium over the then prevailing
market price of our common stock. The factors that may discourage takeover
attempts or make them more difficult include:
Certificate of
Incorporation and Statutory Provisions. Provisions of the
certificate of incorporation and bylaws of Provident Bancorp and Delaware law
may make it more difficult and expensive to pursue a takeover attempt that
management opposes. These provisions also would make it more difficult to remove
our current Board of Directors or management, or to elect new directors. These
provisions also include limitations on voting rights of beneficial owners of
more than 10% of our common stock, supermajority voting requirements for certain
business combinations, the election of directors to staggered terms of three
years and plurality voting. Our bylaws also contain provisions regarding the
timing and content of stockholder proposals and nominations and qualification
for service on the Board of Directors.
Required Change
in Control Payments and Issuance of Stock Options and Recognition and
Retention Plan
Shares. We have
entered into employment agreements with executive officers, which require
payments to be made to them in the event their employment is terminated
following a change in control of Provident Bancorp or Provident Bank. We have
issued stock grants and stock options in accordance with the 2004 Provident
Bancorp Inc. Stock Incentive Plan. The majority of grants under the
plan were made in 2005 and generally vest over five years. In the
event of a change in control, the vesting of stock and option grants
accelerate. In 2006 we adopted the Provident Bank & Affiliates
Transition Benefit Plan. The plan calls for severance payments ranging from 12
weeks to one year for employees not covered by separate agreements if they are
terminated in connection with a change in control of the Company. These payments
and the acceleration of grants would increase the cost of acquiring Provident
Bancorp, thereby discouraging future takeover attempts.
ITEM
1B. Unresolved Staff Comments
Not
Applicable.
ITEM 2. Properties
We
maintain our executive offices, commercial lending division and investment
management and trust department at a leased facility located at 400 Rella
Boulevard, Montebello, NY consisting of 47,445 square feet. At
September 30, 2009, we conducted our business through 33 full-service
branches. Of our 33 branches 14 are located in Orange County, NY, 11
in Rockland County, NY, 2 in Ulster County, NY, 2 in Sullivan County, NY, 1 in
Putnam County, NY, 2 in Westchester County and 1 in Bergen County,
NJ. Additionally, 15 of our branches are owned and 18 are leased. The square
footage of our branches range from 300 to 16,000 square feet.
In
addition to our branch network and corporate headquarters we lease 3 and own 5
additional properties which are held for general corporate purposes and 2
REO’s. The total square footage of these properties is 30,213 square
feet and they are located in Orange, Rockland, Sullivan and Ulster
counties. This total square footage does not include the South
Fallsburg land with square footage of approximately 40,256. See Note 7 of the
“Notes to Consolidated Financial Statements” for further detail on our premises
and equipment.
ITEM
3. Legal Proceedings
Provident
Bancorp is not involved in any pending legal proceedings other than routine
legal proceedings occurring in the ordinary course of business which, in the
aggregate, involve amounts that are believed by management to be immaterial to
Provident Bancorp’s financial condition and results of operations.
ITEM
4. Submission of Matters to a Vote of Security
Holders
No
matters were submitted to a vote of stockholders during the quarter ended
September 30, 2009.
PART
II
ITEM
5. Market for Registrant’s Common Equity, Related
Stockholder Matters and Issuer Purchases of Equity
Securities
(A)
The
shares of common stock of Provident New York Bancorp are quoted on the NASDAQ
Global Select (“NASDAQ”) under the symbol “PBNY.” As of September 30, 2009,
Provident New York Bancorp had 11 registered market makers, 5,788 stockholders
of record (excluding the number of persons or entities holding stock in street
name through various brokerage firms), and 39,547,207 shares
outstanding.
Market Price and
Dividends. The following table sets forth market price and
dividend information for the common stock for the past two fiscal
years.
|
Quarter Ended
|
High
|
Low
|
Cash
Dividends Declared
|
|||||||||
|
September
30, 2009
|
$ | 10.44 | $ | 7.93 | $ | 0.06 | ||||||
|
June
30, 2009
|
10.15 | 7.75 | 0.06 | |||||||||
|
March
31, 2009
|
11.91 | 7.31 | 0.06 | |||||||||
|
December
31, 2008
|
13.60 | 9.54 | 0.06 | |||||||||
|
September
30, 2008
|
$ | 14.53 | $ | 10.21 | $ | 0.06 | ||||||
|
June
30, 2008
|
14.65 | 11.06 | 0.06 | |||||||||
|
March
31, 2008
|
14.20 | 11.45 | 0.06 | |||||||||
|
December
31, 2007
|
14.02 | 11.70 | 0.06 | |||||||||
Payment
of dividends on Provident New York Bancorp’s common stock is subject to
determination and declaration by the Board of Directors and depends on a number
of factors, including capital requirements, regulatory limitations on the
payment of dividends, the results of operations and financial condition, tax
considerations and general economic conditions. No assurance can be given that
dividends will be declared or, if declared, what the amount of dividends will
be, or whether such dividends will continue. Repurchases of the
Company’s shares of common stock during the fourth quarter of the fiscal year
ended September 30, 2009 are detailed in (C) below. There were no sales of
unregistered securities during the quarter ended September 30,
2009.
Set forth
below is a stock performance graph comparing the yearly total return on our
shares of common stock, commencing with the closing price on September 30, 2004,
with (a) the cumulative total return on stocks included in the NASDAQ Composite
Index, and (b) the cumulative total return on stocks included in the SNL Mid-Atlantic Thrift
Index.
There can
be no assurance that our stock performance in the future will continue with the
same or similar trend depicted in the graph below. We will not make
or endorse any predictions as to future stock performance.
PROVIDENT
NEW YORK BANCORP
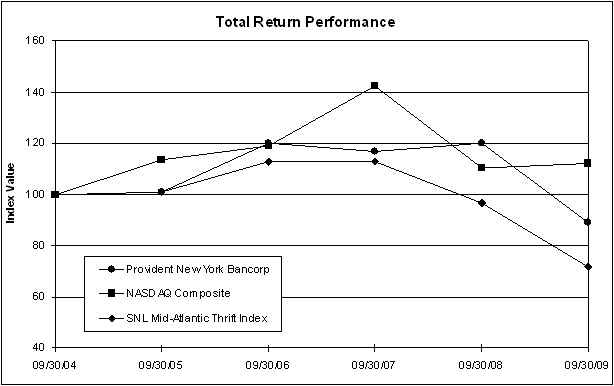
|
At
|
||||||||||||||||||||||||
|
Index
|
09/30/04
|
09/30/05
|
09/30/06
|
09/30/07
|
09/30/08
|
09/30/09
|
||||||||||||||||||
|
Provident
New York Bancorp
|
100.00 | 100.83 | 120.15 | 116.80 | 119.98 | 88.89 | ||||||||||||||||||
|
NASDAQ
Composite
|
100.00 | 113.44 | 119.06 | 142.42 | 110.28 | 111.89 | ||||||||||||||||||
|
SNL
Mid-Atlantic Thrift Index
|
100.00 | 100.87 | 112.73 | 112.62 | 96.75 | 71.69 | ||||||||||||||||||
source: SNL
Financial
This
stock performance graph shall not be deemed incorporated by reference by any
general statement incorporating by reference this Form 10-K under the Securities
Act of 1933, as amended, or the Securities Exchange Act of 1934, as amended,
except to the extent that Provident New York Bancorp specifically incorporates
this information by reference, and shall not otherwise be deemed filed under
such Acts.
(B)
Not
Applicable
(C)
Issuer Purchases of Equity
Securities
|
Total Number of Shares (or Units) Purchased
(1)
|
Average Price Paid per share (or
Unit)
|
Total Number of Shares (or Units)
Purchased as Part of Publicly Announced Plans or Programs
(2)
|
Maximum Number (or Approximate Dollar Value) of
Shares (or Units) that may yet be Purchased Under the Plans or Programs
(2)
|
|||||||||||||
|
Period
(2009)
|
836,950 | |||||||||||||||
|
July
1 - July 31
|
- | $ | 836,950 | |||||||||||||
|
August
1 - August 31
|
10,500 | 9.29 | 10,500 | 826,450 | ||||||||||||
|
September
1 - September 30
|
110,524 | 9.35 | 76,360 | 750,090 | ||||||||||||
|
Total
|
121,024 | $ | 9.34 | 86,860 | ||||||||||||
|
1
|
The
total number of shares purchased during the periods includes shares deemed
to have been received from employees who exercised stock options by
submitting previously acquired shares of common stock in satisfaction of
the exercise price, or shares withheld for tax purposes ($326,266 or
34,164 shares), as is permitted under the Company’s stock benefit plans
and shares repurchased as part of a previously authorized repurchase
program..
|
|
2
|
The
Company announced its fourth repurchase program on August 24, 2007
authorizing the repurchase of 2,000,000
shares.
|
ITEM 6.
Selected Financial Data
The
following financial condition data and operating data are derived from the
audited consolidated financial statements of Provident New York Bancorp.
Additional information is provided in “Management’s Discussion and Analysis of
Financial Condition and Results of Operations” and the Consolidated Financial
Statements and related notes included as Item 7 and Item 8 of this report,
respectively.
|
At September 30,
|
||||||||||||||||||||
|
2009
|
2008
|
2007
|
2006
|
2005
|
||||||||||||||||
|
(Dollars
in thousands)
|
||||||||||||||||||||
|
Selected
Financial Condition Data:
|
||||||||||||||||||||
|
Total
assets
|
$ | 3,021,893 | $ | 2,984,371 | $ | 2,802,099 | $ | 2,841,337 | $ | 2,598,323 | ||||||||||
|
Loans,
net (1)
|
1,673,207 | 1,708,452 | 1,617,669 | 1,453,185 | 1,341,026 | |||||||||||||||
|
Securities
available for sale
|
832,583 | 791,688 | 794,997 | 951,729 | 822,952 | |||||||||||||||
|
Securities
held to maturity
|
44,614 | 43,013 | 37,446 | 60,987 | 70,949 | |||||||||||||||
|
Deposits
|
2,082,282 | 1,989,197 | 1,713,684 | 1,729,659 | 1,726,401 | |||||||||||||||
|
Borrowings
|
430,628 | 566,008 | 661,242 | 682,739 | 442,203 | |||||||||||||||
|
Equity
|
427,456 | 399,158 | 405,089 | 405,286 | 395,157 | |||||||||||||||
|
Years Ended September 30,
|
||||||||||||||||||||
|
2009
|
2008
|
2007
|
2006
|
2005
|
||||||||||||||||
|
(Dollars
in thousands)
|
||||||||||||||||||||
|
Selected
Operating Data:
|
||||||||||||||||||||
|
Interest
and dividend income
|
$ | 131,590 | $ | 148,982 | $ | 151,626 | $ | 135,616 | $ | 116,171 | ||||||||||
|
Interest
expense
|
37,720 | 53,642 | 66,888 | 50,859 | 29,400 | |||||||||||||||
|
Net
interest income
|
93,870 | 95,340 | 84,738 | 84,757 | 86,771 | |||||||||||||||
|
Provision
for loan losses
|
17,600 | 7,200 | 1,800 | 1,200 | 750 | |||||||||||||||
|
Net
interest income after provision for loan losses
|
76,270 | 88,140 | 82,938 | 83,557 | 86,021 | |||||||||||||||
|
Non-interest
income
|
39,953 | 21,042 | 19,845 | 17,152 | 17,007 | |||||||||||||||
|
Non-interest
expense
|
80,187 | 75,500 | 74,590 | 71,256 | 70,582 | |||||||||||||||
|
Income
before income tax expense
|
36,036 | 33,682 | 28,193 | 29,453 | 32,446 | |||||||||||||||
|
Income
tax expense
|
10,175 | 9,904 | 8,566 | 9,258 | 11,204 | |||||||||||||||
|
Net
income
|
$ | 25,861 | $ | 23,778 | $ | 19,627 | $ | 20,195 | $ | 21,242 | ||||||||||
|
At or For the Years Ended September
30,
|
||||||||||||||||||||
|
2009
|
2008
|
2007
|
2006
|
2005
|
||||||||||||||||
|
Selected
Financial Ratios and Other Data:
|
||||||||||||||||||||
|
Performance
Ratios:
|
||||||||||||||||||||
|
Return
on assets (ratio of net income to average total assets)
|
0.89 | % | 0.84 | % | 0.70 | % | 0.75 | % | 0.84 | % | ||||||||||
|
Return
on equity (ratio of net income to average equity)
|
6.22 | 5.88 | 4.82 | 5.15 | 5.16 | |||||||||||||||
|
Average
interest rate spread (2)
|
3.46 | 3.49 | 2.97 | 3.19 | 3.63 | |||||||||||||||
|
Net
interest margin (3)
|
3.81 | 3.96 | 3.57 | 3.68 | 3.98 | |||||||||||||||
|
Efficiency
ratio(4)
|
65.11 | 61.20 | 66.40 | 65.30 | 63.70 | |||||||||||||||
|
Non-interest
expense to average total assets
|
2.77 | 2.68 | 2.68 | 2.63 | 2.79 | |||||||||||||||
|
Ratio
of average interest-earning assets to average interest-bearing
liabilities
|
123.54 | 122.26 | 122.34 | 122.48 | 126.07 | |||||||||||||||
|
Per
Share Related Data:
|
||||||||||||||||||||
|
Basic
earnings per share
|
$ | 0.67 | 0.61 | $ | 0.48 | $ | 0.49 | $ | 0.49 | |||||||||||
|
Diluted
earnings per share
|
0.67 | 0.61 | 0.48 | 0.49 | 0.49 | |||||||||||||||
|
Dividends
per share
|
0.24 | 0.24 | 0.20 | 0.20 | 0.17 | |||||||||||||||
|
Book
value per share (6)
|
10.81 | 10.03 | 9.82 | 9.49 | 9.08 | |||||||||||||||
|
Dividend
payout ratio (5)
|
35.82 | % | 39.34 | % | 41.67 | % | 40.82 | % | 34.69 | % | ||||||||||
|
Asset
Quality Ratios:
|
||||||||||||||||||||
|
Non-performing
assets to total assets
|
0.95 | % | 0.57 | % | 0.26 | % | 0.18 | % | 0.07 | % | ||||||||||
|
Non-performing
loans to total loans
|
1.55 | 0.97 | 0.44 | 0.34 | 0.12 | |||||||||||||||
|
Allowance
for loan losses to non-performing loans
|
114 | 137 | 281 | 406 | 1,283 | |||||||||||||||
|
Allowance
for loan losses to total loans
|
1.76 | 1.33 | 1.24 | 1.38 | 1.55 | |||||||||||||||
|
Capital
Ratios:
|
||||||||||||||||||||
|
Equity
to total assets at end of year
|
14.15 | % | 13.37 | % | 14.46 | % | 14.26 | % | 15.21 | % | ||||||||||
|
Average
equity to average assets
|
14.36 | 14.34 | 14.61 | 14.49 | 16.26 | |||||||||||||||
|
Tier
1 leverage ratio (bank only)
|
8.6 | 8.0 | 8.1 | 7.8 | 8.2 | |||||||||||||||
|
Other
Data:
|
||||||||||||||||||||
|
Number
of full service offices
|
33 | 33 | 33 | 33 | 35 | |||||||||||||||
|
(1)
|
Excludes
loans held for sale.
|
|
(2)
|
The
average interest rate spread represents the difference between the
weighted-average yield on interest-earning assets and the
weighted-average cost of interest-bearing liabilities for the
period.
|
|
(3)
|
The
net interest margin represents net interest income as a percent of average
interest-earning assets for the period. Net interest income is
commonly presented on a tax-equivalent basis. This is to the
extent that some component of the institution’s net interest income will
be exempt from taxation (e.g. was received as a result of its holdings of
state or municipal obligations), an amount equal to the tax benefit
derived from that component is added back to the net interest income
total. This adjustment is considered helpful in comparing one financial
institution’s net interest income (pre-tax) to that of another
institution, as each will have a different proportion of tax-exempt items
in their portfolios. Moreover, net interest income is itself a
component of a second financial measure commonly used by financial
institutions, net interest margin, which is the ratio of net interest
income to average earning assets. For purposes of this measure
as well, tax-equivalent net interest income is generally used by financial
institutions, again to provide a better basis of comparison from
institution to institution. We follow these
practices.
|
|
(4)
|
The
efficiency ratio represents non-interest expense divided by the sum of net
interest income and non-interest income. As in the case of net interest
income, generally, net interest income as utilized in calculating the
efficiency ratio is typically expressed on a tax-equivalent
basis. Moreover, most financial institutions, in calculating
the efficiency ratio, also adjust both noninterest expense and noninterest
income to exclude from these items (as calculated under generally accepted
accounting principles) certain component elements, such as non-recurring
charges, other real estate expense and amortization of intangibles
(deducted from noninterest expense) and securities transactions and other
non-recurring items (excluded from noninterest
income). We follow these
practices.
|
|
(5)
|
The
dividend payout ratio represents dividends per share divided by basic
earnings per share.
|
|
(6)
|
Book
value per share is based on total stockholders’ equity and 39,547,207,
39,815,213, 41,230,618, 42,699,046 and 43,505,659 outstanding common
shares at September 30, 2009, 2008, 2007, 2006 and 2005, respectively. For
this purpose, common shares include unallocated employee stock ownership
plan shares but exclude treasury
shares.
|
ITEM
7. Management’s Discussion and
Analysis of Financial Condition and Results of Operations
Overview
The
Company provides financial services to individuals and businesses in New York
and New Jersey. The Company’s business is primarily accepting deposits from
customers through its banking offices and investing those deposits, together
with funds generated from operations and borrowings into commercial real estate
loans, commercial business loans, ADC loans, residential mortgages, consumer
loans, and investment securities. Additionally, the Company offers investment
management services. The financial condition and results of operations of
Provident New York Bancorp are discussed herein on a consolidated basis with the
Bank. Reference to Provident New York Bancorp or the Company may signify the
Bank, depending on the context.
Our
results of operations depend primarily on our net interest income, which is the
difference between the interest income on our earning assets, such as loans and
securities, and the interest expense paid on our deposits and borrowings.
Results of operations are also affected by non-interest income and expense, the
provision for loan losses and income tax expense. Results of operations are also
significantly affected by general economic and competitive conditions, as well
as changes in market interest rates, government policies and actions of
regulatory authorities. The Federal Reserve Board, through a series of
reductions to the federal funds target rate to an unprecedented 0-25 basis
points has acted to increase liquidity in the credit markets. These
rate reductions significantly lowered yields on the short end of the treasury
yield curve more so than the long end of the curve, resulting in a steeper yield
curve than existed at the prior fiscal year-end.
Net
income for the year ended September 30, 2009, increased 8.8% to $25.9 million,
or $.67 per diluted share from $23.8 million, or $0.61 per diluted share for the
year ended September 30, 2008. Net income for the year ended September 30, 2007
was $19.6 million, or $0.48 per diluted share. Net interest income on
a tax equivalent basis decreased $1.1 million or 1% for the year ended September
30, 2009 as compared to the year ended 2008, and increased $11.2 million or
12.7% between fiscal 2007 and fiscal 2008. Net interest margin
decreased from 3.96% for fiscal 2008 to 3.81% for fiscal
2009. Average loans grew from $1.5 billion in 2007 to $1.6 billion in
2008 and to $1.7 billion .The provision for loan losses increased from $1.8
million in 2007, to $7.2 million in 2008 and to $17.6 million in 2009 primarily
due to an increase in charge-offs from $2.5 million in 2007, to $4.5 million in
2008 to $10.7 million in 2009 due to the slow down in economic activity since
the recession began in December 2007. Charge-offs have been
concentrated in the Bank’s community business loan portfolio.
Non
interest income was $19.8 million in 2007 increasing $1.2 million (resulting
from banking fees as well as investment management fees and gains on sales of
investment securities) to $ 21.0 million in 2008 and increasing to $40.0 million
in 2009, primarily resulting from $18.1 million in securities gains, $1.0
million in gains on sales of residential mortgages and gains on sales of
premises and payments under bank owned life insurance. Non interest
expense was $74.6 million in 2007, increasing to $75.5 million in 2008 and $80.2
million in 2009, primarily resulting from increased FDIC assessments of $3.4
million.
Total
assets were essentially unchanged at $3.0 billion at September 30, 2009 and
2008. Loans decreased by 2.0%. Deposits increased $93.1
million in 2009 primarily in retail and business transaction accounts and
municipal money market deposit accounts.
The
following is an analysis of the financial condition and results of the Company’s
operations. This item should be read in conjunction with the consolidated
financial statements and related notes filed herewith in Part II, Item 8,
“Financial Statements and Supplementary Data” and the description of the
Company’s business filed here within Part I, Item 1,
“Business.”
Critical
Accounting Policies
Our
accounting and reporting policies are prepared in accordance with accounting
principles generally accepted in the United States of America and conform to
general practices within the banking industry. Accounting policies considered
critical to our financial results include the allowance for loan losses,
accounting for goodwill and other intangible assets, accounting for deferred
income taxes and the recognition of interest income.
The
methodology for determining the allowance for loan losses is considered by
management to be a critical accounting policy due to the high degree of judgment
involved, the subjectivity of the assumptions utilized and the potential for
changes in the economic environment that could result in changes to the amount
of the allowance for loan losses considered necessary. We evaluate our loans at
least quarterly, and review their risk components as a part of that evaluation.
See Note 1, “Basis of Financial Statement Presentation and Summary of
Significant Accounting Policies” in our “Notes to Consolidated Financial
Statements” for a discussion of the risk components. We consistently review the
risk components to identify any changes in trends. At September 30, 2009
Provident has recorded $30.1 million in its allowance for loan
losses.
Accounting
for goodwill is considered to be a critical policy because goodwill must be
tested for impairment at least annually using a “two-step” approach that
involves the identification of reporting units and the estimation of fair
values. The estimation of fair values involves a high degree of judgment and
subjectivity in the assumptions utilized. If goodwill is determined to be
impaired, it would be expensed in the period in which it became
impaired. The Company has $160.9 million in recorded goodwill at
September 30, 2009.
We also
use judgment in the valuation of other intangible assets. A core deposit base
intangible asset has been recorded for core deposits (defined as checking, money
market and savings deposits) that were acquired in acquisitions that were
accounted for as purchase business combinations. The core deposit base
intangible asset has been recorded using the assumption that the acquired
deposits provide a more favorable source of funding than more expensive
wholesale borrowings. An intangible asset has been recorded for the present
value of the difference between the expected interest to be incurred on these
deposits and interest expense that would be expected if these deposits were
replaced by wholesale borrowings, over the expected lives of the core deposits.
If we find these deposits have a shorter life than was estimated, we will write
down the asset by expensing the amount that is impaired. Other intangible assets
have been recorded in connection with the acquisition of HVIA for
non-competition and customer intangibles. At September 30, 2009, the
Company had $5.5 million recorded in core deposit and other
intangibles.
We use
the asset and liability method of accounting for income taxes. Under this
method, deferred tax assets and liabilities are recognized for the future tax
consequences attributable to differences between the financial statement
carrying amounts of existing assets and liabilities and their respective tax
bases. If current available information raises doubt as to the realization of
the deferred tax assets, a valuation allowance is established. Deferred tax
assets and liabilities are measured using enacted tax rates expected to apply to
taxable income in the years in which those temporary differences are expected to
be recovered or settled. We exercise significant judgment in evaluating the
amount and timing of recognition of the resulting tax liabilities and assets,
including projections of future taxable income. These judgments and estimates
are reviewed on a continual basis as regulatory and business factors
change.
At
September 30, 2009, Provident has net deferred tax assets of $1.6
million.
Interest
income on loans, securities and other interest-earning assets is accrued monthly
unless management considers the collection of interest to be doubtful. Loans are
placed on non-accrual status when payments are contractually past due 90 days or
more, or when management has determined that the borrower is unlikely to meet
contractual principal or interest obligations, unless the assets are well
secured and in the process of collection. At such time, unpaid interest is
reversed by charging interest income for interest in the current fiscal year or
the allowance for loan losses with respect to prior year income. Interest
payments received on non-accrual loans (including impaired loans) are not
recognized as income unless future collections are reasonably assured. Loans are
returned to accrual status when collectability is no longer considered
doubtful. At September 30, 2009, Provident has $21.9 million in loans
in non-accrual status.
Comparison
of Financial Condition at September 30, 2009 and September 30, 2008
Total
assets as of September 30, 2009 were $3.0 billion, essentially unchanged
from September 30, 2008. Cash and due from banks increased
$34.6 million to $160.4 million at September 30, 2009 due primarily to deposits
received on September 30, 2009 and high levels of balances maintained at the
Federal Reserve in 2009. Core deposit and other intangibles decreased by $2.2
million. Goodwill was unchanged. The Company had $1.2 million in loans held for
sale as of September 30, 2009 and $189,000 at September 30, 2008. Premises and
equipment increased $4.0 million primarily related to a new office location in
Nyack, New York.
Net loans
as of September 30, 2009 were $1.7 billion, a decrease of $35 million, or 2%,
over net loan balances of $1.7 billion at September 30,
2008. Commercial loans remained relatively flat while Acquisition,
Development and Construction loans (ADC) increased $22.8 million or 13.4% to
$193.8 million compared to $171.0 million as of September, 2008. Consumer loans
increased by $2.8 million, or 1.1%, during the fiscal year ended September 30,
2009, while residential loans decreased by $53 million, or 10%. Total
loan originations, excluding loans originated for sale were $450.6 million for
the fiscal year ended September 30, 2009, while repayments were $469.2 million
for the fiscal year ended September 30, 2009.
Total
securities increased by $42 million, to $877 million at September 30,
2009 from $834.7 million at September 30, 2008.
Deposits
as of September 30, 2009 were $2.1 billion, an increase of $93 million, or 4.7%,
from September 30, 2008. Included in the figures for September 30,
2009 were approximately $201 million in short-term seasonal municipal deposits
compared to $243 million at September 30, 2008. As of September 30,
2009 transaction accounts were 40.6% of deposits, or $844.9 million compared to
41.3% at September 30, 2008. As of September 30, 2009 savings deposits were $358
million an increase of $21 million or 6.5%. Certificates of deposit
decreased $31.0 million, or 5.9% as the Company, while maintaining competitive
rate structures, did not compete with the highest pricing in the market place.
These decreases were offset by an increase of $78 million, or 25.5%, in money
market deposit accounts.
Federal Home Loan
Bank Borrowings decreased by $135 million, or 23.9%, from September 2008,
to $431 million. The decrease is related to the borrowings being paid down by
maturing investment securities and seasonal municipal deposits paying down
short-term borrowings. During 2009 the Company issued $51.5 million
of senior unsecured notes, FDIC insured, maturing in 2012.
Stockholders’
equity increased $28.3 million from September 30, 2008 to $427.5 million
at September 30, 2009. The increase was due to $14.5 million increase in the
Company’s retained earnings and a $12.1 million improvement in accumulated other
comprehensive income, after realizing security gains in the fiscal year of $18.1
million. During fiscal 2009, the Company repurchased 415,811 shares
of its common stock at a cost of $3.5 million and issued a net 147,805 shares
from its stock based compensation plan.
As of
September 30, 2009 the Company had authorization to purchase up to an additional
750,090 shares of common stock. Bank Tier I capital to assets was
8.64% at September 30, 2009. Tangible capital as a percentage of tangible assets
at the holding company level was 9.14%.
The
following table sets forth average balance sheets, average yields and costs, and
certain other information for the years indicated. Tax-exempt securities are
reported on a tax-equivalent basis, using a 35% federal tax rate. All average
balances are daily average balances. Non-accrual loans were included in the
computation of average balances, but have been reflected in the table as loans
carrying a zero yield. The yields set forth below include the effect of deferred
fees, discounts and premiums that are amortized or accreted to interest income
or expense.
|
Years
Ended September 30,
|
||||||||||||||||||||||||||||||||||||
|
2009
|
2008
|
2007
|
||||||||||||||||||||||||||||||||||
|
Average
Outstanding Balance
|
Interest
|
Yield/Rate
|
Average
Outstanding Balance
|
Interest
|
Yield/Rate
|
Average
Outstanding Balance
|
Interest
|
Yield/Rate
|
||||||||||||||||||||||||||||
|
(Dollars
in thousands)
|
||||||||||||||||||||||||||||||||||||
|
Interest
Earning Assets:
|
||||||||||||||||||||||||||||||||||||
|
Loans(1)
|
$ | 1,700,383 | $ | 97,148 | 5.71 | % | $ | 1,644,388 | $ | 107,633 | 6.55 | % | $ | 1,541,279 | $ | 109,940 | 7.13 | % | ||||||||||||||||||
|
Securities
taxable
|
592,071 | 25,552 | 4.32 | 647,167 | 31,947 | 4.94 | 736,423 | 33,479 | 4.55 | |||||||||||||||||||||||||||
|
Securities-tax
exempt
|
194,028 | 11,569 | 5.96 | 173,541 | 10,511 | 6.06 | 146,602 | 8,899 | 6.07 | |||||||||||||||||||||||||||
|
Federal
Reserve Bank
|
56,639 | 144 | 0.25 | - | - | - | - | - | - | |||||||||||||||||||||||||||
|
Other
|
27,061 | 1,226 | 1.64 | 35,103 | 2,570 | 7.32 | 34,042 | 2,422 | 7.11 | |||||||||||||||||||||||||||
|
Total
Interest-earnings assets
|
2,570,182 | 135,639 | 5.28 | 2,500,199 | 152,661 | 6.11 | 2,458,346 | 154,740 | 6.29 | |||||||||||||||||||||||||||
|
Non-interest
earning assets
|
325,322 | 320,765 | 329,016 | |||||||||||||||||||||||||||||||||
|
Total
assets
|
$ | 2,895,504 | $ | 2,820,964 | $ | 2,787,362 | ||||||||||||||||||||||||||||||
|
Interest
Bearing Liabilities:
|
||||||||||||||||||||||||||||||||||||
|
NOW
deposits
|
$ | 232,164 | 670 | 0.29 | $ | 189,524 | 1,015 | 0.54 | $ | 153,869 | 622 | 0.40 | ||||||||||||||||||||||||
|
Savings deposits(2)
|
366,355 | 758 | 0.21 | 356,854 | 1,243 | 0.35 | 377,079 | 1,930 | 0.51 | |||||||||||||||||||||||||||
|
Money
market deposits
|
374,507 | 2,707 | 0.72 | 285,119 | 5,299 | 1.86 | 252,925 | 6,671 | 2.64 | |||||||||||||||||||||||||||
|
Certificates
of deposit
|
577,723 | 14,240 | 2.46 | 556,973 | 20,787 | 3.73 | 600,422 | 27,216 | 4.53 | |||||||||||||||||||||||||||
|
Senior
Debt
|
32,730 | 1,269 | 3.88 | - | - | - | - | - | - | |||||||||||||||||||||||||||
|
Borrowings
|
496,884 | 18,076 | 3.64 | 656,538 | 25,298 | 3.85 | 625,139 | 30,449 | 4.87 | |||||||||||||||||||||||||||
|
Total
interest-bearing liabilities
|
2,080,363 | 37,720 | 1.81 | 2,045,008 | 53,642 | 2.62 | 2,009,434 | 66,888 | 3.33 | |||||||||||||||||||||||||||
|
Non-interest
bearing deposits
|
380,571 | 351,995 | 347,956 | |||||||||||||||||||||||||||||||||
|
Other
non-interest bearing liabilities
|
18,683 | 19,565 | 22,638 | |||||||||||||||||||||||||||||||||
|
Total
liabilities
|
2,479,617 | 2,416,568 | 2,380,028 | |||||||||||||||||||||||||||||||||
|
Stockholders'
equity
|
415,887 | 404,396 | 407,334 | |||||||||||||||||||||||||||||||||
|
Total
liabilities and Stockholders' equity
|
$ | 2,895,504 | $ | 2,820,964 | $ | 2,787,362 | ||||||||||||||||||||||||||||||
|
Net interest rate
spread(3)
|
3.46 | % | 3.49 | % | 2.97 | % | ||||||||||||||||||||||||||||||
|
Net Interest-earning
assets(4)
|
$ | 489,819 | $ | 455,191 | $ | 448,912 | ||||||||||||||||||||||||||||||
|
Net interest
margin(5)
|
97,919 | 3.81 | % | 99,019 | 3.96 | % | 87,852 | 3.57 | % | |||||||||||||||||||||||||||
|
Less
tax equivalent adjustment
|
(4,049 | ) | (3,679 | ) | (3,114 | ) | ||||||||||||||||||||||||||||||
|
Net
Interest income
|
$ | 93,870 | $ | 95,340 | $ | 84,738 | ||||||||||||||||||||||||||||||
|
Ratio
of interest-earning assets to interest bearing liabilities
|
123.54 | % | 122.26 | % | 122.34 | % | ||||||||||||||||||||||||||||||
|
(1)
|
Balances
include the effect of net deferred loan origination fees and costs, and
the allowance for the loan losses. Includes prepayment fees and late
charges.
|
|
(2)
|
Includes
club accounts and interest-bearing mortgage escrow
balances.
|
|
(3)
|
Net
interest rate spread represents the difference between the tax equivalent
yield on average interest-earning assets and the cost of average
interest-bearing liabilities.
|
|
(4)
|
Net
interest-earning assets represents total interest-earning assets less
total interest-bearing liabilities.
|
|
(5)
|
Net
interest margin represents net interest income (tax equivalent) divided by
average total interest-earning
assets.
|
The
following table presents the dollar amount of changes in interest income (on a
fully tax-equivalent basis) and interest expense for the major categories of our
interest-earning assets and interest-bearing liabilities. Information is
provided for each category of interest-earning assets and interest-bearing
liabilities with respect to (i) changes attributable to changes in volume (i.e.,
changes in average balances multiplied by the prior-period average rate) and
(ii) changes attributable to rate (i.e., changes in average rate multiplied by
prior-period average balances). For purposes of this table, changes attributable
to both rate and volume, which cannot be segregated, have been allocated
proportionately to the change due to volume and the change due to
rate.
|
2009 vs. 2008
|
2008 vs. 2007
|
|||||||||||||||||||||||
|
Increase
(Decrease) Due
|
Total
|
Increase
(Decrease) Due
|
Total
|
|||||||||||||||||||||
|
to
|
Increase
|
to
|
Increase
|
|||||||||||||||||||||
|
Volume
|
Rate
|
(Decrease)
|
Volume
|
Rate
|
(Decrease)
|
|||||||||||||||||||
|
(Dollars
in thousands)
|
||||||||||||||||||||||||
|
Interest-earning
assets:
|
||||||||||||||||||||||||
|
Loans
|
$ | 3,781 | $ | (14,266 | ) | $ | (10,485 | ) | $ | 7,321 | $ | (9,628 | ) | $ | (2,307 | ) | ||||||||
|
Securities
taxable
|
(2,585 | ) | (3,810 | ) | (6,395 | ) | (4,262 | ) | 2,730 | (1,532 | ) | |||||||||||||
|
Securities
tax exempt
|
1,233 | (175 | ) | 1,058 | 1,627 | (15 | ) | 1,612 | ||||||||||||||||
|
Federal
Reserve Bank
|
- | 144 | 144 | - | - | - | ||||||||||||||||||
|
Other
earning assets
|
(479 | ) | (865 | ) | (1,344 | ) | 76 | 72 | 148 | |||||||||||||||
|
Total
interest-earning assets
|
1,950 | (18,972 | ) | (17,022 | ) | 4,762 | (6,841 | ) | (2,079 | ) | ||||||||||||||
|
Interest-bearing
liabilities:
|
||||||||||||||||||||||||
|
NOW
deposits
|
197 | (542 | ) | (345 | ) | 145 | 248 | 393 | ||||||||||||||||
|
Savings
deposits
|
32 | (517 | ) | (485 | ) | (100 | ) | (587 | ) | (687 | ) | |||||||||||||
|
Money
market deposits
|
1,323 | (3,915 | ) | (2,592 | ) | 775 | (2,147 | ) | (1,372 | ) | ||||||||||||||
|
Certificates
of deposit
|
750 | (7,297 | ) | (6,547 | ) | (1,869 | ) | (4,560 | ) | (6,429 | ) | |||||||||||||
|
Senior
Debt
|
- | 1,269 | 1,269 | - | - | - | ||||||||||||||||||
|
Borrowings
|
(5,899 | ) | (1,323 | ) | (7,222 | ) | 1,470 | (6,621 | ) | (5,151 | ) | |||||||||||||
|
Total
interest-bearing liabilities
|
(3,597 | ) | (12,325 | ) | (15,922 | ) | 421 | (13,667 | ) | (13,246 | ) | |||||||||||||
|
Less
tax equivalent adjustment
|
423 | (53 | ) | 370 | 565 | - | 565 | |||||||||||||||||
|
Change
in net interest income
|
$ | 5,124 | $ | (6,594 | ) | $ | (1,470 | ) | $ | 3,776 | $ | 6,826 | $ | 10,602 | ||||||||||
Analysis
of Net Interest Income
Net
interest income is the difference between interest income on interest-earning
assets and interest expense on interest-bearing liabilities. Net interest income
depends on the relative amounts of interest-earning assets and interest-bearing
liabilities and the interest rates earned or paid on them,
respectively.
Comparison of Operating
Results for the Years Ended September 30, 2009 and September 30,
2008
Net
income for the year ended September 30, 2009 was $25.9 million. This
compares to $23.8 million for the year ended September 30,
2008. Diluted earnings per share were $.67 for the year ended
September 30, 2009 compared to $0.61 for the prior fiscal year.
Interest
Income. Interest income on a tax equivalent basis for the year
ended September 30, 2009 decreased to $135.6 million, a decrease of $17.0
million, or 11.2%, compared to the prior year. The decrease was
primarily due to declines in general market interest rates on variable rate
loans, sales of taxable securities in which gains of $18.1 million were realized
and the proceeds reinvested at lower rates, as well as a decline in the average
balances of taxable securities. Average interest-earning assets for
the year ended September 30, 2009 were $2.6 billion, an increase of $70.0
million, or 2.8%, over average interest-earning assets for the year ended
September 30, 2008 of $2.5 billion. Average loan balances grew by
$56.0 million, balances at the Federal Reserve Bank was $56.6 million and
average balances of other earning assets decreased by $8.0 million, primarily
FHLB stock. On a tax-equivalent basis, average yields on interest
earning assets decreased by 83 basis points to 5.28% for the year ended
September 30, 2009, from 6.11% for the year ended September 30,
2008. The re-pricing of floating rate assets, the sale of securities
and a larger cash position were the primary reasons for the decrease in asset
yields.
Interest
income on loans for the year ended September 30, 2009, decreased 9.7% to $97.1
million from $107.6 million for the prior fiscal year. Interest
income on commercial loans for the year ended September 30, 2009 decreased to
$56.6 million, as compared to commercial loan interest income of $63.5 million
for the prior fiscal year. Average balances of commercial loans grew
$59.7 million to $961.2 million, with a 116 basis point decrease in the average
yield. The decrease in yield relates to the decline in the prime rate
of 175 basis points during fiscal 2009. Commercial loans adjustable
with the prime rate totaled $367.0 million at September 30,
2009. Interest income on consumer loans decreased by $2.4 million, or
16% and $174.1 million of consumer loans adjust with the prime
rate. Income earned on residential mortgage loans was $28.7 million
for the year ended September 30, 2009, down $1.2 million, from the prior
year.
Tax-equivalent
interest income on securities, balances at Federal Reserve Bank and other
earning assets decreased to $38.5 million for the year ended September 30, 2009,
compared to $45.0 million for the prior year. This was due to a tax-equivalent
decrease of 83 basis points in yields along with a $34.6 million decline in the
average balances of securities which was offset in part by a $56.6 million
increase in balances at the Federal Reserve Bank. As noted above, the Company
sold $539.3 million in securities and recorded $18.1 million in gains on the
sales, further during fiscal 2009, $176.2 million in securities matured and the
proceeds were reinvested at current market rates.
Interest
Expense. Interest expense for the year ended September 30,
2009 decreased by $15.9 million to $37.7 million, a decrease of 29.7% compared
to interest expense of $53.6 million for the prior fiscal year. The decrease in
interest expense was primarily due to the significant decrease in the average
rates paid on interest-bearing deposits for the year ended September 30,
2009. Rates paid on interest bearing liabilities decreased to 1.81%
from 2.62% in fiscal 2008. The average interest rate paid on
certificates of deposit decreased by 127 basis points to 2.46% for the year
ended September 30, 2009, from 3.73% for the prior year. The
average interest rate paid on savings decreased to 0.21% for the year ended
September 30, 2009 from 0.35% paid during fiscal 2008. The average rate paid on
money market rates also declined, 114 basis points to 0.72% for the year ended
September 30, 2009. The rates paid on NOW accounts decreased 25 basis
points for fiscal 2009 as compared to fiscal 2008. By comparison,
this average cost of borrowings decreased 21 basis points, which reflects a
higher proportion of fixed rate borrowings outstanding in both
years.
Net Interest
Income for the fiscal year ended September 30, 2009 was $93.9 million,
compared to $95.3 million for the year ended September 30, 2008. The net
interest margin decreased by 15 basis points to 3.81%, while the net
interest spread decreased by 3 basis points to 3.46%. The
Bank’s average cost of interest-bearing liabilities has decreased, although the
average asset yields decreased faster due to the level of variable rate loans
and sales of securities during 2009. Further, the greater increase of interest
earning assets compared to interest bearing liabilities partially offset the
decline in net interest income.
Provision for
Loan Losses. We recorded $17.6 million and $7.2 million in loan loss
provisions for the years ended September 30, 2009 and September 30, 2008,
respectively. At September 30, 2009, the allowance for loan losses totaled $30.1
million, or 1.76% of the loan portfolio, compared to $23.1 million, or 1.33% of
the loan portfolio at September 30, 2008. Net charge-offs for the years ended
September 30, 2009 and 2008 were $10.7 million and $4.5 million, respectively
(an annual rate of 0.62% and 0.28%, respectively, of the average loan
portfolio). Our credit-scored small business loan portfolio continued to account
for the majority of our charge-offs. During the year we recorded net charge-offs
of $6.8 million in this portfolio, on average outstanding balances of $104
million.
Our
substandard loans grew substantially during fiscal 2009. At September
30, 2009, substandard loans totaled $89.4 million, up from $23.8 million at
September 30, 2008. The bulk of the increase came from downgrades in
the ADC portfolio, as home sales remain depressed and more borrowers are feeling
stress in liquidity resources. Our non-performing loans increased to
$26.5 million at September 30, 2009 from $16.9 million at September 30, 2008, an
increase of $9.4 million. The increase was driven by an increase in
ADC loans of $5.7 million, $3.1 million in residential mortgage loans, and $1.8
million in commercial mortgage loans, with $1.6 million transferred from the
non-performing category into other real estate owned during fiscal
2009. The substantially greater increase in substandard loans
compared to nonperforming loans resulted from the underlying status of ADC
loans. The substandard classification for many of these loans is due
to delayed progress in the projects and stress on liquidity reserves or expected
outside (non-project related) cash flows. These loans, however,
continue to pay interest on a current basis and do not otherwise warrant a
non-accrual classification. We increased provisions for loan losses
to account for increased net charge-offs; growth in the criticized (special
mention) and classified loans in the portfolio; and increased factors allocated
to the non-criticized or classified ADC and residential mortgage
portfolios. All significant loans classified substandard or special
mention are reviewed for impairment, under applicable accounting and regulatory
standards. Specific reserves for impairment were $1.3 million at
September 30, 2008 and $2.3 million at September 30, 2009. Specific reserves are
established when current information indicates that the entire book balance of a
loan is probably not recoverable, but there is sufficient uncertainty about the
actual occurrence of a loss or the amount of any loss to be
incurred.
Non-interest
income consists primarily of income on securities sales, banking fees and
service charges, net increases in the cash surrender value of bank-owned life
insurance (“BOLI”) contracts, title insurance fees and investment management
fees. Non-interest income was $40.0 million for the fiscal year ended September
30, 2009 compared to $21.0 million at September 30,
2008. During the year ended September 30, 2009, the Company
recorded gains on sales of investment securities totaling $18.1 million compared
to $983,000 for the prior year. Periodic reviews of current
prepayment speeds are performed in order to ascertain whether prepayment
estimates require modification that would cause amortization or accretion
adjustments. As a result of our reviews, we anticipated an
acceleration of prepayments. Management sold $453.2 million in
mortgage backed securities and realized $16.7 million in gains on the
sales. Such proceeds were reinvested in securities with yields which
were lower than the recorded yields of the securities sold and a more
diversified risk profile. Deposit fees and service charges decreased
by $36,000, or .29%. Income derived from the Company’s BOLI investments
increased by $923,000, or 50.4%, due to $723 thousand in death benefit proceeds
received in 2009. Title insurance fee income derived from the Hardenburgh
Abstract Company, Inc. increased $86 thousand due to the second quarter increase
in residential mortgage originations. Investment management fees decreased $436
thousand which is related to decreased balances under
management. During fiscal 2009 the Company originated and sold $49.7
million in residential mortgage loans and recorded $1.0 million in
gains. No gains on loan sales were recorded in 2008.
Non-interest
expense consists primarily of salaries and employee benefits, stock-based
compensation, occupancy and office expenses, advertising and promotion expense,
professional fees, intangible assets amortization, data processing expenses and
FDIC/other regulatory assessments. Non-interest expense for the fiscal year
ended September 30, 2009 increased by $4.7 million, or 6.2% to $80.2 million,
compared to $75.5 million for the same period in 2008. The increase was
primarily attributable to FDIC assessments of $3.4 million, which included
increased assessments and the special assessment imposed as of June 30, 2009,
which were due to the losses experienced by the FDIC bank closures as a result
of the recession. Also contributing to the increase were employee
benefits. Compensation and employee benefits increased by $2.5 million, or 6.7%,
to $39.5 million for the year ended September 30, 2009. The Company
experienced increases in its health insurance programs and pension expense even
though the pension plan is frozen. Occupancy and office operations
increased $368 thousand, or 3.0%, as the Company invested in branch relocations
in 2008 and 2009. Stock-based compensation decreased by $.9 million due to lower
acceleration of vesting of restricted stock awards and its first step ESOP loan
maturing in December 2007, requiring less share allocations going forward.
Marketing expenses decreased $245 thousand to $3.1 million at September 30, 2009
as compared to $3.3 million at September 30, 2008 due primarily to the 2008
production costs associated with our media campaigns.
Income
Taxes. Income tax expense was $10.2 million for the fiscal year ended
September 30, 2009 compared to $9.9 million for fiscal 2008, representing
effective tax rates of 28.2% and 29.4%, respectively. The lower tax rate in 2009
was primarily due to the continued shift to tax-exempt securities, the maturity
of the first-step ESOP loan, which was primarily non-deductible expense and the
non-taxable BOLI payout.
Comparison of Operating
Results for the Years Ended September 30, 2008 and September 30,
2007
Net
income for the year ended September 30, 2008 was $23.8 million. This
compares to $19.6 million for the year ended September 30,
2007. Diluted earnings per share were $0.61 for the year ended
September 30, 2008 compared to $0.48 for the prior fiscal year.
Interest
Income. Interest income for the year ended September 30, 2008
decreased to $149.0 million, a decrease of $2.6 million, or 1.7%, compared to
the prior year. The decrease was primarily due to declines in general
market interest rates on variable rate loans, as well as a decline in the
average balances of taxable securities. Average interest-earning
assets for the year ended September 30, 2008 were $2.5 billion, an increase of
$41.9 million, or 1.7%, over average interest-earning assets for the year ended
September 30, 2007 of $2.5 billion. Average loan balances grew by
$103.1 million and average balances of securities and other earning assets
decreased by $61.3 million. On a tax-equivalent basis, average yields
on interest earning assets decreased by 18 basis points to 6.11% for the year
ended September 30, 2008, from 6.29% for the year ended September 30,
2007. The repricing of floating rate assets was the primary reason
for the decrease in asset yields.
Interest
income on loans for the year ended September 30, 2008, decreased 2.1% to $107.6
million from $109.9 million for the prior fiscal year. Interest
income on commercial loans for the year ended September 30, 2008 decreased to
$63.5 million, from commercial loan interest income of $64.9 million for the
prior fiscal year. Average balances of commercial loans grew $71.9
million to $901.6 million, with a 79 basis point decrease in the average
yield. The decrease in yield relates to the decline in the prime rate
of 2.75% during fiscal 2008. Commercial loans adjustable with the
prime rate totaled $298.2 million at September 30, 2008. Interest
income on consumer loans decreased by $2.5 million, or 14.7% and $154.5 million
of consumer loans adjust with the prime rate. Income earned on
residential mortgage loans was $29.9 million for the year ended September 30,
2008, up $1.6 million, or 5.7%, from the prior year.
Tax-equivalent
interest income on securities and other earning assets increased to $45.0
million for the year ended September 30, 2008, compared to $44.8 million for the
prior year. This was due to a tax-equivalent increase of 37 basis points in
yields offset in part by a $62.3 million decline in the average balances of
securities and other earning assets. During fiscal 2008 $92.5 million
matured and were reinvested at current market rates.
Interest
Expense. Interest expense for the year ended September 30,
2008 decreased by $13.2 million to $53.6 million, a decrease of 19.8% compared
to interest expense of $66.9 million for the prior fiscal year. The decrease in
interest expense was primarily due to a decrease in the average rates paid on
interest-bearing liabilities for the year ended September 30, 2008 of 2.62%
compared to 3.33% in fiscal 2007. The average interest rate paid on
certificates of deposit decreased by 80 basis points to 3.73% for the year ended
September 30, 2008, from 4.53% for the prior year. The average
interest rate paid on savings decreased to 0.35% for the year ended September
30, 2008 from 0.51% paid during fiscal 2007. The average rate paid on money
market rates also declined, 78 basis points to 1.86% for the year ended
September 30, 2008. Due to increases in municipal deposits the
average rates paid on NOW accounts increased 14 basis points for fiscal 2008 as
compared to fiscal 2007. Furthermore, this average cost of borrowings decreased
102 basis points which reflect the general market conditions during fiscal
2008.
Net Interest
Income for the fiscal year ended September 30, 2008 was $95.3 million,
compared to $84.7 million for the year ended September 30, 2007. The net
interest margin increased by 39 basis points to 3.96%, while the net interest
spread increased by 52 basis points to 3.49%. The 10-year US treasury
rate was an average of 4.72% for the fiscal year ended September 30, 2007
compared to 3.90% for the year ended September 30, 2008. The Bank’s
average cost of interest-bearing liabilities has decreased and, although the
average asset yields also decreased during this period, they did so at a slower
pace due to the asset/liability mix of the Company’s balance sheet. Further, the
greater increase of interest earning assets compared to interest bearing
liabilities improved net interest income.
Provision for
Loan Losses. We recorded $7.2 million and $1.8 million in loan loss
provisions for the year ended September 30, 2008 and September 30, 2007,
respectively. At September 30, 2008, the allowance for loan losses totaled $23.1
million, or 1.33% of the loan portfolio, compared to $20.4 million, or 1.24% of
the loan portfolio at September 30, 2007. Net charge-offs for the years ended
September 30, 2008 and 2007 were $4.5 million and $1.8 million, respectively (an
annual rate of 0.28% and 0.12%, respectively, of the average loan portfolio).
Our credit-scored small business loan portfolio continued to account for the
large majority of our charge-offs. During the year we recorded net charge-offs
of $3.5 million in this portfolio, on average outstanding balances of $99.9
million. While we respond promptly to any loans that are delinquent, we also
monitor the portfolio to identify loans that are showing signs of weakness other
than delinquencies. During the year we also moderately tightened credit
standards in our underwriting process, in particular with applicants in
industries we have identified as particularly vulnerable in this economy. Our
non-performing loans increased to $16.9 million at September 30, 2008 from $7.3
million at September 30, 2007.
We
increased the provision for loan losses to reflect the increase in charge-offs
and non-performing loans. We also increased the provision for loan losses due to
data showing slowing sales and declining values in one-to-four family homes in
our market area, increasing unemployment, and credit and liquidity concerns in
the financial markets, leading to an overall downturn in the economy. Based on
our experience in integrating the loan portfolios acquired in the Ellenville and
Warwick acquisitions in 2004, and further analysis of delinquency trends in our
commercial mortgage portfolio, we decreased the percentage estimate of losses
for the overall commercial mortgage and noncredit-scored commercial and
industrial portfolios. Overall growth in the portfolio, particularly in the
commercial mortgage and noncredit-scored commercial and industrial portfolios
resulted in an increase in our estimate of the required allowance for loan
losses as well.
Non-interest
income consists primarily of banking fees and service charges, and net
increases in the cash surrender value of bank-owned life insurance (“BOLI”)
contracts, title insurance fees and investment management fees. Non-interest
income was $21.0 million for the fiscal year ended September 30, 2008 compared
to $19.8 million for the prior fiscal year. Deposit fees and service charges
increased by $995,000, or 8.7%. Income derived from the Company’s BOLI
investments decreased by $212,000, or 10.4%, due to $403,000 in death benefit
proceeds received in 2007. Title insurance fee income derived from the
Hardenburgh Abstract Company, Inc. decreased $262,000 due to the continued slow
down in the real estate markets. Investment management fees increased
$191,000 which is related to increased balances under
management. During the year ended September 30, 2008, the Company
also recorded gains on sales of investment securities totaling $983,000 compared
to an $8,000 loss for the prior year.
Non-interest
expense consists primarily of salaries and employee benefits, stock-based
compensation, occupancy and office expenses, advertising and promotion expense,
professional fees, intangible assets amortization and data processing expenses.
Non-interest expense for the fiscal year ended September 30, 2008 increased by
$910,000, or 1.2% to $75.5 million, compared to $74.6 million for the same
period in 2007. Compensation and employee benefits increased by $3.6 million, or
10.6%, to $37.0 million for the year ended September 30, 2008. The
increase was primarily attributable to increases in employee benefits, and
additional employees hired in 2008, as the Company experienced increases in its
health insurance programs, 401K matching and profit sharing expenses and added
resources to its municipal bank business and opened a new branch
location. Occupancy and office operations increased $998,000, or
8.7%, as the Company invested in branch relocations in
2008. Stock-based compensation decreased by $1.9 million due to lower
acceleration of vesting of restricted stock awards and its first step ESOP loan
maturing in December 2007 requiring less share allocations going forward.
Marketing expenses decreased $899,000 to $3.3 million at September 30, 2008 as
compared to $4.2 million at September 30, 2007 due primarily to the production
costs associated with our 2007 media campaigns.
Income
Taxes. Income tax expense was $9.9 million for the fiscal year ended
September 30, 2008 compared to $8.6 million for fiscal 2007, representing
effective tax rates of 29.4% and 30.4%, respectively. The lower tax rate in 2008
was primarily due to the continued shift to tax-exempt securities, as well as
the maturity of the first-step ESOP loan, which was primarily non-deductible
expense.
Off-Balance
Sheet Arrangements and Aggregate Contractual Obligations
In the
normal course of operations, the Company engages in a variety of financial
transactions that, in accordance with generally accepted accounting principles,
are not recorded in the financial statements, or are recorded in amounts that
differ from the notional amounts. These transactions involve, to varying
degrees, elements of credit, interest rate, and liquidity risk. Such
transactions are used by the Company for general corporate purposes or for
customer needs.
The
Company’s off-balance sheet arrangements, which principally include lending
commitments, are described below. At September 30, 2009 and 2008, the Company
had no interests in non-consolidated special purpose entities.
Lending
Commitments.
Lending commitments include loan commitments, letters of credit and
unused credit lines. These instruments are not recorded in the consolidated
balance sheet until funds are advanced under the commitments. The Company
provides these lending commitments to customers in the normal course of
business.
For
commercial customers, loan commitments generally take the form of revolving
credit arrangements to finance customers’ working capital requirements, or for
development and construction in the case of real estate businesses. For retail
customers, loan commitments are generally lines of credit secured by residential
property. At September 30, 2009, commercial and retail loan commitments totaled
$133.5 million. Approved closed undrawn lines of credit totaled $136.1 million,
$151.0 million and $15.4 million for commercial, retail accounts, and overdraft
protection lines, respectively. Letters of credit totaled $24.6
million. Letters of credit issued by the Company generally are standby letters
of credit. Standby letters of credit are commitments issued by the Company on
behalf of its customer/obligor in favor of a beneficiary that specify an amount
the Company can be called upon to pay upon the beneficiary’s compliance with the
terms of the letter of credit. These commitments are primarily issued
in favor of local municipalities to support the obligor’s completion of real
estate development projects. The credit risk involved in issuing
letters of credit is essentially the same as that involved in extending loan
facilities to customers. Standby letters of credit are conditional commitments
to support performance, typically of a contract or the financial integrity, of a
customer to a third party, and represent an independent undertaking by the
Company to the third party.
Provident
Bank applies essentially the same credit policies and standards as it does in
the lending process when making these commitments. See Note 15 to “Consolidated
Financial Statements” in Item 8 hereof for additional information regarding
lending commitments.
Contractual
Obligations. In
the ordinary course of our operations, we enter into certain contractual
obligations. Such obligations include operating leases for premises and
equipment.
Payments Due by
Period. The following table summarizes our significant fixed and
determinable contractual obligations and other funding needs by payment date at
September 30, 2009. The payment amounts represent those amounts due to the
recipient and do not include any unamortized premiums or discounts or other
similar carrying amount adjustments.
|
Payments Due by Period
|
||||||||||||||||||||
|
Less
than
|
One
to Three
|
Three
to Five
|
More
Than
|
|||||||||||||||||
|
Contractual Obligations
|
One Year
|
Years
|
Years
|
Five Years
|
Total
|
|||||||||||||||
|
(Dollars
in thousands)
|
||||||||||||||||||||
|
FHLB
and other borrowings
|
$ | 62,677 | $ | 118,915 | $ | 31,639 | $ | 268,891 | $ | 482,122 | ||||||||||
|
Letters
of credits
|
5,912 | 7,119 | 947 | 10,591 | 24,569 | |||||||||||||||
|
Undrawn
lines of credit
|
302,455 | - | - | - | 302,455 | |||||||||||||||
|
Operating
leases
|
2,351 | 6,919 | 6,807 | 19,070 | 35,147 | |||||||||||||||
|
Total
|
$ | 373,395 | $ | 132,953 | $ | 39,393 | $ | 298,552 | $ | 844,293 | ||||||||||
|
Commitments
to extend credit
|
$ | 97,105 | 31,461 | 3,943 | 1,038 | $ | 133,547 | |||||||||||||
Impact
of Inflation and Changing Prices
The
financial statements and related notes of Provident New York Bancorp have been
prepared in accordance with U.S. GAAP. U.S. GAAP generally requires the
measurement of financial position and operating results in terms of historical
dollars without consideration for changes in the relative purchasing power of
money over time due to inflation. The impact of inflation is reflected in the
increased cost of our operations. Unlike industrial companies, our assets and
liabilities are primarily monetary in nature. As a result, changes in market
interest rates have a greater impact on performance than the effects of
inflation.
Liquidity
and Capital Resources
The
overall objective of our liquidity management is to ensure the availability of
sufficient cash funds to meet all financial commitments and to take advantage of
investment opportunities. We manage liquidity in order to meet deposit
withdrawals on demand or at contractual maturity, to repay borrowings as they
mature, and to fund new loans and investments as opportunities
arise.
Our
primary sources of funds are deposits, principal and interest payments on loans
and securities, wholesale borrowings, the proceeds from maturing securities and
short-term investments, and the proceeds from the sales of loans and securities.
The scheduled amortizations of loans and securities, as well as proceeds from
borrowings, are predictable sources of funds. Other funding sources, however,
such as deposit inflows, mortgage prepayments and mortgage loan sales are
greatly influenced by market interest rates, economic conditions and
competition.
Our cash
flows are derived from operating activities, investing activities and financing
activities as reported in the Consolidated Statements of Cash Flows in our
consolidated financial statements. Our primary investing activities are the
origination of commercial real estate and residential one- to four-family loans,
and the purchase of investment securities and mortgage-backed securities. During
the years ended September 30, 2009, 2008 and 2007, our loan originations,
including origination of loans held for sale, totaled $450.6 million, $596.6
million and $626.7 million, respectively. Purchases of securities available for
sale totaled $708.7 million, $263.9 million and $179.0 million for the years
ended September 30, 2009, 2008 and 2007, respectively. Purchases of securities
held to maturity totaled $25.1 million, $19.2 million and $7.8 million for the
years ended September 30, 2009, 2008 and 2007, respectively. These activities
were funded primarily by borrowings and by principal repayments on loans and
securities. Loan origination commitments totaled $133.5 million at September 30,
2009, and consisted of $125.6 million at adjustable or variable rates and $7.9
million at fixed rates. Unused lines of credit granted to customers were $302.5
million at September 30, 2009. We anticipate that we will have sufficient funds
available to meet current loan commitments and lines of credit.
The
Company’s investments in BOLI are considered illiquid and are therefore
classified as other assets. Earnings from BOLI are derived from the net increase
in cash surrender value of the BOLI contracts and the proceeds from the payment
on the insurance policies, if any. The recorded value of BOLI
contracts totaled $49.6 million and $47.6 million at September 30, 2009 and
September 30, 2008, respectively.
Deposit
flows are generally affected by the level of market interest rates, the interest
rates and other conditions on deposit products offered by our banking
competitors, and other factors. The net increase/ (decrease) in total deposits
was $93.1 million, $275.5 million and $(15.9) million for the years ended
September 30, 2009, 2008 and 2007, respectively. Certificates of deposit that
are scheduled to mature in one year or less from September 30, 2009 totaled
$439.6 million. Based upon prior experience and our current pricing strategy,
management believes that a significant portion of such deposits will remain with
us, although we may be required to compete for many of the maturing certificates
in a highly competitive environment.
Credit
markets improved significantly during fiscal 2009 from the dire conditions that
existed at September 2008. Credit spreads narrowed steadily during
the past year and many are very near historical
levels. Notwithstanding these improvements loan demand remains muted
causing liquidity to increase. Furthermore, the extremely low
interest rate environment has enhanced our deposit growth which has also
strengthened our liquidity position. Many banks are experiencing a
situation similar to ours resulting in the industry liquidity to be at
significantly elevated levels. However, much of this liquidity is
held in the form of very short-term securities and non-maturity deposit
accounts. The preference of depositors to stay short could portend
potential liquidity reductions in the future and possibly put pressure on us to
raise rates in the future to retain these funds. Therefore, we continue to view
the credit markets and overall economic conditions as fragile thereby warranting
maintenance of higher than normal liquidity levels.
We
generally remain fully invested and utilize additional sources of funds through
Federal Home Loan Bank of New York (“FHLB”) advances and other sources of which
$482.1 million was outstanding at September 30, 2009. At September 30, 2009, we
had the ability to borrow an additional $200.0 million under our credit
facilities with the Federal Home Loan Bank. The Bank may borrow an additional
$151.4 million by pledging securities not required to be pledged for other
purposes as of September 30, 2009. Further, at September 30,
2009 we had only $20.6 million in Brokered Certificates of Deposit (including
certificates of deposit accounts registers service (CDAR’s) reciprocal CD’s of
$10.6 million) and have relationships with several brokers to utilize these
sources of funding should conditions warrant further sources of
funds. Provident Bank is subject to regulatory capital
requirements that are discussed in “Capital Requirements” under
“Regulation”.
Overall
liquidity is represented by the following sources of funds (in thousands) as of
September 30, 2009:
|
Cash
and Due from Banks
|
$ | 160,408 | ||
|
Investment
Securities
|
151,400 | |||
|
Available
advances from FHLB
|
200,000 | |||
|
Total
immediate funding
|
$ | 511,808 |
CAUTIONARY
STATEMENT REGARDING FORWARD-LOOKING INFORMATION
We make
statements in this Report, and we may from time to time make other statements,
regarding our outlook or expectations for earnings, revenues, expenses and/or
other matters regarding or affecting Provident New York Bancorp that are
forward-looking statements within the meaning of the Private Securities
Litigation Reform Act. Forward-looking statements are typically
identified by words such as “believe,” “expect,” “anticipate,” “intend,”
“outlook,” “estimate,” “forecast,” “project” and other similar words and
expressions.
Forward-looking
statements are subject to numerous assumptions, risks and uncertainties, which
change over time. Forward-looking statements speak only as of the
date they are made. We do not assume any duty and do not undertake to update our
forward-looking statements. Because forward-looking statements are
subject to assumptions and uncertainties, actual results or future events could
differ, possibly materially, from those that we anticipated in our
forward-looking statements and future results could differ materially from our
historical performance.
Our
forward-looking statements are subject to the following principal risks and
uncertainties. We provide greater detail regarding some of these factors
elsewhere in this Report, including in the Risk Factors and Risk Management
sections. Our forward-looking statements may also be subject to other
risks and uncertainties, including those discussed elsewhere in this Report or
in our other filings with the SEC.
|
|
·
|
Our
business and operating results are affected by business and economic
conditions generally or specifically in the principal markets in which we
do business. We are affected by changes in our customers’ and
counterparties’ financial performance, as well as changes in customer
preferences and behavior, including as a result of changing business and
economic conditions.
|
|
|
·
|
The
values of our assets and liabilities, as well as our overall financial
performance, are also affected by changes in interest rates or in
valuations in the debt and equity markets. Actions by the Federal Reserve
and other government agencies, including those that impact money supply
and market interest rates, can affect our activities and financial
results.
|
|
|
·
|
Competition
can have an impact on customer acquisition, growth and retention, as well
as on our credit spreads and product pricing, which can affect market
share, deposits and revenues.
|
|
|
·
|
Our
ability to implement our business initiatives and strategies could affect
our financial performance over the next several
years.
|
|
|
·
|
Our
ability to grow successfully through acquisitions is impacted by a number
of risks and uncertainties related both to the acquisition transactions
themselves and to the integration of the acquired businesses into our
Company after closing.
|
|
|
·
|
Legal
and regulatory developments could have an impact on our ability to operate
our businesses or our financial condition or results of operations or our
competitive position or reputation. Reputational impacts, in
turn, could affect matters such as business generation and retention, our
ability to attract and retain management, liquidity and funding. These
legal and regulatory developments could include: (a) the unfavorable
resolution of legal proceedings or regulatory and other governmental
inquiries; (b) increased litigation risk from recent regulatory and other
governmental developments; (c) the results of the regulatory examination
process, our failure to satisfy the requirements of agreements with
governmental agencies, and regulators’ future use of supervisory and
enforcement tools; (d) legislative and regulatory reforms, including
changes to laws and regulations involving tax, pension, and the protection
of confidential customer information; and (e) changes in accounting
policies and principles.
|
|
|
·
|
Our
business and operating results are affected by our ability to identify and
effectively manage risks inherent in our businesses, including, where
appropriate, through the effective use of third-party insurance and
capital management techniques.
|
|
|
·
|
Our
ability to anticipate and respond to technological changes can have an
impact on our ability to respond to customer needs and to meet competitive
demands.
|
|
|
·
|
Our
business and operating results can be affected by widespread natural
disasters, terrorist activities or international hostilities, either as a
result of the impact on the economy and financial and capital markets
generally or on us or on our customers, suppliers or other counterparties
specifically.
|
|
|
·
|
Recent
and future legislation and regulatory actions responding to instability
and volatility in the credit markets may significantly affect our
operations, financial condition and earnings. Future
legislative or regulatory actions could impair our rights against
borrowers, result in increased credit losses, and significantly increase
our operating expenses.
|
|
|
·
|
The
current levels of volatility in the market are unprecedented and have
adversely affected us and the financial services industry as a
whole. The market turmoil and tightening of credit have led to
an increased level of commercial and consumer delinquencies, lack of
consumer confidence, increased market volatility and widespread reduction
of business activity generally. The resulting economic pressure
on consumers and lack of confidence in the financial markets affect our
business, financial condition and results of
operations.
|
ITEM
7A. Quantitative and Qualitative
Disclosures about Market Risk
Management
believes that our most significant form of market risk is interest rate risk.
The general objective of our interest rate risk management is to determine the
appropriate level of risk given our business strategy, and then manage that risk
in a manner that is consistent with our policy to limit the exposure of our net
interest income to changes in market interest rates. Provident Bank’s
Asset/Liability Management Committee (“ALCO”), which consists of certain members
of senior management, evaluates the interest rate risk inherent in certain
assets and liabilities, our operating environment, and capital and liquidity
requirements, and modifies our lending, investing and deposit gathering
strategies accordingly. A committee of the Board of Directors reviews the ALCO’s
activities and strategies, the effect of those strategies on our net interest
margin, and the effect that changes in market interest rates would have on the
economic value of our loan and securities portfolios as well as the intrinsic
value of our deposits and borrowings.
We
actively evaluate interest rate risk in connection with our lending, investing,
and deposit activities. We emphasize the origination of commercial mortgage
loans, commercial business loans, ADC loans, and residential fixed-rate mortgage
loans that are repaid monthly and bi-weekly, fixed-rate commercial mortgage
loans, adjustable-rate residential and consumer loans. Depending on market
interest rates and our capital and liquidity position, we may retain all of the
fixed-rate, fixed-term residential mortgage loans that we originate or we may
sell or securitize all, or a portion of such longer-term loans, generally on a
servicing-retained basis. We also invest in shorter-term securities, which
generally have lower yields compared to longer-term investments. Shortening the
average maturity of our interest-earning assets by increasing our investments in
shorter-term loans and securities may help us to better match the maturities and
interest rates of our assets and liabilities, thereby reducing the exposure of
our net interest income to changes in market interest rates. These strategies
may adversely affect net interest income due to lower initial yields on these
investments in comparison to longer-term, fixed-rate loans and
investments.
Management
monitors interest rate sensitivity primarily through the use of a model that
simulates net interest income (“NII”) under varying interest rate assumptions.
Management also evaluates this sensitivity using a model that estimates the
change in the Company and the Bank’s net portfolio value (“NPV”) over a range of
interest rate scenarios. NPV is the present value of expected cash flows from
assets, liabilities and off-balance sheet contracts. The model assumes estimated
loan prepayment rates, reinvestment rates and deposit decay rates that seem
reasonable, based on historical experience during prior interest rate
changes.
Estimated Changes
in NPV and NII. The table below sets forth, as of September
30, 2009, the estimated changes in our NPV and our NII that would result from
the designated instantaneous changes in the U.S. Treasury yield curve.
Computations of prospective effects of hypothetical interest rate changes are
based on numerous assumptions including relative levels of market interest
rates, loan prepayments and deposit decay, and should not be relied upon as
indicative of actual results.
|
Change
in Interest Rates
|
Estimated
|
Estimated
Increase (Decrease) in
NPV
|
Estimated
|
Increase
(Decrease) in Estimated
NII
|
||||||||||||||||||||||
|
(basis points)
|
NPV
|
Amount
|
Percent
|
NII
|
Amount
|
Percent
|
||||||||||||||||||||
|
(Dollars
in thousands)
|
||||||||||||||||||||||||||
| +300 | $ | 266,410 | $ | (40,259 | ) | -13.1 | % | $ | 97,416 | $ | 7,048 | 7.8 | % | |||||||||||||
| +200 | 294,475 | (12,194 | ) | -4.0 | % | 96,407 | 6,039 | 6.7 | % | |||||||||||||||||
| +100 | 308,959 | 2,290 | 0.7 | % | 93,412 | 3,044 | 3.4 | % | ||||||||||||||||||
| 0 | 306,669 | 0 | 0.0 | % | 90,368 | 0 | 0.0 | % | ||||||||||||||||||
The table
set forth above indicates that at September 30, 2009, in the event of an
immediate 200 basis point increase in interest rates, we would be expected to
experience a 4.0% decrease in NPV and a 6.7% increase in NII. Due to
the current level of interest rates management is unable to reasonably model the
impact of decreases in interest rates on NPV and NII.
Certain
shortcomings are inherent in the methodology used in the above interest rate
risk measurements. Modeling changes in NPV and NII requires making certain
assumptions that may or may not reflect the manner in which actual yields and
costs respond to changes in market interest rates. The NPV and NII table
presented above assumes that the composition of our interest-rate sensitive
assets and liabilities existing at the beginning of a period remains constant
over the period being measured and, accordingly, the data does not reflect any
actions management may undertake in response to changes in interest rates. The
table also assumes that a particular change in interest rates is reflected
uniformly across the yield curve regardless of the duration to maturity or the
repricing characteristics of specific assets and liabilities. Accordingly,
although the NPV and NII table provides an indication of our sensitivity to
interest rate changes at a particular point in time, such measurements are not
intended to and do not provide a precise forecast of the effect of changes in
market interest rates on our net interest income and will differ from actual
results.
During
the past fiscal year, the federal funds target rate declined from 2.00% to a
range of 0.00 – 0.25% as the Federal Open Market Committee (“FOMC”) cut the
target overnight lending rate three times between October, 2008 and September,
2009. U.S. Treasury yields in the two year maturities decreased by
105 basis points from 2.00% to 0.95% during fiscal year 2009 while the yield on
U.S. Treasury 10 year notes decreased 54 basis points from 3.85% to 3.31% over
the same time period. The disproportional lower rate of decrease on
longer term maturities has resulted in the 2-10 year treasury yield curve being
steeper at the end of the past fiscal year than it was when the year
began. The steeper yield curve caused a significant reduction in
rates paid on deposits and short-term borrowings as well as rates charged on
loans and other assets tied to the prime rate and similar
indices. Further, the gradual improvement in the credit markets has
enabled financial institutions to lower deposit rates significantly in
conjunction with the FOMC’s rate reductions. To fight the economic
crisis the FOMC indicated a willingness to keep the federal funds target low for
an “extended period”. Should economic conditions improve, the FOMC
could reverse direction and increase the federal funds target
rate. This could cause the shorter end of the yield curve to rise
disproportionably more than the longer end thereby resulting in margin
compression.
ITEM
8. Financial Statements and Supplementary
Data
The
following are included in this item:
|
(A)
|
Report
of Management on Internal Control Over Financial
Reporting
|
|
(B)
|
Report
of Independent Registered Public Accounting Firm on Internal Control Over
Financial Reporting
|
|
(C)
|
Report
of Independent Registered Public Accounting Firm on Financial
Statements
|
|
(D)
|
Consolidated
Statements of Financial Condition as of September 30, 2009 and
2008
|
|
(E)
|
Consolidated
Statements of Income for the years ended September 30, 2009, 2008 and
2007
|
|
(F)
|
Consolidated
Statements of Changes in Stockholders’ Equity for the years ended
September 30, 2009,
2008 and
2007
|
|
(G)
|
Consolidated
Statements of Cash Flows for the years ended September 30, 2009, 2008 and
2007
|
|
(H)
|
Notes
to Consolidated Financial
Statements
|
The
supplementary data required by this item (selected quarterly financial data) is
provided in Note 21 of the Notes to Consolidated Financial
Statements.
Report of Management on
Internal Control Over Financial Reporting
The Board
of Directors and Stockholders
Provident
New York Bancorp:
The
management of Provident New York Bancorp (“the Company”) is responsible for
establishing and maintaining effective internal control over financial
reporting. The Company's system of internal controls is designed to
provide reasonable assurance to the Company's management and board of directors
regarding the preparation and fair presentation of published financial
statements in accordance with U.S. generally accepted accounting
principles.
All
internal control systems have inherent limitations. Therefore, even those
systems determined to be effective can provide only reasonable assurance with
respect to financial statement preparation and presentation. Also, projections
of any evaluation of effectiveness to future periods are subject to the risk
that controls may become inadequate because of changes in conditions, or that
the degree of compliance with the policies or procedures may
deteriorate.
Management
assessed the Company’s internal control over financial reporting as of September
30, 2009. This assessment was based on criteria for effective internal control
over financial reporting established in Internal Control - Integrated
Framework issued by the Committee of Sponsoring Organizations of the
Treadway Commission (COSO). Based on this assessment, we have concluded that, as
of September 30, 2009, the Company’s internal control over financial reporting
is effective.
The
Company's independent registered public accounting firm has issued an audit
report on the effective operation of the Company's internal control over
financial reporting as of September 30, 2009. This report appears on the
following page.
|
By:
|
/s/
George Strayton
|
|
George
Strayton
|
|
|
President
and Chief Executive Officer
|
|
|
(Principal
Executive Officer
|
|
|
December
10, 2009
|
|
By:
|
/s/
Paul Maisch
|
|
Paul
Maisch
|
|
|
Executive
Vice President and Chief Financial Officer
|
|
|
(Principal
Financial and Accounting Officer)
|
|
|
December
10, 2009
|
Report of Independent
Registered Public Accounting Firm on Internal Control Over Financial
Reporting
Board of
Directors and Stockholders
Provident
New York Bancorp
We have
audited Provident New York Bancorp’s and subsidiaries (“the Company”) internal
control over financial reporting as of September 30, 2009, based on criteria
established in Internal
Control – Integrated Framework issued by the Committee of Sponsoring
Organizations of the Treadway Commission (COSO). Provident New York
Bancorp’s management is responsible for maintaining effective internal control
over financial reporting, and for its assessment of the effectiveness of
internal control over financial reporting, included in the accompanying Report
of Management on Internal Control Over Financial Reporting. Our
responsibility is to express an opinion on the Company's internal control over
financial reporting based on our audit.
We
conducted our audit in accordance with the standards of the Public Company
Accounting Oversight Board (United States). Those standards require
that we plan and perform the audit to obtain reasonable assurance about whether
effective internal control over financial reporting was maintained in all
material respects. Our audit included obtaining an understanding of
internal control over financial reporting, assessing the risk that a material
weakness exists, and testing and evaluating the design and operating
effectiveness of internal control based on the assessed risk, and performing
such other procedures as we considered necessary in the
circumstances. We believe that our audit provides a reasonable basis
for our opinion.
A
company's internal control over financial reporting is a process designed to
provide reasonable assurance regarding the reliability of financial reporting
and the preparation of financial statements for external purposes in accordance
with generally accepted accounting principles. A company's internal
control over financial reporting includes those policies and procedures that (1)
pertain to the maintenance of records that, in reasonable detail, accurately and
fairly reflect the transactions and dispositions of the assets of the company;
(2) provide reasonable assurance that transactions are recorded as necessary to
permit preparation of financial statements in accordance with generally accepted
accounting principles, and that receipts and expenditures of the company are
being made only in accordance with authorizations of management and directors of
the company; and (3) provide reasonable assurance regarding prevention or timely
detection of unauthorized acquisition, use, or disposition of the company's
assets that could have a material effect on the financial
statements.
Because
of its inherent limitations, internal control over financial reporting may not
prevent or detect misstatements. Also, projections of any evaluation of
effectiveness to future periods are subject to the risk that controls may become
inadequate because of changes in conditions, or that the degree of compliance
with the policies or procedures may deteriorate.
In our
opinion, Provident New York Bancorp maintained, in all material respects,
effective internal control over financial reporting as of September 30, 2009,
based on criteria established in Internal Control – Integrated
Framework issued by the Committee of Sponsoring Organizations of the
Treadway Commission (COSO).
We also
have audited, in accordance with the standards of the Public Company Accounting
Oversight Board (United States), the consolidated statements of financial
condition of Provident New York Bancorp and subsidiaries as of September 30,
2009 and 2008 and the related consolidated statements of income, changes in
stockholders’ equity and cash flows for the three years ended September 30, 2009
and our report dated December 10, 2009 expressed an unqualified opinion on those
consolidated financial statements.
|
/s/Crowe Horwath
LLP
|
Livingston,
New Jersey
December
10, 2009
Report of Independent
Registered Public Accounting Firm on Financial Statements
Board of
Directors and Stockholders
Provident
New York Bancorp
We have
audited the accompanying consolidated statements of financial condition of
Provident New York Bancorp and subsidiaries (“the Company”) as of September 30,
2009 and 2008 and the related consolidated statements of income, changes in
stockholders' equity, and cash flows for the three years in the period ended
September 30, 2009. These financial statements are the responsibility of the
Company’s management. Our responsibility is to express an opinion on these
financial statements based on our audits.
We
conducted our audits in accordance with the standards of the Public Company
Accounting Oversight Board (United States). Those standards require that we plan
and perform the audit to obtain reasonable assurance about whether the financial
statements are free of material misstatement. An audit includes examining, on a
test basis, evidence supporting the amounts and disclosures in the financial
statements. An audit also includes assessing the accounting principles used and
significant estimates made by management, as well as evaluating the overall
financial statement presentation. We believe that our audits provide a
reasonable basis for our opinion.
In our
opinion, the consolidated financial statements referred to above present fairly,
in all material respects, the financial position of Provident New York Bancorp
and subsidiaries as of September 30, 2009 and 2008 and the results of its
operations and its cash flows for the three years in the period ended September
30, 2009 in conformity with accounting principles generally accepted in the
United States of America.
We also
have audited, in accordance with the standards of the Public Company Accounting
Oversight Board (United States), the effectiveness of Provident New York
Bancorp’s internal control over financial reporting as of September 30, 2009,
based on criteria established in Internal Control - Integrated
Framework issued by the Committee of Sponsoring Organizations of the
Treadway Commission and our report dated December 10, 2009 expressed an
unqualified opinion thereon.
|
/s/Crowe Horwath
LLP
|
Livingston,
New Jersey
December
10, 2009
PROVIDENT
NEW YORK BANCORP AND SUBSIDIARIES
Consolidated
Statements of Financial Condition
(Dollars
in thousands, except per share data)
|
September
30,
|
||||||||
|
ASSETS
|
2009
|
2008
|
||||||
|
Cash
and due from banks
|
$ | 160,408 | $ | 125,810 | ||||
|
Securities
(including $521,228 and $765,334 pledged as collateral for borrowings and
deposits in 2009 and 2008, respectively):
|
||||||||
|
Available
for sale, at fair value (note3)
|
832,583 | 791,688 | ||||||
|
Held
to maturity, at amortized cost (fair value of $45,739 and $42,899 in 2009
and 2008, respectively) (note 4)
|
44,614 | 43,013 | ||||||
|
Total
securities
|
877,197 | 834,701 | ||||||
|
Loans
held for sale
|
1,213 | 189 | ||||||
|
Loans
(note 5):
|
||||||||
|
One
to four family residential mortgage loans
|
460,728 | 513,381 | ||||||
|
Commercial
real estate, commercial business and construction loans
|
991,007 | 969,432 | ||||||
|
Consumer
loans
|
251,522 | 248,740 | ||||||
|
Gross
loans
|
1,703,257 | 1,731,553 | ||||||
|
Allowance
for loan losses
|
(30,050 | ) | (23,101 | ) | ||||
|
Total
loans, net
|
1,673,207 | 1,708,452 | ||||||
|
Federal
Home Loan Bank ("FHLB") stock, at cost
|
23,177 | 28,675 | ||||||
|
Accrued
interest receivable (note 6)
|
10,472 | 10,881 | ||||||
|
Premises
and equipment, net (note 7)
|
40,692 | 36,716 | ||||||
|
Goodwill
(note 2)
|
160,861 | 160,861 | ||||||
|
Core
deposit and other intangible assets (note 2)
|
5,489 | 7,674 | ||||||
|
Bank
owned life insurance
|
49,611 | 47,650 | ||||||
|
Other
assets (notes 5, 10 and 11)
|
19,566 | 22,762 | ||||||
|
Total
assets
|
$ | 3,021,893 | $ | 2,984,371 | ||||
|
LIABILITIES
AND STOCKHOLDERS' EQUITY
|
||||||||
|
LIABILITIES
|
||||||||
|
Deposits
(note 8)
|
$ | 2,082,282 | $ | 1,989,197 | ||||
|
FHLB
and other borrowings (including repurchase agreements of $230,000 and
$260,166 in 2009 and 2008, respectively) (note 9)
|
430,628 | 566,008 | ||||||
|
Borrowing
senior unsecured note (FDIC insured) (note 9)
|
51,494 | - | ||||||
|
Mortgage
escrow funds (note 5)
|
8,405 | 7,272 | ||||||
|
Other
(note 10)
|
21,628 | 22,736 | ||||||
|
Total
liabilities
|
2,594,437 | 2,585,213 | ||||||
|
STOCKHOLDERS'
EQUITY (note 14):
|
||||||||
|
Preferred
stock, (par value $0.01 per share; 10,000,000 shares authorized; none
issued or outstanding)
|
- | - | ||||||
|
Common
stock (par value $0.01 per share; 75,000,000 shares authorized; 45,929,552
issued; 39,547,207 and 39,815,213 shares outstanding in 2009 and 2008
respectively)
|
459 | 459 | ||||||
|
Additional
paid-in capital
|
355,753 | 352,882 | ||||||
|
Unallocated
common stock held by employee stock ownership plan ("ESOP") (note
11)
|
(7,136 | ) | (7,635 | ) | ||||
|
Treasury
stock, at cost (6,382,345 shares in 2009 and 6,114,339 shares in
2008)
|
(77,290 | ) | (75,687 | ) | ||||
|
Retained
earnings
|
153,193 | 138,720 | ||||||
|
Accumulated
other comprehensive income (loss), net of taxes of $1,693 in 2009
and $(6,532) in 2008 (note 12)
|
2,477 | (9,581 | ) | |||||
|
Total
stockholders' equity
|
427,456 | 399,158 | ||||||
|
Total
liabilities and stockholders' equity
|
$ | 3,021,893 | $ | 2,984,371 | ||||
See
accompanying notes to consolidated financial statements.
PROVIDENT
NEW YORK BANCORP AND SUBSIDIARIES
Consolidated
Statements of Income
For the
years ended September 30,
(Dollars
in thousands, except per share data)
|
2009
|
2008
|
2007
|
||||||||||
|
Interest
and dividend income:
|
||||||||||||
|
Loans,
including fees
|
$ | 97,149 | $ | 107,633 | $ | 109,940 | ||||||
|
Taxable
securities
|
25,552 | 31,947 | 33,479 | |||||||||
|
Non-taxable
securities
|
7,520 | 6,832 | 5,785 | |||||||||
|
Other
earning assets
|
1,369 | 2,570 | 2,422 | |||||||||
|
Total
interest and dividend income
|
131,590 | 148,982 | 151,626 | |||||||||
|
Interest
expense:
|
||||||||||||
|
Deposits
|
18,375 | 28,344 | 36,439 | |||||||||
|
Borrowings
|
19,345 | 25,298 | 30,449 | |||||||||
|
Total
interest expense
|
37,720 | 53,642 | 66,888 | |||||||||
|
Net
interest income
|
93,870 | 95,340 | 84,738 | |||||||||
|
Provision
for loan losses
|
17,600 | 7,200 | 1,800 | |||||||||
|
Net
interest income after provision for loan losses
|
76,270 | 88,140 | 82,938 | |||||||||
|
Non-interest
income:
|
||||||||||||
|
Deposit
fees and service charges
|
12,393 | 12,429 | 11,434 | |||||||||
|
Net
gain (loss) on sale of securities
|
18,076 | 983 | (8 | ) | ||||||||
|
Title
insurance fees
|
1,005 | 919 | 1,181 | |||||||||
|
Bank
owned life insurance
|
2,755 | 1,832 | 2,044 | |||||||||
|
Gain
on sale of premises and equipment
|
517 | - | 212 | |||||||||
|
Net
gain on sales of loans
|
961 | - | 155 | |||||||||
|
Investment
management fees
|
2,576 | 3,012 | 2,821 | |||||||||
|
Other
|
1,670 | 1,867 | 2,006 | |||||||||
|
Total
non-interest income
|
39,953 | 21,042 | 19,845 | |||||||||
|
Non-interest
expense:
|
||||||||||||
|
Compensation
and employee benefits
|
39,520 | 37,045 | 33,490 | |||||||||
|
Stock-based
compensation plans
|
2,942 | 3,809 | 5,706 | |||||||||
|
Occupancy
and office operations
|
12,802 | 12,434 | 11,436 | |||||||||
|
Advertising
and promotion
|
3,093 | 3,338 | 4,237 | |||||||||
|
Professional
fees
|
3,090 | 3,339 | 3,833 | |||||||||
|
Data
and check processing
|
2,284 | 2,551 | 2,621 | |||||||||
|
Amortization
of intangible assets
|
2,185 | 2,599 | 3,039 | |||||||||
|
ATM/debit
card expense
|
2,115 | 1,936 | 1,881 | |||||||||
|
FDIC
insurance and regulatory assessments
|
4,257 | 875 | 795 | |||||||||
|
Other
|
7,899 | 7,574 | 7,552 | |||||||||
|
Total
non-interest expense
|
80,187 | 75,500 | 74,590 | |||||||||
|
Income
before income tax expense
|
36,036 | 33,682 | 28,193 | |||||||||
|
Income
tax expense
|
10,175 | 9,904 | 8,566 | |||||||||
|
Net
income
|
$ | 25,861 | $ | 23,778 | $ | 19,627 | ||||||
|
Weighted
average common shares:
|
||||||||||||
|
Basic
|
38,537,881 | 38,907,372 | 40,782,643 | |||||||||
|
Diluted
|
38,705,837 | 39,226,641 | 41,266,816 | |||||||||
|
Earnings
per common share (note 13)
|
||||||||||||
|
Basic
|
$ | 0.67 | $ | 0.61 | $ | 0.48 | ||||||
|
Diluted
|
$ | 0.67 | $ | 0.61 | $ | 0.48 | ||||||
See
accompanying notes to consolidated financial statements.
PROVIDENT
BANCORP, INC. AND SUBSIDIARIES
Consolidated
Statements of Changes in Stockholders’ Equity
Years
Ended September 30, 2009, 2008 and 2007
(Dollars
in thousands, except per share data)
|
Number
of
Shares
|
Common
Stock
|
Additional
Paid-in
Capital
|
Unallocated
ESOP
Shares
|
Treasury
Stock
|
Retained
Earnings
|
Accumulated
Other
Comprehensive
Income
(loss)
|
Total
Stockholders’
Equity
|
|||||||||||||||||||||||||
|
Balance
at September 30, 2006
|
42,699,046 | $ | 459 | $ | 343,574 | $ | (9,099 | ) | $ | (36,973 | ) | $ | 114,927 | $ | (7,602 | ) | $ | 405,286 | ||||||||||||||
|
Implementation
of SAB 108
|
— | — | (69 | ) | — | — | 361 | 292 | ||||||||||||||||||||||||
|
Balance
as adjusted at October 1, 2006
|
42,699,046 | 459 | 343,505 | (9,099 | ) | (36,973 | ) | 115,288 | (7,602 | ) | 405,578 | |||||||||||||||||||||
|
Net
income
|
19,627 | 19,627 | ||||||||||||||||||||||||||||||
|
Other
comprehensive income (note 12)
|
3,685 | 3,685 | ||||||||||||||||||||||||||||||
|
Total
comprehensive income
|
23,312 | |||||||||||||||||||||||||||||||
|
Adjustment
to initially apply SFAS No. 158, net of tax (note 11a)
|
— | — | — | — | — | — | (287 | ) | (287 | ) | ||||||||||||||||||||||
|
Deferred
compensation transactions
|
— | — | 48 | — | — | — | — | 48 | ||||||||||||||||||||||||
|
Stock
option transactions, net
|
112,362 | — | 1,307 | — | 984 | (894 | ) | — | 1,397 | |||||||||||||||||||||||
|
ESOP
shares allocated or committed to be released for allocation (187,827
shares)
|
— | — | 1,765 | 878 | — | — | — | 2,643 | ||||||||||||||||||||||||
|
RRP
awards
|
5,000 | — | (70 | ) | — | 70 | — | — | — | |||||||||||||||||||||||
|
Vesting
of RRP shares
|
— | — | 2,007 | — | — | — | — | 2,007 | ||||||||||||||||||||||||
|
Other
RRP transactions
|
(45,319 | ) | — | 172 | — | (590 | ) | — | — | (418 | ) | |||||||||||||||||||||
|
Purchase
of treasury stock
|
(1,540,471 | ) | — | — | — | (20,913 | ) | — | — | (20,913 | ) | |||||||||||||||||||||
|
Cash
dividends paid ($0.20 per common share)
|
— | — | — | — | — | (8,278 | ) | — | (8,278 | ) | ||||||||||||||||||||||
|
Balance
at September 30, 2007
|
41,230,618 | 459 | 348,734 | (8,221 | ) | (57,422 | ) | 125,743 | (4,204 | ) | 405,089 | |||||||||||||||||||||
|
Net
income
|
23,778 | 23,778 | ||||||||||||||||||||||||||||||
|
Other
comprehensive income (note 12)
|
(5,377 | ) | (5,377 | ) | ||||||||||||||||||||||||||||
|
Total
comprehensive income
|
18,401 | |||||||||||||||||||||||||||||||
|
Deferred
compensation transactions
|
— | — | 40 | — | — | — | — | 40 | ||||||||||||||||||||||||
|
Stock
option transactions, net
|
183,494 | — | 1,582 | — | 1,899 | (1,291 | ) | — | 2,190 | |||||||||||||||||||||||
|
ESOP
shares allocated or committed to be released for allocation (84,429
shares)
|
— | — | 492 | 586 | — | — | — | 1,078 | ||||||||||||||||||||||||
|
RRP
awards
|
6,000 | — | (81 | ) | — | 66 | 15 | — | — | |||||||||||||||||||||||
|
Vesting
of RRP shares
|
— | — | 1,811 | — | — | — | — | 1,811 | ||||||||||||||||||||||||
|
Other
RRP transactions
|
(34,142 | ) | — | — | — | (451 | ) | — | — | (451 | ) | |||||||||||||||||||||
|
Purchase
of treasury stock
|
(1,570,757 | ) | — | — | — | (19,779 | ) | — | — | (19,779 | ) | |||||||||||||||||||||
|
Cash
dividends paid ($0.24 per common share)
|
— | — | — | — | — | (9,525 | ) | — | (9,525 | ) | ||||||||||||||||||||||
|
Other
|
— | — | 304 | — | — | — | — | 304 | ||||||||||||||||||||||||
|
Balance
at September 30, 2008
|
39,815,213 | 459 | 352,882 | (7,635 | ) | (75,687 | ) | 138,720 | (9,581 | ) | 399,158 | |||||||||||||||||||||
|
Net
income
|
25,861 | 25,861 | ||||||||||||||||||||||||||||||
|
Other
comprehensive income (note 12)
|
12,058 | 12,058 | ||||||||||||||||||||||||||||||
|
Total
comprehensive income
|
37,919 | |||||||||||||||||||||||||||||||
|
Deferred
compensation transactions
|
— | — | 128 | — | — | — | — | 128 | ||||||||||||||||||||||||
|
Stock
option transactions, net
|
181,969 | — | 1,066 | — | 2,182 | (2,009 | ) | — | 1,239 | |||||||||||||||||||||||
|
ESOP
shares allocated or committed to be released for allocation (49,932
shares)
|
— | — | (11 | ) | 499 | — | — | — | 488 | |||||||||||||||||||||||
|
Vesting
of RRP shares
|
— | — | 1,688 | — | — | — | — | 1,688 | ||||||||||||||||||||||||
|
Other
RRP transactions
|
(34,164 | ) | — | — | — | (326 | ) | — | — | (326 | ) | |||||||||||||||||||||
|
Purchase
of treasury stock
|
(415,811 | ) | — | — | — | (3,459 | ) | — | — | (3,459 | ) | |||||||||||||||||||||
|
Cash
dividends paid ($0.24 per common share)
|
— | — | — | — | — | (9,379 | ) | — | (9,379 | ) | ||||||||||||||||||||||
|
Balance
at September 30, 2009
|
39,547,207 | $ | 459 | $ | 355,753 | $ | (7,136 | ) | $ | (77,290 | ) | $ | 153,193 | $ | 2,477 | $ | 427,456 | |||||||||||||||
See
accompanying notes to consolidated financial statements.
PROVIDENT
NEW YORK BANCORP AND SUBSIDIARIES
Consolidated
Statements of Cash Flows
Years
Ended September 30, 2009, 2008 and 2007
(Dollars
in thousands)
|
2009
|
2008
|
2007
|
||||||||||
|
Cash
flows from operating activities:
|
||||||||||||
|
Net
income
|
25,861 | $ | 23,778 | $ | 19,627 | |||||||
|
Adjustments
to reconcile net income to net cash provided by operating
activities
|
||||||||||||
|
Provisions
for loan losses
|
17,600 | 7,200 | 1,800 | |||||||||
|
Write
down of other real estate owned
|
186 | - | - | |||||||||
|
Depreciation
and amortization of premises and equipment
|
4,675 | 4,616 | 4,451 | |||||||||
|
Amortization
of intangibles
|
2,185 | 2,599 | 3,148 | |||||||||
|
Net
(gain) loss on sale of securities
|
(18,076 | ) | (983 | ) | 8 | |||||||
|
Gains
on loans held for sale
|
(961 | ) | - | (155 | ) | |||||||
|
Gain
on sale of premises and equipment
|
(517 | ) | - | (212 | ) | |||||||
|
Net
amortization (accretion) of premium and discounts on
securities
|
1,715 | (47 | ) | 836 | ||||||||
|
Accretion
of premiums on borrowings (includes calls on borrowings)
|
(440 | ) | (739 | ) | (1,654 | ) | ||||||
|
ESOP
and RRP expense
|
2,178 | 2,889 | 4,900 | |||||||||
|
ESOP
forfeitures
|
(4 | ) | (293 | ) | (250 | ) | ||||||
|
Stock
option compensation expense
|
768 | 1,196 | 1,307 | |||||||||
|
Originations
of loans held for sale
|
(50,677 | ) | (189 | ) | (20,243 | ) | ||||||
|
Proceeds
from sales of loans held for sale
|
49,653 | - | 27,871 | |||||||||
|
Increase
in cash surrender value of bank owned life insurance
|
(1,961 | ) | (1,832 | ) | (1,693 | ) | ||||||
|
Deferred
income tax asset
|
(1,640 | ) | (2,528 | ) | 1,271 | |||||||
|
Net
changes in accrued interest receivable and payable
|
(585 | ) | 134 | 2,341 | ||||||||
|
Other
adjustments (principally net changes in other assets and other
liabilities)
|
(9,273 | ) | 4,504 | (8,111 | ) | |||||||
|
Net
cash provided by operating activities
|
20,687 | 40,305 | 35,242 | |||||||||
|
Cash
flows from investing activities:
|
||||||||||||
|
Purchases
of securities:
|
||||||||||||
|
Available
for sale
|
(708,727 | ) | (263,857 | ) | (178,979 | ) | ||||||
|
Held
to maturity
|
(25,095 | ) | (19,248 | ) | (7,793 | ) | ||||||
|
Proceeds
from maturities, calls and other principal payments on
securities
|
||||||||||||
|
Available
for sale
|
153,585 | 223,492 | 330,251 | |||||||||
|
Held
to maturity
|
22,548 | 13,623 | 31,252 | |||||||||
|
Proceeds
from sales of securities available for sale
|
556,796 | 40,438 | 10,838 | |||||||||
|
Proceeds
from sales of securities held to maturity
|
625 | - | - | |||||||||
|
Loan
originations
|
(450,551 | ) | (596,593 | ) | (626,726 | ) | ||||||
|
Loan
principal payments
|
469,157 | 498,610 | 461,486 | |||||||||
|
Proceeds
from sale of FHLB stock, net
|
5,498 | 4,126 | 717 | |||||||||
|
Settlement
of HVIA (Hudson Valley Investment Advisors, Inc.) earnout
|
- | - | (750 | ) | ||||||||
|
Purchases
of premises and equipment
|
(8,852 | ) | (11,253 | ) | (4,303 | ) | ||||||
|
Proceeds
from the sale of fixed assets
|
718 | - | 1,725 | |||||||||
|
Proceeds
from sales of other real estate owned
|
- | - | 742 | |||||||||
|
Purchases
of BOLI
|
- | (5,000 | ) | 183 | ||||||||
|
Net
cash provided by (used in) investing activities
|
15,702 | (115,662 | ) | 18,643 | ||||||||
PROVIDENT
NEW YORK BANCORP AND SUBSIDIARIES
Consolidated
Statements of Cash Flows Continued
Years
Ended September 30, 2009, 2008 and 2007
(Dollars
in thousands)
|
2009
|
2008
|
2007
|
||||||||||
|
Cash
flows from financing activities
|
||||||||||||
|
Net
increase in transaction, savings and money market deposits
|
124,037 | 312,793 | 12,663 | |||||||||
|
Net
(decrease) in time deposits
|
(30,952 | ) | (37,267 | ) | (28,606 | ) | ||||||
|
Net
increase (decrease) in short-term borrowings
|
(153,791 | ) | (230,400 | ) | 55,464 | |||||||
|
Gross
repayments of long-term borrowings
|
(3,995 | ) | (14,161 | ) | (300,307 | ) | ||||||
|
Gross
proceeds from long-term borrowings
|
22,840 | 150,066 | 225,000 | |||||||||
|
Net
increase in borrowings senior unsecured note
|
51,500 | - | - | |||||||||
|
Net
increase in mortgage escrow funds
|
1,133 | 1,290 | 1,370 | |||||||||
|
Treasury
shares purchased
|
(3,459 | ) | (20,230 | ) | (21,503 | ) | ||||||
|
Stock
option transactions
|
147 | 1,270 | 90 | |||||||||
|
Other
stock-based compensation transactions
|
128 | 40 | 220 | |||||||||
|
Cash
dividends paid
|
(9,379 | ) | (9,525 | ) | (8,278 | ) | ||||||
|
Net
cash provided by (used in) financing activities
|
(1,791 | ) | 153,876 | (63,887 | ) | |||||||
|
Net
increase (decrease) in cash and cash equivalents
|
34,598 | 78,519 | (10,002 | ) | ||||||||
|
Cash
and cash equivalents at beginning of year
|
125,810 | 47,291 | 57,293 | |||||||||
|
Cash
and cash equivalents at end of year
|
$ | 160,408 | $ | 125,810 | $ | 47,291 | ||||||
|
Supplemental
cash flow information:
|
||||||||||||
|
Interest
payments
|
$ | 38,714 | $ | 55,268 | $ | 65,134 | ||||||
|
Income
tax payments
|
11,739 | 13,227 | 8,879 | |||||||||
|
Loans
transferred to real estate owned
|
1,815 | - | 710 | |||||||||
|
Net
change in unrealized gains (losses) recorded on securities available for
sale
|
25,900 | (3,341 | ) | 6,139 | ||||||||
|
Change
in deferred taxes on unrealized (gains) losses on securities available for
sale
|
(10,506 | ) | 1,370 | (2,524 | ) | |||||||
|
Issuance
of RRP shares
|
- | 81 | 70 | |||||||||
See
accompanying notes to consolidated financial statements.
PROVIDENT
NEW YORK BANCORP AND SUBSIDIARIES
Notes to
Consolidated Financial Statements
(Dollars
in thousands, except per share data)
(1)
Basis of Financial Statement Presentation and Summary of Significant Accounting
Policies
The
consolidated financial statements include the accounts of Provident New York
Bancorp (“Provident Bancorp” or “the Company”), Hardenburgh Abstract Title
Company, which provides title searches and insurance for residential and
commercial real estate, Hudson Valley Investment Advisors, LLC,
(“HVIA”) a registered investment advisor, Provident Bank (“the Bank”) and the
Bank’s wholly owned subsidiaries. These subsidiaries are (i) Provident Municipal
Bank (“PMB”) which is a limited-purpose, New York State-chartered commercial
bank formed to accept deposits from municipalities in the Company’s market area,
(ii) Provident REIT, Inc. and WSB Funding, Inc. which are real estate investment
trusts that hold a portion of the Company’s real estate loans, (iii) Provest
Services Corp. I, which has invested in a low-income housing partnership, and
(iv) Provest Services Corp. II, which has engaged a third-party provider to sell
mutual funds and annuities to the Bank’s customers and (v) Limited Liability
Companies, which hold foreclosed properties acquired by the bank. Intercompany
transactions and balances are eliminated in consolidation.
The
consolidated financial statements have been prepared in conformity with
accounting principles generally accepted in the United States of
America. In preparing the consolidated financial statements,
management is required to make estimates and assumptions that affect the
reported amounts of assets, liabilities, income and expense. Certain
amounts from prior years have been reclassified to conform to the current fiscal
year presentation.
|
|
(a)
|
Nature
of Business
|
Provident
New York Bancorp (“Provident Bancorp” or the “Company”), a unitary savings and
loan holding company, is a Delaware corporation that owns all of the outstanding
shares of Provident Bank (the “Bank”). Provident Bancorp was formed
in connection with the second step offering on January 14, 2004.
On June
29, 2005, Provident Bancorp, Inc. changed its name to Provident New York Bancorp
in order to differentiate itself from the numerous bank holding companies with
similar names. It began trading on the NASDAQ under the stock symbol “PBNY” on
that date. Prior to that date, from January 7, 1999 its common stock traded
under the stock symbol “PBCP.”
The Bank
is a community bank offering financial services to individuals and businesses
primarily in Rockland and Orange Counties, New York and the contiguous Sullivan,
Ulster, Westchester and Putnam Counties, New York and Bergen County, New Jersey.
The Bank’s principal business is accepting deposits and, together with funds
generated from operations and borrowings, investing in various types of loans
and securities. The Bank is a federally-chartered savings association and its
deposits are insured up to applicable limits by the Deposit Insurance Fund of
the Federal Deposit Insurance Corporation (FDIC). The Office of Thrift
Supervision (OTS) is the primary regulator for the Bank and for Provident New
York Bancorp. Of the Bank’s loans 85% are collateralized or dependent on real
estate.
|
|
(b)
|
Use
of estimates
|
The
consolidated financial statements have been prepared in conformity with
accounting principles generally accepted in the United States of America. In
preparing the consolidated financial statements, management is required to make
estimates and assumptions that affect the reported amounts of assets,
liabilities, income and expense. Actual results could differ significantly from
these estimates. An estimate that is particularly susceptible to significant
near-term change is the allowance for loan losses, which is discussed below.
Also subject to change are estimates involving mortgage servicing rights,
benefit plans, deferred income taxes and fair values of financial
instruments.
|
|
(c)
|
Cash
Flows
|
For
purposes of reporting cash flows, cash equivalents include highly liquid,
short-term investments such as overnight federal funds, as well as cash and
deposits with other financial institutions. Net cash flows are reported for
customer loan and deposit transactions and short-term borrowings with an
original maturity of 90 days or less.
PROVIDENT
NEW YORK BANCORP AND SUBSIDIARIES
Notes to
Consolidated Financial Statements
(Dollars
in thousands, except per share data)
|
|
(d)
|
Long
Term Assets
|
Premises
and equipment, core deposit and other intangible assets are reviewed annually
for impairment or when events indicate their carrying amount may not be
recoverable from future undiscounted cash flows. If impaired, the
assets are recorded at fair value.
|
|
(e)
|
Fair
Values of Financial Instruments
|
Fair
values of financial instruments are estimated using relevant market information
and other assumptions, as more fully disclosed in a separate
note. Fair value estimates involve uncertainties and matters of
significant judgment regarding interest rates, credit risk, prepayments, and
other factors, especially in the absence of broad markets for particular
items. Changes in assumptions or in market conditions could
significantly affect the estimates.
|
|
(f)
|
Adoption
of New Accounting Standards
|
FASB
Codification Topic 855: Subsequent Events establishes
general standards of accounting for and disclosure of events that occur after
the balance sheet date but before financial statements are issued or available
to be issued. U.S. GAAP specifies (i) the period after the balance sheet date
during which a reporting entity’s management should evaluate events or
transactions that may occur for potential recognition or disclosure in the
financial statements, (ii) the circumstances under which an entity should
recognize events or transactions occurring after the balance sheet date in its
financial statements and (iii) disclosures an entity should make about events or
transactions that occurred after the balance sheet date. The Company
evaluates subsequent events through the date that the financial statements are
issued. Subsequent events guidance became effective for financial
statements for period ending after June 15, 2009 and did not have a significant
effect on the Company’s financial statements.
In April
2009, the FASB issued Staff Position (FSP) No. 115-2 and No. 124-2, Recognition and Presentation of
Other-Than Temporary Impairments, which is now a part of FASB ASC 320,
“Investments – Debt and Equity
Securities”, and which amends existing guidance for determining whether
impairment is other-than-temporary (“OTTI”) for debt securities. The
FSP requires an entity to assess whether it intends to sell, or it is more
likely than not that it will be required to sell a security in an unrealized
loss position before recovery of its amortized cost basis. If either
of these criteria is met, the entire difference between amortized cost and fair
value is recognized in earnings. For securities that do not meet the
aforementioned criteria, the amount of impairment recognized in earnings is
limited to the amount related to credit losses, while impairment related to
other factors is recognized in other comprehensive income or
loss. Additionally, the FSP expands and increases the frequency of
existing disclosures about other-than-temporary impairments for debt and equity
securities. This FSP is effective for interim and annual reporting
periods ending after June 15, 2009, with early adoption permitted for periods
ending after March 15, 2009. The Company recognized no cumulative other-than
–temporary impairment charges. The Company adopted the FSP effective
April 1, 2009. The adoption of this FSP on April 1, 2009 did not have
a material impact on the results of operations or financial
position.
In April
2009, the FASB issued Staff Position (FSP) No. 157-4, Determining Fair Value When the
Volume and Level of Activity for the Asset and Liability Have Significantly
Decreased and Identifying Transactions That Are Not Orderly, which
is now a part of FASB ASC 820, “Fair Value Measurement and
Disclosures.” This FSP emphasizes that even if there has been
a significant decrease in the volume and level of activity, the objective of a
fair value measurement remains the same. Fair Value is the price that
would be received to sell an asset or paid to transfer a liability in an orderly
transaction (that is, not a forced liquidation or distressed sale) between
market participants. The FSP provides a number of factors to consider
when evaluating whether there has been a significant decrease in the volume and
level of activity for an asset or liability in relation to normal market
activity. In addition, when transactions or quoted prices are not
considered orderly, adjustments to those prices based on the weight of available
information may be needed to determine the appropriate fair
value. The FSP also requires increased disclosures. This
FSP is effective for interim and annual reporting periods after June 15, 2009,
and shall be applied prospectively. The adoption of this FSP at
September 30, 2009 did not have a material impact on the results of operations
or financial position.
PROVIDENT
NEW YORK BANCORP AND SUBSIDIARIES
Notes to
Consolidated Financial Statements
(Dollars
in thousands, except per share data)
In April
2009, the FASB issued FSP No. 107-1 and APB 28-1, Interim Disclosures about Fair Value
of Financial Instruments, which is now a part of FASB ASC 825, “Financial
Instruments.” This FSP amends FASB Statement No. 107, Disclosures about Fair Value of
Financial Instruments, to require disclosures about fair value of
financial instruments for interim reporting periods of publicly traded companies
that were previously only required in annual financial
statements. This FSP is effective for interim reporting periods
ending after June 15, 2009. The adoption of this FSP at June 30, 2009
did not have a material impact on the results of operations or financial
position as it only required disclosures.
In
August, 2009, the FASB issued Accounting Standards Update (ASU) 2009-05, “Measuring Liabilities at Fair
Value”, as subset of Topic 820- “Fair Value Measurement and
Disclosure”. Among other clarifying points, ASU 2009-05
provides clarification that in circumstances in which a quoted price in an
active market for the identical liability is not available, a reporting entity
is required to measure fair value using one or more of the following techniques:
(1) The quoted price of the identical liability when traded as an assets, (2)
Quoted prices for similar liabilities or similar liabilities when traded as
assets, or (3) Another valuation technique that is consistent with
the principles of Topic 820 such as an income approach or market
approach. The ASU is effective as of September 30,
2009. The adoption of the ASU did not have a material impact on the
Company’s consolidated financial statements.
|
|
(g)
|
Securities
|
Securities
include U.S. Treasury, U.S. Government Agency and Government Sponsored Agencies,
municipal and corporate bonds, mortgage backed securities, collateralized
mortgage obligations and marketable equity securities.
The
Company can classify its securities among three categories: held to maturity,
trading, and available for sale. Management determines the appropriate
classification of the Company’s securities at the time of purchase.
Held-to-maturity
securities are limited to debt securities for which management has the intent
and the Company has the ability to hold to maturity. These securities are
reported at amortized cost.
Trading
securities are debt and equity securities held principally for the purpose of
selling them in the near term. These securities are reported at fair value, with
unrealized gains and losses included in earnings. The Company does not engage in
security trading activities.
All other
debt and marketable equity securities are classified as available for sale.
These securities are reported at fair value, with unrealized gains and losses
(net of the related deferred income tax effect) excluded from earnings and
reported in a separate component of stockholders’ equity (accumulated other
comprehensive income or loss). Available-for-sale securities include securities
that management intends to hold for an indefinite period of time, such as
securities to be used as part of the Company’s asset/liability management
strategy or securities that may be sold in response to changes in interest
rates, changes in prepayment risks, the need to increase capital, or similar
factors.
Premiums
and discounts on debt securities are recognized in interest income on a
level-yield basis over the period to maturity. Amortization of premiums and
accretion of discounts on mortgage backed securities are based on the estimated
cash flows of the mortgage backed securities, periodically adjusted for changes
in estimated lives, on a level yield basis. The cost of securities
sold is determined using the specific identification method. Unrealized losses
are charged to earnings when management determines that the decline in fair
value of a security is other than temporary.
Securities
deemed to be other-than-temporarily impaired are permanently written down from
their original cost basis to reflect the adjusted fair value subsequent to a
measurement for impairment. The impairment is deemed other than temporary on an
investment the Company does not expect to recover the amortized cost basis of
that particular security. The Company assesses whether it intends to
sell, or it is more likely than not that it will be required to sell a security
in an unrealized loss position before recovery of its amortized cost
basis. If either of these criteria is met, the entire difference
between amortized cost and fair value is recognized in earnings. For
securities that do not meet the aforementioned criteria, the amount of
impairment recognized in earnings is limited to the amount related to credit
losses, while impairment related to other factors is recognized in other
comprehensive income or loss. There were no securities deemed to be
other than temporary impaired as of September 30, 2009.
PROVIDENT
NEW YORK BANCORP AND SUBSIDIARIES
Notes to
Consolidated Financial Statements
(Dollars
in thousands, except per share data)
|
|
(h)
|
Loans
|
Loans
where management has the intent and ability to hold for the foreseeable future
or until maturity or payoff (other than loans held for sale) are reported at
amortized cost less the allowance for loan losses. Mortgage loans originated and
held for sale in the secondary market (if any) are reported at the lower of
aggregate cost or estimated fair value. Fair value is estimated based on
outstanding investor commitments or, in the absence of such commitments, based
on current investor yield requirements. Net unrealized losses are recognized in
a valuation allowance by a charge to earnings. Interest income on loans is
accrued on the level yield method.
A loan is
placed on non-accrual status when management has determined that the borrower
may likely be unable to meet contractual principal or interest obligations, or
when payments are 90 days or more past due, unless well secured and in the
process of collection. Accrual of interest ceases and, in general, uncollected
past due interest is reversed and charged against current interest income,
related to the current year and interest, recorded in the prior year, is charged
to the allowance for loan losses. Interest payments received on non-accrual
loans, including impaired loans, are not recognized as income unless warranted
based on the borrower’s financial condition and payment record.
The
Company defers nonrefundable loan origination and commitment fees, and certain
direct loan origination costs, and amortizes the net amount as an adjustment of
the yield over the estimated life of the loan. If a loan is prepaid or sold, the
net deferred amount is recognized in the statement of income at that time.
Interest and fees on loans include prepayment fees and late charges
collected.
|
|
(i)
|
Allowance
for Loan Losses
|
The
allowance for loan losses is established through provisions for losses charged
to earnings. Losses on loans (including impaired loans) are charged to the
allowance for loan losses when management believes that the collection of
principal is unlikely. Recoveries of loans previously charged-off are credited
to the allowance when realized.
The
allowance for loan losses is an amount that management believes is necessary to
absorb probable incurred losses on existing loans that may become uncollectible.
Management’s evaluations, which are subject to periodic review by the OTS, take
into consideration factors such as the Company’s past loan loss experience,
changes in the nature and volume of the loan portfolio, overall portfolio
quality, review of specific problem loans and collateral values, and current
economic conditions that may affect the borrowers’ ability to pay. Future
adjustments to the allowance for loan losses may be necessary, based on changes
in economic and real estate market conditions, further information obtained
regarding known problem loans, results of regulatory examinations, the
identification of additional problem loans, and other factors.
The
Company considers a loan to be impaired when, based on current information and
events, it is probable that the borrower will be unable to comply with
contractual principal and interest payments due. Certain loans are individually
evaluated for collectability in accordance with the Company’s ongoing loan
review procedures (principally commercial real estate, commercial business and
construction loans). Smaller-balance homogeneous loans are collectively
evaluated for impairment, such as residential mortgage loans and consumer loans.
Impaired loans are based on one of three measures — the present value of
expected future cash flows discounted at the loan’s effective interest rate, the
loan’s observable market price, or the fair value of the collateral if the loan
is collateral dependent. If the measure of an impaired loan is less than its
recorded investment, a portion of the allowance for loan losses is allocated so
that the loan is reported, net, at its measured value.
PROVIDENT
NEW YORK BANCORP AND SUBSIDIARIES
Notes to
Consolidated Financial Statements
(Dollars
in thousands, except per share data)
|
|
(j)
|
Mortgage
Servicing Assets
|
Servicing
assets represent the allocated value of retained servicing rights on loans sold
(as well as the cost of purchased rights). Servicing assets are
expensed in proportion to, and over the period of, estimated net servicing
revenues. Impairment is evaluated based on the fair value of the
assets, using groupings of the underlying loans as to interest rates and then,
secondarily, as to loan type and investor. Fair value is determined
using prices for similar assets with similar characteristics, when available, or
based upon discounted cash flows using market-based assumptions. Any
impairment of a grouping is reported as a valuation allowance, to the extent
that fair value is less than the capitalized amount for a grouping. Upon
adoption of FASB ASC Topic # 860- Transfers and Servicing, the
Company elected to continue to use the amortization method.
|
|
(k)
|
Federal
Home Loan Bank Stock
|
As a
member of the Federal Home Loan Bank (FHLB) of New York, the Bank is required to
hold a certain amount of FHLB stock. This stock is a non-marketable equity
security and, accordingly, is reported at cost.
|
|
(l)
|
Premises
and Equipment
|
Land is
reported at cost, while premises and equipment are reported at cost, less
accumulated depreciation and amortization. Depreciation is computed using the
straight-line method over the estimated useful lives of the related assets,
which range from three years for equipment and 40 years for premises. Leasehold
improvements are amortized on a straight-line basis over the terms of the
respective leases, including renewal options, or the estimated useful lives of
the improvements, whichever is shorter. Routine holding costs are charged to
expense as incurred, while significant improvements are
capitalized.
|
(m)
|
Goodwill
and Other Intangible Assets
|
Goodwill
recorded in acquisitions is not amortized to expense, but instead, is evaluated
for impairment at least annually. The core deposit intangibles recorded in
acquisitions are amortized to expense using an accelerated method over their
estimated lives of approximately eight years. Other intangible assets
are evaluated for impairment at least annually. Intangibles related to HVIA are
amortized over 10 years on a straight-line basis. Impairment losses
on intangible assets are charged to expense, if and when they
occur.
|
|
(n)
|
Real
Estate Owned
|
Real
estate properties acquired through loan foreclosures are recorded initially at
estimated fair value, less expected sales costs, with any resulting write-down
charged to the allowance for loan losses. Subsequent valuations are performed by
management, and the carrying amount of a property is adjusted by a charge to
expense to reflect any subsequent declines in estimated fair value. Fair value
estimates are based on recent appraisals and other available information.
Routine holding costs are charged to expense as incurred, while significant
improvements are capitalized. Gains and losses on sales of real estate owned are
recognized upon disposition. Real estate owned is included in other
assets.
|
|
(o)
|
Securities
Repurchase Agreements
|
In
securities repurchase agreements, the Company transfers securities to a
counterparty under an agreement to repurchase the identical securities at a
fixed price on a future date. These agreements are accounted for as secured
financing transactions since the Company maintains effective control over the
transferred securities and the transfer meets other specified criteria.
Accordingly, the transaction proceeds are recorded as borrowings and the
underlying securities continue to be carried in the Company’s securities
portfolio. Disclosure of the pledged securities is made in the consolidated
statements of financial condition if the counterparty has the right by contract
to sell or repledge such collateral.
PROVIDENT
NEW YORK BANCORP AND SUBSIDIARIES
Notes to
Consolidated Financial Statements
(Dollars
in thousands, except per share data)
|
|
(p)
|
Income
Taxes
|
Net
deferred taxes are recognized for the estimated future tax effects attributable
to “temporary differences” between the financial statement carrying amounts and
the tax bases of existing assets and liabilities. Deferred tax assets and
liabilities are measured using enacted tax rates expected to apply to taxable
income in the years in which the temporary differences are expected to be
recovered or settled. The effect on deferred tax assets and liabilities of a
change in tax laws or rates is recognized in income tax expense in the period
that includes the enactment date of the change.
A
deferred tax liability is recognized for all temporary differences that will
result in future taxable income. A deferred tax asset is recognized for all
temporary differences that will result in future tax deductions, subject to
reduction of the asset by a valuation allowance in certain circumstances. This
valuation allowance is recognized if, based on an analysis of available
evidence, management determines that it is more likely than not that some
portion, or all of the deferred tax asset will not be realized. The valuation
allowance is subject to ongoing adjustment based on changes in circumstances
that affect management’s judgment about the realizability of the deferred tax
asset. Adjustments to increase or decrease the valuation allowance are charged
or credited, respectively, to income tax expense. The Company recognizes
interest and/or penalties related to income tax matters in income tax
expense.
The
Company evaluates uncertain tax positions in a two step process. The
first step is recognition, which requires a determination whether it is more
likely than not that a tax position will be sustained upon
examination. The second step is measurement. Under the
measurement step, a tax position that meets the more likely than not recognition
threshold is measured at the largest amount of benefit that is greater than
fifty percent likely of being realized upon ultimate settlement. Tax
position that previously failed to meet the more likely than not recognition
threshold should be recognized in the first subsequent financial reporting
period in which that threshold is met. Previously recognized tax
position that no longer meet the more likely than not recognition threshold
should be derecognized in the first subsequent financial reporting period in
which the threshold is no longer met. The Company did not have any
such position as of September 30, 2009. See note 10 of the “Notes to
Consolidated Financial Statements”.
|
|
(q)
|
Bank
Owned Life Insurance (BOLI)
|
The
Company has purchased life insurance policies on certain key
executives. Bank owned life insurance is recorded at its cash
surrender value (or the amount that can be realized).
|
|
(r)
|
Stock-Based
Compensation Plans
|
Compensation
expense is recognized for the ESOP equal to the fair value of shares that have
been allocated or committed to be released for allocation to participants. Any
difference between the fair value at that time and the ESOP’s original
acquisition cost is charged or credited to stockholders’ equity (additional
paid-in capital). The cost of ESOP shares that have not yet been allocated or
committed to be released for allocation is deducted from stockholders’
equity.
The
Company applies FASB ASC Topic 718 “Compensation- Stock Based” in
accounting for its stock option plan. During 2009, 2008 and 2007 the Company
issued 88,861, 275,134 and 70,958 new stock-based option awards and recognized
total non-cash stock-based compensation cost of $768, $1,196 and $1,307. As of
September 30, 2009, the total remaining unrecognized compensation cost related
to non-vested stock options was $552.
The
Company’s stock-based compensation plans allow for accelerated vesting when
employees retire under circumstance s in accordance with the terms of the plans.
Grants issued subsequent to adoption of FASB ASC Topic 718 (October 1, 2005),
which are subject to such accelerated vesting, are expensed over the shorter of
the time to retirement age or the vesting schedule in accordance with the grant.
Thus the vesting period can be less than the plan’s five-year vesting period
depending upon the age of the grantee. As of September 30, 2009, 47,800
restricted shares and 7,500 stock options were potentially subject to
accelerated vesting, but will not be expensed over a shorter time period, unless
acceleration is deemed to have occurred. The Company recognized expense
associated with the acceleration of 0, 10,000 and 21,980 restricted shares in
2009, 2008 and 2007, respectively.
PROVIDENT
NEW YORK BANCORP AND SUBSIDIARIES
Notes to
Consolidated Financial Statements
(Dollars
in thousands, except per share data)
|
|
(s)
|
Earnings
Per Share
|
Basic
earnings per share (EPS) is computed by dividing net income applicable to common
stock by the weighted average number of common shares outstanding during the
period.
Diluted
EPS is computed in a similar manner, except that the weighted average number of
common shares is increased to include incremental shares (computed using the
treasury stock method) that would have been outstanding if all potentially
dilutive stock options were exercised and unvested RRP shares became vested
during the periods. For purposes of computing both basic and diluted EPS,
outstanding shares exclude unallocated ESOP shares.
|
|
(t)
|
Segment
Information
|
Public
companies are required to report certain financial information about significant
revenue- producing segments of the business for which such information is
available and utilized by the chief operating decision maker. As a
community-oriented financial institution, substantially all of the Company’s
operations involve the delivery of loan and deposit products to customers.
Management makes operating decisions and assesses performance based on an
ongoing review of the community banking operation, which constitutes the
Company’s only operating segment for financial reporting
purposes.
PROVIDENT
NEW YORK BANCORP AND SUBSIDIARIES
Notes to
Consolidated Financial Statements
(Dollars
in thousands, except per share data)
|
(2)
|
Acquisitions
|
Summary of
Acquisition Transactions. Below is the summary of the
acquisition transactions for Warwick Community Bancorp (2005) “WSB”, Ellenville
National Bank (2004) “ENB”, National Bank of Florida (2002) “NBF”, one purchase
in 2005 of a branch office of HSBC Bank USA, National Association (“HSBC”) and
Hudson Valley Investment Advisors (“HVIA”).
|
HVIA
|
HSBC
|
WSB
|
ENB
|
NBF
|
Total
|
|||||||||||||||||||
|
At Acquisition Date
|
||||||||||||||||||||||||
|
Number
of shares issued
|
208,331 | - | 6,257,896 | 3,969,676 | - | 10,435,903 | ||||||||||||||||||
|
Loans
acquired
|
$ | - | $ | 2,045 | $ | 284,522 | $ | 213,730 | $ | 23,112 | $ | 523,409 | ||||||||||||
|
Deposits
assumed
|
- | 23,319 | 475,150 | 327,284 | 88,182 | 913,935 | ||||||||||||||||||
|
Cash
paid/(received)
|
2,500 | (18,938 | ) | 72,601 | 36,773 | 28,100 | 121,036 | |||||||||||||||||
|
Goodwill
|
2,531 | - | 91,576 | 51,794 | 13,063 | 158,964 | ||||||||||||||||||
|
Core
deposit/other intangibles
|
2,830 | 1,690 | 10,395 | 6,624 | 1,787 | 23,326 | ||||||||||||||||||
|
At September 30, 2009
|
||||||||||||||||||||||||
|
Goodwill
|
$ | 3,279 | $ | - | $ | 92,145 | $ | 52,102 | $ | 13,335 | $ | 160,861 | ||||||||||||
|
Accumulated
core deposit/other amortization
|
943 | 1,313 | 7,732 | 6,150 | 1,698 | 17,836 | ||||||||||||||||||
|
Net
core deposit/other intangible
|
1,887 | 376 | 2,663 | 474 | 89 | 5,489 | ||||||||||||||||||
* In
addition to the above, the Company also carries $877 in mortgage servicing
rights.
The
changes to goodwill, reflected above, are due to tax related items in connection
with acquisitions and the $750 settlement of the earnout provision for HVIA in
2007.
Future
Amortization of Core Deposit and Other Intangible Assets. The
following table sets forth the future amortization of core deposit and other
intangible assets:
|
At September 30, 2009
|
Amortization
|
|||
|
Less
than one year
|
$ | 1,853 | ||
|
One
to two years
|
1,360 | |||
|
Two
to three years
|
941 | |||
|
Three
to four years
|
580 | |||
|
Four
to five years
|
283 | |||
|
Beyond
five years
|
472 | |||
|
Total
|
$ | 5,489 | ||
Goodwill
is not amortized to expense and is reviewed for impairment at least annually,
with impairment losses charged to expense, if and when they occur. The core
deposit and other intangible assets are recognized apart from goodwill and they
are amortized to expense over their estimated useful lives and evaluated at
least annually for impairment.
PROVIDENT
NEW YORK BANCORP AND SUBSIDIARIES
Notes to
Consolidated Financial Statements
(Dollars
in thousands, except per share data)
|
(3)
|
Securities Available for
Sale
|
The
following is a summary of securities available for sale:
|
Gross
|
Gross
|
|||||||||||||||
|
Amortized
|
Unrealized
|
Unrealized
|
Fair
|
|||||||||||||
|
Cost
|
Gains
|
Losses
|
Value
|
|||||||||||||
|
September
30, 2009
|
||||||||||||||||
|
Mortgage-backed
securities
|
||||||||||||||||
|
Fannie
Mae
|
$ | 238,723 | $ | 4,606 | $ | (266 | ) | $ | 243,063 | |||||||
|
Freddie
Mac
|
92,885 | 1,621 | - | 94,506 | ||||||||||||
|
Ginnie
Mae
|
26,586 | 358 | (15 | ) | 26,929 | |||||||||||
|
CMO/Other
MBS
|
66,784 | 174 | (941 | ) | 66,017 | |||||||||||
| 424,978 | 6,759 | (1,222 | ) | 430,515 | ||||||||||||
|
Investment
securities
|
||||||||||||||||
|
U.S.
Government securities
|
20,893 | 183 | - | 21,076 | ||||||||||||
|
Federal
agencies
|
186,301 | 678 | (279 | ) | 186,700 | |||||||||||
|
Corporate
bonds
|
25,245 | 579 | (1 | ) | 25,823 | |||||||||||
|
State
and municipal securities
|
158,007 | 9,591 | (14 | ) | 167,584 | |||||||||||
|
Equities
|
1,145 | - | (260 | ) | 885 | |||||||||||
| 391,591 | 11,031 | (554 | ) | 402,068 | ||||||||||||
|
Total
available for sale
|
$ | 816,569 | $ | 17,790 | $ | (1,776 | ) | $ | 832,583 | |||||||
|
September
30, 2008
|
||||||||||||||||
|
Mortgage-backed
securities
|
||||||||||||||||
|
Fannie
Mae
|
$ | 385,138 | $ | 1,719 | $ | (2,185 | ) | $ | 384,672 | |||||||
|
Freddie
Mac
|
189,113 | 1,694 | (818 | ) | 189,989 | |||||||||||
|
Other
|
36,821 | 650 | (1,116 | ) | 36,355 | |||||||||||
| 611,072 | 4,063 | (4,119 | ) | 611,016 | ||||||||||||
|
Investment
securities
|
||||||||||||||||
|
U.S.
Government securities
|
- | - | - | - | ||||||||||||
|
Federal
agencies
|
30,022 | 19 | - | 30,041 | ||||||||||||
|
State
and municipal securities
|
159,334 | 125 | (9,858 | ) | 149,601 | |||||||||||
|
Equities
|
1,146 | - | (116 | ) | 1,030 | |||||||||||
| 190,502 | 144 | (9,974 | ) | 180,672 | ||||||||||||
|
Total
available for sale
|
$ | 801,574 | $ | 4,207 | $ | (14,093 | ) | $ | 791,688 | |||||||
PROVIDENT
NEW YORK BANCORP AND SUBSIDIARIES
Notes to
Consolidated Financial Statements
(Dollars
in thousands, except per share data)
The
following is a summary of the amortized cost and fair value of investment
securities available for sale (other than equity securities), by remaining
period to contractual maturity. Actual maturities may differ because certain
issuers have the right to call or prepay their obligations.
|
September 30, 2009
|
||||||||
|
Amortized Cost
|
Fair
Value
|
|||||||
|
Remaining
period to contractual maturity
|
||||||||
|
Less
than one year
|
$ | 3,678 | $ | 3,732 | ||||
|
One
to five years
|
205,906 | 208,022 | ||||||
|
Five
to ten years
|
86,696 | 89,651 | ||||||
|
Greater
than ten years
|
94,166 | 99,778 | ||||||
|
Total
|
$ | 390,446 | $ | 401,183 | ||||
Proceeds
from sales of securities available for sale during the years ended September 30,
2009 2008 and 2007 totaled $556,796 $40,438, and 10,838 respectively. These
sales resulted in gross realized gains of $18,043, $983 and $0 for the years
ended September 30, 2009, 2008, and 2007 respectively, and gross realized loss
of $0, $0, $8 in fiscal year 2009, 2008, and 2007 respectively.
Securities,
including held to maturity securities, with carrying amounts of $231,190 and
$323,694 were pledged as collateral for borrowings at September 30, 2009 and
September 30, 2008, respectively. U.S. Government and municipal securities with
carrying amounts of $290,038 and $441,640 were pledged as collateral for
municipal deposits and other purposes at September 30, 2009 and September 30,
2008, respectively.
Securities
Available for Sale with Unrealized Losses. The following table
summarizes those securities available for sale with unrealized losses,
segregated by the length of time in a continuous unrealized loss
position:
|
Continuous
Unrealized Loss Position
|
||||||||||||||||||||||||
|
Less Than 12 Months
|
12 Months or Longer
|
Total
|
||||||||||||||||||||||
|
As of September 30, 2009
|
Fair Value
|
Unrealized Losses
|
Fair Value
|
Unrealized Losses
|
Fair Value
|
Unrealized Losses
|
||||||||||||||||||
|
Mortgage-backed
securities
|
$ | 63,965 | $ | (494 | ) | $ | 9,651 | $ | (728 | ) | $ | 73,616 | $ | (1,222 | ) | |||||||||
|
U.S.
Government and agency securities
|
64,689 | (278 | ) | 42 | (1 | ) | 64,731 | (279 | ) | |||||||||||||||
|
Corporate
bonds
|
2,185 | (1 | ) | - | - | 2,185 | (1 | ) | ||||||||||||||||
|
State
and municipal securities
|
1,710 | (14 | ) | - | - | 1,710 | (14 | ) | ||||||||||||||||
|
Equity
securities
|
- | - | 885 | (260 | ) | 885 | (260 | ) | ||||||||||||||||
|
Total
|
$ | 132,549 | $ | (787 | ) | $ | 10,578 | $ | (989 | ) | $ | 143,127 | $ | (1,776 | ) | |||||||||
|
Continuous
Unrealized Loss Position
|
||||||||||||||||||||||||
|
Less Than 12 Months
|
12 Months or Longer
|
Total
|
||||||||||||||||||||||
|
As of September 30, 2008
|
Fair Value
|
Unrealized Losses
|
Fair Value
|
Unrealized Losses
|
Fair Value
|
Unrealized Losses
|
||||||||||||||||||
|
Mortgage-backed
securities
|
$ | 259,247 | $ | (3,675 | ) | $ | 22,492 | $ | (444 | ) | $ | 281,739 | $ | (4,119 | ) | |||||||||
|
U.S.
Government and agency securities
|
- | - | 47 | - | 47 | - | ||||||||||||||||||
|
State
and municipal securities
|
113,509 | (7,535 | ) | 19,241 | (2,323 | ) | 132,750 | (9,858 | ) | |||||||||||||||
|
Equity
securities
|
926 | (115 | ) | 104 | (1 | ) | 1,030 | (116 | ) | |||||||||||||||
|
Total
|
$ | 373,682 | $ | (11,325 | ) | $ | 41,884 | $ | (2,768 | ) | $ | 415,566 | $ | (14,093 | ) | |||||||||
PROVIDENT
NEW YORK BANCORP AND SUBSIDIARIES
Notes to
Consolidated Financial Statements
(Dollars
in thousands, except per share data)
The
Company, as of June 30, 2009 adopted the provisions under FASB ASC Topic 320 –
Investments- Debt and
Equity Securities which requires a
forecast of recovery of cost basis through cash flow collection on all debt
securities with a fair value less than its amortized cost less any current
period credit loss with an assertion on the lack of intent to sell (or be
required to sell prior to recovery of cost basis).
Based on
a review of each of the securities in the investment portfolio in accordance
FASB ASC 320, at September 30, 2009, the Company concluded that it expects to
recover the amortized cost basis of its investments and therefore there were no
impairment charges. As of September 30, 2009 the Company does not
intend to sell nor is it anticipated that it would be required to sell any of
its securities with unrealized losses prior to recovery of its amortized cost
basis less any current-period credit loss.
Substantially
all of the unrealized losses at September 30, 2009 relate to investment grade
securities and are attributable to changes in market interest rates and credit
risk spreads subsequent to purchase. There were no securities with unrealized
losses that were individually significant dollar amounts at September 30, 2009.
A total of 31 available for sale securities were in a continuous unrealized loss
position for less than 12 months and 13 securities for 12 months or longer. For
securities with fixed maturities, there are no securities past due or securities
for which the Company currently believes it is not probable that it will collect
all amounts due according to the contractual terms of the investment. Based on a
review of each of the securities in the investment portfolio in accordance with
FASB ASC 320 at September 30, 2009, the Company concluded that it expects to
recover the amortized cost basis of its investments and therefore there were no
impairment charges.
Within
the collateralized mortgage-backed securities (CMO’s) category of the available
for sale portfolio there are five individual private label CMO’s that have an
amortized cost of $11,050 and a fair value (carrying value) of $10,411 as of
September 30, 2009. These securities were all performing as of
September 30, 2009 and are expected to perform based on current
information. In determining whether there existed other than
temporary impairment on these securities the Company evaluated the present value
of cash flows expected to be collected based on collateral specific assumptions,
including credit risk and liquidity risk, and determined that no losses are
expected. The Company will continue to evaluate its portfolio in this
manner on a quarterly basis.
PROVIDENT
NEW YORK BANCORP AND SUBSIDIARIES
Notes to
Consolidated Financial Statements
(Dollars
in thousands, except per share data)
|
(4)
|
Securities
Held to Maturity
|
The
following is a summary of securities held to
maturity:
|
Amortized Cost
|
Gross
Unrealized Gains
|
Gross
Unrealized Losses
|
Fair Value
|
|||||||||||||
|
September
30, 2009
|
||||||||||||||||
|
Mortgage-backed
securities
|
||||||||||||||||
|
Fannie
Mae
|
$ | 2,713 | $ | 110 | $ | - | $ | 2,823 | ||||||||
|
Freddie
Mac
|
2,834 | 82 | - | 2,916 | ||||||||||||
|
Other
|
905 | 6 | - | 911 | ||||||||||||
| 6,452 | 198 | - | 6,650 | |||||||||||||
|
Investment
securities
|
||||||||||||||||
|
State
and municipal securities
|
37,162 | 940 | (47 | ) | 38,055 | |||||||||||
|
Other
|
1,000 | 34 | - | 1,034 | ||||||||||||
| 38,162 | 974 | (47 | ) | 39,089 | ||||||||||||
|
Total
held to maturity
|
$ | 44,614 | $ | 1,172 | $ | (47 | ) | $ | 45,739 | |||||||
|
September
30, 2008
|
||||||||||||||||
|
Mortgage-backed
securities
|
||||||||||||||||
|
Fannie
Mae
|
$ | 4,929 | $ | 62 | $ | (4 | ) | $ | 4,987 | |||||||
|
Freddie
Mac
|
4,297 | 69 | (31 | ) | 4,335 | |||||||||||
|
Ginnie
Mae & Other
|
1,125 | 2 | (1 | ) | 1,126 | |||||||||||
| 10,351 | 133 | (36 | ) | 10,448 | ||||||||||||
|
Investment
securities
|
||||||||||||||||
|
State
and municipal securities
|
32,604 | 236 | (449 | ) | 32,391 | |||||||||||
|
Equities
|
58 | 2 | - | 60 | ||||||||||||
| 32,662 | 238 | (449 | ) | 32,451 | ||||||||||||
|
Total
held to maturity
|
$ | 43,013 | $ | 371 | $ | (485 | ) | $ | 42,899 | |||||||
The
following is a summary of the amortized cost and fair value of investment
securities held to maturity, by remaining period to contractual maturity. Actual
maturities may differ because certain issuers have the right to call or repay
their obligations.
|
September 30, 2009
|
||||||||
|
Amortized Cost
|
Fair Value
|
|||||||
|
Remaining
period to contractual maturity
|
||||||||
|
Less
than one year
|
$ | 21,104 | $ | 21,277 | ||||
|
One
to five years
|
8,677 | 8,938 | ||||||
|
Five
to ten years
|
2,724 | 2,935 | ||||||
|
Greater
than ten years
|
5,657 | 5,939 | ||||||
|
Total
|
$ | 38,162 | $ | 39,089 | ||||
PROVIDENT
NEW YORK BANCORP AND SUBSIDIARIES
Notes to
Consolidated Financial Statements
(Dollars
in thousands, except per share data)
Proceeds
from sales of securities held to maturity during the years ended September 30,
2009, 2008 and 2007 totaled $625, $0 and $0, respectively. These sales resulted
in gross realized gains of $33, $0 and $0 for the years ended September 30,
2009, 2008, and 2007 respectively, and gross realized losses of $0 in fiscal
year 2009, 2008, and 2007 respectively. These securities can be
considered maturities per FASB ASC Topic #320, Investments – Debt &
Equity securities, as the sale of the securities occurred after at least
85 percent of the principal outstanding had been collected since
acquisition.
The
following table summarizes those securities held to maturity with unrealized
losses, segregated by the length of time in a continuous unrealized loss
position:
|
Continuous
Unrealized Loss Position
|
||||||||||||||||||||||||
|
Less
Than 12 Months
|
12
Months or Longer
|
Total
|
||||||||||||||||||||||
|
As of September 30, 2009
|
Fair Value
|
Unrealized Losses
|
Fair Value
|
Unrealized Losses
|
Fair Value
|
Unrealized Losses
|
||||||||||||||||||
|
State
and municipal securities
|
$ | 1,019 | $ | (47 | ) | $ | - | $ | - | $ | 1,019 | $ | (47 | ) | ||||||||||
|
Total
|
$ | 1,019 | $ | (47 | ) | $ | - | $ | - | $ | 1,019 | $ | (47 | ) | ||||||||||
|
Continuous
Unrealized Loss Position
|
||||||||||||||||||||||||
|
Less
Than 12 Months
|
12
Months or Longer
|
Total
|
||||||||||||||||||||||
|
As of September 30, 2008
|
Fair Value
|
Unrealized Losses
|
Fair Value
|
Unrealized Losses
|
Fair Value
|
Unrealized Losses
|
||||||||||||||||||
|
Mortgage-backed
securities
|
$ | 3,654 | $ | (5 | ) | $ | 1,282 | $ | (31 | ) | $ | 4,936 | $ | (36 | ) | |||||||||
|
State
and municipal securities
|
13,136 | (420 | ) | 540 | (29 | ) | 13,676 | (449 | ) | |||||||||||||||
|
Other
securities
|
- | - | ||||||||||||||||||||||
|
Total
|
$ | 16,790 | $ | (425 | ) | $ | 1,822 | $ | (60 | ) | $ | 18,612 | $ | (485 | ) | |||||||||
All of
the unrealized losses on held to maturity securities at September 30, 2009
relate to local municipal general obligation bonds and are attributable to
changes in market interest rates and credit risk spreads subsequent to purchase.
There were no securities with unrealized losses that were individually
significant dollar amounts at September 30, 2009. A total of 7 held-to-maturity
securities were in a continuous unrealized loss position for less than 12
months, and 0 securities for 12 months or longer. For securities with fixed
maturities, there are no securities past due or securities for which the Company
currently believes it is not probable that it will collect all amounts due
according to the contractual terms of the investment. Because the Company has
the ability and intent to hold securities with unrealized losses until maturity,
the Company did not consider these investments to be other-than-temporarily
impaired at September 30, 2009.
PROVIDENT
NEW YORK BANCORP AND SUBSIDIARIES
Notes to
Consolidated Financial Statements
(Dollars
in thousands, except per share data)
|
(5)
|
Loans
|
The
components of the loan portfolio, excluding loans held for sale, were as
follows:
|
September 30,
|
||||||||
|
2009
|
2008
|
|||||||
|
One-
to four-family residential mortgage loans:
|
||||||||
|
Fixed
rate
|
$ | 419,863 | $ | 472,536 | ||||
|
Adjustable
rate
|
40,865 | 40,845 | ||||||
| 460,728 | 513,381 | |||||||
|
Commercial
real estate loans
|
554,550 | 554,811 | ||||||
|
Commercial
business loans
|
242,629 | 243,642 | ||||||
|
Acquisition,
development & construction loans
|
193,828 | 170,979 | ||||||
| 991,007 | 969,432 | |||||||
|
Consumer
loans:
|
||||||||
|
Home
equity lines of credit
|
180,205 | 166,491 | ||||||
|
Homeowner
loans
|
54,941 | 58,569 | ||||||
|
Other
consumer loans, including overdrafts
|
16,376 | 23,680 | ||||||
| 251,522 | 248,740 | |||||||
|
Total
loans
|
1,703,257 | 1,731,553 | ||||||
|
Allowance
for loan losses
|
(30,050 | ) | (23,101 | ) | ||||
|
Total
loans, net
|
$ | 1,673,207 | $ | 1,708,452 | ||||
Total
loans include net deferred loan origination costs of $1,654 and $2,711 at
September 30, 2009 and September 30, 2008, respectively.
A
substantial portion of the Company’s loan portfolio is secured by residential
and commercial real estate located in Rockland and Orange Counties of New York
and contiguous areas such as Ulster, Sullivan, Putnam and Westchester Counties
of New York and Bergen County, New Jersey. The ability of the Company’s
borrowers to make principal and interest payments is dependent upon, among other
things, the level of overall economic activity and the real estate market
conditions prevailing within the Company’s concentrated lending area. Commercial
real estate and acquisition, development and construction loans are considered
by management to be of somewhat greater credit risk than loans to fund the
purchase of a primary residence due to the generally larger loan amounts and
dependency on income production or sale of the real estate. Substantially all of
these loans are collateralized by real estate located in the Company’s primary
market area.
PROVIDENT
NEW YORK BANCORP AND SUBSIDIARIES
Notes to
Consolidated Financial Statements
(Dollars
in thousands, except per share data)
The
principal balances of non-performing loans were as follows:
|
2009
|
2008
|
|||||||||||||||
|
90
days past due and still
accruing
|
Non-Accrual
|
90
days past due and still
accruing
|
Non-Accrual
|
|||||||||||||
|
One-
to four-family residential mortgage loans
|
$ | 2,932 | $ | 4,425 | $ | 2,487 | $ | 1,731 | ||||||||
|
Commercial
real estate loans
|
977 | 5,826 | 732 | 3,100 | ||||||||||||
|
Commercial
business loans
|
- | 457 | - | 2,811 | ||||||||||||
|
Acquisition,
development & construction loans
|
440 | 10,830 | - | 5,596 | ||||||||||||
|
Consumer
loans
|
211 | 371 | 70 | 351 | ||||||||||||
|
Total
non-performing loans
|
$ | 4,560 | $ | 21,909 | $ | 3,289 | $ | 13,589 | ||||||||
|
Troubled
debt restructured loans
|
$ | 674 | $ | - | $ | - | $ | - | ||||||||
Gross
interest income that would have been recorded if the foregoing non-accrual loans
had remained current in accordance with their contractual terms totaled $1,429,
$1,129 and $362, for the years ended September 30, 2009, 2008 and 2007,
respectively, compared to interest income actually recognized (including income
recognized on a cash basis) of $724, $724 and $105, respectively.
The
Company’s impaired loans were $22,101 at September 30, 2009 and $13,237 million
as of September 30, 2008. Substantially all of these loans were
collateral-dependent loans measured based on the fair value of the collateral.
The Company determines the need for a specific allocation of the allowance for
loan losses on a loan-by-loan basis for impaired loans. The specific allocation
for impaired loans was $2.3 million and $1.3 million as of September 30, 2009
and 2008, respectively. The Company’s average recorded investment in impaired
loans was $19, 310, $9,465 and $1,500 during the years ended September 30, 2009,
2008, and 2007 respectively. Interest income recognized (including
income recognized on a cash basis) for impaired loans was $723, $698 and $91 for
the years ended September 30, 2009, 2008, and 2007 respectively.
Activity
in the allowance for loan losses is summarized as follows:
|
Year ended September 30,
|
||||||||||||
|
2009
|
2008
|
2007
|
||||||||||
|
Balance
at beginning of year
|
$ | 23,101 | $ | 20,389 | $ | 20,373 | ||||||
|
Provision
for loan losses
|
17,600 | 7,200 | 1,800 | |||||||||
|
Charge-offs
|
(11,289 | ) | (4,929 | ) | (2,493 | ) | ||||||
|
Recoveries
|
638 | 441 | 709 | |||||||||
|
Net
Charge offs
|
(10,651 | ) | (4,488 | ) | (1,784 | ) | ||||||
|
Balance
at end of year
|
$ | 30,050 | $ | 23,101 | $ | 20,389 | ||||||
Provisions
for losses and other activity in the allowance for losses on real estate owned
were insignificant during the years ended September 30, 2009, 2008 and
2007.
Certain
residential mortgages originated by the Company are sold in the secondary
market. Non-interest income includes net gains on such sales of $961 in fiscal
2009, $0 in fiscal 2008, and $155 in fiscal 2007. At September 30, 2009 and 2008
there were $1,213 and $189 residential mortgage loans held for sale,
respectively. The Company ceased originating student loans in
2007.
PROVIDENT
NEW YORK BANCORP AND SUBSIDIARIES
Notes to
Consolidated Financial Statements
(Dollars
in thousands, except per share data)
Other
assets at September 30, 2009 and 2008 include capitalized mortgage servicing
rights with a carrying amount of $840 and $655, respectively, which are recorded
at the lower of amortized cost or fair market value. The Company
recorded a valuation allowance of $115 at September 30, 2009. No
valuation allowance was required at September 30, 2008. The Company
generally retains the servicing rights on mortgage loans sold. Servicing loans
for others involves collecting payments, maintaining escrow accounts, making
remittances to investors and, if necessary, processing foreclosures. Mortgage
loans serviced for others, including loan participations, totaled approximately
$163,621, $129,331 and $122,279 at September 30, 2009, 2008 and 2007,
respectively. Mortgage escrow funds include balances of $1,018 and $766 at
September 30, 2009 and 2008, respectively, related to loans serviced for
others.
|
(6)
|
Accrued
Interest Receivable
|
The
components of accrued interest receivable were as follows:
|
September 30,
|
||||||||
|
2009
|
2008
|
|||||||
|
Loans
|
$ | 5,417 | $ | 5,984 | ||||
|
Securities
|
5,055 | 4,897 | ||||||
|
Total
accrued interest receivable
|
$ | 10,472 | $ | 10,881 | ||||
|
(7)
|
Premises
and Equipment, Net
|
Premises
and equipment are summarized as follows:
|
September 30,
|
||||||||
|
2009
|
2008
|
|||||||
|
Land
and land improvements
|
$ | 4,320 | $ | 3,779 | ||||
|
Buildings
|
31,332 | 26,916 | ||||||
|
Leasehold
improvements
|
8,553 | 8,559 | ||||||
|
Furniture,
fixtures and equipment
|
30,963 | 29,086 | ||||||
| 75,168 | 68,340 | |||||||
|
Accumulated
depreciation and amortization
|
(34,476 | ) | (31,624 | ) | ||||
|
Total
premises and equipment, net
|
$ | 40,692 | $ | 36,716 | ||||
PROVIDENT
NEW YORK BANCORP AND SUBSIDIARIES
Notes to
Consolidated Financial Statements
(Dollars
in thousands, except per share data)
|
(8)
|
Deposits
|
Deposit
balances and weighted average interest rates at September 30, 2009 and 2008 are
summarized as follows:
|
September 30,
|
||||||||||||||||
|
2009
|
2008
|
|||||||||||||||
|
Amount
|
Rate
|
Amount
|
Rate
|
|||||||||||||
|
Non
interest bearing demand deposits:
|
||||||||||||||||
|
Retail
|
$ | 169,122 | — | % | $ | 162,161 | — | % | ||||||||
|
Commercial
|
236,516 | — | 203,682 | — | ||||||||||||
|
Municipal
|
86,596 | — | 122,047 | — | ||||||||||||
|
Business
NOW deposits
|
36,972 | 0.22 | 20,881 | 0.49 | ||||||||||||
|
Municipal
NOW deposits
|
188,074 | 0.28 | 196,581 | 0.49 | ||||||||||||
|
Personal
NOW deposits
|
127,595 | 0.11 | 115,442 | 0.10 | ||||||||||||
|
Savings
deposits
|
357,814 | 0.11 | 335,986 | 0.33 | ||||||||||||
|
Money
market deposits
|
384,632 | 0.43 | 306,504 | 1.46 | ||||||||||||
|
Certificates
of deposit
|
494,961 | 1.83 | 525,913 | 2.79 | ||||||||||||
|
Total
deposits
|
$ | 2,082,282 | 0.57 | % | $ | 1,989,197 | 1.08 | % | ||||||||
Municipal
deposits held by PMB totaled $470,170 and $460,820 at September 30, 2009 and
September 30, 2008, respectively. See Note 3, “Securities Available for Sale,”
for the amount of securities that are pledged as collateral for municipal
deposits and other purposes. Deposits received for tax receipts
were $201,000 and $242,300 at September 30, 2009 and September 30, 2008,
respectively.
Certificates
of deposit had remaining periods to contractual maturity as
follows:
|
September 30,
|
||||||||
|
2009
|
2008
|
|||||||
|
Remaining
period to contractual maturity:
|
||||||||
|
Less
than one year
|
$ | 439,642 | $ | 487,419 | ||||
|
One
to two years
|
19,081 | 23,805 | ||||||
|
Two
to three years
|
10,952 | 3,990 | ||||||
|
Three
to four years
|
8,741 | 2,523 | ||||||
|
Four
to five years
|
16,545 | 8,176 | ||||||
|
Total
certificates of deposit
|
$ | 494,961 | $ | 525,913 | ||||
Certificate
of deposit accounts with a denomination of $100k or more totaled $160,660 and
$186,326 at September 30, 2009 and 2008, respectively. The Company had $20,578
(including certificates of deposit account registers service (CDAR’s) reciprocal
CDs of $10,558) and $16,582 (none of which were CDAR’s) of brokered deposits as
of September 30, 2009 and 2008, respectively.
Interest
expense on deposits is summarized as follows:
|
Years ended September 30,
|
||||||||||||
|
2009
|
2008
|
2007
|
||||||||||
|
Savings
deposits
|
$ | 758 | $ | 1,244 | $ | 1,930 | ||||||
|
Money
market and NOW deposits
|
3,377 | 6,313 | 7,293 | |||||||||
|
Certificates
of deposit
|
14,240 | 20,787 | 27,216 | |||||||||
|
Total
interest expense
|
$ | 18,375 | $ | 28,344 | $ | 36,439 | ||||||
PROVIDENT
NEW YORK BANCORP AND SUBSIDIARIES
Notes to
Consolidated Financial Statements
(Dollars
in thousands, except per share data)
|
(9)
|
FHLB
and Other Borrowings
|
The
Company’s FHLB and other borrowings and weighted average interest rates are
summarized as follows:
|
September 30,
|
||||||||||||||||
|
2009
|
2008
|
|||||||||||||||
|
Amount
|
Rate
|
Amount
|
Rate
|
|||||||||||||
|
By
type of borrowing:
|
||||||||||||||||
|
Advances
|
$ | 200,628 | 4.16 | % | $ | 305,842 | 3.20 | % | ||||||||
|
Repurchase
agreements
|
230,000 | 3.95 | % | 260,166 | 3.85 | % | ||||||||||
|
Senior
unsecured debt (FDIC insured)
|
51,494 | 2.74 | % | - | ||||||||||||
|
Total
borrowings
|
$ | 482,122 | 3.91 | % | $ | 566,008 | 3.50 | % | ||||||||
|
By
remaining period to maturity:
|
||||||||||||||||
|
Less
than one year
|
$ | 62,677 | 4.09 | % | $ | 153,893 | 2.16 | % | ||||||||
|
One
to two years
|
44,921 | 3.79 | % | 52,961 | 3.62 | % | ||||||||||
|
Two
to three years
|
73,994 | 3.14 | % | 32,129 | 3.88 | % | ||||||||||
|
Three
to four years
|
31,639 | 3.98 | % | 22,500 | 4.03 | % | ||||||||||
|
Four
to five years
|
25,159 | 4.14 | % | 35,424 | 3.96 | % | ||||||||||
|
Greater
than five years
|
243,732 | 4.09 | % | 269,101 | 4.09 | % | ||||||||||
|
Total
borrowings
|
$ | 482,122 | 3.91 | % | $ | 566,008 | 3.50 | % | ||||||||
As a
member of the FHLB, the Bank may borrow in the form of term and overnight
borrowings up to the amount of eligible residential mortgage loans and
securities that have been pledged as collateral under a blanket security
agreement. As of September 30, 2009 and 2008, the Bank had pledged residential
mortgage loans totaling $350,538 and $385,279, respectively. The Bank had also
pledged securities with carrying amounts of $231,190 and $323,694 as of
September 30, 2009 and September 30, 2008, respectively, to secure repurchase
agreements. Based on total outstanding borrowings with the FHLB which
totaled $430,628 and $555,252 as of September 30, 2009 and September 30, 2008,
the bank had unused borrowing capacity under the FHLB Line of Credit of $200,000
and $142,000, respectively. As of September 30, 2009, the Bank may
borrow amounts in addition to the line of credit by pledging securities and
mortgages not required to be pledged for other purposes with a market value of
$379,000. FHLB advances are subject to prepayment penalties if repaid prior to
maturity.
Securities
repurchase agreements had weighted average remaining terms to maturity of
approximately 6.2 years and 6.4 years at September 30, 2009 and 2008,
respectively. Average borrowings under securities repurchase agreements were
$238,750 and $254,189 during the years ended September 30, 2009 and 2008,
respectively, and the maximum outstanding month-end balance was $250,000 and
$299,564, respectively.
FHLB
borrowings (includes advances and repurchase agreements) of $227,500 and
$302,500 at September 30, 2009 and 2008 respectively are callable quarterly, at
the discretion of the FHLB. These borrowings have a weighted average remaining
term to the contractual maturity dates of approximately 6.75 years and 7.3 years
and weighted average interest rates of 4.63% and 4.24% at September 30, 2009 and
2008, respectively.
PROVIDENT
NEW YORK BANCORP AND SUBSIDIARIES
Notes to
Consolidated Financial Statements
(Dollars
in thousands, except per share data)
|
(10)
|
Income
Taxes
|
Income
tax expense consists of the following:
|
Years ended September 30,
|
||||||||||||
|
2009
|
2008
|
2007
|
||||||||||
|
Current
tax expense:
|
||||||||||||
|
Federal
|
$ | 10,369 | $ | 10,774 | $ | 6,462 | ||||||
|
State
|
1,446 | 1,658 | 833 | |||||||||
| 11,815 | 12,432 | 7,295 | ||||||||||
|
Deferred
tax expense (benefit):
|
||||||||||||
|
Federal
|
(1,567 | ) | (2,056 | ) | 1,015 | |||||||
|
State
|
(73 | ) | (472 | ) | 256 | |||||||
| (1,640 | ) | (2,528 | ) | 1,271 | ||||||||
|
Total
income tax expense
|
$ | 10,175 | $ | 9,904 | $ | 8,566 | ||||||
Actual
income tax expense differs from the tax computed based on pre-tax income and the
applicable statutory Federal tax rate, for the following reasons:
|
Years ended September 30,
|
||||||||||||
|
2009
|
2008
|
2007
|
||||||||||
|
Tax
at Federal statutory rate of 35%
|
$ | 12,612 | $ | 11,789 | $ | 9,868 | ||||||
|
State
income taxes, net of Federal tax benefit
|
892 | 771 | 708 | |||||||||
|
Tax-exempt
interest
|
(2,536 | ) | (2,241 | ) | (1,783 | ) | ||||||
|
Nondeductible
portion of ESOP expense
|
19 | 112 | 551 | |||||||||
|
BOLI
income
|
(964 | ) | (641 | ) | (715 | ) | ||||||
|
Low-income
housing and other tax credits
|
- | - | (55 | ) | ||||||||
|
Other,
net
|
152 | 114 | (8 | ) | ||||||||
|
Actual
income tax expense
|
$ | 10,175 | $ | 9,904 | $ | 8,566 | ||||||
|
Effective
income tax rate
|
28.2 | % | 29.4 | % | 30.4 | % | ||||||
PROVIDENT
NEW YORK BANCORP AND SUBSIDIARIES
Notes to
Consolidated Financial Statements
(Dollars
in thousands, except per share data)
The tax
effects of temporary differences that give rise to deferred tax assets and
liabilities are summarized below. The net amount is reported in other assets or
other liabilities in the consolidated statements of financial
condition.
|
September 30,
|
||||||||
|
2009
|
2008
|
|||||||
|
Deferred
tax assets:
|
||||||||
|
Allowance
for loan losses
|
$ | 12,203 | $ | 9,381 | ||||
|
Deferred
compensation
|
3,715 | 3,702 | ||||||
|
Purchase
accounting adjustments
|
105 | 282 | ||||||
|
Other
comprehensive loss
|
- | 6,546 | ||||||
|
Goodwill
|
184 | 213 | ||||||
|
Accrued
post retirement expense
|
1,111 | 1,102 | ||||||
|
Other
|
1,014 | 580 | ||||||
|
Total
deferred tax assets
|
18,332 | 21,806 | ||||||
|
Deferred
tax liabilities:
|
||||||||
|
Undistributed
earnings of subsidiary not consolidated for tax return purposes (REIT
Income)
|
6,518 | 6,723 | ||||||
|
Prepaid
pension costs
|
3,866 | 2,035 | ||||||
|
Core
deposit intangibles
|
367 | 939 | ||||||
|
Purchase
accounting fair value adjustments
|
249 | 249 | ||||||
|
Depreciation
of premises and equipment
|
705 | 150 | ||||||
|
Other
comprehensive income
|
1,694 | - | ||||||
|
Other
|
980 | 1,156 | ||||||
|
Total
deferred tax liabilities
|
14,379 | 11,252 | ||||||
|
Net
deferred tax asset
|
$ | 3,953 | $ | 10,554 | ||||
Based on
management’s consideration of historical and anticipated future pre-tax income,
as well as the reversal period for the items giving rise to the deferred tax
assets and liabilities, a valuation allowance for deferred tax assets was not
considered necessary at September 30, 2009 and 2008.
The Bank
is subject to special provisions in the Federal and New York State tax laws
regarding its allowable tax bad debt deductions and related tax bad debt
reserves. Tax bad debt reserves consist of a defined “base-year” amount, plus
additional amounts accumulated after the base year. Deferred tax liabilities are
recognized with respect to reserves accumulated after the base year, as well as
any portion of the base-year amount that is expected to become taxable (or
recaptured) in the foreseeable future. The Bank’s base-year tax bad debt
reserves for Federal tax purposes were $9,313 at both September 30, 2009 and
2008. The Bank’s tax bad debt reserves for NY State purposes were $46,555 and
$48,423 at September 30, 2009 and 2008, respectively. Associated deferred tax
liabilities of $5,872 and $5,976 have not been recognized at those dates since
the Company does not expect that the Federal base-year reserves ($3,260) and New
York State bad debt reserves ($2,612) and ($2,716) net of federal
benefit at September 30, 2009 and 2008, respectively will become
taxable in the foreseeable future. Under the tax laws, events that would result
in taxation of certain of these reserves include (i) redemptions of the Bank’s
stock or certain excess distributions by the Bank to Provident New York Bancorp
and (ii) failure of the Bank to maintain a specified qualifying-assets ratio or
meet other thrift definition tests for New York State tax
purposes.
PROVIDENT
NEW YORK BANCORP AND SUBSIDIARIES
Notes to
Consolidated Financial Statements
(Dollars
in thousands, except per share data)
Unrecognized Tax
Benefits
A
reconciliation of the beginning and ending amount of unrecognized tax benefits
is as follows:
|
Balance
at October 1, 2008
|
$ | 596 | ||
|
Additions
for tax positions of prior years
|
- | |||
|
Reductions
due to the statute of limitations
|
(596 | ) | ||
|
Balance
at September 30, 2009
|
$ | - |
The
Company does not expect that the total amount of unrecognized tax benefits to
significantly increase or decrease in the next twelve months.
The total
amount of interest and penalties recorded in the income statement in income tax
expense (benefit) for the years ended September 30, 2009 and September 30, 2008
were ($89) and $58 respectively.
The
Company and its subsidiaries are subject to U.S. federal income tax as well as
income tax of the state of New York and various other state income
taxes. The tax years that are currently open for audit are 2006 and
later for both federal and for New York State income tax.
|
(11)
|
Employee
Benefit Plans and Stock-Based Compensation
Plans
|
|
(a)
|
Pension
Plans
|
The
Company has a noncontributory defined benefit pension plan covering employees
that were eligible as of September 30, 2006. In July, 2006 the Board of
Directors of the Company approved a curtailment to the Provident Bank Defined
Benefit Pension Plan (“the Plan”) as of September 30, 2006. At that time, all
benefit accruals for future service ceased and no new participants may enter the
plan. The purpose of the Plan curtailment was to afford flexibility in the
retirement benefits the Company provides, while preserving all retirement plan
participants’ earned and vested benefits, and to manage the increasing costs
associated with the defined benefit pension plan. The Company’s funding policy
is to contribute annually an amount sufficient to meet statutory minimum funding
requirements, but not in excess of the maximum amount deductible for Federal
income tax purposes. Contributions are intended to provide not only for benefits
attributed to service to date, but also for benefits expected to be earned in
the future.
In
addition, the Board approved amending the Provident Bank 401(k) and Profit
Sharing Plan, a 401(k) plan available to all employees who are age 21 or older.
The amendment to the 401(k) plan added a profit sharing contribution for
employees, which was 3% of eligible compensation for fiscal 2009 and
2008.
PROVIDENT
NEW YORK BANCORP AND SUBSIDIARIES
Notes to
Consolidated Financial Statements
(Dollars
in thousands, except per share data)
The
following is a summary of changes in the projected benefit obligation and fair
value of plan assets. The Company uses a September 30 measurement
date for its pension plans.
|
September 30,
|
||||||||
|
2009
|
2008
|
|||||||
|
Changes
in projected benefit obligation:
|
||||||||
|
Beginning
of year
|
$ | 23,100 | $ | 29,092 | ||||
|
Service
cost
|
- | - | ||||||
|
Interest
cost
|
1,593 | 1,558 | ||||||
|
Actuarial
(gain) loss
|
4,130 | (2,187 | ) | |||||
|
Contract
conversion
|
- | (3,964 | ) | |||||
|
Benefits
paid
|
(860 | ) | (1,399 | ) | ||||
|
End
of year
|
27,963 | 23,100 | ||||||
|
Changes
in fair value of plan assets:
|
||||||||
|
Beginning
of year
|
20,926 | 31,701 | ||||||
|
Actual
gain (loss) on plan assets
|
287 | (5,412 | ) | |||||
|
Employer
contributions
|
5,150 | - | ||||||
|
Contract
conversion
|
- | (3,964 | ) | |||||
|
Benefits
and distributions paid
|
(860 | ) | (1,399 | ) | ||||
|
End
of year
|
25,503 | 20,926 | ||||||
|
Funded
status at end of year
|
$ | (2,460 | ) | $ | (2,174 | ) | ||
Amounts
recognized in accumulated other comprehensive loss at September 30, 2009 and
2008 consisted of:
|
2009
|
2008
|
|||||||
|
Unrecognized
actuarial loss
|
$ | 11,980 | $ | 7,185 | ||||
|
Deferred
tax asset
|
(4,865 | ) | (2,913 | ) | ||||
|
Net
amount recognized in accumulated other comprehensive loss
|
$ | 7,115 | $ | 4,272 | ||||
Discount
rates of 5.75%, 7.0% and 6.25% were used in determining the actuarial present
value of the projected benefit obligation at September 30, 2009, 2008 and 2007,
respectively. No compensation increases were used as the plan is
frozen. The weighted average long-term rate of return on plan assets
was 7.75% for fiscal years ended 2009, 2008 and 2007. The accumulated benefit
obligation was $27,963 and $23,100 at year end September 30, 2009 and 2008
respectively. The discount rate used in the determination of net
periodic pension expense were 7.0%, 6.25%, and 6.0% for the years ending
September 30, 2009, 2008 and 2007, respectively.
The
following benefit payments, which reflect expected future service, as
appropriate, are expected to be paid:
|
2010
|
1,215 |
|
2011
|
1,285 |
|
2012
|
1,339 |
|
2013
|
1,423 |
|
2014
|
1,527 |
|
2015
- 2019
|
9,227 |
PROVIDENT
NEW YORK BANCORP AND SUBSIDIARIES
Notes to
Consolidated Financial Statements
(Dollars
in thousands, except per share data)
The
components of the net periodic pension expense (benefit) were as
follows:
|
Years
ended September 30,
|
||||||||||||
|
2009
|
2008
|
2007
|
||||||||||
|
Service
cost
|
$ | - | $ | - | $ | - | ||||||
|
Interest
cost
|
1,593 | 1,558 | 1,735 | |||||||||
|
Expected
return on plan assets
|
(1,778 | ) | (2,110 | ) | (2,285 | ) | ||||||
|
Amortization
of unrecognized loss
|
826 | - | - | |||||||||
|
Recognized
net actuarial loss
|
- | - | 55 | |||||||||
|
Net
periodic pension expense (benefit)
|
$ | 641 | $ | (552 | ) | $ | (495 | ) | ||||
Unrecognized
actuarial loss and prior service cost totaling $1.5 million is
expected to be amortized to pension expense during the next fiscal year ending
September 30, 2010.
Weighted-average
pension plan asset allocations based on the fair value of such assets at
September 30, 2009, and September 30, 2008 and target allocations for 2010, by
asset category, are as follows:
|
September 30,
2008
|
September 30,
2009
|
Target Allocation 2010
|
||||||||||
|
Equity
securities
|
71 | % | 70 | % | 70 | % | ||||||
|
Fixed
income
|
29 | % | 30 | % | 30 | % | ||||||
|
Cash
|
0 | % | 0 | % | 0 | % | ||||||
The
expected long-term rate of return assumption as of each measurement date was
determined by taking into consideration asset allocations as of each such date,
historical returns on the types of assets held, and current economic factors.
The Company’s investment policy for determining the asset allocation targets was
developed based on the desire to optimize total return while placing a strong
emphasis on preservation of capital. In general, it is hoped that, in the
aggregate, changes in the fair value of plan assets will be less volatile than
similar changes in appropriate market indices. Returns on invested assets are
periodically compared with target market indices for each asset type to aid
management in evaluating such returns.
There
were no pension plan assets consisting of Provident New York Bancorp equity
securities (common stock) at September 30, 2009 or at September 30,
2008.
The
Company makes contributions to its funded qualified pension plans as required by
government regulation or as deemed appropriate by management after considering
the fair value of plan assets, expected returns on such assets, and the present
value of benefit obligations of the plans. At this time, the Company has not
determined whether contributions in 2010 will be made.
The
Company has also established a non-qualified Supplemental Executive Retirement
Plan to provide certain executives with supplemental retirement benefits in
addition to the benefits provided by the pension plan due to amounts limited by
the Internal Revenue Code of 1986, as amended (“IRS Code”). The periodic pension
expense for the supplemental plan amounted to $94, $82 and $78 for the years
ended September 30, 2009, 2008 and 2007, respectively. The actuarial present
value of the projected benefit obligation was $1,587 and $1,353 at September 30,
2009 and 2008, respectively, and the vested benefit obligation was $1,587 and
$1,353 for the same periods, respectively, all of which is
unfunded.
PROVIDENT
NEW YORK BANCORP AND SUBSIDIARIES
Notes to
Consolidated Financial Statements
(Dollars
in thousands, except per share data)
(b)
Other Postretirement Benefit Plans
The
Company’s postretirement plans, which are unfunded, provide optional medical,
dental and life insurance benefits to retirees or death benefit payments to
beneficiaries of employees covered by the Company and Bank Owned Life Insurance
policies. The Company has elected to amortize the transition obligation for
accumulated benefits to retirees as an expense over a 20-year
period.
Data
relating to the postretirement benefit plan follows:
|
September 30,
|
||||||||
|
2009
|
2008
|
|||||||
|
Change
in accumulated postretirement benefit obligation:
|
||||||||
|
Beginning
of year
|
$ | 1,720 | $ | 1,341 | ||||
|
Service
cost
|
22 | 17 | ||||||
|
Interest
cost
|
118 | 94 | ||||||
|
Actuarial
(gain)
|
272 | (168 | ) | |||||
|
Plan
participants' contributions
|
- | 92 | ||||||
|
Amendments
|
- | 498 | ||||||
|
Benefits
paid
|
(91 | ) | (154 | ) | ||||
|
End
of year
|
$ | 2,041 | $ | 1,720 | ||||
|
Changes
in fair value of plan assets:
|
||||||||
|
Beginning
of year
|
$ | - | $ | - | ||||
|
Employer
contributions
|
91 | 62 | ||||||
|
Plan
participants' contributions
|
- | 92 | ||||||
|
Benefits
paid
|
(91 | ) | (154 | ) | ||||
|
End
of year
|
$ | - | $ | - | ||||
|
Funded
status
|
$ | (2,041 | ) | $ | (1,720 | ) | ||
Components
of net periodic benefit expense (benefit):
|
For
years ended September 30,
|
||||||||||||
|
2009
|
2008
|
2007
|
||||||||||
|
Service
Cost
|
$ | 22 | $ | 17 | $ | 19 | ||||||
|
Interest
Cost
|
118 | 94 | 79 | |||||||||
|
Amortization
of transition obligation
|
24 | 10 | 10 | |||||||||
|
Amortization
of prior service cost
|
49 | 20 | 7 | |||||||||
|
Amortization
of actuarial gain
|
(119 | ) | (115 | ) | (132 | ) | ||||||
|
Total
|
$ | 94 | $ | 26 | $ | (17 | ) | |||||
There is
no unrecognized actuarial loss and prior service cost expected to be amortized
out of accumulated other comprehensive income in 2010.
PROVIDENT
NEW YORK BANCORP AND SUBSIDIARIES
Notes to
Consolidated Financial Statements
(Dollars
in thousands, except per share data)
|
Estimated
Future Benefit Payments
|
||
|
The
following benefit payments are expected to be paid in future
years:
|
||
|
2010
|
131
|
|
|
2011
|
133
|
|
|
2012
|
135
|
|
|
2013
|
140
|
|
|
2014
|
143
|
|
|
2015-2018
|
755
|
|
|
Assumptions used for plan
|
2009
|
2008
|
||||||
|
Medical
trend rate next year
|
4.50 | % | 4.50 | % | ||||
|
Ultimate
trend rate
|
4.50 | % | 4.50 | % | ||||
|
Discount
rate
|
5.50 | % | 7.25 | % | ||||
|
Discount
rate used to value periodic cost
|
7.25 | % | 6.25 | % | ||||
There is
no impact of a 1% increase or decrease in health care trend rate due to the
Company's cap on cost.
Amounts
recognized in accumulated other comprehensive income (loss) at September 30,
2009 and 2008 consisted of:
|
2009
|
2008
|
|||||||
|
Post
retirement plan unrecognized gain
|
$ | 1,235 | $ | 1,499 | ||||
|
Post
retirement plan unrecognized service cost
|
(461 | ) | (509 | ) | ||||
|
Post
retirement unrecognized transition obligation
|
(61 | ) | (70 | ) | ||||
|
Post
retirement SERP
|
(182 | ) | (7 | ) | ||||
|
Post
employment BOLI
|
(61 | ) | 66 | |||||
|
Transition
obligation
|
(621 | ) | - | |||||
|
Subtotal
|
(151 | ) | 979 | |||||
|
Deferred
tax liability
|
61 | (396 | ) | |||||
|
Net
amount recognized in accumulated other comprehensive income
(loss)
|
$ | (90 | ) | $ | 583 | |||
PROVIDENT
NEW YORK BANCORP AND SUBSIDIARIES
Notes to
Consolidated Financial Statements
(Dollars
in thousands, except per share data)
As of
September 30, 2007, the Company adopted FASB ASC Topic # 715 Compensation - Retirement Benefits.
Accordingly, the Company recorded a charge of $287, net of taxes, to
accumulated other comprehensive loss related to our pension and other
postretirement plans for the year ended September 30, 2007, as
follows:
|
Pension
Plan unrecognized actuarial loss
|
$ | (1,848 | ) | |
|
Post
retirement plan unrecognized gain
|
1,510 | |||
|
Post
retirement plan unrecognized service cost
|
(31 | ) | ||
|
Post
retirement plan unrecognized transition obligation
|
(81 | ) | ||
|
Post
retirement SERP
|
(30 | ) | ||
|
Subtotal
|
(480 | ) | ||
|
Net
deferred tax asset
|
193 | |||
|
Net
amount recognized in accumulated other comprehensive
income
|
$ | (287 | ) |
|
(c)
|
Employee
Savings Plan
|
The
Company also sponsors a defined contribution plan established under Section
401(k) of the IRS Code. Eligible employees may elect to contribute up to 50% of
their compensation to the plan. The Company currently makes matching
contributions equal to 50% of a participant’s contributions up to a maximum
matching contribution of 3% of eligible compensation. Effective after September
30, 2006, the Bank amended the plan to include a profit sharing component which
was 3% of eligible compensation, in addition to the matching contributions for
2009. Voluntary matching and profit sharing contributions are
invested, in accordance with the participant’s direction, in one or a number of
investment options. Savings plan expense was $1,594, $1,626, and $1,368 for the
years ended September 30, 2009, 2008 and 2007, respectively.
|
(d)
|
Employee
Stock Ownership Plan
|
In
connection with the reorganization and initial common stock offering in 1999,
the Company established an ESOP for eligible employees who meet certain age and
service requirements. The ESOP borrowed $3,760 from the Bank and used the funds
to purchase 1,370,112 shares of common stock in the open market subsequent to
the Offering. The Bank made periodic contributions to the ESOP sufficient to
satisfy the debt service requirements of the loan which matured December 31,
2007. The ESOP used these contributions, any dividends received by the ESOP on
unallocated shares and forfeitures beginning in 2007, to make principal and
interest payments on the loan.
In
connection with the Second-Step Stock Conversion and Offering in January 2004,
the Company established an additional ESOP loan for eligible employees. The ESOP
borrowed $9,987 from Provident New York Bancorp and used the funds to purchase
998,650 shares of common stock in the offering. The term of the second ESOP loan
is twenty years.
ESOP
shares are held by the plan trustee in a suspense account until allocated to
participant accounts. Shares released from the suspense account are allocated to
participants on the basis of their relative compensation in the year of
allocation. Participants become vested in the allocated shares over a period not
to exceed five years. Any forfeited shares were allocated to other participants
in the same proportion as contributions through 2006 and beginning in 2007 are
used by the plan to reduce debt service. A total of $4, $293 and $250
was reversed against expense for the years ended September 30, 2009, 2008, and
2007 respectively.
ESOP
expense was $484 (net of forfeitures), $802 (net of forfeitures), and $2,393 for
the years ended September 30, 2009, 2008 and 2007, respectively. Through
September 30, 2009 and 2008, a cumulative total of 1,655,146 shares and
1,605,214 shares, respectively, have been allocated to participants or committed
to be released for allocation, respectively. The cost of ESOP shares that have
not yet been allocated to participants or committed to be released for
allocation is deducted from stockholders’ equity (713,622 shares with a cost of
$7,136 and a fair value of approximately $6,815 at September 30, 2009 and
763,554 shares with a cost of $7,635 and a fair value of approximately $10,094
at September 30, 2008, respectively).
PROVIDENT
NEW YORK BANCORP AND SUBSIDIARIES
Notes to
Consolidated Financial Statements
(Dollars
in thousands, except per share data)
A
supplemental savings plan has also been established for certain senior officers
to compensate executives for benefits provided under the Bank’s tax qualified
plans (employee’s savings plan and ESOP) that are limited by the IRS Code.
Expense recognized for this plan including the defined benefit component was
$212, $234, and $195 for the years ended September 30, 2009, 2008 and 2007,
respectively. Amounts accrued and recorded in other liabilities at September 30,
2009 and 2008, including the defined benefit component were $2.8 million and
$2.4 million respectively.
(e)
Recognition and Retention Plan
In
February 2000, the Company’s stockholders approved the Provident Bank 2000
Recognition and Retention Plan (the RRP). The principal purpose of the RRP is to
provide executive officers and directors a proprietary interest in the Company
in a manner designed to encourage their continued performance and service. A
total of 856,320 shares were awarded under the RRP in February 2000, and the
grant-date fair value of these shares of $2,995 was charged to stockholders’
equity. The awards vested at a rate of 20% on each of five annual vesting dates,
the first of which was September 30, 2000. As of September 30, 2009, 27,413
shares remain available for future grant from this plan. In January 2005, the
Company’s stockholders approved the Provident Bancorp, Inc. 2004 Stock Incentive
Plan, under the terms of which the Company is authorized to issue up to 798,920
shares of common stock as restricted stock awards. On March 10, 2005 a total of
762,400 shares were awarded under the RRP, and the grant-date fair value of
$12.84 per share $(9,789), was charged to stockholders’ equity. The awards
vested 10% on September 30, 2005. The remainder will vest 20% on each of four
annual vesting dates beginning on September 30, 2006 and 10% on March 10, 2010.
Employees who retire under circumstances in accordance with the terms of the
Plan may be entitled to accelerate the vesting of individual awards. Such
acceleration would require a charge to earnings for the award shares that would
then vest. As of September 30, 2009, 47,800 shares were potentially subject to
accelerated vesting. The Company granted an additional 6,000 shares in 2008 at
an average grant date fair value of $13.46, vesting 20% each year.
Under the
2004 restricted stock plan, 49,620 shares of authorized but un-issued shares
remain available for future grant at September 30, 2009. Forfeited shares are
available for re-issuance. The Company also can fund the restricted
stock plan with treasury stock. The fair market value of the shares awarded
under the restricted stock plan is being amortized to expense on a straight-line
basis over the five year vesting period of the underlying shares. Compensation
expense related to the restricted stock plan was $1.7 million, $1.8 million and
$2.0 million for the years ended September 30, 2009, 2008 and 2007,
respectively. The remaining unearned compensation cost is $1.0 million as of
September 30, 2009 and is recorded as a reduction of additional paid in capital.
On grant date, shares awarded under the restricted stock plan were transferred
from treasury stock at cost with the difference between the fair market value on
the grant date and the cost basis of the shares recorded as a reduction to
retained earnings or an increase to additional paid-in capital, as applicable.
The fair value of the shares awarded, measured as of the grant date continues to
be recognized and amortized on a straight-line basis to compensation expense
over the vesting period of the awards.
A summary
of restricted stock award activity under the plan for the year ended September
30, 2009, is presented below:
|
Number
of Shares
|
Weighted
Average
Grant-Date
Fair Value
|
|||||||
|
Nonvested
shares at September 30, 2008
|
205,950 | $ | 12.89 | |||||
|
Granted
|
- | - | ||||||
|
Vested
|
131,200 | 12.86 | ||||||
|
Forfeited
|
- | - | ||||||
|
Nonvested
shares at September 30, 2009
|
74,750 | $ | 12.93 | |||||
The total
fair value of restricted stock vested for fiscal year ended September 30, 2009,
2008 and 2007 was $1.3 million, $1.9 million and $2.1 million,
respectively. The intrinsic value of shares vested during 2009 was
$(434).
PROVIDENT
NEW YORK BANCORP AND SUBSIDIARIES
Notes to
Consolidated Financial Statements
(Dollars
in thousands, except per share data)
(f)
Stock Option Plan
The
Company’s stockholders approved the Provident Bank 2000 Stock Option Plan (the
Stock Option Plan) in February 2000. A total of 1,712,640 shares of authorized
but unissued common stock was reserved for issuance under the Stock Option Plan,
although the Company may also fund option exercises using treasury shares. The
Company’s stockholders also approved the Provident Bancorp, Inc. 2004 Stock
Incentive Plan, in February 2005. Under terms of the plan, a total of 1,997,300
shares of authorized but un-issued common stock were reserved for issuance under
the Stock Option Plan. In March, 2005, 1,718,300 options were granted. Under
both plans, options have a ten-year term and may be either non-qualified stock
options or incentive stock options. Reload options may be granted under the
terms of the 2000 Stock Option Plan and provide for the automatic grant of a new
option at the then-current market price in exchange for each previously owned
share tendered by an employee in a stock-for-stock exercise. The 2004 Plan
options do not contain reload options. However, the 2004 plan allows for the
grant of stock appreciation rights. Each option entitles the holder
to purchase one share of common stock at an exercise price equal to the fair
market value of the stock on the grant date. Employees who retire under
circumstances, in accordance with the terms of the Plan, may be entitled to
accelerate the vesting of individual awards. As of September 30,
2009, 7,500 shares were potentially subject to accelerated
vesting. Substantially, all stock options outstanding are
expected to vest. Compensation expense related to stock option plans
was $0.8 million, $1.2 million and $1.3 million for the years ended September
30, 2009, 2008 and 2007, respectively.
The
following is a summary of activity in the Stock Option Plan:
|
Shares
subject to option
|
Weighted
Average
exercise price
|
|||||||
|
Outstanding
at September 30, 2008
|
2,481,163 | $ | 10.91 | |||||
|
Granted
|
88,861 | 9.04 | ||||||
|
Exercised
|
(270,830 | ) | 3.61 | |||||
|
Forfeited
|
(57,700 | ) | 13.00 | |||||
|
Outstanding
shares at September 30, 2009
|
2,241,494 | $ | 11.66 | |||||
The total
intrinsic value of stock options vested (exercisable) for fiscal years ended
September 30, 2009, 2008 and 2007 was $4.1 million, $5.6 million and $3.9
million, respectively. The unrecognized compensation cost associated
with stock options was $0.6 million as of September 30, 2009. The
intrinsic value of stock options exercised during 2009 was $1.6
million.
At
September 30, 2009 and 2008, respectively, there were 363,154 and 305,454 shares
available for future grant. The aggregate intrinsic value of options outstanding
as of September 30, 2009 was $4.7 million. The aggregate intrinsic value
represents the total pre-tax intrinsic value (the difference between the
Company’s closing stock price on the last trading date of the year ended
September 30, 2009 and the exercise price, multiplied by the number of in the
money options). The cash received from option exercises was
$354 and $414 for fiscal 2009 and 2008 respectively. There was no tax
benefit recorded in the results of operations to the Company from the exercise
of options for either fiscal 2009 or fiscal 2008.
PROVIDENT
NEW YORK BANCORP AND SUBSIDIARIES
Notes to
Consolidated Financial Statements
(Dollars
in thousands, except per share data)
A summary
of stock options at September 30, 2009 follows:
|
Outstanding
|
Exercisable
|
|||||||||||||||||||||||||
|
Weighted-Average
|
Weighted-Average
|
|||||||||||||||||||||||||
|
Number
of Stock Options
|
Exercise Price
|
Life
(in Years)
|
Number
of Stock Options
|
Exercise Price
|
Life
(in Years)
|
|||||||||||||||||||||
|
Range
of Exercise Price
|
||||||||||||||||||||||||||
| $ | 3.50 to $7.31 | 261,449 | $ | 4.15 | 0.4 | 261,449 | $ | 4.15 | 0.4 | |||||||||||||||||
| $ | 8.11 to $11.85 | 247,618 | 10.68 | 2.6 | 241,618 | 10.67 | 2.6 | |||||||||||||||||||
| $ | 12.01 to $15.66 | 1,732,427 | 12.93 | 5.4 | 1,556,027 | 12.91 | 5.4 | |||||||||||||||||||
| 2,241,494 | $ | 11.66 | 2,059,094 | $ | 11.53 | |||||||||||||||||||||
The
aggregate intrinsic value of options currently exercisable as of September 30,
2009 was $1.4 million. All non vested shares are expected to
vest.
The
Company used an option pricing model to estimate the grant date present value of
stock options granted. The weighted-average estimated value per option granted
was $1.97 in 2009, $2.99 in 2008 and $3.07 in 2007. The fair value of options
granted was determined using the following weighted-average assumptions as of
the grant date:
|
2009
|
2008
|
2007
|
||||||||||
|
Risk-free
interest rate (1)
|
1.9 | % | 3.4 | % | 4.8 | % | ||||||
|
Expected
stock price volatility
|
61.5 | % | 28 | % | 30 | % | ||||||
|
Dividend
yield (2)
|
3.3 | % | 1.9 | % | 1.6 | % | ||||||
|
Expected
term in years
|
.91 | 5.5 | 2.9 | |||||||||
|
(1)
represents the yield on a risk free rate of return (either the US
Treasury curve or the SWAP curve, in periods with high volatility in US
Treasury securities) with a remaining term equal to the expected option
term
|
||||||||||||
|
(2) represents
the approximate annualized cash dividend rate paid with respect to a share
of common stock at or near the grant date
|
||||||||||||
PROVIDENT
NEW YORK BANCORP AND SUBSIDIARIES
Notes to
Consolidated Financial Statements
(Dollars
in thousands, except per share data)
|
(12)
|
Comprehensive
Income (Loss)
|
Comprehensive
income (loss) represents the sum of net income and items of other comprehensive
income or loss that are reported directly in stockholders’ equity, such as the
change during the period in the after-tax net unrealized gain or loss on
securities available for sale and change in the funded status of defined benefit
plans. The Company has reported its comprehensive income in the consolidated
statements of changes in stockholders’ equity.
The
components of other comprehensive income (loss) are summarized as
follows:
|
Year ended September, 30,
|
||||||||||||
|
2009
|
2008
|
2007
|
||||||||||
|
Net
unrealized holding gain (loss) arising during the year on securities
available for sale, net of related income tax expense (benefit)
of $17,834 $(1,769) and $2,521, respectively
|
$ | 26,142 | $ | (1,391 | ) | $ | 3,610 | |||||
|
Reclassification
adjustment for net realized losses/ (gains) included in net income, net of
related income tax expense (benefit) of $7,328, $399 and $(3),
respectively
|
(10,748 | ) | (584 | ) | 5 | |||||||
| 15,394 | (1,975 | ) | 3,615 | |||||||||
|
*Minimum
pension liability adjustment, net of related income tax expense
of $48
|
- | - | 70 | |||||||||
|
Change
in funded status of defined benefit plans, net of related income tax
benefit of $2,280 and $2,326
|
(3,336 | ) | (3,402 | ) | - | |||||||
| $ | 12,058 | $ | (5,377 | ) | $ | 3,685 | ||||||
|
*Excludes
initial 2007 impact of the adoption of FASB ASC Topic # 715 -
Compensation-Retirement Benefits
|
||||||||||||
The
Company’s accumulated other comprehensive income (loss) included in
stockholders’ equity at September 30, 2009 and 2008 consists of the after-tax
net unrealized gain / (loss) on available for sale securities of $9,502 and
$(5,892) respectively, and the recognition of the funded status of defined
benefit plans of $7,025 and $3,689, after tax, at September 30, 2009 and 2008,
respectively.
PROVIDENT
NEW YORK BANCORP AND SUBSIDIARIES
Notes to
Consolidated Financial Statements
(Dollars
in thousands, except per share data)
|
(13)
|
Earnings
Per Common Share
|
The
following is a summary of the calculation of earnings per share
(EPS):
|
Years ended September 30,
|
||||||||||||
|
2009
|
2008
|
2007
|
||||||||||
|
Net
income
|
$ | 25,861 | $ | 23,778 | $ | 19,627 | ||||||
|
(in
thousands)
|
||||||||||||
|
Weighted
average common shares outstanding for computation of basic
EPS(1)
|
38,538 | 38,907 | 40,783 | |||||||||
|
Common-equivalent
shares due to the dilutive effect of stock options and RRP
awards(2)
|
168 | 320 | 484 | |||||||||
|
Weighted
average common shares for computation of diluted EPS
|
38,706 | 39,227 | 41,267 | |||||||||
|
Earnings
per common share:
|
||||||||||||
|
Basic
|
$ | 0.67 | $ | 0.61 | $ | 0.48 | ||||||
|
Diluted
|
$ | 0.67 | $ | 0.61 | $ | 0.48 | ||||||
|
|
(1)
|
Excludes
unallocated ESOP shares and non vested RRP
shares.
|
|
|
(2)
|
Represents
incremental shares computed using the treasury stock
method.
|
As of
September 30, 2009 and 2008 there were 1,934,637 and 1,155,653 stock options,
respectively, that were considered anti-dilutive for these periods and were not
included in common-equivalent shares.
(14)
Stockholders’ Equity
(a)
Regulatory Capital Requirements
OTS
regulations require banks to maintain a minimum ratio of tangible capital to
total adjusted assets of 1.5%, a minimum ratio of Tier 1 (core) capital to total
adjusted assets of 4.0%, and a minimum ratio of total (core and supplementary)
capital to risk-weighted assets of 8.0%.
Under its
prompt corrective action regulations, the OTS is required to take certain
supervisory actions (and may take additional discretionary actions) with respect
to an undercapitalized institution. Such actions could have a direct material
effect on the institution’s financial statements.
The
regulations establish a framework for the classification of banks into five
categories: well capitalized; adequately capitalized; undercapitalized;
significantly undercapitalized; and critically undercapitalized. Generally, an
institution is considered well-capitalized if it has a Tier 1 (core) capital
ratio of at least 5.0%, a Tier 1 risk-based capital ratio of at least 6.0%, and
a total risk-based capital ratio of at least 10.0%.
The
foregoing capital ratios are based, in part, on specific quantitative measures
of assets, liabilities and certain off-balance-sheet items, as calculated under
regulatory accounting practices. Capital amounts and classifications are also
subject to qualitative judgments by the OTS about capital components, risk
weightings and other factors. These capital requirements apply only to the Bank,
and do not consider additional capital retained by Provident New York
Bancorp.
Management
believes that, as of September 30, 2009 and 2008 the Bank met all capital
adequacy requirements to which it was subject. Further, the most recent OTS
notification categorized the Bank as a well-capitalized institution under the
prompt corrective action regulations. There have been no conditions or events
since that notification that management believes have changed the Bank’s capital
classification.
PROVIDENT
NEW YORK BANCORP AND SUBSIDIARIES
Notes to
Consolidated Financial Statements
(Dollars
in thousands, except per share data)
The
following is a summary of the Bank’s actual regulatory capital amounts and
ratios at September 30, 2009 and 2008, compared to the OTS requirements for
minimum capital adequacy and for classification as a well-capitalized
institution. PMB is also subject to certain regulatory capital requirements,
which it satisfied as of September 30, 2009 and 2008.
|
OTS requirements
|
||||||||||||||||||||||||
|
Bank actual
|
Minimum
capital adequacy
|
Classification
as well capitalized
|
||||||||||||||||||||||
|
Amount
|
Ratio
|
Amount
|
Ratio
|
Amount
|
Ratio
|
|||||||||||||||||||
|
September
30, 2009:
|
||||||||||||||||||||||||
|
Tangible
capital
|
$ | 246,339 | 8.6 | % | $ | 42,784 | 1.5 | % | $ | — | — | |||||||||||||
|
Tier
1 (core) capital
|
246,339 | 8.6 | 114,090 | 4.0 | 142,613 | 5.0 | % | |||||||||||||||||
|
Risk-based
capital:
|
||||||||||||||||||||||||
|
Tier
1
|
246,339 | 12.6 | — | — | 117,447 | 6.0 | ||||||||||||||||||
|
Total
|
270,807 | 13.8 | 156,596 | 8.0 | 195,746 | 10.0 | ||||||||||||||||||
|
September
30, 2008:
|
||||||||||||||||||||||||
|
Tangible
capital
|
$ | 226,053 | 8.0 | % | $ | 42,357 | 1.5 | % | $ | — | — | |||||||||||||
|
Tier
1 (core) capital
|
226,053 | 8.0 | 112,952 | 4.0 | 141,191 | 5.0 | % | |||||||||||||||||
|
Risk-based
capital:
|
||||||||||||||||||||||||
|
Tier
1
|
226,053 | 11.6 | — | — | 116,709 | 6.0 | ||||||||||||||||||
|
Total
|
249,154 | 12.8 | 155,612 | 8.0 | 194,515 | 10.0 | ||||||||||||||||||
Tangible
and Tier 1 capital amounts represent the stockholder’s equity of the Bank, less
intangible assets and after-tax net unrealized gains (losses) on securities
available for sale and any other disallowed assets, such as deferred income
taxes. Total capital represents Tier 1 capital plus the allowance for
loan losses up to a maximum amount equal to 1.25% of risk-weighted
assets.
The
following is a reconciliation of the Bank’s total stockholder’s equity under
accounting principles generally accepted in the United States of America
(“GAAP”) and its regulatory capital:
|
September 30,
|
||||||||
|
2009
|
2008
|
|||||||
|
Total
GAAP stockholder's equity (Provident Bank)
|
$ | 408,555 | $ | 378,554 | ||||
|
Goodwill
and certain intangible assets
|
(159,600 | ) | (162,200 | ) | ||||
|
Unrealized
(gains) losses on securities available for sale included in other
accumulated comprehensive loss
|
(9,641 | ) | 5,824 | |||||
|
Other
Comprehensive Loss
|
7,025 | 3,875 | ||||||
|
Tangible,
tier 1 core and
|
||||||||
|
Tier
1 risk-based capital
|
246,339 | 226,053 | ||||||
|
Allowance
for loan losses
|
24,468 | 23,101 | ||||||
|
Total
risk-based capital
|
$ | 270,807 | $ | 249,154 | ||||
(b)
Dividend Payments
Under OTS
regulations, savings associations such as the Bank generally may declare annual
cash dividends up to an amount equal to the sum of net income for the current
calendar year and net income retained for the two preceding calendar years.
Dividend payments in excess of this amount require OTS approval. After September
30, 2009 the amount that can be paid to Provident New York Bancorp by Provident
Bank is $14.8 million plus earnings for the remainder of calendar year 2009, of
which $9.4 million was paid during October 2009. The Bank paid $10.5 million in
dividends to Provident New York Bancorp during the year ended September 30, 2009
($19 million during the year ended September 30, 2008 and $25 million during the
year ended September 30, 2007).
PROVIDENT
NEW YORK BANCORP AND SUBSIDIARIES
Notes to
Consolidated Financial Statements
(Dollars
in thousands, except per share data)
Unlike
the Bank, Provident New York Bancorp is not subject to OTS regulatory
limitations on the payment of dividends to its stockholders.
(c)
Stock Repurchase Programs
The
Company announced its fourth stock repurchase program on August 24, 2007,
authorizing the repurchase of 2,000,000 shares, of which 750,090 remain to be
purchased at September 30, 2009.
The total
number of shares repurchased under repurchase programs during the fiscal year
ended September 30, 2009, 2008 and 2007, was 415,811, 1,570,757, and 1,540,471
respectively at a total cost of $3.5 million, $19.8 million, and $20.9 million,
respectively.
(d)
Liquidation Rights
Upon
completion of the second-step conversion in January 2004, the Bank established a
special “liquidation account” in accordance with OTS regulations. The account
was established for the benefit of Eligible Account Holders and Supplemental
Eligible Account Holders (as defined in the plan of conversion) in an amount
equal to the greater of (i) the Mutual Holding Company’s ownership interest in
the retained earnings of Provident Federal as of the date of its latest balance
sheet contained in the prospectus, or (ii) the retained earnings of the Bank at
the time that the Bank reorganized into the Mutual Holding Company in 1999. Each
Eligible Account Holder and Supplemental Eligible Account Holder that continues
to maintain his or her deposit account at the Bank would be entitled, in the
event of a complete liquidation of the Bank, to a pro rata interest in the
liquidation account prior to any payment to the stockholders of the Holding
Company. The liquidation account is reduced annually on December 31 to the
extent that Eligible Account Holders and Supplemental Eligible Account Holders
have reduced their qualifying deposits as of each anniversary date. Subsequent
increases in deposits do not restore such account holder’s interest in the
liquidation account. The Bank may not pay cash dividends or make other capital
distributions if the effect thereof would be to reduce its stockholder’s equity
below the amount of the liquidation account.
|
(15)
|
Off-Balance-Sheet
Financial Instruments
|
In the
normal course of business, the Company is a party to off-balance-sheet financial
instruments that involve, to varying degrees, elements of credit risk and
interest rate risk in addition to the amounts recognized in the consolidated
financial statements. The contractual or notional amounts of these instruments,
which reflect the extent of the Company’s involvement in particular classes of
off-balance-sheet financial instruments, are summarized as follows:
|
September
30,
|
||||||||
|
2009
|
2008
|
|||||||
|
Lending-related
instruments:
|
||||||||
|
Loan
origination commitments
|
$ | 133,547 | $ | 121,404 | ||||
|
Unused
lines of credit
|
302,455 | 341,069 | ||||||
|
Letters
of credit
|
24,569 | 27,908 | ||||||
As of
September 30, 2009 and September 30, 2008, 94% and 96%, respectively of lending
related off balance sheet instruments were at variable rates.
PROVIDENT
NEW YORK BANCORP AND SUBSIDIARIES
Notes to
Consolidated Financial Statements
(Dollars
in thousands, except per share data)
The
contractual amounts of loan origination commitments, unused lines of credit and
letters of credit represent the Company’s maximum potential exposure to credit
loss, assuming (i) the instruments are fully funded at a later date, (ii) the
borrowers do not meet the contractual payment obligations, and (iii) any
collateral or other security proves to be worthless. The contractual amounts of
these instruments do not necessarily represent future cash requirements since
certain of these instruments may expire without being funded and others may not
be fully drawn upon. Substantially all of these lending-related instruments have
been entered into with customers located in the Company’s primary market area
described in Note 5 (“Loans”).
Loan
origination commitments are legally-binding agreements to lend to a customer as
long as there is no violation of any condition established in the contract.
Commitments have fixed expiration dates (generally ranging up to 60 days) or
other termination clauses, and may require payment of a fee by the customer. The
Company evaluates each customer’s credit worthiness on a case-by-case basis. The
amount of collateral, if any, obtained by the Company upon extension of credit,
is based on management’s credit evaluation of the borrower. Collateral varies
but may include mortgages on residential and commercial real estate, deposit
accounts with the Company, and other property. The Company’s loan origination
commitments at September 30, 2009 provide for interest rates ranging principally
from 2.21% to 9.75%.
Unused
lines of credit are legally-binding agreements to lend to a customer as long as
there is no violation of any condition established in the contract. Lines of
credit generally have fixed expiration dates or other termination clauses. The
amount of collateral obtained, if deemed necessary by the Company, is based on
management’s credit evaluation of the borrower.
Letters
of credit are commitments issued by the Company on behalf of its customer in
favor of a beneficiary that specify an amount the Company can be called upon to
pay upon the beneficiary’s compliance with the terms of the letter of credit.
These commitments are nearly all standby letters of credit and are primarily
issued in favor of local municipalities to support the obligor’s completion of
real estate development projects. The credit risk involved in issuing letters of
credit is essentially the same as that involved in extending loan facilities to
customers.
As of
September 30, 2009, the Company had $24,569 in outstanding letters of credit, of
which $10,730 were secured by cash collateral.
|
(16)
|
Commitments
and Contingencies
|
Certain
premises and equipment are leased under operating leases with terms expiring
through 2033. The Company has the option to renew certain of these leases for
additional terms. Future minimum rental payments due under
non-cancelable operating leases with initial or remaining terms of more than one
year at September 30, 2009 were as follows (for fiscal years ending September
30th):
|
2010
|
$ | 2,369 | ||
|
2011
|
2,330 | |||
|
2012
|
2,266 | |||
|
2013
|
2,131 | |||
|
2014
|
2,010 | |||
|
2015
and thereafter
|
19,076 | |||
| $ | 30,182 |
Occupancy
and office operations expense includes net rent expense of $2,726, $2,398 and
$1,992, for the years ended September 30, 2009, 2008 and 2007,
respectively.
The
Company is a defendant in certain claims and legal actions arising in the
ordinary course of business. Management, after consultation with legal counsel,
does not anticipate losses on any of these claims or actions that would have a
material adverse effect on the consolidated financial
statements.
PROVIDENT
NEW YORK BANCORP AND SUBSIDIARIES
Notes to
Consolidated Financial Statements
(Dollars
in thousands, except per share data)
|
(17)
|
Fair
value measurements
|
Effective
October 1, 2008, the Company adopted provisions of FASB Codification Topic 820:
Fair Value Measurements and
Disclosure. This topic establishes a hierarchy for valuation
inputs that gives the highest priority to quoted prices in active markets for
identical assets or liabilities and the lowest priority to unobservable
inputs. The fair values hierarchy is as follows:
LEVEL 1 –
Valuation is based on quoted prices in active markets for identical assets and
liabilities.
LEVEL 2 –
Valuation is determined from quoted prices for similar assets or liabilities in
active markets, quoted prices for identical or similar instruments in markets
that are not active or by model-based techniques in which all significant inputs
are observable in the market.
LEVEL 3 –
Valuation is derived from model-based techniques in which at least one
significant input is unobservable and based on the Company’s own estimates about
the assumptions that the market participants would use to value the asset or
liability.
When
available, the Company attempts to use quoted market prices in active markets to
determine fair value and classifies such items as Level 1 or Level 2. If quoted
market prices in active markets are not available, fair value is often
determined using model-based techniques incorporating various assumptions
including interest rates, prepayment speeds and credit losses. Assets and
liabilities valued using model-based techniques are classified as either Level 2
or Level 3, depending on the lowest level classification of an input that is
considered significant to the overall valuation.
The
following is a description of the valuation methodologies used for the Company’s
assets and liabilities that are measured on a recurring basis at estimated fair
value.
Investment
securities available for sale
The
majority of the Company’s available for sale investment securities have been
valued by reference to prices for similar securities or through model-based
techniques in which all significant inputs are observable and, therefore, such
valuations have been classified as Level 2. Certain investments
are actively traded and therefore have been classified as Level 1 valuations
(U.S. Treasuries and certain government sponsored agencies).
The
Company utilizes an outside vendor to obtain valuations for its traded
securities as well as information received from a third party investment
advisor. The majority of the Company’s available for sale investment
securities (mortgage backed securities issued by US government corporations and
government sponsored entities) have been valued by reference to prices for
similar securities or through model-based techniques in which all significant
inputs are observable (Level 2). The Company utilizes prices from a
leading provider of market data information and compares them to dealer
indicative bids from the Company’s external investment advisor. For
securities where there is limited trading activity (private label CMO’s) and
less observable valuation inputs, the Company has classified such valuations as
Level 3.
As of
June 30, 2009, the Company adopted the provisions of FASB ASC Topic 820 “Fair Value Measurements and
Disclosure. As a result of adoption, the Company reviewed the
volume and level of activity for its available for sale securities to identify
transactions which may not be orderly or reflective of significant activity and
volume. The Company determined that there has been a decline in the
volume and level of activity in the market for its private label mortgage backed
securities, and as such determined that such transactions were deemed to be not
orderly. These five securities, with an amortized cost of $11,150 at
September 30, 2009, were transferred by the Company from Level 2 to Level 3
valuations at a fair value of $9,534, in order to determine fair
value. In determining the fair value of these securities the Company
utilized unobservable inputs which reflect assumptions regarding the inputs that
market participants would use in pricing these securities in an orderly
market. Present value estimated cash flow models were used discounted
at a rate that was reflective of similarly structured securities in an orderly
market. The resultant prices were averaged with prices obtained from two
independent third parties to arrive at the fair value as of September 30,
2009.
PROVIDENT
NEW YORK BANCORP AND SUBSIDIARIES
Notes to
Consolidated Financial Statements
(Dollars
in thousands, except per share data)
The
changes in Level 3 assets measured at fair value on a recurring basis are
summarized as follows:
|
Privately
issued MBS
|
||||
|
Net
transfers into Level 3 at April 1, 2009
|
$ | 9,534 | ||
|
Pay
downs
|
(1,696 | ) | ||
|
(Amortization)
and accretion
|
9 | |||
|
Total
gains in other comprehensive income
|
2,564 | |||
|
Balance
at September 30, 2009
|
$ | 10,411 | ||
The
transfers into Level 3 from Level 2 represent securities for which significant
inputs to the valuation became unobservable as well as there being limited
trading activity.
Commitments
to sell real estate loans:
The
Company enters into various commitments to sell real estate loans within the
secondary market. Such commitments are considered to be derivative financial
instruments and, therefore are carried at estimated fair value on the
consolidated balance sheets. The estimated fair values of these
commitments were generally calculated by reference to quoted prices in secondary
markets for commitments to sell to certain government sponsored
agencies. The fair values of these commitments generally result in a
Level 2 classification. The fair values of these commitments are not
considered material.
A summary
of assets and liabilities at September 30, 2009 measured at estimated fair value
on a recurring basis were as follows:
|
Fair
Value Measurements
at
June
30, 2009
|
Level
1
|
Level
2
|
Level
3
|
|||||||||||||
|
Investment
securities available for sale:
|
||||||||||||||||
|
U.S.
Treasury and federal agencies
|
$ | 207,776 | $ | 207,776 | $ | - | $ | - | ||||||||
|
Obligations
of states and political subdivisions
|
167,584 | - | 167,584 | - | ||||||||||||
|
Government
issued or guaranteed mortgage-backed securities
|
420,104 | - | 420,104 | - | ||||||||||||
|
Privately
issued mortgage-backed securities
|
10,411 | - | - | 10,411 | ||||||||||||
|
Corporate
debt securities
|
25,823 | - | 25,823 | - | ||||||||||||
|
Equities
|
885 | - | 885 | - | ||||||||||||
|
Total
Assets
|
$ | 832,583 | $ | 207,776 | $ | 614,396 | $ | 10,411 | ||||||||
The
following categories of financial assets, are not measured at fair value on a
recurring basis, but are subject to fair value adjustments in certain
circumstances:
Loans
and Loans Held for Sale
These
assets are not generally recorded at fair value on a recurring
basis. Loans held for sale are subject to a fair value adjustment
only when the fair value of the loans is less than their cost basis. There was
no adjustment necessary to this category as of September 30,
2009. The Company may record nonrecurring adjustments to the carrying
value of loans based on fair value measurements for partial charge-offs of the
uncollectible portions of these loans. Nonrecurring adjustments also
include certain impairment amounts for collateral dependant loans calculated in
accordance FASC ASC Topic # 310 – Receivables, when
establishing the allowance for credit losses. Such amounts are
generally based on the fair value of the underlying collateral supporting the
loan and, as a result, the carrying value of the loan less the calculated
valuation amount does not necessarily represent the fair value of the
loan. Real estate collateral is valued using independent appraisals
or other indications of value based upon recent comparable sales of similar
properties. Any fair value adjustments for loans categorized here are
classified as Level 2. Estimates of fair value used for other
collateral supporting commercial loans generally are based on assumptions not
observable in the market place and therefore such valuations have been
classified as Level 3. Loans subject to nonrecurring fair value
measurements were $19,752 which equals the carrying value less the allowance for
loan losses allocated to these loans at September 30, 2009, of which all have
been classified as Level 2. Changes in fair value recognized on
partial charge-offs on loans held by the Company for the fiscal year ended
September 30, 2009 were $2,913.
PROVIDENT
NEW YORK BANCORP AND SUBSIDIARIES
Notes to
Consolidated Financial Statements
(Dollars
in thousands, except per share data)
Mortgage
servicing rights
The
Company utilizes the amortization method to subsequently measure the carrying
value of its servicing asset. In accordance FASB ASC Topic #860-Transfers and Servicing, the
Company must record impairment charges on a nonrecurring basis, when the
carrying value exceeds the estimated fair value. To estimate the fair
value of servicing rights the Company utilizes a third party vendor, which
considers the market prices for similar assets and the present value of expected
future cash flows associated with the servicing rights. Assumptions
utilized include estimates of the cost of servicing, loan default rates, an
appropriate discount rate and prepayment speeds. The determination of
fair value of servicing rights is considered a Level 3 valuation. At
September 30, 2009, $840 of mortgage servicing rights had a carrying value equal
to their fair value. Changes in fair value of mortgage servicing
rights recognized for the fiscal year ended September 30, 2009 was an increase
of $185. A valuation allowance of $115 is recorded at September 30,
2009 reflecting the lower of amortized cost or fair market value.
Assets
taken in foreclosure of defaulted loans
Assets
taken in foreclosure of defaulted loans are primarily comprised of commercial
and residential real property and upon initial recognition, were remeasured and
reported at fair value through a charge-off to the allowance for loan losses
based upon the fair value of the foreclosed asset. The fair value is
generally determined using appraisals or other indications of value based on
recent comparable sales of similar properties or assumptions generally
observable in the market place, and the related nonrecurring fair value
measurements adjustments have generally been classified as Level
2. Assets taken in foreclosure of defaulted loans subject to
nonrecurring fair value measurement were $1,712 at September 30, 2009. Changes
in fair value recognized for those foreclosed assets held by the Company at
September 30, 2009 were $186 for fiscal 2009.
|
(18)
|
Fair
Values of Financial Instruments
|
FASB
Codification Topic 825: Financial Instruments,
requires disclosure of fair value information for those financial instruments
for which it is practicable to estimate fair value, whether or not such
financial instruments are recognized in the consolidated statements of financial
condition for interim and annual periods. Fair value is the amount at which a
financial instrument could be exchanged in a current transaction between willing
parties, other than in a forced sale or liquidation.
Quoted
market prices are used to estimate fair values when those prices are available,
although active markets do not exist for many types of financial instruments.
Fair values for these instruments must be estimated by management using
techniques such as discounted cash flow analysis and comparison to similar
instruments. These estimates are highly subjective and require judgments
regarding significant matters, such as the amount and timing of future cash
flows and the selection of discount rates that appropriately reflect market and
credit risks. Changes in these judgments often have a material effect on the
fair value estimates. Since these estimates are made as of a specific point in
time, they are susceptible to material near-term changes. Fair values disclosed
in accordance with FASB Topic 825 do not reflect any premium or discount that
could result from the sale of a large volume of a particular financial
instrument, nor do they reflect possible tax ramifications or estimated
transaction costs.
PROVIDENT
NEW YORK BANCORP AND SUBSIDIARIES
Notes to
Consolidated Financial Statements
(Dollars
in thousands, except per share data)
The
following is a summary of the carrying amounts and estimated fair values of
financial assets and liabilities (none of which were held for trading
purposes):
|
September
30,
|
September
30,
|
|||||||||||||||
|
2009
|
2008
|
|||||||||||||||
|
Carrying
|
Estimated
|
Carrying
|
Estimated
|
|||||||||||||
|
amount
|
fair
value
|
amount
|
fair
value
|
|||||||||||||
|
Financial
assets:
|
||||||||||||||||
|
Cash
and due from banks
|
$ | 160,408 | $ | 160,408 | $ | 125,810 | $ | 125,810 | ||||||||
|
Securities
available for sale
|
832,583 | 832,583 | 791,688 | 791,688 | ||||||||||||
|
Securities
held to maturity
|
44,614 | 45,739 | 43,013 | 42,899 | ||||||||||||
|
Loans
|
1,673,207 | 1,674,490 | 1,708,452 | 1,721,499 | ||||||||||||
|
Loans
held for sale
|
1,213 | 1,242 | 189 | 189 | ||||||||||||
|
Accrued
interest receivable
|
10,472 | 10,472 | 10,881 | 10,881 | ||||||||||||
|
FHLB
of New York stock
|
23,177 | 23,177 | 28,675 | 28,675 | ||||||||||||
|
Financial
liabilities:
|
||||||||||||||||
|
Non-maturity
deposits
|
(1,587,321 | ) | (1,587,321 | ) | (1,463,285 | ) | (1,463,285 | ) | ||||||||
|
Certificates
of Deposit
|
(494,961 | ) | (498,105 | ) | (525,912 | ) | (525,595 | ) | ||||||||
|
FHLB
and other borrowings
|
(482,122 | ) | (524,187 | ) | (566,008 | ) | (550,213 | ) | ||||||||
|
Mortgage
escrow funds
|
(8,405 | ) | (8,405 | ) | (7,272 | ) | (7,155 | ) | ||||||||
|
Accrued
interest payable
|
(3,246 | ) | (3,246 | ) | (4,240 | ) | (4,240 | ) | ||||||||
The
following paragraphs summarize the principal methods and assumptions used by
management to estimate the fair value of the Company’s financial
instruments.
|
|
(a)
|
Securities
|
The fair
value measurements consider observable data that may include dealer quotes,
market spreads, cash flows, live trading levels, market consensus prepayment
speeds, credit information and the bond’s terms and conditions among other
items. For certain securities, for which the inputs used by
independent pricing services were derived from unobservable market information,
the Company evaluated the appropriateness of each price. In
accordance with adoption of FASB Codification Topic 820, the Company reviewed
the volume and level of activity for its different classes of securities to
determine whether transactions were not considered orderly. For these
securities, the quoted prices received from independent pricing services may be
adjusted, as necessary, to estimate fair value in accordance with FASB
Codification Topic 820. If applicable, adjustments to fair value were
based on averaging present value cash flow model projections with prices
obtained from independent pricing services.
|
|
(b)
|
Loans
|
Fair
values were estimated for portfolios of loans with similar financial
characteristics. For valuation purposes, the total loan portfolio was segregated
into adjustable-rate and fixed-rate categories. Fixed-rate loans were further
segmented by type, such as residential mortgage, commercial mortgage, commercial
business and consumer loans. Loans were also segmented by maturity
dates. Fair values were estimated by discounting scheduled future
cash flows through estimated maturity using a discount rate equivalent to the
current market rate on loans that are similar with regard to collateral,
maturity and the type of borrower. The discounted value of the cash flows was
reduced by a credit risk adjustment based on loan categories. Based on the
current composition of the Company’s loan portfolio, as well as past experience
and current economic conditions and trends, the future cash flows were adjusted
by prepayment assumptions that shortened the estimated remaining time to
maturity and therefore affected the fair value estimates.
PROVIDENT
NEW YORK BANCORP AND SUBSIDIARIES
Notes to
Consolidated Financial Statements
(Dollars
in thousands, except per share data)
|
|
(c)
|
FHLB
of New York Stock
|
The
redeemable carrying amount of these securities with limited marketability
approximates their fair value.
|
|
(d)
|
Deposits
and Mortgage Escrow Funds
|
In
accordance with FASB Codification Topic 825, deposits with no stated maturity
(such as savings, demand and money market deposits) were assigned fair values
equal to the carrying amounts payable on demand. Certificates of deposit and
mortgage escrow funds were segregated by account type and original term, and
fair values were estimated by discounting the contractual cash flows. The
discount rate for each account grouping was equivalent to the current market
rates for deposits of similar type and maturity.
These
fair values do not include the value of core deposit relationships that comprise
a significant portion of the Company’s deposit base. Management believes that
the Company’s core deposit relationships provide a relatively stable, low-cost
funding source that has a substantial value separate from the deposit
balances.
|
|
(e)
|
Borrowings
|
Fair
values of FHLB and other borrowings were estimated by discounting the
contractual cash flows. A discount rate was utilized for each outstanding
borrowing equivalent to the then-current rate offered on borrowings of similar
type and maturity.
|
|
(f)
|
Other
Financial Instruments
|
The other
financial assets and liabilities listed in the preceding table have estimated
fair values that approximate the respective carrying amounts because the
instruments are payable on demand or have short-term maturities and present
relatively low credit risk and interest rate risk.
The fair
values of the Company’s off-balance-sheet financial instruments described in
Note 15 (“Off Balance Sheet Financial Instruments”) were estimated based on
current market terms (including interest rates and fees), considering the
remaining terms of the agreements and the credit worthiness of the
counterparties. At September 30, 2009 and September 30, 2008, the estimated fair
values of these instruments approximated the related carrying amounts, which
were insignificant.
|
(19)
|
Recently
Issued Accounting Standards Not Yet
Adopted
|
FASB
Codification Topic 860: Transfers and Servicing
includes amendments to improve the relevance, representational faithfulness and
comparability of the information that a reporting entity provides in its
financial statements about a transfer of financial assets; the effects of a
transfer on its financial position, financial performance and cash flows; and a
transferor’s continuing involvement, if any, in transferred financial
assets. The amendments to U.S. GAAP guidance on transfer and
servicing of financial assets eliminate the concept of a “qualifying special
purpose entity”, change the requirements for derecognizing financial assets and
requires additional disclosures about all continuing involvements with
transferred financial information about gains and losses (resulting from
transfers) during the period. These amendments will be effective
January 1, 2010 and are not expected to have a material effect on the Company’s
financial statements.
Amendments
to FASB Codification Topic 810: Consolidation changes how a
company determines when an entity that is insufficiently capitalized or is not
controlled through voting (or similar rights) should be
consolidated. The determination of whether a company is required to
consolidate an entity is based on, among other things, an entity’s purpose and
design as well as its ability to direct the activities of the entity that most
significantly impact the entity’s economic performance. The
amendments to U.S. GAAP require additional disclosures about the reporting
entity’s involvement with variable-interest entities, as well as any significant
changes in risk exposure due to that involvement and its effect on the entity’s
financial statements. These amendments will be effective January 1,
2010 and are not expected to have a material impact on the Company’s financial
statements.
Please
see Note 1 for a discussion of adoption of new accounting
standards.
PROVIDENT
NEW YORK BANCORP AND SUBSIDIARIES
Notes to
Consolidated Financial Statements
(Dollars
in thousands, except per share data)
|
(20)
|
Condensed
Parent Company Financial Statements
|
Set forth
below are the condensed statements of financial condition of Provident New York
Bancorp and the related condensed statements of income and cash
flows:
|
Condensed
Statements of Financial Condition
|
September 30,
|
|||||||
|
2009
|
2008
|
|||||||
|
Assets:
|
||||||||
|
Cash
|
$ | 2,466 | $ | 3,252 | ||||
|
Loan
receivable from ESOP
|
8,170 | 8,562 | ||||||
|
Securities
available for sale at fair value
|
790 | 926 | ||||||
|
Investment
in Provident Bank
|
409,588 | 379,480 | ||||||
|
Non-bank
subsidiaries
|
7,218 | 7,341 | ||||||
|
Other
assets
|
690 | 769 | ||||||
|
Total
assets
|
$ | 428,922 | $ | 400,330 | ||||
|
Liabilities
|
$ | 1,466 | $ | 1,172 | ||||
|
Stockholders’
equity
|
427,456 | 399,158 | ||||||
|
Total
liabilities & stockholders' equity
|
$ | 428,922 | $ | 400,330 | ||||
|
Year ended September 30,
|
||||||||||||
|
2009
|
2008
|
2007
|
||||||||||
|
Condensed
Statements of Income
|
||||||||||||
|
Interest
income
|
$ | 358 | $ | 473 | $ | 687 | ||||||
|
Dividend
income on equity securities
|
28 | 27 | - | |||||||||
|
Dividends
from Provident Bank
|
10,500 | 19,000 | 25,000 | |||||||||
|
Dividends
from non-bank subsidiaries
|
607 | 650 | 650 | |||||||||
|
Non-interest
expense
|
(3,372 | ) | (3,807 | ) | (3,993 | ) | ||||||
|
Income
tax benefit
|
797 | 962 | 1,025 | |||||||||
|
Income
before equity in undistributed earnings of subsidiaries
|
8,918 | 17,305 | 23,369 | |||||||||
|
Equity
in undistributed (excess distributed) earnings of:
|
||||||||||||
|
Provident
Bank
|
17,076 | 6,644 | (3,757 | ) | ||||||||
|
Non-bank
subsidiaries
|
(133 | ) | (171 | ) | 15 | |||||||
|
Net
income
|
$ | 25,861 | $ | 23,778 | $ | 19,627 | ||||||
PROVIDENT
NEW YORK BANCORP AND SUBSIDIARIES
Notes to
Consolidated Financial Statements
(Dollars
in thousands, except per share data)
|
Year ended September 30,
|
||||||||||||
|
2009
|
2008
|
2007
|
||||||||||
|
Condensed
Statements of Cash Flows
|
||||||||||||
|
Cash
flows from operating activities:
|
||||||||||||
|
Net
income
|
$ | 25,861 | $ | 23,778 | $ | 19,627 | ||||||
|
Adjustments
to reconcile net income to net cash provided by operating
activities:
|
||||||||||||
|
Equity
in (undistributed) excess distributed earnings of Provident
Bank
|
(17,076 | ) | (6,644 | ) | 3,757 | |||||||
|
Non-bank
subsidiaries
|
133 | 171 | (15 | ) | ||||||||
|
Other
adjustments, net
|
(475 | ) | 760 | (3,027 | ) | |||||||
|
Net
cash provided by operating activites
|
8,443 | 18,065 | 20,342 | |||||||||
|
Cash
flows from investing activities:
|
||||||||||||
|
Purchase
of equity securities, available for sale
|
— | (1,041 | ) | — | ||||||||
|
ESOP
loan principal repayments
|
392 | 754 | 739 | |||||||||
|
Net
cash provided by (used in) investing activities
|
392 | (287 | ) | 739 | ||||||||
|
Cash
flows from financing activities:
|
||||||||||||
|
Capital
contribution to subsidiaries
|
— | — | (750 | ) | ||||||||
|
Treasury
shares purchased
|
(3,459 | ) | (20,230 | ) | (21,503 | ) | ||||||
|
Cash
dividends paid
|
(9,379 | ) | (9,525 | ) | (8,278 | ) | ||||||
|
Stock
option transactions including RRP
|
2,729 | 4,001 | 2,986 | |||||||||
|
Other
equity transactions
|
488 | 1,382 | 3,233 | |||||||||
|
Net
cash used in financing activities
|
(9,621 | ) | (24,372 | ) | (24,312 | ) | ||||||
|
Net
decrease in cash
|
(786 | ) | (6,594 | ) | (3,231 | ) | ||||||
|
Cash
at beginning of year
|
3,252 | 9,846 | 13,077 | |||||||||
|
Cash
at end of year
|
$ | 2,466 | $ | 3,252 | $ | 9,846 | ||||||
PROVIDENT
NEW YORK BANCORP AND SUBSIDIARIES
Notes to
Consolidated Financial Statements
(Dollars
in thousands, except per share data)
|
(21)
|
Quarterly
Results of Operations (Unaudited)
|
The
following is a condensed summary of quarterly results of operations for the
years ended September 30, 2009 and 2008:
|
First
|
Second
|
Third
|
Fourth
|
|||||||||||||
|
quarter
|
quarter
|
quarter
|
quarter
|
|||||||||||||
|
Year ended September
30, 2009
|
||||||||||||||||
|
Interest
and dividend income
|
$ | 35,871 | $ | 33,586 | $ | 31,651 | $ | 30,482 | ||||||||
|
Interest
expense
|
10,825 | 9,951 | 8,925 | 8,019 | ||||||||||||
|
Net
interest income
|
25,046 | 23,635 | 22,726 | 22,463 | ||||||||||||
|
Provision
for loan losses
|
2,500 | 7,100 | 3,500 | 4,500 | ||||||||||||
|
Non-interest
income
|
5,771 | 11,123 | 15,255 | 7,804 | ||||||||||||
|
Non-interest
expense
|
19,235 | 20,076 | 21,517 | 19,359 | ||||||||||||
|
Income
before income tax expense
|
9,082 | 7,582 | 12,964 | 6,408 | ||||||||||||
|
Income
tax expense
|
2,791 | 2,038 | 4,014 | 1,332 | ||||||||||||
|
Net
income
|
$ | 6,291 | $ | 5,544 | $ | 8,950 | $ | 5,076 | ||||||||
|
Earnings
per common share:
|
||||||||||||||||
|
Basic
|
$ | 0.16 | $ | 0.14 | $ | 0.23 | $ | 0.13 | ||||||||
|
Diluted
|
$ | 0.16 | $ | 0.14 | $ | 0.23 | $ | 0.13 | ||||||||
|
Year ended September 30,
2008
|
||||||||||||||||
|
Interest
and dividend income
|
$ | 38,845 | $ | 37,365 | $ | 36,066 | $ | 36,706 | ||||||||
|
Interest
expense
|
16,471 | 14,124 | 11,878 | 11,169 | ||||||||||||
|
Net
interest income
|
22,374 | 23,241 | 24,188 | 25,537 | ||||||||||||
|
Provision
for loan losses
|
700 | 3,000 | 1,400 | 2,100 | ||||||||||||
|
Non-interest
income
|
4,959 | 5,753 | 5,024 | 5,306 | ||||||||||||
|
Non-interest
expense
|
18,122 | 18,924 | 18,955 | 19,499 | ||||||||||||
|
Income
before income tax expense
|
8,511 | 7,070 | 8,857 | 9,244 | ||||||||||||
|
Income
tax expense
|
2,617 | 1,987 | 2,551 | 2,749 | ||||||||||||
|
Net
income
|
$ | 5,894 | $ | 5,083 | $ | 6,306 | $ | 6,495 | ||||||||
|
Earnings
per common share:
|
||||||||||||||||
|
Basic
|
$ | 0.15 | $ | 0.13 | $ | 0.16 | $ | 0.17 | ||||||||
|
Diluted
|
$ | 0.15 | $ | 0.13 | $ | 0.16 | $ | 0.17 | ||||||||
ITEM
9. Changes in and Disagreements
with Accountants on Accounting and Financial Disclosure
Not
Applicable.
ITEM 9A. Controls
and Procedures.
Evaluation
of Disclosure Controls and Procedures
As of
September 30, 2009, under the supervision and with the participation of
Provident New York Bancorp’s Chief Executive Officer (“CEO”) and Chief Financial
Officer (“CFO”), management has evaluated the effectiveness of the design and
operation of the Company’s disclosure controls and procedures. Based
on the evaluation, the CEO and CFO concluded that the Company’s disclosure
controls and procedures were effective at the reasonable assurance level in
timely alerting them to material information required to be included in
Provident New York Bancorp’s periodic SEC reports. There were no
changes in the Company’s internal controls over financial reporting during the
fourth fiscal quarter of 2009 that have materially affected or are reasonably
likely to materially affect the Company’s internal control over financial
reporting.
Management’s
Report on Internal Control over Financial Reporting (see “Report of Management
on Internal Control Over Financial Reporting”)
Provident
New York Bancorp’s management is responsible for establishing and maintaining
adequate internal control over financial reporting, as such term is defined in
Exchange Act Rules 13a-15(f) and 15d-15(f). Under the supervision and
with the participation of the management of Provident New York Bancorp’s,
including Provident New York Bancorp’s CEO and CFO, Provident New York Bancorp
conducted an evaluation of the effectiveness of the Company’s internal control
over financial reporting as of September 30, 2009 based on the framework in
Internal Control – Integrated Framework issued by the Committee of Sponsoring
Organizations of the Treadway Commission, which is also referred to as
COSO. Based on that evaluation, management of Provident New York
Bancorp concluded that the Company’s internal control over financial reporting
was effective as of September 30, 2009. Management’s assessment of
the effectiveness of internal control over financial reporting is expressed at
the level of reasonable assurance because a control system, no matter how well
designed and operated, can provide only reasonable, but not absolute, assurance
that the control system’s objectives will be met.
The
effectiveness of the Company’s internal control over financial reporting as of
September 30, 2009 has been audited by Crowe Horwath LLP, as stated in their
report which is included elsewhere herein.
ITEM
9B. Other
Information
Not
applicable.
PART
III
ITEM
10. Directors, Executive
Officers, and Corporate Governance
The
“Proposal I — Election of Directors” section of Provident New York Bancorp’s
Proxy Statement for the Annual Meeting of Stockholders to be held in February
2010 (the “Proxy Statement”) is incorporated herein by reference.
ITEM
11. Executive
Compensation
The
“Proposal I — Election of Directors” section of the Proxy Statement is
incorporated herein by reference.
ITEM
12. Security Ownership of
Certain Beneficial Owners and Management and Related Stockholder
Matters
Provident
New York Bancorp does not have any equity compensation programs that were not
approved by stockholders, other than its employee stock ownership
plan.
Set forth
below is certain information as of September 30, 2009, regarding equity
compensation that has been approved by stockholders.
|
Equity
compensation plans approved by stockholders
|
Number
of securities to be
issued
upon exercise of
outstanding
options and rights
|
Weighted
average
Exercise
price
|
Number
of securities remaining
available
for issuance
under
plan
|
|||||||||
|
Stock
Option Plans
|
2,241,494 | $ | 11.66 | 363,154 | ||||||||
|
Recognition
and Retention Plan (1)
|
74,750 | N/A | 77,033 | |||||||||
|
Total (2)
|
2,316,244 | $ | 11.66 | 440,187 | ||||||||
|
(1)
|
Represents
shares that have been granted but have not yet vested.
|
|
(2)
|
Weighted
average exercise price represents Stock Option Plan only, since RRP shares
have no exercise price.
|
The
“Proposal I — Election of Directors” section of the Proxy Statement is
incorporated herein by reference.
ITEM 13.
Certain
Relationships and Related Transactions and Director
Independence
The
“Transactions with Certain Related Persons” section of the Proxy Statement is
incorporated herein by reference.
ITEM 14.
Principal
Accountant Fees and Services
The
“Independent Registered Public Accounting Firm” section of the proxy statement
is incorporated herein by reference.
PART
IV
ITEM 15.
Exhibits and
Financial Statement Schedules
|
(1)
|
Financial
Statements
|
The
financial statements filed in Item 8 of this Form 10-K are as
follows:
|
(A)
|
Report
of Independent Registered Public Accounting Firm on Financial
Statements
|
|
(B)
|
Consolidated
Statements of Financial Condition as of September 30, 2009 and
2008
|
|
(C)
|
Consolidated
Statements of Income for the years ended September 30, 2009, 2008 and
2007
|
|
(D)
|
Consolidated
Statements of Changes in Stockholders’ Equity for the years ended
September 30, 2009, 2008 and 2007
|
|
(E)
|
Consolidated
Statements of Cash Flows for the years ended September 30, 2009, 2008 and
2007
|
|
(F)
|
Notes
to Consolidated Financial
Statements
|
|
(2)
|
Financial Statement
Schedules
|
All
financial statement schedules have been omitted as the required information is
inapplicable or has been included in the Notes to Consolidated Financial
Statements.
|
(3)
|
Exhibits
|
|
3.1
|
Certificate
of Incorporation of Provident New York Bancorp1
|
|
3.2
|
Bylaws
of Provident New York Bancorp, as amended2
|
|
10.2
|
Employment
Agreement with George Strayton3*
|
|
10.3
|
Employment
Agreement with
Daniel Rothstein3*
|
|
10.4
|
Deferred
Compensation Agreement, as amended and restated4*
|
|
10.5
|
Provident
Amended and Restated 1995 Supplemental Executive
Retirement
Plan5*
|
|
10.5.1
|
Provident
2005 Supplemental Executive Retirement Plan6*
|
|
10.6
|
Executive
Officer Incentive Program7*
|
|
10.7
|
1996
Long-Term Incentive Plan for Officers and Directors, as amended8*
|
|
10.8
|
Provident
Bank 2000 Stock Option Plan9*
|
|
10.9
|
Provident
Bank 2000 Recognition and Retention Plan10*
|
|
10.10
|
Employment
Agreement with Paul A. Maisch3*
|
|
10.11
|
Provident
Bancorp, Inc. 2004 Stock Incentive Plan11*
|
|
10.12
|
Provident
Bank Executive Officer Incentive Plan12*
|
|
10.13
|
Employment
Agreement with Stephen Dormer3*
|
|
10.14
|
Employment
Agreement with Richard Jones13*
|
|
21
|
Subsidiaries
of Registrant3
|
|
23.1
|
Consent
of Crowe Horwath LLP3
|
|
Certification
of Chief Executive Officer Pursuant to Section 302 of the Sarbanes-Oxley
Act of 20023
|
|
|
Certification
of Chief Financial Officer Pursuant to Section 302 of the Sarbanes-Oxley
Act of 20023
|
|
|
Certification
Pursuant to 18 U.S.C. Section 1350, as amended by Section 906 of the
Sarbanes-Oxley Act of 20023
|
|
1
|
Incorporated
by reference to Exhibit 3.1 of the Registration Statement on Form S-1
(File No. 333-108795), originally filed with the Commission on September
15,
2003.
|
|
2
|
Incorporated
by reference to Exhibit 3.1 of the Quarterly Report on Form 10-Q (File No.
0-25233), filed with the Commission on May 8,
2009.
|
|
3
|
Incorporated
by reference to Exhibit 10.2 of the 2008 10-K (File No, 0-25233), files
with the Commission on December 15,
2008.
|
|
4
|
Incorporated
by reference to Exhibit 10.3 of the 2008 10-K (File No. 0-25233), filed
with the Commission on December 15,
2008.
|
|
5
|
Incorporated
by reference to Exhibit 10.4 of the Registration Statement on Form S-1 of
Provident Bancorp, Inc. (File No 333-63593) filed with the Commission on
September 17, 1998.
|
|
6
|
Incorporated
by reference to Exhibit 10.1 of the Quarterly Report on Form 10-Q (File
No. 0-25233), filed with the Commission on August 11,
2008
|
|
7
|
Incorporated
by reference to Exhibit 10.2 of the Quarterly Report on Form 10-Q (File
No. 0-25233), filed with the Commission on August 11,
2008
|
|
8
|
Incorporated
by reference to Exhibit 10.6 of the 2007 10-K (File No. 0-25233), filed
with the Commission on December 13,
2007.
|
|
9
|
Incorporated
by reference to Exhibit 10.7 of Amendment No. 1 to the Registration
Statement on Form S-1 of Provident Bancorp, Inc. (File No. 333-63593),
filed with the Commission on September 17,
1998.
|
|
10
|
Incorporated
by reference to Appendix A of the Proxy Statement for the 2000 Annual
Meeting of Stockholders of Provident Bancorp Inc., (File No. 0-25233),
filed with the Commission on January 18,
2000.
|
|
11
|
Incorporated
by reference to Appendix B of the Proxy Statement for the 2000 Annual
Meeting of Stockholders of Provident Bancorp Inc., (File No. 0-25233),
filed with the Commission on January 18,
2000.
|
|
12
|
Incorporated
by reference to Exhibit 10.10 of the 2008 10-K (File No. 0-25233), filed
with the Commission on December 15,
2008.
|
|
13
|
Incorporated
by reference to Appendix A to the Proxy Statement for the 2005 Annual
Meeting of Stockholders of Provident Bancorp Inc., (File No. 0-25233),
filed with the Commission on January 19,
2005.
|
|
14
|
Incorporated
by reference to Exhibit 10 to the Current Report on Form 8-K (File No.
0-25233), filed with the Commission on December 5,
2005.
|
|
15
|
Incorporated
by reference to Exhibit 10.13 of the 2008 10-K (File No. 0-25233), filed
with the Commission on December 15,
2008.
|
|
16
|
Incorporated
by reference to Exhibit 10.14 of the 2006 10-K (File No. 0-25233), filed
with the Commission on February 6,
2009.
|
*
Indicates management contract or compensatory plan or
arrangement.
Pursuant
to the requirements of Section 13 of the Securities Exchange Act of 1934,
Provident New York Bancorp has duly caused this report to be signed on its
behalf by the undersigned, there unto duly authorized.
Provident
New York Bancorp
|
Date:
|
December
10, 2009
|
By:
|
/s/
George Strayton
|
|
George
Strayton
|
|||
|
President,
Chief Executive Officer and Director
|
|||
|
(Principal
Executive Officer)
|
Pursuant
to the requirements of the Securities Exchange Act of 1934, this report has been
signed below by the following persons on behalf of the Registrant and in the
capacities and on the dates indicated.
|
By:
|
/s/
George Strayton
|
By:
|
/s/
Paul A. Maisch
|
|
|
George
Strayton
|
Paul
A. Maisch
|
|||
|
President,
Chief Executive Officer and
|
Executive
Vice President
|
|||
|
Director
|
Chief
Financial Officer
|
|||
|
Principal
Executive Officer
|
Principal
Accounting Officer
|
|||
|
Date:
|
December
10, 2009
|
Principal
Financial Officer
|
||
|
Date:
|
December
10, 2009
|
|
By:
|
/s/
William F. Helmer
|
By:
|
/s/
Dennis L. Coyle
|
|
|
William
F. Helmer
|
Dennis
L. Coyle
|
|||
|
Chairman
of the Board
|
Vice
Chairman
|
|||
|
Date:
|
December
10, 2009
|
Date:
|
December
10, 2009
|
|
By:
|
/s/
Judith Hershaft
|
By:
|
/s/ Thomas F. Jauntig,
Jr.
|
By:
|
/s/
Thomas G. Kahn
|
||
|
Judith
Hershaft
|
Thomas
F. Jauntig, Jr.
|
Thomas
G. Kahn
|
|||||
|
Director
|
Director
|
Director
|
|||||
|
Date:
|
December
10, 2009
|
Date:
|
December
10, 2009
|
Date:
|
December
10, 2009
|
||
|
By:
|
/s/
R. Michael Kennedy
|
By:
|
/s/
Victoria Kossover
|
By:
|
/s/
Donald T. McNelis
|
||
|
R.
Michael Kennedy
|
Victoria
Kossover
|
Donald
T. McNelis
|
|||||
|
Director
|
Director
|
Director
|
|||||
|
Date:
|
December
10, 2009
|
Date:
|
December
10, 2009
|
Date:
|
December
10, 2009
|
||
|
By:
|
/s/
Richard A. Nozell
|
By:
|
/s/
Carl Rosenstock
|
By:
|
/s/
William Sichol Jr.
|
||
|
Richard
A. Nozell
|
Carl
Rosenstock
|
William
Sichol Jr.
|
|||||
|
Director
|
Director
|
Director
|
|||||
|
December
10, 2009
|
December
10, 2009
|
December
10, 2009
|
|||||
|
By:
|
/s/
Burt Steinberg
|
||||||
|
Burt
Steinberg
|
|||||||
|
Director
|
|||||||
|
Date
|
December
10, 2009
|
112