Attached files
| file | filename |
|---|---|
| 8-K - 8-K - KAPSTONE PAPER & PACKAGING CORP | a13-14731_18k.htm |
| EX-99.1 - EX-99.1 - KAPSTONE PAPER & PACKAGING CORP | a13-14731_1ex99d1.htm |
| EX-2.1 - EX-2.1 - KAPSTONE PAPER & PACKAGING CORP | a13-14731_1ex2d1.htm |
Exhibit 99.2
|
|
A Perfect Fit Acquisition of Longview Fibre and Packaging, Inc. June 11, 2013 |
|
|
Forward Looking Statements The information in this presentation and statements made during this presentation may contain certain forward-looking statements within the meaning of federal securities laws. These statements reflect management’s expectations regarding future events and operating performance. These forward-looking statements involve a number of risks and uncertainties. A list of the factors that could cause actual results to differ materially from those expressed in, or underlying, any forward-looking statements can be found in the Company’s filings with the Securities and Exchange Commission, such as its annual and quarterly reports. The Company disclaims any obligation to revise or update such statements to reflect the occurrence of events after the date of this presentation. This presentation refers to certain non-U.S. GAAP financial information. A reconciliation of non-U.S. GAAP to U.S. GAAP financial measures is available in the attached appendix. Forward-Looking Statements Non-GAAP Financial Measures Risk Factors 2 |
|
|
KapStone will acquire Longview Fibre Paper and Packaging, Inc. in a cash-free, debt-free transaction for a purchase price of $1.025 billion Longview is a leading manufacturer of high quality, lightweight, high performance multiwall paper, containerboard, specialty Kraft papers, and corrugated containers in the Pacific Northwest region What Are We Buying? 3 Longview, WA mill with 5 paper machines Cost effectively produces 1.15 million tons of Kraft paper and containerboard annually Excess pulping and recovery capacity of approximately 300,000 tons per year Can produce products that range from 100% virgin fiber to 100% recycled Current mix is approximately 70% virgin, 30% recycled Well located in a wood basket with declining fiber costs |
|
|
What Are We Buying? 4 Seven strategically located container plants in Washington, Idaho, Utah and California Shipments of approximately 5.7 million square feet per year or approximately 400 thousand tons Well-equipped, well-capitalized facilities with diverse capabilities Three warehouse operations in Utah, Nevada, and California |
|
|
5 Perfect Fit – KapStone Plus Longview Creates nationwide company with compelling strengths in key markets Increases packaging footprint Diversifies product mix Creates strong global position in kraft paper segment Accretive on EPS pro forma historical basis |
|
|
Containerboard Products 6 Diverse capability to produce wide range of high quality linerboard and medium grades Can produce grades of 26 lb. up to 90 lb. Produces approximately 715 thousand tons per year Flexibility in composition of fiber content to meet customers’ needs and to control costs Can use zero to 100% virgin fiber |
|
|
400 thousand tons per year Multiwall, bag and lightweight paper Only US producer of high performance extensible multiwall Global demand growing at around 4% per year Established global customer base in 35 countries Focus on products that have barriers to entry and leverage fiber quality, technical knowledge and machine attributes Branded products include: TEA-Kraft® FibreShield® FibreGreen® Kraft Paper Products 7 |
|
|
Products 8 Strong regional corrugated container manufacturer 5.7 BSF (approximately 400 thousand tons) per year Wide range of capabilities at 7 box plants Corrugated Packaging |
|
|
Longview Financial Analysis Financial Overview 9 $’s in Millions *In Q1 2013, Longview’s net sales were $217 million and EBITDA was $42 million |
|
|
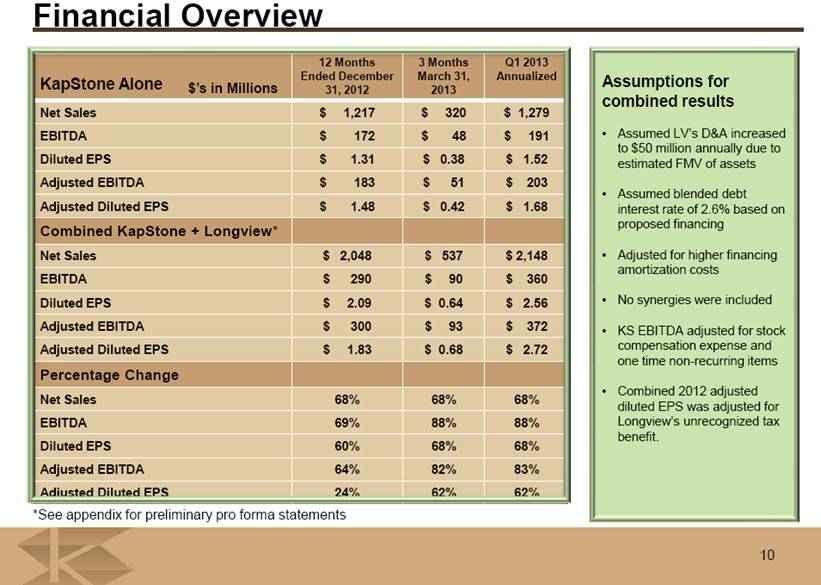
Financial Overview 10 $’s in Millions Assumptions for combined results Assumed LV’s D&A increased to $50 million annually due to estimated FMV of assets Assumed blended debt interest rate of 2.6% based on proposed financing Adjusted for higher financing amortization costs No synergies were included KS EBITDA adjusted for stock compensation expense and one time non-recurring items Combined 2012 adjusted diluted EPS was adjusted for Longview’s unrecognized tax benefit. *See appendix for preliminary pro forma statements |
|
|
Financial Overview 11 $’s in Millions Longview has modest annual maintenance CAPEX of $15 million to $30 million Overfunded pension plan will require no cash contributions in the near future |
|
|
12 FINANCIAL OVERVIEW 12 $775 million senior credit facility add on to current term loan with a 5 year term Accordion provision up to an additional $300 million Interest rate based on current grid $250 million 6 year term loan A1 Amortization: back-ended with 94% bullet at end of term Interest rate based on current grid plus 25 bps $300 million revolver Blended interest rate expected to be less than 3% Expected debt to EBITDA leverage ratio at closing will be less than 4.0 times 100% commitment from Bank of America, Barclays, and Wells Fargo SOURCES & USES $’s in millions |
|
|
Strong management team High quality products Right product lines Expansion of containerboard Lightweight, high performance multiwall paper Specialty Kraft papers Expansion opportunity as a result of incremental pulping and recovery capacity Increases packaging footprint Geographic diversity Excellent safety performance Good environmental record Accretive Day 1 Perfect Fit – Transforms KapStone 13 |

|
|
Appendix |
|
|
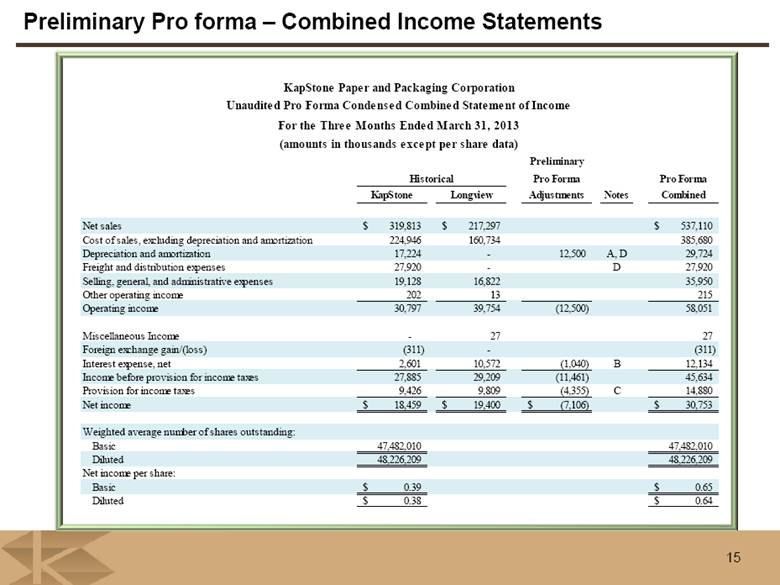
Preliminary Pro forma – Combined Income Statements 15 Preliminary Pro Forma Pro Forma KapStone Longview Adjustments Notes Combined Net sales 319,813 $ 217,297 $ 537,110 $ Cost of sales, excluding depreciation and amortization 224,946 160,734 385,680 Depreciation and amortization 17,224 - 12,500 A, D 29,724 Freight and distribution expenses 27,920 - D 27,920 Selling, general, and administrative expenses 19,128 16,822 35,950 Other operating income 202 13 215 Operating income 30,797 39,754 (12,500) 58,051 Miscellaneous Income - 27 27 Foreign exchange gain/(loss) (311) - (311) Interest expense, net 2,601 10,572 (1,040) B 12,134 Income before provision for income taxes 27,885 29,209 (11,461) 45,634 Provision for income taxes 9,426 9,809 (4,355) C 14,880 Net income 18,459 $ 19,400 $ (7,106) $ 30,753 $ Weighted average number of shares outstanding: Basic 47,482,010 47,482,010 Diluted 48,226,209 48,226,209 Net income per share: Basic 0.39 $ 0.65 $ Diluted 0.38 $ 0.64 $ Historical Unaudited Pro Forma Condensed Combined Statement of Income For the Three Months Ended March 31, 2013 (amounts in thousands except per share data) KapStone Paper and Packaging Corporation |
|
|
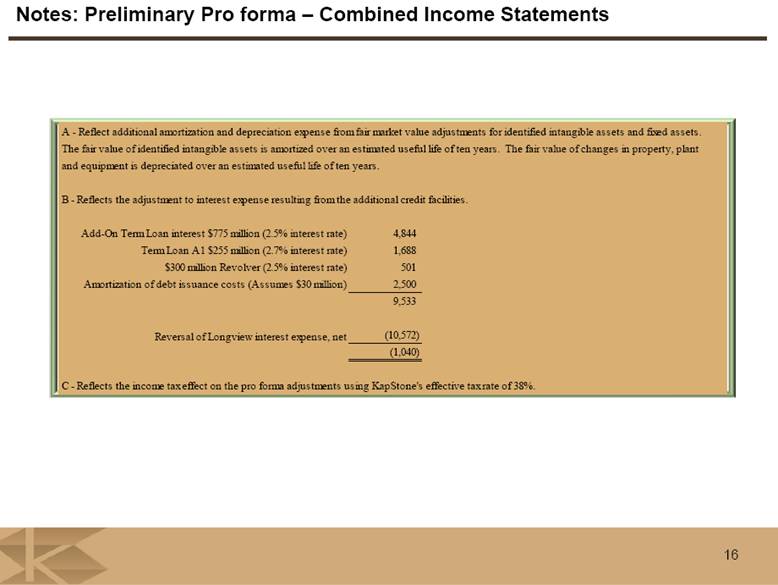
Notes: Preliminary Pro forma – Combined Income Statements 16 A - Reflect additional amortization and depreciation expense from fair market value adjustments for identified intangible assets and fixed assets. The fair value of identified intangible assets is amortized over an estimated useful life of ten years. The fair value of changes in property, plant and equipment is depreciated over an estimated useful life of ten years. B - Reflects the adjustment to interest expense resulting from the additional credit facilities. Add-On Term Loan interest $775 million (2.5% interest rate) 4,844 Term Loan A1 $255 million (2.7% interest rate) 1,688 $300 million Revolver (2.5% interest rate) 501 Amortization of debt issuance costs (Assumes $30 million) 2,500 9,533 Reversal of Longview interest expense, net (10,572) (1,040) C - Reflects the income tax effect on the pro forma adjustments using KapStone's effective tax rate of 38%. |
|
|
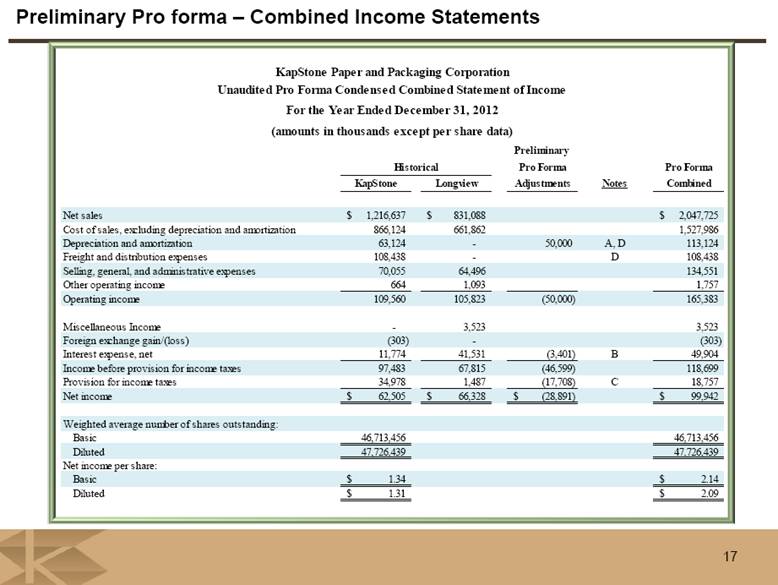
Preliminary Pro forma – Combined Income Statements 17 Preliminary Pro Forma Pro Forma KapStone Longview Adjustments Notes Combined Net sales 1,216,637 $ 831,088 $ 2,047,725 $ Cost of sales, excluding depreciation and amortization 866,124 661,862 1,527,986 Depreciation and amortization 63,124 - 50,000 A, D 113,124 Freight and distribution expenses 108,438 - D 108,438 Selling, general, and administrative expenses 70,055 64,496 134,551 Other operating income 664 1,093 1,757 Operating income 109,560 105,823 (50,000) 165,383 Miscellaneous Income - 3,523 3,523 Foreign exchange gain/(loss) (303) - (303) Interest expense, net 11,774 41,531 (3,401) B 49,904 Income before provision for income taxes 97,483 67,815 (46,599) 118,699 Provision for income taxes 34,978 1,487 (17,708) C 18,757 Net income 62,505 $ 66,328 $ (28,891) $ 99,942 $ Weighted average number of shares outstanding: Basic 46,713,456 46,713,456 Diluted 47,726,439 47,726,439 Net income per share: Basic 1.34 $ 2.14 $ Diluted 1.31 $ 2.09 $ For the Year Ended December 31, 2012 Historical KapStone Paper and Packaging Corporation Unaudited Pro Forma Condensed Combined Statement of Income (amounts in thousands except per share data) |
|
|
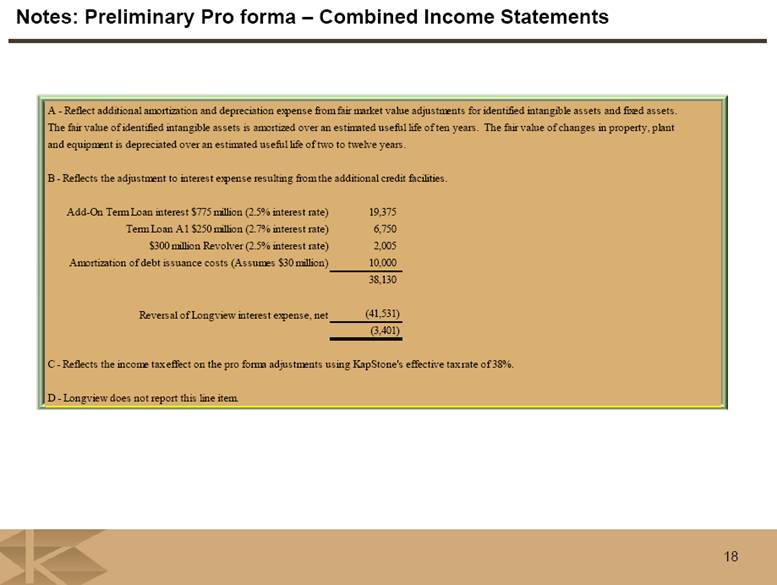
Notes: Preliminary Pro forma – Combined Income Statements 18 A - Reflect additional amortization and depreciation expense from fair market value adjustments for identified intangible assets and fixed assets. The fair value of identified intangible assets is amortized over an estimated useful life of ten years. The fair value of changes in property, plant and equipment is depreciated over an estimated useful life of two to twelve years. B - Reflects the adjustment to interest expense resulting from the additional credit facilities. Add-On Term Loan interest $775 million (2.5% interest rate) 19,375 Term Loan A1 $250 million (2.7% interest rate) 6,750 $300 million Revolver (2.5% interest rate) 2,005 Amortization of debt issuance costs (Assumes $30 million) 10,000 38,130 Reversal of Longview interest expense, net (41,531) (3,401) C - Reflects the income tax effect on the pro forma adjustments using KapStone's effective tax rate of 38%. D - Longview does not report this line item. |
|
|
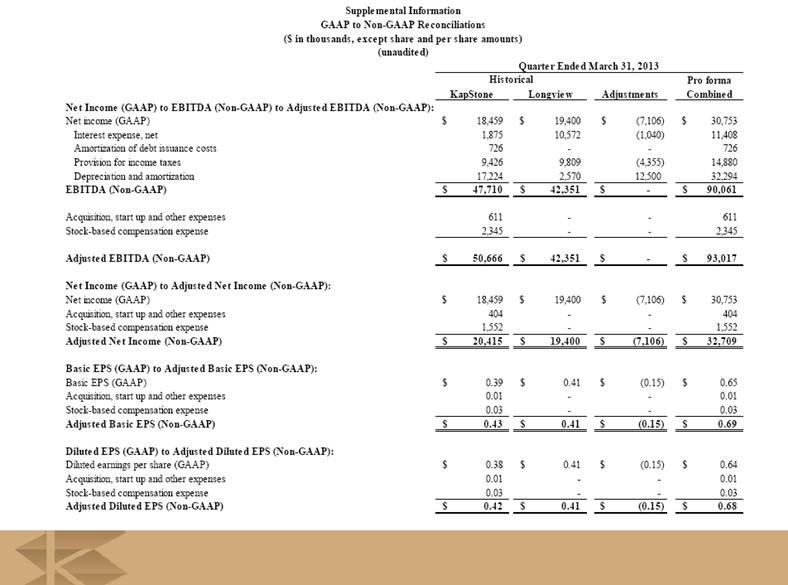
Pro forma KapStone Longview Adjustments Combined Net Income (GAAP) to EBITDA (Non-GAAP) to Adjusted EBITDA (Non-GAAP): Net income (GAAP) 18,459 $ 19,400 $ (7,106) $ 30,753 $ Interest expense, net 1,875 10,572 (1,040) 11,408 Amortization of debt issuance costs 726 - - 726 Provision for income taxes 9,426 9,809 (4,355) 14,880 Depreciation and amortization 17,224 2,570 12,500 32,294 EBITDA (Non-GAAP) 47,710 $ 42,351 $ - $ 90,061 $ Acquisition, start up and other expenses 611 - - 611 Stock-based compensation expense 2,345 - - 2,345 Adjusted EBITDA (Non-GAAP) 50,666 $ 42,351 $ - $ 93,017 $ Net Income (GAAP) to Adjusted Net Income (Non-GAAP): Net income (GAAP) 18,459 $ 19,400 $ (7,106) $ 30,753 $ Acquisition, start up and other expenses 404 - - 404 Stock-based compensation expense 1,552 - - 1,552 Adjusted Net Income (Non-GAAP) 20,415 $ 19,400 $ (7,106) $ 32,709 $ Basic EPS (GAAP) to Adjusted Basic EPS (Non-GAAP): Basic EPS (GAAP) 0.39 $ 0.41 $ (0.15) $ 0.65 $ Acquisition, start up and other expenses 0.01 - - 0.01 Stock-based compensation expense 0.03 - - 0.03 Adjusted Basic EPS (Non-GAAP) 0.43 $ 0.41 $ (0.15) $ 0.69 $ Diluted EPS (GAAP) to Adjusted Diluted EPS (Non-GAAP): Diluted earnings per share (GAAP) 0.38 $ 0.41 $ (0.15) $ 0.64 $ Acquisition, start up and other expenses 0.01 - - 0.01 Stock-based compensation expense 0.03 - - 0.03 Adjusted Diluted EPS (Non-GAAP) 0.42 $ 0.41 $ (0.15) $ 0.68 $ Supplemental Information GAAP to Non-GAAP Reconciliations ($ in thousands, except share and per share amounts) (unaudited) Historical Quarter Ended March 31, 2013 |
|
|
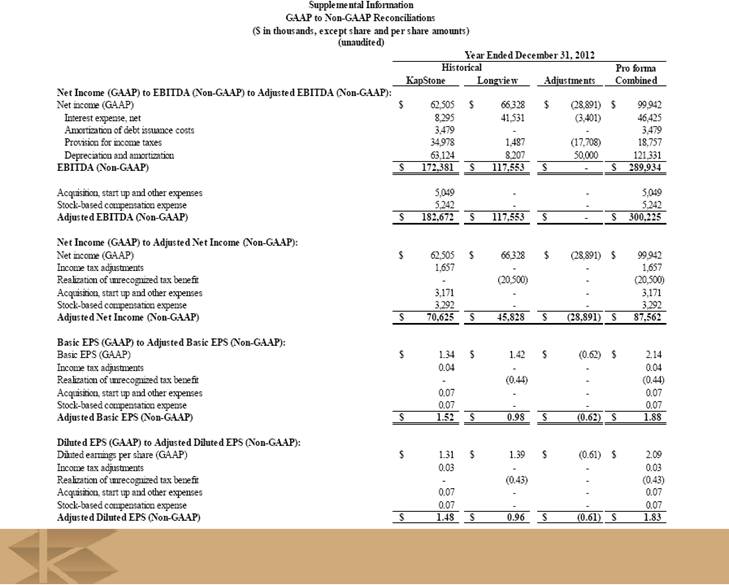
Pro forma KapStone Longview Adjustments Combined Net Income (GAAP) to EBITDA (Non-GAAP) to Adjusted EBITDA (Non-GAAP): Net income (GAAP) 62,505 $ 66,328 $ (28,891) $ 99,942 $ Interest expense, net 8,295 41,531 (3,401) 46,425 Amortization of debt issuance costs 3,479 - - 3,479 Provision for income taxes 34,978 1,487 (17,708) 18,757 Depreciation and amortization 63,124 8,207 50,000 121,331 EBITDA (Non-GAAP) 172,381 $ 117,553 $ - $ 289,934 $ Acquisition, start up and other expenses 5,049 - - 5,049 Stock-based compensation expense 5,242 - - 5,242 Adjusted EBITDA (Non-GAAP) 182,672 $ 117,553 $ - $ 300,225 $ Net Income (GAAP) to Adjusted Net Income (Non-GAAP): Net income (GAAP) 62,505 $ 66,328 $ (28,891) $ 99,942 $ Income tax adjustments 1,657 - - 1,657 Realization of unrecognized tax benefit - (20,500) - (20,500) Acquisition, start up and other expenses 3,171 - - 3,171 Stock-based compensation expense 3,292 - - 3,292 Adjusted Net Income (Non-GAAP) 70,625 $ 45,828 $ (28,891) $ 87,562 $ Basic EPS (GAAP) to Adjusted Basic EPS (Non-GAAP): Basic EPS (GAAP) 1.34 $ 1.42 $ (0.62) $ 2.14 $ Income tax adjustments 0.04 - - 0.04 Realization of unrecognized tax benefit - (0.44) - (0.44) Acquisition, start up and other expenses 0.07 - - 0.07 Stock-based compensation expense 0.07 - - 0.07 Adjusted Basic EPS (Non-GAAP) 1.52 $ 0.98 $ (0.62) $ 1.88 $ Diluted EPS (GAAP) to Adjusted Diluted EPS (Non-GAAP): Diluted earnings per share (GAAP) 1.31 $ 1.39 $ (0.61) $ 2.09 $ Income tax adjustments 0.03 - - 0.03 Realization of unrecognized tax benefit - (0.43) - (0.43) Acquisition, start up and other expenses 0.07 - - 0.07 Stock-based compensation expense 0.07 - - 0.07 Adjusted Diluted EPS (Non-GAAP) 1.48 $ 0.96 $ (0.61) $ 1.83 $ Historical Supplemental Information GAAP to Non-GAAP Reconciliations ($ in thousands, except share and per share amounts) (unaudited) Year Ended December 31, 2012 |