Attached files
| file | filename |
|---|---|
| 8-K - 8-K - KEMET CORP | a13-13296_18k.htm |
Exhibit 99.1
|
|
One World. One KEMET KeyBanc’s Industrial, Automotive & Transportation Conference May 29, 2013 Presenters: Per Loof – Chief Executive Officer William Lowe – Chief Financial Officer |
|
|
Cautionary Statement Certain statements included herein contain forward-looking statements within the meaning of federal securities laws about KEMET Corporation's (the "Company") financial condition and results of operations that are based on management's current expectations, estimates and projections about the markets in which the Company operates, as well as management's beliefs and assumptions. Words such as "expects," "anticipates," "believes," "estimates," variations of such words and other similar expressions are intended to identify such forward-looking statements. These statements are not guarantees of future performance and involve certain risks, uncertainties and assumptions, which are difficult to predict. Therefore, actual outcomes and results may differ materially from what is expressed or forecasted in, or implied by, such forward-looking statements. Readers are cautioned not to place undue reliance on these forward-looking statements, which reflect management's judgment only as of the date hereof. The Company undertakes no obligation to update publicly any of these forward-looking statements to reflect new information, future events or otherwise. Factors that may cause actual outcome and results to differ materially from those expressed in, or implied by, these forward-looking statements include, but are not necessarily limited to, the following: (i) adverse economic conditions could impact our ability to realize operating plans if the demand for our products declines, and such conditions could adversely affect our liquidity and ability to continue to operate; (ii) adverse economic conditions could cause the write down of long-lived assets or goodwill; (iii) an increase in the cost or a decrease in the availability of our principal or single-sourced purchased materials; (iv) changes in the competitive environment; (v) uncertainty of the timing of customer product qualifications in heavily regulated industries; (vi) economic, political, or regulatory changes in the countries in which we operate; (vii) difficulties, delays or unexpected costs in completing the restructuring plan; (viii) equity method investments expose us to a variety of risks; (ix) acquisitions and other strategic transactions expose us to a variety of risks; (x) the inability to attract, train and retain effective employees and management; (xi) the inability to develop innovative products to maintain customer relationships and offset potential price erosion in older products; (xii) exposure to claims alleging product defects; (xiii) the impact of laws and regulations that apply to our business, including those relating to environmental matters; (xiv) the impact of international laws relating to trade, export controls and foreign corrupt practices; (xv) volatility of financial and credit markets affecting our access to capital; (xvi) the need to reduce the total costs of our products to remain competitive; (xvii) potential limitation on the use of net operating losses to offset possible future taxable income; (xviii) restrictions in our debt agreements that limit our flexibility in operating our business; and (xix) additional exercise of the warrant by K Equity, LLC which could potentially result in the existence of a significant stockholder who could seek to influence our corporate decisions. |
|
|
MARKET OVERVIEW |

|
|
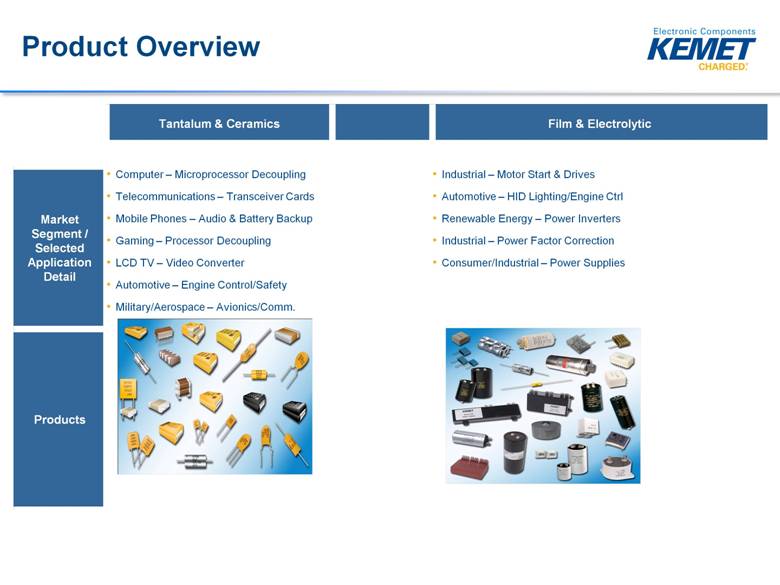
Product Overview Tantalum & Ceramics Film & Electrolytic Market Segment / Selected Application Detail Computer – Microprocessor Decoupling Telecommunications – Transceiver Cards Mobile Phones – Audio & Battery Backup Gaming – Processor Decoupling LCD TV – Video Converter Automotive – Engine Control/Safety Military/Aerospace – Avionics/Comm. Industrial – Motor Start & Drives Automotive – HID Lighting/Engine Ctrl Renewable Energy – Power Inverters Industrial – Power Factor Correction Consumer/Industrial – Power Supplies Products |
|
|
Sales Summary – FY13 Updated 4-30-2013 |
|
|
Global Capacitor Market Data Source: World Cap & KEMET |
|
|
Laptop Shipments (units) Million units Data Sources: MIC,IDC & Statista. |
|
|
Strategy- Driving Financial Performance -Vertical Integration -F&E Restructuring -Growth Opportunities -Private Label Partnership-NEC TOKIN |
|
|
KEMET’s Conflict Free Tantalum Vertically Integrated Supply Chain Mine provides Ore KTaF converted to Ta Powder/Wire Ta Powder/Wire converts to Ta Capacitors Ore converted to KTaF 9 |
|
|
Raw Material Cost Savings-Vertical Integration Key actions for FY14: K2 Mata ramping using Ore –AUG 2013 Q1 third-part buy to fill low volume – MAY 2013 Reliable supply of low cost Ore – SEP 2013 |
|
|
Film & Electrolytics Restructuring Campaign |
|
|
Film & Electrolytic Capacitors Restructuring will be completed during the second half of FY2014. The expectation is that F&E will become a positive contributor to our financial results by Q3 FY 2014. However, our evaluation of the future of the Film & Electrolytic business remaining a part of the KEMET family involves the following: Where we are in the current Business Cycle Where we are in terms of restructuring this business and the financial return from these efforts Our view of the current and future prospects for Film and Electrolytic capacitors |
|
|
Business Cycle Below is a historical quarterly view of the Film and Electrolytic Capacitor market in terms of value which illustrate the last two cycles . The swings (high to low) in purchasing of these two types of capacitors are dramatic (-50%, +100%). |
|
|
Business Cycle Objective: Take advantage of cyclical increase Sell our capabilities to initiate the timing of the increase Restructure our business so we can be profitable during the valleys as well as in the peaks. |
|
|
Restructuring During fiscal years 2011 and 2012, the Film & Electrolytic Capacitor Business Group generated ~$78MM in Segment Operating Profit. Approximately 15% EBIT margin. Since the previous peak period, we have reduced Film & Electrolytic Capacitor operating costs by ~$15M on an annual basis. A summary of the activities that generated these savings are: #Line Moves 31 #Plant Closing(s) 2 #People moved from HLCC to LLCC 211 During FY14, costs are expected to be reduced by another $17 million and $7 million additional savings in FY2015. This will be accomplished by executing the following actions: #Line Moves 34 #Plant Closing(s) 3 #Labor relocations 197 |
|
|
Restructuring Plan Line Move Summary |
|
|
Restructuring Continued: The two key initiatives for FY14 restructuring are: Creation of Lower Labor Cost Plants to support Europe and America: Skopje, Macedonia for Film Capacitors Evora, Portugal for Electrolytic Capacitors Consolidate three Italy Film plants into a single plant: Monghidoro, Italy operation for Film capacitor has ceased Vergato, Italy will be moved into Pontecchio, Italy facility in FY14 Sasso Marconi, Italy will be moved into Pontecchip, Italy facility in FY14 Maintain Asian Plants to support Asia and America: Anting, China and Batam, Indonesia for Film Capacitors Suzhou, China for Electrolytic Capacitors |
|
|
Macedonia Plant |
|
|
Product Capabilities Main uses of Film & Electrolytic capacitors: Motors Drives Power Supplies Voltage Conversion Circuits Power Meters Voltage / Pulse Suppression Power Factor Correction Film capacitors have a unique self-healing characteristic which prevents them from failing in a catastrophic way when the materials, process, and design are properly engineered. This provides opportunity for many safety applications where a fail safe mechanism is required. In addition, packages can also be engineered to provide a fail safe solution. These capabilities are needed now and will continue to be needed in the future. |
|
|
One of our strengths is our ability to design products to meet unique customer requirements for use in the following markets: Automotive Industrial Drives/Motors Wind Power Solar Power Medical Devices Lighting Electrical Distribution and Measurement As we restructure our manufacturing operations, we are keeping our R&D centers close to our customer’s to maintain this competitive advantage. Capabilities |
|
|
NEC TOKIN |
|
|
INVESTMENT IN NEC TOKIN KEMET announced on March 12, 2012 that it has entered into an agreement to acquire a 34% economic interest with a 51% voting interest in NEC TOKIN Corporation (“NEC TOKIN”) and will receive two call options that, if exercised, will result in the acquisition of 100% of NEC TOKIN NEC TOKIN manufactures tantalum and other capacitors, electro-magnetic materials, piezoelectric components, electro-mechanical devices and access devices Transaction closed on February 1, 2013. |
|
|
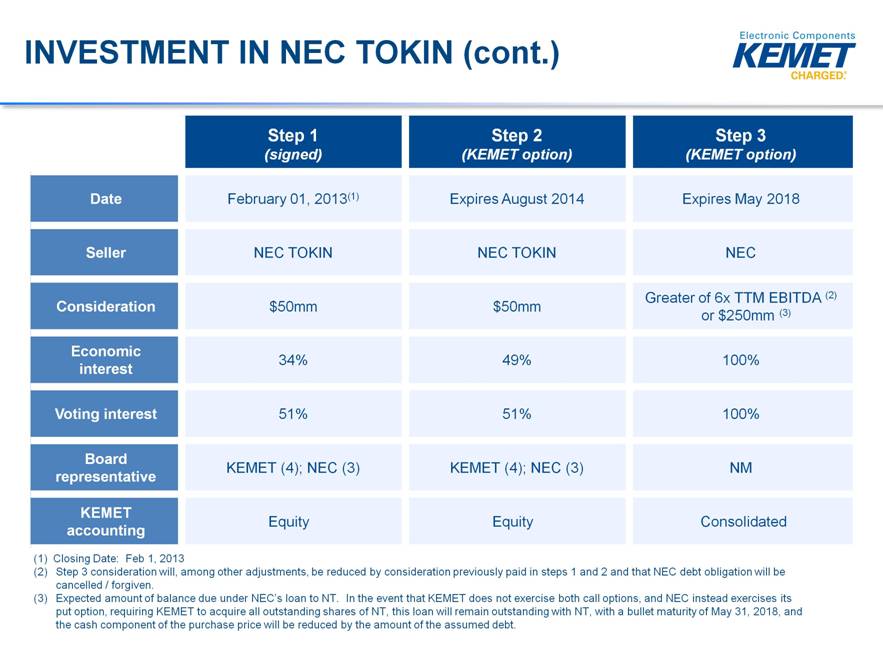
INVESTMENT IN NEC TOKIN (cont.) Step 1 (signed) Step 2 (KEMET option) Step 3 (KEMET option) Date February 01, 2013(1) Expires August 2014 Expires May 2018 Seller NEC TOKIN NEC TOKIN NEC Consideration $50mm $50mm Greater of 6x TTM EBITDA (2) or $250mm (3) Economic interest 34% 49% 100% Voting interest 51% 51% 100% Board representative KEMET (4); NEC (3) KEMET (4); NEC (3) NM KEMET accounting Equity Equity Consolidated (1) Closing Date: Feb 1, 2013 Step 3 consideration will, among other adjustments, be reduced by consideration previously paid in steps 1 and 2 and that NEC debt obligation will be cancelled / forgiven. Expected amount of balance due under NEC’s loan to NT. In the event that KEMET does not exercise both call options, and NEC instead exercises its put option, requiring KEMET to acquire all outstanding shares of NT, this loan will remain outstanding with NT, with a bullet maturity of May 31, 2018, and the cash component of the purchase price will be reduced by the amount of the assumed debt. |
|
|
NEC - TOKIN - Major Technologies (ex. Capacitors) EMC Devices (Electromagnetic compatibility) Products that transform, isolate, protect or filter signals EMD (Electromechanical devices) Products that act as a low power switch to activate a circuit or device such as a motor Access Control devices Products that control or protect personal, physical or signal access Piezoelectric devices Products that transform electric energy into mechanical energy (or the reverse) |
|
|
NEC - TOKIN Manufacturing Locations Sendai Shiroishi Toyama Japan Outside Japan Xiamen, China Dong Nai, Vietnam Calamba, Phillipines Chachoengsao, Thailand |
|
|
GROWTH OPPORTUNITES |

|
|
Capacitor Growth Opportunities Total Market = $17B $6B SAM $1.5B AVL $100M Potential Focus on growth opportunities at customers where KEMET is on AVL (Approved Vender List) and use “value added or applications specific” capacitors. ACTION: Leverage that preferred position to drive margin growth SEGMENT FOCUS: Automotive, Industrial, Medical, Military & Aerospace |
|
|
PP Expand markets and product offerings for both KEMET and NEC TOKIN Achieve true scale in operations to manage raw materials sourcing as well as maximize efficiencies and best practices in manufacturing and product development Partnership between two of the world's premier tantalum manufacturers Creates significant cross-selling opportunities for TaMnO2, Ta Poly, film capacitors, high value Aluminum Electrolytic capacitors and solutions capabilities (i.e., coils, relays, and piezo devices) Complementary geographic reach – strong KEMET presence in western hemisphere and excellent NEC - TOKIN position in Asia Benefits from international management team sensitive to region-specific business needs and combined R&D capabilities and university relationships Enjoy flexibility to pursue growth initiatives Continued R&D investment in both Japan and the U.S. Enables KEMET to diversify beyond capacitors in the in the passives market Private Label Partnership & Cross Licensing |
|
|
FINANCIAL METRICS |
|
|
Sales by Region $59.4 $60.5 $62.2 $62.2 $63.5 $77.9 $79.4 $70.7 $66.1 $73.7 $73.4 $83.7 $83.1 $72.0 $65.8 $210.7 $223.6 $216.0 $200.3 $203.0 $0 $50 $100 $150 $200 $250 $300 Q4 FY12 Q1 FY13 Q2 FY13 Q3 FY13 Q4 FY13 Americas Europe Asia |
|
|
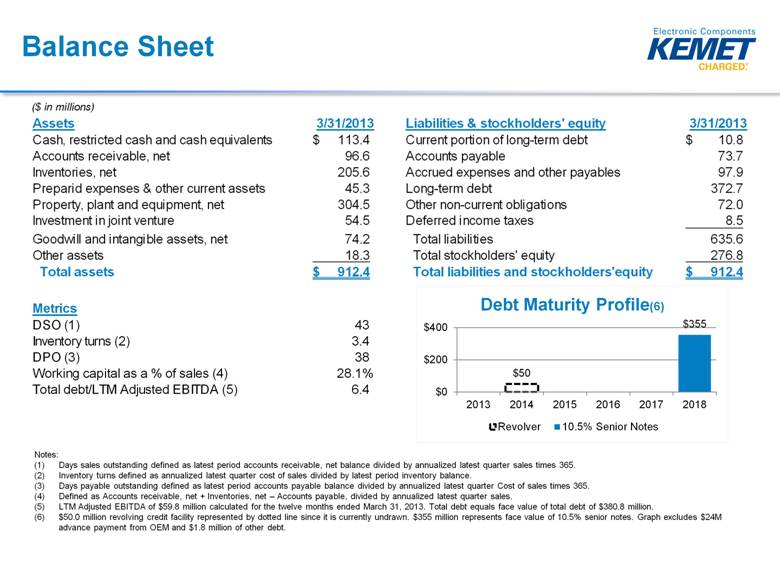
Balance Sheet Notes: Days sales outstanding defined as latest period accounts receivable, net balance divided by annualized latest quarter sales times 365. Inventory turns defined as annualized latest quarter cost of sales divided by latest period inventory balance. Days payable outstanding defined as latest period accounts payable balance divided by annualized latest quarter Cost of sales times 365. Defined as Accounts receivable, net + Inventories, net – Accounts payable, divided by annualized latest quarter sales. LTM Adjusted EBITDA of $59.8 million calculated for the twelve months ended March 31, 2013. Total debt equals face value of total debt of $380.8 million. $50.0 million revolving credit facility represented by dotted line since it is currently undrawn. $355 million represents face value of 10.5% senior notes. Graph excludes $24M advance payment from OEM and $1.8 million of other debt. ($ in millions) Assets 3/31/2013 Liabilities & stockholders' equity 3/31/2013 Cash, restricted cash and cash equivalents 113.4 $ Current portion of long-term debt 10.8 $ Accounts receivable, net 96.6 Accounts payable 73.7 Inventories, net 205.6 Accrued expenses and other payables 97.9 Preparid expenses & other current assets 45.3 Long-term debt 372.7 Property, plant and equipment, net 304.5 Other non-current obligations 72.0 Investment in joint venture 54.5 Deferred income taxes 8.5 Goodwill and intangible assets, net 74.2 Total liabilities 635.6 Other assets 18.3 Total stockholders' equity 276.8 Total assets 912.4 $ Total liabilities and stockholders'equity 912.4 $ $50 $355 $0 $200 $400 2013 2014 2015 2016 2017 2018 Debt Maturity Profile (6) Revolver 10.5% Senior Notes Metrics DSO (1) 43 Inventory turns (2) 3.4 DPO (3) 38 Working capital as a % of sales (4) 28.1% Total debt/LTM Adjusted EBITDA (5) 6.4 |
|
|
FINANCIAL TARGETS Consolidated Gross Margin – 25% Operating Margin (EBIT) – 10% |
|
|
Summary Current revenue forecast flat to prior quarter Approximately $12 million in overhead reductions during FY 2014 from recent reduction in force. Annualized $16 million beginning FY2015. Vertical integration of Tantalum raw material continues-benefits building to $7 million per quarter by Q4. Expected to achieve $10 million per quarter April 2015. F&E restructuring expected to help drive lower break-even point each quarter during FY2014. Cost reductions from relocations and plant closures approximately $17 million in FY2014 and an additional $7 million in FY2015. NEC Private Label Partnership to add value toward the end of FY2014. Net Income break-even at approximately $200 million of Revenue by Q4 FY2014. |
|
|
One world. One KEMET. |
|
|
APPENDIX |
|
|
Adjusted EBITDA Reconciliation (Amounts in thousands) FY13 Net loss before equity loss from NEC TOKIN (80,928) $ Interest expense, net 41,192 Income tax expense (benefit) 3,318 Depreciation and amortization 45,559 EBITDA 9,141 Excluding the following items (Non-GAAP) Restructuring charges 18,719 Write down of long-lived assets 7,582 ERP integration costs 7,702 Plant start-up costs 6,122 Stock-based compensation expense 4,599 Goodwill impairment 1,092 Acquisition related fees 4,581 Net curtailment and settlement gain on benefit plans 266 Registration related fees 20 Net (gain) loss on sales and disposals of assets 18 Net foreign exchange (gain) (28) Adjusted EBITDA 59,814 $ |