Attached files
| file | filename |
|---|---|
| EX-31.1 - EXHIBIT 31.1 - KEMET CORP | fy2018_q4x10kxex311.htm |
| EX-31.2 - EXHIBIT 31.2 - KEMET CORP | fy2018_q4x10kxex312.htm |
| EX-23.1 - EXHIBIT 23.1 - KEMET CORP | fy2018_q4x10kxex231.htm |
| EX-32.1 - EXHIBIT 32.1 - KEMET CORP | fy2018_q4x10kxex321.htm |
| EX-32.2 - EXHIBIT 32.2 - KEMET CORP | fy2018_q4x10kxex322.htm |
| EX-21.1 - EXHIBIT 21.1 - KEMET CORP | fy2018_q4x10kxex211.htm |
UNITED STATES
SECURITIES AND EXCHANGE COMMISSION
Washington, D.C. 20549
____________________________________________________________________________
FORM 10-K
(Mark One) | ||
ý | ANNUAL REPORT PURSUANT TO SECTION 13 OR 15(d) OF THE SECURITIES EXCHANGE ACT OF 1934 | |
For the fiscal year ended March 31, 2018 | ||
Or | ||
o | TRANSITION REPORT PURSUANT TO SECTION 13 OR 15(d) OF THE SECURITIES EXCHANGE ACT OF 1934 | |
For the transition period from to | ||
Commission File Number: 001-15491
____________________________________________________________________________
KEMET Corporation
(Exact name of registrant as specified in its charter)
Delaware (State or other jurisdiction of incorporation or organization) | 57-0923789 (I.R.S. Employer Identification No.) | |
101 NE 3rd Avenue, Suite 1700, Fort Lauderdale, Florida (Address of principal executive offices) | 33301 (Zip Code) | |
Registrant’s telephone number, including area code: (954) 766-2800
Securities registered pursuant to Section 12(b) of the Act:
(Title of each class) (Name of Exchange on which registered)
Common Stock, par value $0.01 New York Stock Exchange
Securities registered pursuant to Section 12(g) of the Act: None.
____________________________________________________________________________
Indicate by check mark if the registrant is a well-known seasoned issuer, as defined in Rule 405 of the Securities Act. Yes ý No o
Indicate by check mark if the registrant is not required to file reports pursuant to Section 13 or Section 15(d) of the Act. Yes o No ý
Indicate by check mark whether the registrant (1) has filed all reports required to be filed by Section 13 or 15(d) of the Securities Exchange Act of 1934 during the preceding 12 months (or for such shorter period that the registrant was required to file such reports), and (2) has been subject to such filing requirements for the past 90 days. Yes ý No o
Indicate by check mark whether the registrant has submitted electronically and posted on its corporate Web site, if any, every Interactive Data File required to be submitted and posted pursuant to Rule 405 of Regulation S-T (§ 232.405 of this chapter) during the preceding 12 months (or for such shorter period that the registrant was required to submit and post such files). Yes ý No o
Indicate by check mark if disclosure of delinquent filers pursuant to Item 405 of Regulation S-K (§ 229.405) is not contained herein, and will not be contained, to the best of registrant’s knowledge, in definitive proxy or information statements incorporated by reference in Part III of this Form 10-K or any amendment to this Form 10-K. o
Indicate by check mark whether the registrant is a large accelerated filer, an accelerated filer, a non-accelerated filer, a smaller reporting company, or an emerging growth company. See the definitions of “large accelerated filer,” “accelerated filer,” “smaller reporting company,” and "emerging growth company" in Rule 12b-2 of the Exchange Act (Check one):
Large Accelerated filer ý | Accelerated filer o | Non-accelerated filer o (Do not check if a smaller reporting company) | ||
Smaller reporting company o | Emerging growth company o | |||
If an emerging growth company, indicate by check mark if the registrant has elected not to use the extended
transition period for complying with any new or revised financial accounting standards provided pursuant to Section
13(a) of the Exchange Act. o
Indicate by check mark whether the registrant is a shell company (as defined in Rule 12b-2 of the Act). Yes o No ý
The aggregate market value of voting common stock held by non-affiliates of the registrant as of September 30, 2017 computed by reference to the closing sale price of the registrant’s common stock was approximately $1,164,758,499.
The number of shares of each class of common stock, $0.01 par value, outstanding as of May 18, 2018 was 56,944,132.
DOCUMENTS INCORPORATED BY REFERENCE
Portions of the definitive proxy statement to be delivered to stockholders in connection with the Annual Meeting of Stockholders to be held July 25, 2018 are incorporated by reference into Part III of this report.
Table of Contents
Page No. | ||
3
PART I
ITEM 1. BUSINESS
Background of Company
KEMET Corporation (“we,” “us,” “our,” “KEMET” and the “Company”), is a global manufacturer of passive electronic components. We first began manufacturing tantalum capacitors in 1958 as a division of Union Carbide Corporation (“UCC”) and became a stand-alone legal entity in 1990 following a management buyout from UCC. In 1992, we publicly issued shares of our common stock. Since then, we have made the following acquisitions:
Business Segment | Fiscal Year | Business |
Solid Capacitors Segment (“Solid Capacitors”) | 2007 | Tantalum Business Unit of EPCOS AG |
Film and Electrolytic Segment (“Film and Electrolytic”) | 2008 | Evox Rifa Group Oyj |
Film and Electrolytic | 2008 | Arcotronics Italia S.p.A. |
Film and Electrolytic | 2012 | Cornell Dubilier Foil, LLC (renamed KEMET Foil Manufacturing, LLC (“KFM”)) |
Solid Capacitors | 2012 | Niotan Incorporated (renamed KEMET Blue Powder Corporation (“KBP”)) |
Corporate | 2013 | 34% economic interest in TOKIN Corporation (“TOKIN”) (1) |
Corporate | 2016 | IntelliData, Inc. (“IntelliData”) |
Solid Capacitors and Electro-Magnetic, Sensors, and Actuators Segment ("MSA") | 2018 | TOKIN (1) |
______________________________________________________________________________
(1) In fiscal year 2013, our subsidiary, KEMET Electronics Corporation (“KEC”) acquired a 34% economic interest in TOKIN as calculated based on the number of common shares held by KEC, directly and indirectly, in proportion to the aggregate number of common and preferred shares of TOKIN outstanding as of such date. The Company accounted for its investment in TOKIN using the equity method for a non-consolidated variable interest entity since KEC did not have the power to direct significant activities of TOKIN. KEMET entered into a Definitive NEC TOKIN Stock Purchase Agreement (the “TOKIN Purchase Agreement”) with NEC Corporation (“NEC”), to acquire all of the outstanding shares of common stock and preferred stock of TOKIN not already held by KEMET. The transaction closed on April 19, 2017 and on that date TOKIN became a 100% indirect owned subsidiary of KEMET.
Through the above acquisitions and organic growth we have expanded our product base to include multilayer ceramic, solid and electrolytic aluminum and film capacitors, and electro-magnetic, sensors, and actuators.
General
We compete in the passive electronic component industry, specifically multilayer ceramic, tantalum, film and aluminum (solid and electrolytic) capacitors, and Electro-Magnetic Compatible ("EMC") devices, sensors, and actuators. Product offerings include surface mount, which are attached directly to the circuit board; leaded capacitors, which are attached to the circuit board using lead wires; and chassis-mount and other pin-through-hole board-mount capacitors, which utilize attachment methods such as screw terminal and snap-in. Capacitors are electronic components that store, filter, and regulate electrical energy and current flow. As an essential passive component used in nearly all circuit boards, capacitors are typically used for coupling, decoupling, filtering, oscillating and wave shaping and are used in communication systems, servers, personal computers, tablets, cellular phones, automotive electronic systems, defense and aerospace systems, consumer electronics, power management systems and many other electronic devices and systems (basically anything that plugs in or has a battery).
Our product line consists of many distinct part configurations distinguished by various attributes, such as dielectric (or insulating) material, configuration, encapsulation, capacitance (at various tolerances), voltage, performance characteristics and packaging. Most of our customers have multiple capacitance requirements, often within each of their products. Our broad product offering allows us to meet the majority of those needs independent of application and end use.
We believe the long-term demand for the various types of capacitors we offer will grow on a regional and global basis due to a variety of factors, including increasing demand for and complexity of electronic products, growing demand for technology in emerging markets and the ongoing development of new solutions for energy generation and conservation. Our customer base includes most of the world’s major electronics original equipment manufacturers (“OEMs”), electronics manufacturing services providers (“EMSs”) and distributors listed below.
4
Major OEMs:
• | Bosch Group, Cisco Systems Inc., Continental AG, Delphi Technologies PLC, Tesla Inc. and Denso in the automotive segment. |
• | Apple Inc., Western Digital Corporation, Dell Inc., Nintendo and Google LLC in the Computer and consumer segment. |
• | ABB Group, Terumo Corporation, Horiba and Schlumberger in the industrial and alternative energy segment. |
Major EMSs:
• | Flex Ltd, Jabil Circuit Inc., Celestica Inc and Sanmina-SCI Corporation |
Major Distributors:
• | TTI, Inc., Arrow Electronics, Inc. and Avnet, Inc. |
Solid Capacitors products are commonly used in conjunction with integrated circuits, and the same circuit may, and frequently does, contain both ceramic and tantalum capacitors. Tantalum capacitors are a popular choice because of their ability for high capacitance in a small volume package. While ceramic capacitors are more cost-effective at lower capacitance values, tantalum capacitors are more cost-effective at higher capacitance values while solid aluminum capacitors can be more effective in special applications.
Film, paper and aluminum electrolytic capacitors can be used to support integrated circuits, but also are used in the field of power electronics to provide energy for applications such as motor starts, power conditioning, electromagnetic interference filtering safety and inverters. Capacitors account for the largest market within the passive component product grouping.
The acquisition of TOKIN (the "TOKIN Acquisition") allowed the Company entry into EMC devices and sensor and actuator markets. The EMC business offers a broad line of electrical noise management products. As circuits become more complex within a device, and the amount of information being communicated between devices increases at a dramatic rate, the quality of electronic signals becomes key to the integrity of the information being communicated. TOKIN EMC products play a key role in maintaining signal integrity across a number of end markets including telecommunications, mobile computing, automotive and general industries. The sensor and actuator business manufactures products that sense and respond to human activity, physical vibration, and electric current. These products are found in home appliances, consumer devices and industrial electrical equipment.
Our Industry
We compete with others that manufacture and distribute capacitors both domestically and globally and our success in the market is influenced by many factors, including price, availability, engineering specifications, quality and breadth of offering, performance characteristics, customer service and geographic location of our manufacturing sites. As in all manufacturing industries, there is ongoing pressure on average unit selling prices for capacitors. To help mitigate this effect, KEMET, as well as many of our larger competitors, have relocated their manufacturing operations to low cost regions and locations in closer proximity to our respective customers.
Because capacitors are a fundamental component of electronic circuits, demand for capacitors tends to reflect the general demand for electronic products, as well as integrated circuits, which, though cyclical, continues to grow. We believe growth in the electronics market and the resulting growth in demand for capacitors will be driven primarily by a number of recent trends which include:
• | the development of new products and applications, such as alternative and renewable energy systems, hybrid transportation systems, electronic controls for engines and industrial machinery, smart phones and mobile personal computing devices; |
• | the “internet-of-things” products; |
• | the next generation of automotive electronics to support advance driver assistance systems, as well as the connected car; |
• | the increase in the electronic content of existing products, such as home appliances and medical equipment; |
• | consumer desire for mobility and connectivity; and |
• | the enhanced functionality, complexity and convergence of electronic devices that use state-of-the-art microprocessors. |
5
The acquisition of TOKIN increases our market opportunity through the EMC devices and sensor and actuator markets.
Markets and Customers
Our products are sold to a variety of OEMs in a broad range of industries including the computer, communications, automotive, military, consumer, industrial and aerospace industries. We also sell products to EMS providers, which serve OEMs in these industries. Electronics distributors are an important channel of distribution in the electronics industry and represent the largest channel through which we sell our capacitors. One electronics distributor, TTI, Inc., accounted for over 10% of our net sales in fiscal years 2018, 2017 and 2016. If our relationship with this customer were to terminate, we would need to determine alternative means of delivering our products to the end-customers served by them. In addition, an aggregate of over 10% of our net sales in fiscal year 2018 were driven by sales to EMS providers for incorporation into Apple Inc. products.
While we are seeing a merging of major segments as connectivity and “internet-of-things” grow, the following table presents an overview of the diverse industries that incorporate our capacitors into their products and the general nature of those products.
Industry | Products | |
Automotive | Adaptive cruise control, High intensity discharge headlamps, Light emitting diode electronic modules, Lane departure warning, Camera systems, Audio systems, Tire pressure monitoring, Power train electronics, Instrumentation, Airbag systems, Anti-lock braking and stabilization systems, Hybrid and electric drive vehicles, Electronic engine control modules, Driver comfort controls, Security systems, Radar, Connectivity systems and Advance driver assistance gear | |
Communications | Smart phones, Telephones, Switching equipment, Relays, Base stations, and Wireless infrastructure | |
Computer-related | Personal computers (laptops, tablets, notebooks), Workstations, Servers, Mainframes, Computer peripheral equipment, Power supplies, Solid state drives, and Local area networks | |
Industrial | Electronic controls, Measurement equipment, Instrumentation, Solar and wind energy generation, Down-hole drilling and Medical electronics | |
Consumer | Digital media devices, Game consoles, Televisions, Audio devices, and Global positioning systems | |
Military/Aerospace | Avionics, Radar, Guidance systems, and Satellite communications | |
Alternative Energy | Wind generation systems, Solar generation systems, Geothermal generation systems, Tidal generation systems and Electric drive vehicles | |
We produce a small percentage of capacitors under military specification standards sold for both military and commercial uses. We do not sell any capacitors directly to the United States government. Certain of our customers purchase capacitors for products in the military and aerospace industries.
It is impracticable to report revenues from external customers for each of the above noted products primarily because approximately 39.2% of our external sales were to electronics distributors for fiscal year 2018.
TOKIN increases our position in the following industries that incorporate EMC devices, sensors, and actuators into their products:
Industry | Products | |
Telecom Infrastructure | Switching equipment, Base stations, and Wireless infrastructure | |
Gaming | Consoles, Displays, Power management | |
Consumer | Battery chargers/AC adapters, Power supply, Refrigerators, Inductive cooking and Air conditioning | |
Automotive | Infotainment and Power supply | |
Medical | Test and Diagnostic | |
Industrial | Semiconductor producing equipment and Measurement equipment | |
6
KEMET in the United States
Our corporate headquarters is located in Fort Lauderdale, Florida.
Commodity manufacturing previously located in the United States has been substantially relocated to our lower-cost manufacturing facilities in Mexico, China and Europe. Production remaining in the United States focuses primarily on early-stage manufacturing of new products and other specialty products for which customers are predominantly located in North America.
On February 21, 2012, we completed the acquisition of all of the outstanding shares of Blue Powder, a leading manufacturer of tantalum powders. Blue Powder had been a significant supplier of tantalum powder to KEMET for several years. KBP's principal operating location is in Carson City, Nevada. Over the next several quarters, the Company will modify its vertical integration strategy by relocating its tantalum powder facility equipment from Carson City, Nevada to its existing Matamoros, Mexico plant.
To accelerate the pace of innovations, KEMET maintains an Innovation Center for Solid Capacitors near Greenville, South Carolina. The primary objectives of the KEMET Innovation Center are to ensure the flow of new product platforms, material sets, and processes that are expected to keep us at the forefront of our customers’ product designs, while enabling these products to be transferred rapidly to the most appropriate KEMET manufacturing location in the world for low-cost, high-volume production.
KEMET in Mexico
We believe our operations in Mexico are among the most cost efficient in the world, and we expect they will continue to be our primary production facilities supporting North American and European customers for Solid Capacitors. One of the strengths of KEMET Mexico is that it is a local operation, including local management and workers. These facilities are responsible for maintaining KEMET’s tradition of excellence in quality, service, and delivery, while driving costs down. The facilities in Victoria and Matamoros are focused primarily on tantalum capacitors, while the facilities in Monterrey are focused on ceramic capacitors.
KEMET in Asia Pacific
We have a well-established manufacturing, sales and logistics network in Asia to support our customers’ Asian operations. We currently manufacture tantalum and aluminum polymer and electrolytic products in China. In addition, as a result of the acquisition of TOKIN on April 19, 2017, we manufacture electromagnetic compatibility and sensor and actuator products in China, Japan and Vietnam and tantalum capacitors in Thailand and Japan. The vision for KEMET's foreign subsidiaries is for them to be primarily local operations, with local management and workers, to help achieve our objective of being a global company. These facilities are responsible for maintaining our tradition of excellence in quality, service, and delivery, while accelerating cost-reduction efforts and supporting efforts to grow our customer base in Asia. In addition, we operate one innovation center for Solid Capacitors and two innovation centers for MSA in Japan.
KEMET in Europe
We currently have one or more manufacturing locations in each of the following countries: Bulgaria, Finland, Italy, Macedonia, Portugal, and Sweden. In addition, we operate product innovation centers in Italy, Portugal and Sweden. We continue to maintain and enhance our strong European sales and customer service infrastructure, allowing us to continue to meet the local preferences of European customers who remain an important focus for KEMET.
Global Sales and Logistics
KEMET serves the needs of our global customer base through four geographic regions: North America and South America (“Americas”), Europe, the Middle East and Africa (“EMEA”), Asia and the Pacific Rim (“APAC”) and Japan and Korea ("JPKO"). We also have independent sales representatives located in several countries worldwide including: Brazil, Israel, Canada, and the United States.
In our major markets, we market and sell our products primarily through a direct sales force. With a global sales organization that is customer-focused, our direct sales personnel from around the world serve on KEMET Global Account Teams committed to serving any customer location in the world with a dedicated KEMET representative. The traditional sales team is supported by regional Field Application Engineers who are experts in electronic engineering and market all of KEMET’s products by assisting customers with the resolution of capacitor application issues. We believe our direct sales force creates a distinct advantage in the marketplace by enabling us to establish and maintain strong relationships with our customers to efficiently process simple repeat business as well as to consult with customers on new and technically complex custom applications. In addition, where appropriate, we use independent commissioned representatives. This approach requires a blend
7
of accountability and responsibility for specific customer locations, guided by an overall account strategy for each customer. Our sales team works with the customers throughout the entire purchasing process, following opportunities as they progress through concept, design, validation and, finally, mass production. In Japan, we market and sell directly and through manufacturers agents, who sell exclusively for KEMET or TOKIN, and do not carry competitor products. These manufacturers agents create unique custom solutions integrating our products which help pull our products though the channel.
Electronics distributors are an important distribution channel in the electronics industry and accounted for 39.2%, 46.8%, and 41.9% of our net sales in fiscal years 2018, 2017 and 2016, respectively. A portion of our net sales to distributors are made under agreements allowing certain rights of return and price protection on unsold merchandise held by distributors. In addition, our distributor policy includes inventory price protection and “ship-from-stock and debit” (“SFSD”) programs common in the industry.
Sales by Geography
In fiscal years 2018 and 2017, net sales by region were as follows (dollars in thousands):
Fiscal Year 2018 | Fiscal Year 2017 | |||||||||||||||
Net Sales | % of Total | Net Sales | % of Total | |||||||||||||
APAC | $ | 479,987 | 40.0 | % | APAC | $ | 288,764 | 38.1 | % | |||||||
EMEA | 277,643 | 23.1 | % | EMEA | 237,890 | 31.4 | % | |||||||||
Americas | 259,105 | 21.6 | % | Americas | 224,056 | 29.6 | % | |||||||||
JPKO | 183,191 | 15.3 | % | JPKO | 7,081 | 0.9 | % | |||||||||
Total | $ | 1,199,926 | Total | $ | 757,791 | |||||||||||
We believe our regional balance of revenues is a benefit to our business. The geographic diversity of our net sales diminishes the impact of regional sales decreases caused by various holiday seasons. The Americas remains the leading region in the world for product design in activity where engagement with OEM design engineers determines product placement independent of the region of the world where the final product is manufactured. Please see Note 7, “Segment and Geographic Information” to our consolidated financial statements.
Inventory and Backlog
Our customers often encounter uncertain or changing demand for their products. They historically order products from us based on their forecast and if demand does not meet their forecasts, they may cancel or reschedule the shipments included in our backlog, in many instances without penalty. Additionally, many of our customers have started to require shorter lead times and “just in time” delivery. Consequently, the twelve month order backlog is not a meaningful trend indicator for us.
The Company is currently at or near sales capacity for many products. Although we manufacture and inventory standardized products, a portion of our products are produced to meet specific customer requirements. Cancellations by customers of orders already in production could have an impact on inventories. Historically, however, cancellations have not been significant.
Competition
The capacitor industry is characterized by, among other factors, a long-term trend toward lower prices, low transportation costs, and few import barriers. Competitive factors influencing the market for our products include: product quality, customer service, technical innovation, pricing, and timely delivery. We believe we compete favorably on the basis of each of these factors.
Our major global competitors in the passive electronic component industry include AVX Corporation, Coilcraft Inc., Elna Co., Ltd., Panasonic Corporation, Littelfuse, Inc., Murata Manufacturing Co., Ltd., Samsung, Taiyo Yuden Co., Ltd., Schaffner Group, TDK-EPC Corporation, WIMA GmbH and Co., KG, Vishay Intertechnology, Inc. (“Vishay”) and 3M Company.
Raw Materials
The principal raw materials used in the manufacture of our products are tantalum powder, tantalum ore, palladium, aluminum, silver, copper, nickel and tin. These materials are considered commodities and are subject to price volatility. Additionally, any delays in obtaining raw materials for our products could hinder our ability to manufacture our products, negatively impacting our competitive position and our relationships with our customers.
8
Tantalum is mined principally in the Democratic Republic of Congo, Australia, Brazil, Canada, Mozambique and Rwanda. As a result of our tantalum vertical integration program which began in fiscal year 2012, we have reduced our exposure to price volatility and supply uncertainty in the tantalum supply chain. A majority of our tantalum needs are now met through our direct sourcing partners of conflict free tantalum ore or tantalum scrap reclaim, which is then processed into the intermediate product potassium heptafluorotantalate (commonly known as K-salt) at our own facility in Mexico or at third party locations, before final processing into tantalum powder at KBP. Price increases for tantalum ore, or for the remaining tantalum powder that we source from third parties, could impact our financial performance as we may not be able to pass all such price increases on to our customers.
Silver and aluminum have generally been available in sufficient quantities, and we believe there are a sufficient number of suppliers from which we can purchase our requirements. An increase in the price of silver and aluminum that we are unable to pass on to our customers, could, however, have an adverse effect on our profitability.
Patents and Trademarks
As of March 31, 2018, we held the following number of patents and trademarks:
Patents | Trademarks | |||||
United States | 313 | 18 | ||||
Foreign | 1,006 | 259 | ||||
Many of our patents and trademarks were obtained as part of the TOKIN acquisition. We believe the success of our business is not materially dependent on the existence or duration of any individual patent, license, or trademark other than the trademarks “KEMET,” “KEMET Charged,” and "TOKIN". Our engineering and research and development staffs have developed and continue to develop proprietary manufacturing processes and equipment designed to enhance our manufacturing facilities and reduce costs.
Research and Development
Research and development expenses were $39.6 million, $27.4 million and $24.6 million for fiscal years 2018, 2017 and 2016, respectively. These amounts include expenditures for product development and the design and development of machinery and equipment for new processes and cost reduction efforts. We continue to invest in new technology to improve product performance and production efficiencies.
Segment Reporting
We are organized into three segments: Solid Capacitors, Film and Electrolytic and Electro-Magnetic, Sensors, and Actuators. Each segment is responsible for the operations of certain manufacturing sites as well as all related research and development efforts. The sales, marketing and corporate functions are shared by each of the segments. See Note 7, “Segment and Geographic Information” to our consolidated financial statements for other information regarding the Company, including net sales, operating income (loss), total assets, and financial information about geographic areas.
Solid Capacitors Segment
Solid Capacitors operates in ten manufacturing sites in the United States, Mexico and Asia and operates innovation centers in the United States and Japan. Solid Capacitors primarily produces tantalum, aluminum, polymer and ceramic capacitors which are sold globally. Solid Capacitors also produces tantalum powder used in the production of tantalum capacitors. Solid Capacitors employs approximately 8,150 employees worldwide. For fiscal years 2018, 2017 and 2016, Solid Capacitors had consolidated net sales of $771.2 million, $575.1 million and $556.3 million, respectively.
We continue to make significant investments in tantalum production within Solid Capacitors and, based on net sales, we believe we are the largest tantalum capacitor manufacturer in the world. We believe we have one of the broadest lines of tantalum product offerings and are one of the leaders in the growing market for high-frequency surface mount tantalum and aluminum polymer capacitors. On February 21, 2012, we acquired KBP which we believe is the largest production facility for tantalum powder in the western hemisphere. The Company continues to streamline its vertical integration strategy and may take actions to improve the cost structure if the anticipated results are advantageous. The Company is in the process of relocating its tantalum powder facility equipment from Carson City, Nevada to its existing Matamoros, Mexico plant.
Our tantalum product line is broad product portfolio, industry leading process and materials technology, global manufacturing base and on-time delivery capabilities allow us to serve a wide range of customers in a diverse group of end markets, including computing, telecommunications, consumer, medical, military, automotive and general industries.
9
Our ceramic product line offers an extensive line of multilayer ceramic capacitors in a variety of sizes and configurations. We are one of the two leading ceramic capacitor manufacturers headquartered in the United States and among the ten largest manufacturers worldwide.
Our ceramics product line is high temperature and capacitance stable product lines provide us with what we believe to be a significant advantage over many of our competitors, especially in high reliability markets, such as medical, industrial, defense and aerospace. Our other significant end-markets include computing, telecommunications, automotive and general industries.
Film and Electrolytic Segment
Our Film and Electrolytic Segment produces film, paper and wet aluminum electrolytic capacitors. In addition, the segment designs and produce electromagnetic interference filters ("EMI filters"). Film capacitors can be used for applications requiring high power and high voltages. Whereas aluminum electrolytic capacitors can be used for applications requiring high energy at a reasonable price. EMI filters consist of capacitive and inductive elements that reduce electromagnetic disturbance in the frequency range desired. We believe we are one of the world’s largest suppliers of film capacitors and one of the leaders in wet aluminum electrolytic capacitors. Both product families serve industrial and automotive customers, and in particular, the emerging market for alternative energy and electrical vehicles. For fiscal years 2018, 2017, and 2016, our Film and Electrolytic segment had consolidated net sales of $201.7 million, $182.7 million, and $178.5 million, respectively. Our Film and Electrolytic business is concentrated in Europe, and as such, is impacted by the change in the exchange rate for the Euro to the U.S. dollar.
Our Film and Electrolytic Segment primarily serves the industrial and automotive markets. We believe our Film and Electrolytic Segment’s product portfolio, technology and experience allow us to significantly benefit from the continued growth in alternative energy solutions and energy efficiency solutions within both the automotive and industrial markets especially for demanding applications such as humidity, temperature, voltage, etc. We operate ten manufacturing sites throughout Europe and Asia and maintain product innovation centers in Italy, Portugal and Sweden. Our Film and Electrolytic Segment employs approximately 1,750 employees worldwide.
Electro-Magnetic, Sensors, and Actuators Segment
MSA operates in four manufacturing sites throughout Asia and operates a product innovation center in Japan. MSA is a new segment for KEMET in fiscal year 2018 resulting from the acquisition of TOKIN in April 2017. MSA primarily produces EMC materials and devices, piezo materials and actuators and various types of sensors which are sold globally. For the fiscal year 2018, our Electro-Magnetic, Sensors, and Actuators Segment had consolidated net sales of $227.0 million. Our MSA business is concentrated in Japan and Korea. Our MSA segment employs approximately 3,450 employees worldwide.
The EMC device product line offers a broad line of electrical noise management products. As circuits become more complex within a device, and the amount of information being communicated between devices increases at a dramatic rate, the quality of electronic signals becomes key to the integrity of the information being communicated. EMC products play a key role in maintaining signal integrity across a number of end-markets including telecommunications, mobile computing, automotive and general industries.
The sensor and actuator product line manufactures products that sense and respond to human activity, physical vibration, and electric current. These products are found in home appliances, consumer devices industrial electrical equipment. In addition, we manufacture electromechanical actuation devices that are critical to the manufacture of semiconductor devices and the management of industrial and chemical gas flow. Sensors are an important family of devices as the “internet-of-things” continues to permeate everyday life.
Environmental and Regulatory Compliance
We are subject to various North American, European, and Asian national, state, and local environmental laws and regulations relating to the protection of the environment, including those governing the handling and management of certain chemicals and materials used and generated in manufacturing electronic components. Based on the annual costs incurred over the past several years, we do not believe compliance with these laws and regulations will have a material adverse effect on our capital expenditures, earnings, or competitive position. We believe, however, it is reasonably likely the trend in environmental litigation, laws, and regulations will continue to be toward stricter standards. Such changes in the laws and regulations may require us to make additional capital expenditures which, while not currently estimable with certainty, are not presently expected to have a material adverse effect on our financial condition.
We are strongly committed to economic, environmental, and socially sustainable development. As a result of this commitment, in 2008 we adopted the Electronic Industry Citizenship Coalition (“EICC”) Code of Conduct, now titled
10
Responsible Business Alliance ("RBA") Code of Conduct. The RBA Code of Conduct is a comprehensive code of conduct that addresses all aspects of corporate responsibility including labor, health and safety, the environment, business ethics, and related management system elements. It outlines standards to ensure working conditions in the electronic industry supply chain are safe, free from slavery and human trafficking, workers are treated with respect and dignity, manufacturing processes are environmentally sustainable and materials are sourced responsibly.
Policies, programs, and procedures implemented throughout KEMET are intended to ensure conformity with legal and regulatory requirements, the content of the RBA Code of Conduct, and customer contractual requirements related to social and environmental responsibility.
We fully support the position of the RBA, the Global e-Sustainability Initiative (“GeSI”), now titled Responsible Minerals Initiative ("RMI") and the Tantalum-Niobium International Study Center (“TIC”) in avoiding the use of conflict minerals which directly or indirectly finance or benefit armed groups in the Democratic Republic of Congo and its adjoining countries, or in any region determined to be a conflict affected and high risk area. This policy and requirement has been communicated to all suppliers of conflict minerals and this policy is communicated publicly on our website. Our tantalum supply base has been and continues to be validated as conformant to the RMI's Responsible Minerals Assurance Program ("RMAP"). We will continue to work through the RMI and TIC towards the goal of greater transparency in the supply chain.
Summary of Activities to Develop a Transparent Supply Chain
We are actively involved in developing a transparent supply chain through our membership in the RMI. We were a member of the EICC/GeSI working group that developed the original Conflict Free Sourcing Progam assessment protocols and participated in the pilot implementation phase of the Organization for Economic Cooperation and Development Due Diligence Guidance for Responsible Supply Chains of Minerals from Conflict-Affected and High-Risk Areas. We participate in smelter engagement to increase the number of conflict-free validated smelters globally, the development of due diligence guidance documents and the advancement of the industry adopted conflict minerals reporting template. We will rely on the RMAP independent third party audits to supplement our internal due diligence of conflict mineral suppliers and are monitoring the progress of these audits to ensure our supply chain is conflict free. We fully support section 1502 “Conflict Minerals” of the Dodd-Frank Wall Street Reform and Consumer Protection Act of 2010 and are complying with all reporting requirements.
Global Code of Conduct and Mission, Vision and Values
KEMET maintains a Global Code of Conduct (“Code of Conduct”), which became effective August 1, 2010, as well as mission (“Mission”), vision (“Vision”) and values (“Values”) statements along with a set of core values, which became effective in June 2011. KEMET’s Mission is to help make the world a better, safer, more connected place to live. KEMET’s Vision is to be the world’s most trusted partner for innovative component solutions. KEMET’s Values embody the key expectations of how our employees should approach the work they do every day: One KEMET, Unparalleled Customer Experience, Ethics and Integrity, Talent Oriented, No Politics, The Math Must Work and Speed. The Global Code of Conduct and Mission, Vision and Values are applicable to all employees, officers, and directors of the Company. We intend to satisfy the disclosure requirement under Item 5.05 of Form 8-K regarding an amendment to, or waiver from a provision of our Code of Conduct, Mission, Vision and Values by posting such information on our website at http://www.kemet.com.
KEMET supports the Kisengo Foundation and certain other charitable endeavors in the Democratic Republic of Congo with periodic monetary donations. Funds have been used toward building and supporting a new hospital and school as well as the installation of fresh water wells, solar street lighting, infrastructure improvements and a micro-agriculture project.
Employees
We have approximately 14,850 employees as of March 31, 2018 in the following locations:
Asia | 7,000 | |
Mexico | 5,850 | |
Europe | 1,400 | |
United States | 600 | |
11
The number of employees represented by labor organizations at KEMET locations in each of the following countries is as follows:
Mexico | 4,050 | |
Vietnam | 1,650 | |
Japan | 700 | |
Indonesia | 350 | |
Italy | 200 | |
Bulgaria | 150 | |
Finland | 150 | |
Sweden | 100 | |
In fiscal year 2018, we did not experience any major work stoppages. Our labor costs in Mexico, Asia and various locations in Europe are denominated in local currencies, and a significant depreciation or appreciation of the United States dollar against the local currencies would increase or decrease our labor costs.
Securities Exchange Act of 1934 (“Exchange Act”) Reports
We maintain an Internet website at the following address: http://www.kemet.com. KEMET makes available on or through our Internet website certain reports and amendments to those reports filed or furnished to the Securities and Exchange Commission (“SEC”) pursuant to Section 13(a) or 15(d) of the Exchange Act. These include annual reports on Form 10-K, quarterly reports on Form 10-Q, current reports on Form 8-K and beneficial ownership reports on Forms 3, 4 and 5. This information is available on our website free of charge as soon as reasonably practicable after we electronically file the information with, or furnish it to, the SEC.
ITEM 1A. RISK FACTORS.
This report contains certain statements that are forward-looking within the meaning of the Private Securities Litigation Reform Act of 1995. These statements are not guarantees of future performance and involve certain risks, uncertainties and assumptions that are difficult to predict. Actual outcomes and results may differ materially from those expressed in, or implied by, our forward-looking statements. Words such as “expects,” “anticipates,” “believes,” “estimates” or other similar expressions and future or conditional verbs such as “will,” “should,” “would” and “could” are intended to identify such forward-looking statements. Readers of this report should not rely solely on the forward-looking statements and should consider all uncertainties and risks throughout this report. The statements are representative only as of the date they are made, and we undertake no obligation to update any forward-looking statement.
All forward-looking statements, by their nature, are subject to risks and uncertainties. Our actual future results may differ materially from those set forth in our forward-looking statements. We face risks that are inherent in the businesses and the market places in which we operate. While management believes these forward-looking statements are accurate and reasonable, uncertainties, risks and factors, including those described below, could cause actual results to differ materially from those reflected in the forward-looking statements.
Factors that may cause actual outcomes and results to differ materially from those expressed in, or implied by, these forward-looking statements include, but are not necessarily limited to, the following: (i) adverse economic conditions could impact our ability to realize operating plans if the demand for our products declines, and such conditions could adversely affect our liquidity and ability to continue to operate and could cause a write down of long-lived assets or goodwill; (ii) an increase in the cost or a decrease in the availability of our principal or single-sourced purchased raw materials; (iii) changes in the competitive environment; (iv) uncertainty of the timing of customer product qualifications in heavily regulated industries; (v) economic, political, or regulatory changes in the countries in which we operate; (vi) difficulties, delays, or unexpected costs in completing the restructuring plans; (vii) acquisitions and other strategic transactions expose us to a variety of risks; (viii) acquisition of TOKIN may not achieve all of the anticipated results; (ix) our business could be negatively impacted by increased regulatory scrutiny and litigation; (x) difficulties associated with retaining, attracting, and training effective employees and management; (xi) the need to develop innovative products to maintain customer relationships and offset potential price erosion in older products; (xii) exposure to claims alleging product defects; (xiii) the impact of laws and regulations that apply to our business, including those relating to environmental matters and cyber security; (xiv) the impact of international laws relating to trade, export controls and foreign corrupt practices; (xv) changes impacting international trade and corporate tax provisions related to the global manufacturing and sales of our products may have an adverse effect on our financial condition and results of operations; (xvi) volatility of financial and credit markets affecting our access to capital; (xvii) the need to reduce the total costs of our products to remain competitive; (xviii) potential limitation on the use of net operating losses to offset possible future taxable income; (xix) restrictions in our debt agreements that could limit our flexibility
12
in operating our business; (xx) disruption to our information technology systems to function properly or control unauthorized access to our systems may cause business disruptions; (xxi) economic and demographic experience for pension and other post-retirement benefit plans could be less favorable than our assumptions; (xxii) fluctuation in distributor sales could adversely affect our results of operations, (xxiii) earthquakes and other natural disasters could disrupt our operations and have a material adverse effect on our financial condition and results of operations, (xxiv) volatility in our stock price.
Additional risks and uncertainties not presently known to us or that we currently deem immaterial also may impair our business operations and could cause actual results to differ materially from those included, contemplated or implied by the forward-looking statements made in this report, and the reader should not consider the above list of factors to be a complete set of all potential risks or uncertainties.
Adverse economic conditions could impact our ability to realize operating plans if the demand for our products declines; and such conditions could adversely affect our liquidity, ability to continue to operate and could cause the write down of long-lived assets or goodwill.
While our operating plans provide for cash generated from operations to be sufficient to cover our future operating requirements, many factors, including reduced demand for our products, currency exchange rate fluctuations, increased raw material costs, and other adverse market conditions we cannot predict could cause a shortfall in net cash generated from operations. As an example, the electronics industry is a cyclical industry with demand for capacitors reflecting the demand for products in the electronics market. Customers’ requirements for our capacitors fluctuate as a result of changes in general economic activity and other factors affecting the demand for their end-products. During periods of increasing demand for their products, they typically seek to increase their inventory of our products to avoid production bottlenecks. When demand for their products peaks and begins to decline, they may rapidly decrease orders for our products while they use accumulated inventory. Business cycles vary somewhat in different geographical regions, such as Asia, and within customer industries. We are also vulnerable to general economic events beyond our control and our sales and profits may suffer in periods of weak demand.
Our ability to realize operating plans is also dependent upon meeting our payment obligations. If cash generated from operating, investing and financing activities is insufficient to pay for operating requirements and to cover interest payment obligations under debt instruments, planned operating and capital expenditures may need to be reduced.
Additionally, long-lived assets and intangible assets subject to amortization are reviewed for impairment whenever events or changes in circumstances indicate the carrying amount of a long-lived asset or group of assets may not be recoverable. Also, goodwill is reviewed for impairment annually and whenever events or changes in circumstances indicate the carrying amount of goodwill may not be recoverable. In the event the tests show the carrying value of certain long-lived assets is impaired, we would be required to take an impairment charge to earnings under U.S. generally accepted accounting principles. However, such a charge would have no direct effect on our cash. If the economic conditions decline we could incur impairment charges in the future.
An increase in the cost or decrease in the availability of our principal or single-sourced purchased raw materials could adversely affect profitability.
The principal raw materials used in the manufacture of our products are tantalum powder, tantalum ore, palladium, aluminum, silver, copper, nickel and tin. These materials are considered commodities and are subject to price volatility. Additionally, any delays in obtaining raw materials for our products could hinder our ability to manufacture our products, negatively impacting our competitive position and our relationships with our customers.
Tantalum is mined principally in the Democratic Republic of Congo, Australia, Brazil, Canada, Mozambique and Rwanda. As a result of our tantalum vertical integration program which began in fiscal year 2012, we have reduced our exposure to price volatility and supply uncertainty in the tantalum supply chain. A majority of our tantalum needs are now met through our direct sourcing partners of conflict free tantalum ore or tantalum scrap reclaim, which is then processed into the intermediate product potassium heptafluorotantalate (commonly known as K-salt) at our own facility in Mexico or at third party locations, before final processing into tantalum powder at KBP. Price increases for tantalum ore, or for the remaining tantalum powder that we source from third parties, could impact our financial performance as we may not be able to pass all such price increases on to our customers.
Silver and aluminum have generally been available in sufficient quantities, and we believe there are a sufficient number of suppliers from which we can purchase our requirements. An increase in the price of silver and aluminum that we are unable to pass on to our customers, could, however, have an adverse effect on our profitability.
13
Changes in the competitive environment could harm our business.
The capacitor business is competitive worldwide, with low transportation costs and few import barriers. Competition is based on factors such as product quality and reliability, availability, customer service, technical innovation, timely delivery and price. The industry has become increasingly consolidated and global in recent years, and our primary U.S. and non-U.S. competitors, some of which are larger than us, have significant financial resources. The greater financial resources of such competitors may enable them to commit larger amounts of capital in response to changing market conditions. Some competitors may also have the ability to use profits from other operations to subsidize losses sustained in their businesses with which we compete. Certain competitors may also develop product or service innovations that could put us at a disadvantage.
Uncertainty of the timing of customer product qualifications in heavily regulated industries could affect the timing of product revenues and profitability arising from these industries.
Our capacitors are incorporated into products used in diverse industries. Certain of these industries, such as military, aerospace and medical, are heavily regulated, with long and sometimes unpredictable product approval and qualification processes. Due to such regulatory compliance issues, there can be no assurances as to the timing of product revenues and profitability arising from our product development and sales efforts in these industries.
We manufacture many capacitors in Europe, Mexico and Asia and economic, political or regulatory changes in any of these regions could adversely affect our profitability.
Our international operations are subject to a number of special risks, in addition to the same risks as our domestic business. These risks include currency exchange rate fluctuations, differing protections of intellectual property, trade barriers, labor unrest, exchange controls, regional economic uncertainty, differing (and possibly more stringent) labor regulation, risk of governmental expropriation, domestic and foreign customs and tariffs, current and changing regulatory regimes, differences in the availability and terms of financing, political instability and potential increases in taxes. These factors could impact our production capability or adversely affect our results of operations or financial condition.
We may experience difficulties, delays or unexpected costs in completing our restructuring plan and may not realize all of the expected benefits from our restructuring plan.
During fiscal year 2018, our restructuring plans focused on making the Company more competitive by relocating production to lower cost locations and eliminating unnecessary costs. Restructuring plans which include personnel reduction costs initiated in fiscal year 2018 are summarized below:
• | The Solid Capacitors segment is streamlining its vertical integration strategy by relocating its tantalum powder facility equipment from Carson City, Nevada to its existing Matamoros, Mexico plant. Severance charges and equipment relocation costs are expected to be recognized over the next seven quarters. |
• | The Film and Electrolytic segment had a voluntary reduction in force in its Italian operations. |
We may not realize, in full or in part, the anticipated benefits of the restructuring plan without encountering difficulties, which may include complications in the transfer of production knowledge, loss of key employees and/or customers, the disruption of ongoing business, possible inconsistencies in standards, controls and procedures and potential difficulty in meeting customer demand in the event the market dramatically improves. We are party to collective bargaining agreements in certain jurisdictions in which we operate which could potentially prevent or delay execution of parts of our restructuring plan.
Acquisitions and other strategic transactions expose us to a variety of operational and financial risks.
Our ability to realize the anticipated benefits of acquisitions depends, to a large extent, on our ability to integrate the acquired companies with our own. Our management devotes significant attention and resources to these efforts, which may disrupt the business of each of the companies and, if executed ineffectively, could preclude realization of the full benefits we expect. Failure to realize the anticipated benefits of our acquisitions could cause an interruption of, or a loss of momentum in, the operations of the acquired company. In addition, the efforts required to realize the benefits of our acquisitions may result in material unanticipated problems, expenses, liabilities, competitive responses, loss of customer relationships, the diversion of management’s attention, and may cause our stock price to decline.
Additionally, we may finance acquisitions or future payments with cash from operations, additional indebtedness and/or the issuance of additional securities, any of which may impair the operation of our business or present additional risks, such as reduced liquidity or increased interest expense. Such acquisition financing could result in a decrease of our ratio of earnings to fixed charges. We may also seek to restructure our business in the future by disposing of certain of our assets, which may harm our future operating results, divert significant managerial attention from our operations and/or require us to accept non-cash consideration, the market value of which may fluctuate.
14
Failure to implement our acquisition strategy, including successfully integrating acquired businesses, could have an adverse effect on our business, financial condition and results of operations.
We may not realize the anticipated cross-selling synergies and revenue expansion expected to result from the acquisition of TOKIN and we may experience difficulties in integrating TOKIN’s business which may adversely affect our financial performance.
There can be no assurance we will realize the anticipated operating synergies, tax benefits and revenue expansion from the acquisition of TOKIN or we will not experience difficulties in integrating the operations of TOKIN with our operations. For example, the integration of TOKIN will require the experience and expertise of certain of our key managers and key managers of TOKIN. There can be no assurance, however, that these managers will remain with us for the time period necessary to successfully integrate the operations of TOKIN with our operations. In addition, the acquisition of TOKIN may present significant challenges for our management due to the increased time and resources required to properly integrate our management, employees, information systems, accounting controls, personnel and administrative functions with those of TOKIN and to manage the combined company on a going forward basis. There can be no assurance we will be able to successfully integrate and streamline overlapping functions or, if successfully accomplished, that such integration will not be more costly to accomplish than presently contemplated or that we will not encounter difficulties in managing the combined company due to its increased size and scope. Furthermore, expansions or acquisitions into new geographic markets and services may require us to comply with new and unfamiliar legal and regulatory requirements, which could impose substantial obligations on us and our management, cause us to expend additional time and resources and increase our exposure to penalties or fines for non-compliance with such requirements.
Furthermore, there can be no assurance that, as a combined company, we will continue to maintain all of the supplier and customer relationships we and TOKIN maintained as separate companies. As a combined company, we may encounter difficulties managing relationships with our suppliers and our customers due to our increased size and scope and to the increased number of relationships we will have with suppliers and customers.
We are currently subject to increased regulatory scrutiny and litigation that may negatively impact our business.
The growth of our Company and our expansion into a variety of new products expose us to a variety of new regulatory issues, and we have experienced increased regulatory scrutiny as we have grown. We are subject to various federal, foreign and state laws, including antitrust laws, violations of which can involve civil or criminal sanctions. Furthermore, as a result of our acquisition of TOKIN, we assumed all liabilities assessed against TOKIN that may arise as a result of litigation to which TOKIN is a party. Beginning in March 2014, TOKIN and certain of its subsidiaries have received inquiries, requests for information and other communications from government authorities in China, the United States, the European Commission, Japan, South Korea, Taiwan, Singapore and Brazil concerning alleged anti-competitive activities within the capacitor industry, and TOKIN has subsequently received significant fines from the United States Department of Justice, the European Union and the Taiwan Fair Trade Commission arising out of their respective investigations. Given our leading position within several segments of the capacitor industry and our acquisition of TOKIN on April 19, 2017, these investigations have exposed us to civil litigation costs and could interfere with our ability to meet certain business objectives. As of March 31, 2018, TOKIN’s accrual for antitrust and civil litigation totaled $76.7 million. This amount includes the best estimate of losses which may result from the ongoing antitrust investigations, civil litigation and claims. However, the actual outcomes could differ from what has been accrued.
Various purported antitrust class actions as described in “Item 3. Legal Proceedings,” have been filed in United States district courts and Canada alleging collusion and restraint of trade in capacitors by the named defendants, including KEMET Corporation, KEC and TOKIN.
Except for the TOKIN accrual described above, the Company has not recorded any accrual concerning these antitrust class action suits.
The impact of these and other investigations could have a material adverse effect on our financial position, liquidity and results of operations.
15
If we are unable to attract, train or retain key employees, management or a highly skilled and diverse workforce, it could have a negative impact on our business, financial condition or results of operations.
Our success depends upon the continued contributions of our executive officers and certain other employees, many of whom have many years of experience with us and would be extremely difficult to replace. We must also attract and retain experienced and highly skilled engineering, sales and marketing and managerial personnel. Competition for qualified personnel is intense in our industry, and we may not be successful in hiring and retaining these people. If we lost the services of our executive officers or our other highly qualified and experienced employees or cannot attract and retain other qualified personnel, our business could suffer through less effective management due to loss of accumulated knowledge of our business or through less successful products due to a reduced ability to design, manufacture and market our products.
We must continue to develop innovative products to maintain relationships with our customers and to offset potential price erosion in older products.
While most of the fundamental technologies used in the passive components industry have been available for a long time, the market is nonetheless characterized by rapid changes in product designs and technological advances allowing for better performance, smaller size and/or lower cost. New applications are frequently found for existing technologies, and new technologies occasionally replace existing technologies for some applications or open up new business opportunities in other areas of application. We believe successful innovation is critical for maintaining profitability in order to offset potential erosion of selling prices for existing products and to ensure the flow of new products and robust manufacturing processes that will keep us at the forefront of our customers’ product designs. Non-customized commodity products are especially vulnerable to price pressure, but customized products have also experienced price pressure in recent years. Developing and marketing new products requires start-up costs that may not be recouped if these products or production techniques are not successful. There are numerous risks inherent in product development, including the risks we will be unable to anticipate the direction of technological change or we will be unable to develop and market new products and applications in a timely fashion to satisfy customer demands. If this occurs, we could lose customers and experience adverse effects on our results of operations.
We may be exposed to claims alleging product defects.
Our business exposes us to claims alleging product defects or nonconformance with product specifications. We may be held liable for, or incur costs related to, such claims if any of our products, or products in which our products are incorporated, are found to have caused end market product application failures, product recalls, property damage or personal injury. Provisions in our customer and distributor agreements are designed to limit our exposure to potential material product defect claims, including warranty, indemnification, waiver and limitation of liability provisions, but such provisions may not be effective under the laws of some jurisdictions. If we cannot successfully defend ourselves against product defect claims, we may incur substantial liabilities. Regardless of the merits or eventual outcome, defect claims could entail substantial expense and require the time and attention of key management personnel.
Our insurance program may not be adequate to cover all liabilities arising out of product defect claims and, at any time, insurance coverage may not be available on commercially reasonable terms or at all. If liability coverage is insufficient, a product defect claim could result in liability to us, which could materially and adversely affect our results of operations or financial condition. Even if we have adequate insurance coverage, product defect claims or recalls could result in negative publicity or force us to devote significant time and attention to those matters.
Various laws and regulations that apply to our business, including those relating to conflict minerals and environmental matters, could limit our ability to operate as we are currently and could result in additional costs.
We are subject to various laws and regulations of national, state and local authorities in the countries in which we operate regarding a wide variety of matters, including conflict minerals, environmental, employment, land use, antitrust, and others that affect the day-to-day operations of our business. The liabilities and requirements associated with the laws and regulations that affect us may be costly and time-consuming. There can be no assurance we have been or will be at all times in compliance with such applicable laws and regulations. Failure to comply may result in the assessment of administrative, civil and criminal penalties, the issuance of injunctions to limit or cease operations, the suspension or revocation of permits and other enforcement measures that could have the effect of limiting our operations. If we are pursued for sanctions, costs or liabilities in respect of these matters, our operations and, as a result, our profitability could be materially and adversely affected.
The SEC requires issuers for whom tantalum, tin, tungsten and gold are necessary to the functionality or production of a product manufactured, or contracted to be manufactured, by such person to disclose annually whether any of those minerals originated in the Democratic Republic of Congo or an adjoining country. As defined by the SEC, tantalum, tin, tungsten and gold are commonly referred to as “conflict minerals” or “3TG”. If an issuer’s conflict minerals originated in those countries, the rule requires the issuer to submit a report to the Commission that includes a description of the measures it took to exercise due diligence on the conflict minerals’ source and chain of custody. We use tantalum, tin and, to a lesser degree, other of the
16
3TG minerals in our production processes and in our products. We have exercised due diligence on the source and chain of custody during the reporting period and, as required under the rule, have disclosed a description of these measures and certain of our findings in a special disclosure on Form SD. Disclosure in accordance with the rule may cause changes to the pricing of 3TG minerals, which could adversely affect our profitability. In addition, it is possible some of our disclosures pursuant to the rule related to our inquiries and supply chain custody diligence could cause reputational harm and cause the company to lose customers or sales.
In addition, we are subject to a variety of U.S. federal, state and local, as well as foreign, environmental laws and regulations relating, among other things, to wastewater discharge, air emissions, handling of hazardous materials, disposal of solid and hazardous wastes, and remediation of soil and groundwater contamination. We use a number of chemicals or similar substances and generate waste that are considered hazardous. We are required to hold environmental permits to conduct many of our operations. Violations of environmental laws and regulations could result in substantial fines, penalties, and other sanctions. Changes in environmental laws or regulations (or in their enforcement) affecting or limiting, for example, our chemical uses, certain of our manufacturing processes, or our disposal practices, could restrict our ability to operate as we are currently operating or impose additional costs. In addition, we may experience releases of certain chemicals or discover existing contamination, which could cause us to incur material cleanup costs or other damages.
Our international sales and operations are subject to applicable laws relating to trade, export controls and foreign corrupt practices, the violation of which could adversely affect our operations.
We must comply with all applicable export control laws and regulations of the United States and other countries. United States laws and regulations applicable to us include the Arms Export Control Act, the International Traffic in Arms Regulations (“ITAR”), the Export Administration Regulations (“EAR”) and the trade and trade sanctions laws and regulations administered by the Office of the United States Trade Representative (“OFTR”) and the United States Department of the Treasury’s Office of Foreign Assets Control (“OFAC”). The import and export of our products from each of our United States and international manufacturing facilities and distribution hubs are subject to international trade agreements, the modification or repeal of which could impact our business. We must comply with the requirements of OFTR and non-U.S. trade representative offices in order to benefit from existing trade agreements. EAR restricts the export of dual-use products and technical data to certain countries, while ITAR restricts the export of defense products, technical data and defense services. The U.S. government agencies responsible for administering EAR and ITAR have significant discretion in the interpretation and enforcement of these regulations. We also cannot provide services to certain countries subject to United States trade sanctions unless we first obtain the necessary authorizations from OFAC. In addition, we are subject to the Foreign Corrupt Practices Act and other anti-bribery laws that, generally, bar bribes or unreasonable gifts to foreign governments or officials.
Violations of these laws or regulations could result in significant additional sanctions including fines, more onerous compliance requirements, more extensive debarments from export privileges, loss of authorizations needed to conduct aspects of our international business and criminal penalties and may harm our ability to enter contracts with customers who have contracts with the U.S. government. A violation of the laws or the regulations enumerated above could materially adversely affect our business, financial condition and results of operations.
Changes impacting international trade and corporate tax provisions related to the global manufacturing and sales of our products may have an adverse effect on our financial condition and results of operations.
A significant portion of our business activities are conducted in foreign countries, including Mexico and China. Our business benefits from free trade agreements such as the North American Free Trade Agreement (“NAFTA”) and we also rely on various U.S. corporate tax provisions related to international commerce as we build, market and sell our products globally. Changes in trade treaties and corporate tax policy could impact U.S. trade relations with other countries such as Mexico, and adversely affect our financial condition and results of operations.
Volatility of financial and credit markets could affect our access to capital.
Uncertainty in the global financial and credit markets could impact our ability to implement new financial arrangements or to modify our existing financial arrangements. An inability to obtain new financing or to further modify existing financing could adversely impact the execution of our restructuring plans and delay the realization of the expected cost reductions. Our ability to generate adequate liquidity will depend on our ability to execute our operating plans and to manage costs in light of developing economic conditions. An unanticipated decrease in sales, or other factors that would cause the actual outcome of our plans to differ from expectations, could create a shortfall in cash available to fund our liquidity needs. Being unable to access new capital, experiencing a shortfall in cash from operations to fund our liquidity needs and the failure to implement an initiative to offset the shortfall in cash would likely have a material adverse effect on our business.
17
We must consistently reduce the total costs of our products to remain competitive.
Our industry is intensely competitive and prices for existing commodity products tend to decrease steadily over their life cycle. There is substantial and continuing pressure from customers to reduce the total cost of capacitors. To remain competitive, we must achieve continuous cost reductions through process and product improvements.
We must also be in a position to minimize our customers’ shipping and inventory financing costs and to meet their other goals for rationalization of supply and production. Our growth and the profit margins of our products will suffer if our competitors are more successful in reducing the total cost to customers of their products than we are. We must also continue to introduce new products that offer performance advantages over our existing products and can thereby achieve premium prices, offsetting the price declines in our more mature products.
Our use of net operating losses to offset possible future taxable income could be limited by ownership changes.
In addition to the general limitations on the carryback and carryforward of net operating losses under Section 172 of the Internal Revenue Code (the “Code”), Section 382 of the Code imposes further limitations on the utilization of net operating losses by a corporation following ownership changes which result in more than a 50 percentage point change in ownership of a corporation within a three-year period. If Section 382 applies, the post-ownership change utilization of our net operating losses may be subject to limitation for federal income tax purposes related to regular and alternative minimum tax. The application of Section 382 of the Code now or in the future could limit a substantial part of our future utilization of available net operating losses. Such limitation could require us to pay substantial additional income taxes and adversely affect our liquidity and financial position.
We do not believe we have experienced an ownership change to date. However, the Section 382 rules are complex and there is no assurance our view is correct. For example, the issuance of a warrant (the “Platinum Warrant”) in May 2009 to K Financing, LLC (“K Financing”), in connection with the entry into a credit facility (the “Platinum Credit Facility”) with K Financing, may be deemed to have resulted in an “ownership change” for purposes of Section 382 of the Code. If such an ownership change is deemed to have occurred, the amount of our post-ownership change taxable income that could be offset by our pre-ownership change net operating loss carryforwards would be severely limited. While we believe the issuance of the Platinum Warrant did not result in an ownership change for purposes of Section 382 of the Code, there is no assurance our view will be unchallenged.
Even if we have not experienced an ownership change to date, we could experience an ownership change in the near future if there are certain significant purchases of our common stock or other events outside our control.
Our debt agreements contain restrictions that could limit our flexibility in operating our business.
Our debt agreements contain various covenants that, subject to exceptions, may limit our ability to, among other things: incur additional indebtedness; create liens on assets; make capital expenditures; engage in mergers, consolidations, liquidations and dissolutions; sell assets (including pursuant to sale leaseback transactions); pay dividends and distributions on or repurchase capital stock; make investments (including acquisitions), loans, or advances; prepay certain junior indebtedness; engage in certain transactions with affiliates; enter into restrictive agreements; amend material agreements governing certain junior indebtedness; and change lines of business. The agreement governing our revolving credit facility also includes a fixed charge coverage ratio covenant that we must satisfy if an event of default occurs or in the event we do not meet certain excess availability requirements under our revolving credit facility. Our ability to comply with this covenant is dependent on our future performance, which may be subject to many factors, some of which are beyond our control.
If our information technology systems fail to function properly it may cause business disruptions.
As a global company we depend on our information technology systems to support our business. Any inability to successfully manage the procurement, development, implementation, execution or maintenance of our information systems, including matters related to system and data security, reliability, compliance or performance could have an adverse effect on our business including our results of operation and timeliness of financial reporting.
In the ordinary course of business, we collect and store sensitive data and information, including our proprietary and regulated business information, as well as personally identifiable information about our employees, in addition to other information upon which our business processes rely. Our information systems, like those of other companies, are susceptible to malicious damage, intrusions and outages due to, among other events, viruses, breaches of security, natural disasters, power loss or telecommunications failures. We have taken steps to maintain adequate data security and address these risks and uncertainties by implementing security technologies, internal controls, network and data center resiliency and recovery processes. The Company is continuously working to install new, and upgrade its existing, information technology systems and provide employee awareness training around phishing, malware, and other cyber risks to ensure that the Company is protected,
18
to the greatest extent possible, against cyber risks and security breaches. However, any operational failure could lead to the loss or disclosure of confidential and other important information which could have the following implications: loss of intellectual property, significant remediation costs, disruption to key business operations and diversion of management’s attention and key informational technology resources.
If economic and demographic experience for pension and other post-retirement benefit plans are less favorable than our assumptions (e.g., discount rates or return on investments), then it may affect our financial condition and results
of operations.
The measurement of our obligations, costs, and liabilities associated with benefits pursuant to our pension and other post-retirement benefit plans requires that we estimate the present value of projected future payments to all participants. We use many assumptions in calculating these estimates, including assumptions related to discount rates, return on investments on designated plan assets, and demographic experience (e.g. mortality and retirement rates). To the extent actual results are less favorable than our assumptions, there could be a substantial adverse impact on our financial condition and results of operations. For instance, significant decreases in market interest rates could lead to increases in annual pension expense. Further, decreases in the value of plan assets could lead to an increased use of cash for plan contributions. For discussion of our assumptions, see “Management’s Discussion and Analysis of Financial Condition and Results of Operations—Critical Accounting Policies” in Item 7 and Note 9 to the consolidated financial statements.
Sales to distribution channel customers may fluctuate and adversely affect our results of operations.
From time-to-time, if end customer demand decreases, our sales to distributors also decrease while the distributors reduce their inventory levels. In addition, a single customer, a distributor, accounted for over 10% of our net sales in fiscal years 2018, 2017 and 2016. If our relationship with this customer were to terminate, we would need to determine alternative means of delivering our products to the end-customers served by it.
Earthquakes and other natural disasters could disrupt our operations and have a material adverse effect on our financial condition and results of operations.
Several of our facilities in Japan are located in regions that could be subject to earthquakes and other natural disasters. Our production facilities located in Japan are in areas with above average seismic activity and some have been affected by other natural disasters such as tsunami. If any of our facilities in Japan or elsewhere were to experience a catastrophic earthquake or other natural disaster, such event could disrupt our operations, delay production, shipments, and revenue, and result in large expenses to repair or replace the facility or facilities. While KEMET has property insurance to partially reimburse it for losses caused by windstorm and earth movement, such insurance would not cover all possible losses. In addition, our existing disaster recovery and business continuity plans (including those relating to our information technology systems) may not be fully responsive to, or minimize losses associated with, catastrophic events.
Our stock price can be volatile.
The market price for our common stock has been volatile historically. Our stock price may be significantly affected by factors including those described elsewhere in "Part 1, Item 1A. Risk Factors," as well as the following:
• | general market and economic conditions; |
• | quarterly fluctuations in our operating results compared to market expectations; |
• | investors' perceptions of the electronic component industry; |
• | changes in financial estimates by us or securities analysts and recommendations by securities analysts; |
• | the composition of our stockholders, particularly the presence of "short sellers" trading our stock; and |
• | a decline in our credit rating. |
ITEM 1B. UNRESOLVED STAFF COMMENTS.
None.
19
ITEM 2. PROPERTIES.
We are headquartered in Fort Lauderdale, Florida, and, as of March 31, 2018, we had 24 manufacturing plants located in North America, Europe and Asia. Our manufacturing and research facilities include approximately 4.8 million square feet of floor space and use proprietary manufacturing processes and equipment.
Our facilities in Mexico operate under the Maquiladora program. In general, a company that operates under this program is afforded certain duty and tax preferences and incentives on products brought into the United States. Our manufacturing standards, including compliance with worker safety laws and regulations, are essentially identical in North America, Europe and Asia. Our operations in Mexico, Europe and Asia, similar to our United States operations, have won numerous quality, environmental and safety awards.
We believe substantially all of our property and equipment is in good condition, and overall, we have sufficient capacity to meet our current and projected manufacturing and distribution needs. The following table provides certain information regarding our principal facilities:
_______________________________________________________________________________
Location | Square Footage (in thousands) | Type of Interest | Description of Use | ||||
Fort Lauderdale, Florida, U.S.A | 21 | Leased | Headquarters (1) | ||||
Simpsonville, South Carolina, U.S.A. | 382 | Owned | Innovation Center, Advanced Tantalum Manufacturing | ||||
Solid Capacitor Segment | |||||||
Matamoros, Mexico | 286 | Owned | Manufacturing | ||||
Monterrey, Mexico (2) | 532 | Owned | Manufacturing | ||||
Suzhou, China (2) | 353 | Leased | Manufacturing | ||||
Ciudad Victoria, Mexico | 265 | Owned | Manufacturing | ||||
Carson City, Nevada U.S.A. | 87 | Owned | Manufacturing | ||||
Nyuzen, Toyama Japan (3) | 209 | Owned | Manufacturing and Innovation Center | ||||
Chachoengsao, Thailand (3) | 140 | Owned | Manufacturing | ||||
Film and Electrolytic Segment | |||||||
Evora, Portugal | 233 | Owned | Manufacturing and Innovation Center | ||||
Skopje, Macedonia | 126 | Owned | Manufacturing | ||||
Granna, Sweden | 132 | Owned | Manufacturing | ||||
Suomussalmi, Finland | 56 | Leased | Manufacturing | ||||
Batam, Indonesia (4) | 86 | (4) | (4) | ||||
Kyustendil, Bulgaria (4) | 83 | (4) | (4) | ||||
Pontecchio, Italy | 226 | Owned | Manufacturing and Innovation Center | ||||
Anting, China (5) | 73 | (5) | (5) | ||||
Farjestaden, Sweden | 28 | Leased | Manufacturing and Innovation Center | ||||
Electro-Magnetic, Sensors, and Actuators Segment (3) | |||||||
Shiroishi, Miyagi Japan | 524 | Owned | Manufacturing and Innovation Center | ||||
Sendai, Miyagi Japan | 377 | Owned | Manufacturing and Innovation Center | ||||
Bien Hoa City Dong Nai Province, Vietnam | 174 | Owned | Manufacturing | ||||
Xiamen, China | 432 | Owned | Manufacturing | ||||
(1) Beginning in FY 2018 and concluding in FY 2019, we moved headquarter functions from Simpsonville, South Carolina to Fort Lauderdale, Florida.
(2) Includes two manufacturing facilities.
(3) New properties added during fiscal year 2018 related to the acquisition of TOKIN on April 19, 2017.
(4) Includes one owned manufacturing facility and one leased warehouse facility.
(5) Includes one owned manufacturing facility and one leased manufacturing and innovation center.
20
ITEM 3. LEGAL PROCEEDINGS.
We or our subsidiaries may at any one time be parties to lawsuits arising out of our respective operations, including workers’ compensation or work place safety cases, some of which involve claims of substantial damages. Although there can be no assurance, based upon information known to us, we do not believe that any liability which might result from an adverse determination of such lawsuits would have a material adverse effect on our financial condition or results of operations.
As previously reported, KEMET and KEC, along with more than 20 other capacitor manufacturers and subsidiaries (including TOKIN, as described below), are defendants in a purported antitrust class action complaint, In re: Capacitors Antitrust Litigation, No. 3:14-cv-03264-JD, filed on December 4, 2014 with the United States District Court, Northern District of California (the “U.S. Class Action Complaint”). The complaint alleges a violation of Section 1 of the Sherman Act, for which it seeks injunctive and equitable relief and money damages. The complaint is currently nearing the end of the factual discovery phase. In addition, KEMET and KEC, along with more than 20 other capacitor manufacturers and subsidiaries, have been named as defendants in two suits by plaintiffs who have chosen not to participate in the U.S. Class Action Complaint (collectively with the U.S. Class Action Complaint, the “U.S. Complaints”): AASI Beneficiaries’ Trust v. AVX Corporation, et al., filed on August 29, 2016 in the United States District Court, Southern District of Florida, and Benchmark Electronics, Inc., et al. v. AVX Corporation, et al., filed on April 18, 2017 in the United States District Court, Southern District of Texas. KEMET and KEC, along with more than 20 other capacitor manufacturers and subsidiaries, were also named as defendants in a complaint filed on January 9, 2018, Digi-Key Corporation v. AVX Corporation et. al., in the Norther District of California. The AASI, Benchmark and Digi-Key complaints allege generally the same violations as the U.S. Class Action Complaint.
In addition, as previously reported, KEMET and KEC, along with certain other capacitor manufacturers and subsidiaries (including TOKIN), were named as defendants in several additional suits that were filed in Canada (collectively, the “Canadian Complaints”): Badashmin v. Panasonic Corporation, et al., filed August 6, 2014 in the Superior Court, Province of Quebec, District of Montreal; Herard v. Panasonic Corporation, et al., filed August 6, 2014 in the Superior Court, Province of Quebec, District of Montreal; Cygnus Electronics Corporation v. Panasonic Corporation, et al., filed August 6, 2014 in the Superior Court of Justice, Province of Ontario; LeClaire v. Panasonic Corporation, et al., filed August 6, 2014 in the Superior Court, Province of Quebec, District of Montreal; Taylor v Panasonic Corporation, et al., filed August 11, 2014 in the Superior Court of Justice, Province of Ontario; Ramsay v. Panasonic Corporation, et al., filed August 14, 2014 in the Supreme Court, Province of British Columbia; Martin v. Panasonic Corporation, et al., filed September 25, 2014 in the Superior Court, Province of Quebec, District of Montreal; Parikh v. Panasonic Corporation, et al., filed October 3, 2014 in the Superior Court of Justice, Province of Ontario; Fraser v. Panasonic Corporation, et al., filed October 3, 2014 in the Court of Queen’s Bench, Province of Saskatchewan; Pickering v. Panasonic Corporation, et al., filed October 6, 2014 in the Supreme Court, Province of British Columbia; McPherson v Panasonic Corporation et al., filed on November 6, 2014 in the Court of Queen’s Bench, Province of Manitoba; and Allott v AVX Corporation, et al., filed on May 13, 2016 in the Superior Court of Justice, Province of Ontario. The Canadian Complaints generally allege the same unlawful acts as in the U.S. Complaints, assert claims under Canada’s Competition Act as well as various civil and common law causes of action, and seek injunctive and equitable relief and money damages.
Except for the TOKIN accrual described below and certain attorneys’ fees, the Company has not recorded any accrual concerning the U.S. Complaints and the Canadian Complaints.
In July 2013, TOKIN was named as one of eight defendants in two purported U.S. class action antitrust lawsuits (In Re: Lithium Ion Batteries Antitrust Litigation, 13-MD-02420-YGR, United States District Court, Northern District of California) (the “Battery Class Action Suits”) regarding the sale of lithium ion batteries brought on behalf of direct product purchasers and indirect product purchasers. On May 16, 2018, the Court granted final approval to a settlement agreement by which, in consideration of the release of TOKIN and its subsidiaries from claims asserted in the Battery Class Action Suits, TOKIN agreed to pay $4.95 million to the settlement class of direct product purchasers. TOKIN paid the settlement amount on January 18, 2018. On March 2, 2018, TOKIN entered into a settlement agreement, which, subject to court approval, provides for the release of TOKIN and its subsidiaries from claims asserted in the Battery Class Action Suits, in consideration of which, TOKIN agreed to pay $2.0 million to the settlement class of indirect product purchasers.
Beginning in March 2014, TOKIN and certain of its subsidiaries received inquiries, requests for information and other communications from government authorities in China, the United States, the European Commission, Japan, South Korea, Taiwan, Singapore and Brazil concerning alleged anti-competitive activities within the capacitor industry.
On September 2, 2015, the United States Department of Justice announced a plea agreement with TOKIN in which TOKIN agreed to plead guilty to a one-count felony charge of unreasonable restraint of interstate and foreign trade and commerce in violation of Section 1 of the Sherman Act, and to pay a criminal fine of $13.8 million. The plea agreement was approved by the United States District Court, Northern District of California, on January 21, 2016. The fine is payable over 5
21
years in six installments of $2.3 million each, plus accrued interest. The first three payments were made in February 2016, January 2017 and January 2018. The next payment is due in January 2019.
On December 9, 2015, the Taiwan Fair Trade Commission (“TFTC”) publicly announced that TOKIN would be fined 1,218.2 million New Taiwan dollars (“NTD”) (approximately U.S. $41.8 million) for violations of the Taiwan Fair Trade Act. Subsequently, the TFTC indicated the fine would be reduced to NTD 609.1 million (approximately U.S. $20.9 million). In February 2016, TOKIN commenced an administrative suit in Taiwan, challenging the validity of the amount of the fine.
On March 29, 2016, the Japan Fair Trade Commission published an order by which TOKIN was fined ¥127.2 million (approximately U.S. $1.2 million) for violation of the Japanese Antimonopoly Act. Payment of the fine was made on October 31, 2016.
On July 15, 2016, TOKIN entered into definitive settlement agreements in two antitrust suits filed with the United States District Court, Northern District of California as In re: Capacitors Antitrust Litigation, No. 3:14-cv-03264-JD (the “Capacitor Class Action Suits”). Pursuant to the terms of the settlement, in consideration of the release of TOKIN and its subsidiaries (including TOKIN America, Inc.) from claims asserted in the Capacitor Class Action Suits, TOKIN will pay an aggregate $37.3 million to a settlement class of direct purchasers of capacitors and a settlement class of indirect purchasers of capacitors. Each of the respective class payments is payable in five installments, two of which were paid on or before the respective due dates of July 29, 2016 and 2017 and the third of which was paid on May 15, 2018. The fourth installments are due by May 15, 2019 and the final payments are due by December 31, 2019.
On July 27, 2016, Brazil’s Administrative Council for Economic Defense approved a cease and desist agreement with TOKIN in which TOKIN made a financial contribution of Brazilian Real 601 thousand (approximately U.S. $0.2 million) to Brazil’s Fund for Defense of Diffuse Rights.
On March 21, 2018, the European Commission announced a decision by which TOKIN was fined €8.8 million directly (approximately $10.9 million) and €5.0 million (approximately $6.2 million) jointly and severally with NEC Corporation, for violation of the competition laws of the European Union. The fines are payable by June 28, 2018.
The remaining governmental investigations are continuing at various stages. As of March 31, 2018, TOKIN’s accrual for antitrust and civil litigation claims totaled $76.7 million which is stated in the following line items; “Account payable” ($7.7 million), “Accrued expenses” ($33.7 million) and “Other non-current obligations” ($35.3 million) on the Consolidated Balance Sheets. This amount includes the best estimate of losses which may result from the ongoing antitrust investigations, civil litigation and claims. However, the actual outcomes could differ from what has been accrued. Additionally, under the terms of the TOKIN Purchase Agreement, KEMET will be responsible for defending all suits brought against TOKIN, paying all expenses and satisfying all judgments to the extent incurred by or rendered against TOKIN arising out of or related the capacitor antitrust investigations and related litigation described above.
ITEM 4. MINE SAFTETY DISCLOSURES.
Not applicable.
22
ITEM 4A. EXECUTIVE OFFICERS OF THE REGISTRANT
The name, age, business experience, positions and offices held and period served in such positions or offices for each of the executive officers and certain key employees of the Company are listed below. There are no family relationships among our executive officers and directors or any other arrangement or understanding pursuant to which any person was selected as an officer.
Name | Age | Position | Years with Company | |||||
Per-Olof Lööf | 67 | Chief Executive Officer and Director | 13 | |||||
William M. Lowe, Jr. | 64 | Executive Vice President and Chief Financial Officer | 10 | |||||
Charles C. Meeks, Jr. | 56 | Executive Vice President, Solid Capacitors | 34 | |||||
Shigenori (Sean) Oyama | 61 | Executive Vice President, Magnetics, Sensors, and Actuators | 36 | |||||
R. James Assaf | 58 | Senior Vice President, General Counsel and Secretary | 10 | |||||
Claudio Lollini | 38 | Senior Vice President of Global Sales and Marketing | 13 | |||||
Stefano Vetralla | 55 | Senior Vice President and Chief Human Resources Officer | 10 | |||||
Susan B. Barkal | 55 | Senior Vice President Quality, Chief Compliance Officer and Chief of Staff | 18 | |||||
Dr. Phillip M. Lessner | 59 | Senior Vice President and Chief Technology Officer | 22 | |||||
Andreas Meier | 50 | Senior Vice President, Film and Electrolytic | 20 | |||||
Michael L. Raynor | 52 | Vice President and Corporate Controller | 11 | |||||
Richard J. Vatinelle | 54 | Vice President and Treasurer | 5 | |||||
Robert S. Willoughby | 57 | Senior Vice President, Ceramic Product Line | 32 | |||||
Executive Officers
Per-Olof Lööf, Chief Executive Officer and Director, was named such in April 2005. Mr. Lööf was previously the Managing Partner of QuanStar Group, LLC, a management consulting firm and had served in such capacity since December 2003. Prior thereto, he served as Chief Executive Officer of Sensormatic Electronics Corporation and in various management roles with Andersen Consulting, Digital Equipment Corporation, AT&T and NCR. Mr. Lööf also serves on several charity boards including the Boca Raton Regional Hospital and the International Centre for Missing and Exploited Children. He received a “civilekonom examen” degree in economics and business administration from the Stockholm School of Economics.
William M. Lowe, Jr., Executive Vice President and Chief Financial Officer, was named such in July 2008. Mr. Lowe was previously the Vice President, Chief Operating Officer and Chief Financial Officer of Unifi, Inc., a producer and processor of textured synthetic yarns from January 2004 to October 2007. Prior to holding that position, he was Executive Vice President and Chief Financial Officer for Metaldyne, an automotive components manufacturer. He also held various financial management positions with ArvinMeritor, Inc., a premier global supplier of integrated automotive components. He received his B.S. degree in business administration with a major in accounting from Tri-State University and is a Certified Public Accountant in the state of Ohio.
Charles C. Meeks, Jr., Executive Vice President, Solid Capacitors, was named such in May 2013. He joined KEMET in December 1983 in the position of Process Engineer, and has held various positions of increased responsibility including the positions of Plant Manager and Director of Operations, Ceramic Product Line. He was named Vice President, Ceramic Product Line in June 2005, Senior Vice President, Ceramic Product Line in October 2007, Senior Vice President, Ceramic and Film and Electrolytics in March 2010 and Executive Vice President Ceramic and Film and Electrolytics in May 2011 prior to his appointment to his current position. In addition, since January 2000, Mr. Meeks has served as President of Top Notch Inc., a private company that offers stress management therapy services. Mr. Meeks received a Masters of Business Administration degree and a Bachelor of Science degree in Ceramic Engineering from Clemson University.
Shigenori (Sean) Oyama, Executive Vice President, Magnetics, Sensors, and Actuators, was named such in July 2017 after the Company's acquisition of TOKIN. Mr. Oyama joined TOKIN in 1982. He moved to California in 1989 and held various management roles in Field Application Engineering, Sales and Marketing at TOKIN America Inc. Mr. Oyama returned to TOKIN Japan and was appointed General Manager of Product Marketing for Energy Devices in 2003, General Manager and Vice President for the EMC Division in 2005, Senior Vice President of all Business Groups in 2010, followed by his appointment to President of TOKIN in 2012. Mr. Oyama holds a Bachelor's degree in Electrical Engineering from Tohoku University.
23
R. James Assaf, Senior Vice President, General Counsel and Secretary, was named such in February 2014. Mr. Assaf joined KEMET as Vice President, General Counsel in March 2008, and was appointed Vice President, General Counsel and Secretary in July 2008 prior to his appointment to his current position. Before joining KEMET, Mr. Assaf served as General Manager for InkSure Inc., a start-up seller of product authentication solutions. He had also previously held several positions with Sensormatic Electronics Corporation, including Associate General Counsel and Director of Business Development, Mergers and Acquisitions. Prior to Sensormatic, Mr. Assaf served as an Associate Attorney with the international law firm Squire Sanders and Dempsey. Mr. Assaf received his Bachelor of Arts degree from Kenyon College and his Juris Doctor degree from Case Western Reserve University School of Law.
Claudio Lollini, Senior Vice President of Global Sales and Marketing, was named such in July 2015. He joined KEMET in October 2007 through the Company’s acquisition of Arcotronics Italia S.p.A., where he served as Manager, Sales - Greater China. Mr. Lollini was appointed Director of Product Management for Film and Electrolytic in January 2009, Director of Sales Taiwan in June 2012, and Vice President, Sales - Asia Pacific in May 2013 prior to his appointment to his current position. Mr. Lollini holds a Bachelor of Science degree in Engineering Management from the University of Bologna and a Master of Business Administration from the Kellogg School of Management, and is a 2011 graduate of the KEMET Leadership Forum.
Stefano Vetralla, Senior Vice President and Chief Human Resources Officer, was named such in July 2015. He joined KEMET in May 2008 as Director - HR, Film and Electrolytic Business Group. Mr. Vetralla was appointed Director - HR, Global Sales and Film and Electrolytic Business Group in January 2011; Senior Director HR, Global Sales and Film and Electrolytic Business Group in January 2012; Senior Director - HR, Field in September 2012; Vice President - Global HR Operations in September 2013; and Vice President - Global HR and Chief Human Resources Officer in May 2014 prior to his current appointment. Prior to KEMET, he held Human Resources positions of increasing responsibility in international corporations including Hewlett-Packard Company, 3Com Corporation and Telindus /Belgacom. Mr. Vetralla holds a Law Degree from the State University of Milan and is a 2011 graduate of the KEMET Leadership Forum.
Other Key Employees
Susan B. Barkal, Senior Vice President Quality, Chief Compliance Officer and Chief of Staff, was named such in February 2014. Ms. Barkal joined KEMET in November 1999, and has served as Quality Manager for the Tantalum Business Group (now a part of Solid Capacitors), Technical Product Manager for all Tantalum product lines and Director of Tantalum Product Management. Ms. Barkal was appointed Vice President of Quality and Chief Compliance Officer in December 2008 prior to her appointment to her current position. Ms. Barkal holds a Bachelor of Science degree in Chemical Engineering from Clarkson University, a Master of Science degree in Mechanical Engineering from California Polytechnic University and is a 2007 graduate of the KEMET Leadership Forum.
Dr. Philip M. Lessner, Senior Vice President and Chief Technology Officer, was named such in February 2014. He joined KEMET in March 1996 as a Technical Associate in the Tantalum Technology Group. He has held several positions of increasing responsibility in the Technology and Product Management areas including Senior Technical Associate, Director Tantalum Technology, Director Technical Marketing Services and Vice President Tantalum Technology. Dr. Lessner was named Vice President, Chief Technology Officer and Chief Scientist in December 2006, Senior Vice President, Chief Technology Officer and Chief Scientist in May 2011 and Senior Vice President and Chief Technology and Marketing Officer in November 2012 prior to his appointment to his current position. Dr. Lessner received a PhD in Chemical Engineering from the University of California, Berkeley and a Bachelor of Engineering in Chemical Engineering from Cooper Union.
Andreas Meier, Senior Vice President-Film and Electrolytic, was named such in May 2016. Mr. Meier joined KEMET in January 1998 and has held several positions of increasing responsibility in the Sales and Product Management areas. Mr. Meier was named Vice President - Product Management, Film and Electrolytics in January, 2010 and Vice President, Sales - EMEA in December, 2012 prior to his appointment to his current position. Mr. Meier holds a degree in Electronic Engineering from the University of Paderborn in Germany.
Michael L. Raynor, Vice President and Corporate Controller, was named such in November 2012. Mr. Raynor joined the Company in July 2007 as the Assistant Corporate Controller; in November of 2008 Mr. Raynor was named Director of Financial Planning and Analysis prior to his appointment to his current position. Prior to joining KEMET, Mr. Raynor held various controller level positions with distribution and manufacturing companies. Mr. Raynor received a Bachelor of Arts degree in Economics and a Masters of Accounting from the University of North Carolina at Chapel Hill, is a Certified Public Accountant in the state of North Carolina and is a 2015 graduate of the KEMET Leadership Forum.
Richard J. Vatinelle, Vice President and Treasurer, was named such in March 2014. Mr. Vatinelle joined the Company in November 2012 as Controller - Tantalum Business Group. Prior to joining KEMET, Mr. Vatinelle served for two years as Regional Controller - Latin America for Leo Pharma A/S, a global manufacturer of pharmaceutical products. From 2007 to
24
2009 he served as Director of Finance, Policies and Reporting, for Stiefel Laboratories, a pharmaceutical company specialized in dermatology. Mr. Vatinelle’s career in finance includes eight years with Conagra Foods Inc., where he held various international finance roles, and eleven years with Banque Sudameris, an international banking group where he began his career. Mr. Vatinelle holds a Bachelor of Science degree in Finance and International Management from Georgetown University and is a 2015 graduate of the KEMET Leadership Forum.
Robert S. Willoughby, Senior Vice President-Ceramic Product Line, was named such in May 2016. He joined KEMET in December 1985 and has held positions of increasing responsibility within Diagnostic, Quality, New Product and Process Engineering. Mr. Willoughby served as Director - Ceramic Operations from July 2007 until March 2010; served as Vice President of Operations - Film and Electrolytic Business Unit from March 2010 until May 2013; served as Vice President, Film and Electrolytic Business Group from May 2013 through December 2014; and served as Senior Vice President-Film and Electrolytic Business Group from January 2015 through April 2016. Mr. Willoughby was named Senior Vice President-Global Supply Chain in May 2016, prior to his appointment to his current position. He holds a Bachelor of Science degree in Industrial Engineering from Clemson University and is a 2007 graduate of the KEMET Leadership Forum.
25
PART II
ITEM 5. MARKET FOR REGISTRANT’S COMMON EQUITY, RELATED STOCKHOLDER MATTERS AND ISSUER PURCHASES OF EQUITY SECURITIES.
Market for Common Stock of the Company
Our common stock trades on the NYSE under the ticker symbol “KEM” (NYSE: KEM). We had 100 stockholders of record as of May 18, 2018. The following table represents the high and low sale prices of our common stock for the periods indicated:
Fiscal Year 2018 | Fiscal Year 2017 | |||||||||||||||
Quarter | High | Low | High | Low | ||||||||||||
First | $ | 14.92 | $ | 10.70 | $ | 2.98 | $ | 1.76 | ||||||||
Second | 24.64 | 12.65 | 3.62 | 2.66 | ||||||||||||
Third | 27.35 | 13.73 | 6.99 | 3.45 | ||||||||||||
Fourth | 21.28 | 15.07 | 12.65 | 5.78 | ||||||||||||
Dividend Policy
We have not declared or paid any cash dividends on our common stock since our initial public offering in October 1992. Any future determination to pay dividends will be at the discretion of our Board and will depend upon, among other factors, the capital requirements, operating results, and our financial condition. In addition, under the terms of the Term Loan Credit Agreement (as hereinafter defined) entered into during fiscal year 2018, we are restricted from paying cash dividends in an amount greater than $4.0 million in the aggregate per year. See “Management’s Discussion and Analysis of Financial Condition and Results of Operations—Liquidity and Capital Resources.”
26
PERFORMANCE GRAPH
The following graph compares our cumulative total stockholder return for the past five fiscal years, beginning on March 31, 2013, with the Russell 3000 and a peer group (the “Peer Group”) comprised of certain companies which manufacture capacitors and with which we generally compete. The Peer Group is comprised of AVX Corporation, Littelfuse, Inc. and Vishay Intertechnology, Inc.
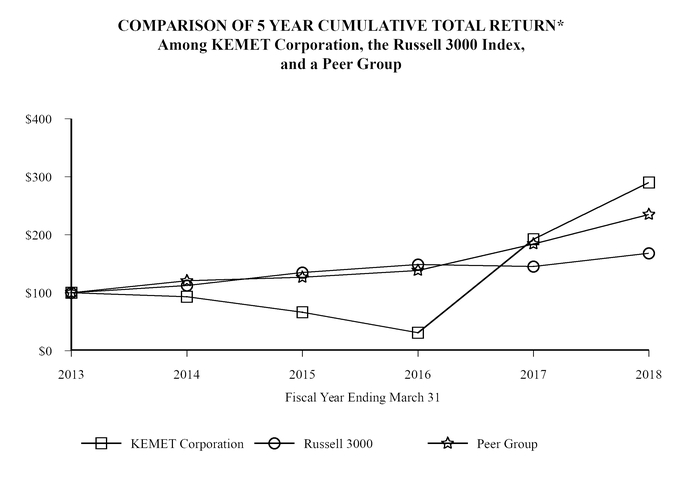
*$100 invested on 3/31/13 in stock or index, including reinvestment of dividends
RETURNS
Years Ending March 31,
2013 | 2014 | 2015 | 2016 | 2017 | 2018 | |||||||||||||||||||
KEMET Corporation | $ | 100.00 | $ | 92.96 | $ | 66.24 | $ | 30.88 | $ | 192.00 | $ | 290.08 | ||||||||||||
Russell 3000 | 100.00 | 112.16 | 134.87 | 148.70 | 145.21 | 168.03 | ||||||||||||||||||
Peer Group | 100.00 | 120.42 | 126.46 | 138.42 | 184.01 | 234.84 | ||||||||||||||||||
Unregistered Sales of Equity Securities
We did not sell any of our equity securities during fiscal year 2018 that were not registered under the Securities Act of 1933, as amended (the “Securities Act”).
27
Repurchase of Equity Securities
The following table provides information relating to our purchase of shares of our common stock during the quarter ended March 31, 2018 (amounts in thousands, except per share price):
Periods | (a) Total Number of Shares Purchased (1) | (b) Average Price Paid per Share | (c) Total Number of Shares Purchased as Part of Publicly Announced Plans or Programs (2) | (d) Maximum Number of Shares that may yet be Purchased Under the Plan or Programs (2) | |||||
January 1 to January 31, 2018 | 4 | $ | 19.73 | — | — | ||||
February 1 to February 28, 2018 | — | — | — | — | |||||
March 1 to March 31, 2018 | 10 | 18.13 | — | — | |||||
Total for Quarter Ended March 31, 2018 | 14 | $ | 18.62 | ||||||
_______________________________________________________________________________
(1) Represents shares withheld by the Company upon vesting of restricted stock to pay taxes due. The Company does not currently have a publicly announced share repurchase plan or program.
(2) The Company does not currently have a publicly announced share repurchase plan or program.
Equity Compensation Plan Disclosure
The following table summarizes equity compensation plans approved by stockholders and equity compensation plans that were not approved by stockholders as of March 31, 2018:
(a) | (b) | (c) | ||||||||
Plan category | Number of securities to be issued upon exercise of outstanding options, warrants, and rights | Weighted-average exercise price of outstanding options, warrants, and rights | Number of securities remaining available for future issuance under equity compensation plans (excluding securities reflected in column (a)) | |||||||
Equity compensation plans approved by stockholders | 2,965,739 (1) | $ | 6.36 | 4,452,819 | ||||||
Equity compensation plans not approved by stockholders | — | — | — | |||||||
Total | 2,965,739 | $ | 6.36 | 4,452,819 | ||||||
_______________________________________________________________________________
(1) Includes 811,260 shares subject to outstanding LTIP Awards (time-based), 172,989 shares subject to outstanding LTIP Awards (performance-based) and 1,751,073 outstanding non-vested restricted shares of Common Stock; the weighted-average exercise price does not take into account these shares as they have no exercise price.
28
ITEM 6. SELECTED FINANCIAL DATA.
The following table summarizes our selected historical consolidated financial information for each of the last five years. The selected financial information under the captions “Income Statement Data,” “Per Share Data,” “Balance Sheet Data,” and “Other Data” shown below has been derived from our audited consolidated financial statements. This table should be read in conjunction with other consolidated financial information of KEMET, including “Management’s Discussion and Analysis of Financial Condition and Results of Operations” and the consolidated financial statements, included elsewhere herein. The data set forth below may not be indicative of our future financial condition or results of operations (see Item 1A, “Risk Factors”) (amounts in thousands except per share amounts):
Fiscal Years Ended March 31, | ||||||||||||||||||||
2018 | 2017 | 2016 | 2015 | 2014 | ||||||||||||||||
Income Statement Data: | ||||||||||||||||||||
Net sales | $ | 1,199,926 | $ | 757,791 | $ | 734,823 | $ | 823,192 | $ | 833,666 | ||||||||||
Operating income (loss) (1) | 113,303 | 35,796 | 33,833 | 23,832 | (16,878 | ) | ||||||||||||||
Interest income | (809 | ) | (24 | ) | (14 | ) | (15 | ) | (195 | ) | ||||||||||
Interest expense | 32,882 | 39,755 | 39,605 | 40,701 | 40,962 | |||||||||||||||
Income (loss) from continuing operations | 254,529 | 47,989 | (53,629 | ) | (19,522 | ) | (64,869 | ) | ||||||||||||
Income (loss) from discontinued operations, net of income tax expense (benefit) | — | — | — | 5,379 | (3,634 | ) | ||||||||||||||
Net income (loss) | 254,529 | 47,989 | (53,629 | ) | (14,143 | ) | (68,503 | ) | ||||||||||||
Per Share Data: | ||||||||||||||||||||
Net income (loss) per basic share: | ||||||||||||||||||||
Income (loss) from continuing operations | $ | 4.82 | $ | 1.03 | $ | (1.17 | ) | $ | (0.43 | ) | $ | (1.44 | ) | |||||||
Income (loss) from discontinued operations, net of income tax expense (benefit) | $ | — | $ | — | $ | — | $ | 0.12 | $ | (0.08 | ) | |||||||||
Net income (loss) | $ | 4.82 | $ | 1.03 | $ | (1.17 | ) | $ | (0.31 | ) | $ | (1.52 | ) | |||||||
Net income (loss) per diluted share: | ||||||||||||||||||||
Income (loss) from continuing operations | $ | 4.34 | $ | 0.87 | $ | (1.17 | ) | $ | (0.43 | ) | $ | (1.44 | ) | |||||||
Income (loss) from discontinued operations, net of income tax expense (benefit) | $ | — | $ | — | $ | — | $ | 0.12 | $ | (0.08 | ) | |||||||||
Net income (loss) | $ | 4.34 | $ | 0.87 | $ | (1.17 | ) | $ | (0.31 | ) | $ | (1.52 | ) | |||||||
Balance Sheet Data: | ||||||||||||||||||||
Total assets (2) | $ | 1,218,269 | $ | 734,325 | $ | 699,780 | $ | 742,604 | $ | 836,193 | ||||||||||
Working capital | 391,552 | 248,896 | 228,793 | 228,478 | 227,070 | |||||||||||||||
Long-term debt, less current portion (2) (3) | 304,083 | 386,211 | 385,833 | 386,320 | 385,877 | |||||||||||||||
Other non-current obligations | 151,736 | 60,131 | 74,892 | 57,131 | 55,864 | |||||||||||||||
Stockholders’ equity | 462,963 | 154,472 | 112,481 | 164,682 | 221,884 | |||||||||||||||
Other Data: | ||||||||||||||||||||
Cash flow provided by (used in) operating activities | $ | 120,860 | $ | 71,667 | $ | 32,365 | $ | 24,402 | $ | (6,746 | ) | |||||||||
Capital expenditures | 65,004 | 25,617 | 20,469 | 22,232 | 32,147 | |||||||||||||||
Research and development (1) | 39,619 | 27,398 | 24,613 | 25,513 | 24,188 | |||||||||||||||
_______________________________________________________________________________
(1) Fiscal years 2014 through 2017 adjusted due to the adoption of ASU No. 2017-07, Improving the Presentation of Net Periodic Pension Cost and Net Periodic Postretirement Benefit Cost ("ASU No. 2017-07").
(2) Fiscal years 2014 through 2016 have been restated due to the retroactive adoption of ASU. No 2015-03, Interest - Imputation of Interest (Subtopic 835-30); Simplifying the Presentation of Debt Issuance Costs.
(3) In fiscal year 2018, the 10.5% Senior Notes were repurchased and retired in full and the Company entered into a Term Loan Credit Agreement for $345.0 million.
29
ITEM 7. MANAGEMENT’S DISCUSSION AND ANALYSIS OF FINANCIAL CONDITION AND RESULTS OF OPERATIONS.
The following discussion and analysis provides information that we believe is useful in understanding our operating results, cash flows, and financial condition for the three fiscal years ended March 31, 2018, 2017, and 2016. The discussion should be read in conjunction with, and is qualified in its entirety by reference to, the consolidated financial statements and related notes appearing elsewhere in this report. The discussions in this document contain forward-looking statements within the meaning of the Private Securities Litigation Reform Act of 1995 and involve risks and uncertainties. Our actual future results could differ materially from those discussed here. Factors that could cause or contribute to such differences include, but are not limited to, those discussed under the Item 1A, “Risk Factors” and, from time to time, in our other filings with the Securities and Exchange Commission.
Our Competitive Strengths
We believe that our Company benefits from the following competitive strengths:
Strong Customer Relationships
We have a large and diverse customer base. We believe that our emphasis on quality control and our performance history establishes loyalty with OEMs, EMSs and distributors. Our customer base includes most of the world’s major electronics OEMs (including Alcatel-Lucent USA, Inc., Bosch Group, Cisco Systems, Inc., Continental AG, Dell Inc., HP Inc., International Business Machines Corporation, Motorola Solutions, L.M. Ericsson, Delphi Technologies PLC, Siemens AG and TRW Automotive), EMSs (including Celestica Inc., Flextronics International LTD, Jabil Circuit, Inc. and Sanmina-SCI Corporation) and distributors (including TTI, Inc., Arrow Electronics, Inc. and Avnet, Inc.). Our strong, extensive and efficient worldwide distribution network is one of our differentiating factors. We believe our ability to provide innovative and flexible service offerings, superior customer support and focus on speed-to-market results in a more rewarding customer experience, earning us a high degree of customer loyalty.
Breadth of Our Diversified Product Offering and Markets
We believe that we have the most complete line of primary capacitor types spanning a full spectrum of dielectric materials including tantalum, multilayer ceramic, solid and electrolytic aluminum and film capacitors. As discussed below, our acquisition of (and previous private label partnership with) TOKIN, has expanded our product offerings and markets. As a result, we believe we can satisfy virtually all of our customers’ capacitance needs, thereby strengthening our position as their supplier of choice. In addition, through our acquisition of TOKIN, we have products to assist in the management of electronic noise within a device and in communications between devices, as well as products that can sense and respond to human activity, physical vibration, and electric current. We sell our products into a wide range of end-markets, including computing, industrial, telecommunications, transportation, consumer, defense and healthcare across all geographical regions. No single end market industry accounted for more than 30% of net sales; although, one customer, an electronics distributor, accounted for more than 10% of our net sales in fiscal year 2018. No single end-use direct customer accounted for more than 5% of our net sales in fiscal year 2018. We believe that well-balanced product, geographic and customer diversification helps us mitigate some of the negative financial impact through economic cycles.
Leading Market Positions and Operating Scale
Based on net sales, we believe that we are the largest manufacturer of tantalum capacitors in the world and one of the largest manufacturers of direct current film capacitors in the world and have a substantial market position in the specialty ceramic and custom wet aluminum electrolytic markets. As discussed below, our acquisition of (and previous private label partnership with) TOKIN allows us to achieve true scale in operations to manage raw materials sourcing as well as maximize efficiencies. We believe that our leading market positions and operating scale allow us to realize production efficiencies, leverage economies of scale and capitalize on growth opportunities in the global capacitor market.
Strong Presence in Specialty Products
We engage in design collaboration with our customers in order to meet their specific needs and provide them with customized products satisfying their engineering specifications. Whether at the concept or design stage, KEMET provides engineering tools and samples to our customers to enable them to make the best product selections. KEMET’s Field Application Engineers (experts in electrical circuits) and Technical Product Managers (experts in product applications) assist our Sales team as they navigate the product selection process with our customers. During fiscal years 2018 and 2017, respectively, specialty products accounted for 41.8% and 40.7% of our revenue. By allocating an increasing portion of our management resources and research and development (“R&D”) investment particularly through our acquisition of (and previous partnership with) TOKIN to specialty products, we have established ourselves as one of the leading innovators in this
30
fast growing, emerging segment of the market, including healthcare, renewable energy, telecommunication infrastructure and oil and gas.
Low-Cost and Strategic Locations
We believe our manufacturing plants located in China, Thailand, Vietnam, Mexico, Bulgaria, and Macedonia provide some of the lowest cost production facilities in the industry. Many of our key customers relocated or added production facilities to Asia, particularly China. We believe our manufacturing production footprint is essential to best meet our customers demands, production needs, and total value proposition.
Our Brand
Founded by Union Carbide in 1919 as KEMET Laboratories, we believe that we have established a reputation as a high quality, efficient and affordable partner that sets our customers’ needs as the top priority. This has allowed us to successfully attract loyal clientele and enabled us to expand our operations and market share over the past few years. We believe our commitment to addressing the needs of the industry in which we operate has differentiated us from our competitors. In addition to our traditional reputation of being the “Easy-To-Buy-From” company by providing excellent customer service and on-time delivery, we have now evolved to being the “Easy-To-Design-In” company with the addition of technical resources like KEMET’s online Engineering Center and capacitor selection simulation tools.
Our People
We believe that we have successfully developed a unique corporate culture based on innovation, customer focus and commitment. We have a strong, highly experienced and committed team in each of our markets. Many of our professionals have developed unparalleled experience in building leadership positions in new markets, as well as successfully integrating acquisitions. Our 22 member senior management team has an average of 17 years of experience with us and an average of 26 years of experience in the manufacturing industry.
Business Strategy
Our strategy is to use our position as a leading, high-quality manufacturer of electronic components and materials to capitalize on the increasingly demanding requirements of our customers. Key elements of our strategy include:
One KEMET Campaign.
We continue to focus on improving our commercial and technological capabilities through various initiatives that all fall under our One KEMET campaign. The One KEMET campaign aims to ensure that we, as a company, are focused on the same goals and working with the same processes and systems to ensure consistent quality and service that allow us to provide our customers with the technologies they require at a competitive “total cost of ownership.” This effort was launched to ensure that, as we continue to grow, we not only remain grounded in our core principles but that we also use those principles, operating procedures and systems as the foundation from which to expand. These initiatives include our Lean and Six Sigma culture evolution, our global customer accounts management program and our evolution toward a philosophy of being “easy to design-in.”
Develop Our Significant Customer Relationships and Industry Presence.
We continue to focus on our responsiveness to our customers’ needs and requirements by making order entry and fulfillment easier, faster, more flexible and more reliable for our customers. This will be accomplished by focusing on building products around customers’ needs and by giving decision-making authority to customer-facing personnel and by providing purpose-built systems and processes.
Leverage Our Technological Competence and Expand Our Leadership in Specialty Products
We continue to leverage our technological competence and our acquisition of (and previous partnership with) TOKIN, by introducing new products in a timely and cost-efficient manner. This allows us to generate an increasing portion of our sales from new and customized solutions that meet our customers’ varied and evolving capacitor needs as well as to improve our financial performance. We believe that by continuing to build on our strength in the higher growth and higher margin specialty segments of the capacitor market, we will be well-positioned to achieve our long-term growth objectives while also improving our profitability. During fiscal year 2018, excluding TOKIN, we introduced 42,719 new products of which 1,078 were first to market, and specialty products accounted for 41.8% of our revenue over this period.
31
Further Expand Our Broad Capacitance Capabilities
We identify ourselves as the "Electronic Components" company and strive to be the supplier of choice for all our customers' capacitance needs across the full spectrum of dielectric materials including tantalum, multilayer ceramic, solid and electrolytic aluminum, film and paper. While we believe we have the most complete line of capacitor technologies across these primary capacitor types, we intend to continue to research and pursue additional capacitance technologies and solutions in order to maximize the breadth of our product offerings. As discussed below, through our acquisition of (and previous partnership with) TOKIN we have further expanded our product offerings to electric double layer capacitors, electro-magnetic devices, sensors, and actuators.
Selectively Target Complementary Acquisitions and Equity Investments
As strategic opportunities are identified, we will evaluate and possibly pursue them if they would enable us to enhance our competitive position and expand our market presence. Our strategy is to acquire complementary capacitor and other related businesses allowing us to leverage our business model, potentially including those involved in other passive components that are synergistic with our customers’ technologies and our current product offerings. For example, in fiscal year 2012, we acquired KBP, which has allowed us to vertically integrate certain manufacturing processes within Solid Capacitors. Further, as described below, we recently acquired TOKIN, a manufacturer of tantalum capacitors and electro-magnetic devices.
In fiscal year 2018, we entered into a Joint Venture Agreement for the formation of KEMET Jianghai Electronic Components Co. Ltd., a limited liability company located in Nantong, China with Jianghai (Nantong) Film Capacitor Co., Ltd, a subsidiary of Nantong Jianghai Capacitor Co. Ltd ("Jianghai"). KEMET Jianghai Electronic Components will manufacture axial electrolytic capacitors and (H)EV Film DC brick capacitors, for distribution through the KEMET and Jianghai sales channels.
Also during fiscal year 2018, the Company invested in Novasentis' Series-D round of funding. Novasentis makes the world's thinnest, electro mechanical polymer based actuators that provide rich haptic feedback for a variety of applications, including augmented/virtual reality and wearables. Novasentis will supply its "smart" film and KEMET will apply its expertise in manufacturing film capacitors to the development and commercial production of the actuators.
Promote the KEMET Brand Globally
We are focused on promoting the KEMET brand globally by highlighting the high-quality and high reliability of our products and our superior customer service. We will continue to market our products to new and existing customers around the world in order to expand our business. We continue to be recognized by our customers as a leading global supplier. For example, in calendar years 2016 and 2017, we received the “Global Operations Excellence Award” from TTI, Inc.
Global Sales & Marketing Strategy
Our motto “Think Global, Act Local” describes our approach to sales and marketing. Each of our four sales regions (Americas, EMEA, JPKO and APAC) have account managers, field application engineers and strategic marketing managers. In addition, we also have local customer and quality-control support in each region. This organizational structure allows us to respond to the needs of our customers on a timely basis and in their native language. The regions are managed locally and report to a senior manager who is on the KEMET Leadership Team. Furthermore, this organizational structure ensures the efficient communication of our global goals and strategies and allows us to serve the language, cultural and other region-specific needs of our customers.
TOKIN
Through our acquisition of TOKIN and previous cross licensing agreement and Amended and Restated Private Label Agreement with TOKIN, we have expanded product offerings and markets for both KEMET and TOKIN. KEMET’s strong presence in the western hemisphere and TOKIN's excellent position in Japan and Asia significantly enhanced our customer reach. Through TOKIN we believe we can achieve true scale in operations allowing us to manage raw materials sourcing as well as maximize efficiencies and best practices in manufacturing and product development. We believe that the international management team of KEMET and TOKIN has allowed us to be more sensitive and aware of region-specific business needs compared to our competitors. Combining our R&D capabilities and university relationships allows us to be on the forefront of new developments and technological advancements in the capacitor industry. Leveraging R&D investment in both Japan and the U.S. enables KEMET to diversify beyond capacitors in the passives market as a result of the TOKIN acquisition (and previous partnership).
32
Recent Developments and Trends
TOKIN
Between February 1, 2013 and April 19, 2017, KEMET, through its wholly-owned subsidiary, KEMET Electronics Corporation (“KEC”), held a 34% economic interest in TOKIN Corporation (“TOKIN”) pursuant to a Stock Purchase Agreement (the “Stock Purchase Agreement”) by and among KEC, TOKIN and NEC Corporation (“NEC”), as calculated based on the number of common shares held by KEC, directly and indirectly, in proportion to the aggregate number of common and preferred shares of TOKIN outstanding as of such date. TOKIN was established in Japan in 1938 and is engaged in production and distribution of tantalum capacitors, transmitting communication devices, magnetic devices, piezoelectric devices and sensors. TOKIN has six manufacturing locations throughout Asia and was previously operating as a joint venture with NEC.
On April 14, 2017, TOKIN closed on the sale of its electro-mechanical devices ("EMD") business to NTJ Holdings 1 Ltd. (“NTJ”), a special purpose entity that is owned by funds managed or operated by Japan Industrial Partners, Inc. ("JIP"), pursuant to a master sale and purchase agreement (the “EMD Master Sale and Purchase Agreement”) previously entered into between TOKIN, NTJ, and JIP ("Sale of EMD"). The initial selling price for EMD was JPY 48.2 billion, or approximately $431.0 million (using the March 31, 2017 exchange rate of 111.823 Japanese Yen to 1.00 U.S. Dollar) and was subject to certain working capital adjustments. In the third quarter of fiscal year 2018, the selling price was adjusted by JPY 1.1 billion or approximately $10.1 million (using the December 31, 2017 exchange rate of 112.574 Japanese Yen to 1.00 U.S. Dollar) related to working capital and other adjustments in accordance with the EMD Master Sale and Purchase Agreement. At the closing of the Sale of EMD, TOKIN used a portion of the sale proceeds to repay debt related to a shareholder loan from NEC. The TOKIN historical balance sheet was adjusted to reflect the removal of net assets sold and other items directly impacted by the Sale of EMD. Additionally, due to KEMET's 34% equity interest in TOKIN held as of the closing, adjustments have been made to reflect KEMET's accounting for the Sale of EMD in accordance with the equity method of accounting.
On April 19, 2017, pursuant to the TOKIN Purchase Agreement dated February 23, 2017 between KEC and NEC, KEC completed its acquisition, subject to the final purchase price adjustment, of the remaining 66% economic interest in TOKIN, and as a result TOKIN is now a 100% owned indirect subsidiary of KEMET. Under the terms of the TOKIN Purchase Agreement, KEC paid NEC JPY 16.2 billion, or approximately $148.6 million (using the April 19, 2017 exchange rate of 109.007 Japanese Yen to 1.00 U.S. Dollar), for all of the outstanding shares of TOKIN it did not already own. The preliminary purchase price was comprised of JPY 6.0 billion, or approximately $55.0 million (using the April 19, 2017 exchange rate of 109.007 Japanese Yen to 1.00 U.S. Dollar) plus JPY 10.2 billion, or approximately $93.6 million, which represented one-half of the estimated excess net cash proceeds (“Excess Cash”) from the Sale of EMD. The acquisition price was subject to working capital adjustments pursuant to the EMD Master Sale and Purchase Agreement. As a result of these working capital adjustments, the acquisition price was increased by JPY 0.3 billion, or approximately $3.0 million (using the September 30, 2017 exchange rate of 112.502 Japanese Yen to 1.00 U.S. Dollar) in the second quarter of fiscal year 2018. No additional working capital adjustments were recorded in the remainder of fiscal year 2018.
As part of the TOKIN Acquisition, KEMET recorded acquisition gains totaling $130.9 million consisting of the following: a gain of $68.7 million to mark its 34% interest in TOKIN to fair value and a $62.2 million gain on the acquisition of TOKIN for the year ended March 31, 2018.
We believe the acquisition of TOKIN has expanded KEMET’s geographic presence, combining KEMET’s presence in the western hemisphere and TOKIN’s excellent position in Asia to enhance customer reach and create an entrance into Japan for KEMET. We believe TOKIN’s product portfolio is a strong complement to KEMET’s existing product portfolio. We believe the combination creates a leader in the combined polymer and tantalum capacitors market. The acquisition also enhances KEMET’s product diversification with entry into EMC devices, as well as sensors and actuators. With the increased scale, the Company anticipates optimizing costs through competitive raw materials sourcing and maximizing operating efficiencies. The acquisition was accretive to earnings with improvement in Net income, Adjusted EBITDA, and cash flow.
33
The following table shows the components of the acquisition price (amounts in thousands):
Upfront cash consideration (1) | $ | 148,614 | |
Excess cash payment (2) | 3,144 | ||
Indemnity asset (3) | 8,500 | ||
Less: Put option (4) | (9,900 | ) | |
Net consideration transferred | $ | 150,358 | |
(1) The upfront cash payment is comprised of JPY 6.0 billion plus one half of Excess Cash in an amount of approximately JPY 10.2 billion, approximately $55.0 million and $93.6 million (using the April 19, 2017 exchange rate of 109.007 Japanese Yen to 1.00 U.S. Dollar), respectively.
(2) Current estimate of the additional amount due to NEC Corporation upon the settlement of the adjusted purchase price for the EMD sale.
(3) Pursuant to the Stock Purchase Agreement between KEMET and NEC, NEC was required to indemnify TOKIN and/or KEC for any breaches by TOKIN or NEC of certain representations, warranties and covenants in the Stock Purchase Agreement. NEC’s aggregate liability for indemnification claims was limited to $25.0 million. Prior to the acquisition, KEMET's equity method investment balance included an $8.5 million indemnification asset pursuant to this indemnification arrangement. In connection with the TOKIN Acquisition, NEC was released from its indemnification obligations to KEMET without an exchange of consideration; as such, this amount of released obligation is included as purchase consideration by KEMET.
(4) Pursuant to the option agreement, dated as of March 12, 2012, by and among NEC and KEMET (the “Option Agreement”), from April 1, 2015 through May 31, 2018, NEC had the right to require KEC to purchase all outstanding capital stock of TOKIN (the “Put Option”). The fair value of the Put Option of $9.9 million was reflected as a liability on KEMET’s balance sheet prior to KEMET’s acquisition of the remaining 66% economic interest in TOKIN. The Put Option was canceled, pursuant to the terms of the TOKIN Purchase Agreement with no exchange of consideration between NEC and KEMET. Accordingly, the fair value of the Put Option reduces the amount of consideration paid to acquire NEC’s equity in TOKIN.
The following table reflects the bargain purchase gain resulting from the TOKIN Acquisition (amounts in thousands):
Net consideration transferred | $ | 150,358 | |
Fair value of KEMET’s previously held equity interest in TOKIN (1) | 204,112 | ||
Less: fair value of net assets acquired | (416,629 | ) | |
Bargain purchase gain | $ | (62,159 | ) |
_______________________________________________________________________________
(1) Value based in the 34% of the enterprise value determined under the discounted cash flow method.
In performing acquisition accounting procedures, we engaged an internationally recognized independent valuation firm to assist in the valuation of identifiable net assets acquired. We also performed an extensive review for any unrecorded assets, liabilities, and contingencies. After identifying and valuing acquired assets and liabilities, we concluded recording a bargain purchase gain was appropriate and required under ASC 805-30-25-2. We believe the bargain purchase gain resulted from (1) NEC seeking repayment of its receivables due from TOKIN pursuant to TOKIN’s January 25, 2013 Loan Agreement with NEC of JPY 25.4 billion, or approximately $233.2 million (using the April 19, 2017 exchange rate of 109.007 Japanese Yen to 1.00 U.S. Dollar), which the sale transaction achieved, and for which TOKIN did not have the resources to pay prior to the transaction; and, (2) a predetermined purchase price which, other than certain customary working capital adjustments, was not subject to amendment irrespective of the amount of proceeds resulting from the sale of TOKIN’s EMD business, which was a precondition to our acquisition of TOKIN. The bargain purchase gain is recognized in the line item “Acquisition (gain) loss” in the Consolidated Statements of Operations.
See Note 2, "Acquisitions" for further discussion on the TOKIN acquisition.
(Gain) Loss on Write down and Disposal of long-lived assets:
During fiscal year 2018, we recorded a net gain on disposal of long-lived assets of $1.0 million, which was comprised of $1.2 million in net gains on the write-down and disposal and long-lived assets offset by $0.2 million in impairment charges. The net gains on the sale and disposal of long-lived assets are primarily related to the sale of equipment, land, and buildings from KFM, which was shut down in fiscal year 2017. On March 13, 2018, the Company sold KFM's land and building to a third party for a gross sales price of $3.6 million. The net proceeds realized by the Company were approximately $3.4 million after payment of $0.2 million in closing costs. The Company realized a gain on the sale of the land and buildings of approximately $1.9 million during the year ended March 31, 2018 as a result of the sale. In addition, the Company sold KFM's equipment for a $1.4 million gain. These gains were partially offset by MSA's loss on disposals of assets of $1.3 million primarily related to equipment and buildings used for discontinued products and Solid Capacitors recorded a loss of approximately $0.6 million related to the relocation of its K-Salt operations from a leased facility to its existing Matamoros, Mexico facility. See Note 8, "(Gain) loss on write down and disposal of long-lived assets" for further discussion.
34
Restructuring
KEMET incurred severance charges across various overhead functions in its Simpsonville, South Carolina office as these functions were relocated to the new corporate headquarters in Fort Lauderdale, Florida. The relocation was substantially complete by March 31, 2018. Within the TOKIN legacy group, KEMET took a reduction in force across various operational and overhead functions. The reduction is expected to result in savings of approximately $6.5 million in fiscal year 2019, increasing to $9.2 million per year in fiscal year 2020 and fiscal year 2021. Expected completion is December 31, 2018.
Solid Capacitors is streamlining its vertical integration strategy by relocating its tantalum powder facility equipment from Carson City, Nevada to its existing Matamoros, Mexico plant. The relocation is expected to result in operating cost savings of approximately $0.8 million, $2.3 million, and $3.1 million in fiscal years 2019, 2020, and 2021, respectively. Severance charges and equipment relocation costs are expected to be recognized over the next seven quarters.
Film and Electrolytic took a voluntary reduction in force in its Italian operations. Cost savings are expected to begin in March 2018 and are expected to be approximately $1.0 million beginning in fiscal year 2019, $2.0 million in fiscal year 2020 and growing to $2.4 million in fiscal year 2021.
These restructuring plans are summarized in the table below (amounts in thousands):
Total expected to be incurred | Incurred during year ended March 31, 2018 | Cumulative incurred to date | |||||||||||||||||||
Restructuring Plan (1) | Segment | Personnel Reduction Costs | Relocation & Exit Costs | Personnel Reduction Costs | Relocation & Exit Costs | Personnel Reduction Costs | Relocation & Exit Costs | ||||||||||||||
US overhead function relocation to Fort Lauderdale, FL | Corporate | $ | 2,734 | $ | 909 | $ | 2,734 | $ | 909 | $ | 2,734 | $ | 909 | ||||||||
TOKIN operational & overhead function reduction in force | MSA, Corporate, & Solid Capacitors (2) | 4,397 | — | 4,397 | — | 4,397 | — | ||||||||||||||
Tantalum powder facility relocation | Solid Capacitors | 897 | 2,098 | — | — | — | — | ||||||||||||||
Italian operations reduction in force | Film and Electrolytic | 5,243 | — | 5,243 | — | 5,243 | — | ||||||||||||||
(1) Restructuring charges presented exclude $0.2 million in other miscellaneous personnel charges. These expenses are included in the Consolidated Statements of Operations line item "Restructuring charges."
(2) Personnel reduction costs are comprised of $3.3 million, $0.9 million, and $0.1 million within the MSA, Corporate, and Solid Capacitor segments, respectively.
Long-term debt
On April 28, 2017, KEMET entered into a Term Loan Credit Agreement (the “Term Loan Credit Agreement”) by and among the Company, KEC (together with the Company, the “Borrowers”), Bank of America, N.A. as the Administrative Agent and Collateral Agent, Merrill Lynch, Pierce, Fenner & Smith Incorporated, as sole lead arranger and bookrunner, and various lenders party thereto from time to time. The Term Loan Credit Agreement provides for a $345.0 million term loan facility. In addition, the Borrowers may request incremental term loan commitments in an aggregate amount not to exceed $50.0 million (together with the initial $345.0 million term loan, the “Term Loans”). The proceeds were used, together with cash on hand, to fund the redemption of all of KEMET’s outstanding 10.5% Senior Notes, which were called for redemption on April 28, 2017. The Term Loans were issued at a price of 97.0% (with an original issue discount of 300 basis points). At the Company’s election, the Term Loans may be made as either Base Rate Term Loans or LIBO Rate Term Loans (each as defined in the Term Loan Credit Agreement). The applicable margin for term loans is 5.0% for Base Rate Term Loans and 6.0% for LIBO Rate Term Loans. All LIBO Rate Term Loans are subject to a pre-margin floor of 1.00%. The Term Loan Credit Agreement contains customary covenants and events of default. The Company also entered into the Term Loan Security Agreement dated April 28, 2017 (the “Security Agreement”), among the Company, KEC, certain other subsidiaries of the Company, and Bank of America, N.A., as collateral agent, pursuant to which the Company’s obligations under the Term Loan Credit Agreement are secured by a pledge of 65.0% of the outstanding voting stock of certain first-tier subsidiaries organized in Italy, Japan, Mexico and Singapore, and a second lien pledge on the collateral securing KEMET’s revolving credit facility. The obligations of the Company under the Term Loan Credit Agreement are guaranteed by certain of its subsidiaries, including KRC Trade Corporation, KEMET Services Corporation, KBP and The Forest Electric Company. The Term Loans mature April 28, 2024, and may be extended in accordance with the Term Loan Credit Agreement. The Company may prepay loans under the Term Loan Credit Agreement at any time, subject to certain notice requirements and certain prepayment premiums during the first
35
two years. On a quarterly basis the Company must repay 1.25% of the aggregate principle amount on the initial $345.0 million term loan, or $4.3 million; payments began on September 29, 2017.
In connection with the closing of the new Term Loan Credit Agreement, KEC also entered into Amendment No. 9 to Loan and Security Agreement, Waiver and Consent, dated as of April 28, 2017, by and among KEC, the other borrowers named therein, the financial institutions party thereto as lenders and Bank of America, N.A., as agent for the lenders (the “Loan Amendment”). The Loan Amendment increased the facility to $75.0 million and provided KEC with lower applicable interest rate margins and the ability to complete the refinancing of the 10.5% Senior Notes. As part of the overall refinancing, KEC repaid all amounts outstanding under the Loan Amendment.
Subsequent Events
Amended and Restated Employment Agreement
On April 18, 2018, the Company amended and restated the employment agreement with the Company's Chief Executive Officer. The unvested Restricted Stock Units previously granted to him on June 29, 2015 and September 6, 2017, totaling 175,000 and 100,000 shares respectively, immediately became vested. The modification of the award terms did not result in any incremental compensation cost. However, total compensation cost of $1.7 million will be accelerated and recognized during the three-month period ending June 30, 2018.
Off-Balance Sheet Arrangements
As of March 31, 2018, other than operating lease commitments as described in Note 15, “Commitments and Contingencies”, we are not a party to any off-balance sheet financing arrangements that have, or are reasonably likely to have, a current or future material effect on our financial condition, revenues, expenses, results of operations, liquidity, capital expenditures or capital resources.
Critical Accounting Policies
Our accounting policies are summarized in Note 1, “Organization and Significant Accounting Policies” to the consolidated financial statements. The following identifies a number of policies which require significant judgments and estimates, or are otherwise deemed critical to our financial statements.
Our estimates and assumptions are based on historical data and other assumptions that we believe are reasonable. These estimates and assumptions affect the reported amounts of assets and liabilities and the disclosure of contingent assets and liabilities at the date of the financial statements. In addition, they affect the reported amounts of revenues and expenses during the reporting period.
Our judgments are based on our assessment as to the effect certain estimates, assumptions, or future trends or events may have on the financial condition and results of operations reported in the consolidated financial statements. Readers should understand that actual future results could differ from these estimates, assumptions, and judgments.
A quantitative sensitivity analysis is provided where that information is reasonably available, can be reliably estimated and provides material information to investors. The amounts used to assess sensitivity (i.e., 1%, 10%, etc.) are included to allow readers of this Annual Report on Form 10-K to understand a general cause and effect of changes in the estimates and do not represent our predictions of variability. For these estimates, it should be noted that future events rarely develop exactly as forecast, and estimates require regular review and adjustment. We believe the following critical accounting policies contain the most significant judgments and estimates used in the preparation of the consolidated financial statements:
REVENUE RECOGNITION. We ship products to customers based upon firm orders and revenue is recognized when the sales process is complete. This occurs when products are shipped to the customer in accordance with the terms of an agreement of sale, there is a fixed or determinable selling price, title and risk of loss have been transferred and collectability is reasonably assured. Based on product availability, customer requirements and customer consent, KEMET may ship products earlier than the initial planned ship date. Shipping and handling costs are included in cost of sales.
A portion of sales is related to products designed to meet customer specific requirements. These products typically have stricter tolerances making them useful to the specific customer requesting the product and to customers with similar or less stringent requirements. We recognize revenue when title to the products transfers to the customer.
36
A portion of sales is made to distributors under agreements allowing certain rights of return and price protection on unsold merchandise held by distributors. Our distributor policy includes inventory price protection and SFSD programs common in the industry. The price protection policy protects the value of the distributors’ inventory in the event we reduce our published selling price to distributors. This program allows the distributor to debit us for the difference between our list price and the lower authorized price for specific parts. We establish price protection reserves on specific parts residing in distributors’ inventories in the period that the price protection is formally authorized by KEMET.
KEMET’s SFSD program provides authorized distributors with the flexibility to meet marketplace prices by allowing them, upon a case-by-case pre-approved basis, to adjust their purchased inventory cost to correspond with current market demand. Requests for SFSD adjustments are considered on an individual basis, require a pre-approved cost adjustment quote from their local KEMET sales representative, apply only to a specific customer, part, specified special price amount, specified quantity, and is only valid for a specific period of time. To estimate potential SFSD adjustments corresponding with current period sales, KEMET records a sales reserve based on historical SFSD credits, distributor inventory levels, and certain accounting assumptions, all of which are reviewed quarterly. We believe this methodology enables us to make reliable estimates of future adjustments under the SFSD program. If the historical SFSD run rates used in our calculation changed by 1% in fiscal year 2018, net sales would be impacted by $0.9 million.
The establishment of these reserves is recognized as a component of the line item “Net sales” on the Consolidated Statements of Operations, while the associated reserves are included in the line item “Accounts receivable” on the Consolidated Balance Sheets. Estimates used in determining sales allowances are subject to various factors. This includes, but is not limited to, changes in economic conditions, pricing changes, product demand, inventory levels in the supply chain, the effects of technological change, and other variables that might result in changes to our estimates.
INVENTORIES. Inventories are valued at the lower of cost or net realizable value. For most of the inventory, cost is determined under the first-in, first-out method. For tool crib, a component of our raw material inventory, cost is determined under the average cost method. The valuation of inventories requires us to make estimates. We also must assess the prices at which we believe the finished goods inventory can be sold compared to its cost. A sharp decrease in demand could adversely impact earnings as the reserve estimates could increase.
PENSION AND POST-RETIREMENT BENEFITS. Our management, with the assistance of actuarial firms, performs actuarial valuations of the fair values of our pension and post-retirement plans’ benefit obligations. We make certain assumptions that have a significant effect on the calculated fair value of the obligations such as the:
• | discount rate—used to arrive at the net present value of the obligation; and |
• | salary increases—used to calculate the impact future pay increases will have on post-retirement obligations. |
We understand that these assumptions directly impact the actuarial valuation of the obligations recorded on the Consolidated Balance Sheets and the income or expense that flows through the Consolidated Statements of Operations.
We base our assumptions on either historical or market data that we consider reasonable. Variations in these assumptions could have a significant effect on the amounts reported in Consolidated Balance Sheets and the Consolidated Statements of Operations. The most critical assumption relates to the discount rate. A 25 basis point increase or decrease in the weighted average discount rate would result in changes to the projected benefit obligation of ($4.4) million and $4.9 million, respectively.
GOODWILL AND LONG-LIVED ASSETS. Goodwill, which represents the excess of purchase price over fair value of net assets acquired, and intangible assets with indefinite useful lives are tested for impairment at least on an annual basis. We perform our impairment test during the fourth quarter of each fiscal year and when otherwise warranted.
We evaluate our goodwill on a reporting unit basis. This requires us to estimate the fair value of the reporting units based on the future net cash flows expected to be generated. The impairment test involves a comparison of the fair value of each reporting unit, with the corresponding carrying amounts. If the reporting unit’s carrying amount exceeds its fair value, then an indication exists that the reporting unit’s goodwill may be impaired. The impairment to be recognized is measured by the amount by which the carrying value of the reporting unit’s goodwill being measured exceeds its implied fair value. The implied fair value of goodwill is the excess of the fair value of the reporting unit over the sum of the amounts assigned to identified net assets. As a result, the implied fair value of goodwill is generally the residual amount that results from subtracting the value of net assets including all tangible assets and identified intangible assets from the fair value of the reporting unit’s fair value. We determine the fair value of our reporting units using an income-based, discounted cash flow (“DCF”) analysis, and market-based approaches (Guideline Publicly Traded Company Method and Guideline Transaction Method) which examine transactions in the marketplace involving the sale of the stocks of similar publicly-owned companies, or the sale of entire companies engaged in operations similar to KEMET. In addition to the above described reporting unit valuation techniques, our
37
goodwill impairment assessment also considers our aggregate fair value based upon the value of our outstanding shares of common stock.
Our goodwill balance of $40.3 million is comprised of $35.6 million related to KBP, which is within the Tantalum product line of the Solid Capacitors segment, and $4.7 million related to IntelliData, which is a corporate asset. As part of our annual impairment testing, we determine the fair value of the relevant reporting unit(s) using an income-based, DCF analysis for KBP at the Tantalum product line level, and an internal rate of return analysis for IntelliData.
Significant assumptions used in the DCF analysis are:
• | the discount rate based on the weighted average cost of capital (“WACC”), |
• | estimated sales growth rates, and |
• | the estimated market price and production cost for tantalum products |
Our WACC is determined through market comparisons combined with small stock and equity risk premiums. Tantalum’s sales growth rates are estimated through KEMET’s three-year strategic plan.
Long-lived assets and intangible assets subject to amortization are reviewed for impairment whenever events or changes in circumstances indicate that the carrying amount of a long-lived asset or group of assets may not be recoverable. A long-lived asset classified as held for sale is initially measured and reported at the lower of its carrying amount or fair value less cost to sell.
Long-lived assets to be disposed of other than by sale are classified as held and used until the long-lived asset is disposed of.
Tests for the recoverability of a long-lived asset to be held and used are performed by comparing the carrying amount of the long-lived asset to the sum of the estimated future undiscounted cash flows expected to be generated by the asset. In estimating the future undiscounted cash flows, we use future projections of cash flows directly associated with, and which are expected to arise as a direct result of, the use and eventual disposition of the assets. These assumptions include, among other estimates, periods of operation and projections of sales and cost of sales. Changes in any of these estimates could have a material effect on the estimated future undiscounted cash flows expected to be generated by the asset. If it is determined that the book value of a long-lived asset is not recoverable, an impairment loss would be calculated equal to the excess of the carrying amount of the long-lived asset over its fair value. The fair value is calculated as the discounted cash flows of the underlying assets.
We evaluate the value of our other indefinite-lived intangible assets (trademarks) using an income-based, relief from royalty analysis.
The Company completed its impairment test on goodwill and intangible assets with indefinite useful lives as of January 1, 2018 and concluded that goodwill and indefinite-lived assets were not impaired nor were they at risk of failing step one of the impairment test as the fair value of each of the assets exceeds the carrying value by more than 10%. The type of events that could result in a future goodwill impairment could include an increase of over 100 basis points in the Company's derived weighted-average cost of capital, which could be driven by stock price volatility, increases in government or corporate bond market rates, or other factors. A one percent increase or decrease in the discount rate used in the goodwill and indefinite-lived assets valuation would have resulted in changes in fair value in the following amounts, and would not have resulted in an impairment charge:
Discount Rate Sensitivity, in millions | |||||||||||
Fair Value in Excess of Carrying Value, % | +1% | -1% | |||||||||
Goodwill - KBP | 108.0 | % | $ | (36.0 | ) | $ | 45.0 | ||||
Trademarks | 1,674.0 | % | (9.6 | ) | 11.3 | ||||||
Goodwill - IntelliData | 49.0 | % | (0.9 | ) | 1.1 | ||||||
INCOME TAXES. Tax law requires items to be included in the tax return at different times than when these items are reflected in the consolidated financial statements. As a result, the annual effective tax rate reflected in our consolidated financial statements is different from that reported in our tax return (our cash tax rate). Some of these differences are permanent, such as expenses that are not deductible in our tax return, and some differences reverse over time, such as depreciation expense. These timing differences create deferred tax assets and liabilities. Income taxes are accounted for under
38
the asset and liability method. Deferred tax assets and liabilities are recognized for the future tax consequences attributable to differences between the financial statement carrying amounts of existing assets and liabilities and their respective tax bases and operating loss and tax credit carryforwards. Deferred tax assets and liabilities are measured using enacted tax rates. Valuation allowances are recognized to reduce deferred tax assets to the amount that is more likely than not to be realized.
We believe that it is more likely than not that a portion of the deferred tax assets in various jurisdictions will not be realized, based on the scheduled reversal of deferred tax liabilities, the recent history of cumulative losses, and the insufficient evidence of projected future taxable income to overcome the loss history. We have provided a valuation allowance related to any benefits from income taxes resulting from the application of a statutory tax rate to the deferred tax assets. We continue to have net deferred tax assets (future tax benefits) in several jurisdictions which we expect to realize, assuming, based on certain estimates and assumptions, sufficient taxable income can be generated to utilize these deferred tax benefits. If these estimates and related assumptions change in the future, we may be required to reduce the value of the deferred tax assets resulting in additional tax expense. The amount of future income required for the Company to realize its net deferred tax assets is $51.3 million.
Differences between the provision for income taxes on earnings from continuing operations and the amount computed using the U.S. Federal statutory income tax rate are primarily due to the changes in the U.S. and foreign valuation allowances, the non-taxable gain from the bargain purchase, taxable foreign source income, and differences due to U.S. tax law changes.
The accounting rules require that we recognize, in our financial statements, the impact of a tax position, if that position is “more likely than not” of not being sustained on audit, based on the technical merits of the position. Any accruals for estimated interest and penalties would be recorded as a component of income tax expense.
To the extent that the provision for income taxes changed by 1% of income before income taxes, consolidated net income would change by $1.9 million in fiscal year 2018.
39
Results of Operations
Historically, revenues and earnings may or may not be representative of future operating results due to various economic and other factors. The following table sets forth the Consolidated Statements of Operations for the periods indicated (amounts in thousands):
Fiscal Years Ended March 31, | ||||||||||||
2018 | 2017 | 2016 | ||||||||||
Net sales | $ | 1,199,926 | $ | 757,791 | $ | 734,823 | ||||||
Operating costs and expenses: | ||||||||||||
Cost of sales (1) | 859,533 | 570,864 | 571,011 | |||||||||
Selling, general and administrative expenses (1) | 173,620 | 107,658 | 100,813 | |||||||||
Research and development (1) | 39,619 | 27,398 | 24,613 | |||||||||
Restructuring charges | 14,843 | 5,404 | 4,178 | |||||||||
(Gain) loss on write down and disposal of long-lived assets | (992 | ) | 10,671 | 375 | ||||||||
Total operating costs and expenses | 1,086,623 | 721,995 | 700,990 | |||||||||
Operating income (loss) (1) | 113,303 | 35,796 | 33,833 | |||||||||
Non-operating (income) expense: | ||||||||||||
Interest income | (809 | ) | (24 | ) | (14 | ) | ||||||
Interest expense | 32,882 | 39,755 | 39,605 | |||||||||
Acquisition (gain) loss | (130,880 | ) | — | — | ||||||||
Change in value of TOKIN options | — | (10,700 | ) | 26,300 | ||||||||
Other (income) expense, net (1) | 24,592 | (3,871 | ) | (841 | ) | |||||||
Income (loss) before income taxes and equity income (loss) from equity method investments | 187,518 | 10,636 | (31,217 | ) | ||||||||
Income tax expense (benefit) | 9,181 | 4,290 | 6,006 | |||||||||
Income (loss) before equity income (loss) from equity method investments | 178,337 | 6,346 | (37,223 | ) | ||||||||
Equity income (loss) from equity method investments | 76,192 | 41,643 | (16,406 | ) | ||||||||
Net income (loss) | $ | 254,529 | $ | 47,989 | $ | (53,629 | ) | |||||
______________________________________________________________________________
(1) Fiscal years ending March 31, 2017 and 2016 adjusted due to the adoption of ASU No. 2017-07.
Consolidated Comparison of Fiscal Year 2018 to Fiscal Year 2017
Net Sales
Net sales of $1.2 billion in fiscal year 2018 increased 58.3% from $757.8 million in fiscal year 2017. Solid Capacitor and Film and Electrolytic sales increased by $196.1 million and $19.0 million, respectively, and net sales for our new segment MSA were $227.0 million. Prior to the TOKIN acquisition on April 19, 2017, the Company did not have any MSA sales.
The increase in Solid Capacitors net sales was primarily driven by the addition of net sales of $133.8 million resulting from the TOKIN acquisition and an increase in net sales to the legacy products distributor channel of $81.7 million. To a lesser degree, an increase in legacy Ceramic products' net sales in the EMS channel across all regions and in the OEM channel in the EMEA and APAC regions also contributed to the increase in Solid Capacitors net sales. These increases were partially offset by a decrease in net sales in the OEM channel for legacy Tantalum products across all regions. In addition, Solid Capacitors net sales was favorably impacted by $6.1 million from foreign currency exchange due to the change in the value of the Euro compared to the U.S. dollar.
The increase in Film and Electrolytic net sales was driven by an increase in net sales in the distributor channel across the APAC and EMEA regions of $13.7 million, and to a lesser degree, an increase in sales in the OEM channel of the EMEA region and the EMS channel across the Americas, EMEA, and APAC regions. These increases were partially offset by a decrease in net sales in the OEM channel across the Americas, APAC, and JPKO regions. In addition, there was a favorable impact of $7.6 million from foreign currency exchange primarily due to the change in the value of the Euro compared to the U.S. dollar.
40
In fiscal years 2018 and 2017, net sales by region were as follows (dollars in thousands):
Fiscal Year 2018 | Fiscal Year 2017 | |||||||||||||||
Net Sales | % of Total | Net Sales | % of Total | |||||||||||||
APAC | $ | 479,987 | 40.0 | % | APAC | $ | 288,764 | 38.1 | % | |||||||
EMEA | 277,643 | 23.1 | % | EMEA | 237,890 | 31.4 | % | |||||||||
Americas | 259,105 | 21.6 | % | Americas | 224,056 | 29.6 | % | |||||||||
JPKO | 183,191 | 15.3 | % | JPKO | 7,081 | 0.9 | % | |||||||||
Total | $ | 442,296 | Total | $ | 231,137 | |||||||||||
In fiscal years 2018 and 2017, the percentages of net sales by channel to total net sales were as follows (dollars in thousands):
Fiscal Year 2018 | Fiscal Year 2017 | |||||||||||||||
Net Sales | % of Total | Net Sales | % of Total | |||||||||||||
OEM | $ | 563,240 | 46.9 | % | OEM | $ | 246,850 | 32.6 | % | |||||||
Distributors | 470,324 | 39.2 | % | Distributors | 354,639 | 46.8 | % | |||||||||
EMS | 166,362 | 13.9 | % | EMS | 156,302 | 20.6 | % | |||||||||
Total | $ | 636,686 | Total | $ | 510,941 | |||||||||||
Gross Margin
Gross margin for the fiscal year ended March 31, 2018 of $340.4 million (28.4% of net sales) increased $153.5 million or 82.1% from $186.9 million (24.7% of net sales) in the prior fiscal year. Gross margin as a percentage of net sales improved 370 basis points. Solid Capacitors gross margin increased $100.4 million, or 57.5% due to an increase in net sales, cost improvements in vertical integration, favorable foreign currency impact to manufacturing costs, and manufacturing process improvements resulting from annual cost reduction activities as well as our acquisition with TOKIN. TOKIN contributed $47.0 million to Solid Capacitors gross margin in fiscal year 2018. Film and Electrolytic gross margin increased $3.8 million, or 30.3% due to an increase in net sales, as well as the benefit of completed restructuring activities. MSA gross margin was $49.3 million for the fiscal year ended March 31, 2018.
Selling, General and Administrative Expenses (“SG&A”)
SG&A expenses of $173.6 million (14.5% of net sales) for fiscal year 2018 increased $66.0 million, or 61.3% compared to $107.7 million (14.2% of net sales) for fiscal year 2017. The increase was primarily attributable to $41.9 million in SG&A expenses incurred by TOKIN for the fiscal year ended March 31, 2018. In addition, the increase was related to $15.7 million in increased payroll-related expenses and benefits, a $9.1 million increase in office related expenses and rent, a $4.1 million increase in professional fees and a $2.4 million increase in travel related expenses. These increases were partially offset by a $7.0 million decrease in ERP integration and technology transition costs and a $0.4 million decrease in legal expenses.
Research and Development
R&D expenses of $39.6 million (3.3% of net sales) for fiscal year 2018 increased $12.2 million or 44.6% compared to $27.4 million (3.6% of net sales). The increase was primarily related to $10.1 million in R&D expenses incurred by TOKIN for fiscal year 2018 and $2.2 million in increased payroll-related expenses.
41
(Gain) Loss on Write Down and Disposal of Long-Lived Assets
In fiscal year 2018 the Company recorded a net gain on write down and disposal of long-lived assets of $1.0 million, which was comprised of $1.2 million in net gains on the sale and disposal of long-lived assets offset by $0.2 million in impairment charges. The net gains on the sale and disposal of long-lived assets and impairment charges are recorded on the Consolidated Statement of Operations line item "(Gain) loss on write down and disposal of long-lived assets." The net gains on the sale and disposal of long-lived assets are primarily related to the sale of equipment, land, and buildings from KFM, which was shut down in fiscal year 2017. On March 13, 2018, the Company sold KFM's land and buildings to a third party for a gross sales price of $3.6 million. The net proceeds realized by the Company were approximately $3.4 million after payment of $0.2 million in closing costs. The Company realized a gain on the sale of the land and buildings of approximately $1.9 million during the year ended March 31, 2018. In addition, the Company sold KFM's equipment for a $1.4 million gain. These gains were partially offset by MSA's loss on disposals of assets of $1.3 million primarily related to equipment and buildings used for discontinued products and Solid Capacitors' loss of approximately $0.6 million related to the relocation of its K-Salt operations from a leased facility to its existing Matamoros, Mexico facility.
In fiscal year 2017, the Company recorded a net loss on write down and disposal of long-lived assets of $10.7 million, which was comprised of $0.4 million in net losses on the sale and disposal of long-lived assets and $10.3 million in impairment charges. Film and Electrolytic incurred impairment charges totaling $8.2 million ($0.18 per basic share and $0.15 per diluted share). The impairment charges consisted of the following two actions.
On August 31, 2016, KEMET Electronics Corporation, a wholly-owned subsidiary of KEMET made the decision to shut-down operations of its wholly-owned subsidiary, KFM. Operations at KFM’s Knoxville, Tennessee plant ceased as of October 31, 2016. KFM supplied formed foil to the Company’s Film and Electrolytic Business Group, as well as to certain third party customers. The Company recorded impairment charges related to KFM totaling $4.1 million comprised of $3.0 million for the write down of property plant and equipment and $1.1 million for the write down of intangible assets. In addition, the Company accrued severance charges and restructuring costs described in Note 4, “Restructuring.”
The Company also recorded impairment charges of $4.1 million related to a decline in real estate market conditions surrounding its vacated Sasso Marconi, Italy manufacturing facility. KEMET used a capitalization of income method to estimate fair value taking into account the surface area of the property, the lease price per unit of surface area, and a weighted average cost of capital.
In fiscal year 2017, Solid Capacitors incurred impairment charges totaling $2.1 million ($0.04 per basic share and $0.04 per diluted share) related to the relocation of our leased K-salt facility to our existing Matamoros, Mexico facility. In addition, the Company accrued severance charges described in Note 4 “Restructuring” and incurred equipment relocation costs of approximately $0.6 million during fiscal year 2017.
Restructuring Charges
Restructuring charges of $14.8 million in fiscal year 2018 increased $9.4 million or 174.7% from $5.4 million in fiscal year 2017.
Restructuring charges in the fiscal year ended March 31, 2018 included $12.6 million of personnel reduction costs and $2.3 million of relocation costs. The personnel reduction costs of $12.6 million are due to $5.2 million related to a voluntary reduction in force in the Film and Electrolytic segment's Italian operations; $4.4 million related to a headcount reduction in the TOKIN legacy group across various internal and operational functions; $2.7 million in severance charges across various overhead functions in the Simpsonville, South Carolina office as these functions were relocated to the Company's new corporate headquarters in Fort Lauderdale, Florida; and $0.2 million in headcount reductions related to a European sales reorganization.
The manufacturing relocation costs of $2.3 million include $0.9 million in lease termination penalties related to the relocation of global marketing, finance and accounting, and information technology functions to the Company's Fort Lauderdale office, $0.8 million in expenses related to the relocation of the K-Salt operations to the existing Matamoros, Mexico plant, $0.4 million in exit costs related to the shut-down of operations for KFM, and $0.1 million related to the transfer of certain Tantalum production from Simpsonville, South Carolina to Victoria, Mexico.
Restructuring charges in the fiscal year ended March 31, 2017 included $2.2 million related to personnel reduction costs and $3.2 million of relocation costs. The personnel reduction costs correspond with the following: $0.3 million related to the consolidation of certain Solid Capacitor manufacturing in Matamoros, Mexico; $0.4 million for headcount reductions related to the shut-down of operations for KFM in Knoxville, Tennessee; $0.3 million related to headcount reductions in Europe (primarily Italy and Landsberg, Germany) corresponding with the relocation of certain production lines and laboratories to lower cost regions; $0.3 million for overhead reductions in Sweden; $0.3 million in U.S. headcount reductions related to the
42
relocation of global marketing functions to the Company’s Fort Lauderdale, Florida office; $0.3 million in headcount reductions related to the transfer of certain Tantalum production from Simpsonville, South Carolina to Victoria, Mexico; $0.2 million in overhead reductions for the relocation of R&D operations from Weymouth, England to Evora, Portugal; and $0.1 million in manufacturing headcount reductions related to the relocation of the K-Salt operations to the existing Matamoros, Mexico plant.
The manufacturing relocation costs of $3.2 million include $1.9 million in expenses related to contract termination costs related to the shut-down of operations for KFM; $0.6 million in expenses related to the relocation of the K-Salt operations to the existing Matamoros, Mexico plant; $0.6 million for transfers of Film and Electrolytic production lines and R&D functions to lower cost regions; and $0.1 million related to the transfer of certain Tantalum production from Simpsonville, South Carolina to Victoria, Mexico.
Operating Income (Loss)
Operating income for fiscal year 2018 of $113.3 million increased $77.5 million compared to operating income of $35.8 million in fiscal year 2017. The improvement was primarily due to a $153.5 million increase in gross margin and a $11.7 million favorable impact from (gain) loss on write down and disposal of long-lived assets. These improvements to operating income were partially offset by a $66.0 million increase in SG&A expenses, a $12.2 million increase in R&D expenses, and a $9.4 million increase in restructuring charges.
Non-Operating (Income) Expense, net
Non-operating income, was $74.2 million in fiscal year 2018 compared to a net expense of $25.2 million in fiscal year 2017. The $99.4 million increase was primarily due to a $130.9 million gain on acquisition in fiscal 2018 and a $7.7 million decrease in net interest and amortization expense under the new Term Loan and Credit Agreement for fiscal year 2018 as compared to net interest and amortization expense under the Senior Notes in fiscal year 2017. Partially offsetting these favorable changes were the following unfavorable changes: a $16.9 million net unfavorable change in foreign currency exchange gain/(loss), which was primarily due to the change in the value of the Chinese Yuan Renminbi, Euro, Great Britain Pound, Thai Baht, and Japanese Yen, compared to the U.S. dollar; a $10.7 million change in value related to the TOKIN Option recorded in fiscal year 2017 compared to no gain/loss in fiscal year 2018; $11.3 million in antitrust litigation fines recorded in fiscal year 2018, $1.1 million in integration expenses incurred by TOKIN in fiscal year 2018, and $0.6 million in net other operating expenses.
Income Taxes
The income tax expense of $9.2 million in fiscal year 2018 increased $4.9 million compared to an income tax expense of $4.3 million in fiscal year 2017. The change was primarily driven by income tax expense from foreign operations. Of the $4.9 million increase, $3.3 million relates to income tax expense from operations of newly acquired subsidiaries. Fiscal year 2018 income tax expense is comprised of $9.8 million in foreign income tax expense and a $0.6 million U.S. federal income tax benefit. The U.S. federal benefit of $0.6 million includes an estimated $0.8 million tax benefit resulting from the Tax Cuts and Jobs Act of 2017.
Equity Income (Loss) from Equity Method Investments
In fiscal year 2018, we incurred equity income related to our equity method investments of $76.2 million compared to $41.6 million in fiscal year 2017. The increase was primarily due to equity income of $84.2 million related to our 34% economic interest in TOKIN for the 19 day period ended April 19, 2017, which included the gain on the sale of the EMD business. The increase was also due to $0.8 million and $0.4 million of income from TOKIN's equity method investments, Nippon Yttrium Co., Ltd ("NYC") and NT Sales Co., Ltd ("NTS"), respectively. Partially offsetting these favorable items was a $9.0 million removal of the balance of the cost basis of the portion of equity investment related to the EMD division which was established at the time of initial acquisition of 34% of TOKIN, as well as $0.1 million of loss from our joint venture with Novasentis.
43
Segment Comparison of Fiscal Year 2018 to Fiscal Year 2017
The following table sets forth the operating income (loss) for each of our business segments for the fiscal years 2018 and 2017. The table also sets forth each of the segments’ net sales as a percentage of total net sales and total operating income (loss) as a percentage of total net sales (amounts in thousands, except percentages):
For the Fiscal Years Ended | ||||||||||||||
March 31, 2018 | March 31, 2017 | |||||||||||||
Amount | % to Total Sales | Amount | % to Total Sales | |||||||||||
Net sales | ||||||||||||||
Solid Capacitors | $ | 771,240 | 64.3 | % | $ | 575,110 | 75.9 | % | ||||||
Film and Electrolytic | 201,722 | 16.8 | % | 182,681 | 24.1 | % | ||||||||
MSA | 226,964 | 18.9 | % | — | — | % | ||||||||
Total | $ | 1,199,926 | 100.0 | % | $ | 757,791 | 100.0 | % | ||||||
Operating income (loss) | ||||||||||||||
Solid Capacitors (1) | $ | 234,473 | $ | 147,662 | ||||||||||
Film and Electrolytic (1) | 4,073 | (8,200 | ) | |||||||||||
MSA | 15,694 | — | ||||||||||||
Corporate (1) | (140,937 | ) | (103,666 | ) | ||||||||||
Total | $ | 113,303 | 9.4 | % | $ | 35,796 | 4.7 | % | ||||||
(1) Fiscal year ending March 31, 2017 adjusted due to the adoption of ASU No. 2017-07.
Solid Capacitors
The table below sets forth net sales, operating income (loss) and operating income (loss) as a percentage of net sales for Solid Capacitors for fiscal years 2018 and 2017 (amounts in thousands, except percentages):
For the Fiscal Years Ended | ||||||||||||||
March 31, 2018 | March 31, 2017 | |||||||||||||
Amount | % to Net Sales | Amount | % to Net Sales | |||||||||||
Tantalum product line net sales | $ | 495,114 | $ | 342,184 | ||||||||||
Ceramic product line net sales | 276,126 | 232,926 | ||||||||||||
Solid Capacitors net sales | 771,240 | 575,110 | ||||||||||||
Solid Capacitors operating income (loss) | 234,473 | 30.4 | % | 147,662 | 25.7 | % | ||||||||
Net Sales
Solid Capacitors net sales of $771.2 million in fiscal year 2018 increased $196.1 million or 34.1% from $575.1 million in fiscal year 2017. Tantalum product line net sales of $495.1 million in fiscal year 2018 increased $152.9 million or 44.7% from $342.2 million in fiscal year 2017. Ceramic product line net sales of $276.1 million in fiscal year 2018 increased $43.2 million or 18.5% from $232.9 million in fiscal year 2017.
The overall increase in Solid Capacitors net sales was primarily driven by the addition of net sales of $133.8 million resulting from the TOKIN acquisition and an increase in net sales to the legacy products distributor channel across all regions of $81.7 million, consisting of $48.0 million from Tantalum products and $33.7 million from Ceramic products.
To a lesser degree, an increase in legacy Ceramic products' net sales in the EMS channel across all regions and in the OEM channel in the EMEA and APAC regions also contributed to the increase in Solid Capacitors net sales. These increases were partially offset by a decrease in net sales in the OEM channel for legacy Tantalum products across all regions. In addition, Solid Capacitors net sales was favorably impacted by $6.1 million from foreign currency exchange due to the change in the value of the Euro compared to the U.S. dollar.
44
Segment Operating Income (Loss)
Segment operating income of $234.5 million for fiscal year 2018 increased $86.8 million or 58.8% from $147.7 million for fiscal year 2017. The increase in segment operating income was primarily attributable to an increase in gross margin of $100.4 million. TOKIN contributed $47.0 million in additional gross margin in fiscal year 2018. Legacy KEMET gross margin increased $53.3 million, or 30.6%, primarily driven by an increase in net sales, cost improvements in vertical integration, favorable foreign currency impact to manufacturing costs, and manufacturing process improvements resulting from cost reduction activities. In addition, there was a $1.6 million improvement in (gain) loss on write down and disposal of long-lived assets. Partially offsetting these improvements were a $10.5 million increase in SG&A and a $5.0 million increase in R&D expenses. TOKIN accounted for $10.2 million of the increase in SG&A expenses and $4.1 million of the increase in R&D expenses.
Film and Electrolytic
The table below sets forth net sales, operating income (loss) and operating income (loss) as a percentage of net sales for Film and Electrolytic for the fiscal years 2018 and 2017 (amounts in thousands, except percentages):
For the Fiscal Years Ended | ||||||||||||||
March 31, 2018 | March 31, 2017 | |||||||||||||
Amount | % to Net Sales | Amount | % to Net Sales | |||||||||||
Net sales | $ | 201,722 | $ | 182,681 | ||||||||||
Segment operating income (loss) | 4,073 | 2.0 | % | (8,200 | ) | (4.5 | )% | |||||||
Net Sales
Film and Electrolytic net sales of $201.7 million in fiscal year 2018 increased $19.0 million or 10.4% from $182.7 million in fiscal year 2017. The increase in net sales was primarily driven by an increase in net sales in the distributor channel across the APAC and EMEA regions of $13.7 million, and to a lesser degree an increase in sales in the OEM channel of the EMEA region and the EMS channel across the Americas, EMEA, and APAC regions. In addition, there was a favorable impact of $7.6 million from foreign currency exchange primarily due to the change in the value of the Euro compared to the U.S. dollar.
Segment Operating Income (Loss)
Segment operating income of $4.1 million in fiscal year 2018 increased $12.3 million from $8.2 million of segment operating loss in fiscal year 2017. The increase was primarily attributable to a $3.8 million increase in gross margin driven by higher net sales, as well as the benefit of the completed restructuring activities. The increase was also attributed to an $11.7 million improvement in (gain) loss on write down and disposal of long-lived assets. These improvements were partially offset by a $2.1 million increase in restructuring expenses, a $0.7 million increase in S&G expenses, and a $0.4 million increase in R&D expenses.
Electro-Magnetic, Sensors, and Actuators
The following table sets forth net sales, operating income (loss), and operating income (loss) as a percentage of net sales for our MSA segment in fiscal year 2018 (amounts in thousands, except percentages). MSA is a new segment which is comprised of EMC materials and devices, piezo materials and actuators and various types of sensors acquired in connection with the TOKIN acquisition on April 19, 2017:
Net Sales
For the Fiscal Years Ended | |||||||
March 31, 2018 | |||||||
Amount | % to Net Sales | ||||||
Net sales | $ | 226,964 | |||||
Segment operating income (loss) | 15,694 | 6.9 | % | ||||
MSA had net sales of $227.0 million in fiscal year 2018, with all sales coming from the newly acquired TOKIN business. MSA net sales consisted of $215.4 million in the OEM channel, $11.0 million in the distributor channel, and $0.6 million in the EMS channel.
45
Segment Operating Income (Loss)
Segment operating income was $15.7 million in fiscal year 2018, with all the activity coming from the newly acquired TOKIN business. MSA had a gross margin of $49.3 million, SG&A expenses of $22.5 million, R&D expenses of $6.5 million, restructuring expenses of $3.3 million, and other operating expenses of $1.3 million.
Consolidated Comparison of Fiscal Year 2017 to Fiscal Year 2016
Net sales
Net sales of $757.8 million for fiscal year 2017 increased 3.1% from $734.8 million for fiscal year 2016. Solid Capacitor and Film and Electrolytic sales increased by $18.8 million and $4.2 million, respectively. The overall Solid Capacitors net sales increase was primarily driven by an increase in net sales to the APAC and EMEA distribution channel driven by increases in volume, which offset typical market price erosion.
The overall Film and Electrolytic net sales increase was driven by an increase in net sales in the Distributor channel through all regions. This increase was partially offset by a decrease in net sales in the OEM channel for the Americas and EMEA region, primarily related to increased sales in the prior year in anticipation of the relocation of our manufacturing line from Germany to Macedonia. A portion of the OEM declines were offset by an increase in APAC due to increased sales to a customer that relocated from EMEA. In addition, there was an unfavorable impact of $0.5 million from foreign currency exchange primarily due to the change in the value of the Euro compared to the U.S. dollar.
In fiscal years 2017 and 2016, net sales by region were as follows (dollars in thousands):
Fiscal Year 2017 | Fiscal Year 2016 | |||||||||||||||
Net Sales | % of Total | Net Sales | % of Total | |||||||||||||
Americas | $ | 224,056 | 29.6 | % | Americas | $ | 225,676 | 30.7 | % | |||||||
APAC | 288,764 | 38.1 | % | APAC | 266,814 | 36.3 | % | |||||||||
EMEA | 237,890 | 31.4 | % | EMEA | 233,313 | 31.8 | % | |||||||||
JPKO | 7,081 | 0.9 | % | JPKO | 9,020 | 1.2 | % | |||||||||
Total | $ | 757,791 | Total | $ | 734,823 | |||||||||||
In fiscal years 2017 and 2016, the percentages of net sales by channel to total net sales were as follows:
Fiscal Year 2017 | Fiscal Year 2016 | |||||||||||||||
Net Sales | % of Total | Net Sales | % of Total | |||||||||||||
Distributors | $ | 354,639 | 46.8 | % | Distributors | $ | 308,105 | 41.9 | % | |||||||
EMS | 156,302 | 20.6 | % | EMS | 155,548 | 21.2 | % | |||||||||
OEM | 246,850 | 32.6 | % | OEM | 271,170 | 36.9 | % | |||||||||
Total | $ | 757,791 | Total | $ | 734,823 | |||||||||||
Gross Margin
Gross margin for the fiscal year ended March 31, 2017 of $186.9 million (24.7% of net sales) increased $23.1 million or 14.1% from $163.8 million (22.3% of net sales) in the prior fiscal year. Gross margin as a percentage of net sales improved 250 basis points. The primary contributor to the increase was an increase in Solid Capacitor gross margin of $20.4 million due to an increase in net sales, cost improvements in vertical integration, favorable foreign currency impact to manufacturing costs, and manufacturing process improvements resulting from annual cost reduction activities as well as our partnership with TOKIN. In addition, Film and Electrolytic's gross margin improved $2.7 million due the increase in net sales as well as cost reductions achieved through headcount reductions, manufacturing relocations, operating efficiencies and actions taken to reduce raw material costs across all plants.
SG&A
SG&A expenses of $107.7 million (14.2% of net sales) for fiscal year 2017 increased $7.0 million or 7.0% compared to $100.6 million (13.7% of net sales) for fiscal year 2016. The increase consisted primarily of the following items: a $6.0 million increase in payroll, commissions, and related expenses and benefits; a $1.4 million increase in ERP integration and technology transition costs; a $1.0 million increase in consulting and contractor expenses; and a $0.4 million increase in professional fees. Partially offsetting these increases was a $0.9 million decrease related to the change in the allocation of IT
46
resources and other costs between SG&A and cost of goods sold; a $0.4 million decrease in legal expenses related to ongoing antitrust lawsuits; and a $0.5 million decrease in travel and training expenses.
Research and Development
R&D expenses of $27.4 million (3.6% of net sales) for fiscal year 2017 increased $2.8 million or 11.3% compared to $24.6 million (3.3% of net sales) for fiscal year 2016 due to additional projects within the Tantalum product line related to demand from customers for new part types.
(Gain) Loss on Write Down and Disposal of Long-Lived Assets
During fiscal year 2017, the Company recorded a net loss on write down and disposal of long-lived assets of $10.7 million, which was comprised of $0.4 million in net losses on the sale and disposal of long-lived assets and $10.3 million in impairment charges. Film and Electrolytic incurred impairment charges totaling $8.2 million ($0.18 per basic share and $0.15 per diluted share). The net losses on the sale and disposal of long-lived assets and impairment charges are recorded on the Consolidated Statement of Operations line item "(Gain) loss on write down and disposal of long-lived assets." The impairment charges consisted of the following two actions.
On August 31, 2016, KEMET Electronics Corporation, a wholly-owned subsidiary of KEMET made the decision to shut-down operations of its wholly-owned subsidiary, KFM. Operations at KFM’s Knoxville, Tennessee plant ceased as of October 31, 2016. KFM supplied formed foil to the Company’s Film and Electrolytic segment, as well as to certain third party customers. The Company anticipates that Film and Electrolytic will achieve raw material cost savings by purchasing its formed foil from suppliers that have the advantage of lower utility costs. The Company recorded impairment charges related to KFM totaling $4.1 million comprised of $3.0 million for the write down of property plant and equipment and $1.1 million for the write down of intangible assets. In addition, the Company accrued severance charges and restructuring costs described in Note 4, “Restructuring.”
The Company also recorded impairment charges of $4.1 million related to a decline in real estate market conditions surrounding its vacated Sasso Marconi, Italy manufacturing facility. KEMET used a capitalization of income method to estimate fair value taking into account the surface area of the property, the lease price per unit of surface area, and a weighted average cost of capital.
In fiscal year 2017, Solid Capacitors incurred impairment charges totaling $2.1 million ($0.04 per basic share and $0.04 per diluted share) related to the relocation of our leased K-salt facility to our existing Matamoros, Mexico facility. In addition, the Company accrued severance charges described in Note 4 “Restructuring” and incurred equipment relocation costs of approximately $0.6 million during fiscal year 2017.
During fiscal year 2016, the Company recorded a net loss on write down and disposal of long-lived asset of $0.4 million, which was a result of net losses on the sale and disposal of long-lived assets. There were no impairment charges in fiscal year 2016.
Restructuring Charges
Restructuring charges of $5.4 million in fiscal year 2017 increased $1.2 million or 29.3% from $4.2 million in fiscal year 2016.
Restructuring charges in the fiscal year ended March 31, 2017 included $2.2 million related to personnel reduction costs and $3.2 million of relocation costs. The personnel reduction costs correspond with the following: $0.3 million related to the consolidation of certain Solid Capacitor manufacturing in Matamoros, Mexico; $0.4 million for headcount reductions related to the shut-down of operations for KFM in Knoxville, Tennessee; $0.3 million related to headcount reductions in Europe (primarily Italy and Landsberg, Germany) corresponding with the relocation of certain production lines and laboratories to lower cost regions; $0.3 million for overhead reductions in Sweden; $0.3 million in U.S. headcount reductions related to the relocation of global marketing functions to the Company’s Fort Lauderdale, Florida office; $0.3 million in headcount reductions related to the transfer of certain Tantalum production from Simpsonville, South Carolina to Victoria, Mexico; $0.2 million in overhead reductions for the relocation of R&D operations from Weymouth, England to Evora, Portugal; and $0.1 million in manufacturing headcount reductions related to the relocation of the K-Salt operations to the existing Matamoros, Mexico plant.
The manufacturing relocation costs of $3.2 million include $1.9 million in expenses related to contract termination costs related to the shut-down of operations for KFM; $0.6 million in expenses related to the relocation of the K-Salt operations to the existing Matamoros, Mexico plant; $0.6 million for transfers of Film and Electrolytic production lines and R&D functions to lower cost regions; and $0.1 million related to the transfer of certain Tantalum production from Simpsonville, South Carolina to Victoria, Mexico.
47
Restructuring charges in the fiscal year ended March 31, 2016 included $1.8 million related to personnel reduction costs and $2.4 million of relocation costs. The personnel reduction costs were primarily comprised of the following: $0.9 million for headcount reductions in Matamoros, Mexico related to the relocation of certain Solid Capacitor manufacturing from Matamoros, Mexico to Victoria, Mexico, $0.6 million related to a headcount reduction in Suzhou, China for the Film and Electrolytic production line transfer from Suzhou, China to Anting, China, $0.5 million related to the consolidation of certain Solid Capacitor manufacturing in Victoria, Mexico, $0.5 million for headcount reductions related to the outsourcing of the Company's information technology function and overhead reductions in North America and Europe, and $0.3 million for headcount reductions in Europe (primarily Landsberg, Germany). These personnel reduction costs were partially offset by a $1.0 million credit to expense in Italy due to the partial reversal of a severance accrual. The Company originally recorded the accrual in the third quarter of fiscal year 2015 corresponding with a plan to reduce headcount by 50 employees. Under the plan, 24 employees were terminated. However, due to unexpected workforce attrition combined with achieving other cost reduction goals, the Company decided not to complete the remaining headcount reduction. Consequently, the Company reversed the remaining accrual during the second quarter of fiscal year 2016.
The manufacturing relocation costs of $2.4 million include $1.1 million for the Landsberg, Germany shut-down including relocating equipment to Pontecchio, Italy and Skopje, Macedonia; $0.4 million for the relocation of certain Solid Capacitor manufacturing equipment in Victoria, Mexico; $0.4 million for the exit of Film and Electrolytic manufacturing from Suzhou, China; and $0.5 million for other costs related to shut-downs in Europe, North America, and Asia.
Operating Income (Loss)
Operating income for fiscal year 2017 of $35.8 million improved $1.8 million compared to operating income of $34.0 million in fiscal year 2016. The improvement was primarily due a $23.1 million increase in gross margin. These improvements were partially offset by a $10.3 million increase in net loss on write down and disposal of long-lived assets, a $7.0 million increase in SG&A expenses, a $2.8 million increase in R&D expenses, and a $1.2 million increase in restructuring charges.
Non-Operating (Income) Expense, net
Non-operating (income) expense, net was a net expense of $25.2 million in fiscal year 2017 compared to a net expense of $65.2 million in fiscal year 2016. The $40.1 million decrease was primarily attributable to a $10.7 million increase in the value of the TOKIN options recognized in fiscal year 2017 compared to a $26.3 million decrease in fiscal year 2016, which was primarily attributable to the expiration of KEMET's call option and from the TOKIN antitrust and civil litigation. In addition, we incurred a $3.8 million foreign exchange gain in fiscal year 2017 compared to a $3.0 million foreign exchange gain in fiscal year 2016, and received $0.4 million in insurance proceeds in fiscal year 2017.
Income Taxes
The income tax expense of $4.3 million in fiscal year 2017 decreased $1.7 million compared to an income tax expense of $6.0 million in fiscal year 2016. The change was primarily driven by tax law changes in foreign jurisdictions and an inflation adjustment for the Mexican Peso. Fiscal year 2017 income tax expense was comprised of $4.3 million in foreign income tax expense. No U.S. federal income tax benefit was recognized for the U.S. taxable loss for fiscal year 2017 due to a valuation allowance provided for U.S. net operating losses.
Equity Income (Loss) from Equity Method Investments
In fiscal year 2017, we incurred an equity gain related to our 34% economic interest in TOKIN of $41.6 million compared to a loss of $16.4 million in fiscal year 2016. The change was primarily comprised of the following: a $41.0 million reversal of a deferred tax valuation allowance due to the gain on the sale of the EMD business to be recognized in fiscal year 2018, a $12.0 million decrease in additional charge of antitrust and civil litigation fines and a $6.4 million increase in gross margin (including a $3.9 million favorable impact from foreign currency exchange fluctuation) during fiscal year 2017 compared to fiscal year 2016. The actual improvement in gross margin excluding foreign currency exchange impact was driven primarily by sales mix improvement, improvements in manufacturing efficiencies and reduction of fixed costs. Partially offsetting these favorable items was a $0.5 million unfavorable change in the foreign currency translation gains (losses). In addition, there was a $1.0 million favorable legal settlement in Hong Kong for fiscal year 2016 and no similar activity in fiscal year 2017.
48
Segment Comparison of Fiscal Year 2017 to Fiscal Year 2016
The following table sets forth the operating income (loss) for each of our business segments for the fiscal years 2017 and 2016. The table also sets forth each of the segments’ net sales as a percentage of total net sales and the operating income (loss) components as a percentage of total net sales (amounts in thousands, except percentages):
_______________________________________________
For the Fiscal Years Ended | ||||||||||||||
March 31, 2017 | March 31, 2016 | |||||||||||||
Amount | % to Total Sales | Amount | % to Total Sales | |||||||||||
Net sales | ||||||||||||||
Solid Capacitors | $ | 575,110 | 75.9 | % | $ | 556,303 | 75.7 | % | ||||||
Film and Electrolytic | 182,681 | 24.1 | % | 178,520 | 24.3 | % | ||||||||
Total | $ | 757,791 | 100.0 | % | $ | 734,823 | 100.0 | % | ||||||
Operating income (loss) | ||||||||||||||
Solid Capacitors (1) | $ | 147,662 | $ | 130,574 | ||||||||||
Film and Electrolytic (1) | (8,200 | ) | 137 | |||||||||||
Corporate (1) | (103,666 | ) | (96,707 | ) | ||||||||||
Total | $ | 35,796 | 4.7 | % | $ | 34,004 | 4.6 | % | ||||||
(1) Fiscal years ending March 31, 2017 and 2016 adjusted due to the adoption of ASU No. 2017-07.
Solid Capacitors
The table below sets forth net sales, operating income (loss) and operating income (loss) as a percentage of net sales for Solid Capacitors for the fiscal years 2017 and 2016 (amounts in thousands, except percentages):
For the Fiscal Years Ended | ||||||||||||||
March 31, 2017 | March 31, 2016 | |||||||||||||
Amount | % to Net Sales | Amount | % to Net Sales | |||||||||||
Tantalum product line net sales | $ | 342,184 | $ | 337,392 | ||||||||||
Ceramic product line net sales | 232,926 | 218,911 | ||||||||||||
Net sales | $ | 575,110 | $ | 556,303 | ||||||||||
Segment operating income | 147,662 | 25.7 | % | 130,574 | 23.5 | % | ||||||||
Net Sales
Net sales of $575.1 million in fiscal year 2017 increased $18.8 million or 3.4% from $556.3 million in fiscal year 2016. Tantalum product line net sales of $342.2 million in fiscal year 2017 increased $4.8 million or 1.4% from $337.4 million in fiscal year 2016. Ceramic product line net sales of $232.9 million in fiscal year 2017 increased $14.0 million or 6.4% from $218.9 million in fiscal year 2016.
49
The overall Solid Capacitors net sales increase was primarily driven by an increase in net sales to the APAC and EMEA distribution channel (as shown in the table below) driven by increases in volume which offset typical market price erosion (amounts in thousands):
For the Fiscal Years Ended | ||||||||||||
March 31, 2017 | March 31, 2016 | |||||||||||
Solid Capacitor Distributor Sales by Region | Amount | Amount | Change in Sales | |||||||||
Americas | $ | 103,338 | $ | 99,599 | $ | 3,739 | ||||||
EMEA | 73,606 | 64,961 | 8,645 | |||||||||
JPKO | 2,361 | 2,391 | (30 | ) | ||||||||
APAC | 96,286 | 70,722 | 25,564 | |||||||||
Solid Capacitor distributor net sales | $ | 275,591 | $ | 237,673 | $ | 37,918 | ||||||
Segment Operating Income (Loss)
Segment operating income of $147.7 million for fiscal year 2017 increased $17.1 million or 13.1% from $130.6 million for fiscal year 2016. The increase in segment operating income is primarily attributable to the following: an increase in gross margin of $20.4 million, a decrease in restructuring charges of $0.6 million and a $0.3 million decrease in loss on disposal of assets. Our gross margin improvement was due to an increase in net sales, cost improvements in vertical integration, favorable foreign currency impact to manufacturing costs, and manufacturing process improvements resulting from annual cost reduction activities as well as our partnership with TOKIN. These items were partially offset by a $2.1 million increase in R&D expenses and $2.1 million in non-cash impairment charges resulting from the plan to relocate the K-Salt facility equipment to the existing Matamoros, Mexico plant.
Film and Electrolytic
The table below sets forth net sales, operating income (loss) and operating income (loss) as a percentage of net sales for Film and Electrolytic for the fiscal years 2017 and 2016 (amounts in thousands, except percentages):
For the Fiscal Years Ended | ||||||||||||||
March 31, 2017 | March 31, 2016 | |||||||||||||
Amount | % to Net Sales | Amount | % to Net Sales | |||||||||||
Net sales | $ | 182,681 | $ | 178,520 | ||||||||||
Segment operating (loss) income | (8,200 | ) | (4.5 | )% | 137 | 0.1 | % | |||||||
Net Sales
Net sales of $182.7 million in fiscal year 2017 increased $4.2 million or 2.3% from $178.5 million in fiscal year 2016. Capacitor unit sales volume for fiscal year 2017 increased 19.5% with a shift in product line mix that lowered the overall average selling price by 13.1% compared to fiscal year 2016. The increase was driven by a increase in net sales in the Distributor channel through all regions. This increase was partially offset by an decrease in net sales in the OEM channel for the Americas and the EMEA region, primarily related to increased sales in the prior year in anticipation of the relocation of our manufacturing line from Germany to Macedonia. A portion of the OEM declines were offset by an increase in the APAC region due to increased sales to a customer that relocated from EMEA. In addition, there was an unfavorable impact of $0.5 million from foreign currency exchange primarily due to the change in the value of the Euro compared to the U.S. dollar.
Segment Operating Income (Loss)
Segment operating loss of $8.2 million in fiscal year 2017 increased $8.3 million from $0.1 million of segment operating loss in fiscal year 2016. The increase in the size of the operating loss was primarily attributable to a $8.2 million write down to long-lived assets, a $2.0 million increase in restructuring charges, a $0.4 million decrease in the gain on disposals of fixed assets for fiscal year 2017 compared to fiscal year 2016 and a $0.3 million increase in SG&A expenses. These unfavorable items were partially offset by a $2.7 million improvement in gross margin and a $0.1 million decrease in R&D expenses. The improvement in gross margin was mainly driven by the increase in net sales as well as cost reductions achieved through headcount reductions, manufacturing relocations, operating efficiencies and actions taken to reduce raw material costs across all plants.
50
Liquidity and Capital Resources
Our liquidity needs arise from working capital requirements, acquisitions, capital expenditures, principal and interest payments on debt, and costs associated with the implementation of our restructuring plan. Historically, these cash needs have been met by cash flows from operations, borrowings under credit agreements and existing cash and cash equivalents balances.
Term Loan Credit Agreement
On April 28, 2017, KEMET entered into the Term Loan Credit Agreement by and among the Company, KEC, Bank of America, N.A. as the Administrative Agent and Collateral Agent, Merrill Lynch, Pierce, Fenner & Smith Incorporated, as sole lead arranger and bookrunner and various other lenders thereto from time to time. The Term Loan Credit Agreement provides for a $345.0 million term loan facility. In addition, the Borrowers may request incremental term loan commitments in an aggregate amount not to exceed $50.0 million (together with the initial $345.0 million term loan). The proceeds were used, together with cash on hand, to fund the redemption of all of KEMET’s outstanding 10.5% Senior Notes, which were called for redemption on April 28, 2017. The Term Loans were issued at a price of 97.0% (with an original issue discount of 300 basis points). At the Company’s election, the Term Loans may be made as either Base Rate Term Loans or LIBO Rate Term Loans (each as defined in the Term Loan Credit Agreement). The applicable margin for term loans is 5.0% for Base Rate Term Loans and 6.0% for LIBO Rate Term Loans. All LIBO Rate Term Loans are subject to a pre-margin floor of 1.0%. The Term Loan Credit Agreement contains customary covenants and events of default. The Company also entered into the Security Agreement dated April 28, 2017, by and among the Company, KEC, certain other subsidiaries of the Company, and Bank of America, N.A., as collateral agent, pursuant to which the Company’s obligations under the Term Loan Credit Agreement are secured by a pledge of 65.0% of the outstanding voting stock of certain first-tier subsidiaries organized in Italy, Japan, Mexico and Singapore, and a second lien pledge on the collateral securing KEMET’s revolving credit facility. The obligations of the Company under the Term Loan Credit Agreement are guaranteed by certain of its subsidiaries, including KRC Trade Corporation, KEMET Services Corporation, KBP, and The Forest Electric Company. The Term Loans mature April 28, 2024, and may be extended in accordance with the Term Loan Credit Agreement. The Company may prepay loans under the Term Loan Credit Agreement at any time, subject to certain notice requirements and certain prepayment premiums during the first two years. On a quarterly basis the Company must repay 1.25% of the aggregate principal amount of the initial $345.0 million term loan, or $4.3 million; payments began on September 29, 2017.
The Company currently pays interest on the Term Loan Security Agreement on a monthly basis due to favorable LIBO rates, and as such had only three days interest payable related to the Term Loan Security Agreement included in the line item “Accrued expenses” on its Consolidated balance sheets of $0.2 million and zero as of March 31, 2018 and 2017.
Revolving Line of Credit
In connection with the closing of the new Term Loan Credit Agreement, KEC also entered into the Loan Amendment. The Loan Amendment increases the facility amount to $75.0 million and provides KEC with lower applicable interest rate margins and the ability to complete the refinancing pursuant to the new Term Loan Credit Agreement. As part of the overall refinancing, KEC also repaid all amounts outstanding under the Loan Amendment.
10.5% Senior Notes
On April 28, 2017, the Company repurchased and retired the full outstanding balance of $353.0 million of its 10.5% Senior Notes due May 1, 2018 (the “10.5% Senior Notes”). The Company had interest payable related to the 10.5% Senior Notes included in the line item “Accrued expenses” on its Consolidated balance sheets of zero and $15.4 million as of March 31, 2018 and 2017, respectively.
Other Debt
In January 2017, KEMET Electronics Portugal, S.A., a wholly owned subsidiary received the first part of an interest free loan from the Portuguese Government in the amount of EUR 2.2 million (or $2.5 million) to be used for fixed asset purchases. In July 2017, KEMET Electronics Portugal, S.A. received the second part of the loan in the amount of EUR 277 thousand (or $325 thousand). The loan has a total term of eight years ending February 1, 2025. The loan will be repaid through semi-annual payments beginning on August 1, 2019. The first payment will be in the amount of EUR 185 thousand (or $211 thousand) beginning on August 1, 2019 and the remaining payments will be in the amount of EUR 210 thousand (or $248 thousand). Since the debt is non-interest bearing, we have recorded a debt discount in the amount of EUR 0.6 million (or $0.7 million) with an offsetting reduction to fixed assets. This discount will be amortized over the life of the loan through interest expense. If certain conditions are met, such as increased headcount, increased revenue and increased gross value added, a portion of the loan could be forgiven during fiscal year 2020.
51
In September 2017, TOKIN received a short term borrowing pursuant to an overdraft agreement with The 77 Bank Limited, located in Japan, in the amount of 350 million yen (or $3.3 million), at an interest rate of 0.53% (JBA TIBOR + 40 basis points). The loan is due September 2018, and the loan agreement automatically renews if both parties choose not to terminate or modify it.
Short-term Liquidity
Cash and cash equivalents of $286.8 million as of March 31, 2018 increased $177.1 million from $109.8 million as of March 31, 2017. Our net working capital (current assets less current liabilities) increased $142.7 million, with the balance as of March 31, 2018 of $391.6 million compared to $248.9 million of net working capital as of March 31, 2017, with the increase primarily driven by the cash holdings of TOKIN. Cash and cash equivalents held by our foreign subsidiaries totaled $196.8 million and $35.0 million at March 31, 2018 and March 31, 2017, respectively, with the increase primarily driven by cash holdings of TOKIN. Our operating income outside the U.S. is no longer deemed to be permanently reinvested in foreign jurisdictions. However, we currently do not intend nor foresee a need to repatriate cash and cash equivalents held by foreign subsidiaries. If these funds are needed for our operations in the U.S., we may be required to accrue U.S. withholding taxes on the distributed foreign earnings.
Based on our current operating plans, we believe domestic cash and cash equivalents, including expected cash generated from operations, are sufficient to fund our operating requirements for at least the next twelve months, including $23.8 million in interest payments, $17.2 million in debt principal payments, $80.0 to $100.0 million in expected capital expenditures and $14.8 million in restructuring payments. As of March 31, 2018, our borrowing capacity, which is based on factors including outstanding eligible accounts receivable, inventory and equipment collateral, under the revolving line of credit was $64.7 million. The revolving line of credit expires on April 28, 2022.
Our cash and cash equivalents increased by $177.1 million during the year ended March 31, 2018, as compared to an increase of $44.8 million during the year ended March 31, 2017 and an increase of $8.6 million during the year ended March 31, 2016 as follows (amounts in thousands):
Fiscal Years Ended March 31, | ||||||||||||
2018 | 2017 | 2016 | ||||||||||
Net cash provided by (used in) operating activities | $ | 120,860 | $ | 71,667 | $ | 32,365 | ||||||
Net cash provided by (used in) investing activities | 102,364 | (25,598 | ) | (20,588 | ) | |||||||
Net cash provided by (used in) financing activities | (55,798 | ) | (125 | ) | (3,803 | ) | ||||||
Effect of foreign currency fluctuations on cash | 9,646 | (1,174 | ) | 668 | ||||||||
Net increase (decrease) in cash and cash equivalents | $ | 177,072 | $ | 44,770 | $ | 8,642 | ||||||
Fiscal Year 2018 compared to Fiscal Year 2017
Operations
In fiscal year 2018, cash provided by operating activities totaled $120.9 million, representing a $49.2 million improvement compared to cash provided by operating activities of $71.7 million in fiscal year 2017. Contributing to the positive changes in cash was a $63.5 million increase in operating cash flows led by an improvement in net income (loss) net of the following non-cash income statement items: depreciation and amortization, change in value of TOKIN options, (income) loss from equity method investments, acquisition gains, net gain (loss) on write down and disposals of long-lived assets, non-cash debt and financing costs, stock-based compensation expense, receivable write down, pension and other post-retirement benefits, gain on early extinguishment of debt, rent receivable, and deferred income taxes for fiscal year 2018 compared to fiscal year 2017.
Also contributing to the positive changes in cash was a $5.6 million increase in cash from operating assets, excluding foreign currency exchange, comprised of the following:
• | In fiscal year 2018, a decrease in accounts receivable generated $30.1 million in cash, compared to fiscal year 2017, during which an increase in accounts receivable used $12 thousand in cash. The primary reason for the change in accounts receivable is due to the timing of customer receipts. |
• | In fiscal year 2018, a decrease in prepaid and other current assets generated $4.3 million in cash, compared to fiscal year 2017, during which an increase in prepaid and other current assets used $1.8 million in cash. |
52
• | Offsetting these improvements in fiscal year 2018, an increase in inventory used $13.8 million in cash, compared to fiscal year 2017, during which a decrease in inventory generated $16.8 million in cash. The primary reason for the change in inventory is increased customer demand. |
Offsetting the positive changes in cash was a $19.9 million decrease in cash from operating liabilities, excluding foreign currency exchange, comprised of the following:
• | In fiscal year 2018, a decrease in accounts payable used $16.1 million in cash, compared to fiscal year 2017, during which an increase in accounts payable generated $6.2 million in cash. The primary reason for the change in accounts payable is due to the timing of supplier payments. |
• | In fiscal year 2018, an increase in accrued expenses generated $0.1 million in cash, compared to fiscal year 2017, during which an decrease in accrued expenses used $1.1 million in cash. |
• | In fiscal year 2018, an increase in accrued income taxes generated $1.3 million in cash, compared to fiscal year 2017, during which an increase in accrued income taxes generated $0.1 million in cash. |
Investing
Cash provided by investing activities was $102.4 million in fiscal year 2018 compared to cash used in investing activities of $25.6 million in fiscal year 2017.
Cash provided by investing activities in fiscal year 2018 was primarily related to the acquisition of TOKIN, net of cash received, of $164.0 million in positive cash flow in fiscal year 2018. Additionally, we had proceeds from sale of assets of $3.6 million and dividend proceeds of $2.7 million. This was partially offset by cash used for capital expenditures of $65.0 million primarily related to expanding capacity at our manufacturing facilities in Mexico, Portugal, China, Thailand and Japan, as well as for information technology projects in Simpsonville, South Carolina and for our investment in Novasentis of $3.0 million.
Cash used in investing activities in fiscal year 2017 included capital expenditures of $25.6 million primarily related to expanding capacity at our manufacturing facilities in Mexico, Italy, Portugal, and China.
Financing
Cash used in financing activities of $55.8 million in fiscal year 2018 increased $55.7 million from cash used in financing activities of $0.1 million in fiscal year 2017.
In fiscal year 2018, we used $353.0 million to repay the remaining outstanding balance of our 10.5% Senior Notes, $33.9 million to repay the remaining outstanding balance of the revolving line of credit, and made three quarterly payments on the Term Loan Credit Agreement of $4.3 million for a total of $12.9 million. We received $329.7 million in proceeds from the Term Loan Credit Agreement, net of discount, bank issuance costs, and other indirect issuance costs; received proceeds from the exercise of stock warrants and stock options which generated $8.8 million and $5.2 million in cash, respectively, and received proceeds on an interest free loan from the Portuguese Government of $0.3 million.
In fiscal year 2017, we used $0.1 million for net payments on long-term debt, used $1.1 million for the purchase of treasury stock, and generated $1.1 million from the exercise of stock options.
Fiscal Year 2017 compared to Fiscal Year 2016
Operations
In fiscal year 2017, cash provided by operating activities totaled $71.7 million, representing a $39.3 million improvement compared to cash provided by operating activities of $32.4 million in fiscal year 2016. Contributing to the positive changes in cash was a $13.5 million increase in operating cash flows led by an improvement in net income (loss) net of the following non-cash income statement items: depreciation and amortization, change in value of TOKIN options, equity (income) loss from TOKIN, write down of long-lived assets, non-cash debt and financing costs, stock-based compensation expense, receivable write down, net (gain) loss on sales and disposals of assets, pension and other post-retirement benefits, and deferred income taxes for fiscal year 2017 compared to fiscal year 2016.
Also contributing to the positive changes in cash was a $25.4 million improvement in cash from operating liabilities, excluding foreign currency exchange, primarily due to using $13.8 million of cash to reduce accrued expenses during fiscal year 2016 compared to only using $1.1 million of cash to reduce accrued expenses during fiscal year 2017. The primary reason for the change in accrued expenses is due to a $7.7 million increase for our incentive-based compensation largely related to
53
performance improvements. Additionally, accounts payable increased by $6.2 million in fiscal year 2017, whereas in fiscal year 2016, accounts payable decreased by $6.0 million, primarily due to the timing of supplier payments.
A final driver to the positive changes in cash was a $0.4 million improvement in cash from operating assets, excluding foreign currency exchange, primarily due to a decrease in inventory of $16.8 million for fiscal year 2017, compared to a $3.3 million decrease for fiscal year 2016. The decrease in inventory for fiscal year 2017 was primarily related to continued improvements related to vertical integration of the Tantalum product line supply chain. Offsetting this improvement, prepaid and other current assets increased by $1.8 million in fiscal year 2017, whereas in fiscal year 2016, prepaid expenses and other current assets decreased by $13.6 million, primarily driven by a decrease in value-added-tax receivable.
Investing
Cash used in investing activities was $25.6 million in fiscal year 2017 compared to cash used in investing activities of $20.6 million in fiscal year 2016.
Cash used in investing activities in fiscal year 2017 included capital expenditures of $25.6 million primarily related to expanding capacity at our manufacturing facilities in Monterrey and Matamoros, Mexico; Pontecchio, Italy; Evora, Portugal; and Suzhou, China.
Cash used for investing activities in fiscal year 2016 included capital expenditures of $20.5 million, and $2.9 million in acquisition payments net of cash received related to the acquisition of Intellidata. Capital expenditures were primarily related to expanding capacity at our manufacturing facilities in Suzhou, China; Pontecchio, Italy; Gränna, Sweden; Matamoros, Mexico; and Evora, Portugal as well as information technology capital projects. Offsetting these uses of cash were $1.8 million due to the release of restricted cash and $1.0 million in proceeds from the sale of assets.
Financing
Cash used in financing activities of $0.1 million in fiscal year 2017 decreased $3.7 million from cash used in financing activities of $3.8 million in fiscal year 2016.
In fiscal year 2017, we used $0.1 million for net payments of long-term debt, used $1.1 million for purchase of treasury stock and generated $1.1 million from exercise of stock options.
In fiscal year 2016, we used $3.0 million for deferred acquisition payments related to the Intellidata acquisition, $0.5 million for payments of long term debt, and $0.7 million for purchase of treasury stock, and received $0.4 million in net proceeds from the revolving line of credit.
54
Commitments
At March 31, 2018, we had contractual obligations in the form of non-cancellable operating leases and debt, including interest payments (see Note 3, “Debt” and Note 15, “Commitments and Contingencies” to our consolidated financial statements), European social security, pension benefits, other post-retirement benefits, inventory purchase obligations, fixed asset purchase obligations, acquisition related obligations, and construction obligations as follows (amounts in thousands):
Payment Due by Period | ||||||||||||||||||||
Contractual obligations | Total | Year 1 | Years 2 - 3 | Years 4 - 5 | More than 5 years | |||||||||||||||
Debt obligations (1) | $ | 338,430 | $ | 20,540 | $ | 35,505 | $ | 35,536 | $ | 246,849 | ||||||||||
Interest obligations (1) | 126,694 | 23,823 | 44,158 | 39,364 | 19,349 | |||||||||||||||
Operating lease obligations | 33,846 | 9,558 | 8,642 | 4,908 | 10,738 | |||||||||||||||
Pension and other post-retirement benefits (2) | 101,088 | 9,023 | 15,003 | 19,246 | 57,816 | |||||||||||||||
Employee separation liability | 8,539 | 875 | 739 | 739 | 6,186 | |||||||||||||||
Restructuring liability | 9,959 | 8,719 | 1,240 | — | — | |||||||||||||||
Purchase commitments | 4,023 | 4,023 | — | — | — | |||||||||||||||
Capital lease obligations | 1,183 | 579 | 543 | 59 | 2 | |||||||||||||||
Anti-trust fines and settlements (3) | 64,093 | 30,552 | 24,516 | 9,025 | — | |||||||||||||||
Total | $ | 687,855 | $ | 107,692 | $ | 130,346 | $ | 108,877 | $ | 340,940 | ||||||||||
_______________________________________________________________________________
(1)The Term Loans mature April 28, 2024 and the applicable margin for the term loans is 5.0% for Base Rate Term Loans (as defined in the Term Loan Credit Agreement) and 6.0% for LIBO Rate Term Loans (as defined in the Term Loan Credit Agreement), see Note 3, “Debt” for additional information.
(2) Reflects expected benefit payments through 2028.
(3) In addition to amounts reflected in the table, an additional $12.6 million has been recorded in the line item "Accrued expenses," for which the timing of payment has not been determined.
Derivative Investments
Certain operating expenses at the Company’s Mexican facilities are paid in Mexican Pesos or Japanese Yen, and certain sales in the Company's European operations are transacted in Euros. In order to hedge these forecasted cash flows, the Company may decide to purchase foreign exchange contracts to buy Mexican Pesos, buy Japanese Yen, or sell Euros for periods and amounts consistent with the underlying cash flow exposures. At March 31, 2018, the Company had outstanding forward exchange contracts with maturities of less than twelve months to purchase Mexican Pesos with notional amounts of $70.6 million. The fair value of these contracts at March 31, 2018 totaled $1.2 million and was recorded as a derivative asset on the Consolidated Balance Sheets under the line item “Other Current Assets.” As of March 31, 2018, KEMET does not have any contracts outstanding for Japanese Yen, or Euros. See Note 12, “Derivatives” for further discussion of derivative financial instruments.
Uncertain Income Tax Positions
We have recognized a liability for our unrecognized uncertain income tax positions of approximately $5.7 million as of March 31, 2018. The ultimate resolution and timing of payment for remaining matters continues to be uncertain and are, therefore, excluded from the above table.
Non-GAAP Financial Measures
To complement our consolidated statements of operations and cash flows, we use non-GAAP financial measures of Adjusted gross margin, Adjusted operating income (loss), Adjusted net income (loss) and Adjusted EBITDA. We believe that Adjusted gross margin, Adjusted operating income (loss), Adjusted net income (loss) and Adjusted EBITDA are complements to U.S. GAAP amounts and such measures are useful to investors. The presentation of these non-GAAP measures is not meant to be considered in isolation or as an alternative to net income (loss) as an indicator of our performance, or as an alternative to cash flows from operating activities as a measure of liquidity.
55
The following table provides a reconciliation from U.S. GAAP Gross margin to Non-U.S. GAAP Adjusted gross margin (amounts in thousands):
_______________________________________________________________________________
Fiscal Years Ended March 31, | ||||||||||||
2018 | 2017 | 2016 | ||||||||||
Net sales | $ | 1,199,926 | $ | 757,791 | $ | 734,823 | ||||||
Cost of sales | 859,533 | 570,864 | 571,011 | |||||||||
Gross Margin (U.S. GAAP) (1) | 340,393 | 186,927 | 163,812 | |||||||||
Gross margin as a % of net sales | 28.4 | % | 24.7 | % | 22.3 | % | ||||||
Non-U.S. GAAP-adjustments: | ||||||||||||
Plant shut-down costs | — | — | 372 | |||||||||
Plant start-up costs | 929 | 427 | 861 | |||||||||
Stock-based compensation expense | 1,519 | 1,384 | 1,418 | |||||||||
Adjusted gross margin (non-GAAP) (1) | $ | 342,841 | $ | 188,738 | $ | 166,463 | ||||||
Adjusted gross margin as a % of net sales | 28.6 | % | 24.9 | % | 22.7 | % | ||||||
(1) Fiscal years ending March 31, 2017 and 2016 adjusted due to the adoption of ASU No. 2017-07
The following table provides reconciliation from U.S. GAAP Operating income (loss) to non-U.S. GAAP Adjusted operating income (loss) (amounts in thousands):
_______________________________________________________________________________
Fiscal Years Ended March 31, | ||||||||||||
2018 | 2017 | 2016 | ||||||||||
Operating income (loss) (1) | $ | 113,303 | $ | 35,796 | $ | 33,833 | ||||||
Adjustments: | ||||||||||||
(Gain) loss on write down and disposal of long-lived assets | (992 | ) | 10,671 | 375 | ||||||||
ERP integration costs/IT transition costs | 80 | 7,045 | 5,677 | |||||||||
Stock-based compensation | 7,657 | 4,720 | 4,774 | |||||||||
Restructuring charges | 14,843 | 5,404 | 4,178 | |||||||||
Legal expenses/fines related to antitrust class actions | 6,736 | 2,640 | 3,041 | |||||||||
TOKIN investment-related expenses | — | 1,101 | 900 | |||||||||
Plant start-up costs | 929 | 427 | 861 | |||||||||
Plant shut-down costs | — | — | 372 | |||||||||
Pension plan adjustment | — | — | 312 | |||||||||
Adjusted operating income (loss) | $ | 142,556 | $ | 67,804 | $ | 54,323 | ||||||
(1) Fiscal years ending March 31, 2017 and 2016 adjusted due to the adoption of ASU No. 2017-07
56
The following table provides a reconciliation from U.S. GAAP Net income (loss) to non-U.S. GAAP Adjusted net income (loss) (amounts in thousands):
Fiscal Years Ended March 31, | ||||||||||||
2018 | 2017 | 2016 | ||||||||||
Net income (loss) (U.S. GAAP) | $ | 254,529 | $ | 47,989 | $ | (53,629 | ) | |||||
Adjustments: | ||||||||||||
Equity (income) loss from equity method investments | (76,192 | ) | (41,643 | ) | 16,406 | |||||||
Acquisition (gain) loss | (130,880 | ) | — | — | ||||||||
Change in value of TOKIN options | — | (10,700 | ) | 26,300 | ||||||||
(Gain) loss on write down and disposal of long-lived assets | (992 | ) | 10,671 | 375 | ||||||||
Restructuring charges | 14,843 | 5,404 | 4,178 | |||||||||
ERP integration costs/IT transition costs | 80 | 7,045 | 5,677 | |||||||||
Stock-based compensation | 7,657 | 4,720 | 4,774 | |||||||||
Legal expenses/fines related to antitrust class actions | 16,636 | 2,640 | 3,041 | |||||||||
Net foreign exchange (gain) loss | 13,145 | (3,758 | ) | (3,036 | ) | |||||||
TOKIN investment-related expenses | — | 1,101 | 900 | |||||||||
Income tax effect on pension curtailment | — | — | 875 | |||||||||
Plant start-up costs | 929 | 427 | 861 | |||||||||
Amortization included in interest expense | 2,467 | 761 | 859 | |||||||||
Plant shut-down costs | — | — | 372 | |||||||||
Pension plan adjustment | — | — | 312 | |||||||||
Income tax effect of non-GAAP adjustments | (30 | ) | (741 | ) | 652 | |||||||
(Gain) loss on early extinguishment of debt | 486 | — | — | |||||||||
Adjusted net income (loss) | $ | 102,678 | $ | 23,916 | $ | 8,917 | ||||||
57
The following table provides reconciliation from U.S. GAAP Net income (loss) to non-U.S. GAAP Adjusted EBITDA (amounts in thousands):
Fiscal Years Ended March 31, | ||||||||||||
2018 | 2017 | 2016 | ||||||||||
Net income (loss) | $ | 254,529 | $ | 47,989 | $ | (53,629 | ) | |||||
Adjustments: | ||||||||||||
Income tax expense (benefit) | 9,181 | 4,290 | 6,006 | |||||||||
Interest expense, net | 32,073 | 39,731 | 39,591 | |||||||||
Depreciation and amortization | 49,755 | 37,338 | 39,016 | |||||||||
Equity (income) loss from equity method investments | (76,192 | ) | (41,643 | ) | 16,406 | |||||||
Acquisition (gain) loss | (130,880 | ) | — | — | ||||||||
Change in value of TOKIN options | — | (10,700 | ) | 26,300 | ||||||||
(Gain) loss on write down and disposal of long-lived assets | (992 | ) | 10,671 | 375 | ||||||||
ERP integration costs/IT transition costs | 80 | 7,045 | 5,677 | |||||||||
Stock-based compensation | 7,657 | 4,720 | 4,774 | |||||||||
Restructuring charges | 14,843 | 5,404 | 4,178 | |||||||||
Legal expenses/fines related to antitrust class actions | 16,636 | 2,640 | 3,041 | |||||||||
Net foreign exchange (gain) loss | 13,145 | (3,758 | ) | (3,036 | ) | |||||||
TOKIN investment-related expenses | — | 1,101 | 900 | |||||||||
Plant start-up costs | 929 | 427 | 861 | |||||||||
Plant shut-down costs | — | — | 372 | |||||||||
Pension plan adjustment | — | — | 312 | |||||||||
(Gain) loss on early extinguishment of debt | 486 | — | — | |||||||||
Adjusted EBITDA | $ | 191,250 | $ | 105,255 | $ | 91,144 | ||||||
Adjusted gross margin represents net sales less cost of sales excluding adjustments which are outlined in the quantitative reconciliation provided above. Management uses Adjusted gross margin to facilitate our analysis and understanding of our business operations by excluding the items outlined in the quantitative reconciliation provided above which might otherwise make comparisons of our ongoing business with prior periods more difficult and obscure trends in ongoing operations. The Company believes that Adjusted gross margin is useful to investors because it provides a supplemental way to understand the underlying operating performance of the Company. Adjusted gross margin should not be considered as an alternative to gross margin or any other performance measure derived in accordance with U.S. GAAP.
Adjusted operating income (loss) represents operating income (loss), excluding adjustments which are outlined in the quantitative reconciliation provided above. We use Adjusted operating income (loss) to facilitate our analysis and understanding of our business operations by excluding the items outlined in the quantitative reconciliation provided above which might otherwise make comparisons of our ongoing business with prior periods more difficult and obscure trends in ongoing operations. The Company believes that Adjusted operating income (loss) is useful to investors because it provides a supplemental way to understand the underlying operating performance of the Company and allows investors to monitor and understand changes in our ability to generate income from ongoing operations.
Adjusted operating income (loss) should not be considered as an alternative to operating income (loss) or any other performance measure derived in accordance with U.S. GAAP.
Adjusted net income (loss) represents net income (loss), excluding adjustments which are outlined in the quantitative reconciliation provided above. We use Adjusted net income (loss) to evaluate the Company’s operating performance by excluding the items outlined in the quantitative reconciliation provided above which might otherwise make comparisons of our ongoing business with prior periods more difficult and obscure trends in ongoing operations. The Company believes that adjusted net income (loss) is useful to investors because it provides a supplemental way to understand the underlying operating performance of the Company and allows investors to monitor and understand changes in our ability to generate income from ongoing operations. Adjusted net income (loss) should not be considered as an alternative to net income (loss), operating income (loss) or any other performance measures derived in accordance with U.S. GAAP.
58
Adjusted EBITDA represents net income (loss) before income tax expense, interest expense, net, and depreciation and amortization, excluding adjustments which are outlined in the quantitative reconciliation provided above. We present Adjusted EBITDA as a supplemental measure of our performance and ability to service debt. We also present adjusted EBITDA because we believe such measure is frequently used by securities analysts, investors and other interested parties in the evaluation of companies in our industry.
We believe adjusted EBITDA is an appropriate supplemental measure of debt service capacity because cash expenditures on interest are, by definition, available to pay interest, and tax expense is inversely correlated to interest expense because tax expense goes down as deductible interest expense goes up; depreciation and amortization are non-cash charges. The other items excluded from adjusted EBITDA are excluded in order to better reflect our continuing operations.
In evaluating adjusted EBITDA, one should be aware that in the future we may incur expenses similar to the adjustments noted above. Our presentation of adjusted EBITDA should not be construed as an inference that our future results will be unaffected by these types of adjustments. Adjusted EBITDA is not a measurement of our financial performance under U.S. GAAP and should not be considered as an alternative to net income (loss), operating income (loss) or any other performance measures derived in accordance with U.S. GAAP or as an alternative to cash flow from operating activities as a measure of our liquidity.
Our adjusted EBITDA measure has limitations as an analytical tool, and you should not consider it in isolation or as a substitute for analysis of our results as reported under U.S. GAAP. Some of these limitations are:
• | it does not reflect our cash expenditures, future requirements for capital expenditures or contractual commitments; |
• | it does not reflect changes in, or cash requirements for, our working capital needs; |
• | it does not reflect the significant interest expense or the cash requirements necessary to service interest or principal payments on our debt; |
• | although depreciation and amortization are non-cash charges, the assets being depreciated and amortized will often have to be replaced in the future, and our adjusted EBITDA measure does not reflect any cash requirements for such replacements; |
• | it is not adjusted for all non-cash income or expense items that are reflected in our statements of cash flows; |
• | it does not reflect the impact of earnings or charges resulting from matters we consider not to be indicative of our ongoing operations; |
• | it does not reflect limitations on or costs related to transferring earnings from our subsidiaries to us; and |
• | other companies in our industry may calculate this measure differently than we do, limiting its usefulness as a comparative measure. |
Because of these limitations, adjusted EBITDA should not be considered as a measure of discretionary cash available to us to invest in the growth of our business or as a measure of cash that will be available to us to meet our obligations. You should compensate for these limitations by relying primarily on our U.S. GAAP results and using adjusted EBITDA only supplementary.
Recent Accounting Pronouncements
In March 2018, the Financial Accounting Standards Board ("FASB") issued Accounting Standards Update (“ASU”) No. 2018-05, Amendments to SEC Paragraphs Pursuant to SEC Staff Accounting Bulletin (SAB) No. 118. The ASU adds seven paragraphs to ASU 740, Income Taxes, that contain SEC guidance related to SAB 118, Income Tax Implications of the Tax Cuts and Jobs Act (the "Act"). The update clarifies that if accounting for certain income tax effects of the Act are not completed by the time a company issues its financial statements that includes the reporting period in which the Act was enacted, the staff would not object to a company including a reasonable estimate of the tax effects in its financial statements. The staff believes a reasonable estimate of the tax effect should be included in a company's financial statements in the first reporting period in which the company is able to determine a reasonable estimate. At March 31, 2018, the Company has not completed its accounting for the tax effects of enactment of the Act; however, the Company has initially determined a $0.8 million tax benefit impact related to the US federal corporate tax rate change to its existing deferred tax balances, which is included as a component of income tax expense from continuing operations for the year ended March 31, 2018. The Company estimates no tax impact from the estimated transition tax repatriation charge of $79.3 million due to net operating loss utilization and a valuation allowance in the U.S. There is no impact to foreign locations. The Company has not been able to finalize the estimate for the one-time transition tax and will continue to account to this item based on its existing accounting under ASC 740,
59
Income Taxes. Additionally, the Act subjects a U.S. shareholder to tax on Global Intangible Low-Taxed Income (“GILTI”) earned by certain foreign subsidiaries. The Company can make an accounting policy election to either treat taxes due on the GILTI as a current period expense or factor such amounts into our measurement of deferred taxes. Given the complexity of the GILTI provisions, the Company is still evaluating and has not yet determined its accounting policy. GILTI will not be applicable to the Company until fiscal year 2019.
In August 2017, the FASB issued ASU No. 2017-12, Targeted Improvements to Accounting for Hedging Activities. The update amends and simplifies existing guidance in order to allow companies to more accurately present the economic effects or risk management activities in the financial statements. The effective date of this update is for fiscal years, and interim periods within those fiscal years, beginning after December 15, 2018, with early adoption permitted. The Company is currently evaluating the impact of the adoption of this guidance on the Company's consolidated financial statements.
In March 2017, the FASB issued ASU No. 2017-07, Improving the Presentation of Net Periodic Pension Cost and Net Periodic Postretirement Benefit Cost. The update requires employers to report the service cost component in the same line item or items as other compensation costs arising from services rendered by the pertinent employees during the period. The other components of net benefit cost are required to be presented in the income statement separately from the service cost component and outside a subtotal of Operating income. The effective date of this update is for fiscal years, and interim periods within those fiscal years, beginning after December 15, 2017, with early adoption permitted. The update requires retrospective application to all periods presented. The Company adopted this guidance in the first quarter of fiscal year 2018; the adoption of this guidance had an immaterial impact on the Company's consolidated financial statements.
In January 2017, the FASB issued ASU No. 2017-04, Intangibles - Goodwill and Other. The update eliminates the requirement to calculate the implied fair value of goodwill to measure the amount of impairment loss, if any, under the second step of the current goodwill impairment test. Under the update, the goodwill impairment loss would be measured as the amount by which a reporting unit’s carrying value exceeds its fair value, not to exceed the carrying amount of goodwill. The effective date of this update is for annual reporting periods beginning after December 15, 2019, with early adoption permitted. The Company is currently evaluating the impact of the adoption of this guidance on the Company’s consolidated financial statements, however the adoption of this guidance is not expected to have a significant effect on the Company's consolidated financial position, results of operations, or cash flows.
In October 2016, the FASB issued ASU No. 2016-16, Income Taxes - Intra-Entity Transfers of Assets Other Than Inventory. The update requires entities to recognize the income tax consequences of many intercompany asset transfers at the transaction date. The seller and buyer will immediately recognize the current and deferred income tax consequences of an intercompany transfer of an asset other than inventory. The tax consequences were previously deferred. The effective date of this update is for fiscal years, and interim periods within those fiscal years, beginning after December 15, 2017, with early adoption permitted. The update requires modified retrospective transition method which is a cumulative effect adjustment to retained earnings as of the beginning of the first effective reporting period. The Company adopted this guidance as of April 1, 2017 and recorded a cumulative effect adjustment to retained earnings of $203 thousand.
In August 2016, the FASB issued ASU No. 2016-15, Statement of Cash Flows (Topic 230): Classification of Certain Cash Receipts and Cash Payments. The update clarifies how cash receipts and cash payments in certain transactions are presented and classified in the statement of cash flows. The effective date of this update is for fiscal years, and interim periods within those fiscal years, beginning after December 15, 2017, with early adoption permitted. The update requires retrospective application to all periods presented but may be applied prospectively if retrospective application is impracticable. The Company is currently evaluating the impact of the adoption of this guidance on the Company’s consolidated financial statements, however, the adoption of this guidance is not expected to have a significant effect on the Company's consolidated financial position, results of operations, or cash flows.
In March 2016, the FASB issued ASU No. 2016-09, Compensation-Stock Compensation. This guidance changes several aspects of the accounting for share-based payment award transactions, including: (1) Accounting and Cash Flow Classification for Excess Tax Benefits and Deficiencies, (2) Forfeitures, and (3) Tax Withholding Requirements and Cash Flow Classification. This ASU is effective for fiscal years and interim periods within those years beginning after December 15, 2016. Early application is permitted, and KEMET adopted ASU No. 2016-09 as of April 1, 2016. The Company elected to discontinue estimating forfeitures that are expected to occur and recorded a cumulative effect adjustment to retained earnings of $130 thousand as of April 1, 2016. There was no cumulative adjustment related to the excess tax benefits as the Company did not have an additional paid in capital pool of excess tax benefits. The adoption did not have a significant impact on the Company’s consolidated financial statements.
In February 2016, the FASB issued ASU No. 2016-02, Leases, as modified by ASU 2017-03, Transition and Open Effective Date Information, requiring lessees to record a right-of-use asset and a lease liability for all leases with lease terms of more than twelve months. The accounting standards update also requires expanded disclosures to help financial statement users
60
better understand the amount, timing and uncertainty of cash flows arising from leases. The change will be effective on a modified retrospective basis for fiscal years beginning after December 15, 2018, and interim periods within those years, with early adoption permitted. We are currently evaluating the impact of this standard on our financial statements, disclosures, internal controls, and accounting policies. We have implemented a third-party supported lease accounting software solution to account for our leases. We have begun a project to implement this system and are currently collecting the necessary information on our lease population, establishing a new lease accounting process and designing new internal controls for the new process. We do not plan to early adopt the standard. We believe the impact will be material on the consolidated financial statements as all leases will be recognized as a right of use asset and lease obligation.
In July 2015, the FASB issued ASU No. 2015-11, Simplifying the Measurement of Inventory. The ASU requires an entity that uses first-in, first-out or average cost to measure its inventory at the lower of cost or net realizable value. Net realizable value is the estimated selling price in the ordinary course of business, less reasonably predictable costs of completion, disposal, and transportation. ASU 2015-11 was effective for interim and annual reporting periods beginning April 1, 2016. The adoption of ASU 2015-11 did not materially impact the Company’s operating results and financial position.
In May 2014, the FASB issued ASU No. 2014-09, Revenue from Contracts with Customers, which supersedes existing accounting standards for revenue recognition and creates a single framework. The new guidance requires either a retrospective or a modified retrospective approach at adoption. Additional updates to Topic 606 issued by the FASB in 2015, 2016 and 2017 include the following:
• | ASU No. 2015-14, Revenue from Contracts with Customers (Topic 606): Deferral of the Effective Date, which defers the effective date of the new guidance such that the new provisions will now be required for fiscal years, and interim periods within those years, beginning after December 15, 2017 (ASU No. 2015-14 is effective for the Company’s fiscal year that begins on April 1, 2018 and interim periods within that fiscal year). |
• | ASU No. 2016-08, Revenue from Contracts with Customers (Topic 606): Principal versus Agent Considerations, which clarifies the implementation guidance on principal versus agent considerations (reporting revenue gross versus net). |
• | ASU No. 2016-10, Revenue from Contracts with Customers (Topic 606): Identifying Performance Obligations and Licensing, which clarifies the implementation guidance on identifying performance obligations and classifying licensing arrangements. |
• | ASU No. 2016-12, Revenue from Contracts with Customers (Topic 606): Narrow-Scope Improvements and Practical Expedients, which clarifies the implementation guidance in a number of other areas. |
• | ASU No. 2016-20, Technical Corrections and Improvements to (Topic 606): Revenue from Contracts with Customers. |
• | ASU No. 2017-13, Revenue Recognition (Topic 605), Revenue from Contracts with Customers (Topic 606), Leases (Topic 840), and Leases (Topic 842): Provides additional implementation guidance on the previously issued ASU 2014-09. |
• | ASU No. 2017-14, Income Statement-Reporting Comprehensive Income (Topic 220), Revenue Recognition (Topic 605), and Revenue from Contracts with Customers (Topic 606). ASU 2017-14 includes amendments to certain SEC paragraphs within the FASB Accounting Standards Codification. |
The effective date of this guidance is for fiscal years, and interim periods within those fiscal years, beginning after December 15, 2018, with early adoption permitted. The Company has completed the assessment phase, applied the principles of the new standard using the five step method to material customer contracts, and held discussions with key stakeholders and management. The Company has finalized changes to accounting policies and internal controls over financial reporting. Key changes in the ASU which impact the Company's revenue recognition include certain customer tooling contracts primarily within the original equipment manufacturers ("OEM") channel and the deferral of incremental costs to fulfill a contract. The Company will adopt the requirements of the new standard on a full retrospective basis during the three month period ended June 30, 2018.
There are currently no other accounting standards that have been issued that will have a significant impact on the Company’s financial position, results of operations or cash flows upon adoption.
Effect of Inflation
Inflation generally affects us by increasing the cost of labor, equipment, and raw materials. We do not believe that inflation has had any material effect on our business over the past three fiscal years except for the following discussion in Commodity Price Risk.
61
ITEM 7A. QUANTITATIVE AND QUALITATIVE DISCLOSURES ABOUT MARKET RISK.
Interest Rate Risk
On April 28, 2017, KEMET entered into a $345.0 million Term Loan Credit Agreement that has a variable interest rate. As of March 31, 2018, the term loan had a carrying amount of $318.8 million and an outstanding principal balance of $332.1 million. We are exposed to interest rate risk through the Term Loan, and a 1 percent change in the interest rate would yield a $3.3 million change in interest expense on an annualized basis.
Foreign Currency Exchange Rate Risk
Given our international operations and sales, we are exposed to movements in foreign exchange rates. Of these, the most significant are currently the Euro, Japanese Yen, Thai Baht, and Mexican Peso. A portion of our sales to our customers and operating costs in Europe, Japan, and Thailand are denominated in Euro, Japanese Yen, and Thai Baht, respectively, creating an exposure to foreign currency exchange rates. Also, a portion of our costs in our operations in Mexico are denominated in Mexican Pesos, creating an exposure to foreign currency exchange rates. Additionally, certain of our non-U.S. subsidiaries make sales denominated in U.S. dollars which expose them to foreign currency transaction gains and losses. Historically, in order to minimize our exposure, we periodically entered into forward foreign exchange contracts in which the future cash flows were hedged against the U.S. dollar (see Note 12, “Derivatives” to the consolidated financial statements).
A 10 percent weakening or strengthening of the U.S. dollar in relation to the foreign currencies we transact in would result in approximately a $12.9 million increase or a $10.9 million decrease to our net income (loss), respectively.
Commodity Price Risk
As a result of our tantalum vertical integration efforts which began in fiscal year 2012, we have reduced our exposure to price volatility and supply uncertainty in the tantalum supply chain. A majority of our tantalum needs are now met through our direct sourcing of conflict free tantalum ore or tantalum scrap reclaim, which is then processed into the intermediate product potassium heptafluorotantalate (commonly known as K-salt) at our own facility in Mexico, before final processing into tantalum powder at KBP. Price increases for tantalum ore, or for the remaining tantalum powder that we source from third parties, could impact our financial performance as we may be unable to pass all such price increases on to our customers.
Silver and aluminum have generally been available in sufficient quantities, and we believe there are a sufficient number of suppliers from which we can purchase our requirements. An increase in the price of silver and aluminum that we are unable to pass on to our customers, however, could have an adverse effect on our profitability.
To evaluate the impact of price changes in precious metals on net income (loss) we used the following assumptions: the selling prices of our products would not be impacted, all the precious metals change in the same direction at the same time and we do not have commitment contracts in place. Under these assumptions, a 10 percent increase or decrease in the cost of precious metals would result in approximately a $10.3 million increase or decrease to our net income (loss). We believe we have partially mitigated this risk through our vertical integration efforts.
ITEM 8. FINANCIAL STATEMENTS AND SUPPLEMENTARY DATA.
The response to this item is submitted as a separate section of this Form 10-K. See Item 15.
ITEM 9. CHANGES IN AND DISAGREEMENTS WITH ACCOUNTANTS ON ACCOUNTING AND FINANCIAL DISCLOSURE
None.
ITEM 9A. CONTROLS AND PROCEDURES.
Disclosure Controls and Procedures
As of March 31, 2018, an evaluation of the effectiveness of the Company’s disclosure controls and procedures (as defined in Rule 13a-15(e) and 15d-15(e) promulgated under the Exchange Act) was performed under the supervision and with the participation of the Company’s management, including the Chief Executive Officer and Chief Financial Officer. Based on that evaluation, the Company’s Chief Executive Officer and Chief Financial Officer have concluded that the Company’s disclosure controls and procedures are effective to ensure that information required to be disclosed by the Company in its reports that it files or submits under the Exchange Act is recorded, processed, summarized and reported within the time periods specified in the Securities and Exchange Commission rules and forms, and that information required to be disclosed by the Company in the reports the Company files or submits under the Exchange Act is accumulated and communicated to the
62
Company’s management, including its Chief Executive Officer and Chief Financial Officer, as appropriate to allow timely decisions regarding required disclosure.
Management's Report on Internal Control over Financial Reporting
The Company’s management is responsible for establishing and maintaining adequate internal control over financial reporting (as defined in Rule 13a-15(f) and 15d-15(f) promulgated under the Exchange Act). Internal control over financial reporting is a process, designed by, or under the supervision of, an entity’s principal executive and principal financial officers, and effected by an entity’s board of directors, management and other personnel, to provide reasonable assurance regarding the reliability of financial reporting and the preparation of consolidated financial statements for external purposes in accordance with generally accepted accounting principles. Internal control over financial reporting includes those policies and procedures that (1) pertain to the maintenance of records that, in reasonable detail, accurately and fairly reflect the transactions and the dispositions of the assets of the entity; (2) provide reasonable assurance that transactions are recorded as necessary to permit preparation of financial statements in accordance with generally accepted accounting principles, and that receipts and expenditures of the entity are being made only in accordance with authorizations of the management and directors of the entity; and (3) provide reasonable assurance regarding prevention or timely detection of unauthorized acquisition, use, or disposition of the entity’s assets that could have a material effect on its consolidated financial statements.
Because of its inherent limitations, internal control over financial reporting may not prevent or detect misstatements. Also, projections of any evaluation of effectiveness to future periods are subject to the risk that controls may become inadequate because of changes in conditions, or that the degree of compliance with the policies or procedures may deteriorate.
On April 19, 2017, the Company acquired all of the outstanding shares of common stock and preferred stock of TOKIN not already owned by the Company. TOKIN’s combined total assets and net sales constituted 38% and 30%, respectively, of the Company’s consolidated total assets and net sales shown on our consolidated financial statements as of and for the year ended March 31, 2018. We excluded TOKIN and TOKIN’s internal control over financial reporting from the scope of management’s 2018 annual assessment of the effectiveness of our internal control over financial reporting. This exclusion is in accordance with the general guidance issued by the Staff of the SEC that an assessment of a recent business combination may be omitted from management’s report on internal control over financial reporting in the first year of consolidation.
Under the supervision and with the participation of the Company’s management, including the Company’s Chief Executive Officer and Chief Financial Officer, the Company’s management conducted an assessment of the effectiveness of its internal control over financial reporting based on the criteria set forth in the Internal Control—Integrated Framework issued by the Committee of Sponsoring Organizations of the Treadway Commission (2013 framework).
Based on that assessment, as of March 31, 2018, the Company’s management concluded that its internal control over financial reporting was effective. Ernst & Young LLP, our independent registered public accounting firm has issued an attestation report on the Company’s internal control over financial reporting, which is on page 71 of this annual report on Form 10-K.
Changes in Internal Control over Financial Reporting
In connection with the acquisition of TOKIN in April 2017, the Company began implementing standards and procedures at TOKIN, including establishing controls over accounting systems and establishing controls over the preparation of financial statements in accordance with generally accepted accounting principles to ensure that we have in place appropriate internal control over financial reporting at TOKIN. We are continuing to integrate the acquired operations of TOKIN into our overall internal control over financial reporting.
These changes to the Company's internal control over financial reporting that occurred during the most recent quarter ended March 31, 2018 are reasonably likely to materially affect the Company's internal control over financial reporting. Other than changes that have and may continue to result from integrating TOKIN into the Company's overall internal control over financial reporting, there have been no changes in the Company's internal control over financial reporting during the quarter ended March 31, 2018 that have materially affected, or are reasonably likely to materially affect, the Company's internal control over financial reporting.
ITEM 9B. OTHER INFORMATION.
None.
63
PART III
ITEM 10. DIRECTORS, EXECUTIVE OFFICERS AND CORPORATE GOVERNANCE.
Other than the information under “Executive Officers” and “Other Key Employees” under Part I, Item 4A, the other information required by Item 10 is incorporated by reference from the Company’s definitive proxy statement for its annual stockholders meeting to be held on July 25, 2018 under the headings “Nominees for Board of Directors,” “Continuing Directors,” “Section 16(a) Beneficial Ownership Reporting Compliance,” "Review, Approval, or Ratification of Transactions with Related Persons," and “Information about the Board of Directors.”
ITEM 11. EXECUTIVE COMPENSATION.
The information required by Item 11 is incorporated by reference from the Company’s definitive proxy statement for its annual stockholders’ meeting to be held on July 25, 2018 under the headings “Compensation Discussion and Analysis,” “Summary Compensation Table,” “Grants of Plan-Based Awards Table,” “Outstanding Equity Awards at Fiscal Year-End Table,” “Option Exercises and Stock Vested Table,” “Nonqualified Deferred Compensation Table,” “Potential Payments Upon Termination or Change in Control,” “Compensation of Directors,” “Director Compensation Table,” “Report of the Compensation Committee,” “Compensation Committee Interlocks and Insider Participation,” and "CEO Pay Ratio Table."
ITEM 12. SECURITY OWNERSHIP OF CERTAIN BENEFICIAL OWNERS AND MANAGEMENT AND RELATED STOCKHOLDER MATTERS.
The information required by Item 12 is incorporated by reference from the Company’s definitive proxy statement for its annual stockholders’ meeting to be held on July 25, 2018 under the heading “Security Ownership,” and from “Equity Compensation Plan Disclosure” in Item 5 hereof.
ITEM 13. CERTAIN RELATIONSHIPS AND RELATED TRANSACTIONS, AND DIRECTOR INDEPENDENCE.
The information required by Item 13 is incorporated by reference from the Company’s definitive proxy statement for its annual stockholders’ meeting to be held on July 25, 2018 under the headings “Review, Approval or Ratification of Transactions with Related Persons” and “Information about the Board of Directors.”
ITEM 14. PRINCIPAL ACCOUNTANT FEES AND SERVICES.
The information required by Item 14 is incorporated by reference from the Company’s definitive proxy statement for its annual stockholders’ meeting to be held on July 25, 2018 under the heading “Audit and Non-Audit Fees.”
64
PART IV
ITEM 15. EXHIBITS AND FINANCIAL STATEMENT SCHEDULES.
(a) | (1) Financial Statements |
The following financial statements are filed as a part of this report:
Page No. | |
Consolidated Financial Statements: | |
(2) Financial Statement Schedules
Financial statement schedules are omitted because they are not applicable or because the required information is included in the consolidated financial statements or notes thereto.
(3) List of Exhibits
The following exhibits are filed herewith or are incorporated by reference to exhibits previously filed with the SEC:
Stock Purchase Agreement, dated as of February 2, 2012, by and among KEMET Corporation, Niotan Incorporated and Niotan Investment Holdings LLC (incorporated by reference to Exhibit 99.2 to the Company’s Current Report on Form 8-K (File No. 1-15491) filed on February 2, 2012) | |||
Stock Purchase Agreement, dated as of March 12, 2012, by and among KEMET Electronics Corporation, NEC Corporation and NEC TOKIN Corporation (incorporated by reference to Exhibit 99.2 to the Company’s Current Report on Form 8-K (File No. 1-15491) filed on March 15, 2012) | |||
Amendment No. 1 to the Stock Purchase Agreement dated as of December 12, 2012, by and among KEMET Electronics Corporation, NEC Corporation and NEC TOKIN Corporation (incorporated by reference to Exhibit 99.1 to the Company’s Current Report on Form 8-K (File No. 1-15491) filed on December 14, 2012) | |||
Definitive NEC TOKIN Stock Purchase Agreement dated as of February 23, 2017, by and between KEMET Electronics Corporation and NEC Corporation (incorporated by reference to Exhibit 2.1 to the Company's Current Report on form 8-K (File No. 1-15491) filed on February 23, 2017) | |||
Master Sale and Purchase Agreement, dated February 23, 2017 between NEC TOKIN Corporation, NTJ Holdings 1 Ltd. and Japan Industrial Partner, Inc. (incorporated by reference to Exhibit 2.1 to the Company's Current Report on Form 8-K (File No. 1-15491) filed on April 20, 2017) | |||
Amendment, dated April 7, 2017, to the Master Sale and Purchase Agreement between NEC TOKIN Corporation, NTJ Holdings 1 Ltd. and Japan Industrial Partners, Inc. (incorporated by reference to Exhibit 2.2 to the Company's Current Report on Form 8-K (File No. 1-15491) filed on April 20, 2017) | |||
Amendment, dated April 14, 2017, to the Master Sale and Purchase Agreement between NEC TOKIN Corporation, NTJ Holdings 1 Ltd. and Japan Industrial Partners, Inc. (incorporated by reference to Exhibit 2.3 to the Company's Current Report on Form 8-K (File No. 1-15491) filed on April 20, 2017) | |||
65
Second Restated Certificate of Incorporation of the Company, as amended to date (incorporated by reference to Exhibit 3.1 to the Company’s Quarterly Report on Form 10-Q (File No. 1-15491) for the quarter ended June 30, 2011) | |||
Amended and Restated By-laws of KEMET Corporation, effective June 5, 2008 (incorporated by reference to Exhibit 3.2 to the Company’s Current Report on Form 8-K (File No. 1-15491) filed on June 5, 2008) | |||
Indenture, dated May 5, 2010, by and among the Company, certain subsidiary guarantors named therein and Wilmington Trust Company, as trustee (incorporated by reference to Exhibit 4.1 to the Company’s Current Report on Form 8-K (File No. 1-15491) filed on May 5, 2010) | |||
Registration Rights Agreement, dated May 5, 2010, by and among the Company, certain subsidiary guarantors named therein and the initial purchasers named therein (incorporated by reference to Exhibit 4.2 to the Company’s Current Report on Form 8-K (File No. 1-15491) filed on May 5, 2010) | |||
Supplemental Indenture, dated as of August 10, 2011, among KEMET Foil Manufacturing LLC (f/k/a Cornell Dubilier Foil, LLC), KEMET Corporation, the other Guarantors named therein and Wilmington Trust Company, as trustee (incorporated by reference to Exhibit 4.1 to the Company’s Quarterly Report on Form 10-Q (File No. 1-15491) for the quarter ended September 30, 2011) | |||
Registration Rights Agreement, dated March 27, 2012, among KEMET Corporation, the guarantors named therein and Merrill Lynch, Pierce, Fenner & Smith Incorporated and Deutsche Bank Securities Inc., as initial purchasers (incorporated by reference to Exhibit 4.1 to the Company’s Current Report on Form 8-K (File No. 1-15491) filed on March 28, 2012) | |||
Registration Rights Agreement, dated as of April 3, 2012, among KEMET Corporation, the guarantors named therein and Merrill Lynch, Pierce, Fenner & Smith Incorporated and Deutsche Bank Securities Inc., as initial purchasers (incorporated by reference to Exhibit 4.1 to the Company’s Current Report on Form 8-K (File No. 1-15491) filed on April 4, 2012) | |||
Supplemental Indenture, dated April 17, 2012, among KEMET Corporation, the guarantors named therein and Wilmington Trust Company, as trustee (incorporated by reference to Exhibit 4.1 to the Company’s Current Report on Form 8-K (File No. 1-15491) filed on April 18, 2012) | |||
Form of 10 1/2% Senior Note due 2018 (included in Exhibit 4.1) | |||
10.1 | Registration Agreement, dated as of December 21, 1990, by and among the Company and each of the investors and executives listed on the schedule of investors and executives attached thereto (incorporated by reference to Exhibit 10.3 to the Company’s Registration Statement on Form S-1 (Reg. No. 33-48056)) | ||
10.2 | Form of Amendment No. 1 to Registration Agreement, dated as of April 28, 1994 (incorporated by reference to Exhibit 10.3.1 to the Company’s Registration Statement on Form S-1 (Reg. No. 33-61898)) | ||
10.3 | 1995 Executive Stock Option Plan by and between the Company and each of the executives listed on the schedule attached thereto (incorporated by reference to Exhibit 10.33 to the Company’s Annual Report on Form 10-K (File No. 1-15491) for the year ended March 31, 1996)* | ||
10.4 | Executive Bonus Plan by and between the Company and each of the executives listed on the schedule attached thereto (incorporated by reference to Exhibit 10.34 to the Company’s Annual Report on Form 10-K (File No. 1-15491) for the year ended March 31, 1996)* | ||
1992 Key Employee Stock Option Plan (incorporated by reference to Exhibit 10.16 to the Company’s Annual Report on Form 10-K (File No. 1-15491) for the year ended March 31, 2009)* | |||
Amendment No. 1 to KEMET Corporation 1992 Key Employee Stock Option Plan effective October 23, 2000 (incorporated by reference to Exhibit 10.1 to the Company’s Quarterly Report on Form 10-Q (File No. 1-15491) for the quarter ended December 31, 2000)* | |||
2004 Long-Term Equity Incentive Plan (incorporated by reference to Exhibit 4.3 to the Company’s Registration Statement on Form S-8 (Reg. No. 333-123308))* | |||
66
Form of Indemnification Agreement (incorporated by reference to Exhibit 10.1 to the Company’s Current Report on Form 8-K (File No. 1-15491) filed on April 23, 2009)* | |||
Warrant to Purchase Common Stock, dated June 30, 2009, issued by the Company to K Financing, LLC (incorporated by reference to Exhibit 10.1 to the Company’s Current Report on Form 8-K (File No. 1-15491) filed on June 30, 2009) | |||
Investor Rights Agreement, dated June 30, 2009, between the Company and K Financing, LLC (incorporated by reference to Exhibit 10.2 to the Company’s Current Report on Form 8-K (File No. 1-15491) filed on June 30, 2009) | |||
Purchase Agreement, dated April 21, 2010, by and among the Company, certain subsidiary guarantors named therein and Banc of America Securities LLC, as representative of the several initial purchasers (incorporated by reference to Exhibit 10.1 to the Company’s Current Report on Form 8-K (File No. 1-15491) filed on April 22, 2010) | |||
Second Amended and Restated KEMET Corporation Deferred Compensation Plan (incorporated by reference to Exhibit 10.56 to the Company’s Annual Report on Form 10-K (File No. 1-15491) for the year ended March 31, 2009)* | |||
Loan and Security Agreement, dated as of September 30, 2010, by and among KEMET Electronics Corporation, KEMET Electronics Marketing (S) Pte Ltd., and Bank of America, N.A., as agent and Banc of America Securities LLC, as lead arranger and bookrunner (incorporated by reference to Exhibit 10.1 to the Company’s Current Report on Form 8-K (File No. 1-15491) filed on October 5, 2010) | |||
KEMET Executive Secured Benefit Plan (incorporated by reference to Exhibit 10.1 to the Company’s Quarterly Report on Form 10-Q (File No. 1-15491) for the quarter ended December 31, 2010)* | |||
Form of Change in Control Severance Compensation Agreement, entered into with executive officers of the Company (incorporated by reference to Exhibit 10.15 to the Company's Annual Report on Form 10-K (File No. 1-15491) for the year ended March 31, 2016)* | |||
Option Agreement, dated as of March 12, 2012, by and among NEC Corporation and KEMET Electronics Corporation (incorporated by reference to Exhibit 99.3 to the Company’s Current Report on Form 8-K (File No. 1-15491) filed on March 15, 2012) | |||
Stockholders’ Agreement, dated as of March 12, 2012, by and among KEMET Electronics Corporation, NEC Corporation and NEC TOKIN Corporation (incorporated by reference to Exhibit 99.4 to the Company’s Current Report on Form 8-K (File No. 1-15491) filed on March 15, 2012) | |||
Form of Restricted Stock Unit Grant Agreement for Employees (incorporated by reference to Exhibit 10.61 to the Company’s Annual Report on Form 10-K (File No. 1-15491) for the year ended March 31, 2012)* | |||
Form of Restricted Stock Unit Grant Agreement for Directors (incorporated by reference to Exhibit 10.62 to the Company’s Annual Report on Form 10-K (File No. 1-15491) for the year ended March 31, 2012)* | |||
Amendment No. 1 to Loan and Security Agreement, Waiver and Consent, dated as of March 19, 2012, by and among KEMET Electronics Corporation, KEMET Electronics Marketing (S) Pte Ltd., the financial institutions party thereto as lenders and Bank of America, N.A., as agent (incorporated by reference to Exhibit 10.63 to the Company’s Annual Report on Form 10-K (File No. 1-15491) for the year ended March 31, 2012) | |||
Development and Cross-Licensing Agreement between NEC TOKIN Corporation and KEMET Electronics Corporation (incorporated by reference to Exhibit 10.1 to the Company’s Current Report on Form 8-K (File No. 1-15491) filed on May 8, 2013) | |||
Form of Long-Term Incentive Plan Award Agreement (incorporated by reference to Exhibit 10.2 to the Company's Quarterly Report on Form 10-Q (File No. 1-15491) filed on August 3, 2016)* | |||
67
Consolidated Amendment to Loan and Security Agreement, dated as of July 8, 2013, by and among KEMET Electronics Corporation, KEMET Foil Manufacturing, LLC, KEMET Blue Powder Corporation, KEMET Electronics Marketing (S) PTE LTD., the financial institutions party thereto as lenders and Bank of America, N.A., as agent (incorporated by reference to Exhibit 10.1 to the Company’s Quarterly Report on Form 10-Q (File No. 1-15491) filed on August 2, 2013) | |||
Amendment No. 5 to Loan and Security Agreement, dated April 30, 2014, among KEMET Electronics Corporation and its subsidiaries KEMET Foil Manufacturing, LLC, KEMET Blue Powder Corporation, and KEMET Electronics Marketing (S) PTE LTD., as Borrowers, and Bank of America, N.A., as agent for the Lenders (incorporated by reference to Exhibit 10.1 to the Company’s Current Report on Form 8-K (File No. 1-15491) filed on May 5, 2014) | |||
KEMET Corporation Omnibus Incentive Plan (incorporated by reference to Exhibit 10.1 to the Company’s Current Report on Form 8-K (File No. 1-15491) filed on August 2, 2017)* | |||
Amendment No. 1 to Option Agreement, dated as of August 29, 2014, between KEMET Electronics Corporation and NEC Corporation (incorporated by reference to Exhibit 10.1 to the Company’s Current Report on Form 8-K (File No. 001-15491) filed on September 4, 2014) | |||
Incentive Award, Severance and Non-Competition Agreement, dated as of December 1, 2014, between KEMET Corporation and William M. Lowe, Jr. (incorporated by reference to Exhibit 10.1 to the Company’s Current Report on Form 8-K (File No. 1-15491) filed on December 5, 2014)* | |||
Incentive Award and Non-Competition Agreement, dated as of December 1, 2014, between KEMET Corporation and Charles C. Meeks, Jr. (incorporated by reference to Exhibit 10.2 to the Company’s Current Report on Form 8-K (File No. 1-15491) filed on December 5, 2014)* | |||
Amendment No. 6 to Loan and Security Agreement, Waiver and Consent dated December 19, 2014, among KEMET Electronics Corporation, KEMET Foil Manufacturing, LLC, KEMET Blue Powder Corporation, The Forest Electric Company and KEMET Electronics Marketing (S) PTE LTD., as Borrowers, the financial institutions party thereto, as Lenders, and Bank of America, N.A., as agent for the Lenders (incorporated by reference to Exhibit 10.1 to the Company’s Current Report on Form 8-K (File No. 1-15491) filed on December 22, 2014) | |||
Amendment No. 7 to Loan and Security Agreement, dated March 27, 2015, among KEMET Electronics Corporation, KEMET Foil Manufacturing, LLC, KEMET Blue Powder Corporation, The Forest Electric Company and KEMET Electronics Marketing (S) PTE LTD., as Borrowers, the financial institutions party thereto, as Lenders, and Bank of America, N.A., as agent for the Lenders (incorporated by reference to Exhibit 10.30 to the Company's Annual Report on Form 10-K (File No. 1-15491) filed for the year ended March 31, 2016) | |||
Third Supplemental Indenture dated May 21, 2015, among KEMET Corporation, IntelliData, Inc., the other guarantors named therein and Wilmington Trust Company, as trustee (incorporated by reference to Exhibit 4.1 to the Company’s Current Report on Form 8-K (File No. 1-15491) filed on May 26, 2015) | |||
Amended and Restated Employment Agreement between KEMET Corporation and Per-Olof Lööf, dated April 18, 2018 (incorporated by reference to Exhibit 10.1 to the Company’s Current Report on Form 8-K (File No. 1-15491) filed on April 20, 2018)* | |||
Amendment No. 8 to Loan and Security Agreement, dated May 2, 2016, among KEMET Electronics Corporation, KEMET Foil Manufacturing, LLC, KEMET Blue Powder Corporation, The Forest Electric Company and KEMET Electronics Marketing (S) PTE LTD., as Borrowers, the financial institutions party thereto, as Lenders, and Bank of America, N.A., as agent for the Lenders (incorporated by reference to Exhibit 10.1 to the Company’s Current Report on Form 8-K (File No. 1-15491) filed on May 5, 2016) | |||
Employee Transfer Agreement, dated as of December 5, 2016, between KEMET Corporation and Claudio Lollini (incorporated by reference to Exhibit 10.2 to the Company's Quarterly Report on Form 10-Q (File No. 001-15491) filed on February 2, 2017)* | |||
68
Term Loan Credit Agreement, dated as of April 28, 2017, by and among KEMET Corporation, KEMET Electronics Corporation, the lenders party thereto, Bank of America, N.A. as the Administrative Agent and Collateral Agent, and Merrill Lynch, Pierce, Fenner & Smith Incorporated, as sole lead arranger and bookrunner (incorporated by reference to Exhibit 10.1 to the Company's Current Report on form 8-K (File No. 1-15491) filed on May 1, 2017) | |||
Term Loan Security Agreement, dated as of April 28, 2017, by and among KEMET Corporation, KEMET Electronics Corporation, the other guarantors party thereto, and Bank of America, N.A., as collateral agent (incorporated by reference to Exhibit 10.2 to the Company's Current Report on form 8-K (File No. 1-15491) filed on May 1, 2017) | |||
Amendment No. 9 to Loan and Security Agreement, Waiver and Consent, dated as of April 28, 2017, by and among KEMET Corporation, the other borrowers named therein, the financial institutions party thereto as lenders and Bank of America, N.A., a national banking association, as agent for the lenders (incorporated by reference to Exhibit 10.3 to the Company's Current Report on Form 8-K (File No. 1-15491) filed on May 1, 2017) | |||
Subsidiaries of KEMET Corporation | |||
Consent of Independent Registered Public Accounting Firm, Ernst & Young LLP | |||
Certification of the Chief Executive Officer Pursuant to Section 302 | |||
Certification of the Chief Financial Officer Pursuant to Section 302 | |||
Certification of the Chief Executive Officer Pursuant to Section 906 | |||
Certification of the Chief Financial Officer Pursuant to Section 906 | |||
101 | The following financial information from KEMET Corporation’s Annual Report on Form 10-K for the year ended March 31, 2018, formatted in XBRL (eXtensible Business Reporting Language): (i) Consolidated Balance Sheets at March 31, 2018, and March 31, 2017, (ii) Consolidated Statements of Income for the years ended March 31, 2018, 2017 and 2016, (iii) Consolidated Statements of Comprehensive Income for the years ended March 31, 2018, 2017 and 2016, (iv) Consolidated Statements of Changes in Stockholders’ Equity for the years ended March 31, 2018, 2017 and 2016, (v) Consolidated Statements of Cash Flows for the years ended March 31, 2018, 2017 and 2017 and (vi) the Notes to Consolidated Financial Statements, tagged as blocks of text | ||
_______________________________________________________________________________
* | Exhibit is a management contract or a compensatory plan or arrangement. |
69
Report of Independent Registered Public Accounting Firm
To the Stockholders and the Board of Directors of KEMET Corporation
Opinion on the Financial Statements
We have audited the accompanying consolidated balance sheets of KEMET Corporation and subsidiaries (the Company) as of March 31, 2018 and 2017, the related consolidated statements of operations, comprehensive income (loss), changes in stockholders' equity, and cash flows, for each of the three years in the period ended March 31, 2018, and the related notes (collectively referred to as the “consolidated financial statements”). In our opinion, the consolidated financial statements present fairly, in all material respects, the financial position of the Company at March 31, 2018 and 2017, and the results of its operations and its cash flows for each of the three years in the period ended March 31, 2018, in conformity with US generally accepted accounting principles.
We also have audited, in accordance with the standards of the Public Company Accounting Oversight Board (United States) (PCAOB), the Company's internal control over financial reporting as of March 31, 2018, based on criteria established in Internal Control-Integrated Framework issued by the Committee of Sponsoring Organizations of the Treadway Commission (2013 framework) and our report dated May 25, 2018 expressed an unqualified opinion thereon.
Basis for Opinion
These financial statements are the responsibility of the Company's management. Our responsibility is to express an opinion on the Company's financial statements based on our audits. We are a public accounting firm registered with the PCAOB and are required to be independent with respect to the Company in accordance with the US federal securities laws and the applicable rules and regulations of the Securities and Exchange Commission and the PCAOB.
We conducted our audits in accordance with the standards of the PCAOB. Those standards require that we plan and perform the audit to obtain reasonable assurance about whether the financial statements are free of material misstatement, whether due to error or fraud. Our audits included performing procedures to assess the risks of material misstatement of the financial statements, whether due to error or fraud, and performing procedures that respond to those risks. Such procedures include examining, on a test basis, evidence regarding the amounts and disclosures in the financial statements. Our audits also included evaluating the accounting principles used and significant estimates made by management, as well as evaluating the overall presentation of the financial statements. We believe that our audits provide a reasonable basis for our opinion.
/s/ Ernst & Young LLP | ||
We have served as the Company’s auditor since 2009.
Greenville, South Carolina
May 25, 2018
70
Report of Independent Registered Public Accounting Firm
To the Stockholders and the Board of Directors of KEMET Corporation
Opinion on Internal Control over Financial Reporting
We have audited KEMET Corporation and subsidiaries' internal control over financial reporting as of March 31, 2018, based on criteria established in Internal Control - Integrated Framework issued by the Committee of Sponsoring Organizations of the Treadway Commission (2013 framework) (the COSO criteria). In our opinion, KEMET Corporation and subsidiaries (the Company) maintained, in all material respects, effective internal control over financial reporting as of March 31, 2018, based on the COSO criteria.
As indicated in the accompanying Management’s Report on Internal Control over Financial Reporting, management’s assessment of and conclusion on the effectiveness of internal control over financial reporting did not include the internal controls of TOKIN Corporation and its subsidiaries, which is included in the 2018 consolidated financial statements of the Company and constituted 38% and 8% of total and net assets, respectively, as of March 31, 2018 and 30% and 7% of revenues and net income, respectively, for the year then ended. Our audit of internal control over financial reporting of the Company also did not include an evaluation of the internal control over financial reporting of TOKIN Corporation and its subsidiaries.
We also have audited, in accordance with the standards of the Public Company Accounting Oversight Board (United States) (PCAOB), the 2018 consolidated financial statements of the Company and our report dated May 25, 2018 expressed an unqualified opinion thereon.
Basis for Opinion
The Company’s management is responsible for maintaining effective internal control over financial reporting and for its assessment of the effectiveness of internal control over financial reporting included in the accompanying Management’s Report on Internal Control over Financial Reporting. Our responsibility is to express an opinion on the Company’s internal control over financial reporting based on our audit. We are a public accounting firm registered with the PCAOB and are required to be independent with respect to the Company in accordance with the U.S. federal securities laws and the applicable rules and regulations of the Securities and Exchange Commission and the PCAOB.
We conducted our audit in accordance with the standards of the PCAOB. Those standards require that we plan and perform the audit to obtain reasonable assurance about whether effective internal control over financial reporting was maintained in all material respects.
Our audit included obtaining an understanding of internal control over financial reporting, assessing the risk that a material weakness exists, testing and evaluating the design and operating effectiveness of internal control based on the assessed risk, and performing such other procedures as we considered necessary in the circumstances. We believe that our audit provides a reasonable basis for our opinion.
Definition and Limitations of Internal Control Over Financial Reporting
A company’s internal control over financial reporting is a process designed to provide reasonable assurance regarding the reliability of financial reporting and the preparation of financial statements for external purposes in accordance with generally accepted accounting principles. A company’s internal control over financial reporting includes those policies and procedures that (1) pertain to the maintenance of records that, in reasonable detail, accurately and fairly reflect the transactions and dispositions of the assets of the company; (2) provide reasonable assurance that transactions are recorded as necessary to permit preparation of financial statements in accordance with generally accepted accounting principles, and that receipts and expenditures of the company are being made only in accordance with authorizations of management and directors of the company; and (3) provide reasonable assurance regarding prevention or timely detection of unauthorized acquisition, use, or disposition of the company’s assets that could have a material effect on the financial statements.
Because of its inherent limitations, internal control over financial reporting may not prevent or detect misstatements. Also, projections of any evaluation of effectiveness to future periods are subject to the risk that controls may become inadequate because of changes in conditions, or that the degree of compliance with the policies or procedures may deteriorate.
/s/ Ernst & Young LLP | ||
May 25, 2018
71
KEMET CORPORATION AND SUBSIDIARIES
Consolidated Balance Sheets
(Amounts in thousands except per share data)
March 31, | ||||||||
2018 | 2017 | |||||||
ASSETS | ||||||||
Current assets: | ||||||||
Cash and cash equivalents | $ | 286,846 | $ | 109,774 | ||||
Accounts receivable, net | 144,076 | 92,526 | ||||||
Inventories, net | 204,386 | 147,955 | ||||||
Prepaid and other current assets (1) | 41,160 | 28,782 | ||||||
Total current assets | 676,468 | 379,037 | ||||||
Property, plant and equipment, net | 405,316 | 209,311 | ||||||
Goodwill | 40,294 | 40,294 | ||||||
Intangible assets, net | 59,907 | 29,781 | ||||||
Equity method investments | 12,016 | 63,416 | ||||||
Deferred income taxes (1) | 13,837 | 8,367 | ||||||
Other assets | 10,431 | 4,119 | ||||||
Total assets | $ | 1,218,269 | $ | 734,325 | ||||
LIABILITIES AND STOCKHOLDERS’ EQUITY | ||||||||
Current liabilities: | ||||||||
Current portion of long-term debt | $ | 20,540 | $ | 2,000 | ||||
Accounts payable | 139,989 | 69,674 | ||||||
Accrued expenses | 122,377 | 57,752 | ||||||
Income taxes payable | 2,010 | 715 | ||||||
Total current liabilities | 284,916 | 130,141 | ||||||
Long-term debt | 304,083 | 386,211 | ||||||
Other non-current obligations | 151,736 | 60,131 | ||||||
Deferred income taxes | 14,571 | 3,370 | ||||||
Total liabilities | 755,306 | 579,853 | ||||||
Commitments and contingencies (Note 15) | ||||||||
Stockholders’ equity: | ||||||||
Preferred stock, par value $0.01, authorized 10,000 shares, none issued | — | — | ||||||
Common stock, par value $0.01, authorized 175,000 shares, issued 56,641 and 46,689 shares at March 31, 2018 and 2017, respectively | 566 | 467 | ||||||
Additional paid-in capital | 462,737 | 447,671 | ||||||
Retained earnings (deficit) (1) | 2,675 | (251,854 | ) | |||||
Accumulated other comprehensive income (loss) | (3,015 | ) | (41,812 | ) | ||||
Total stockholders’ equity | 462,963 | 154,472 | ||||||
Total liabilities and stockholders’ equity | $ | 1,218,269 | $ | 734,325 | ||||
______________________________________________________________________________
(1) March 31, 2017 adjusted due to the adoption of Accounting Standards Update ("ASU") No. 2016-16, Income Taxes - Intra-Entity Transfers of Assets Other Than Inventory ("ASU No. 2016-16")
See accompanying notes to consolidated financial statements.
72
KEMET CORPORATION AND SUBSIDIARIES
Consolidated Statements of Operations
(Amounts in thousands except per share data)
Fiscal Years Ended March 31, | ||||||||||||
2018 | 2017 | 2016 | ||||||||||
Net sales | $ | 1,199,926 | $ | 757,791 | $ | 734,823 | ||||||
Operating costs and expenses: | ||||||||||||
Cost of sales (1) | 859,533 | 570,864 | 571,011 | |||||||||
Selling, general and administrative expenses (1) | 173,620 | 107,658 | 100,813 | |||||||||
Research and development (1) | 39,619 | 27,398 | 24,613 | |||||||||
Restructuring charges | 14,843 | 5,404 | 4,178 | |||||||||
(Gain) loss on write down and disposal of long-lived assets | (992 | ) | 10,671 | 375 | ||||||||
Total operating costs and expenses | 1,086,623 | 721,995 | 700,990 | |||||||||
Operating income (loss) (1) | 113,303 | 35,796 | 33,833 | |||||||||
Non-operating (income) expense: | ||||||||||||
Interest income | (809 | ) | (24 | ) | (14 | ) | ||||||
Interest expense | 32,882 | 39,755 | 39,605 | |||||||||
Acquisition (gain) loss | (130,880 | ) | — | — | ||||||||
Change in value of TOKIN options | — | (10,700 | ) | 26,300 | ||||||||
Other (income) expense, net (1) | 24,592 | (3,871 | ) | (841 | ) | |||||||
Income (loss) before income taxes and equity income (loss) from equity method investments | 187,518 | 10,636 | (31,217 | ) | ||||||||
Income tax expense (benefit) | 9,181 | 4,290 | 6,006 | |||||||||
Income (loss) before equity income (loss) from equity method investments | 178,337 | 6,346 | (37,223 | ) | ||||||||
Equity income (loss) from equity method investments | 76,192 | 41,643 | (16,406 | ) | ||||||||
Net income (loss) | $ | 254,529 | $ | 47,989 | $ | (53,629 | ) | |||||
Net income (loss) per basic share: | ||||||||||||
Net income (loss) | $ | 4.82 | $ | 1.03 | $ | (1.17 | ) | |||||
Net income (loss) per diluted share: | ||||||||||||
Net income (loss) | $ | 4.34 | $ | 0.87 | $ | (1.17 | ) | |||||
Weighted-average shares outstanding: | ||||||||||||
Basic | 52,798 | 46,552 | 46,004 | |||||||||
Diluted | 58,640 | 55,389 | 46,004 | |||||||||
______________________________________________________________________________
(1) Fiscal years ending March 31, 2017 and 2016 adjusted due to the adoption of ASU No. 2017-07, Improving the Presentation of Net Periodic Pension Cost and Net Periodic Postretirement Benefit Cost ("ASU No. 2017-07").
See accompanying notes to consolidated financial statements.
73
KEMET CORPORATION AND SUBSIDIARIES
Consolidated Statements of Comprehensive Income (Loss)
(Amounts in thousands)
Fiscal Years Ended March 31, | ||||||||||||
2018 | 2017 | 2016 | ||||||||||
Net income (loss) | $ | 254,529 | $ | 47,989 | $ | (53,629 | ) | |||||
Other comprehensive income (loss): | ||||||||||||
Foreign currency translation gains (losses), net of tax | 35,054 | (15,284 | ) | 1,860 | ||||||||
Defined benefit pension plans, net of tax | 167 | 163 | 5,202 | |||||||||
Defined benefit post-retirement plan adjustments | (255 | ) | 20 | (45 | ) | |||||||
Equity interest in investee’s other comprehensive income (loss) | 5,584 | 1,440 | (8,276 | ) | ||||||||
Foreign exchange contracts | (1,753 | ) | 3,274 | (1,370 | ) | |||||||
Other comprehensive income (loss) | 38,797 | (10,387 | ) | (2,629 | ) | |||||||
Total comprehensive income (loss) | $ | 293,326 | $ | 37,602 | $ | (56,258 | ) | |||||
See accompanying notes to consolidated financial statements.
74
KEMET CORPORATION AND SUBSIDIARIES
Consolidated Statements of Changes in Stockholders’ Equity
(Amounts in thousands)
Shares Outstanding | Common Stock | Additional Paid-In Capital | Retained Earnings (Deficit) | Accumulated Other Comprehensive Income (Loss) | Treasury Stock | Total Stockholders’ Equity | |||||||||||||||||||||
Balance at March 31, 2015 | 45,452 | $ | 465 | $ | 461,191 | $ | (245,881 | ) | $ | (28,796 | ) | $ | (22,297 | ) | $ | 164,682 | |||||||||||
Net income (loss) | — | — | — | (53,629 | ) | — | — | (53,629 | ) | ||||||||||||||||||
Other comprehensive income (loss) | — | — | — | — | (2,629 | ) | — | (2,629 | ) | ||||||||||||||||||
Issuance of shares | 445 | — | (13,144 | ) | — | — | 12,427 | (717 | ) | ||||||||||||||||||
Stock-based compensation | — | — | 4,774 | — | — | — | 4,774 | ||||||||||||||||||||
Balance at March 31, 2016 | 45,897 | 465 | 452,821 | (299,510 | ) | (31,425 | ) | (9,870 | ) | 112,481 | |||||||||||||||||
Net income (loss) | — | — | — | 47,989 | — | — | 47,989 | ||||||||||||||||||||
Other comprehensive income (loss) | — | — | — | — | (10,387 | ) | — | (10,387 | ) | ||||||||||||||||||
Issuance of shares | 792 | 2 | (10,000 | ) | — | — | 9,870 | (128 | ) | ||||||||||||||||||
Stock-based compensation | — | — | 4,720 | — | — | — | 4,720 | ||||||||||||||||||||
Adoption of ASU's (1) | — | — | 130 | (333 | ) | — | — | (203 | ) | ||||||||||||||||||
Balance at March 31, 2017 | 46,689 | 467 | 447,671 | (251,854 | ) | (41,812 | ) | — | 154,472 | ||||||||||||||||||
Net income (loss) | — | — | — | 254,529 | — | — | 254,529 | ||||||||||||||||||||
Other comprehensive income (loss) | — | — | — | — | 38,797 | — | 38,797 | ||||||||||||||||||||
Issuance of shares | 9,952 | 99 | 8,043 | — | — | — | 8,142 | ||||||||||||||||||||
Stock-based compensation | — | — | 7,657 | — | — | — | 7,657 | ||||||||||||||||||||
Offering Fees | (634 | ) | (634 | ) | |||||||||||||||||||||||
Balance at March 31, 2018 | 56,641 | $ | 566 | $ | 462,737 | $ | 2,675 | $ | (3,015 | ) | $ | — | $ | 462,963 | |||||||||||||
______________________________________________________________________________
(1) Impact of the adoption of ASU No. 2016-09, Improvements to Employee Share-Based Payment Accounting ("ASU No. 2016-09") and ASU No. 2016-16.
See accompanying notes to consolidated financial statements.
75
KEMET CORPORATION AND SUBSIDIARIES
Consolidated Statements of Cash Flows
(Amounts in thousands)
Fiscal Years Ended March 31, | ||||||||||||
2018 | 2017 | 2016 | ||||||||||
Sources (uses) of cash and cash equivalents | ||||||||||||
Operating activities: | ||||||||||||
Net income (loss) | $ | 254,529 | $ | 47,989 | $ | (53,629 | ) | |||||
Adjustments to reconcile net income (loss) to net cash provided by (used in) operating activities: | ||||||||||||
Depreciation and amortization | 49,755 | 37,338 | 39,016 | |||||||||
Equity (income) loss from equity method investments | (76,192 | ) | (41,643 | ) | 16,406 | |||||||
Acquisition (gain) loss | (130,880 | ) | — | — | ||||||||
Non-cash debt and financing costs | 2,467 | 761 | 859 | |||||||||
(Gain) loss on early extinguishment of debt | 486 | — | — | |||||||||
Stock-based compensation expense | 7,657 | 4,720 | 4,774 | |||||||||
Write down of receivables | 162 | 64 | 24 | |||||||||
Change in value of TOKIN options | — | (10,700 | ) | 26,300 | ||||||||
Pension and other post-retirement benefits | 4,717 | 2,543 | 3,013 | |||||||||
Change in deferred income taxes | 613 | (19 | ) | 495 | ||||||||
Net (gain) loss on write down and disposal of long-lived assets | (992 | ) | 10,671 | 375 | ||||||||
Rent receivable | 2,645 | — | — | |||||||||
Other, net | (71 | ) | (327 | ) | 306 | |||||||
Changes in assets and liabilities, net of the effect of acquisitions: | ||||||||||||
Accounts receivable | 30,084 | (12 | ) | (2,346 | ) | |||||||
Inventories | (13,827 | ) | 16,805 | 3,338 | ||||||||
Prepaid expenses and other assets | 4,330 | (1,769 | ) | 13,588 | ||||||||
Accounts payable | (16,053 | ) | 6,170 | (5,982 | ) | |||||||
Accrued income taxes | 1,317 | 144 | (382 | ) | ||||||||
Other operating liabilities | 113 | (1,068 | ) | (13,790 | ) | |||||||
Net cash provided by (used in) operating activities | 120,860 | 71,667 | 32,365 | |||||||||
Investing activities: | ||||||||||||
Capital expenditures | (65,004 | ) | (25,617 | ) | (20,469 | ) | ||||||
Investment in Novasentis | (3,000 | ) | — | — | ||||||||
Change in restricted cash | — | — | 1,802 | |||||||||
Proceeds from dividend | 2,745 | — | — | |||||||||
Acquisitions, net of cash received | 163,985 | — | (2,892 | ) | ||||||||
Proceeds from sale of assets | 3,638 | 19 | 971 | |||||||||
Net cash provided by (used in) investing activities | 102,364 | (25,598 | ) | (20,588 | ) | |||||||
76
Consolidated Statements of Cash Flows (Continued)
Fiscal Years Ended March 31, | ||||||||||||
2018 | 2017 | 2016 | ||||||||||
Financing activities: | ||||||||||||
Proceeds from revolving line of credit | — | 12,000 | 10,000 | |||||||||
Payments of revolving line of credit | (33,881 | ) | (12,000 | ) | (9,600 | ) | ||||||
Proceeds from issuance of debt | 334,978 | 2,314 | — | |||||||||
Deferred acquisition payments | — | — | (3,000 | ) | ||||||||
Payment of long-term debt | (365,938 | ) | (2,428 | ) | (481 | ) | ||||||
Debt issuance costs | (5,002 | ) | — | — | ||||||||
Proceeds from exercise of stock options | 5,207 | 1,133 | — | |||||||||
Proceeds from exercise of stock warrants | 8,838 | — | — | |||||||||
Purchase of treasury stock | — | (1,144 | ) | (722 | ) | |||||||
Net cash provided by (used in) financing activities | (55,798 | ) | (125 | ) | (3,803 | ) | ||||||
Net increase (decrease) in cash and cash equivalents | 167,426 | 45,944 | 7,974 | |||||||||
Effect of foreign currency fluctuations on cash | 9,646 | (1,174 | ) | 668 | ||||||||
Cash and cash equivalents at beginning of fiscal year | 109,774 | 65,004 | 56,362 | |||||||||
Cash and cash equivalents at end of fiscal year | $ | 286,846 | $ | 109,774 | $ | 65,004 | ||||||
Supplemental Cash Flow Statement Information: | ||||||||||||
Interest paid, net of capitalized interest | $ | 44,905 | $ | 38,922 | $ | 39,091 | ||||||
Income taxes paid | $ | 7,120 | $ | 4,153 | $ | 4,892 | ||||||
See accompanying notes to consolidated financial statements.
77
KEMET CORPORATION AND SUBSIDIARIES
Notes to Consolidated Financial Statements
Note 1: Organization and Significant Accounting Policies
Nature of Business and Organization
KEMET Corporation, which together with its subsidiaries is referred to herein as “KEMET” or the “Company” is a leading manufacturer of tantalum capacitors, multilayer ceramic capacitors, film capacitors, electrolytic capacitors, paper capacitors and solid aluminum capacitors, and with the recent acquisition of TOKIN, Electro-Magnetic Compatible ("EMC") devices, sensors, and actuators. The Company is headquartered in Fort Lauderdale, Florida and has manufacturing plants and distribution centers located in the United States, Mexico, Europe and Asia. Additionally, the Company has wholly-owned foreign subsidiaries which primarily provide sales support for KEMET’s products in foreign markets.
KEMET is organized into three segments: the Solid Capacitor Segment (“Solid Capacitors”), the Film and Electrolytic Segment (“Film and Electrolytic”) and the Electro-Magnetic, Sensors, and Actuators Segment ("MSA"). Prior to the acquisition of TOKIN, we reported two reportable segments, Solid Capacitors and Film and Electrolytic. However, in connection with the acquisition of TOKIN, and effective beginning the quarter ended June 30, 2017, TOKIN's tantalum capacitor business was included within KEMET's Solid Capacitors reportable segment and the remainder of TOKIN's business formed the new reportable segment for KEMET, MSA. Each segment is responsible for the operations of certain manufacturing sites as well as related research and development efforts.
Basis of Presentation
Certain amounts for the consolidated statements of operations for fiscal years 2017 and 2016 have been revised to conform with the fiscal year 2018 presentation.
Principles of Consolidation
The accompanying consolidated financial statements of the Company include the accounts of its wholly-owned subsidiaries. All intercompany balances and transactions have been eliminated in consolidation. Investment in entities in which the Company can exercise significant influence, but does not own a majority equity interest or otherwise control, are accounted for using the equity method and are included as equity method investments on the consolidated balance sheets.
Cash Equivalents
Cash equivalents of $83.9 million and $2.1 million at March 31, 2018 and 2017, respectively, consist of money market accounts and certificates of deposits with an original term of three months or less. The Company considers all liquid debt instruments with original maturities of three months or less to be cash equivalents.
Inventories
Inventories are stated at the lower of cost or net realizable value. The Company maintains reserves for excess and slow moving inventory in order to reflect a carrying amount for inventory that is stated at the lower of cost or net realizable value. The inventory reserve is an estimate and is adjusted based on slow moving and excess inventory, historical shipments, customer forecasts and backlog, and technology developments. Inventory costs include material, labor and manufacturing overhead and most inventory costs are determined by the “first-in, first-out” (“FIFO”) method. For tool crib, a component of the Company’s raw material inventory, cost is determined under the average cost method. The Company has consigned inventory at certain customer locations totaling $8.1 million and $8.8 million at March 31, 2018 and 2017, respectively.
Property, Plant and Equipment
Property and equipment are carried at cost. Depreciation is calculated principally using the straight-line method over the estimated useful lives of the respective assets. Leasehold improvements are amortized using the straight-line method over the shorter of the estimated useful lives of the assets or the terms of the respective leases. Maintenance costs are expensed; expenditures for renewals and improvements are generally capitalized. Upon sale or retirement of property and equipment, the related cost and accumulated depreciation are removed and any gain or loss is recognized. A long-lived asset classified as held for sale is initially measured and reported at the lower of its carrying amount or fair value less cost to sell. Long-lived assets to be disposed of other than by sale are classified as held and used until the long-lived asset is disposed of. Depreciation expense, including amortization of capital leases, was $45.5 million, $35.0 million and $36.9 million for the fiscal years ended March 31, 2018, 2017 and 2016, respectively.
78
KEMET CORPORATION AND SUBSIDIARIES
Notes to Consolidated Financial Statements (Continued)
The Company evaluates long-lived assets for impairment whenever events or changes in circumstances indicate the carrying amount of an asset may not be recoverable. Reviews are regularly performed to determine whether facts and circumstances exist which indicate the carrying amount of assets may not be recoverable. The Company assesses the recoverability of its assets by comparing the projected undiscounted net cash flows associated with the related asset or group of assets over their remaining lives against their respective carrying amounts. If it is determined that the book value of a long-lived asset or asset group is not recoverable, an impairment loss would be calculated equal to the excess of the carrying amount of the long-lived asset over its fair value. The Company has to make certain assumptions as to the future cash flows to be generated by the underlying assets. Those assumptions include the amount of volume increases, average selling price decreases, anticipated cost reductions, and the estimated remaining useful life of the equipment. Future changes in assumptions may negatively impact future valuations. Fair market value is based on the discounted cash flows that the assets will generate over their remaining useful lives or other valuation techniques. In future tests for recoverability, adverse changes in cash flow assumptions could result in an impairment of certain long-lived assets that would require a non-cash charge to the Consolidated Statements of Operations and may have a material effect on the Company’s financial condition and operating results. See Note 8, “(Gain) loss on write down and disposal of long-lived assets” for further discussion of property, plant and equipment impairment charges.
Goodwill and Other Intangible Assets
Goodwill and other intangible assets with indefinite useful lives are not amortized but are subject to annual impairment tests during the fourth quarter of each fiscal year and when otherwise warranted. The Company evaluates its goodwill on a reporting unit basis, which requires the Company to estimate the fair value of the reporting unit. The impairment test involves a comparison of the fair value of each reporting unit, with the corresponding carrying amounts. If the reporting unit’s carrying amount exceeds its fair value, then an indication exists that the reporting unit’s goodwill and intangible asset with indefinite useful lives may be impaired. The impairment to be recognized is measured by the amount by which the carrying value of the reporting unit’s goodwill being measured exceeds its implied fair value. The implied fair value of goodwill is the excess of the fair value of the reporting unit over the sum of the amounts assigned to identified net assets. As a result, the implied fair value of goodwill is generally the residual amount that results from subtracting the value of net assets, including all tangible assets and identified intangible assets, from the fair value of the reporting unit’s fair value. The Company determined the fair value of its reporting units using an income-based, discounted cash flow (“DCF”) analysis, and market-based approaches (Guideline Publicly Traded Company Method and Guideline Transaction Method) which examine transactions in the marketplace involving the sale of the stocks of similar publicly owned companies, or the sale of entire companies engaged in operations similar to KEMET. The Company evaluates the value of its other indefinite-lived intangible assets (trademarks) using an income-based, relief from royalty analysis. In addition to the previously described reporting unit valuation techniques, the Company’s goodwill and intangible assets with indefinite useful lives impairment assessment also considers the Company’s aggregate fair value based upon the value of the Company’s outstanding shares of common stock.
The impairment review of goodwill and intangible assets with indefinite useful lives are subjective and involve the use of estimates and assumptions in order to calculate the impairment charges. Estimates of business enterprise fair value use discounted cash flow and other fair value appraisal models and involve making assumptions for future sales trends, market conditions, growth rates, cost reduction initiatives and cash flows for the next several years. Future changes in assumptions may negatively impact future valuations.
Equity Method Investments
Investments and ownership interests are accounted for under the equity method of accounting if the Company has the ability to exercise significant influence, but not control, over the entity. Investments accounted for under the equity method are initially recorded at cost, and the difference between the basis of the Company’s investment and the underlying equity in the net assets of the company at the investment date, is amortized over the lives of the related assets that gave rise to the difference. The Company’s share of earnings or losses under the equity method investments and basis difference amortization is reported in the consolidated statements of operations as “Equity income (loss) from equity method investments.” The Company reviews its investments and ownership interests accounted for under the equity method of accounting for impairment whenever events or changes in circumstances indicate a loss in the value of the investment may be other than temporary.
79
KEMET CORPORATION AND SUBSIDIARIES
Notes to Consolidated Financial Statements (Continued)
Deferred Income Taxes
Income taxes are accounted for under the asset and liability method. Deferred tax assets and liabilities are recognized for the future tax consequences attributable to differences between the financial statement carrying amounts of existing assets and liabilities and their respective tax basis and operating loss and tax credit carryforwards. Deferred tax assets and liabilities are measured using enacted tax rates expected to apply to taxable income in fiscal years in which those temporary differences are expected to be recovered or settled. The effect on deferred tax assets and liabilities of a change in tax rates is recognized in income in the period that includes the enactment date. A valuation allowance is recorded to reduce the carrying amounts of deferred tax assets unless it is more likely than not that such assets will be realized.
Stock-based Compensation
Stock-based compensation for stock options is estimated on the date of grant using the Black-Scholes option-pricing model. The Black-Scholes model takes into account volatility in the price of the Company’s stock, the risk-free interest rate, the estimated life of the equity-based award, the closing market price of the Company’s stock on the grant date and the exercise price. The estimates utilized in the Black-Scholes calculation involve inherent uncertainties and the application of management judgment. The Company's stock options were fully expensed during the fiscal year ended March 31, 2017. Upon adoption of ASU No. 2016-09, Compensation Stock-Compensation, the Company elected to discontinue estimating forfeitures. Stock-based compensation cost for restricted stock is measured based on the closing fair market value of the Company’s common stock on the date of grant. The Company recognizes stock-based compensation cost for arrangements with cliff vesting as expense ratably on a straight-line basis over the requisite service period. The Company recognizes stock-based compensation cost for arrangements with graded vesting as expense on an accelerated basis over the requisite service period.
Concentrations of Credit and Other Risks
The Company sells to customers globally. Credit evaluations of its customers’ financial condition are performed periodically, and the Company generally does not require collateral from its customers. One customer, TTI, Inc., an electronics distributor, accounted for $133.5 million, $104.4 million and $99.3 million of the Company’s net sales in fiscal years ended March 31, 2018, 2017, and 2016, respectively. There were no customers’ accounts receivable balances exceeding 10% of gross accounts receivable at March 31, 2018 or March 31, 2017.
Consistent with industry practice, the Company utilizes electronics distributors for a large percentage of its sales. Electronics distributors are an effective means to distribute the products to end-users. For fiscal years ended March 31, 2018, 2017, and 2016, net sales to electronics distributors accounted for 39.2%, 46.8% and 41.9%, respectively, of the Company’s total net sales.
Foreign Subsidiaries
The Company translates the assets and liabilities of its foreign subsidiaries from their respective functional currencies to U.S. dollars at the appropriate spot rates as of the balance sheet date. Generally, our foreign subsidiaries use the local currency as their functional currency. Changes in the carrying value of these assets and liabilities attributable to fluctuations in spot rates are recognized as a component of equity in accumulated other comprehensive income ("AOCI"). Results of operations accounts are translated using average exchange rates for the year.
Assets and liabilities denominated in a currency that is different from a reporting entity's functional currency must first be remeasured from the applicable currency to the legal entity's functional currency. The effect of this remeasurement process is recognized in the Consolidated Statements of Operations.
Comprehensive Income (Loss)
Comprehensive income (loss) consists of net income (loss), currency translation gains (losses), defined benefit plan adjustments including those adjustments which result from changes in net prior service credit and actuarial gains (losses), equity interest in investee’s other comprehensive income (loss), and gains (losses) on derivatives held as cash flow hedges, and is presented in the Consolidated Statements of Comprehensive Income (Loss).
80
KEMET CORPORATION AND SUBSIDIARIES
Notes to Consolidated Financial Statements (Continued)
The following summary sets forth the components of accumulated other comprehensive income (loss) contained in the stockholders’ equity section of the Consolidated Balance Sheets (amounts in thousands):
Foreign Currency Translation Gains (Losses) | Defined Benefit Post-retirement Plan Adjustments | Defined Benefit Pension Plans (3) | Ownership Share of Equity Method Investees’ Other Comprehensive Income (Loss) | Foreign Exchange Contracts | Net Accumulated Other Comprehensive Income (Loss) | |||||||||||||||||||
Balance at March 31, 2016 | $ | (10,272 | ) | $ | 1,114 | $ | (15,161 | ) | $ | (6,739 | ) | $ | (367 | ) | $ | (31,425 | ) | |||||||
Other comprehensive income (loss) before reclassifications (1) | (15,284 | ) | 228 | (536 | ) | 1,440 | 8,444 | (5,708 | ) | |||||||||||||||
Amounts reclassified in (out) of AOCI (1) | — | (208 | ) | 699 | — | (5,170 | ) | (4,679 | ) | |||||||||||||||
Other comprehensive income (loss) | (15,284 | ) | 20 | 163 | 1,440 | 3,274 | (10,387 | ) | ||||||||||||||||
Balance at March 31, 2017 | (25,556 | ) | 1,134 | (14,998 | ) | (5,299 | ) | 2,907 | (41,812 | ) | ||||||||||||||
Other comprehensive income (loss) before reclassifications (2) | 35,054 | (255 | ) | 167 | 5,584 | 667 | 41,217 | |||||||||||||||||
Amounts reclassified in (out) of AOCI (2) | — | — | — | — | (2,420 | ) | (2,420 | ) | ||||||||||||||||
Other comprehensive income (loss) | 35,054 | (255 | ) | 167 | 5,584 | (1,753 | ) | 38,797 | ||||||||||||||||
Balance at March 31, 2018 | $ | 9,498 | $ | 879 | $ | (14,831 | ) | $ | 285 | $ | 1,154 | $ | (3,015 | ) | ||||||||||
_______________________________________________________________________________
(1) Activity within foreign currency translation gains and defined benefit pension plans are net of a tax benefit of zero and $0.7 million, respectively.
(2) Activity within foreign currency translation losses and defined benefit pension plans are net of a tax expense of zero and $0.4 million, respectively.
(3) Balance is net of a tax benefit of $2.3 million, $2.7 million, and $2.0 million as of March 31, 2018, 2017, and 2016, respectively.
Stock Warrant
Concurrent with the consummation of a credit facility in May 2009, the Company issued K Financing, LLC (“K Financing”) a warrant (the “Platinum Warrant”) to purchase up to 26,848,484 shares of the Company’s common stock, subject to certain adjustments, representing approximately 49.9% of the Company’s outstanding common stock at the time of issuance on a post-exercise basis. The Platinum Warrant was subsequently transferred to K Equity, LLC (“K Equity”). On September 11, 2017, K Equity sold the remaining portion of the Platinum Warrant to UBS Securities LLC (the "Underwriter"), in connection with the offering of 8,416,814 shares of the Company's common stock, at an offering price of $21.57 per share. The Company filed a registration statement on Form S-3 to register the offer and resale by K Equity of the shares. The Company did not receive any of the proceeds from the sale of the shares in the offering, but received approximately $8.8 million from the Underwriter in connection with the cash exercise of the Platinum Warrant for all 8,416,814 shares underlying the Platinum Warrant at an exercise price of $1.05 per share.
As of March 31, 2018, the Platinum Warrant has been exercised in full.
Fair Value Measurement
The Company utilizes three levels of inputs to measure the fair value of (a) nonfinancial assets and liabilities that are recognized or disclosed at fair value in the Company’s consolidated financial statements on a recurring basis (at least annually) and (b) all financial assets and liabilities. Fair value is defined as the exchange price that would be received for an asset or paid to transfer a liability (an exit price) in the principal or most advantageous market for the asset or liability in an orderly transaction between market participants on the measurement date. Valuation techniques used to measure fair value must maximize the use of observable inputs and minimize the use of unobservable inputs.
The first two inputs are considered observable and the last is considered unobservable. The levels of inputs are as follows:
• | Level 1—Quoted prices in active markets for identical assets or liabilities. |
81
KEMET CORPORATION AND SUBSIDIARIES
Notes to Consolidated Financial Statements (Continued)
• | Level 2—Inputs other than Level 1 that are observable, either directly or indirectly, such as quoted prices for similar assets or liabilities, quoted prices in markets that are not active, or other inputs that are observable or can be corroborated by observable market data for substantially the full term of the assets or liabilities. |
• | Level 3—Unobservable inputs that are supported by little or no market activity and that are significant to the fair value of the assets or liabilities. |
Assets and liabilities are measured at fair value on a recurring basis as of March 31, 2018 and 2017 are as follows (amounts in thousands):
Carrying Value March 31, | Fair Value March 31, | Fair Value Measurement Using | Carrying Value March 31, | Fair Value March 31, | Fair Value Measurement Using | ||||||||||||||||||||||||||||||||||
2018 | 2018 | Level 1 | Level 2 (3) | Level 3 | 2017 | 2017 | Level 1 | Level 2 (3) | Level 3 | ||||||||||||||||||||||||||||||
Assets and Liabilities: | |||||||||||||||||||||||||||||||||||||||
Money markets (1)(2) | $ | 83,891 | $ | 83,891 | $ | 83,891 | $ | — | $ | — | $ | 2,055 | $ | 2,055 | $ | 2,055 | $ | — | $ | — | |||||||||||||||||||
Total debt | (324,623 | ) | (343,125 | ) | (337,043 | ) | (6,082 | ) | — | (388,211 | ) | (385,251 | ) | (353,000 | ) | (32,251 | ) | — | |||||||||||||||||||||
TOKIN options, net (4) | — | — | — | — | — | (9,900 | ) | (9,900 | ) | — | — | (9,900 | ) | ||||||||||||||||||||||||||
_______________________________________________________________________________
(1) Included in the line item “Cash and cash equivalents” on the Consolidated Balance Sheets.
(2) Certificates Deposits of $33.9 million that mature in three months or less are included within the balance as of March 31, 2018.
(3) The valuation approach used to calculate fair value was a discounted cash flow based on the borrowing rate for each respective debt facility.
(4) See Note 6, “Equity Method Investments,” for a description of the TOKIN options. The value of the options was interrelated and depended on the enterprise value of TOKIN Corporation and its EBITDA over the duration of the instruments. Therefore, the options were valued using option pricing methods in a Monte Carlo simulation.
The table below summarizes TOKIN options valuation activity using significant unobservable inputs (Level 3) (amounts in thousands):
Balance as of March 31, 2016 | $ | (20,600 | ) |
Change in value of TOKIN options | 10,700 | ||
Balance as of March 31, 2017 | $ | (9,900 | ) |
Option cancellation | 9,900 | ||
Balance as of March 31, 2018 | $ | — | |
Revenue Recognition
The Company ships products to customers based upon firm orders and revenue is recognized when the sales process is complete. This occurs when products are shipped to the customer in accordance with the terms of an agreement of sale, there is a fixed or determinable selling price, title and risk of loss have been transferred and collectability is reasonably assured. Based on product availability, customer requirements and customer consent, KEMET may ship products earlier than the initial planned ship date. Shipping and handling costs are included in cost of sales.
A portion of sales is related to products designed to meet customer specific requirements. These products typically have stricter tolerances making them useful to the specific customer requesting the product and to customers with similar or less stringent requirements. The Company recognizes revenue when title to the products transfers to the customer.
A portion of sales is made to distributors under agreements allowing certain rights of return and price protection on unsold merchandise held by distributors. The Company’s distributor policy includes inventory price protection and “ship-from-stock and debit” (“SFSD”) programs common in the industry.
KEMET’s SFSD program provides authorized distributors with the flexibility to meet marketplace prices by allowing them, upon a case-by-case pre-approved basis, to adjust their purchased inventory cost to correspond with current market demand. Requests for SFSD adjustments are considered on an individual basis, require a pre-approved cost adjustment quote
82
KEMET CORPORATION AND SUBSIDIARIES
Notes to Consolidated Financial Statements (Continued)
from their local KEMET sales representative, apply only to a specific customer, part, specified special price amount, specified quantity, and is only valid for a specific period of time. To estimate potential SFSD adjustments corresponding with current period sales, KEMET records a sales reserve based on historical SFSD credits, distributor inventory levels, and certain accounting assumptions, all of which are reviewed quarterly.
Most of the Company’s distributors have the right to return to KEMET a certain portion of the purchased inventory, which, in general, does not exceed 6% of their purchases from the previous fiscal quarter. KEMET estimates future returns based on historical patterns of the distributors and records an allowance on the Consolidated Balance Sheets. The Company also offers volume-based rebates on a case-by-case basis to certain customers in each of the Company’s sales channels.
The establishment of sales allowances is recognized as a component of the line item “Net sales” on the Consolidated Statements of Operations, while the associated reserves are included in the line item “Accounts receivable, net” on the Consolidated Balance Sheets. Estimates used in determining sales allowances are subject to various factors. This includes, but is not limited to, changes in economic conditions, pricing changes, product demand, inventory levels in the supply chain, the effects of technological change, and other variables that might result in changes to the Company’s estimates.
The Company provides a limited warranty to customers that the Company’s products meet certain specifications. The warranty period is generally limited to one year, and the Company’s liability under the warranty is generally limited to a replacement of the product or refund of the purchase price of the product. Warranty costs were less than 1% of net sales for the fiscal years ended March 31, 2018, 2017 and 2016. The Company recognizes warranty costs when losses are both probable and reasonably estimable.
Allowance for Doubtful Accounts
The Company evaluates the collectability of trade receivables through the analysis of customer accounts. When the Company becomes aware that a specific customer has filed for bankruptcy, has begun closing or liquidation proceedings, has become insolvent or is in financial distress, the Company records a specific allowance for the doubtful account to reduce the related receivable to the amount the Company believes is collectible. If circumstances related to specific customers change, the Company’s estimates of the recoverability of receivables could be adjusted. Accounts are written off after all means of collection, including legal action, have been exhausted.
Shipping and Handling Costs
The Company’s shipping and handling costs are reflected in the line item “Cost of sales” on the Consolidated Statements of Operations. Shipping and handling costs were $21.4 million, $16.4 million, and $16.1 million in the fiscal years ended March 31, 2018, 2017 and 2016, respectively.
Advertising Costs
The Company expenses advertising costs in the period in which the expenditures are incurred. Advertising costs reflected in the line item "Selling, general and administrative expenses" in our Consolidated Statements of Operations were $2.4 million, $1.3 million, and $0.8 million in fiscal years ended March 31, 2018, 2017 and 2016, respectively.
Income (Loss) per Share
Basic income (loss) per share is computed using the weighted-average number of shares outstanding. Diluted income (loss) per share is computed using the weighted-average number of shares outstanding adjusted for the incremental shares attributed to the Platinum Warrant and outstanding employee stock grants if such effects are dilutive.
Grants from Governmental Agencies
The Company from time to time enters into contracts to perform projects in which governmental agencies agree to reimburse the Company for certain expenses incurred on the projects. The Company recognizes revenue from government grants when it is probable that the Company will comply with the conditions attached to the grant agreement and the grant proceeds will be received. During the fiscal year ended March 31, 2018, the Company recognized EUR 0.6 million, or $0.8 million, as income within Non-operating (income) expense, net for grants provided to the Company.
83
KEMET CORPORATION AND SUBSIDIARIES
Notes to Consolidated Financial Statements (Continued)
Environmental Cost
The Company recognizes liabilities for environmental remediation when it is probable that a liability has been incurred and can be reasonably estimated. The Company determines its liability on a site-by-site basis, and it is not discounted or reduced for anticipated recoveries from insurance carriers. In the event of anticipated insurance recoveries, such amounts would be presented on a gross basis in other current or non-current assets, as appropriate. Expenditures that extend the life of the related property or mitigate or prevent future environmental contamination are capitalized.
Derivative Financial Instruments
Derivative financial instruments have been utilized by the Company to reduce exposures to volatility of foreign currencies impacting the sales and costs of its products.
The Company accounts for derivatives and hedging activities in accordance with Accounting Standards Codification ("ASC") 815, Derivatives and Hedging. See Note 12, "Derivatives," for further discussion of derivative financial instruments.
Use of Estimates
The preparation of consolidated financial statements in conformity with U.S. generally accepted accounting principles requires management to make a number of estimates and assumptions. These estimates and assumptions affect the reported amounts of assets and liabilities and the disclosure of contingent assets and liabilities at the date of the financial statements. In addition, they affect the reported amounts of revenues and expenses during the reporting period. Significant items subject to such estimates and assumptions include impairment of property and equipment, intangibles and goodwill, allowances for doubtful accounts, price protection and customers’ returns, deferred income taxes, and assets and obligations related to employee benefits. Actual results could differ from these estimates and assumptions.
Impact of Recently Issued Accounting Standards
In March 2018, the Financial Accounting Standards Board ("FASB") issued Accounting Standards Update (“ASU”) No. 2018-05, Amendments to SEC Paragraphs Pursuant to SEC Staff Accounting Bulletin (SAB) No. 118. The ASU adds seven paragraphs to ASU 740, Income Taxes, that contain SEC guidance related to SAB 118, Income Tax Implications of the Tax Cuts and Jobs Act (the "Act"). The update clarifies that if accounting for certain income tax effects of the Act are not completed by the time a company issues its financial statements that includes the reporting period in which the Act was enacted, the staff would not object to a company including a reasonable estimate of the tax effects in its financial statements. The staff believes a reasonable estimate of the tax effect should be included in a company's financial statements in the first reporting period in which the company is able to determine a reasonable estimate. At March 31, 2018, the Company has not completed its accounting for the tax effects of enactment of the Act; however, the Company has initially determined a $0.8 million tax benefit impact related to the US federal corporate tax rate change to its existing deferred tax balances, which is included as a component of income tax expense from continuing operations for the year ended March 31, 2018. The Company estimates no tax impact from the estimated transition tax repatriation charge of $79.3 million due to net operating loss utilization and a valuation allowance in the U.S. There is no impact to foreign locations. The Company has not been able to finalize the estimate for the one-time transition tax and will continue to account to this item based on its existing accounting under ASC 740, Income Taxes. Additionally, the Act subjects a U.S. shareholder to tax on Global Intangible Low-Taxed Income (“GILTI”) earned by certain foreign subsidiaries. The Company can make an accounting policy election to either treat taxes due on the GILTI as a current period expense or factor such amounts into our measurement of deferred taxes. Given the complexity of the GILTI provisions, the Company is still evaluating and has not yet determined its accounting policy. GILTI will not be applicable to the Company until fiscal year 2019.
In August 2017, the FASB issued ASU No. 2017-12, Targeted Improvements to Accounting for Hedging Activities. The update amends and simplifies existing guidance in order to allow companies to more accurately present the economic effects or risk management activities in the financial statements. The effective date of this update is for fiscal years, and interim periods within those fiscal years, beginning after December 15, 2018, with early adoption permitted. The Company is currently evaluating the impact of the adoption of this guidance on the Company's consolidated financial statements.
In March 2017, the FASB issued ASU No. 2017-07, Improving the Presentation of Net Periodic Pension Cost and Net Periodic Postretirement Benefit Cost. The update requires employers to report the service cost component in the same line item or items as other compensation costs arising from services rendered by the pertinent employees during the period. The other components of net benefit cost are required to be presented in the statements of operations separately from the service cost
84
KEMET CORPORATION AND SUBSIDIARIES
Notes to Consolidated Financial Statements (Continued)
component and outside a subtotal of Operating income. The effective date of this update is for fiscal years, and interim periods within those fiscal years, beginning after December 15, 2017, with early adoption permitted. The update requires retrospective application to all periods presented. The Company adopted this guidance in the first quarter of fiscal year 2018; the adoption of this guidance had an immaterial impact on the Company's consolidated financial statements.
In January 2017, the FASB issued ASU No. 2017-04, Intangibles - Goodwill and Other. The update eliminates the requirement to calculate the implied fair value of goodwill to measure the amount of impairment loss, if any, under the second step of the current goodwill impairment test. Under the update, the goodwill impairment loss would be measured as the amount by which a reporting unit’s carrying value exceeds its fair value, not to exceed the carrying amount of goodwill. The effective date of this update is for annual reporting periods beginning after December 15, 2019, with early adoption permitted. The Company is currently evaluating the impact of the adoption of this guidance on the Company’s consolidated financial statements, however the adoption of this guidance is not expected to have a significant effect on the Company's consolidated financial position, results of operations, or cash flows.
In October 2016, the FASB issued ASU No. 2016-16, Income Taxes - Intra-Entity Transfers of Assets Other Than Inventory. The update requires entities to recognize the income tax consequences of many intercompany asset transfers at the transaction date. The seller and buyer will immediately recognize the current and deferred income tax consequences of an intercompany transfer of an asset other than inventory. The tax consequences were previously deferred. The effective date of this update is for fiscal years, and interim periods within those fiscal years, beginning after December 15, 2017, with early adoption permitted. The update requires modified retrospective transition method which is a cumulative effect adjustment to retained earnings as of the beginning of the first effective reporting period. The Company adopted this guidance as of April 1, 2017 and recorded a cumulative effect adjustment to retained earnings of $203 thousand.
In August 2016, the FASB issued ASU No. 2016-15, Statement of Cash Flows (Topic 230): Classification of Certain Cash Receipts and Cash Payments. The update clarifies how cash receipts and cash payments in certain transactions are presented and classified in the statement of cash flows. The effective date of this update is for fiscal years, and interim periods within those fiscal years, beginning after December 15, 2017, with early adoption permitted. The update requires retrospective application to all periods presented but may be applied prospectively if retrospective application is impracticable. The Company is currently evaluating the impact of the adoption of this guidance on the Company’s consolidated financial statements, however, the adoption of this guidance is not expected to have a significant effect on the Company's consolidated financial position, results of operations, or cash flows.
In March 2016, the FASB issued ASU No. 2016-09, Compensation-Stock Compensation. This guidance changes several aspects of the accounting for share-based payment award transactions, including: (1) Accounting and Cash Flow Classification for Excess Tax Benefits and Deficiencies, (2) Forfeitures, and (3) Tax Withholding Requirements and Cash Flow Classification. This ASU is effective for fiscal years and interim periods within those years beginning after December 15, 2016. Early application is permitted, and KEMET adopted ASU No. 2016-09 as of April 1, 2016. The Company elected to discontinue estimating forfeitures that are expected to occur and recorded a cumulative effect adjustment to retained earnings of $130 thousand as of April 1, 2016. There was no cumulative adjustment related to the excess tax benefits as the Company did not have an additional paid in capital pool of excess tax benefits. The adoption did not have a significant impact on the Company’s consolidated financial statements.
In February 2016, the FASB issued ASU No. 2016-02, Leases, as modified by ASU 2017-03, Transition and Open Effective Date Information, requiring lessees to record a right-of-use asset and a lease liability for all leases. The accounting standards update also requires expanded disclosures to help financial statement users better understand the amount, timing and uncertainty of cash flows arising from leases. The change will be effective on a modified retrospective basis for fiscal years beginning after December 15, 2018, and interim periods within those years, with early adoption permitted. We are currently evaluating the impact of this standard on our financial statements, disclosures, internal controls, and accounting policies. We have implemented a third-party supported lease accounting software solution to account for our leases. We have begun a project to implement this system and are currently collecting the necessary information on our lease population, establishing a new lease accounting process and designing new internal controls for the new process. We do not plan to early adopt the standard. We believe the impact will be material on the consolidated financial statements as all leases will be recognized as a right of use asset and lease obligation.
In July 2015, the FASB issued ASU No. 2015-11, Simplifying the Measurement of Inventory. The ASU requires an entity that uses first-in, first-out or average cost to measure its inventory at the lower of cost or net realizable value. Net realizable value is the estimated selling price in the ordinary course of business, less reasonably predictable costs of completion,
85
KEMET CORPORATION AND SUBSIDIARIES
Notes to Consolidated Financial Statements (Continued)
disposal, and transportation. ASU 2015-11 was effective for interim and annual reporting periods beginning April 1, 2016. The adoption of ASU 2015-11 did not materially impact the Company’s operating results and financial position.
In May 2014, the FASB issued ASU No. 2014-09, Revenue from Contracts with Customers, which supersedes existing accounting standards for revenue recognition and creates a single framework. The new guidance requires either a retrospective or a modified retrospective approach at adoption. Additional updates to Topic 606 issued by the FASB in 2015, 2016, and 2017 include the following:
• | ASU No. 2015-14, Revenue from Contracts with Customers (Topic 606): Deferral of the Effective Date, which defers the effective date of the new guidance such that the new provisions will now be required for fiscal years, and interim periods within those years, beginning after December 15, 2017 (ASU No. 2015-14 is effective for the Company’s fiscal year that begins on April 1, 2018 and interim periods within that fiscal year). |
• | ASU No. 2016-08, Revenue from Contracts with Customers (Topic 606): Principal versus Agent Considerations, which clarifies the implementation guidance on principal versus agent considerations (reporting revenue gross versus net). |
• | ASU No. 2016-10, Revenue from Contracts with Customers (Topic 606): Identifying Performance Obligations and Licensing, which clarifies the implementation guidance on identifying performance obligations and classifying licensing arrangements. |
• | ASU No. 2016-12, Revenue from Contracts with Customers (Topic 606): Narrow-Scope Improvements and Practical Expedients, which clarifies the implementation guidance in a number of other areas. |
• | ASU No. 2016-20, Technical Corrections and Improvements to (Topic 606): Revenue from Contracts with Customers. |
• | ASU No. 2017-13, Revenue Recognition (Topic 605), Revenue from Contracts with Customers (Topic 606), Leases (Topic 840), and Leases (Topic 842): Provides additional implementation guidance on the previously issued ASU 2014-09. |
• | ASU No. 2017-14, Income Statement-Reporting Comprehensive Income (Topic 220), Revenue Recognition (Topic 605), and Revenue from Contracts with Customers (Topic 606). ASU 2017-14 includes amendments to certain SEC paragraphs within the FASB Accounting Standards Codification. |
The effective date of this guidance is for fiscal years, and interim periods within those fiscal years, beginning after December 15, 2018, with early adoption permitted. The Company has completed the assessment phase, applied the principles of the new standard using the five step model to material customer contracts, and held discussions with key stakeholders and management. The Company has finalized changes to accounting policies and internal controls over financial reporting. Key changes in the ASU which impact the Company's revenue recognition include certain customer tooling contracts primarily within the original equipment manufacturers ("OEM") channel and the deferral of incremental costs to fulfill a contract. The Company is currently finalizing the impact of the ASU on the consolidated results of operations, financial position, cash flows and financial statement disclosures. The Company will adopt the requirements of the new standard on a full retrospective basis during the three month period ended June 30, 2018.
There are currently no other accounting standards that have been issued that will have a significant impact on the Company’s financial position, results of operations or cash flows upon adoption.
86
KEMET CORPORATION AND SUBSIDIARIES
Notes to Consolidated Financial Statements (Continued)
Note 2: Acquisitions
Sale of Electro-Mechanical Business and Acquisition of Remaining Interest in TOKIN
Between February 1, 2013 and April 19, 2017, KEMET, through its wholly-owned subsidiary, KEMET Electronics Corporation (“KEC”), held a 34% economic interest in TOKIN Corporation (“TOKIN”) pursuant to a Stock Purchase Agreement (the “Stock Purchase Agreement”) by and among KEC, TOKIN and NEC Corporation (“NEC”), as calculated based on the number of common shares held by KEC, directly and indirectly, in proportion to the aggregate number of common and preferred shares of TOKIN outstanding as of such date. TOKIN was established in Japan in 1938 and is engaged in production and distribution of tantalum capacitors, transmitting communication devices, magnetic devices, piezoelectric devices and sensors. TOKIN has six manufacturing locations throughout Asia and was previously operating as a joint venture with NEC.
On April 14, 2017, TOKIN closed on the sale of its electro-mechanical devices (“EMD”) business to NTJ Holdings 1 Ltd. (“NTJ”), a special purpose entity that is owned by funds managed or operated by Japan Industrial Partners, Inc. (“JIP”), pursuant to a master sale and purchase agreement (the “EMD Master Sale and Purchase Agreement”) previously entered into between TOKIN, NTJ and JIP (“Sale of EMD”). The initial selling price for EMD was JPY 48.2 billion, or approximately $431.0 million, using the March 31, 2017 exchange rate of 111.823 Japanese Yen to 1.00 U.S. Dollar, and was subject to certain working capital adjustments. In the third quarter of fiscal year 2018, the selling price was adjusted by JPY 1.1 billion or approximately $10.1 million (using the December 31, 2017 exchange rate of 112.574 Japanese Yen to 1.00 U.S. Dollar) related to working capital and other adjustments in accordance with the EMD Master Sale and Purchase Agreement. At the closing of the Sale of EMD, TOKIN used a portion of the sale proceeds to repay debt related to a shareholder loan from NEC. The TOKIN historical balance sheet was adjusted to reflect the removal of net assets sold and other items directly impacted by the Sale of EMD. Additionally, due to KEMET’s 34% equity interest in TOKIN held as of the closing, adjustments have been made to reflect KEMET’s accounting for the Sale of EMD in accordance with the equity method of accounting.
On April 19, 2017, pursuant to a stock purchase agreement (the “TOKIN Purchase Agreement”) dated February 23, 2017 between KEC and NEC, KEC completed its acquisition, subject to final purchase price adjustment, of the remaining 66% economic interest in TOKIN, and as a result, TOKIN is now a 100% owned indirect subsidiary of KEMET (the “TOKIN Acquisition”). Under the terms of the TOKIN Purchase Agreement, KEC paid NEC JPY 16.2 billion, or approximately $148.6 million (using the April 19, 2017 exchange rate of 109.007 Japanese Yen to 1.00 U.S. Dollar), for all of the outstanding shares of TOKIN it did not already own. The preliminary purchase price was comprised of JPY 6.0 billion, or approximately $55.0 million (using the April 19, 2017 exchange rate of 109.007 Japanese Yen to 1.00 U.S. Dollar) plus JPY 10.2 billion, or approximately $93.6 million, which represented one-half of the estimated excess net cash proceeds (“Excess Cash”) from the Sale of EMD. The acquisition price was subject to working capital adjustments pursuant to the EMD Master Sale and Purchase Agreement. As a result of these working capital adjustments, the acquisition price was increased by JPY 0.3 billion, or approximately $3.0 million (using the September 30, 2017 exchange rate of 112.502 Japanese Yen to 1.00 U.S. Dollar) in the second quarter of fiscal year 2018. No additional working capital adjustments were recorded in the remainder of fiscal year 2018.
The Company believes the acquisition of TOKIN expands KEMET’s geographic presence, combining KEMET’s presence in the western hemisphere and TOKIN’s excellent position in Asia to enhance customer reach and create an entrance into Japan for KEMET. The Company believes TOKIN’s product portfolio is a strong complement to KEMET’s existing product portfolio. KEMET believes the combination creates a leader in the combined polymer and tantalum capacitors market. The acquisition also enhances KEMET’s product diversification with entry into EMC devices, as well as sensors and actuators. With the increased scale, the Company anticipates optimizing costs through competitive raw materials sourcing and maximizing operating efficiencies. Consistent with expectations, the acquisition has been accretive to earnings with improvement in Net income, Adjusted EBITDA and cash flow. TOKIN’s tantalum capacitor business is included within KEMET’s Solid Capacitor segment (“Solid Capacitors”) and the remainder of TOKIN’s business formed a new reportable segment for KEMET, Electro-Magnetic, Sensors, and Actuators (“MSA”).
87
KEMET CORPORATION AND SUBSIDIARIES
Notes to Consolidated Financial Statements (Continued)
The following table shows the components of the acquisition price (amounts in thousands):
Upfront cash consideration (1) | $ | 148,614 | |
Excess cash payment (2) | 3,144 | ||
Indemnity asset (3) | 8,500 | ||
Less: Put option (4) | (9,900 | ) | |
Net consideration transferred | $ | 150,358 | |
(1) The upfront cash payment is comprised of JPY 6.0 billion plus one half of Excess Cash in an amount of approximately JPY 10.2 billion, approximately $55.0 million and $93.6 million (using the April 19, 2017 exchange rate of 109.007 Japanese Yen to 1.00 U.S. Dollar), respectively.
(2) The additional amount paid to NEC Corporation upon the settlement of the adjusted purchase price for the EMD sale.
(3) Pursuant to the Stock Purchase Agreement between KEMET and NEC, NEC was required to indemnify TOKIN and/or KEC for any breaches by TOKIN or NEC of certain representations, warranties and covenants in the Stock Purchase Agreement. NEC’s aggregate liability for indemnification claims was limited to $25.0 million. Prior to the acquisition, KEMET's equity method investment balance included an $8.5 million indemnification asset pursuant to this indemnification arrangement. In connection with the TOKIN Acquisition, NEC was released from its indemnification obligations to KEMET without an exchange of consideration; as such, this amount of released obligation is included as purchase consideration by KEMET.
(4) Pursuant to the option agreement, dated as of March 12, 2012, by and among NEC and KEMET (the “Option Agreement”), from April 1, 2015 through May 31, 2018, NEC had the right to require KEC to purchase all outstanding capital stock of TOKIN (the “Put Option”). The fair value of the Put Option of $9.9 million was reflected as a liability on KEMET’s balance sheet prior to KEMET’s acquisition of the remaining 66% economic interest in TOKIN. The Put Option was canceled, pursuant to the terms of the TOKIN Purchase Agreement with no exchange of consideration between NEC and KEMET. Accordingly, the fair value of the Put Option reduces the amount of consideration paid to acquire NEC’s equity in TOKIN.
In accordance with ASC 805, KEMET’s previously held 34% equity interest in TOKIN and the assets acquired and the liabilities assumed have been measured at their fair values based on various estimates. The acquisition-date fair value of KEMET’s previously held 34% equity interest in TOKIN is approximately $204.1 million, which was derived from 34% of the fair value of TOKIN as of April 19, 2017 determined under the discounted cash flow method, an income valuation approach.
The following table presents the allocations of the aggregate purchase price based on the estimated fair values of the assets and liabilities (amounts in thousands):
Fair Value | |||
Cash | $ | 315,743 | |
Accounts Receivable | 79,295 | ||
Inventory | 35,310 | ||
Other current assets | 20,902 | ||
Property, Plant and equipment | 154,744 | ||
Intangible assets (1) | 32,996 | ||
Equity method investments | 11,128 | ||
Other assets | 6,512 | ||
Current portion of long term debt | (3,225 | ) | |
Accounts payable | (81,642 | ) | |
Accrued expenses | (44,542 | ) | |
Other non-current obligations | (105,140 | ) | |
Deferred income taxes | (5,452 | ) | |
Total net assets acquired | $ | 416,629 | |
(1) Includes trade name for $8.0 million and products and relationships of $25.0 million. TOKIN’s technology, products, and relationships were valued as a grouped, composite intangible asset due to the Company’s products being dependent on the existing technology, which enabled a product portfolio that customers found appealing in selecting and designing electronic devices for purchase. The trade name was valued based on the relief from royalty method and has an indefinite remaining useful life. The products and relationships were valued on the excess earnings method and are amortized over 10 years.
There were $0.9 million of acquisition-related costs, which were all recognized as an expense in the line item “Selling, general and administrative expenses” on the Consolidated Statements of Operations for the fiscal year ended March 31, 2018.
88
KEMET CORPORATION AND SUBSIDIARIES
Notes to Consolidated Financial Statements (Continued)
In fiscal year 2018, the Company's Consolidated Statements of Operations includes net sales and operating income of $358.2 million and $36.1 million, respectively derived from TOKIN Corporation.
The following table reflects the bargain purchase gain resulting from the TOKIN Acquisition (amounts in thousands):
Net consideration transferred | $ | 150,358 | |
Fair value of KEMET’s previously held equity interest in TOKIN (1) | 204,112 | ||
Less: fair value of net assets acquired | (416,629 | ) | |
Bargain purchase gain | $ | (62,159 | ) |
(1) Value based in the 34% of the enterprise value determined under the discounted cash flow method.
In performing acquisition accounting procedures, we engaged an internationally recognized independent valuation firm to assist in the valuation of identifiable net assets acquired. We also performed an extensive review for any unrecorded assets, liabilities, and contingencies. After identifying and valuing acquired assets and liabilities, we concluded recording a bargain purchase gain was appropriate and required under ASC 805-30-25-2. We believe the bargain purchase gain resulted from (1) NEC seeking repayment of its receivables due from TOKIN pursuant to TOKIN’s January 25, 2013 Loan Agreement with NEC of JPY 25.4 billion, or approximately $233.2 million (using the April 19, 2017 exchange rate of 109.007 Japanese Yen to 1.00 U.S. Dollar), which the sale transaction achieved, and for which TOKIN did not have the resources to pay prior to the transaction; and, (2) a predetermined purchase price which, other than certain customary working capital adjustments, was not subject to amendment irrespective of the amount of proceeds resulting from the sale of TOKIN’s EMD business, which was a precondition to our acquisition of TOKIN. The bargain purchase gain is recognized in the line item “Acquisition (gain) loss” in the Consolidated Statements of Operations.
Pro Forma Results
The following table summarizes, on a pro forma basis, the combined results of operations of the Company and TOKIN as though the acquisition and the Sale of EMD had occurred as of April 1, 2016. The pro forma amounts presented are not necessarily indicative of either the actual consolidated results had the acquisition occurred as of April 1, 2016, or of future consolidated operating results (amounts in thousands, except per share data):
Fiscal Years Ended March 31, | |||||||
2018 (1) | 2017 (2) | ||||||
Pro forma revenues | $ | 1,217,400 | $ | 1,061,230 | |||
Pro forma net income (loss) from continuing operations available to common stockholders | 52,377 | 226,918 | |||||
Pro forma earnings per common share - basic | 0.99 | 4.87 | |||||
Pro forma earnings per common share - diluted | 0.89 | 4.10 | |||||
Pro forma common shares - basic | 52,798 | 46,552 | |||||
Pro forma common shares - diluted | 58,640 | 55,389 | |||||
(1) The net income for the fiscal year ended March 31, 2018 excludes the following: 34% of the gain on sale of the EMD business of $75.2 million, the gain related to the fair value of KEMET’s previous 34% interest in TOKIN of $68.7 million, and the bargain gain on the acquisition of TOKIN of $62.2 million.
(2) The net income for the fiscal year ended March 31, 2017 includes the following: 34% of the gain on sale of the EMD business of $123.4 million (which includes the release of a valuation allowance that was recorded in the fourth quarter of fiscal year 2017 and the use of the deferred tax asset which was recorded in the first quarter of fiscal year 2018), the gain related to the fair value of KEMET’s previous 34% interest in TOKIN of $66.7 million, and the bargain gain on the acquisition of TOKIN of $60.3 million.
89
KEMET CORPORATION AND SUBSIDIARIES
Notes to Consolidated Financial Statements (Continued)
Note 3: Debt
A summary of debt is as follows (amounts in thousands):
______________________________________________________________________________
March 31, | ||||||||
2018 | 2017 | |||||||
Term Loan Credit Agreement (1) | $ | 318,782 | $ | — | ||||
10.5% Senior Notes, net (2) | — | 352,472 | ||||||
Revolving line of credit | — | 33,881 | ||||||
Other, net (3) | 5,841 | 1,858 | ||||||
Total debt | 324,623 | 388,211 | ||||||
Current maturities | (20,540 | ) | (2,000 | ) | ||||
Total long-term debt | $ | 304,083 | $ | 386,211 | ||||
(1) Amounts shown are net of discount, bank issuance costs and other indirect issuance costs of $13.3 million and zero as of March 31, 2018 and 2017, respectively, which reduce the Term Loan Credit Agreement (as defined herein) balance.
(2) Amounts shown are net of premium and debt issuance costs of zero and $0.5 million as of March 31, 2018 and 2017, respectively, which reduce the 10.5% Senior Notes balance.
(3) The amount shown is net of discount of $0.5 million and $0.5 million as of March 31, 2018 and 2017, respectively.
The line item “Interest expense” on the Consolidated Statements of Operations for the fiscal years 2018, 2017 and 2016, respectively, is as follows (amounts in thousands):
Fiscal Years Ended March 31, | ||||||||||||
2018 | 2017 | 2016 | ||||||||||
Contractual interest expense | $ | 30,323 | $ | 38,825 | $ | 39,087 | ||||||
Capitalized interest | (141 | ) | (154 | ) | (509 | ) | ||||||
Amortization of debt issuance costs | 511 | 1,390 | 1,392 | |||||||||
Amortization of debt (premium) discount | 1,843 | (788 | ) | (745 | ) | |||||||
Imputed interest on acquisition related obligations | 113 | 159 | 212 | |||||||||
Interest expense on capital leases | 233 | 323 | 168 | |||||||||
Total interest expense | $ | 32,882 | $ | 39,755 | $ | 39,605 | ||||||
Term Loan Credit Agreement
On April 28, 2017, KEMET entered into a Term Loan Credit Agreement (the "Term Loans") by and among the Company, KEC (together with the Company), Bank of America, N.A. as the Administrative Agent and Collateral Agent, Merrill Lynch, Pierce, Fenner & Smith Incorporated, as sole lead arranger and bookrunner and various other lenders thereto from time to time.
The Term Loan Credit Agreement provides for a $345.0 million term loan facility. In addition, the Borrowers may request incremental term loan commitments in an aggregate amount not to exceed $50.0 million (together with the initial $345.0 million term loan). The proceeds were used, together with cash on hand, to fund the redemption of all of KEMET’s outstanding 10.5% Senior Notes, which were called for redemption on April 28, 2017. The Term Loans were issued at a price of 97.0% (with an original issue discount of 300 bps). At the Company’s election, the Term Loans may be made as either Base Rate Term Loans or LIBO Rate Term Loans (each as defined in the Term Credit Loan Agreement). The applicable margin for term loans is 5.0% for Base Rate Term Loans and 6.0% for LIBO Rate Term Loans. All LIBO Rate Term Loans are subject to a pre-margin floor of 1.0%. The Term Loan Credit Agreement contains customary covenants and events of default.
The Company also entered into the Term Loan Security Agreement dated April 28, 2017, among the Company, KEC, certain other subsidiaries of the Company, and Bank of America, N.A., as collateral agent, pursuant to which the Company’s obligations under the Term Loan Credit Agreement are secured by a pledge of 65.0% of the outstanding voting stock of certain first-tier subsidiaries organized in Italy, Japan, Mexico and Singapore, and a second lien pledge on the collateral securing
90
KEMET CORPORATION AND SUBSIDIARIES
Notes to Consolidated Financial Statements (Continued)
KEMET’s revolving credit facility. The obligations of the Company under the Term Loan Credit Agreement are guaranteed by certain of its subsidiaries, including KRC Trade Corporation, KEMET Services Corporation, KEMET Blue Powder Corporation ("KBP"), and The Forest Electric Company. The Term Loans mature April 28, 2024, and may be extended in accordance with the Term Loan Credit Agreement. The Company may prepay loans under the Term Loan Credit Agreement at any time, subject to certain notice requirements and certain prepayment premiums during the first two years. On a quarterly basis, the Company must repay 1.25% of the aggregate principle amount on the initial $345.0 million term loan, or $4.3 million; payments began on September 29, 2017.
The Company currently pays interest on the Term Loan Security Agreement on a monthly basis due to favorable LIBO rates, and as such had only three days interest payable related to the Term Loan Security Agreement included in the line item “Accrued expenses” on its Consolidated balance sheets of $0.2 million and zero as of March 31, 2018 and 2017, respectively. The effective interest rate for the Term Loan was 8.2% for the year ended March 31, 2018.
Revolving Line of Credit
On September 30, 2010, KEC and KEMET Singapore entered into a Loan and Security Agreement, with Bank of America, N.A, as the administrative agent and the initial lender. The Loan and Security Agreement provided a $50.0 million revolving line of credit, which was bifurcated into a U.S. facility and a Singapore facility. A portion of the U.S. facility and the Singapore facility can be used to issue letters of credit. On December 19, 2014, the Loan and Security Agreement was amended and as a result the expiration was extended to December 19, 2019. Under the terms of amended Loan and Security Agreement, the revolving credit facility increased to $60.0 million, bifurcated into a U.S. facility and a Singapore facility. The amendment contained an accordion feature permitting the U.S. Borrowers to increase commitments under the facility by an aggregate principal amount up to $15.0 million (for a total facility of $75.0 million), subject to terms and documentation acceptable to the Agent and/or the Lenders. In addition, KEMET Foil Manufacturing, LLC (“KEMET Foil”), KBP, and The Forest Electric Company were included as Borrowers under the U.S. facility.
In connection with the closing of the new Term Loan Credit Agreement, KEC entered into Amendment No. 9 to the Loan and Security Agreement, Waiver, and Consent, dated as of April 28, 2017, by and among KEC, the other borrowers named therein, the financial institutions party thereto as lenders and Bank of America, N.A., as agent for the lenders (the "Loan Amendment"). The Loan Amendment increased the facility to $75.0 million and provided KEC with lower applicable interest rate margins and the ability to complete the refinancing of the 10.5% Senior Notes. As part of the overall refinancing, KEC repaid all amounts outstanding under the Loan Amendment.
The principal features of the Loan and Security Agreement as amended are reflected in the description below.
The size of the U.S. facility and Singapore facility can fluctuate as long as the Singapore facility does not exceed $30.0 million and the total facility does not exceed $60.0 million.
Borrowings under the U.S. and Singapore facilities are subject to a borrowing base consisting of:
• | in the case of the U.S. facility, (A) 85% of KEC’s accounts receivable that satisfy certain eligibility criteria plus (B) the lesser of (i) $6.0 million and (ii) (a) on or prior to agent’s receipt of an updated inventory appraisal and agent’s approval thereof, 40% of the value of Eligible Inventory (as defined in the agreement) and (b) upon agent’s receipt of an updated inventory appraisal, 85% of the net orderly liquidation value of the Eligible Inventory (as defined in the agreement) plus (C) the lesser of $5.1 million and 80% of the net orderly liquidation percentage of the appraised value of equipment that satisfies certain eligibility criteria, as reduced on the first day of each fiscal quarter occurring after April 30, 2014 in an amount equal to one-twentieth (1/20) of such appraised value less (D) certain reserves, including certain reserves imposed by the administrative agent in its permitted discretion; and |
• | in the case of the Singapore facility, (A) 85% of KEMET Singapore’s accounts receivable that satisfy certain eligibility criteria as further specified in the Loan and Security Agreement, less (B) certain reserves, including certain reserves imposed by the administrative agent in its permitted discretion. |
91
KEMET CORPORATION AND SUBSIDIARIES
Notes to Consolidated Financial Statements (Continued)
Interest is payable on borrowings monthly at a rate equal to the London Interbank Offer Rate (“LIBOR”) or the base rate, plus an applicable margin, as selected by the Borrower. Depending upon the fixed charge coverage ratio of KEMET Corporation and its subsidiaries on a consolidated basis as of the latest test date, the applicable margin under the U.S. facility varies between 2.00% and 2.50% for LIBOR advances and 1.00% and 1.50% for base rate advances, and under the Singapore facility varies between 2.25% and 2.75% for LIBOR advances and 1.25% and 1.75% for base rate advances.
The base rate is subject to a floor that is 100 basis points above LIBOR.
An unused line fee is payable monthly in an amount equal to a per annum rate equal to (a) 0.50%, if the average daily balance of revolver loans and stated amount of letters of credit was 50% or less of the revolver commitments during the preceding calendar month, or (b) 0.375%, if the average daily balance of revolver loans and stated amount of letters of credit was more than 50% of the Revolver Commitment during the preceding calendar month. A customary fee is also payable to the administrative agent on a quarterly basis.
KEC’s ability to draw funds under the U.S. facility and KEMET Singapore’s ability to draw funds under the Singapore facility are conditioned upon, among other matters:
• | the absence of the existence of a Material Adverse Effect (as defined in the Loan and Security Agreement); |
• | the absence of the existence of a default or an event of default under the Loan and Security Agreement; and |
• | the representations and warranties made by KEC and KEMET Singapore in the Loan and Security Agreement continuing to be correct in all material respects. |
KEMET and KEC’s 100% owned domestic subsidiaries (“Guarantor Subsidiaries”) guarantee the U.S. facility obligations and the U.S. facility obligations are secured by a lien on substantially all of the assets of KEC and the Guarantor Subsidiaries (other than assets that secure the 10.5% Senior Notes due 2018). The collection accounts of the Borrowers and Guarantor Subsidiaries are subject to a daily sweep into a concentration account and the concentration account will become subject to full cash dominion in favor of the administrative agent (i) upon an event of default, (ii) if for five consecutive business days, aggregate availability of all facilities has been less than the greater of (A) 10% of the aggregate revolver commitments at such time and (B) $7.5 million, or (iii) if for five consecutive business days, availability of the U.S. facility has been less than $3.75 million (each such event, a “Cash Dominion Trigger Event”).
KEC and the Guarantor Subsidiaries guarantee the Singapore facility obligations. In addition to the assets that secure the U.S. facility, the Singapore obligations are also secured by a pledge of 100% of the stock of KEMET Singapore and a security interest in substantially all of KEMET Singapore’s assets. KEMET Singapore’s bank accounts are maintained at Bank of America and upon a Cash Dominion Trigger Event will become subject to full cash dominion in favor of the administrative agent.
A fixed charge coverage ratio of at least 1.0:1.0 must be maintained as of the last day of each fiscal quarter ending immediately prior to or during any period in which any of the following occurs and is continuing until none of the following occurs for a period of at least forty-five consecutive days: (i) an event of default, (ii) aggregate availability of all facilities has been less than the greater of (A) 10% of the aggregate revolver commitments at such time and (B) $7.5 million, or (iii) availability of the U.S. facility has been less than $3.75 million. The fixed charge coverage ratio tests the EBITDA and fixed charges of KEMET and its subsidiaries on a consolidated basis.
In addition, the Loan and Security Agreement includes various covenants that, subject to exceptions, limit the ability of KEMET and its direct and indirect subsidiaries to, among other things: incur additional indebtedness; create liens on assets; engage in mergers, consolidations, liquidations and dissolutions; sell assets (including pursuant to sale leaseback transactions); pay dividends and distributions on or repurchase capital stock; make investments (including acquisitions), loans, or advances; prepay certain junior indebtedness; engage in certain transactions with affiliates; enter into restrictive agreements; amend material agreements governing certain junior indebtedness; and change its lines of business. The Loan and Security Agreement includes certain customary representations and warranties, affirmative covenants and events of default, which are set forth in more detail in the Loan and Security Agreement.
Debt issuance costs related to the Loan and Security Agreement, net of amortization, were $13.3 million and $0.2 million as of March 31, 2018 and 2017, respectively; these costs will be amortized over the term of the Loan and Security Agreement.
92
KEMET CORPORATION AND SUBSIDIARIES
Notes to Consolidated Financial Statements (Continued)
The Company had the following activity for the twelve month period ended March 31, 2018 and resulting balances under the revolving line of credit (amounts in thousands, excluding percentages):
March 31, 2017 | Twelve Month Period Ended March 31, 2018 | March 31, 2018 | ||||||||||||||||||
Outstanding Borrowings | Additional Borrowings | Repayments (3) (4) | Outstanding Borrowings | Rate (1) (2) | Due Date | |||||||||||||||
U.S. Facility | $ | 31,881 | $ | — | $ | 31,881 | $ | — | 5.000 | % | December 19, 2019 | |||||||||
Singapore Facility | ||||||||||||||||||||
Singapore Borrowing 2 | 2,000 | — | 2,000 | — | 3.375 | % | April 10, 2017 | |||||||||||||
Total Facilities | $ | 33,881 | $ | — | $ | 33,881 | $ | — | ||||||||||||
______________________________________________________________________________
(1) For U.S. borrowings, Base Rate plus 1.5%, as defined in the Loan and Security Agreement.
(2) For Singapore borrowings, LIBOR, plus a spread of 2.50% as of March 31, 2018.
(3) The Company repaid the U.S. Facility in full on April 27, 2017
(4) The Company repaid the Singapore Borrowing 2 in full on the due date of April 10, 2017.
There were no borrowings under the revolving line of credit during fiscal year 2018, and the Company’s available borrowing capacity under the Loan and Security Agreement was $64.7 million as of March 31, 2018. The borrowing capacity has increased from the prior year due to an increase in the eligible account receivable collateral.
10.5% Senior Notes
On May 5, 2010, the Company issued 10.5% Senior Notes with an aggregate principal amount of $230.0 million which resulted in net proceeds to the Company of $222.2 million.
The 10.5% Senior Notes were issued pursuant to an Indenture (the “10.5% Senior Notes”), dated as of May 5, 2010, as amended, by and among the Company, Guarantor Subsidiaries and Wilmington Trust Company, as trustee (the “Trustee”). The 10.5% Senior Notes will mature on May 1, 2018, and bear interest at a stated rate of 10.5% per annum, payable semi-annually in cash in arrears on May 1 and November 1 of each year, beginning on November 1, 2010. The 10.5% Senior Notes are senior obligations of the Company and will be guaranteed by each of the Guarantor Subsidiaries and secured by a first priority lien on 51% of the capital stock of certain of the Company’s foreign restricted subsidiaries.
On March 27, 2012 and April 3, 2012, the Company completed the issuance of $110.0 million and $15.0 million aggregate principal amount of its 10.5% Senior Notes due May 1, 2018, respectively, at an issue price of 105.5% of the principal amount plus accrued interest from November 1, 2011. The issuance resulted in a debt premium of $6.1 million which will be amortized over the term of the 10.5% Senior Notes. The Senior Notes were issued as additional notes under the indenture, dated May 5, 2010, among the Company, the Guarantor Subsidiaries party thereto and Wilmington Trust Company, as trustee.
On April 28, 2017, the Company repurchased and retired the full outstanding balance of $353.0 million of its 10.5% Senior Notes due May 1, 2018 (the “10.5% Senior Notes”). The Company had interest payable related to the 10.5% Senior Notes included in the line item “Accrued expenses” on its Consolidated balance sheets of zero and $15.4 million as of March 31, 2018 and 2017, respectively.
In total, debt issuance costs related to the 10.5% Senior Notes, net of amortization, were zero and $1.4 million as of March 31, 2018 and 2017, respectively. These costs were written off in the first quarter of fiscal year 2018 upon the extinguishment of the 10.5% Senior Notes. The effective interest rate for the Senior Notes was 10.2% for the year ended March 31, 2017.
Other Debt
In January 2017, KEMET Electronics Portugal, S.A., a wholly owned subsidiary received the first part of an interest free loan from the Portuguese Government in the amount of EUR 2.2 million (or $2.5 million) to be used for fixed asset purchases. In July 2017, KEMET Electronics Portugal, S.A. received the second part of the loan in the amount of EUR 277 thousand (or $325 thousand). The loan has a total term of eight years ending February 1, 2025. The loan will be repaid through semi-annual payments beginning on August 1, 2019. The first payment will be in the amount of EUR 185 thousand (or $211
93
KEMET CORPORATION AND SUBSIDIARIES
Notes to Consolidated Financial Statements (Continued)
thousand) beginning on August 1, 2019 and the remaining payments will be in the amount of EUR 210 thousand (or $248 thousand). Since the debt is non-interest bearing, we have recorded a debt discount in the amount of EUR 0.6 million (or $0.7 million) with an offsetting reduction to fixed assets. This discount will be amortized over the life of the loan through interest expense. If certain conditions are met, such as increased headcount, increased revenue and increased gross value added, a portion of the loan could be forgiven during fiscal year 2020.
In September 2017, TOKIN received a short term borrowing pursuant to an overdraft agreement with The 77 Bank Limited, located in Japan, in the amount of 350 million yen (or $3.3 million), at an interest rate of 0.53% (JBA TIBOR + 40 basis points). The loan is due September 2018, and the loan agreement automatically renews if both parties choose not to terminate or modify it.
The following table highlights the Company’s annual cash maturities of debt (amounts in thousands):
Annual Maturities of Debt Fiscal Years Ended March 31, | ||||||||||||||||||||||||
2019 | 2020 | 2021 | 2022 | 2023 | Thereafter | |||||||||||||||||||
Term Loan Credit Agreement | $ | 17,250 | $ | 17,250 | $ | 17,250 | $ | 17,250 | $ | 17,250 | $ | 245,813 | ||||||||||||
Other | 3,290 | 487 | 518 | 518 | 518 | 1,036 | ||||||||||||||||||
$ | 20,540 | $ | 17,737 | $ | 17,768 | $ | 17,768 | $ | 17,768 | $ | 246,849 | |||||||||||||
Note 4: Restructuring
The Company has implemented restructuring plans which include programs to increase competitiveness by removing excess capacity, relocating production to lower cost locations, relocating corporate functions to the new headquarters, and eliminating unnecessary costs throughout the Company. Significant restructuring plans which include personnel reduction costs during fiscal year ended March 31, 2018 are summarized below:
• | KEMET incurred severance and relocation charges across finance, sales, and technology departments in its Simpsonville, South Carolina office as these functions were relocated to the new corporate headquarters in Fort Lauderdale, Florida. The reduction was substantially complete as of March 31, 2018. Within the TOKIN legacy group, KEMET took a reduction in force across various operational and overhead functions. |
• | The Solid Capacitors segment is streamlining its vertical integration strategy by relocating its tantalum powder facility equipment from Carson City, Nevada to its existing Matamoros, Mexico plant. Severance charges and equipment relocation costs are expected to be recognized over the next seven quarters. |
• | The Film and Electrolytic segment had a voluntary reduction in force in its Italian operations. |
94
KEMET CORPORATION AND SUBSIDIARIES
Notes to Consolidated Financial Statements (Continued)
These restructuring plans are summarized in the table below (amounts in thousands):
Total expected to be incurred | Incurred during year ended March 31, 2018 | Cumulative incurred to date | |||||||||||||||||||
Restructuring Plan (1) | Segment | Personnel Reduction Costs | Relocation & Exit Costs | Personnel Reduction Costs | Relocation & Exit Costs | Personnel Reduction Costs | Relocation & Exit Costs | ||||||||||||||
US overhead function relocation to Fort Lauderdale, FL | Corporate | $ | 2,734 | $ | 909 | $ | 2,734 | $ | 909 | $ | 2,734 | $ | 909 | ||||||||
TOKIN operational & overhead function reduction in force | MSA, Corporate, & Solid Capacitors (2) | 4,397 | — | 4,397 | — | 4,397 | — | ||||||||||||||
Tantalum powder facility relocation | Solid Capacitors | 897 | 2,098 | — | — | — | — | ||||||||||||||
Italian operations reduction in force | Film and Electrolytic | 5,243 | — | 5,243 | — | 5,243 | — | ||||||||||||||
(1) Restructuring charges presented exclude $0.2 million in other miscellaneous personnel charges. These expenses are included in the Consolidated Statements of Operations line item "Restructuring charges."
(2) Personnel reduction costs are comprised of $3.3 million, $0.9 million, and $0.1 million within the MSA, Corporate, and Solid Capacitor segments, respectively.
A summary of the expenses aggregated on the Consolidated Statements of Operations line item “Restructuring charges” in the fiscal years ended March 31, 2018, 2017 and 2016, is as follows (amounts in thousands):
Fiscal Years Ended March 31, | ||||||||||||
2018 | 2017 | 2016 | ||||||||||
Manufacturing and sales office relocation costs | $ | 2,256 | $ | 3,190 | $ | 2,375 | ||||||
Personnel reduction costs | 12,587 | 2,214 | 1,803 | |||||||||
Restructuring charges | $ | 14,843 | $ | 5,404 | $ | 4,178 | ||||||
Fiscal Year Ended March 31, 2018
The Company incurred $14.8 million in restructuring charges in the fiscal year ended March 31, 2018, including $12.6 million of personnel reduction costs and $2.3 million of relocation costs.
The personnel reduction costs of $12.6 million are due to $5.2 million related to a voluntary reduction in force in the Film and Electrolytic segment's Italian operations; $4.4 million related to a headcount reduction in the TOKIN legacy group across various internal and operational functions; $2.7 million in severance charges across various overhead functions in the Simpsonville, South Carolina office as these functions were relocated to the Company's new corporate headquarters in Fort Lauderdale, Florida; and $0.2 million in headcount reductions related to a European sales reorganization.
The manufacturing relocation costs of $2.3 million include $0.9 million in lease termination penalties related to the relocation of global marketing, finance and accounting, and information technology functions to the Company's Fort Lauderdale office, $0.8 million in expenses related to the relocation of the K-Salt operations to the existing Matamoros, Mexico plant, $0.4 million in exit costs related to the shut-down of operations for KFM, and $0.1 million related to the transfer of certain Tantalum production from Simpsonville, South Carolina to Victoria, Mexico.
Fiscal Year Ended March 31, 2017
The Company incurred $5.4 million in restructuring charges in the fiscal year ended March 31, 2017, including $2.2 million related to personnel reduction costs and $3.2 million of relocation costs.
The personnel reduction costs correspond with the following: $0.3 million related to the consolidation of certain Solid Capacitor manufacturing in Matamoros, Mexico; $0.4 million for headcount reductions related to the shut-down of operations for KFM; $0.3 million related to headcount reductions in Europe (primarily Italy and Landsberg, Germany) corresponding with the relocation of certain production lines and laboratories to lower cost regions; $0.3 million for overhead reductions in
95
KEMET CORPORATION AND SUBSIDIARIES
Notes to Consolidated Financial Statements (Continued)
Sweden; $0.3 million in U.S. headcount reductions related to the relocation of global marketing functions to the Company’s Fort Lauderdale, Florida office; $0.3 million in headcount reductions related to the transfer of certain Tantalum production from Simpsonville, South Carolina to Victoria, Mexico; $0.2 million in overhead reductions for the relocation of R&D operations from Weymouth, England to Evora, Portugal; and $0.1 million in manufacturing headcount reductions related to the relocation of the K-Salt operations to the existing Matamoros, Mexico plant.
The manufacturing relocation costs of $3.2 million include $1.9 million in expenses related to contract termination costs related to the shut-down of operations for KFM; $0.6 million in expenses related to the relocation of the K-Salt operations to the existing Matamoros, Mexico plant; $0.6 million for transfers of Film and Electrolytic production lines and R&D functions to lower cost regions; and $0.1 million related to the transfer of certain Tantalum production from Simpsonville, South Carolina to Victoria, Mexico.
Fiscal Year Ended March 31, 2016
The Company incurred $4.2 million in restructuring charges in the fiscal year ended March 31, 2016, including $1.8 million related to personnel reduction costs and $2.4 million of relocation costs.
The personnel reduction costs correspond with the following: $0.9 million for headcount reductions in Matamoros, Mexico related to the relocation of certain Solid Capacitor manufacturing from Matamoros, Mexico to Victoria, Mexico; $0.6 million related to a headcount reduction in Suzhou, China for the Film and Electrolytic production line transfer from Suzhou, China to Anting, China; $0.5 million related to the consolidation of certain Solid Capacitor manufacturing in Victoria, Mexico; $0.5 million for headcount reductions related to the outsourcing of the Company's information technology function and overhead reductions in North America and Europe; and $0.3 million for headcount reductions in Europe (primarily Landsberg, Germany). These personnel reduction costs were partially offset by a $1.0 million credit to expense in Italy due to the partial reversal of a severance accrual. The Company originally recorded the accrual in the third quarter of fiscal year 2015 corresponding with a plan to reduce headcount by 50 employees. Under the plan, 24 employees were terminated. However, due to unexpected workforce attrition combined with achieving other cost reduction goals, the Company decided not to complete the remaining headcount reduction. Consequently, the Company reversed the remaining accrual during the second quarter of fiscal year 2016.
The $2.4 million relocation costs include $1.1 million for the Landsberg, Germany shut-down including relocating equipment to Pontecchio, Italy and Skopje, Macedonia; $0.4 million for the relocation of certain Solid Capacitor manufacturing equipment in Victoria, Mexico; $0.4 million for the exit of Film and Electrolytic manufacturing from Suzhou, China; and $0.5 million for other costs related to shut-downs in Europe, North America, and Asia.
96
KEMET CORPORATION AND SUBSIDIARIES
Notes to Consolidated Financial Statements (Continued)
A reconciliation of the beginning and ending liability balances for restructuring charges included in the line items “Accrued expenses” and “Other non-current obligations” on the Consolidated Balance Sheets were as follows (amounts in thousands):
_________________________________________
Personnel Reductions | Manufacturing and Sales Office Relocation Costs | |||||||
Balance at March 31, 2015 | $ | 7,239 | $ | — | ||||
Costs charged to expense | 1,803 | 2,375 | ||||||
Costs paid or settled | (8,273 | ) | (2,375 | ) | ||||
Change in foreign exchange | 207 | — | ||||||
Balance at March 31, 2016 | 976 | — | ||||||
Costs charged to expense | 2,214 | 3,190 | ||||||
Costs paid or settled | (2,130 | ) | (2,784 | ) | ||||
Change in foreign exchange | (61 | ) | — | |||||
Balance at March 31, 2017 | 999 | 406 | ||||||
TOKIN opening balance | — | 312 | ||||||
Costs charged to expense (1) | 12,384 | 2,256 | ||||||
Costs paid or settled | (3,901 | ) | (2,662 | ) | ||||
Change in foreign exchange | 147 | 18 | ||||||
Balance at March 31, 2018 | $ | 9,629 | $ | 330 | ||||
(1) Personnel reduction costs charged to expense include $0.2 million of relocation costs expensed as incurred, and therefore not included in accrued expenses for the fiscal year ended March 31, 2018.
Note 5: Goodwill and Intangible Assets
The following table highlights the Company’s intangible assets (amounts in thousands):
March 31, 2018 | March 31, 2017 | |||||||||||||||||||||||
Carrying Amount | Accumulated Amortization | Net Amount | Carrying Amount | Accumulated Amortization | Net Amount | |||||||||||||||||||
Indefinite Lived Intangible Assets: | ||||||||||||||||||||||||
Trademarks | $ | 15,474 | $ | — | $ | 15,474 | $ | 7,207 | $ | — | $ | 7,207 | ||||||||||||
Amortizing Intangibles: | ||||||||||||||||||||||||
Patents (10 - 18 years) | 26,662 | (10,625 | ) | 16,037 | 26,660 | (9,204 | ) | 17,456 | ||||||||||||||||
Customer relationships (10 - 21 years | 40,131 | (11,735 | ) | 28,396 | 12,653 | (7,535 | ) | 5,118 | ||||||||||||||||
Other | 238 | (238 | ) | — | 214 | (214 | ) | — | ||||||||||||||||
Total amortizing intangibles | 67,031 | 22,598 | 44,433 | 39,527 | (16,953 | ) | 56,480 | |||||||||||||||||
Total intangible assets | $ | 82,505 | $ | 22,598 | $ | 59,907 | $ | 46,734 | $ | (16,953 | ) | $ | 63,687 | |||||||||||
For fiscal years ended March 31, 2018, 2017, and 2016, amortization related to intangibles was $4.3 million, $2.1 million and $2.2 million, respectively, consisting of amortization related to patents of $1.4 million, $1.5 million, and $1.6 million, respectively, and amortization related to customer relationships of $2.9 million, $0.6 million, and $0.6 million, respectively. The weighted-average useful life for patents was 15.8 years for the fiscal years ended March 31, 2018 and 2017, respectively, and for customer relationships was 12.3 years and 15.7 years, respectively. The weighted-average period prior to the next renewal for patents was 3.5 years and 0.5 years as of March 31, 2018 and 2017. Estimated amortization of intangible assets for each of the next five fiscal years is $4.6 million, and thereafter, amortization will total $21.3 million. Estimated amortization of patents for each of the next five fiscal years is $1.4 million, and thereafter, amortization will total $8.9 million.
97
KEMET CORPORATION AND SUBSIDIARIES
Notes to Consolidated Financial Statements (Continued)
Estimated amortization of customer relationships for each of the next five fiscal years is $3.2 million, and thereafter, amortization will total $12.5 million.
For fiscal year 2018, the Company completed its impairment test on goodwill and intangible assets with indefinite useful lives as of January 1, 2018 and concluded that goodwill and indefinite-lived assets were not impaired. The were no changes to the carrying amount of goodwill for the years ended March 31, 2018 and 2017. As of March 31, 2018 and 2017, the carrying amount of goodwill was $40.3 million.
Note 6: Equity Method Investments
The following table provides a reconciliation of equity method investments to the Company's consolidated balance sheet (amounts in thousands):
March 31, | ||||||||
2018 | 2017 | |||||||
Nippon Yttrium Co., Ltd ("NYC") | $ | 8,148 | $ | — | ||||
NT Sales Co., Ltd ("NTS") | 998 | — | ||||||
Investment in Novasentis | 2,870 | — | ||||||
Investment in TOKIN | — | 63,416 | ||||||
$ | 12,016 | $ | 63,416 | |||||
TOKIN's Joint Ventures - NYC and NTS
As noted in Note 2, “Acquisitions,” on April 19, 2017, the Company completed its acquisition of the remaining 66% economic interest in TOKIN and TOKIN became a 100% owned subsidiary of KEMET. TOKIN had two investments at the time of acquisition: NYC and NTS. The Company accounts for both investments using the equity method due to the related nature of operations and the Company's ability to influence management decisions.
NYC was established in 1966 by TOKIN and Mitsui Mining and Smelting Co., Ltd (“Mitsui”). NYC was established to commercialize yttrium oxides. Due to the acquisition of TOKIN, the Company owned 30% of NYC's stock as of March 31, 2018. The carrying amount of the Company's equity investment in NYC was $8.1 million as of March 31, 2018.
NTS was established in 2004 by TOKIN, however since then, TOKIN sold 77% of its stock to Shinko Electric Industries, Co. Ltd ("Shinko"). NTS provides world-class electronic devices by utilizing global procurement networks. Due to the TOKIN acquisition, the Company owned 33% of NTS' stock as of March 31, 2018. During the year ended March 31, 2018, a significant portion of NTS' sales were TOKIN’s products. The carrying amount of the Company's equity investment in NTS was $1.0 million as of March 31, 2018.
Summarized transactions between TOKIN and NTS are as follows (amounts in thousands):
Fiscal Year March 31, 2018 | ||||
KEMET's sales to NTS | $ | 52,883 | ||
NTS' sales to KEMET | 1,616 | |||
Investment in Novasentis
KEMET has invested in the Series-D round of funding of Novasentis, a leading developer of film-based haptic actuators. Novasentis makes the world’s thinnest electro mechanical polymer-based actuators that provide rich haptic feedback for a variety of applications, including AR/VR and Wearables. Novasentis supplies its “smart” film and KEMET applies its expertise in manufacturing film capacitors to the development and commercial production of the actuators. The Company's
98
KEMET CORPORATION AND SUBSIDIARIES
Notes to Consolidated Financial Statements (Continued)
ownership percentage in Novasentis is 15% and has 1 of 3 seats on Novasentis’ board of directors. Additionally, KEMET has an exclusive manufacturing supply agreement, whereby Novasentis (the “Buyer”) will purchase goods exclusively from KEMET (the “Seller”) and the Seller shall manufacture and sell goods exclusively to the Buyer.
While the Company determined that Novasentis is a variable interest entity ("VIE"), ASC 810 provides that an entity is the primary beneficiary of a VIE if the entity has 1) the power to direct the activities of the VIE that most significantly impact the VIE's economic performance, and 2) the obligation to absorb losses of the VIE that could potentially be significant to the VIE or the right to receive benefits from the entity that could potentially be significant to the VIE. KEMET does not have power to purchase or sell any of Novasentis’ significant assets. KEMET will not incur any additional indebtedness, and cannot solely make acquisition and/or divestiture decisions. Furthermore, KEMET cannot solely determine the strategic operating direction of the entity. Based on an evaluation of these factors, the Company concluded that it is not the primary beneficiary of Novasentis. Accordingly, the Company accounts for its investment in Novasentis under the equity method of accounting.
Under the equity method, the Company's share of profits and losses and impairment charges on investments in affiliates are included in “Equity income (loss) from equity method investments” in the consolidated statements of operations. The carrying amount of the Company's equity investment in Novasentis was $2.9 million as of March 31, 2018.
Investment in TOKIN
On March 12, 2012, KEC, a wholly owned subsidiary of the Company, entered into a Stock Purchase Agreement (the “Stock Purchase Agreement”) with TOKIN and NEC Corporation (“NEC”) (together with its affiliate NEC Capital Solutions Limited, the sole shareholder of TOKIN) to acquire 51% of the common stock of TOKIN (which represented a 34% economic interest, as calculated based on the number of common shares held by KEC, directly and indirectly, in proportion to the aggregate number of outstanding common and convertible preferred shares of TOKIN as of such date) (the “Initial Purchase”). The transaction closed on February 1, 2013, at which time KEC paid a purchase price of $50.0 million for new shares of common stock of TOKIN (the “Initial Closing”). Through April 19, 2017, the Company accounted for its investment in TOKIN using the equity method for a non-consolidated variable interest entity since KEC did not have the power to direct significant activities of TOKIN. The Company believes that the TOKIN convertible preferred stock represents in-substance common stock of TOKIN and, as a result, its method of calculating KEC’s economic basis in TOKIN is the appropriate basis on which to recognize its share of the earnings or loss of TOKIN.
In connection with KEC’s execution of the Stock Purchase Agreement, KEC entered into a Stockholders’ Agreement (the “Stockholders’ Agreement”) with TOKIN and NEC, which provided for restrictions on transfers of TOKIN’s capital stock, certain tag-along and first refusal rights on transfer, restrictions on NEC’s ability to convert the preferred stock of TOKIN held by it, certain management services provided to TOKIN by KEC (or an affiliate of KEC) and certain board representation rights. From February 1, 2013 until April 19, 2017, KEC held four of seven TOKIN director positions. However, NEC had significant board rights.
Concurrent with the execution of the Stock Purchase Agreement and the Stockholders’ Agreement, KEC entered into an Option Agreement (the “Option Agreement”) with NEC, which was amended on August 29, 2014, whereby KEC had the right to purchase additional shares of TOKIN common stock from TOKIN for a purchase price of $50.0 million resulting in an economic interest of approximately 49% while maintaining ownership of 51% of TOKIN’s common stock (the “First Call Option”) by providing notice of the First Call Option between the Initial Closing and April 30, 2015. Upon providing such First Call Option notice, but not before April 1, 2015, KEC could also have exercised a second option to purchase all outstanding capital stock of TOKIN from its stockholders, primarily NEC, for a purchase price based on the greater of six times LTM EBITDA (as defined in the Option Agreement) less the previous payments and certain other adjustments, or the outstanding amount of TOKIN’s debt obligation to NEC (the “Second Call Option”) by providing notice of the Second Call Option by May 31, 2018. The First and Second Call Options expired on April 30, 2015 without being exercised.
Under the Option Agreement, from April 1, 2015 through May 31, 2018, NEC could have required KEC to purchase all outstanding capital stock of TOKIN from its stockholders, primarily NEC (the “Put Option”), provided that KEC’s payment of the Put Option price was permitted under the 10.5% Senior Notes and Loan and Security Agreement. On April 19, 2017, the Company completed its acquisition of the remaining 66% economic interest in TOKIN and TOKIN became a 100% owned subsidiary of KEMET. See Note 2, “Acquisitions,” for additional information. The Put Option was canceled under the Definitive TOKIN Stock Purchase Agreement, herein defined, for acquisition of the remaining 66% of TOKIN.
99
KEMET CORPORATION AND SUBSIDIARIES
Notes to Consolidated Financial Statements (Continued)
The Company marked these options to fair value in the fiscal years ended March 31, 2017 and 2016 and recognized a $10.7 million gain and a $26.3 million loss respectively, which are included on the line item “Change in value of TOKIN options” in the Consolidated Statement of Operations. The line item “Other non-current obligations” on the Consolidated Balance Sheets includes $9.9 million as of March 31, 2017 related to the options.
KEC’s total investment in TOKIN including the net call forward contract described above on February 1, 2013 was $54.5 million which included $50.0 million cash consideration plus approximately $4.5 million in transaction expenses (fees for legal, accounting, due diligence, investment banking and other various services necessary to complete the transactions). The Company made an allocation of the aggregate purchase price, which was based upon estimates that the Company believed to be reasonable.
Summarized financial information for TOKIN follows (amounts in thousands):
March 31, 2017 | |||
Current assets continuing operations | $ | 204,654 | |
Assets held for sale (current) (1) | 118,983 | ||
Noncurrent assets continuing operations | 285,952 | ||
Current liabilities continuing operations | 375,433 | ||
Liabilities held for sale (current) (1) | 50,008 | ||
Noncurrent liabilities continuing operations | 65,657 | ||
___________________________________________
(1) As discussed in Note 2, “Acquisitions,” TOKIN sold its EMD business on April 14, 2017.
19 Day Period Ended April 19, 2017 | Fiscal Year March 31, 2017 | Fiscal Year March 31, 2016 | |||||||
Net sales | $ | 23,649 | $ | 328,822 | $ | 301,898 | |||
Gross profit | 6,647 | 74,465 | 67,409 | ||||||
Net income (loss) | 247,786 | 128,502 | (42,995 | ) | |||||
A reconciliation between TOKIN’s net loss and KEMET’s equity investment income (loss) follows (amounts in thousands):
19 Day Period Ended April 19, 2017 | Fiscal Year March 31, 2017 | Fiscal Year March 31, 2016 | |||||||||
TOKIN net income (loss) | $ | 247,786 | $ | 128,502 | $ | (42,995 | ) | ||||
KEMET’s equity ownership % | 34 | % | 34 | % | 34 | % | |||||
Equity income (loss) from TOKIN before Adjustments | $ | 84,247 | $ | 43,691 | $ | (14,618 | ) | ||||
Adjustments: | |||||||||||
Amortization and depreciation | (113 | ) | (2,210 | ) | (1,625 | ) | |||||
Removal of EMD memo accounts | (8,981 | ) | — | — | |||||||
Inventory profit elimination | 24 | 162 | (163 | ) | |||||||
Equity income (loss) from TOKIN | 75,177 | 41,643 | (16,406 | ) | |||||||
Acquired equity method investment income (loss) | 1,015 | — | — | ||||||||
Equity income (loss) from equity method investments | $ | 76,192 | $ | 41,643 | $ | (16,406 | ) | ||||
100
KEMET CORPORATION AND SUBSIDIARIES
Notes to Consolidated Financial Statements (Continued)
A reconciliation between TOKIN’s net assets and KEMET’s equity investment balance follows (amounts in thousands):
___________________________________________
March 31, 2017 | |||
Investment in TOKIN | $ | 63,416 | |
Purchase price accounting basis adjustment: | |||
Property, plant and equipment (1) | 3,080 | ||
Technology (1) | (8,691 | ) | |
Long-term debt (1) | (1,067 | ) | |
Goodwill | (7,590 | ) | |
Indemnity asset for legal investigation | (8,500 | ) | |
Inventory profit elimination (2) | 208 | ||
Other | (569 | ) | |
KEMET’s 34% interest of TOKIN’s equity | $ | 40,287 | |
(1) Depreciated or amortized over the estimated lives.
(2) Adjusted each period for any activity
As of March 31, 2017, KEC’s maximum loss exposure as a result of its investments in TOKIN was limited to the aggregate of the carrying value of the investment, any accounts receivable balance due from TOKIN and obligations in the Put Option.
Summarized transactions between KEC and TOKIN are as follows (amounts in thousands):
19 Day Period Ended April 19, 2017 | Fiscal Year March 31, 2017 | Fiscal Year March 31, 2016 | |||||||||
KEC’s sales to TOKIN | $ | 727 | $ | 17,100 | $ | 21,061 | |||||
TOKIN’s sales to KEMET | 356 | 8,341 | 5,912 | ||||||||
March 31, 2017 | |||
Accounts receivable | $ | 2,662 | |
Accounts payable | 1,378 | ||
Management service agreement receivable (1) | 775 | ||
(1) In accordance with the Stockholders’ Agreement, KEC entered into a management services agreement with TOKIN to provide services for which KEC was being reimbursed.
KEMET JIANGHAI Joint Venture
On January 29, 2018, KEC entered into a joint venture agreement (the “Agreement”) with Jianghai (Nantong) Film Capacitor Co., Ltd (“Jianghai Film”), a subsidiary of Nantong Jianghai Capacitor Co., Ltd (“Jianghai”) for the formation of KEMET Jianghai Electronic Components Co. Ltd., a limited liability company located in Nantong, China. KEMET Jianghai Electronic Components will manufacture axial electrolytic capacitors and (H)EV Film DC brick capacitors, for distribution through the KEMET and Jianghai sales channels. KEC and Jianghai Film will each provide initial capital contributions of $5.0 million through a combination of cash and manufacturing equipment, and will be equally represented on the joint venture’s board of directors.
Once the initial capital contribution is made to the KEMET Jianghai joint venture, the Company will account for its investment using the equity method due to the related nature of operations, and the Company's ability to influence the joint venture's decisions. As of March 31, 2018, the Company does not have an investment balance in KEMET Jianghai.
101
KEMET CORPORATION AND SUBSIDIARIES
Notes to Consolidated Financial Statements (Continued)
Note 7: Segment and Geographic Information
The Company is organized into three segments: Solid Capacitors, Film and Electrolytic, and MSA based primarily on product lines. Each segment is responsible for its respective manufacturing operations and research and development efforts. All research and development expenses are direct costs to the respective segment.
Solid Capacitors
Solid Capacitors operates in ten manufacturing sites in the United States, Mexico and Asia, and operates innovation centers in the United States and Japan. Solid Capacitors primarily produces tantalum, aluminum, polymer and ceramic capacitors which are sold globally. Solid Capacitors also produces tantalum powder used in the production of tantalum capacitors.
Film and Electrolytic
Film and Electrolytic operates in ten manufacturing sites throughout Europe and Asia. Film and Electrolytic primarily produces film, paper, and electrolytic capacitors which are sold globally. In addition, this segment has product innovation centers in Italy, Portugal and Sweden.
MSA
MSA operates in four manufacturing sites throughout Asia. MSA primarily produces EMC materials and devices, piezo materials and actuators and various types of sensors which are sold globally. In addition, this segment has product innovation centers in Sendai and Shiroishi, Japan.
102
KEMET CORPORATION AND SUBSIDIARIES
Notes to Consolidated Financial Statements (Continued)
The following tables summarize information about each segment’s net sales, operating income (loss), depreciation and amortization, capital expenditures and total assets (amounts in thousands):
_______________________________________________________________________________
Fiscal Years Ended March 31, | ||||||||||||
2018 | 2017 | 2016 | ||||||||||
Net sales: | ||||||||||||
Solid Capacitors | $ | 771,240 | $ | 575,110 | $ | 556,303 | ||||||
Film and Electrolytic | 201,722 | 182,681 | 178,520 | |||||||||
MSA | 226,964 | — | — | |||||||||
$ | 1,199,926 | $ | 757,791 | $ | 734,823 | |||||||
Operating income (loss) (1)(2)(3): | ||||||||||||
Solid Capacitors | $ | 234,473 | $ | 147,662 | $ | 130,574 | ||||||
Film and Electrolytic | 4,073 | (8,200 | ) | 138 | ||||||||
MSA | 15,694 | — | — | |||||||||
Corporate | (140,937 | ) | (103,666 | ) | (96,879 | ) | ||||||
$ | 113,303 | $ | 35,796 | $ | 33,833 | |||||||
Depreciation and amortization: | ||||||||||||
Solid Capacitors | $ | 27,329 | $ | 20,824 | $ | 21,318 | ||||||
Film and Electrolytic | 10,012 | 10,953 | 11,984 | |||||||||
MSA | 4,407 | — | — | |||||||||
Corporate | 8,007 | 5,561 | 5,714 | |||||||||
$ | 49,755 | $ | 37,338 | $ | 39,016 | |||||||
Capital expenditures: | ||||||||||||
Solid Capacitors | $ | 31,249 | $ | 12,300 | $ | 10,098 | ||||||
Film and Electrolytic | 12,651 | 7,955 | 5,902 | |||||||||
MSA | 8,481 | — | — | |||||||||
Corporate | 12,623 | 5,362 | 4,469 | |||||||||
$ | 65,004 | $ | 25,617 | $ | 20,469 | |||||||
(1) Fiscal years 2017 and 2016 adjusted due to the adoption of ASU No. 2017-07.
(2) Restructuring charges included in Operating income (loss) were as follows (amounts in thousands):
Fiscal Years Ended March 31, | ||||||||||||
2018 | 2017 | 2016 | ||||||||||
Total restructuring: | ||||||||||||
Solid Capacitors | $ | 983 | $ | 1,333 | $ | 1,916 | ||||||
Film and Electrolytic | 5,788 | 3,738 | 1,714 | |||||||||
MSA | 3,343 | — | — | |||||||||
Corporate | 4,729 | 333 | 548 | |||||||||
$ | 14,843 | $ | 5,404 | $ | 4,178 | |||||||
103
KEMET CORPORATION AND SUBSIDIARIES
Notes to Consolidated Financial Statements (Continued)
(3) Gain (loss) on write down and disposal of long-lived assets included in operating income were as follows (amounts in thousands):
Fiscal Years Ended March 31, | ||||||||||||
2018 | 2017 | 2016 | ||||||||||
(Gain) loss on write down and disposal of long-lived assets | ||||||||||||
Solid Capacitors | $ | 689 | $ | 2,303 | $ | 536 | ||||||
Film and Electrolytic | (3,356 | ) | 8,339 | (270 | ) | |||||||
MSA | 1,272 | — | — | |||||||||
Corporate | 403 | 29 | 109 | |||||||||
$ | (992 | ) | $ | 10,671 | $ | 375 | ||||||
March 31, | ||||||||
2018 | 2017 | |||||||
Total assets: | ||||||||
Solid Capacitors | $ | 704,851 | $ | 439,281 | ||||
Film and Electrolytic | 236,314 | 204,407 | ||||||
MSA | 254,193 | — | ||||||
Corporate (1) | 22,911 | 90,637 | ||||||
$ | 1,218,269 | $ | 734,325 | |||||
_______________________________________________________________________________
(1) March 31, 2017 adjusted due to the adoption of ASU No. 2016-16.
The following highlights net sales by geographic location (amounts in thousands):
Fiscal Years Ended March 31,(1) | ||||||||||||
2018 | 2017 | 2016 | ||||||||||
United States | $ | 233,133 | $ | 198,250 | $ | 201,878 | ||||||
Hong Kong | 169,073 | 121,813 | 133,117 | |||||||||
Germany | 105,548 | 104,755 | 83,589 | |||||||||
Europe (2) | 63,993 | 64,316 | 57,362 | |||||||||
China | 163,016 | 71,223 | 65,043 | |||||||||
Taiwan (3) | 78,728 | 9,147 | 8,747 | |||||||||
Asia Pacific (2) | 36,647 | 26,878 | 32,426 | |||||||||
Japan (3) | 170,282 | 3,565 | 5,251 | |||||||||
United Kingdom | 37,038 | 33,837 | 28,083 | |||||||||
Netherlands | 39,684 | 32,478 | 31,218 | |||||||||
Malaysia (3) | 28,165 | 15,177 | 14,990 | |||||||||
Singapore | 17,267 | 15,565 | 16,260 | |||||||||
Italy | 17,905 | 15,376 | 14,391 | |||||||||
Hungary | 13,254 | 18,856 | 17,766 | |||||||||
Mexico | 23,915 | 22,424 | 23,041 | |||||||||
Other Countries (2) | 2,278 | 4,131 | 1,661 | |||||||||
Total Non-United States | 966,793 | 559,541 | 532,945 | |||||||||
$ | 1,199,926 | $ | 757,791 | $ | 734,823 | |||||||
_______________________________________________________________________________
(1) Revenues are attributed to countries or regions based on the location of the customer. Net Sales to one customer, TTI, Inc., exceeded 10% of total net sales as follows: $133.4 million, $104.4 million and $99.3 million in fiscal years 2018, 2017 and 2016, respectively.
(2) No country included in this caption exceeded 3% of consolidated net sales for fiscal years 2018, 2017 and 2016.
(3) Net sales from these countries were included within Asia Pacific in fiscal years 2017 and 2016 and have been broken out to conform with 2018 presentation.
104
KEMET CORPORATION AND SUBSIDIARIES
Notes to Consolidated Financial Statements (Continued)
The following geographic information includes Property, plant and equipment, net, based on physical location (amounts in thousands):
March 31, | ||||||||
2018 | 2017 | |||||||
United States | $ | 49,530 | $ | 46,387 | ||||
Japan | 79,855 | — | ||||||
Thailand | 74,100 | — | ||||||
Mexico | 62,503 | 55,878 | ||||||
Italy | 39,398 | 36,108 | ||||||
China | 36,396 | 23,780 | ||||||
Portugal | 29,073 | 21,637 | ||||||
Macedonia | 13,723 | 12,339 | ||||||
Sweden | 6,005 | 5,851 | ||||||
Other (1) | 14,733 | 7,331 | ||||||
Total Non-United States | 355,786 | 162,924 | ||||||
$ | 405,316 | $ | 209,311 | |||||
_______________________________________________________________________________
(1) No country included in this caption exceeded 2% of consolidated Property, plant and equipment net for fiscal years 2018 and 2017.
Note 8: (Gain) Loss on Write Down and Disposal of Long-Lived Assets
During fiscal year 2018, KEMET recorded a net gain on the write-down and disposal of long-lived assets of $1.0 million, which was comprised of $1.2 million in net gains on the sale and disposal of long-lived assets offset by $0.2 million in impairment charges. The net gains on the sale and disposal of long-lived assets are primarily related to the sale of equipment, land, and buildings from KFM, which was shut down in fiscal year 2017. On March 13, 2018, the Company sold KFM's land and buildings to a third party for a gross sales price of $3.6 million. The net proceeds realized by the Company were approximately $3.4 million after payment of $0.2 million in closing costs. The Company realized a gain on the sale of the land and buildings of approximately $1.9 million during the year ended March 31, 2018 as a result of the sale. In addition, the Company sold KFM's equipment for a $1.4 million gain. These gains were partially offset by MSA's loss on disposals of assets of $1.3 million primarily related to equipment and buildings used for discontinued products and Solid Capacitors' loss of approximately $0.6 million related to the relocation of its K-Salt operations from a leased facility to its existing Matamoros, Mexico facility. This activity is recorded on the Consolidated Statements of Operations line item "(Gain) loss on write down and disposal of long-lived assets."
During fiscal year 2017, the Company recorded a net loss on write down and disposal of long-lived assets of $10.7 million, which was comprised of $10.3 million in impairment charges and $0.4 million in net losses on the sale and disposals of long-lived assets. In fiscal year 2017, Film and Electrolytic incurred impairment charges totaling $8.2 million ($0.18 per basic share and $0.15 per diluted share). The impairment charges consisted of the following two actions.
On August 31, 2016, KEMET Electronics Corporation, a wholly-owned subsidiary of KEMET made the decision to shut-down operations of its wholly-owned subsidiary, KFM. Operations at KFM’s Knoxville, Tennessee plant ceased as of October 31, 2016. KFM supplied formed foil to the Company’s Film and Electrolytic Business Group, as well as to certain third party customers. The Company anticipated that Film and Electrolytic will achieve raw material cost savings by purchasing its formed foil from suppliers that have the advantage of lower utility costs. The Company recorded impairment charges related to KFM totaling $4.1 million comprised of $3.0 million for the write down of property plant and equipment and $1.1 million for the write down of intangible assets. In addition, the Company accrued severance charges and restructuring costs described in Note 4, “Restructuring.”
The Company also recorded impairment charges of $4.1 million related to a decline in real estate market conditions surrounding its vacated Sasso Marconi, Italy manufacturing facility. KEMET used a capitalization of income method to estimate fair value taking into account the surface area of the property, the lease price per unit of surface area, and a weighted
105
KEMET CORPORATION AND SUBSIDIARIES
Notes to Consolidated Financial Statements (Continued)
average cost of capital. The measurements utilized to determine the fair value of the property represent inputs that are observable or can be corroborated by observable market data (Level 2) in accordance with the fair value hierarchy.
In fiscal year 2017, Solid Capacitors incurred impairment charges totaling $2.1 million ($0.04 per basic share and $0.04 per diluted share) related to the relocation of our leased K-salt facility to our existing Matamoros, Mexico facility. In addition, the Company accrued severance and equipment relocation charges described in Note 4 “Restructuring” during fiscal year 2017.
During fiscal year 2016, the Company incurred net a loss on write-down and disposal of long-lived assets of $0.4 million, which was fully comprised of disposals of long-lived assets.
Note 9: Pension and Other Post-retirement Benefit Plans
The Company sponsors eleven defined benefit pension plans: six in Europe, one in Singapore, two in Mexico, and with the completion of the TOKIN acquisition in April 2017, two plans in Japan. The Company funds the pension liabilities in accordance with laws and regulations applicable to those plans.
In addition, the Company maintains two frozen post-retirement benefit plans: health care and life insurance benefits for certain retired United States employees who reached retirement age while working for the Company. The health care plan is contributory, with participants’ contributions adjusted annually. The life insurance plan is non-contributory.
A summary of the changes in benefit obligations and plan assets is as follows (amounts in thousands):
Pension | Other Benefits | |||||||||||||||
2018 | 2017 | 2018 | 2017 | |||||||||||||
Change in Benefit Obligation | ||||||||||||||||
Benefit obligation at beginning of the year | $ | 45,171 | $ | 45,716 | $ | 386 | $ | 623 | ||||||||
Service cost | 4,585 | 1,298 | — | — | ||||||||||||
Interest cost | 1,750 | 1,297 | 12 | 11 | ||||||||||||
Plan participants’ contributions | — | — | 536 | 592 | ||||||||||||
Actuarial (gain) loss | 437 | 1,980 | 64 | (228 | ) | |||||||||||
Foreign currency exchange rate change | 9,934 | (3,732 | ) | — | — | |||||||||||
Gross benefits paid | (1,128 | ) | (1,120 | ) | (631 | ) | (612 | ) | ||||||||
Curtailments and settlements | (5,642 | ) | (268 | ) | — | — | ||||||||||
Acquisitions | 106,566 | — | — | — | ||||||||||||
Benefit obligation at end of year | $ | 161,673 | $ | 45,171 | $ | 367 | $ | 386 | ||||||||
Change in Plan Assets | ||||||||||||||||
Fair value of plan assets at beginning of year | $ | 10,004 | $ | 10,268 | $ | — | $ | — | ||||||||
Actual return on plan assets | 2,594 | 1,099 | — | — | ||||||||||||
Foreign currency exchange rate changes | 3,831 | (1,361 | ) | — | — | |||||||||||
Employer contributions | 4,766 | 1,176 | 95 | 20 | ||||||||||||
Settlements | (5,659 | ) | (58 | ) | — | — | ||||||||||
Plan participants’ contributions | — | — | 536 | 592 | ||||||||||||
Gross benefits paid | (1,128 | ) | (1,120 | ) | (631 | ) | (612 | ) | ||||||||
Acquisitions | 57,083 | — | — | — | ||||||||||||
Fair value of plan assets at end of year | $ | 71,491 | $ | 10,004 | $ | — | $ | — | ||||||||
Funded status at end of year | ||||||||||||||||
Fair value of plan assets | $ | 71,491 | $ | 10,004 | $ | — | $ | — | ||||||||
Benefit obligations | (161,673 | ) | (45,171 | ) | (367 | ) | (386 | ) | ||||||||
Amount recognized at end of year | $ | (90,182 | ) | $ | (35,167 | ) | $ | (367 | ) | $ | (386 | ) | ||||
106
KEMET CORPORATION AND SUBSIDIARIES
Notes to Consolidated Financial Statements (Continued)
The Company expects to contribute $6.2 million to the pension plans in fiscal year 2019, which includes direct contributions to be made for funded plans and benefit payments to be made for unfunded plans.
The Company does not pre-fund its post-retirement health care and life insurance benefit plans. As a result, the Company is responsible annually for the payment of benefits as incurred by the plans. The Company anticipates making payments of $55 thousand during fiscal year 2019.
Amounts recognized in the Consolidated Balance Sheets consist of the following (amounts in thousands):
Pension | Other Benefits | |||||||||||||||
2018 | 2017 | 2018 | 2017 | |||||||||||||
Current liability | $ | (7,000 | ) | $ | (827 | ) | $ | (54 | ) | $ | (52 | ) | ||||
Noncurrent liability | (83,182 | ) | (34,340 | ) | (313 | ) | (334 | ) | ||||||||
Amount recognized, end of year | $ | (90,182 | ) | $ | (35,167 | ) | $ | (367 | ) | $ | (386 | ) | ||||
Amounts recognized in Accumulated other comprehensive income (loss) consist of the following (amounts in thousands):
Pension | Other Benefits | |||||||||||||||
2018 | 2017 | 2018 | 2017 | |||||||||||||
Net actuarial loss (gain) | $ | 15,691 | $ | 16,196 | $ | (879 | ) | $ | (1,134 | ) | ||||||
Prior service cost | 1,413 | 1,500 | — | — | ||||||||||||
Accumulated other comprehensive (income) loss | $ | 17,104 | $ | 17,696 | $ | (879 | ) | $ | (1,134 | ) | ||||||
Although not reflected in the table above, the tax effect on the balances was $2.3 million and $2.7 million as of March 31, 2018 and 2017, respectively.
Components of benefit costs (credit) consist of the following (amounts in thousands):
Pension | Other Benefits | |||||||||||||||||||||||
2018 | 2017 | 2016 | 2018 | 2017 | 2016 | |||||||||||||||||||
Net service cost | $ | 4,585 | $ | 1,298 | $ | 1,507 | $ | — | $ | — | $ | — | ||||||||||||
Interest cost | 1,750 | 1,297 | 1,347 | 12 | 11 | 19 | ||||||||||||||||||
Expected return on plan assets (1) | (1,956 | ) | (346 | ) | (433 | ) | — | — | — | |||||||||||||||
Amortization: | ||||||||||||||||||||||||
Actuarial (gain) loss (2) | 393 | 419 | 704 | (191 | ) | (207 | ) | (191 | ) | |||||||||||||||
Prior service cost | 87 | 82 | 60 | — | — | — | ||||||||||||||||||
Recurring activity | 4,859 | 2,750 | 3,185 | (179 | ) | (196 | ) | (172 | ) | |||||||||||||||
One time expense (income) | (71 | ) | (11 | ) | — | — | — | — | ||||||||||||||||
Net periodic benefit cost (credit) | $ | 4,788 | $ | 2,739 | $ | 3,185 | $ | (179 | ) | $ | (196 | ) | $ | (172 | ) | |||||||||
_______________________________________________________________________________
(1) The Company has elected to use the actual fair value of plan assets as the market-related value of assets in the determination of the expected return on plan assets.
(2) Actuarial gains and losses are amortized using a corridor approach. The total unrecognized amount of cumulative actuarial gain or loss in excess of 10% of the greater of the market value of assets or the projected benefit obligation is amortized over the average remaining service of active employees/lifetime of plan participants for plans with no active participants.
The estimated amounts related to pensions that will be amortized from accumulated other comprehensive income into net periodic benefit costs in fiscal year 2019 are actuarial losses of $429 thousand, and prior service costs of $92 thousand. The estimated amounts related to other benefits that will be amortized from accumulated other comprehensive income into net periodic benefit costs in fiscal year 2019 are actuarial gains of $155 thousand.
107
KEMET CORPORATION AND SUBSIDIARIES
Notes to Consolidated Financial Statements (Continued)
The asset allocation for the Company’s defined benefit pension plans at March 31, 2018 and the target allocation for 2018, by asset category, are as follows:
Asset Category | Target Allocation (%) | Plan Assets at March 31, 2018 (%) | ||
Insurance (1) | 10 | 1 | ||
International equities | 15 | 31 | ||
International bonds | 60 | 61 | ||
Other | 15 | 7 | ||
Total | 100 | 100 | ||
_______________________________________________________________________________
(1) Comprised of assets held by the defined benefit pension plan in Germany.
The Company’s investment strategy for its defined benefit pension plans is to maximize long-term rate of return on plan assets within an acceptable level of risk in order to minimize the cost of providing pension benefits. The investment policy establishes a target allocation range for each asset class and the fund is managed within those ranges. The plans use a number of investment approaches including insurance products, equity and fixed income funds in which the underlying securities are marketable in order to achieve this target allocation. Certain plans invest solely in insurance products. The Company continuously monitors the performance of the overall pension asset portfolio, asset allocation policies, and the performance of individual pension asset managers and makes adjustments and changes, as required. The Company does not manage any assets internally, does not have any passive investments in index funds, and does not directly utilize futures, options, or other derivative instruments or hedging strategies with regard to the pension plans; however, the investment mandate of some pension asset managers allows the use of the foregoing as components of their portfolio management strategies.
The expected rate of return was determined by modeling the expected long-term rates of return for broad categories of investments held by the plan against a number of various potential economic scenarios.
Other changes in plan assets and benefit obligations recognized in Accumulated other comprehensive income (loss) are as follows (amounts in thousands):
Pension | Other Benefits | |||||||||||||||||||||||
2018 | 2017 | 2016 | 2018 | 2017 | 2016 | |||||||||||||||||||
Current year actuarial (gain) loss | $ | (184 | ) | $ | 1,229 | $ | (5,125 | ) | $ | 64 | $ | (228 | ) | $ | (146 | ) | ||||||||
Amortization of actuarial gain (loss) | (322 | ) | (619 | ) | (698 | ) | 191 | 208 | 191 | |||||||||||||||
Current year prior service cost | — | — | 342 | — | — | — | ||||||||||||||||||
Amortization of prior service cost | (87 | ) | (82 | ) | (60 | ) | — | — | — | |||||||||||||||
Total recognized in other comprehensive income | $ | (593 | ) | $ | 528 | $ | (5,541 | ) | $ | 255 | $ | (20 | ) | $ | 45 | |||||||||
Total recognized in net periodic benefit cost and other comprehensive income (loss) | $ | 4,195 | $ | 3,267 | $ | (2,356 | ) | $ | 76 | $ | (216 | ) | $ | (127 | ) | |||||||||
Each of these changes has been factored into the following benefit payments schedule for the next ten fiscal years. The Company expects to have benefit payments in the future as follows (amounts in thousands):
Expected benefit payments | ||||||||||||||||||||||||
2019 | 2020 | 2021 | 2022 | 2023 | 2024- 2028 | |||||||||||||||||||
Pension benefits | $ | 8,968 | $ | 7,417 | $ | 7,487 | $ | 10,105 | $ | 9,059 | $ | 57,685 | ||||||||||||
Other benefits | 55 | 52 | 47 | 43 | 39 | 131 | ||||||||||||||||||
Total | $ | 9,023 | $ | 7,469 | $ | 7,534 | $ | 10,148 | $ | 9,098 | $ | 57,816 | ||||||||||||
108
KEMET CORPORATION AND SUBSIDIARIES
Notes to Consolidated Financial Statements (Continued)
The following weighted-average assumptions were used to determine the projected benefit obligation at the measurement date and the net periodic cost for the pension and post-retirement plan (amounts in thousands except percentages):
Pension | Other Benefits | |||||||||||||
2018 | 2017 | 2018 | 2017 | |||||||||||
Projected benefit obligation: | ||||||||||||||
Discount rate (1) | 1.2 | % | 3.1 | % | 3.5 | % | 3.2 | % | ||||||
Rate of compensation increase | 3.5 | % | 3.5 | % | — | % | — | % | ||||||
Health care cost trend on covered charges | — | % | — | % | 7.0% decreasing to ultimate trend of 5% in 2022 | 7.0% decreasing to ultimate trend of 5% in 2021 | ||||||||
Net periodic benefit cost: | ||||||||||||||
Discount rate | 1.2 | % | 3.1 | % | 3.2 | % | 2.8 | % | ||||||
Rate of compensation increase | 3.5 | % | 3.5 | % | — | % | — | % | ||||||
Expected return on plan assets | 3.0 | % | 3.2 | % | — | % | — | % | ||||||
Health care cost trend on covered charges | — | % | — | % | 7.0% decreasing to ultimate trend of 5% in 2021 | 7.0% decreasing to ultimate trend of 5% in 2021 | ||||||||
Sensitivity of retiree welfare results | ||||||||||||||
Effect of a one percentage point increase in assumed health care cost trend: | ||||||||||||||
On total service and interest costs components | $ | — | $ | — | ||||||||||
On post-retirement benefits obligation | — | — | ||||||||||||
Effect of a one percentage point decrease in assumed health care cost trend: | ||||||||||||||
On total service and interest costs components | — | — | ||||||||||||
On post-retirement benefits obligation | — | — | ||||||||||||
___________________________________________
(1) The change in 2018 pension discount rate is primarily driven by the inclusion of TOKIN discount rate into the weighted averaged discount rate calculations after the acquisition of TOKIN. As discussed in Note 2, “Acquisitions,” TOKIN sold its EMD business on April 14, 2017.
The measurement date used to determine pension and post-retirement benefits is March 31.
The Company evaluated input from its third-party actuary to determine the appropriate discount rate. The determination of the discount rate is based on various factors such as the rate on bonds, term of the expected payouts, and long-term inflation factors.
109
KEMET CORPORATION AND SUBSIDIARIES
Notes to Consolidated Financial Statements (Continued)
The following table sets forth by level, within the fair value hierarchy as described in Note 1, the pension plan’s assets, required to be carried at fair value on a recurring basis as of March 31, 2018 and March 31, 2017 (amounts in thousands):
Fair Value March 31, 2018 | Fair Value Measurement Using | Fair Value March 31, 2017 | Fair Value Measurement Using | |||||||||||||||||||||||||||||
Level 1 | Level 2 (1) | Level 3 (2) | Level 1 | Level 2 | Level 3 | |||||||||||||||||||||||||||
Cash and cash equivalents | $ | 193 | $ | 193 | $ | — | $ | — | $ | 86 | $ | 86 | $ | — | $ | — | ||||||||||||||||
Equity securities: | ||||||||||||||||||||||||||||||||
International equities | 22,391 | — | 22,391 | — | 1,760 | — | 1,760 | — | ||||||||||||||||||||||||
Fixed income securities: | ||||||||||||||||||||||||||||||||
International bonds | 43,742 | — | 43,742 | — | 6,275 | — | 6,275 | — | ||||||||||||||||||||||||
Insurance contracts | 697 | — | — | 697 | 580 | — | — | 580 | ||||||||||||||||||||||||
Diversified growth funds | 4,468 | — | 4,468 | — | 1,303 | — | 1,303 | — | ||||||||||||||||||||||||
$ | 71,491 | $ | 193 | $ | 70,601 | $ | 697 | $ | 10,004 | $ | 86 | $ | 9,338 | $ | 580 | |||||||||||||||||
(1) Level 2 plan assets consist of pooled investment funds which are unquoted and have no restriction on redemption. Fair value was determined using daily, weekly, or monthly trading activity which derives the unit price of the pooled fund.
(2) Level 3 plan assets are invested in reinsurance contracts whose value is the sum of the actuarial reserve and the profit participation of each contract. The actuarial reserve is the sum of discounted cash flows associated with future benefits and premiums.
The table below sets forth a summary of changes in the fair value of the defined benefit pension plan’s Level 3 assets for the fiscal years ended March 31, 2017 and March 31, 2018 (amounts in thousands):
Balance at March 31, 2016 | $ | 611 | |
Actual return on plan assets | 20 | ||
Employer contributions | 198 | ||
Benefits paid | (211 | ) | |
Foreign currency exchange rate change | (38 | ) | |
Balance at March 31, 2017 | $ | 580 | |
Actual return on plan assets | 41 | ||
Employer contributions | 219 | ||
Benefits paid | (233 | ) | |
Foreign currency exchange rate change | 90 | ||
Balance at March 31, 2018 | $ | 697 | |
The Company also sponsors a deferred compensation plan for highly compensated employees. The plan is non-qualified and allows certain employees to contribute to the plan. Company matches, net of gains (losses) related to the deferred compensation plan, were $206 thousand in fiscal year 2018, $176 thousand in fiscal year 2017, and $5 thousand in fiscal year 2016. Total benefits accrued under this plan were $2.1 million and $1.8 million at March 31, 2018 and March 31, 2017, respectively.
In addition, the Company has a defined contribution retirement plan (the “Savings Plan”) in which all United States employees who meet certain eligibility requirements may participate. A participant may direct the Company to contribute amounts, based on a percentage of the participant’s compensation, to the Savings Plan through the execution of salary reduction agreements. In addition, the participants may elect to make after-tax contributions. The Company matches contributions to the Savings Plan up to 6% of the employee’s salary. The Company made matching contributions of $2.2 million, $2.4 million and $2.1 million in fiscal years 2018, 2017, and 2016, respectively.
110
KEMET CORPORATION AND SUBSIDIARIES
Notes to Consolidated Financial Statements (Continued)
Note 10: Stock-Based Compensation
The Company’s stock-based compensation plans are broad-based, long-term retention programs intended to attract and retain talented employees and align stockholder and employee interests.
The major components of stock-based compensation expense are as follows (amounts in thousands):
Fiscal year ended March 31, 2018 | Fiscal year ended March 31, 2017 | Fiscal year ended March 31, 2016 | ||||||||||||||||||||||||||||||||||
Stock Options | Restricted Stock | LTIPs | Stock Options | Restricted Stock | LTIPs | Stock Options | Restricted Stock | LTIPs | ||||||||||||||||||||||||||||
Cost of sales | $ | — | $ | 865 | $ | 654 | $ | 21 | $ | 634 | $ | 729 | $ | 81 | $ | 617 | $ | 720 | ||||||||||||||||||
Selling, general and administrative expenses | — | 4,195 | 1,695 | 20 | 1,490 | 1,620 | 78 | 1,352 | 1,732 | |||||||||||||||||||||||||||
Research and development | — | 46 | 202 | 1 | 26 | 179 | 4 | 23 | 167 | |||||||||||||||||||||||||||
$ | — | $ | 5,106 | $ | 2,551 | $ | 42 | $ | 2,150 | $ | 2,528 | $ | 163 | $ | 1,992 | $ | 2,619 | |||||||||||||||||||
Employee Stock Options
As of March 31, 2018, the KEMET Corporation Omnibus Incentive Plan (the “Incentive Plan”), which amended and restated the KEMET Corporation 2014 Amendment and Restatement of the KEMET Corporation 2011 Omnibus Equity Incentive Plan, approved by the Company’s stockholders on August 2, 2017, is the only plan the Company has to issue equity based awards to executives and key employees. Upon adoption of the Incentive Plan, no further awards were permitted to be granted under the Company’s prior plans, including the 1992 Key Employee Stock Option Plan, the 1995 Executive Stock Option Plan, and the 2004 Long-Term Equity Incentive Plan (collectively, the “Prior Plans”).
The Incentive Plan authorized the grant of up to 12.2 million shares of the Company’s Common Stock, comprised of 11.4 million shares under the Incentive Plan and 0.8 million shares remaining from the Prior Plans and authorizes the Company to provide equity-based compensation in the form of:
• | stock options, including incentive stock options, entitling the optionee to favorable tax treatment under Section 422 of the Code; |
• | stock appreciation rights; |
• | restricted stock and restricted stock units ("RSUs"); |
• | other share-based awards; and |
• | performance awards. |
Options issued under these plans vest within two to three years and expire ten years from the grant date. For the stock options granted to the Company’s Chief Executive Officer on January 27, 2010, 50% vested on June 30, 2014 and 50% vested on June 30, 2015.
If available, the Company issues shares of Common Stock from treasury stock upon exercise of stock options and vesting of restricted stock units. The Company has no plans to purchase additional shares in conjunction with its employee stock option plans in the near future.
111
KEMET CORPORATION AND SUBSIDIARIES
Notes to Consolidated Financial Statements (Continued)
Employee stock option activity for fiscal year 2018 is as follows:
Options (in thousands) | Weighted- Average Exercise Price | ||||||
Outstanding at March 31, 2017 | 964 | $ | 7.27 | ||||
Exercised | (718 | ) | 7.25 | ||||
Expired | (16 | ) | 21.19 | ||||
Outstanding at March 31, 2018 | 230 | 6.36 | |||||
Exercisable at March 31, 2018 | 230 | $ | 6.36 | ||||
Remaining weighted average contractual life of options exercisable (years) | 3.86 | ||||||
Remaining weighted average contractual life of options outstanding (years) | 3.86 | ||||||
Amounts included in the following table are in thousands, except weighted average fair value and weighted average exercise price:
Fiscal Years Ended March 31, | ||||||||||||
2018 | 2017 | 2016 | ||||||||||
Weighted average grant-date fair value of non-vested shares | $ | — | $ | — | $ | 2.72 | ||||||
Weighted average grant-date fair value of shares | ||||||||||||
Granted | — | — | — | |||||||||
Vested | — | 2.72 | 2.73 | |||||||||
Forfeited | — | 2.72 | 2.81 | |||||||||
Total estimated fair value of shares vested | — | 223 | 548 | |||||||||
Intrinsic value | ||||||||||||
Stock options exercised | 6,914 | 890 | — | |||||||||
Options outstanding | 2,713 | |||||||||||
Options currently exercisable | 2,713 | |||||||||||
Total unrecognized compensation cost, non-vested options | — | |||||||||||
Weighted-average period of recognition for unrecognized compensation cost (in years) | N/A | |||||||||||
Weighted average exercise price of stock options expected to vest | N/A | |||||||||||
All option plans provide that options to purchase shares be supported by the Company’s authorized but unissued common stock or treasury stock. All restricted stock and performance awards are also supported by the Company’s authorized but unissued common stock or treasury stock. The prices of the options granted pursuant to these plans are not less than 100% of the value of the shares on the date of the grant.
112
KEMET CORPORATION AND SUBSIDIARIES
Notes to Consolidated Financial Statements (Continued)
Restricted Stock Units (“RSU’s”)
Restricted stock unit activity for fiscal year 2018 is as follows (amounts in thousands except fair value):
Shares | Weighted- average Fair Value on Grant Date | ||||||
Non-vested restricted stock at March 31, 2017 | 1,382 | $ | 4.00 | ||||
Granted | 613 | 17.57 | |||||
Vested | (534 | ) | 4.22 | ||||
Forfeited | (56 | ) | 6.46 | ||||
Non-vested restricted stock at March 31, 2018 | 1,405 | $ | 9.81 | ||||
The Company grants RSUs to members of the Board of Directors, the Chief Executive Officer and a limited group of executives. In fiscal year 2018, RSUs granted to the Board of Directors vest in one year and RSUs granted to certain officers and under the key manager stock program vest over 3 years. Once vested, RSUs are converted into restricted shares of common stock, except for RSUs granted to members of the Board of Directors, who can elect to defer settlement of the RSUs to a later date. Restricted shares cannot be sold until 90 days after the Chief Executive Officer, executive, key manager, or member of the Board of Directors, as applicable, resigns from his or her position, or until the KEMET employee achieves the targeted ownership under the Company’s stock ownership guidelines, and only to the extent that such ownership exceeds the target. As of March 31, 2018 and 2017, unrecognized compensation costs related to the non-vested restricted stock share based compensation arrangements granted were $8.1 million and $2.7 million, respectively. The expense is being recognized over the respective vesting periods.
Long-term Incentive Plans (“LTIP”)
Historically the Board of Directors of the Company has approved annual Long Term Incentive Plans which cover two year periods and are primarily based upon the achievement of an adjusted EBITDA range for the two-year period. At the time of the award, the individual plans entitle the participants to receive cash or RSUs, or a combination of both as determined by the Company's Board of Directors. The Company assesses the likelihood of meeting the Adjusted EBITDA financial metric on a quarterly basis and adjusts compensation expense to match expectations. The 2015/2016 LTIP, 2016/2017 LTIP, 2017/2018 LTIP and 2018/2019 LTIP also awarded time-based RSUs which vest over the course of three years from the anniversary of the establishment of the plan are are not subject to a performance metric. Any related liability (for the cash portion of the LTIP) is reflected in the line item “Accrued expenses” on the Consolidated Balance Sheets and any restricted stock commitment is reflected in the line item “Additional paid-in capital” on the Consolidated Balance Sheets.
The following is the performance-based vesting schedule of RSU under each respective LTIP, subject to the respective participant’s continued employment with KEMET (shares in thousands):
___________________________________________
2018/2019 (1) | 2017/2018 (1) | 2016/2017 | 2015/2016 | |||||||||
Performance-based award vested fiscal year 2018 | — | — | 173 | 102 | ||||||||
Performance-based award vesting fiscal year 2019 | — | — | 173 | — | ||||||||
(1) The performance portion of the 2018/2019 and 2017/2018 LTIP are payable in cash.
The following is the time-based vesting schedule of RSU under each respective LTIP, subject to the respective participant’s continued employment with KEMET (shares in thousands):
2018/2019 | 2017/2018 | 2016/2017 | 2015/2016 | |||||||||
Time-based award vested fiscal year 2018 | — | 198 | 186 | 113 | ||||||||
Time-based award vesting fiscal year 2019 | 72 | 198 | 191 | — | ||||||||
Time-based award vesting fiscal year 2020 | 72 | 204 | — | — | ||||||||
Time-based award vesting fiscal year 2021 | 74 | — | — | — | ||||||||
113
KEMET CORPORATION AND SUBSIDIARIES
Notes to Consolidated Financial Statements (Continued)
In the Operating activities section of the Consolidated Statements of Cash Flows, stock-based compensation expense was treated as an adjustment to net income (loss) for fiscal years 2018, 2017 and 2016.
Note 11: Income Taxes
The components of Income (loss) before income taxes and equity income (loss) from equity method investments are as follows (amounts in thousands):
Fiscal Years Ended March 31, | ||||||||||||
2018 | 2017 | 2016 | ||||||||||
Domestic (U.S.) | $ | 141,632 | $ | 653 | $ | (38,581 | ) | |||||
Foreign (Outside U.S.) | 45,886 | 9,983 | 7,364 | |||||||||
Total | $ | 187,518 | $ | 10,636 | $ | (31,217 | ) | |||||
The provision (benefit) for Income tax expense is as follows (amounts in thousands):
Fiscal Years Ended March 31, | ||||||||||||
2018 | 2017 | 2016 | ||||||||||
Current: | ||||||||||||
Federal | $ | 223 | $ | — | $ | — | ||||||
State and local | 50 | 62 | 95 | |||||||||
Foreign | 8,295 | 4,247 | 5,416 | |||||||||
Total current income tax expense from continuing operations | 8,568 | 4,309 | 5,511 | |||||||||
Deferred: | ||||||||||||
Federal | (807 | ) | (6 | ) | (647 | ) | ||||||
State and local | (96 | ) | (97 | ) | 172 | |||||||
Foreign | 1,516 | 84 | 970 | |||||||||
Deferred tax expense (benefit) from continuing operations | 613 | (19 | ) | 495 | ||||||||
Provision for income taxes | $ | 9,181 | $ | 4,290 | $ | 6,006 | ||||||
The Company realized a deferred tax expense (benefit) for fiscal years ended 2018, 2017 and 2016 of $0.6 million, $1.2 million and $1.4 million, respectively, in certain foreign jurisdictions based on changes in judgment about the realizability of deferred tax assets in future years.
114
KEMET CORPORATION AND SUBSIDIARIES
Notes to Consolidated Financial Statements (Continued)
Differences between the provision for income taxes on earnings from continuing operations and the amount computed using the U.S. Federal statutory income tax rate are as follows (amounts in thousands):
___________________________________________
Fiscal Years Ended March 31, | ||||||||||||
2018 | 2017 | 2016 | ||||||||||
Amount computed using the statutory rate (1) | $ | 59,162 | $ | 3,722 | $ | (10,926 | ) | |||||
Change in U.S. valuation allowance | (66,948 | ) | (7,080 | ) | 4,099 | |||||||
Unremitted earnings of foreign subsidiaries | — | 2,127 | (231 | ) | ||||||||
Effect of prior year adjustments (2) | (1,337 | ) | 1,789 | (286 | ) | |||||||
Expired foreign tax credits | 407 | 4,766 | — | |||||||||
Effect of business combination | — | — | (648 | ) | ||||||||
Taxable foreign source income | 22,238 | 1,835 | 2,415 | |||||||||
(Put)/call option valuation impact | — | (3,745 | ) | 7,381 | ||||||||
Non-taxable gain from bargain purchase | (41,292 | ) | — | — | ||||||||
Tax-deductible equity compensation | (5,699 | ) | (44 | ) | — | |||||||
Other non-deductible expenses | 220 | (893 | ) | 126 | ||||||||
Differences due to U.S. tax law changes (3) | 50,420 | — | — | |||||||||
State income taxes, net of federal taxes (4) | (3,325 | ) | (35 | ) | 267 | |||||||
Change in foreign operations tax exposure reserves | 1,059 | 108 | 998 | |||||||||
Change in foreign tax law | 251 | 144 | 981 | |||||||||
Change in foreign operations valuation allowance (5) | (6,676 | ) | 983 | (200 | ) | |||||||
Other effect of foreign operations | 701 | 613 | 2,030 | |||||||||
Provision for income taxes | $ | 9,181 | $ | 4,290 | $ | 6,006 | ||||||
(1) The statutory income tax rate for fiscal years ended March 31, 2017 and March 31, 2016 is 35%. The Tax Cuts and Jobs Act enacted on December 22, 2017 reduced the U.S. federal corporate tax rate from 35% to 21%, effective January 1, 2018. Based on the fiscal year of the Company ending on March 31, the statutory income tax rate for the fiscal year ended March 31, 2018 is a blended rate of 31.55% based on the number of days in the fiscal year before January 1, 2018 and the number of days in the fiscal after December 31, 2017.
(2) The effect of prior year adjustments is offset by a full valuation allowance resulting in no impact on the provision for income taxes.
(3) Differences due to tax law changes consists of $4.8 million related foreign earnings and $45.6 million related to tax rate adjustment. $45.6 million related to tax rate adjustment is the gross deferred rate change, which is offset by valuation allowance adjustment, resulting in a net benefit of $0.8 million.
(4) State net operating losses of $3.7 million resulted from the change in the federal tax rate.
(5) The change in foreign operations valuation allowance excludes other comprehensive income and currency translation adjustments of ($3.4) million, $0.9 million, and $0.6 million for fiscal years ended 2018, 2017 and 2016, respectively, which has no impact on the provision for income taxes.
The foreign jurisdictions having the greatest effect on the provision for income taxes are China and Mexico. The statutory tax rates for China and Mexico are 25% and 30%, respectively. The combined provision for income taxes for China and Mexico for fiscal years ended 2018, 2017 and 2016 is $3.8 million, $3.1 million, and $3.2 million, respectively.
115
KEMET CORPORATION AND SUBSIDIARIES
Notes to Consolidated Financial Statements (Continued)
The components of deferred tax assets and liabilities are as follows (amounts in thousands):
__________________________________________________________________
March 31, | ||||||||
2018 | 2017 | |||||||
Deferred tax assets: | ||||||||
Net operating loss carry forwards | $ | 115,064 | $ | 165,161 | ||||
Sales allowances and inventory reserves | 9,675 | 14,910 | ||||||
Medical and employee benefits | 38,572 | 16,336 | ||||||
Depreciation and differences in basis | 6,241 | — | ||||||
Accrued restructuring | 2,551 | — | ||||||
Anti-trust fines and settlements | 16,575 | — | ||||||
Tax credits | 4,208 | 4,954 | ||||||
Stock-based compensation | 1,765 | 2,501 | ||||||
Other | 3,299 | 2,357 | ||||||
Total deferred tax assets before valuation allowance | 197,950 | 206,219 | ||||||
Less valuation allowance | (171,401 | ) | (163,898 | ) | ||||
Total deferred tax assets | 26,549 | 42,321 | ||||||
Deferred tax liabilities: | ||||||||
Unremitted earnings of subsidiaries | (11,678 | ) | (20,265 | ) | ||||
Depreciation and differences in basis | — | (7,802 | ) | |||||
Amortization of intangibles and debt discounts | (14,054 | ) | (6,207 | ) | ||||
Non-amortized intangibles (1) | (1,551 | ) | (2,549 | ) | ||||
Other | — | (501 | ) | |||||
Total deferred tax liabilities | (27,283 | ) | (37,324 | ) | ||||
Net deferred tax assets (liabilities) | $ | (734 | ) | $ | 4,997 | |||
1) March 31, 2017 adjusted due to the adoption of ASU No. 2016-16
The following table presents the annual activities included in the deferred tax valuation allowance (amounts in thousands):
Valuation Allowance for Deferred Tax Assets | |||
Balance at March 31, 2015 | $ | 167,594 | |
Charge to costs and expenses | 4,072 | ||
Deductions | (749 | ) | |
Balance at March 31, 2016 | 170,917 | ||
Charge to costs and expenses | (2,094 | ) | |
Deductions | (4,925 | ) | |
Balance at March 31, 2017 | 163,898 | ||
Charge to costs and expenses | 8,647 | ||
Deductions | (1,144 | ) | |
Balance at March 31, 2018 | $ | 171,401 | |
In fiscal year 2018, the valuation allowance increased $7.5 million, of which $74.4 million related to a valuation allowance increase for the foreign group and 66.9 million related to a valuation allowance decrease for the U.S. group. The $66.9 million decrease in valuation allowance related to the U.S. group primarily is comprised of a $49.4 million decrease from the repricing of deferred tax assets under U.S. tax reform, and a $21.1 million decrease from the additional investment in
116
KEMET CORPORATION AND SUBSIDIARIES
Notes to Consolidated Financial Statements (Continued)
TOKIN. The $74.4 million increase in valuation allowance related to the foreign group is comprised of a $78.2 million increase due to opening balance sheet adjustments from the acquisition of TOKIN, and a decrease of $3.8 million from other foreign operations. In fiscal year 2017, the valuation allowance decreased $7.0 million, of which $4.8 million relates to the expiration of foreign tax credit carryovers that were held by the U.S. group and a $1.2 million decrease related to the investment in TOKIN. In fiscal year 2016, the valuation allowance increased $3.3 million primarily due to the reversal of the deferred tax liability related to the NT Options, offset by the increase in federal net operating loss carryforwards. Deductions in fiscal years 2018, 2017 and 2016 resulted primarily from expiring net operating loss carryforwards and expiring tax credits in certain U.S. state and foreign jurisdictions.
The change in net deferred income tax asset (liability) for the current year is presented below (amounts in thousands):
Balance at March 31, 2017 (1) | $ | 4,997 | |
Deferred income taxes resulting from business combination | (5,452 | ) | |
Deferred income taxes related to continuing operations | (614 | ) | |
Deferred income taxes related to other comprehensive income | 2 | ||
Foreign currency translation | 333 | ||
Balance at March 31, 2018 | $ | (734 | ) |
1) March 31, 2017 adjusted due to the adoption of ASU No. 2016-16
As of March 31, 2018 and 2017, the Company’s gross deferred tax assets are reduced by a valuation allowance of $171.4 million and $163.9 million, respectively. A valuation allowance on U.S. deferred tax assets was determined to be necessary based on the existence of significant negative evidence. The amount of future income required for the Company to realize its net deferred tax assets is $51.3 million.
In assessing the realizability of deferred tax assets in foreign jurisdictions, management considers whether it is more likely than not that some portion or all of the deferred tax assets will not be realized. The ultimate realization of deferred tax assets is dependent upon the generation of future taxable income during the periods in which those temporary differences become deductible. Management considers the scheduled reversal of deferred tax liabilities, projected future taxable income, and tax planning strategies in making this assessment. Based upon the level of historical taxable income and projections for future taxable income over the periods in which the deferred tax assets are deductible, management believes it is more likely than not that the Company will realize the benefits of these deductible differences, net of the existing valuation allowances as of March 31, 2018. However, the amount of deferred tax assets considered realizable could be reduced in the near term if estimates of future taxable income during the carryforward period are reduced.
As of March 31, 2018, the Company had U.S. federal net operating loss carryforwards of $240.0 million. These U.S. federal net operating losses were incurred from 2007 through 2018 and are available to offset future federal taxable income, if any, through 2037. The Company had state net operating losses of $530.4 million, of which $5.1 million will expire in one year if unused. These state net operating losses are available to offset future state taxable income, if any, through 2038. Foreign subsidiaries, primarily in Japan, Portugal, Sweden, Italy, and Hong Kong had net operating loss carryforwards totaling $157.7 million of which $0.3 million will expire within one year if unused. The net operating losses in Japan and Portugal are available to offset future taxable income through 2027. The net operating losses in Sweden, Italy, and Hong Kong are available indefinitely to offset future taxable income. For the U.S. federal and state jurisdictions there is a greater likelihood of not realizing the future tax benefits of these deferred tax assets, and accordingly, the Company has recorded valuation allowances related to the net deferred tax assets in these jurisdictions. For the foreign jurisdictions with net operating loss carryforwards, a valuation allowance has been recorded where the Company does not expect to fully realize the deferred tax assets in the future.
Utilization of the Company’s net operating loss carryforwards may be subject to substantial annual limitation due to the ownership change limitations provided by the Internal Revenue Code of 1986, as amended (the “Code”) and similar state provisions. Such an annual limitation could result in the expiration of the net operating loss and tax credit carryforwards before utilization. The issuance of the Platinum Warrant may have given rise to an “ownership change” for purposes of Section 382 of the Code. If such an ownership change were deemed to have occurred, the amount of our taxable income that could be offset by the Company’s net operating loss carryovers in taxable years after the ownership change would be severely limited. While the Company believes that the issuance of the Platinum Warrant did not result in an ownership change for purposes of Section 382
117
KEMET CORPORATION AND SUBSIDIARIES
Notes to Consolidated Financial Statements (Continued)
of the Code, there is no assurance that the Company’s view will be unchallenged. KBP was acquired which has substantial federal net operating losses that will now be limited due to the ownership change which occurred.
At March 31, 2018, the U.S. consolidated group of companies had the following tax credit carryforwards available (amounts in thousands):
Tax Credits ($) | Fiscal Year of Expiration | |||||
U.S. research credits | $ | 1,253 | 2023 | |||
Texas franchise tax credits | 2,955 | 2026 | ||||
The Company conducts business in Macedonia and Thailand through subsidiaries that qualify for a tax holiday. The tax holiday for Macedonia will terminate on January 1, 2023. For calendar years 2016, 2017, and 2018, the statutory rate of 10% was reduced to zero. The tax holiday for Thailand will terminate on June 15, 2020. For the 2018 fiscal year, the statutory rate of 20% was reduced to zero. For the fiscal year ended March 31, 2018 the Company realized no income tax benefit from the tax holidays.
Prior to the Tax Cuts and Jobs Act of 2017, earnings of a foreign subsidiary were taxed when remitted to the U.S. While the company previously recognized a deferred tax liability related to unremitted earnings of subsidiaries outside the United States, no tax impact resulted due to the valuation allowance in the U.S. With the Tax Cuts and Jobs Act of 2017 the Company is permitted a 100% exemption from U.S. tax on foreign earnings remitted to the U.S. and the U.S group recognizes no deferred tax liability at March 31, 2018 relating to unremitted foreign earnings. The Company asserts that no foreign earnings subject to a withholding tax or having currency translation gain will be remitted to the U.S.
At March 31, 2018, the Company had $8.7 million of unrecognized tax benefits. A reconciliation of gross unrecognized tax benefits (excluding interest and penalties) is as follows (amounts in thousands):
Fiscal Years Ended March 31, | ||||||||||||
2018 | 2017 | 2016 | ||||||||||
Beginning of fiscal year | $ | 7,390 | $ | 7,103 | $ | 6,377 | ||||||
Additions from business combinations | 1,270 | — | — | |||||||||
Additions for tax positions of the current year | 1,078 | 762 | 763 | |||||||||
Reductions for tax positions of prior years | (1,058 | ) | (64 | ) | — | |||||||
Lapse in statute of limitations | — | (411 | ) | (10 | ) | |||||||
Settlements | — | — | (27 | ) | ||||||||
End of fiscal year | $ | 8,680 | $ | 7,390 | $ | 7,103 | ||||||
At March 31, 2018, $4.3 million of the $8.7 million of unrecognized income tax benefits would affect the Company’s effective income tax rate, if recognized. It is reasonably possible that the total unrecognized tax benefit could decrease by $3.3 million in fiscal year 2019 if the advanced pricing arrangement for one of the Company’s foreign subsidiaries is agreed to by the foreign tax authority.
The Company files income tax returns in the U.S. and multiple foreign jurisdictions, including various state and local jurisdictions. The U.S. Internal Revenue Service concluded its examinations of the Company’s U.S. federal tax returns for all tax years through 2003. Because of net operating losses, the Company’s U.S. federal returns for 2003 and later years will remain subject to examination until the losses are utilized. The Company is subject to income tax examinations in various foreign and U.S. state jurisdictions for the years 2012 and forward. The Company records potential interest and penalty expenses related to unrecognized income tax benefits within its global operations in income tax expense. The Company had $0.9 million and $0.2 million of accrued interest and penalties respectively at March 31, 2018 and 2017, which are included as a component of income tax expense. To the extent interest and penalties are not assessed with respect to uncertain tax positions, amounts accrued will be reduced and reflected as a reduction of the overall income tax provision.
118
KEMET CORPORATION AND SUBSIDIARIES
Notes to Consolidated Financial Statements (Continued)
Tax Cuts and Jobs Act
The Tax Cuts and Jobs Act (the “Act”) was enacted on December 22, 2017. The Act reduces the US federal corporate tax rate from 35% to 21%, requires companies to pay a one-time transition tax on earnings of certain foreign subsidiaries that were previously tax deferred, and creates new taxes on certain foreign-sourced earnings. The reduction of the US federal corporate tax rate to 21% is not expected to have a significant impact on the provisions for income taxes of the Company for periods beginning after March 31, 2018 due to valuation allowances in the U.S. The SEC issued Staff Accounting Bulletin No. 118 “Income Tax Accounting Implications of the Tax Cuts and Jobs Act” (“SAB 118”) to provide guidance to companies that are not able to complete their accounting for income tax effect of the Act in the period of enactment. SAB 118 allows registrants to record tax reform impact amounts during a measurement period. The measurement period ends when a company has obtained, prepared and analyzed the information necessary to finalize its accounting, but cannot extend beyond one year. At March 31, 2018, the Company has not completed its accounting for the tax effects of enactment of the Act; however, the Company has initially determined a $0.8 million tax benefit impact related to the US federal corporate tax rate change to its existing deferred tax balances, which is included as a component of income tax expense from continuing operations for the year ended March 31, 2018. The Company estimates no tax impact from the estimated transition tax repatriation charge of $79.3 million due to net operating loss utilization and a valuation allowance in the U.S. There is no impact to foreign locations. The Company has not been able to finalize the estimate for the one-time transition tax and will continue to account for this item based on its existing accounting under ASC 740, Income Taxes. Additionally, the Act subjects a U.S. shareholder to tax on GILTI earned by certain foreign subsidiaries. The Company can make an accounting policy election to either treat taxes due on the GILTI as a current period expense or factor such amounts into our measurement of deferred taxes. Given the complexity of the GILTI provisions, the Company is still evaluating and has not yet determined its accounting policy. GILTI will not be applicable to the Company until fiscal year 2019.
Note 12: Derivatives
In fiscal year 2015, the Company began using certain derivative instruments (i.e., foreign exchange contracts) to reduce exposures to the volatility of foreign currencies impacting revenues and the costs of its products.
Certain operating expenses at the Company’s Mexican facilities are paid in Mexican Pesos. In order to hedge a portion of these forecasted cash flows, the Company purchases foreign exchange contracts, with terms generally less than twelve months, to buy Mexican Pesos for periods and amounts consistent with underlying cash flow exposures. These contracts are designated as cash flow hedges at inception and monitored for effectiveness on a routine basis. The notional value of outstanding Peso contracts was $70.6 million and $49.1 million as of March 31, 2018 and 2017, respectively.
The Company formally documents all relationships between hedging instruments and hedged items, as well as risk management objectives and strategies for undertaking various hedge transactions.
The Company records and presents the fair values of all of its derivative assets and liabilities in the Consolidated Balance Sheets on a net basis, since they are subject to master netting agreements. However, if the Company were to offset and record the asset and liability balances of its forward foreign currency exchange contracts on a gross basis, the amounts presented in the Consolidated Balance Sheets would be adjusted from the current net presentation to the gross amounts as detailed in the following table. The balance sheet classifications and fair value of derivative instruments as of March 31, 2018 and 2017 are as follows (amounts in thousands):
March 31, 2018 | March 31, 2017 | |||||||||||||||||||||||
As Presented(1) | Offset | Gross | As Presented(1) | Offset | Gross | |||||||||||||||||||
Prepaid and other current assets | $ | 1,154 | $ | — | $ | 1,154 | $ | 2,907 | $ | 40 | $ | 2,947 | ||||||||||||
Accrued expenses | — | — | — | — | (40 | ) | (40 | ) | ||||||||||||||||
$ | 1,154 | $ | — | $ | 1,154 | $ | 2,907 | $ | — | $ | 2,907 | |||||||||||||
(1) Fair Value measured using Level 2 inputs by adjusting the market spot rate by forward points, based on the date of the contract. The spot rates and forward points used are based on an average rate from an actively traded market.
119
KEMET CORPORATION AND SUBSIDIARIES
Notes to Consolidated Financial Statements (Continued)
The impact of foreign exchange contracts on the Consolidated Statement of Operations for the twelve month periods ended March 31, 2018 and 2017 is as follows (amounts in thousands):
Fiscal Years Ended March 31, | ||||||||||||
2018 | 2017 | 2016 | ||||||||||
Net Sales | $ | — | $ | — | $ | (789 | ) | |||||
Operating costs and expenses: | ||||||||||||
Cost of sales | 2,420 | 5,170 | 3,199 | |||||||||
Total operating costs and expenses | 2,420 | 5,170 | 3,199 | |||||||||
Operating income (loss) | $ | (2,420 | ) | $ | (5,170 | ) | $ | (3,988 | ) | |||
Unrealized gains and losses associated with the change in value of these financial instruments are recorded in AOCI. Changes in the derivatives’ fair values are deferred and recorded as a component of AOCI until the underlying transaction is settled and recorded to the income statement. When the hedged item affects income, gains or losses are reclassified from AOCI to the Consolidated Statement of Operations as Cost of sales for foreign exchange contracts to purchase Mexican Pesos. Any ineffectiveness, if material, in the Company’s hedging relationships is recognized immediately as a loss, within the same income statement accounts as described above; to date, there has been no ineffectiveness. Changes in derivative balances impact the line items “Prepaid and other current assets” and “Accrued Expenses” on the Consolidated Balance Sheets and Statements of Cash Flows.
Note 13: Supplemental Balance Sheets and Statements of Operations Detail
March 31, | ||||||||
(amounts in thousands) | 2018 | 2017 | ||||||
Accounts receivable: | ||||||||
Trade | $ | 166,459 | $ | 112,940 | ||||
Allowance for doubtful accounts reserve | (1,210 | ) | (942 | ) | ||||
Ship-from-stock and debit reserve ("SFSD") | (17,362 | ) | (15,489 | ) | ||||
Returns reserves | (2,616 | ) | (2,913 | ) | ||||
Rebates reserves | (446 | ) | (564 | ) | ||||
Price protection reserves | (420 | ) | (506 | ) | ||||
Other | (329 | ) | — | |||||
Accounts receivable, net | $ | 144,076 | $ | 92,526 | ||||
The Company has agreements with distributors and certain other customers that, under certain conditions, allow for returns of overstocked inventory, provide protection against price reductions initiated by the Company and grant other sales allowances. Allowances for these commitments are included in the Consolidated Balance Sheets as reductions in trade accounts receivable. The Company adjusts sales based on historical experience.
120
KEMET CORPORATION AND SUBSIDIARIES
Notes to Consolidated Financial Statements (Continued)
The following table presents the annual activities included in the allowance for these commitments (amounts in thousands):
Balance at March 31, 2015 | $ | 24,647 | |
Reduction in sales | 93,850 | ||
Actual adjustments applied | (95,596 | ) | |
Other | 77 | ||
Balance at March 31, 2016 | 22,978 | ||
Reduction in sales | 87,739 | ||
Actual adjustments applied | (90,365 | ) | |
Other | 62 | ||
Balance at March 31, 2017 | 20,414 | ||
Reduction in sales | 94,660 | ||
Actual adjustments applied | (92,959 | ) | |
Other | 268 | ||
Balance at March 31, 2018 | $ | 22,383 | |
March 31, | ||||||||
(amounts in thousands) | 2018 | 2017 | ||||||
Inventories: | ||||||||
Raw materials and supplies | $ | 88,408 | $ | 65,750 | ||||
Work in process | 65,417 | 47,408 | ||||||
Finished goods | 66,907 | 50,738 | ||||||
Inventory gross | 220,732 | 163,896 | ||||||
Inventory reserves | (16,346 | ) | (15,941 | ) | ||||
Inventory, net | $ | 204,386 | $ | 147,955 | ||||
The following table presents the annual activities included in the inventory reserves (amounts in thousands):
Balance at March 31, 2015 | $ | 17,499 | |
Costs charged to expense | 5,696 | ||
Write-offs | (7,326 | ) | |
Other | 232 | ||
Balance at March 31, 2016 | 16,101 | ||
Costs charged to expense | 6,163 | ||
Write-offs | (6,125 | ) | |
Other | (198 | ) | |
Balance at March 31, 2017 | 15,941 | ||
Costs charged to expense | 4,994 | ||
Write-offs | (6,954 | ) | |
Other (1) | 2,365 | ||
Balance at March 31, 2018 | $ | 16,346 | |
_______________________________________________________________________________
(1) Includes $1.9 million in inventory reserves from TOKIN.
121
KEMET CORPORATION AND SUBSIDIARIES
Notes to Consolidated Financial Statements (Continued)
Useful life (years) | March 31, | |||||||||
(amounts in thousands, except years) | 2018 | 2017 | ||||||||
Property, plant and equipment: | ||||||||||
Land and land improvements | 20 | $ | 66,150 | $ | 21,642 | |||||
Buildings | 20 - 40 | 186,207 | 140,895 | |||||||
Machinery and equipment | 10 | 895,914 | 783,288 | |||||||
Furniture and fixtures | 4 - 10 | 72,811 | 68,706 | |||||||
Construction in progress | 46,391 | 14,653 | ||||||||
Other | 4,457 | 1,403 | ||||||||
Total property and equipment | 1,271,930 | 1,030,587 | ||||||||
Accumulated depreciation | (866,614 | ) | (821,276 | ) | ||||||
Property, plant and equipment, net | $ | 405,316 | $ | 209,311 | ||||||
March 31, | ||||||||
(amounts in thousands) | 2018 | 2017 | ||||||
Accrued expenses: | ||||||||
Salaries, wages, and related employee costs | $ | 62,778 | $ | 29,589 | ||||
Interest | 396 | 15,603 | ||||||
Restructuring | 8,719 | 984 | ||||||
Vacation | 10,364 | 7,524 | ||||||
Anti-trust fines and settlements | 33,696 | — | ||||||
Other | 6,424 | 4,052 | ||||||
Total accrued expenses | $ | 122,377 | $ | 57,752 | ||||
March 31, | ||||||||
(amounts in thousands) | 2018 | 2017 | ||||||
Other non-current obligations: | ||||||||
Pension plans | $ | 83,495 | $ | 34,674 | ||||
Employee separation liability | 8,539 | 8,685 | ||||||
Deferred compensation | 5,857 | 1,774 | ||||||
Anti-trust fines and settlements | 35,263 | — | ||||||
Uncertain tax positions | 5,704 | 2,891 | ||||||
Deferred rent | 3,840 | — | ||||||
Return of government subsidies | 4,739 | — | ||||||
Restructuring | 1,240 | 15 | ||||||
TOKIN option valuation | — | 9,900 | ||||||
Long-term obligation on land purchase | — | 898 | ||||||
Long-term service contracts | — | 339 | ||||||
Other | 3,059 | 955 | ||||||
Total other non-current obligations | $ | 151,736 | $ | 60,131 | ||||
122
KEMET CORPORATION AND SUBSIDIARIES
Notes to Consolidated Financial Statements (Continued)
Fiscal Years Ended March 31, | ||||||||||||
(amounts in thousands) | 2018 | 2017 | 2016 | |||||||||
Other (income) expense, net: | ||||||||||||
Net foreign exchange (gains) losses | $ | 13,145 | $ | (3,758 | ) | $ | (3,036 | ) | ||||
Legal expenses/fines related to anti-trust class actions | 9,900 | — | — | |||||||||
Post retirement and pension plan non-service costs | 210 | 1,256 | 1,507 | |||||||||
Insurance proceeds | — | (423 | ) | — | ||||||||
Gain on early extinguishment of debt | 486 | — | — | |||||||||
Other | 851 | (946 | ) | 688 | ||||||||
Total other (income) expense, net | $ | 24,592 | $ | (3,871 | ) | $ | (841 | ) | ||||
Note 14: Income/Loss Per Share
Basic earnings per share calculation is based on the weighted-average number of common shares outstanding. Diluted earnings per share calculation is based on the weighted-average number of common shares outstanding adjusted by the number of additional shares that would have been outstanding had the potentially dilutive common shares been issued. Potentially dilutive shares of common stock include stock options and Platinum Warrant.
The following table presents the basic and diluted weighted-average number of shares of common stock (amounts in thousands, except per share data):
Fiscal Years Ended March 31, | ||||||||||||
2018 | 2017 | 2016 | ||||||||||
Numerator | ||||||||||||
Net income (loss) | $ | 254,529 | $ | 47,989 | $ | (53,629 | ) | |||||
Denominator: | ||||||||||||
Weighted-average common shares outstanding: | ||||||||||||
Basic | 52,798 | 46,552 | 46,004 | |||||||||
Assumed conversion of employee stock grants | 2,291 | 2,235 | — | |||||||||
Assumed conversion of Platinum Warrant | 3,551 | 6,602 | — | |||||||||
Weighted-average shares outstanding (diluted) | 58,640 | 55,389 | 46,004 | |||||||||
Net income (loss) per basic share: | ||||||||||||
Net income (loss) | $ | 4.82 | $ | 1.03 | $ | (1.17 | ) | |||||
Net income (loss) per diluted share: | ||||||||||||
Net income (loss) | $ | 4.34 | $ | 0.87 | $ | (1.17 | ) | |||||
Common stock equivalents that could potentially dilute net income per basic share in the future, but were not included in the computation of diluted earnings per share because the impact would have been anti-dilutive, were as follows (amounts in thousands):
Fiscal Years Ended March 31, | |||||||||
2018 | 2017 | 2016 | |||||||
Assumed conversion of employee stock grants | 71 | 771 | 3,329 | ||||||
Assumed conversion of Platinum Warrant | — | — | 4,951 | ||||||
123
KEMET CORPORATION AND SUBSIDIARIES
Notes to Consolidated Financial Statements (Continued)
Note 15: Commitments and Contingencies
The Company’s operating leases are primarily for distribution facilities or sales and administrative offices that expire principally between 2018 and 2030. A number of leases require the Company to pay certain executory costs (taxes, insurance, and maintenance) and contain certain renewal and purchase options. Annual rental expenses for operating leases were included in results of operations and were $10.7 million, $6.7 million and $7.1 million in fiscal years 2018, 2017, and 2016, respectively.
Future minimum lease payments over the next five fiscal years and thereafter under non-cancellable operating leases at March 31, 2018, are as follows (amounts in thousands):
Fiscal Years Ended March 31, | ||||||||||||||||||||||||
2019 | 2020 | 2021 | 2022 | 2023 | Thereafter | |||||||||||||||||||
Minimum lease payments | $ | 9,558 | $ | 5,198 | $ | 3,444 | $ | 2,665 | $ | 2,243 | $ | 10,738 | ||||||||||||
The Company or its subsidiaries are at any one time parties to a number of lawsuits arising out of our respective operations, including workers’ compensation or work place safety cases, some of which involve claims of substantial damages. Although there can be no assurance, based upon information known to the Company, the Company does not believe that any liability which might result from an adverse determination of such lawsuits would have a material adverse effect on the Company’s financial condition or results of operations.
Legal Update
We or our subsidiaries may at any one time be parties to lawsuits arising out of our respective operations, including workers’ compensation or work place safety cases, some of which involve claims of substantial damages. Although there can be no assurance, based upon information known to us, we do not believe that any liability which might result from an adverse determination of such lawsuits would have a material adverse effect on our financial condition or results of operations.
As previously reported, KEMET and KEC, along with more than 20 other capacitor manufacturers and subsidiaries (including TOKIN, as described below), are defendants in a purported antitrust class action complaint, In re: Capacitors Antitrust Litigation, No. 3:14-cv-03264-JD, filed on December 4, 2014 with the United States District Court, Northern District of California (the “U.S. Class Action Complaint”). The complaint alleges a violation of Section 1 of the Sherman Act, for which it seeks injunctive and equitable relief and money damages. The complaint is currently nearing the end of the factual discovery phase. In addition, KEMET and KEC, along with more than 20 other capacitor manufacturers and subsidiaries, have been named as defendants in two suits by plaintiffs who have chosen not to participate in the U.S. Class Action Complaint (collectively with the U.S. Class Action Complaint, the “U.S. Complaints”): AASI Beneficiaries’ Trust v. AVX Corporation, et al., filed on August 29, 2016 in the United States District Court, Southern District of Florida, and Benchmark Electronics, Inc., et al. v. AVX Corporation, et al., filed on April 18, 2017 in the United States District Court, Southern District of Texas. KEMET and KEC, along with more than 20 other capacitor manufacturers and subsidiaries, were also named as defendants in a complaint filed on January 9, 2018, Digi-Key Corporation v. AVX Corporation et. al., in the Norther District of California. The AASI, Benchmark and Digi-Key complaints allege generally the same violations as the U.S. Class Action Complaint.
In addition, as previously reported, KEMET and KEC, along with certain other capacitor manufacturers and subsidiaries (including TOKIN), were named as defendants in several additional suits that were filed in Canada (collectively, the “Canadian Complaints”): Badashmin v. Panasonic Corporation, et al., filed August 6, 2014 in the Superior Court, Province of Quebec, District of Montreal; Herard v. Panasonic Corporation, et al., filed August 6, 2014 in the Superior Court, Province of Quebec, District of Montreal; Cygnus Electronics Corporation v. Panasonic Corporation, et al., filed August 6, 2014 in the Superior Court of Justice, Province of Ontario; LeClaire v. Panasonic Corporation, et al., filed August 6, 2014 in the Superior Court, Province of Quebec, District of Montreal; Taylor v Panasonic Corporation, et al., filed August 11, 2014 in the Superior Court of Justice, Province of Ontario; Ramsay v. Panasonic Corporation, et al., filed August 14, 2014 in the Supreme Court, Province of British Columbia; Martin v. Panasonic Corporation, et al., filed September 25, 2014 in the Superior Court, Province of Quebec, District of Montreal; Parikh v. Panasonic Corporation, et al., filed October 3, 2014 in the Superior Court of Justice, Province of Ontario; Fraser v. Panasonic Corporation, et al., filed October 3, 2014 in the Court of Queen’s Bench, Province of Saskatchewan; Pickering v. Panasonic Corporation, et al., filed October 6, 2014 in the Supreme Court, Province of British Columbia; McPherson v Panasonic Corporation et al., filed on November 6, 2014 in the Court of Queen’s Bench,
124
KEMET CORPORATION AND SUBSIDIARIES
Notes to Consolidated Financial Statements (Continued)
Province of Manitoba; and Allott v AVX Corporation, et al., filed on May 13, 2016 in the Superior Court of Justice, Province of Ontario. The Canadian Complaints generally allege the same unlawful acts as in the U.S. Complaints, assert claims under Canada’s Competition Act as well as various civil and common law causes of action, and seek injunctive and equitable relief and money damages.
Except for the TOKIN accrual described below and certain attorneys’ fees, the Company has not recorded any accrual concerning the U.S. Complaints and the Canadian Complaints.
In July 2013, TOKIN was named as one of eight defendants in two purported U.S. class action antitrust lawsuits (In Re: Lithium Ion Batteries Antitrust Litigation, 13-MD-02420-YGR, United States District Court, Northern District of California) (the “Battery Class Action Suits”) regarding the sale of lithium ion batteries brought on behalf of direct product purchasers and indirect product purchasers. On May 16, 2018, the Court granted final approval to a settlement agreement by which, in consideration of the release of TOKIN and its subsidiaries from claims asserted in the Battery Class Action Suits, TOKIN agreed to pay $4.95 million to the settlement class of direct product purchasers. TOKIN paid the settlement amount on January 18, 2018. On March 2, 2018, TOKIN entered into a settlement agreement, which, subject to court approval, provides for the release of TOKIN and its subsidiaries from claims asserted in the Battery Class Action Suits, in consideration of which, TOKIN agreed to pay $2.0 million to the settlement class of indirect product purchasers.
Beginning in March 2014, TOKIN and certain of its subsidiaries received inquiries, requests for information and other communications from government authorities in China, the United States, the European Commission, Japan, South Korea, Taiwan, Singapore and Brazil concerning alleged anti-competitive activities within the capacitor industry.
On September 2, 2015, the United States Department of Justice announced a plea agreement with TOKIN in which TOKIN agreed to plead guilty to a one-count felony charge of unreasonable restraint of interstate and foreign trade and commerce in violation of Section 1 of the Sherman Act, and to pay a criminal fine of $13.8 million. The plea agreement was approved by the United States District Court, Northern District of California, on January 21, 2016. The fine is payable over 5 years in six installments of $2.3 million each, plus accrued interest. The first three payments were made in February 2016, January 2017 and January 2018. The next payment is due in January 2019.
On December 9, 2015, the Taiwan Fair Trade Commission (“TFTC”) publicly announced that TOKIN would be fined 1,218.2 million New Taiwan dollars (“NTD”) (approximately U.S. $41.8 million) for violations of the Taiwan Fair Trade Act. Subsequently, the TFTC indicated the fine would be reduced to NTD 609.1 million (approximately U.S. $20.9 million). In February 2016, TOKIN commenced an administrative suit in Taiwan, challenging the validity of the amount of the fine.
On March 29, 2016, the Japan Fair Trade Commission published an order by which TOKIN was fined ¥127.2 million (approximately U.S. $1.2 million) for violation of the Japanese Antimonopoly Act. Payment of the fine was made on October 31, 2016.
On July 15, 2016, TOKIN entered into definitive settlement agreements in two antitrust suits filed with the United States District Court, Northern District of California as In re: Capacitors Antitrust Litigation, No. 3:14-cv-03264-JD (the “Capacitor Class Action Suits”). Pursuant to the terms of the settlement, in consideration of the release of TOKIN and its subsidiaries (including TOKIN America, Inc.) from claims asserted in the Capacitor Class Action Suits, TOKIN will pay an aggregate $37.3 million to a settlement class of direct purchasers of capacitors and a settlement class of indirect purchasers of capacitors. Each of the respective class payments is payable in five installments, two of which were paid on or before the respective due dates of July 29, 2016 and 2017 and the third of which was paid on May 15, 2018. The fourth installments are due by May 15, 2019 and the final payments are due by December 31, 2019.
On July 27, 2016, Brazil’s Administrative Council for Economic Defense approved a cease and desist agreement with TOKIN in which TOKIN made a financial contribution of Brazilian Real 601 thousand (approximately U.S. $0.2 million) to Brazil’s Fund for Defense of Diffuse Rights.
On March 21, 2018, the European Commission announced a decision by which TOKIN was fined €8.8 million directly (approximately $10.9 million) and €5.0 million (approximately $6.2 million) jointly and severally with NEC Corporation, for violation of the competition laws of the European Union. The fines are payable by June 28, 2018.
The remaining governmental investigations are continuing at various stages. As of March 31, 2018, TOKIN’s accrual for antitrust and civil litigation claims totaled $76.7 million which is stated in the following line items, “Account payable” ($7.7 million), “Accrued expenses” ($33.7 million) and “Other non-current obligations” ($35.3 million) on the Consolidated Balance
125
KEMET CORPORATION AND SUBSIDIARIES
Notes to Consolidated Financial Statements (Continued)
Sheets. This amount includes the best estimate of losses which may result from the ongoing antitrust investigations, civil litigation and claims. However, the actual outcomes could differ from what has been accrued. Additionally, under the terms of the TOKIN Purchase Agreement, KEMET will be responsible for defending all suits brought against TOKIN, paying all expenses and satisfying all judgments to the extent incurred by or rendered against TOKIN arising out of or related the capacitor antitrust investigations and related litigation described above.
Note 16: Quarterly Results of Operations (Unaudited)
The following table sets forth certain quarterly information for fiscal years 2018 and 2017. This information, in the opinion of the Company’s management, reflects all adjustments (consisting only of normal recurring adjustments) necessary to present fairly this information when read in conjunction with the consolidated financial statements and notes thereto included elsewhere herein (amounts in thousands except per share data):
Fiscal Year 2018 Quarters Ended | ||||||||||||||||
Jun-30 | Sep-30 | Dec-31 | Mar-31 | |||||||||||||
Net sales | $ | 274,000 | $ | 301,471 | $ | 306,408 | $ | 318,047 | ||||||||
Gross margin | 74,437 | 85,076 | 92,461 | 88,419 | ||||||||||||
Operating income (loss) (1) | 27,784 | 31,643 | 32,077 | 21,799 | ||||||||||||
Net income (loss) | $ | 220,606 | $ | 12,849 | $ | 18,641 | $ | 2,433 | ||||||||
Net income (loss) per basic share | $ | 4.66 | $ | 0.26 | $ | 0.33 | $ | 0.04 | ||||||||
Net income (loss) per diluted share | $ | 3.82 | $ | 0.22 | $ | 0.32 | $ | 0.04 | ||||||||
Fiscal Year 2017 Quarters Ended | ||||||||||||||||
Jun-30 | Sep-30 | Dec-31 | Mar-31 | |||||||||||||
Net sales | $ | 184,935 | $ | 187,308 | $ | 188,029 | $ | 197,519 | ||||||||
Gross margin (2) | 42,752 | 46,516 | 47,478 | 50,181 | ||||||||||||
Operating income (loss) (1) (2) | 9,298 | 3,374 | 14,182 | 8,942 | ||||||||||||
Net income (loss) | $ | (12,205 | ) | $ | (4,998 | ) | $ | 12,278 | $ | 52,914 | ||||||
Net income (loss) per basic share | $ | (0.26 | ) | $ | (0.11 | ) | $ | 0.26 | $ | 1.13 | ||||||
Net income (loss) per diluted share | $ | (0.26 | ) | $ | (0.11 | ) | $ | 0.22 | $ | 0.93 | ||||||
(1) Operating income (loss) as a percentage of net sales fluctuates from quarter to quarter due to a number of factors, including net sales fluctuations, foreign currency exchange, restructuring charges, product mix, the timing and expense of moving product lines to lower-cost locations, the write-down of long lived assets, the net gain/loss on sales and disposals of assets and the relative mix of sales among distributors, original equipment manufacturers, and electronic manufacturing service providers.
(2) Quarters ended in fiscal year 2017 adjusted due to the adoption of ASU No. 2017-07.
126
KEMET CORPORATION AND SUBSIDIARIES
Notes to Consolidated Financial Statements (Continued)
Note 17: Condensed Consolidating Financial Statements
As discussed in Note 3, “Debt,” the Company repurchased and retired the full outstanding balance of 10.5% Senior Notes on April 28, 2017. The 10.5% Senior Notes were fully and unconditionally guaranteed, jointly and severally, on a senior basis by certain of the Company’s 100% owned domestic subsidiaries (“Guarantor Subsidiaries”) and secured by a first priority lien on 51% of the capital stock of certain of the Company’s foreign restricted subsidiaries (“Non-Guarantor Subsidiaries”). Prior to fiscal year 2018, the Company was required to present condensed consolidating financial information in order for the Guarantor Subsidiaries of the Company's public debt to be exempt from reporting under the Securities Act of 1934, as amended. Since the Company's public debt was repurchased and retired prior to the end of fiscal year 2018, it is no longer required to present condensed consolidated information.
Note 18: Subsequent Events
Amended and Restated Employment Agreement
On April 18, 2018, the Company amended and restated the employment agreement with the Company's Chief Executive Officer. The unvested Restricted Stock Units previously granted to him on June 29, 2015 and September 6, 2017, totaling 175,000 and 100,000 shares respectively, immediately became vested. The modification of the award terms did not result in any incremental compensation cost. However, total compensation cost of $1.7 million will be accelerated and recognized during the three-month period ending June 30, 2018.
.
127
SIGNATURES
Pursuant to the requirements of Section 13 or 15(d) of the Securities Exchange Act of 1934, the registrant has duly caused this report to be signed on its behalf by the undersigned, thereunto duly authorized.
KEMET CORPORATION (Registrant) | ||
Date: May 25, 2018 | By: | /s/ WILLIAM M. LOWE, JR. |
William M. Lowe, Jr. Executive Vice President and Chief Financial Officer | ||
________________________________________________________________________________________________________________________
Pursuant to the requirements of the Securities Exchange Act of 1934, this report has been signed below by the following persons on behalf of the registrant and in the capacities and on the dates indicated.
128
Date: May 25, 2018 | /s/ PER-OLOF LÖÖF | |
Per-Olof Lööf Chief Executive Officer and Director (Principal Executive Officer) | ||
Date: May 25, 2018 | /s/ WILLIAM M. LOWE, JR. | |
William M. Lowe, Jr. Executive Vice President and Chief Financial Officer (Principal Accounting and Financial Officer) | ||
Date: May 25, 2018 | /s/ FRANK G. BRANDENBERG | |
Frank G. Brandenberg Chairman and Director | ||
Date: May 25, 2018 | /s/ DR. WILFRIED BACKES | |
Dr. Wilfried Backes Director | ||
Date: May 25, 2018 | /s/ GURMINDER S. BEDI | |
Gurminder S. Bedi Director | ||
Date: May 25, 2018 | /s/ JOSEPH V. BORRUSO | |
Joseph V. Borruso Director | ||
Date: May 25, 2018 | /s/ JACOB KOTZUBEI | |
Jacob Kozubei Director | ||
Date: May 25, 2018 | /s/ E. ERWIN MADDREY, II | |
E. Erwin Maddrey, II Director | ||
Date: May 25, 2018 | /s/ ROBERT G. PAUL | |
Robert G. Paul Director | ||
Date: May 25, 2018 | /s/ YASUKO MATSUMOTO | |
Yasuko Matsumoto Director | ||
129