Attached files
| file | filename |
|---|---|
| EX-23.2 - EX-23.2 - KEMET CORP | a2198903zex-23_2.htm |
| EX-21.1 - EX-21.1 - KEMET CORP | a2198903zex-21_1.htm |
| EX-32.2 - EX-32.2 - KEMET CORP | a2198903zex-32_2.htm |
| EX-23.3 - EX-23.3 - KEMET CORP | a2198903zex-23_3.htm |
| EX-23.1 - EX-23.1 - KEMET CORP | a2198903zex-23_1.htm |
| EX-31.2 - EX-31.2 - KEMET CORP | a2198903zex-31_2.htm |
| EX-32.1 - EX-32.1 - KEMET CORP | a2198903zex-32_1.htm |
| EX-31.1 - EX-31.1 - KEMET CORP | a2198903zex-31_1.htm |
UNITED STATES
SECURITIES AND EXCHANGE COMMISSION
Washington, D.C. 20549
FORM 10-K
| (Mark One) | ||
ý |
ANNUAL REPORT PURSUANT TO SECTION 13 OR 15(d) OF THE SECURITIES EXCHANGE ACT OF 1934 |
|
For the fiscal year ended March 31, 2010 |
||
Or |
||
o |
TRANSITION REPORT PURSUANT TO SECTION 13 OR 15(d) OF THE SECURITIES EXCHANGE ACT OF 1934 |
|
For the transition period from to |
||
Commission File Number: 0-20289
KEMET Corporation
(Exact name of registrant as specified in its charter)
| Delaware (State or other jurisdiction of incorporation or organization) |
57-0923789 (I.R.S. Employer Identification No.) |
|
2835 Kemet Way, Simpsonville, South Carolina (Address of principal executive offices) |
29681 (Zip Code) |
Registrant's telephone number, including area code: (864) 963-6300
Securities registered pursuant to Section 12(b) of the Act: None.
Securities registered pursuant to Section 12(g) of the Act: Common Stock, par value $0.01
Indicate by check mark if the registrant is a well-known seasoned issuer, as defined in Rule 405 of the Securities Act. Yes o No ý
Indicate by check mark if the registrant is not required to file reports pursuant to Section 13 or Section 15(d) of the Act. Yes o No ý
Indicate by check mark whether the registrant (1) has filed all reports required to be filed by Section 13 or 15(d) of the Securities Exchange Act of 1934 during the preceding 12 months (or for such shorter period that the registrant was required to file such reports), and (2) has been subject to such filing requirements for the past 90 days. Yes ý No o
Indicate by check mark whether the registrant has submitted electronically and posted on its corporate Web site, if any, every Interactive Data File required to be submitted and posted pursuant to Rule 405 of Regulation S-T (§ 332.405 of this chapter) during the preceding 12 months (or for such shorter period that the registrant was required to submit and post such files). Yes o No o
Indicate by check mark if disclosure of delinquent filers pursuant to Item 405 of Regulation S-K (§ 229.405) is not contained herein, and will not be contained, to the best of registrant's knowledge, in definitive proxy or information statements incorporated by reference in Part III of this Form 10-K or any amendment to this Form 10-K. ý
Indicate by check mark whether the registrant is a large accelerated filer, an accelerated filer, a non-accelerated filer, or a smaller reporting company. See the definitions of "large accelerated filer," "accelerated filer" and "smaller reporting company" in Rule 12b-2 of the Exchange Act (Check one):
| Large accelerated filer o | Accelerated filer ý | Non-accelerated filer o (Do not check if a smaller reporting company) |
Smaller reporting company o |
Indicate by check mark whether the registrant is a shell company (as defined in Rule 12b-2 of the Act). Yes o No ý
Aggregate market value of voting common stock held by non-affiliates of the registrant as of September 30, 2009, computed by reference to the closing sale price of the registrant's common stock was approximately $122,419,962
Number of shares of each class of common stock outstanding as of May 24, 2010: common stock, $0.01 par value, 81,135,009.
DOCUMENTS INCORPORATED BY REFERENCE
Portions of the definitive proxy statement to be delivered to stockholders in connection with the Annual Meeting of Shareholders to be held July 28, 2010 are incorporated by reference in Part III and Part IV of this report.
General
KEMET Corporation is a leading global manufacturer of a wide variety of capacitors. Our product offerings include tantalum, multilayer ceramic, solid and electrolytic aluminum, film and paper capacitors. Capacitors are fundamental components of most electronic circuits and are found in communication systems, data processing equipment, personal computers, cellular phones, automotive electronic systems, defense and aerospace systems, consumer electronics, power management systems and many other electronic devices and systems. Capacitors are typically used to filter out interference, smooth the output of power supplies, block the flow of direct current while allowing alternating current to pass and for many other purposes. We manufacture a broad line of capacitors in many different sizes and configurations using a variety of raw materials. Our product line consists of nearly 250,000 distinct part configurations distinguished by various attributes, such as dielectric (or insulating) material, configuration, encapsulation, capacitance level and tolerance, performance characteristics and packaging. Most of our customers have multiple capacitance requirements, often within each of their products. Our broad offering allows us to meet the majority of those needs independent of application and end use. In fiscal year 2010, we shipped approximately 31 billion capacitors and in fiscal year 2009, we shipped approximately 32 billion capacitors. We believe the medium-to-long term demand for the various types of capacitors offered by us will grow on a regional and global basis due to a variety of factors, including increasing demand for and complexity of electronics products, growing demand for technology in emerging markets and the ongoing development of new solutions for energy generation and conservation. As used in this report, the terms "we", "us", "our", "KEMET" and the "Company" refer to KEMET Corporation and its predecessors, subsidiaries and affiliates, unless the context indicates otherwise. For the fiscal year ended March 31, 2010 ("fiscal year 2010"), KEMET generated net sales of $736.3 million, down 8.5% from $804.4 million for the fiscal year 2009 ("fiscal year 2009").
KEMET's business strategy is to be the preferred capacitor supplier to the world's most successful electronics original equipment manufacturers, electronics manufacturing services providers, and electronics distributors. Our customers are global in nature and include leaders in both the design and manufacture of electronic devices and equipment. Our primary channel for servicing these customers is a direct, salaried sales force strategically located around the world.
Background of Company
KEMET's operations began in 1919 as a business of Union Carbide Corporation ("Union Carbide") to manufacture component parts for vacuum tubes. In the 1950s, Bell Laboratories invented solid-state transistors along with tantalum capacitors and other passive components necessary for their operation. As vacuum tubes were gradually replaced by transistors, we changed our manufacturing focus from vacuum tube parts to tantalum capacitors. We entered the market for tantalum capacitors in 1958 as one of approximately 25 United States manufacturers. By 1966, we were the United States' market leader in tantalum capacitors. In 1969, we began production of ceramic capacitors as one of approximately 35 United States manufacturers, and opened our first manufacturing facility in Mexico. In 2003, we expanded operations into Asia, opening our first facility in Suzhou, China. In fiscal year 2007, we acquired the tantalum business unit of EPCOS AG. In fiscal year 2008, we acquired Evox Rifa Group Oyj ("Evox Rifa") and Arcotronics Italia S.p.A. ("Arcotronics") and, as a result, entered into the markets for film, electrolytic and paper capacitors. We are organized into three segments: the Tantalum Business Group ("Tantalum"), the Ceramic Business Group ("Ceramic") and the Film and Electrolytic Business Group ("Film and Electrolytic").
KEMET is a Delaware corporation that was formed in 1990 by certain members of the Company's management at the time, Citicorp Venture Capital, Ltd., and other investors that acquired the
2
outstanding common stock of KEMET Electronics Corporation from Union Carbide. In 1992, we publicly issued shares of our common stock. Today, our stock trades on the OTC Bulletin Board under the symbol "KEME.OB".
Recent Developments
Net sales for the quarter ended March 31, 2010 were $213.0 million, which is a 56.6% increase over the same quarter last fiscal year and a 6.5% increase over the prior fiscal quarter ended December 31, 2009. Net income was $0.3 million, or $0.00 per share for the fourth quarter of fiscal year 2010 compared to net income of $2.4 million or $0.03 per share for the same quarter last year and compared to net loss of $1.8 million or $(0.02) per share for the prior fiscal quarter ended December 31, 2009.
On April 8, 2010, we reported that we reached an agreement with three labor unions in Italy and with the regional government in Emilia Romagna, Italy to proceed with our planned restructuring process. The Company intends to focus on producing specialty products in Europe and the U.S. and shift standard and commodity production to lower cost regions.
In December 2009, in an effort consistent with our cost reduction measures, we plan to relocate our Amsterdam Hub facility from the Netherlands to the Czech Republic, effective July 2010. We expect this relocation to allow shipping lane optimization and customer consolidation (bi-weekly or weekly) for all import shipments. Our European manufacturing plants will continue to ship direct to 'local' customers (i.e. customers located in the same country as the plant).
On May 5, 2010, we completed a private placement of $230.0 million in aggregate principal amount of our 10.5% Senior Notes due 2018 (the "10.5% Senior Notes") to several initial purchasers (the "Initial Purchasers") represented by Banc of America Securities LLC pursuant to an exemption from the registration requirements under the Securities Act of 1933, as amended (the "Securities Act"). The Initial Purchasers subsequently sold the 10.5% Senior Notes to qualified institutional buyers pursuant to Rule 144A under the Securities Act and to persons outside of the United States pursuant to Regulation S under the Securities Act.
The private placement of the 10.5% Senior Notes resulted in proceeds to the Company of $222.2 million. We used a portion of the proceeds of the private placement to repay all of its outstanding indebtedness under our credit facility with K Financing, LLC. Our €60 million credit facility and €35 million credit facility with UniCredit Corporate Banking S.p.A. ("UniCredit") and our term loan with Vishay Intertechnology, Inc. ("Vishay") and we used a portion of the remaining proceeds to fund a previously announced tender offer to purchase $40.5 million in aggregate principal amount of our 2.25% Convertible Notes due 2026 (the "Convertible Notes") and to pay the costs incurred in connection with the private placement, the tender offer and the foregoing repayments. We incurred approximately $6.4 million in costs related to the execution of the offering, these costs are capitalized and will be amortized over the term of the 10.5% Senior Notes.
The 10.5% Senior Notes were issued pursuant to an Indenture (the "10.5% Senior Notes Indenture"), dated as of May 5, 2010, by and among the Company, the Company's domestic restricted subsidiaries (the "Guarantors") and Wilmington Trust Company, as trustee (the "Trustee"). The 10.5% Senior Notes will mature on May 1, 2018, and bear interest at a stated rate of 10.5% per annum, payable semi-annually in cash in arrears on May 1 and November 1 of each year, beginning on November 1, 2010. The 10.5% Senior Notes are our senior obligations and will be guaranteed by each of the Guarantors and secured by a first priority lien on 51% of our capital stock of certain of our foreign restricted subsidiaries.
The terms of the 10.5% Senior Notes Indenture will, among other things, limit our ability and the ability of our restricted subsidiaries to (i) incur additional indebtedness or issue certain preferred stock;
3
(ii) pay dividends on, or make distributions in respect of, our capital stock or repurchase our capital stock; (iii) make certain investments or other restricted payments; (iv) sell certain assets; (v) create liens or use assets as security in other transactions; (vi) enter into sale and leaseback transactions; (vii) merge, consolidate or transfer or dispose of substantially all assets; (viii) engage in certain transactions with affiliates; and (ix) designate subsidiaries as unrestricted subsidiaries. These covenants are subject to a number of important limitations and exceptions that are described in the 10.5% Senior Notes Indenture.
The 10.5% Senior Notes will be redeemable, in whole or in part, on any time on or after May 1, 2014, at the redemption prices specified in the 10.5% Senior Notes Indenture. At any time prior to May 1, 2013, we may redeem up to 35% of the aggregate principal amount of the 10.5% Senior Notes with the net cash proceeds from certain equity offerings at a redemption price equal to 110.5% of the principal amount thereof, together with accrued and unpaid interest, if any, to the redemption date. In addition, at any time prior to May 1, 2014, we may redeem the 10.5% Senior Notes, in whole or in part, at a redemption price equal to 100% of the principal amount of the 10.5% Senior Notes so redeemed, plus a "make whole" premium and together with accrued and unpaid interest, if any, to the redemption date.
Upon the occurrence of a change of control triggering event specified in the 10.5% Senior Notes Indenture, we must offer to purchase the 10.5% Senior Notes at a redemption price equal to 101% of the principal amount thereof, plus accrued and unpaid interest, if any, to the date of purchase.
The 10.5% Senior Notes Indenture provides for customary events of default (subject in certain cases to customary grace and cure periods), which include nonpayment, breach of covenants in the 10.5% Senior Notes Indenture, payment defaults or acceleration of other indebtedness, a failure to pay certain judgments and certain events of bankruptcy and insolvency. The 10.5% Senior Notes Indenture also provides for events of default with respect to the collateral, which include default in the performance of (or repudiation, disaffirmation or judgment of unenforceability or assertion of unenforceability) by us or a Guarantor with respect to the provision of security documents under the 10.5% Senior Notes Indenture. These events of default are subject to a number of important qualifications, limitations and exceptions that are described in the 10.5% Senior Notes Indenture. Generally, if an event of default occurs, the Trustee or holders of at least 25% in principal amount of the then outstanding 10.5% Senior Notes may declare the principal of and accrued but unpaid interest, including additional interest, on all the 10.5% Senior Notes to be due and payable.
On May 17, 2010, we consummated a tender offer to purchase $40.5 million in aggregate principal amount of our Convertible Notes. We used $37.9 million from the bond offering discussed above to extinguish the tendered notes. We incurred approximately $0.2 million in costs related to the execution of this tender offer; these costs will be included in the loss on extinguishment.
Registration Rights Agreement
On May 5, 2010, in connection with the private placement of the 10.5% Senior Notes, the Company, the Guarantors and the initial purchasers of the 10.5% Senior Notes entered into a Registration Rights Agreement (the "Registration Rights Agreement"). The terms of the Registration Rights Agreement require the Company and the Guarantors to (i) use their commercially reasonable efforts to file with the Securities and Exchange Commission within 210 days after the date of the initial issuance of the 10.5% Senior Notes, a registration statement with respect to an offer to exchange the 10.5% Senior Notes for a new issue of debt securities registered under the Securities Act, with terms substantially identical to those of the 10.5% Senior Notes (except for provisions relating to the transfer restrictions and payment of additional interest); (ii) use our commercially reasonable efforts to consummate such exchange offer within 270 days after the date of the initial issuance of the 10.5% Senior Notes; and (iii) in certain circumstances, file a shelf registration statement for the resale of the
4
10.5% Senior Notes. If the Company and the Guarantors fail to satisfy our registration obligations under the Registration Rights Agreement, then we will be required to pay additional interest to the holders of the 10.5% Senior Notes, up to a maximum additional interest rate of 1.0% per annum.
The foregoing description of the 10.5% Senior Notes Indenture and the Registration Rights Agreement does not purport to be complete and is qualified in its entirety by reference to the full text of the 10.5% Senior Notes Indenture and Registration Rights Agreement.
The Capacitor Industry
We compete with others that manufacture and distribute capacitors both domestically and globally. Success in our market is influenced by many factors, including price, engineering specifications, quality, breadth of offering, performance characteristics, customer service and geographic location of our manufacturing sites. As in all manufacturing industries, there is ongoing pressure on average unit selling prices for capacitors. To help mitigate this effect, many of the larger competitors have relocated their manufacturing operations to low cost regions and in closer proximity to their customers.
Within the capacitor market there exists several types of capacitor technologies, the largest segments of which include ceramic, tantalum, aluminum and film and paper. Ceramic and tantalum capacitors are commonly used in conjunction with integrated circuits and the same circuit may, and frequently does, contain both ceramic and tantalum capacitors. Tantalum is a chemical element and popular in capacitors because of its ability to put high capacitance in a small volume. Generally, ceramic capacitors are more cost-effective at lower capacitance values, and tantalum capacitors are more cost-effective at higher capacitance values. Solid aluminum capacitors can be more effective in special applications. Film, paper and electrolytic capacitors can also be used to support integrated circuits, but also are used in the field of power electronics to provide energy for applications such as motor starts, power conditioning, electromagnetic interference filtering, safety and inverters.
The capacitor industry represents a large and growing market. According to an industry report, the global capacitor market was approximately $17.5 billion in fiscal year 2008. Although the recent economic downturn has resulted in reduced sales volume, according to the an industry report, the global capacitor market is expected to gradually improve and by fiscal year 2013 achieve a sales volume similar to that achieved in fiscal year 2008. This report also estimates that from fiscal years 2008 to 2013, the industry will see a total increase in unit volume demand of 21% (1.4 trillion pieces growing to 1.7 trillion pieces), representing a compound annual growth rate of 4.6%. This is in comparison to a unit volume compound annual growth rate of 13% from fiscal year 2003 through fiscal year 2008. The tantalum, ceramic, aluminum and paper and film capacitor markets were estimated at $2.2 billion, $8.3 billion, $3.9 billion and $2.6 billion in fiscal year 2008, respectively.
Because capacitors are a fundamental component of most electronic circuits, demand for capacitors tends to reflect the general demand for electronic products, which, though cyclical, has continued to grow. We believe that growth in the electronics market and the resulting growth in demand for capacitors will be driven primarily by a number of recent trends which include:
- •
- the development of new products and applications, such as global positioning devices, alternative and renewable energy
systems, hybrid transportation systems and electronic controls for engines and industrial machinery, smart phones and mobile personal computers;
- •
- the increase in the electronic content of existing products, such as home appliances, medical equipment and automobiles;
- •
- consumer desire for mobility and connectivity; and
- •
- the enhanced functionality, complexity and convergence of electronic devices that use state-of-the-art microprocessors.
5
Capacitors
Capacitors are electronic components consisting of conducting materials separated by a dielectric, or insulating material, which allows a capacitor to act as a filtering or an energy storage/delivery device. We manufacture a full line of capacitors, including tantalum, multilayer ceramic, film, paper, and aluminum (both wet electrolytic and solid polymer). We manufacture these types of capacitors in many different sizes and configurations. These configurations include surface-mount capacitors, which are attached directly to the circuit board without lead wires, leaded capacitors, which are attached to the circuit board using lead wires, and other attachment methods such as screw terminal and snap-in.
The choice of capacitor dielectric is driven by the engineering specifications and the application of the component product into which the capacitor is incorporated. Product design engineers in the electronics industry typically select capacitors on the basis of capacitance levels, voltage requirements, size and cost. Tantalum and ceramic capacitors are commonly used in conjunction with integrated circuits, and the same circuit may, and frequently does, contain both ceramic and tantalum capacitors. Generally, ceramic capacitors are more cost-effective at lower capacitance values, tantalum capacitors are more cost-effective at higher capacitance values, and solid aluminum capacitors can be more effective in special applications. Film, paper and electrolytic capacitors can also be used to support integrated circuits; a significant area of usage is the field of power electronics to provide energy for applications such as motor start, power factor correction, pulse power, electromagnetic interference filtering and safety.
Management believes that sales of surface-mount capacitors, including multilayer ceramic, tantalum, film, paper, electrolytic and solid aluminum capacitors will grow more rapidly than other types of capacitors in both the United States and worldwide markets, because technological breakthroughs in electronics are regularly expanding the number and type of applications for these products. Management also believes that sales of film, paper and electrolytic capacitors will grow, driven by growth in industrial power applications, hybrid electric vehicles, automotive electronics, alternative energy generation, as well as other electronic application.
Markets and Customers
Our products are sold to a variety of Original Equipment Manufacturers ("OEMs") in a broad range of industries including the computer, communications, automotive, military, consumer, industrial and aerospace industries. We also sell products to Electronic Manufacturing Service ("EMS") providers, which also serve OEMs in these industries. Electronics distributors are an important channel of distribution in the electronics industry and represent the largest channel through which we sell our capacitors. TTI, Inc., a distributor, accounted for over 10% of our net sales in fiscal years 2010, 2009 and 2008. If our relationship with TTI, Inc. were to terminate, we would need to determine alternative means of delivering our products to the end-customers served by TTI, Inc. Our top 50 customers accounted for 75.9% of our net sales during fiscal year 2010.
6
The following table presents an overview of the diverse industries that incorporate our capacitors into their products and the general nature of those products.
Industry
|
Products | |
|---|---|---|
| Automotive | Audio systems, tire pressure monitoring systems, power train electronics, instrumentation, airbag systems, anti-lock braking systems, electronic engine controls, air conditioning controls, and security systems | |
Business Equipment |
Copiers, point-of-sale terminals, and fax machines |
|
Communications |
Cellular phones, telephones, switching equipment, relays, base stations, and wireless infrastructure |
|
Computer-related |
Personal computers, workstations, mainframes, computer peripheral equipment, power supplies, disk drives, printers, and local area networks |
|
Industrial |
Electronic controls, measurement equipment, instrumentation, solar and wind energy generation, and medical electronics |
|
Consumer |
DVD players, MP3 players, game consoles, LCD televisions, global positioning systems and digital still cameras |
|
Military/Aerospace |
Avionics, radar, guidance systems, and satellite communications |
|
Alternative Energy |
Wind generation systems, solar generation systems, geothermal generation systems, tidal generation systems and electric drive vehicles. |
We produce a small percentage of capacitors under military specification standards sold for both military and commercial uses. We do not sell any capacitors directly to the United States government. Certain of our customers purchase capacitors for products in the military and aerospace industries.
It is impracticable to report revenues from external customers for each of the above noted products primarily due to approximately 50% of our external sales being sold to electronics distributors.
KEMET in the United States
Our corporate headquarters are located in Simpsonville, South Carolina which is part of the greater Greenville metropolitan area. Individual functions are evolving to support global activities in Asia, Europe, and the Americas, either from Greenville, South Carolina or through locations in appropriate parts of the world.
Commodity manufacturing in the United States has been substantially relocated to our lower-cost manufacturing facilities in Mexico and China. Production that remains in the United States will focus primarily on early-stage manufacturing of new products and other specialty products for which customers are predominantly located in North America.
To accelerate the pace of innovations, the KEMET Innovation Center was created in July 2003. The primary objectives of the KEMET Innovation Center are to ensure the flow of new products and robust manufacturing processes that are expected to keep us at the forefront of our customers' product designs, while enabling these products to be transferred rapidly to the most appropriate KEMET manufacturing location in the world for low-cost, high-volume production. The main campus of the KEMET Innovation Center is located in Greenville, South Carolina.
7
KEMET in Mexico
We believe our Mexican operations are among the most cost efficient in the world, and they will continue to be our primary production facilities supporting North American and European customers for Tantalum and Ceramic. One of the strengths of KEMET Mexico is that it is a Mexican operation, including Mexican management and workers. These facilities are responsible for maintaining KEMET's traditional excellence in quality, service, and delivery, while driving costs down. The facilities in Victoria and Matamoros will remain focused primarily on tantalum capacitors, while the facilities in Monterrey will continue to focus on ceramic capacitors. During fiscal year 2011, we expect to begin production of standard and commodity Film and Electrolytic products in one of our existing facilities in Monterrey, Mexico.
KEMET in Asia Pacific
In recent years, low production costs and proximity to large, growing markets have caused many of our key customers to relocate production facilities to Asia, particularly China. We have a well-established sales and logistics network in Asia to support our customers' Asian operations. In calendar year 2003, we commenced shipments from our production facility in Suzhou, China near Shanghai ("Suzhou Plant A"). In connection with the Evox Rifa acquisition which was completed in April 2007, we added another Chinese operation in Nantong, China as well as a manufacturing operation in Batam, Indonesia. With the Arcotronics acquisition which was completed in October 2007, we have further expanded our presence in China with a manufacturing operation in Anting, China. These operations will continue to support the former Evox Rifa and Arcotronics customer bases in Asia with top quality film and electrolytic capacitors. In the fourth quarter of fiscal year 2010, we began to manufacture aluminum polymer products in a new leased facility in Suzhou, China ("Suzhou Plant B"). Manufacturing operations in China will continue to grow and we anticipate that our production capacity in China may be equivalent to Mexico in the future. The vision for KEMET China is to be a Chinese operation, with Chinese management and workers, to help achieve our objective of being a global company. These facilities will be responsible for maintaining our traditional excellence in quality, service, and delivery, while accelerating cost-reduction efforts and supporting efforts to grow our customer base in Asia.
KEMET in Europe
As previously mentioned, we acquired the tantalum business unit of EPCOS AG in April 2006, acquired Evox Rifa in April 2007, and acquired Arcotronics in October 2007. These acquisitions have provided us with manufacturing operations in Europe. We currently have one or more manufacturing locations in Bulgaria, Finland, Germany, Italy, Portugal, Sweden, and the United Kingdom. In addition, we have a research and development center in Farjestaden, Sweden. We will maintain and enhance our strong European sales and customer service infrastructure, allowing us to continue to meet the local preferences of European customers who remain an important focus for KEMET going forward.
In September 2009, we announced plans to reduce operating costs by consolidating the manufacturing of certain products and by implementing other lean initiatives. Manufacturing consolidation plans include the movement of certain standard, high-volume products to lower cost locations. We expect the plans will take approximately two to three years to complete; however the length of time required to complete the restructuring activities is dependent upon a number of factors, including the ability to continue to manufacture products required to meet customer demand while at the same time relocating certain production lines, and the progress of discussions with union and government representatives in certain European locations concerning the optimization of product mix and related headcount requirements in such manufacturing locations.
8
Global Sales and Logistics
In recent years, it has become more complex to do business in the electronics industry. Market-leading electronics manufacturers have spread their facilities globally. The growth of the electronics manufacturing services industry has resulted in a more challenging supply chain. New Asian electronics manufacturers are emerging rapidly. The most successful business models in the electronics industry are based on tightly integrated supply chain logistics to drive down costs. Our direct worldwide sales force and a well-developed global logistics infrastructure distinguish us in the marketplace and will remain a hallmark of KEMET in meeting the needs of our global customers. The North America and South America ("Americas") sales staff is organized into four areas supported by regional offices. The European sales staff is organized into five areas, also supported by regional offices. The Asia and Pacific Rim ("APAC") sales staff is organized into four areas (China, Singapore, Taiwan and India), and is also supported by regional offices. We also have independent sales representatives located in seven countries worldwide including: Brazil, Puerto Rico, South Korea, and the United States.
We market and sell our products in our major markets primarily through a direct sales force. In addition, we use independent commissioned representatives. We believe our direct sales force creates a distinctive competence in the marketplace and has enabled us to establish and maintain strong relationships with our customers. With a global sales organization that is customer-focused, our direct sales personnel from around the world serve on KEMET Global Account Teams. These teams are committed to serving any customer location in the world with a dedicated KEMET representative. This approach requires a blend of accountability and responsibility for specific customer locations, guided by an overall account strategy for each customer.
Electronics distributors are an important distribution channel in the electronics industry and accounted for 48%, 47%, and 48% of our net sales in fiscal years 2010, 2009 and 2008 respectively. In fiscal years 2010, 2009 and 2008, TTI, Inc. accounted for more than 10% of net sales.
A portion of our net sales is made to distributors under agreements allowing certain rights of return and price protection on unsold merchandise held by distributors. Our distributor policy includes inventory price protection and "ship-from-stock and debit" ("SFSD") programs common in the industry.
The SFSD program provides a mechanism for the distributor to meet a competitive price after obtaining authorization from the local Company sales office. This program allows the distributor to ship its higher-priced inventory and debit us for the difference between our list price and the lower authorized price for that specific transaction. We establish reserves for the SFSD program based primarily on historical SFSD activity and the actual inventory levels of certain distributor customers.
Sales by Geography
In fiscal year 2010, net sales by region were as follows: Americas net sales were 24%, APAC net sales were 39%, and Europe, Middle East and Africa ("EMEA") net sales were 37%. Although we believe that we are able to provide a level of delivery and service that is competitive with local suppliers, our capacitor market share in Asian and European markets tend to be significantly lower than in the United States because certain international electronics manufacturers prefer to purchase components from local producers. As a result, a large percentage of our international sales are made to foreign operations of United States manufacturers.
Inventory and Backlog
Although we manufacture and inventory standardized products, a portion of our products are produced to meet specific customer requirements. Cancellations by customers of orders already in
9
production could have an impact on inventories. However, historically, cancellations have not been significant.
Our customers often encounter uncertain or changing demand for their products. They historically order products from us based on their forecast. If demand does not meet their forecasts, they may cancel or reschedule the shipments included in our backlog, in many instances without penalty. Additionally, many of our customers have started to require shorter lead times and "just in time" delivery. As a result of these factors, the twelve month order backlog is no longer a meaningful trend indicator for us.
Competition
The market for capacitors is highly competitive. The capacitor industry is characterized by, among other factors, a long-term trend toward lower prices, low transportation costs, and few import barriers. Competitive factors that influence the market for our products include product quality, customer service, technical innovation, pricing, and timely delivery. We believe that we compete favorably on the basis of each of these factors.
Our major global competitors include AVX Corporation, EPCOS AG, Matsushita Electric Industrial Company, Ltd. (Panasonic), Murata Manufacturing Co., Ltd., NEC TOKIN Corporation, Sanyo Electric Co., Ltd., TDK Corporation, Taiyo Yuden Co., Ltd., TDK Corporation, WIMA GmbH & Co., KG and Vishay. These competitors, among others, cover the breadth of our capacitor offerings.
Raw Materials
The most expensive raw materials used in the manufacture of our products are tantalum powder, palladium, aluminum, and silver. These materials are considered commodities and are subject to price volatility.
Due to market constraints, we no longer purchase tantalum powder under long-term contracts. Instead, we forecast our tantalum needs for the short-term (twelve weeks) and make purchases based upon those forecasts. We currently have purchase agreements outstanding three to six months. While the financial impact of these decisions are short-term in nature given that we are not currently party to any long-term supply agreements, they could impact our financial performance from period to period given that we do not hedge any of our raw material exposure and we may be unable to pass on to a significant number of our customers any fluctuations in our raw material costs. Additionally, any delays in obtaining raw materials for our products could hinder our ability to manufacture our products, negatively impacting our competitive position and our relationships with our customers.
Presently, a limited number of suppliers process tantalum ore into capacitor-grade tantalum powder. We believe the tantalum our operations require is generally available in sufficient quantities to meet our requirements and that there are a sufficient number of tantalum processors relative to foreseeable demand. Although limited, additional suppliers have emerged in the market. This fact, along with our effort to broaden the number of qualified suppliers, should minimize our commodity price risk exposure. However, an increase in the price of tantalum that we are unable to pass on to our customers, could have an adverse affect on our profitability.
Palladium is a precious metal used in the manufacture of multilayer ceramic capacitors ("MLCC") and is mined primarily in Russia and South Africa. We are aggressively pursuing ways to reduce palladium usage in ceramic capacitors in order to minimize the price risk. The amount of palladium that we require has generally been available in sufficient quantities, however of the price of palladium is driven by the market which has shown significant price fluctuations. For instance, in fiscal year 2010
10
the price of palladium fluctuated between $177 and $444 per troy ounce. Price increases and our inability to pass such increases on to our customers could have an adverse effect on profitability.
Silver and aluminum have generally been available in sufficient quantities, and we believe there are a sufficient number of suppliers from which we can purchase our requirements. In addition, while silver was previously primarily purchased on the spot and forward markets, we now manage silver inventory levels to maintain close to a zero balance in an effort to remain lean. An increase in the price of silver that we are unable to pass on to our customers, however, could have an adverse affect on our profitability.
Patents and Trademarks
At March 31, 2010, we held 84 United States and 31 foreign patents and 8 United States and 87 foreign trademarks. We believe that the success of our business is not materially dependent on the existence or duration of any patent, license, or trademark other than the trademarks "KEMET" and "KEMET Charged". Our engineering and research and development staffs have developed and continue to develop proprietary manufacturing processes and equipment designed to enhance our manufacturing facilities and reduce costs.
Research and Development
Research and development expenses were $22.1 million, $29.0 million and $35.7 million for fiscal years 2010, 2009 and 2008, respectively. These amounts include expenditures for product development and the design and development of machinery and equipment for new processes and cost reduction efforts. Most of our products and manufacturing processes have been designed and developed by our engineers. We continue to invest in new technology to improve product performance and production efficiencies.
Segment Reporting
We are is organized into three distinct business groups: Tantalum, Ceramic, and Film and Electrolytic. Each business group is responsible for the operations of certain manufacturing sites as well as all related research and development efforts. The sales and marketing functions are shared by each of the business groups and the cost of which are allocated to the business groups based on the business groups' respective budgeted net sales. See Note 8, "Segment and Geographic Information" to our consolidated financial statements.
Tantalum Business Group
Our Tantalum Business Group is a leading manufacturer of solid tantalum and aluminum capacitors. Over the past fifty years, we have made significant investments in our tantalum capacitor business and, based on net sales, we believe that we are the largest tantalum capacitor manufacturer in the world. We are one of the leaders in the growing market for high-frequency surface mount tantalum and aluminum polymer capacitors.
Our broad product portfolio, industry leading process and materials technology, global manufacturing base and on-time delivery capabilities allow us to serve a wide range of customers in a diverse group of end markets, including computing, telecommunications, consumer, automotive and general industries. This business group operates five manufacturing sites in Portugal, Mexico and China and maintains a product innovation center in the United States. Our Tantalum Business Group employs over 4,500 employees worldwide.
11
Ceramic Business Group
Our Ceramic Business Group offers an extensive line of multilayer ceramic capacitors in a variety of sizes and configurations. We are one of the two leading ceramic capacitor manufacturers in the United States and among the ten largest manufacturers worldwide.
Our high temperature and capacitance-stable product lines provide us with what we believe to be a significant advantage over many of our competitors, especially in high reliability markets, such as medical, industrial, defense and aerospace. Our other significant end markets include computing, telecommunications, aerospace & defense, automotive and general industries. This business group operates two manufacturing sites in Mexico and a finishing plant in China and maintains a product innovation center in the United States. Our Ceramic Business Group employs over 2,500 employees worldwide.
Film and Electrolytic Business Group
Our Film and Electrolytic Business Group produces film, paper and wet aluminum electrolytic capacitors. We entered this market through the acquisitions of Evox Rifa and Arcotronics in fiscal year 2008. In January 2011, we expect to begin the production of film and electrolytic capacitors within the United States to support alternative energy products and emerging green technologies such as hybrid electric drive vehicles. Film capacitors are preferred where high reliability is a determining factor, while wet aluminum electrolytic capacitors are preferred when high capacitance at reasonable cost is required. We are one of the world's largest suppliers of film and one of the leaders in wet aluminum electrolytic capacitors for high-value custom applications.
Our Film and Electrolytic Business Group primarily serves the industrial, automotive, consumer and telecom markets. We believe that our Film and Electrolytic Business Group's product portfolio, technology and experience allow us to significantly benefit from the continued growth in alternative energy solutions. We operate thirteen film and electrolytic manufacturing sites throughout Europe and Asia and maintain a product innovation center in Sweden.
In September 2009, we announced plans to reduce operating costs by consolidating the manufacturing of certain products and by implementing other lean initiatives. Manufacturing consolidation plans include the movement of certain standard, high-volume products to lower cost manufacturing locations. We expect the plans will take approximately two to three years to complete; however the length of time required to complete the restructuring activities is dependent upon a number of factors, including the ability to continue to manufacture products required to meet customer demand while at the same time relocating certain production lines and the progress of discussions with union and government representatives in certain European locations concerning the optimization of product mix and related headcount requirements in such manufacturing locations.
Environmental and Regulatory Compliance
We are subject to various North American, European, and Asian federal, state, and local environmental laws and regulations relating to the protection of the environment, including those governing the handling and management of certain chemicals used and generated in manufacturing electronic components. Based on the annual costs incurred over the past several years, we do not believe that compliance with these laws and regulations will have a material adverse effect on our capital expenditures, earnings, or competitive position. We believe, however, that it is reasonably likely that the trend in environmental litigation, laws, and regulations will continue to be toward stricter standards. Such changes in the laws and regulations may require us to make additional capital expenditures which, while not currently estimable with certainty, are not presently expected to have a material adverse effect on our financial condition.
12
Our Guiding Principles support a strong commitment to economic, environmental, and socially sustainable development. As a result of this commitment, we have adopted the Electronic Industry Code of Conduct ("EICC"). The EICC is a comprehensive code of conduct that addresses all aspects of corporate responsibility including Labor, Health and Safety, the Environment, and Business Ethics. It outlines standards to ensure working conditions in the electronic industry supply chain are safe, that workers are treated with respect and dignity, and that manufacturing processes are environmentally friendly.
Policies, programs, and procedures implemented throughout KEMET ensure compliance with legal and regulatory requirements, the content of the EICC, and customer contractual requirements related to social and environmental responsibility.
We are committed to these business ethics and labor, health, safety, and environmental standards.
Employees
We have approximately 10,400 employees as of March 31, 2010, of whom 550 are located in the United States, 5,250 are located in Mexico, 2,450 in Asia and 2,150 in Europe. We believe that our future success will depend in part on our ability to recruit, retain, and motivate qualified personnel at all levels of the Company. As of March 31, 2010, we have 4,300 hourly employees in Mexico who are represented by labor unions as required by Mexican law. In addition, as of March 31, 2010, we have 300 employees represented by labor unions in China, 550 employees represented by labor unions in Indonesia, 200 employees represented by labor unions in Finland, 300 employees represented by labor unions in Portugal, 85 employees represented by labor unions in Sweden, 800 employees represented by labor unions in Italy and 260 employees represented by labor unions in Bulgaria. In fiscal year 2010, we have not experienced any major work stoppages. Our labor costs in Mexico, China, Indonesia, and various locations in Europe are denominated in the local currencies, and a significant depreciation or appreciation of the United States dollar against the local currencies would increase or decrease our labor costs.
Securities Exchange Act of 1934 Reports
We maintain an Internet website at the following address: http://www.kemet.com. KEMET makes available on or through our Internet website certain reports and amendments to those reports that are filed or furnished to the SEC pursuant to Section 13(a) or 15(d) in accordance with the Securities Exchange Act of 1934. These include annual reports on Form 10-K, quarterly reports on Form 10-Q, and current reports on Form 8-K. This information is available on our website free of charge as soon as reasonably practicable after we electronically file the information with, or furnish it to, the SEC.
Code of Business Integrity and Ethics
We maintain a Code of Business Integrity and Ethics (the "Code of Ethics"). Our website includes a copy of the Code of Ethics, and it can be downloaded free of charge at http://www.kemet.com. On May 3, 2010, we adopted a new Global Code of Conduct ("Code of Conduct"), effective August 1, 2010, which is applicable to all employees, officers, and directors of the Company. The Code of Conduct will replace and substantially elaborate on the Company's Code of Ethics. The Code of Conduct addresses among other things, ethics in the workplace and marketplace, guidance for making decisions and reporting violations of the law and the Code of Conduct, and the importance of protecting the Company's assets. The Code of Conduct was filed on May 6, 2010 with the SEC in our Current Report on Form 8-K. Effective August 1, 2010, the Code of Conduct and any amendments thereto will be immediately available at http://www.kemet.com.
13
This report contains certain statements that are forward-looking within the meaning of the Private Securities Litigation Reform Act of 1995. These statements are not guarantees of future performance and involve certain risks, uncertainties and assumptions that are difficult to predict. Actual outcomes and results may differ materially from those expressed in, or implied by, our forward-looking statements. Words such as "expects," "anticipates," "believes," "estimates" and other similar expressions or future or conditional verbs such as "will," "should," "would" and "could" are intended to identify such forward-looking statements. Readers of this report should not rely solely on the forward-looking statements and should consider all uncertainties and risks throughout this report. The statements are representative only as of the date they are made, and we undertake no obligation to update any forward-looking statement.
All forward-looking statements, by their nature, are subject to risks and uncertainties. Our actual future results may differ materially from those set forth in our forward-looking statements. We face risks that are inherent in the businesses and the market places in which we operate. While we believe these forward-looking statements are accurate and reasonable, uncertainties, risks and factors, including those described below, could cause actual results to differ materially from those reflected in the forward-looking statements.
Factors that may cause the actual outcome and results to differ materially from those expressed in, or implied by, these forward-looking statements include, but are not necessarily limited to the following: (i) continued uncertainty of the economy could impact our ability to realize operating plans if the demand for our products declines and could adversely affect our liquidity and ability to continue to operate; (ii) adverse economic conditions could cause further reevaluation and the write down of long-lived assets; (iii) an increase in the cost or a decrease in the availability of our principal raw materials; (iv) changes in the competitive environment; (v) certain of our capacitors are incorporated into products used in heavily regulated industries; (vi) economic, political, or regulatory changes in the countries in which we operate; (vii) difficulties, delays or unexpected costs in completing the restructuring plan; (viii) the ability to attract, train and retain effective employees and management; (ix) the ability to develop innovative products to maintain customer relationships; (x) the impact of environmental issues, laws, and regulations; (xi) volatility of financial and credit markets which would affect our access to capital; (xii) increased difficulty or expense in accessing capital because of the delisting of our common stock from the New York Stock Exchange ("NYSE"); (xiii) exposure to foreign exchange gains and losses; (xiv) need to reduce costs to offset downward price trends; (xv) potential limitation on use of net operating losses to offset possible future taxable income; (xvi) dilution as a result of the issuance of the warrant held by K Equity, LLC; and (xvii) exercise of the warrant by K Equity, LLC may result in the existence of a controlling stockholder.
Additional risks and uncertainties not presently known to us or that we currently deem immaterial also may impair our business operations and also could cause actual results to differ materially from those included, contemplated or implied by the forward-looking statements made in this report, and the reader should not consider the above list of factors to be a complete set of all potential risks or uncertainties.
The continued uncertainty of the economy could impact our ability to realize operating plans if the demand for our products declines and could adversely affect our liquidity and ability to continue to operate.
While our operating plans provide for cash generated from operations to be sufficient to cover our future operating requirements, many factors, including reduced demand for our products, currency exchange rate fluctuations, increased raw material costs, and other adverse market conditions could cause a shortfall in net cash generated from operations. As an example, the electronics industry is a highly cyclical industry. The demand for capacitors tends to reflect the demand for products in the
14
electronics market. Customers' requirements for our capacitors fluctuate as a result of changes in general economic activity and other factors that affect the demand for their products. During periods of increasing demand for their products, they typically seek to increase their inventory of our products to avoid production bottlenecks. When demand for their products peaks and begins to decline, they may rapidly decrease orders for our products while they use up accumulated inventory. Business cycles vary somewhat in different geographical regions, such as Asia, and within customer industries. We are also vulnerable to general economic events beyond our control and our sales and profits may suffer in periods of weak demand.
TTI, Inc., a distributor, accounted for over 10% of our net sales in fiscal years 2010, 2009 and 2008. If our relationship with TTI, Inc. were to terminate, we would need to determine alternative means of delivering our products to the end-customers served by TTI, Inc.
To provide financial flexibility, we may enter into negotiations to secure additional financing or sell non-core assets. However, there can be no assurances that we will be successful in either of these strategic initiatives.
Our ability to realize operating plans is also dependent upon meeting our payment obligations and complying with any applicable financial covenants under our debt agreements. If cash generated from operating, investing and financing activities is insufficient to pay for operating requirements and to cover interest payment obligations under debt instruments, planned operating and capital expenditures may need to be reduced.
Adverse economic conditions could cause further reevaluation and the write down of long-lived assets.
Long-lived assets and intangible assets subject to amortization are reviewed for impairment whenever events or changes in circumstances indicate that the carrying amount of a long-lived asset or group of assets may not be recoverable. In the event that the test shows that the carrying value of certain long-lived assets are impaired, we would be required to take an impairment charge to earnings under U.S. generally accepted accounting principles. However, such a charge would have no direct effect on our cash.
An increase in the cost or decrease in the availability of our principal raw materials could adversely affect profitability.
The principal raw materials used in the manufacture of our products are tantalum powder, palladium, aluminum and silver. These materials are considered commodities and are subject to price volatility. Due to market constraints, we no longer purchase tantalum powder under long-term contracts. Instead, we forecast our tantalum needs for the short-term (twelve weeks) and make purchases based upon those forecasts; we currently have purchase agreements outstanding for three to six months. While the financial impact of these decisions are short-term in nature given that we are not currently party to any long-term supply agreements, they could impact our financial performance from period to period given that we do not hedge any of our raw material exposure and we may be unable to pass on to a significant number of our customers any fluctuations in our raw material costs. Additionally, any delays in obtaining raw materials for our products could hinder our ability to manufacture our products, negatively impacting our competitive position and our relationships with our customers.
Presently, a limited number of suppliers process tantalum ore into capacitor-grade tantalum powder. We believe the tantalum our operations require is generally available in sufficient quantities to meet our requirements and that there are a sufficient number of tantalum processors relative to foreseeable demand. Although limited, additional suppliers have emerged in the market. This fact, along with our effort to broaden the number of qualified suppliers, should minimize our commodity
15
price risk exposure. However, an increase in the price of tantalum that we are unable to pass on to our customers, could have an adverse affect on our profitability.
Palladium is a precious metal used in the manufacture of multilayer ceramic capacitors and is mined primarily in Russia and South Africa. We are aggressively pursuing ways to reduce palladium usage in ceramic capacitors in order to minimize the price risk. The amount of palladium that we require has generally been available in sufficient quantities, however of the price of palladium is driven by the market which has shown significant price fluctuations. For instance, in fiscal year 2009 the price of palladium fluctuated between $177 and $444 per troy ounce. Price increases and the possibility of our inability to pass such increases on to our customers could have an adverse effect on profitability.
Silver and aluminum have generally been available in sufficient quantities, and we believe there are a sufficient number of suppliers from which we can purchase our requirements. In addition, while silver was previously primarily purchased on the spot and forward markets, we now manage silver inventory levels to maintain close to a zero balance in an effort to remain lean. An increase in the price of silver that we are unable to pass on to our customers, however, could have an adverse affect on our profitability.
We face intense competition.
The capacitor business is highly competitive worldwide, with low transportation costs and few import barriers. Competition is based on factors such as product quality and reliability, availability, customer service, timely delivery and price. The industry has become increasingly consolidated and globalized in recent years, and our primary U.S. and non-U.S. competitors, some of which are larger than us, have significant financial resources. The greater financial resources of such competitors may enable them to commit larger amounts of capital in response to changing market conditions. Some competitors may also have the ability to use profits from other operations to subsidize losses sustained in their businesses with which we compete. Certain competitors may also develop product or service innovations that could put us at a disadvantage.
Certain of our capacitors are incorporated into products used in heavily regulated industries.
Our capacitors are incorporated into products used in diverse industries. Certain of these industries, such as military, aerospace and medical, are heavily regulated, with long and sometimes unpredictable product approval and qualification processes. Due to such regulatory compliance issues, there can be no assurances as to the timing of product revenues and profitability arising from our product development and sales efforts in these industries.
We manufacture many capacitors in Europe, Mexico and Asia and future political or regulatory changes in any of these regions could adversely affect our profitability.
Our international operations are subject to a number of special risks, in addition to the same risks as our domestic business. These risks include currency exchange rate fluctuations, differing protections of intellectual property, trade barriers, labor unrest, exchange controls, regional economic uncertainty, differing (and possibly more stringent) labor regulation, risk of governmental expropriation, domestic and foreign customs and tariffs, current and changing regulatory regimes, differences in the availability and terms of financing, political instability and potential increases in taxes. These factors could impact our production capability or adversely affect our results of operations or financial condition.
We may experience difficulties, delays or unexpected costs in completing the restructuring plan.
In the second quarter of fiscal year 2010, we initiated a restructuring plan designed to improve the operating performance of Film and Electrolytic. However, any anticipated benefits of this restructuring
16
activity will not be realized until future periods. The plan is expected to take approximately two to three years to complete.
We may not realize, in full or in part, the anticipated benefits of the restructuring plan without encountering difficulties, which may include complications in the transfer of production knowledge, loss of key employees and/or customers, the disruption of ongoing business and possible inconsistencies in standards, controls and procedures. We are party to collective bargaining agreements in certain jurisdictions in which we operate which could potentially prevent or delay execution of parts of our restructuring plan.
Losing the services of our executive officers or our other highly qualified and experienced employees or our inability to continue to attract and retain additional qualified personnel could harm our business.
Our success depends upon the continued contributions of our executive officers and certain other employees, many of whom have many years of experience with us and would be extremely difficult to replace. We must also attract and retain experienced and highly skilled engineering, sales and marketing and managerial personnel. Competition for qualified personnel is intense in our industry, and we may not be successful in hiring and retaining these people. If we lost the services of our executive officers or our other highly qualified and experienced employees or cannot attract and retain other qualified personnel, our business could suffer through less effective management due to loss of accumulated knowledge of our business or through less successful products due to a reduced ability to design, manufacture and market our products.
We must continue to develop innovative products to maintain relationships with our customers and to offset potential price erosion in older products.
While most of the fundamental technologies used in the passive components industry have been available for a long time, the market is nonetheless typified by rapid changes in product designs and technological advances allowing for better performance, smaller size and/or lower cost. New applications are frequently found for existing technologies, and new technologies occasionally replace existing technologies for some applications or open up new business opportunities in other areas of application. We believe that successful innovation is critical for maintaining profitability in the face of potential erosion of selling prices for existing products and to ensure the flow of new products and robust manufacturing processes that will keep us at the forefront of our customers' product designs. Non-customized commodity products are especially vulnerable to price pressure, but customized products have also experienced price pressure in recent years. Developing and marketing new products requires start-up costs that may not be recouped if these products or production techniques are not successful. There are numerous risks inherent in product development, including the risks that we will be unable to anticipate the direction of technological change or that we will be unable to develop and market new products and applications in a timely fashion to satisfy customer demands. If this occurs, we could lose customers and experience adverse effects on our results of operations.
Various laws and regulations that apply to our business, including those relating to environmental matters, could limit our ability to operate as we are currently and could result in additional costs.
We are subject to various laws and regulations of federal, state and local authorities in the countries in which we operate regarding a wide variety of matters, including environmental, employment, land use, anti-trust, and others that affect the day-to-day operations of our business. The liabilities and requirements associated with the laws and regulations that affect us may be costly and time-consuming. There can be no assurance that we have been or will be at all times in compliance with such applicable laws and regulations. Failure to comply may result in the assessment of administrative, civil and criminal penalties, the issuance of injunctions to limit or cease operations, the suspension or revocation of permits and other enforcement measures that could have the effect of
17
limiting our operations. If we are pursued for sanctions, costs or liabilities in respect of these matters, our operations and, as a result, our profitability could be materially and adversely affected.
We are subject to a variety of U.S. federal, state and local, as well as foreign, environmental laws and regulations relating, among other things, to wastewater discharge, air emissions, handling of hazardous materials, disposal of solid and hazardous wastes, and remediation of soil and groundwater contamination. We use a number of chemicals or similar substances, and generate wastes, that are considered hazardous. We require environmental permits to conduct many of our operations. Violations of environmental laws and regulations could result in substantial fines, penalties, and other sanctions. Changes in environmental laws or regulations (or in their enforcement) affecting or limiting, for example, our chemical uses, certain of our manufacturing processes, or our disposal practices, could restrict our ability to operate as we are currently operating or impose additional costs. In addition, we may experience releases of certain chemicals or discover existing contamination, which could cause us to incur material cleanup costs or other damages.
Volatility of financial and credit markets could affect our access to capital.
The continued uncertainty in the global financial and credit markets could impact our ability to implement new financial arrangements or to modify our existing financial arrangements. An inability to obtain new financing or to further modify existing financing could adversely impact the execution of our restructuring plans and delay the realization of the expected cost reductions. Our ability to generate adequate liquidity will depend on our ability to execute our operating plans and to manage costs in light of developing economic conditions. An unanticipated decrease in sales, or other factors that would cause the actual outcome of our plans to differ from expectations, could create a shortfall in cash available to fund our liquidity needs. Being unable to access new capital, experiencing a shortfall in cash from operations to fund our liquidity needs and the failure to implement an initiative to offset the shortfall in cash, such as, for example, a sale of non-core assets, would likely have a material adverse effect on our business.
We are currently listed on the OTC Bulletin Board which could have an adverse effect on our financial condition and results of operations.
Our listing on the OTC Bulletin Board could have an adverse effect on our financial condition and results of operations by, among other things, limiting:
- •
- the liquidity of our common stock;
- •
- the market price of our common stock;
- •
- the number of institutional and other investors that will consider investing in our common stock;
- •
- the availability of information concerning the trading prices and volume of our common stock;
- •
- the number of broker-dealers willing to execute trades in shares of our common stock; and
- •
- our ability to obtain financing for the continuation of operations.
Our inability to purchase forward exchange contracts exposes us to foreign exchange gains and losses.
Given our international operations and sales, we are exposed to movements in foreign exchange rates. Of these, the most significant are currently the Euro and the Mexican peso. A portion of our sales to our customers and operating costs in Europe are denominated in Euro creating an exposure to foreign currency exchange rates. Also, a portion of our costs in our Mexican operations are denominated in Mexican pesos, creating an exposure to foreign currency exchange rates. Additionally, certain of our non-U.S. subsidiaries make sales denominated in U.S. dollars which expose them to foreign currency transaction gains and losses. Historically, in order to minimize our exposure, we
18
periodically entered into forward foreign exchange contracts in which the future cash flows in the Euro or Mexican peso were hedged against the U.S. dollar. In the event we were to establish a revolving line of credit or foreign exchange line of credit, we will consider entering into forward exchange contracts.
We must consistently reduce the total costs of our products to remain competitive.
Our industry is intensely competitive and prices for existing commodity products tend to decrease steadily over their life cycle. There is substantial and continuing pressure from customers to reduce the total cost of using our parts. To remain competitive, we must achieve continuous cost reductions through process and product improvements.
We must also be in a position to minimize our customers' shipping and inventory financing costs and to meet their other goals for rationalization of supply and production. Our growth and the profit margins of our products will suffer if our competitors are more successful in reducing the total cost to customers of their products than we are. We must also continue to introduce new products that offer performance advantages over our existing products and can thereby achieve premium prices, offsetting the price declines in our more mature products.
Our use of net operating loss carryforwards could be limited by ownership changes.
In addition to the general limitations on the carryback and carryforward of net operating losses under Section 172 of the Internal Revenue Code (the "Code"), Section 382 of the Code imposes further limitations on the utilization of net operating losses by a corporation following various types of ownership changes which result in more than a 50 percentage point change in ownership of a corporation within a three year period. Therefore, the future utilization of our net operating losses may be subject to limitation for regular federal income tax purposes.
The issuance of the Closing Warrant may be deemed an "ownership change" for purposes of Section 382 of the Code. If such an ownership change is deemed to occur, the amount of our taxable income that can be offset by our net operating loss carryovers in taxable years after the ownership change will be severely limited. While we believe that the issuance of the Closing Warrant did not result in an ownership change for purposes of Section 382 of the Code, there is no assurance that our view will be unchallenged. Moreover, a future exercise of part or all of the Closing Warrant may give rise to an ownership change in the future.
The application of Section 382 of the Code now or in the future could limit or deny all or a substantial part of our future utilization of available net operating losses, if any. Such limitation or denial could require us to pay substantial additional federal and state taxes and interest. Such tax and interest liabilities may adversely affect our liquidity and financial position.
Holders of our common stock are subject to the risk of dilution as a result of the warrant held by K Equity, LLC.
As part of the consideration for entering into the Platinum Credit Facility, we granted K Financing a warrant to purchase up to 80,544,685 shares of our common stock at a maximum aggregate purchase price of $40.3 million, subject to certain adjustments, representing up to 49.9% of our outstanding common stock on a post-Closing warrant basis. This warrant was subsequently transferred to K Equity, LLC. The warrant is exercisable at any time prior to the tenth anniversary of the date of issuance. The exercise of the warrant could result in dilution to the holders of our common stock. In addition to the potential dilutive effective of a warrant, there is the potential that a large number of the shares may be traded in the public market at any time, which could place significant downward pressure on the trading price of our common stock. The issuance and sale of additional shares in the public market could also impair our ability to raise capital by selling equity securities.
19
The exercise of the warrant by K Equity, LLC may result in the existence of a controlling stockholder that may have interests that conflict with our interests and those of our other stockholders.
On June 30, 2009, K Financing received a warrant to purchase up to 80,544,685 shares of our common stock. The initial maximum aggregate exercise price of the Closing Warrant was $40.3 million and the aggregate exercise price was subsequently adjusted pursuant to its terms to $28.2 million. This warrant was subsequently transferred to K Equity, an affiliate of K Financing. Upon exercise of the warrant, K Equity may own up to approximately 49% of our outstanding common stock. As a result, K Equity would have significant influence over our management and affairs, and would be able to control virtually all matters requiring approval by the stockholders, including the vote to approve members of our board of directors. K Equity would have significant influence over actions to be taken by us and our board of directors, including amendments to our certificate of incorporation and bylaws and approval of significant corporate transactions, including mergers and sales of substantially all of our assets. It is possible that the interests of K Equity may in some circumstances conflict with our interests and the interests of our other stockholders.
ITEM 1B. UNRESOLVED STAFF COMMENTS.
None.
We are headquartered in Greenville, South Carolina and have a total of 21 manufacturing plants located in the United States, Mexico, Europe and Asia. Our existing manufacturing and assembly facilities have approximately 3 million square feet of floor space and are highly automated with proprietary manufacturing processes and equipment.
The Mexican facilities operate under the Maquiladora Program. In general, a company that operates under this program is afforded certain duty and tax preferences and incentives on products brought into the United States. Our manufacturing standards, including compliance with worker safety laws and regulations are essentially identical in the United States, Mexico, Europe and Asia. Our Mexican, European and Asian operations, like our United States operations, have won numerous quality, environmental and safety awards.
We have developed just-in-time manufacturing and sourcing systems. These systems enable us to meet customer requirements for faster deliveries while minimizing the need to carry significant inventory levels. We continue to emphasize flexibility in all of our manufacturing operations to improve product delivery response times.
We believe that substantially all of our property and equipment is in good condition, and that overall, we have sufficient capacity to meet our current and projected manufacturing and distribution needs.
20
The following table provides certain information regarding our principal facilities:
Location
|
Square Footage (in thousands) |
Type of Interest |
Description of Use | |||||
|---|---|---|---|---|---|---|---|---|
| Greenville, South Carolina | 372 | Owned | Headquarters, Innovation Center and Manufacturing | |||||
Tantalum Business Group |
||||||||
| Matamoros, Mexico | 286 | Owned | Manufacturing | |||||
| Suzhou, China(1) | 374 | Leased | Manufacturing | |||||
| Ciudad Victoria, Mexico | 265 | Owned | Manufacturing | |||||
| Evora, Portugal | 233 | Owned | Manufacturing | |||||
Ceramic Business Group |
||||||||
| Monterrey, Mexico(1) | 532 | Owned | Manufacturing | |||||
Film and Electrolytic Business Group |
||||||||
| Sasso Marconi, Italy | 215 | Owned | Manufacturing | |||||
| Granna, Sweden | 132 | Owned | Manufacturing | |||||
| Suomussalmi, Finland | 121 | Leased | Manufacturing | |||||
| Batam, Indonesia | 86 | Owned | Manufacturing | |||||
| Kyustendil, Bulgaria | 82 | Owned | Manufacturing | |||||
| Landsberg, Germany | 81 | Leased | Manufacturing | |||||
| Weymouth, United Kingdom | 96 | Leased | Manufacturing | |||||
| Vergato, Italy | 78 | Owned | Manufacturing | |||||
| Monghidoro, Italy | 71 | Owned | Manufacturing | |||||
| Anting, China | 38 | Owned | Manufacturing | |||||
| Nantong, China | 30 | Leased | Manufacturing | |||||
| Farjestaden, Sweden | 28 | Leased | Manufacturing | |||||
| Northampton, England | 8 | Leased | Manufacturing | |||||
- (1)
- Includes two manufacturing facilities.
In recent years, low production costs and proximity to large, growing markets have caused many of our key customers to relocate production facilities to Asia, particularly China. We have a well-established sales and logistics network in Asia to support our customers' Asian operations. In calendar year 2003, we commenced shipments from our production facility in Suzhou, China near Shanghai ("Suzhou Plant A"). In connection with the Evox Rifa acquisition which was completed in April 2007, we added another Chinese operation in Nantong, China as well as a manufacturing operation in Batam, Indonesia. With the Arcotronics acquisition which was completed in October 2007, we have further expanded our presence in China with a manufacturing operation in Anting, China. These operations will continue to support the former Evox Rifa and Arcotronics customer bases in Asia with top quality film and electrolytic capacitors. In the fourth quarter of fiscal year 2010, we began to manufacture aluminum polymer products in a new leased facility in Suzhou Plant B.
We or our subsidiaries are at any one time parties to a number of lawsuits arising out of their respective operations, including workers' compensation or work place safety cases, some of which involve claims of substantial damages. Although there can be no assurance, based upon information known to us, we do not believe that any liability which might result from an adverse determination of such lawsuits would have a material adverse effect on our financial condition or results of operations.
21
ITEM 4. [RESERVED AND REMOVED]
ITEM 4A. EXECUTIVE OFFICERS OF THE REGISTRANT
The name, age, business experience, positions and offices held and period served in such positions or offices for each of the executive officers and certain key employees of the Company is as listed below.
Name
|
Age | Position | Years with Company(1) |
||||||
|---|---|---|---|---|---|---|---|---|---|
| Per-Olof Lööf | 59 | Chief Executive Officer and Director | 5 | ||||||
| William M. Lowe, Jr. | 57 | Executive Vice President and Chief Financial Officer | 2 | ||||||
| Robert R. Argüelles | 43 | Senior Vice President, Operational Excellence and Quality | 1 | ||||||
| Conrado Hinojosa | 45 | Senior Vice President, Tantalum Business Group | 11 | ||||||
| Marc Kotelon | 46 | Senior Vice President Sales—Global Sales | 16 | ||||||
| Charles C. Meeks, Jr. | 49 | Senior Vice President, Ceramic Business Group | 26 | ||||||
| Susan B. Barkal | 47 | Vice President, Corporate Quality and Chief Compliance Officer | 10 | ||||||
| Daniel E. LaMorte | 64 | Vice President and Chief Information Officer | 6 | ||||||
| Dr. Phillip M. Lessner | 51 | Vice President and Chief Technology Officer | 14 | ||||||
| Larry C. McAdams | 58 | Vice President, Human Resources | 26 | ||||||
| Dr. Daniel F. Persico | 54 | Vice President, Strategic Marketing and Business Development | 9 | ||||||
| R. James Assaf | 50 | Vice President, General Counsel and Secretary | 2 | ||||||
| Michael W. Boone | 59 | Vice President and Treasurer | 23 | ||||||
| David S. Knox | 46 | Vice President and Corporate Controller | 2 | ||||||
- (1)
- Includes service with Union Carbide Corporation.
Executive Officers
Per-Olof Lööf, Chief Executive Officer and Director, was named such in April 2005. Mr. Lööf was previously the Managing Partner of QuanStar Unit LLC, a management consulting firm. Prior to this, he served as Chief Executive Officer of Sensormatic Electronics Corporation and in various management roles with Andersen Consulting, Digital Equipment Corporation, AT&T and NCR. Mr. Lööf serves as a board member of Global Options Inc., and Devcon International Corporation. He received a "civilekonom examen" degree in economics and business administration from the Stockholm School of Economics.
William M. Lowe, Jr., Executive Vice President and Chief Financial Officer, was named such in July 2008. Mr. Lowe was previously the Vice President, Chief Operating Officer and Chief Financial Officer of Unifi, Inc., a producer and processor of textured synthetic yarns from January 2004 to October 2007. Prior to holding that position, he was Executive Vice President and Chief Financial Officer for Metaldyne, an automotive components manufacturer. He also held various financial management positions with ArvinMeritor, Inc., a premier global supplier of integrated automotive components. He received his B.S. degree in business administration with a major in accounting from Tri-State University and is a Certified Public Accountant.
Robert R. Argüelles, Senior Vice President, Operational Excellence and Quality, joined KEMET as such in September 2008. Mr. Argüelles previously served as Vice President and Plant Manager with Continental Automotive Systems, which followed his role as a top research and development executive in Continental's North American Chassis & Safety division. Prior to Continental Automotive,
22
Mr. Argüelles worked at Valeo Electronics/ITT Automotive where he was the Product Line Director for Valeo's North American Sensors and Electronics product lines. Mr. Argüelles began his career serving in technical roles at Electronic Data Systems in the Delco Chassis Division. He received a Bachelor of Science degree in Mechanical Engineering, Dynamics and Controls, from Old Dominion University in Norfolk, Virginia.
Conrado Hinojosa, Senior Vice President, Tantalum Business Group, was named such in October 2007. He joined KEMET in 1999 in the position of Plant Manager of the Monterrey 3 plant in Mexico. Mr. Hinojosa later served as the Operations Director for the Tantalum Division in Matamoros, Mexico and was later named Vice President, Tantalum Business Group in June 2005. Prior to joining KEMET, Mr. Hinojosa held numerous manufacturing positions with IBM de Mexico and had previous experience with Kodak. Mr. Hinojosa received a Masters of Business Administration degree from Instituto Technologico de Estudios Superiores de Monterrey and a Bachelor of Science degree in Mechanical Engineering from Universidad Autonoma de Guadalajara.
Marc Kotelon, Senior Vice President—Global Sales, was named such in August 2008. He joined KEMET in 1994 and has held various positions of increased responsibility in the sales area prior to the appointment to his current position. Mr. Kotelon received a Bachelor of Science degree in Electronics from Ecole Centrale d'Electronique/Paris.
Charles C. Meeks, Jr., Senior Vice President, Ceramic, Film & Electrolytics Business Group, was named such in March 2010. He joined Union Carbide/KEMET in 1983 in the position of Process Engineer, and has held various positions of increased responsibility including the positions of Plant Manager and Director of Operations, Ceramic Business Group. He was named Vice President, Ceramic Business Group in June 2005 and Senior Vice President, Ceramic Business Group in October 2007. Mr. Meeks received a Masters of Business Administration degree and a Bachelor of Science degree in Ceramic Engineering from Clemson University.
Susan B. Barkal, Vice President of Quality and Chief Compliance Officer, was named such in December 2008. Ms. Barkal joined KEMET in November 1999, and has served as Quality Manager for Tantalum Business Group, Technical Product Manager for all Tantalum product lines and Director of Tantalum Product Management. Ms. Barkal holds a Bachelor of Science degree in Chemical Engineering from Clarkson University and a Master of Science degree in Mechanical Engineering from California Polytechnic University.
Daniel E. LaMorte, Vice President and Chief Information Officer, joined KEMET as such in May 2004. Prior to joining KEMET, Mr. LaMorte held numerous Information Technology positions with Keycorp, Elf Acquitaine, Fisher Scientific and U.S. Steel Corp. Mr. LaMorte had previously served as Vice President of Worldwide Marketing and Sales for Chemcut, a manufacturer of capital equipment and chemicals in the electronics industry. Prior to Keycorp, Mr. LaMorte served as Chief Information Officer at Submit Order, an E-commerce start-up in Columbus, Ohio. Mr. LaMorte holds a Bachelor of Science degree from the University of Pittsburgh and a Master of Business Administration from Fairleigh Dickinson University.
Dr. Philip M. Lessner, Vice President, Chief Technology Officer and Chief Scientist, joined KEMET in 1996 as a Technical Associate in the Tantalum Technology Group. He has held several positions of increased responsibility in the Technology and Product Management areas including Senior Technical Associate, Director Tantalum Technology, Director Technical Marketing Services, and Vice President Tantalum Technology prior to his appointment to his current position. Mr. Lessner received a PhD in Chemical Engineering from the University of California, Berkeley and a Bachelor of Engineering in Chemical Engineering from Cooper Union.
Larry C. McAdams, Vice President, Human Resources, joined Union Carbide/KEMET in 1983. He previously served as the site Human Resources Manager at the Columbus, GA; Shelby, NC; and
23
Fountain Inn, SC, plants. Since 1991, he has been assigned to the corporate HR staff, where he was appointed a Director in 1999, Senior Director in 2002, and Vice President in 2003. Mr. McAdams received a Bachelor of Arts in Political Science from Clemson University and attended the University of South Carolina School of Law.
Dr. Daniel F. Persico, Vice President, Strategic Marketing and Business Development, joined KEMET in November 1997, and served as Director of Tantalum Technology, Vice President of Tantalum Technology, and Vice President of Organic Process Technology. Prior to his return to KEMET in December 2006, he held the position of the Executive Vice President and Chief Technology Officer of H.W. Sands Corporation, a manufacturer and distributor of specialty chemicals. Dr. Persico holds a Ph.D. in Chemistry from the University of Texas and a Bachelor of Science degree in Chemistry from Boston College.
Other Key Employees
R. James Assaf, Vice President, General Counsel and Secretary, was named such in July 2008. Mr. Assaf joined KEMET as Vice President, General Counsel in March 2008. Prior to joining KEMET, Mr. Assaf served as General Manager for InkSure Inc., a start-up seller of product authentication solutions. He had also previously held several positions with Sensormatic Electronics Corporation, including Associate General Counsel and Director of Business Development, Mergers & Acquisitions. Prior to Sensormatic, Mr. Assaf served as an Associate Attorney with the international law firm Squire Sanders & Dempsey. Mr. Assaf received his Bachelor of Arts degree from Kenyon College and his Juris Doctor degree from Case Western Reserve University School of Law.
Michael W. Boone, Vice President and Treasurer, was named such in July 2008. Mr. Boone joined KEMET in June 1987 as Manager of Credit and Cash Management and has previously held the positions of Senior Director of Finance and Corporate Secretary before his appointment to his current position. Mr. Boone holds a Bachelor of Business Administration degree in Banking and Finance from the University of Georgia.
David S. Knox, Vice President and Corporate Controller, joined KEMET as such in February 2008. From November 1999 through February 2008, Mr. Knox held various financial positions at Unifi, Inc. and was the Corporate Controller from August 2002 through February 2008. Mr. Knox received a Bachelor of Science degree in Business Administration from the University of North Carolina at Chapel Hill and is a Certified Public Accountant.
24
ITEM 5. MARKET FOR THE REGISTRANT'S COMMON EQUITY AND RELATED STOCKHOLDER MATTERS AND ISSUER PURCHASES OF EQUITY SECURITIES.
In February 2009, our common stock began trading on the OTC Bulletin Board. Our trading symbol on the OTC Bulletin Board is "KEME.OB".
We had 12,455 stockholders on May 10, 2010, of which 223 were stockholders of record. The following table represents the high and low sale prices of our common stock for the periods indicated:
| |
Fiscal Year 2010 | Fiscal Year 2009 | |||||||||||
|---|---|---|---|---|---|---|---|---|---|---|---|---|---|
Quarter
|
High | Low | High | Low | |||||||||
First |
$ | 0.84 | $ | 0.24 | $ | 4.63 | $ | 3.23 | |||||
Second |
1.60 | 0.45 | 3.29 | 0.97 | |||||||||
Third |
1.60 | 1.15 | 1.50 | 0.24 | |||||||||
Fourth |
1.74 | 1.24 | 0.46 | 0.08 | |||||||||
We have not declared or paid any cash dividends on our common stock since our initial public offering in October 1992. We do not anticipate paying dividends in the foreseeable future. Any future determination to pay dividends will be at the discretion of our Board and will depend upon, among other factors, the capital requirements, operating results, and our financial condition. See "Management's Discussion and Analysis of Financial Condition and Results of Operations—Liquidity and Capital Resources."
In fiscal year 2008, we reactivated our share buyback program and repurchased 3.7 million shares of our common stock. In fiscal year 2009, we indefinitely suspended the share buyback program and did not repurchase any shares of our common stock.
25
The following graph compares our cumulative total stockholder return for the past five fiscal years, beginning on April 1, 2005, with the Russell Microcap Index and a peer group (the "Peer Group") comprised of certain companies which manufacture capacitors and with which we generally compete. The Peer Group is comprised of AVX Corporation, Thomas & Betts Corp. and Vishay Intertechnology, Inc.
COMPARISON OF 5 YEAR CUMULATIVE TOTAL RETURN*
Among KEMET Corporation, the Russell Microcap Index
and a Peer Group
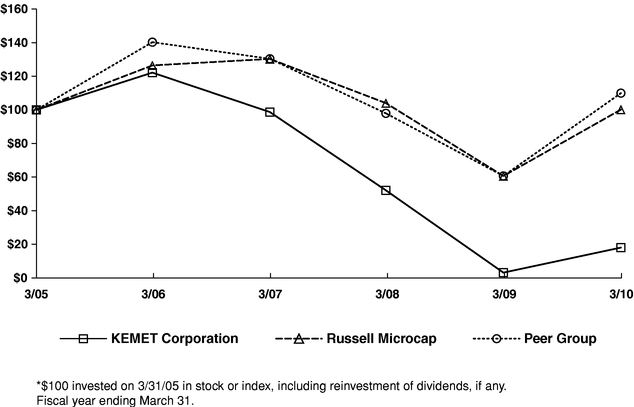
| |
3/05 | 3/06 | 3/07 | 3/08 | 3/09 | 3/10 | |||||||||||||
|---|---|---|---|---|---|---|---|---|---|---|---|---|---|---|---|---|---|---|---|
KEMET Corporation |
100.00 | 122.19 | 98.71 | 52.13 | 3.16 | 18.06 | |||||||||||||
Russell Microcap |
100.00 | 126.47 | 130.33 | 104.05 | 60.66 | 100.18 | |||||||||||||
Peer Group |
100.00 | 140.30 | 130.42 | 97.95 | 60.68 | 109.98 | |||||||||||||
26
Equity Compensation Plan Disclosure
The following table summarizes equity compensation plans approved by stockholders and equity compensation plans that were not approved by stockholders as of March 31, 2010:
| |
(a) | (b) | (c) | |||||||
|---|---|---|---|---|---|---|---|---|---|---|
Plan category
|
Number of securities to be issued upon exercise of outstanding options, warrants, and rights |
Weighted-average exercise price of outstanding options, warrants, and rights |
Number of securities remaining available for future issuance under equity compensation plans (excluding securities reflected in column (a)) |
|||||||
Equity compensation plans approved by stockholders |
4,889,875 | $ | 5.49 | 6,346,085 | ||||||
Equity compensation plans not approved by stockholders |
— | — | — | |||||||
|
4,889,875 | $ | 5.49 | 6,346,085 | ||||||
ITEM 6. SELECTED FINANCIAL DATA.
The following table summarizes our selected historical consolidated financial information for each of the last five years. The selected financial information under the captions "Income Statement Data," "Per Share Data," "Balance Sheet Data," and "Other Data" shown below has been derived from our audited consolidated financial statements. This selected financial information reflects the retrospective application of an accounting standard related to the accounting for convertible debt instruments that may be settled in cash upon conversion (including partial cash settlement), which required retrospective application. These adjustments and the retrospective application of this accounting standard are reflected in our audited consolidated financial statements as of March 31, 2008 and 2009 and for the years ended March 31, 2007, 2008 and 2009, which were filed in Exhibit 99.1 to our Current Report on Form 8-K, filed with the SEC on November 5, 2009. This table should be read in conjunction with other consolidated financial information of KEMET, including "Management's Discussion and Analysis of Financial Condition and Results of Operations" and the consolidated financial statements, included
27
elsewhere herein. The data set forth below may not be indicative of our future financial condition or results of operations (see Item 1A, "Risk Factors") (amounts in thousands except per share amounts):
| |
Fiscal Years Ended March 31, | |||||||||||||||
|---|---|---|---|---|---|---|---|---|---|---|---|---|---|---|---|---|
| |
2010 | 2009 | 2008(3) | 2007(1) | 2006 | |||||||||||
Income Statement Data: |
||||||||||||||||
Net sales |
$ | 736,335 | $ | 804,385 | $ | 850,120 | $ | 658,714 | $ | 490,106 | ||||||
Operating income (loss) |
7,697 | (271,112 | ) | (8,881 | ) | 7,078 | (10,196 | ) | ||||||||
Interest income |
(188 | ) | (618 | ) | (6,061 | ) | (6,283 | ) | (5,640 | ) | ||||||
Interest expense |
26,008 | 29,789 | 21,696 | 9,865 | 6,628 | |||||||||||
Net income (loss)(7) |
(69,447 | ) | (285,209 | ) | (25,215 | ) | 4,206 | 375 | ||||||||
Per Share Data: |
||||||||||||||||
Net income (loss) per share—basic and diluted |
$ | (0.86 | ) | $ | (3.54 | ) | $ | (0.30 | ) | $ | 0.05 | $ | — | |||
Balance Sheet Data: |
||||||||||||||||
Total assets |
$ | 740,961 | $ | 714,151 | $ | 1,250,999 | $ | 942,373 | $ | 748,318 | ||||||
Working capital |
226,600 | 195,142 | 239,059 | 337,943 | 269,339 | |||||||||||
Long-term debt(2)(4)(5)(6) |
231,629 | 280,752 | 269,354 | 195,931 | 80,000 | |||||||||||
Other non-current obligations |
55,626 | 57,316 | 80,130 | 19,587 | 44,139 | |||||||||||
Stockholders' equity(7) |
284,272 | 240,039 | 576,831 | 577,419 | 512,703 | |||||||||||
Other Data: |
||||||||||||||||
Cash flow provided by (used in) operating activities |
$ | 54,620 | $ | 5,725 | $ | (20,563 | ) | $ | 21,933 | $ | 40,423 | |||||
Capital expenditures |
12,921 | 30,541 | 43,605 | 28,670 | 22,846 | |||||||||||
Research and development |
22,064 | 28,956 | 35,699 | 33,385 | 25,976 | |||||||||||
- (1)
- In
fiscal year 2007, the Company acquired the EPCOS tantalum business unit.
- (2)
- In
fiscal year 2007, the Company issued $175.0 million in Convertible Notes.
- (3)
- In
fiscal year 2008, the Company acquired Evox Rifa on April 24, 2007 and Arcotronics on October 12, 2007.
- (4)
- In
fiscal year 2008, the Company entered into two Senior Facility Agreements with UniCredit whereby it borrowed a total of
€96.8 million.
- (5)
- In
fiscal year 2009, the Company paid the outstanding balance on its Senior Notes and refinanced Facility A with UniCredit totaling
€60.0 million ($79.8 million). On April 3, 2009, the Company extended Facility B with UniCredit totaling €35.0 million
($46.6 million). The scheduled amortization of our Facility A was amended effective June 30, 2009.
- (6)
- In
fiscal year 2010, the Company repurchased $93.9 million in face value of Convertible Notes and incurred additional borrowings of
$57.8 million with Platinum.
- (7)
- In fiscal year 2010, the Closing Warrant was initially classified as a derivative and the Company recorded a mark-to-market adjustment of $81.1 million through earnings. As of September 29, 2009, the strike price of the Closing Warrant became fixed and the Company reevaluated the Closing Warrant concluding that the Closing Warrant is indexed to the Company's own stock and should be classified as a component of equity. The Company reclassified the warrant liability of $112.5 million into the line item "Additional paid-in capital" on the Consolidated Balance Sheets and the Closing Warrant is no longer marked-to-market.
28
ITEM 7. MANAGEMENT'S DISCUSSION AND ANALYSIS OF FINANCIAL CONDITION AND RESULTS OF OPERATIONS.
The following discussion and analysis provides information that we believe is useful in understanding our operating results, cash flows, and financial condition for the three fiscal years ended March 31, 2010. The discussion should be read in conjunction with, and is qualified in its entirety by reference to, the consolidated financial statements and related notes appearing elsewhere in this report. Except for the historical information contained herein, the discussions in this document contain forward-looking statements within the meaning of the Private Securities Litigation Reform Act of 1995 and involve risks and uncertainties. Our actual future results could differ materially from those discussed here. Factors that could cause or contribute to such differences include, but are not limited to, those discussed under the Item 1A, "Risk Factors" and, from time to time, in our other filings with the Securities and Exchange Commission.
Business Overview
We are a leading global manufacturer of a wide variety of capacitors. Our product offerings include tantalum, multilayer ceramic, solid and electrolytic aluminum and film and paper capacitors. Capacitors are fundamental components of most electronic circuits and are found in communication systems, data processing equipment, personal computers, cellular phones, automotive electronic systems, defense and aerospace systems, consumer electronics, power management systems and many other electronic devices and systems. Capacitors are typically used to filter out interference, smooth the output of power supplies, block the flow of direct current while allowing alternating current to pass and for many other purposes. We manufacture a broad line of capacitors in many different sizes and configurations using a variety of raw materials. Our product line consists of over 250,000 distinct part configurations distinguished by various attributes, such as dielectric (or insulating) material, configuration, encapsulation, capacitance level and tolerance, performance characteristics and packaging. Most of our customers have multiple capacitance requirements, often within each of their products. Our broad offering allows us to meet the majority of those needs independent of application and end use. In fiscal year 2010, we shipped approximately 31 billion capacitors and in fiscal year 2009, we shipped approximately 32 billion capacitors. We believe the medium-to-long term demand for the various types of capacitors offered by us will grow on a regional and global basis due to a variety of factors, including increasing demand for and complexity of electronic products, growing demand for technology in emerging markets and the ongoing development of new solutions for energy generation and conservation.
Our Competitive Strengths
We believe our Company benefits from the following competitive strengths:
Strong Customer Relationships. We have a large and diverse customer base. We believe that our persistent emphasis on quality control and history of performance establishes loyalty with OEMs, EMSs and distributors. Our customer base includes nearly all of the world's major electronics OEMs (including Alcatel-Lucent, Apple, Dell, Hewlett Packard, IBM, Intel, Motorola and Nokia) and EMSs (including Celestica, Elcoteq, Flextronics, Jabil, Sanmina and Solectron). Our strong, extensive and efficient worldwide distribution network is one of our differentiating factors.
Breadth of Our Diversified Product Offering and Markets. We believe that we have the most complete line of primary capacitor types, across a full spectrum of dielectric materials including tantalum, ceramic, solid and electrolytic aluminum, film and paper. As a result, we believe we can satisfy virtually all of our customers' capacitance needs, thereby strengthening our position as their supplier of choice. We sell our products into a wide range of different end markets, including computing, industrial, telecommunications, transportation, consumer, defense and healthcare markets
29
across all geographic regions. No single end market segment accounted for more than 30% and only one customer, TTI, Inc. accounted for more than 10% of our net sales in fiscal year 2010. Our largest customer is a distributor, and no single end use customer accounted for more than 5% of our net sales in fiscal year 2010. We believe that well-balanced product, geographic and customer diversification help us mitigate some of the negative financial impact through economic cycles.
Leading Market Positions and Operating Scale. Based on net sales, we believe that we are the largest manufacturer of tantalum capacitors in the world and one of the largest manufacturers of film capacitors in the world and have a significant market position in the specialty ceramics and custom wet aluminum electrolytic markets. We believe the demand for our products is growing and we are well-positioned to take advantage of that trend due to our strengths and the diversity of our product offerings.
Strong Presence in Specialty Products. We engage in design collaboration with our customers in order to meet their specific needs and provide them with customized products satisfying their engineering specifications. During fiscal year 2010, specialty products accounted for 29.6% of our revenue. By allocating an increasing portion of our management resources and research and development investment to specialty products, we have established ourselves as one of the leading innovators in this fast growing emerging segment of the market, which includes aerospace and defense, healthcare, renewable energy, telecom infrastructure and gas and oil. For example, in August 2009, we were selected as one of thirty companies to receive a grant from the Department of Energy. Our $15.1 million award will enable us to produce film and electrolytic capacitors within the United States to support alternative energy products and emerging green technologies such as hybrid electric drive vehicles. Producing these parts in the United States will allow us to compete effectively in the alternative energy market in the Americas. We believe our ability to provide innovative and flexible service offerings, superior customer support and focus on speed-to-market result in a more rewarding customer experience, earning us a high degree of customer loyalty.
Low-Cost Production. We believe we have some of the lowest cost production facilities in the industry. Many of our key customers have relocated their production facilities to Asia, particularly China, and we have a growing list of customers that are based in Asia. We believe our manufacturing facilities in China have low production costs and close proximity to the large and growing Chinese market as well as the ability to increase capacity and change our product mix to meet our customers' needs. We also believe our operations in Mexico, which are our primary production facilities supporting our North American and, to a large extent, European customers, are among the most cost efficient in the world.
Our Brand. Founded by Union Carbide in 1919 as KEMET Laboratories, we believe that KEMET has a reputation as a high quality, efficient and affordable partner that sets our customers' needs as the top priority. This has allowed us to successfully attract loyal clientele and enabled us to expand our operations and market share over the past few years. We believe our commitment to the needs of the industry in which we operate has differentiated us among other competitors and established us as the "Easy-To-Buy-From" company.
Our People. We believe that we have successfully developed a unique corporate culture based on innovation, customer focus and commitment. We have a strong, highly experienced and committed team in each of our markets. Many of our professionals have developed unparalleled experience in building leadership positions in new markets, as well as successfully integrating acquisitions. Combined, our 15 member management team has an average of over 11 years of experience with us and an average of over 25 years of experience in the manufacturing industry and has grown our revenue to $736.3 million in fiscal year 2010 from $425.3 million in fiscal year 2005, representing a compound annual growth rate of 11.6%.
30
Business Strategy
Our strategy is to use our position as a leading, high-quality manufacturer of capacitors to capitalize on the increasingly demanding requirements of our customers. Key elements of our strategy include to:
Develop Our Significant Customer Relationships and Industry Presence. We intend to continue to be responsive to our customers' needs and requirements and to make order entry and fulfillment easier, faster, more flexible and more reliable for our customers by focusing on building products around customers' needs, giving decision making authority to customer-facing personnel and providing purpose-built systems and processes, such as our Easy-To-Buy-From order entry system.
Continue to Pursue Low-Cost Production Strategy. We intend to actively pursue measures that will allow us to maintain our position as a low-cost producer of capacitors with facilities close to our customers. These measures include shifting production to low cost locations; reducing material and labor costs; developing more cost-efficient manufacturing equipment and processes; designing manufacturing plants for more efficient production; and reducing work-in-process ("WIP") inventory by building products from start to finish in one factory. Additionally, we intend to continue to implement Lean and Six Sigma methods to drive towards zero product defects so that quality remains a given in the minds of our customers. Between August 2008 and January 2009, we implemented rationalization plans which have resulted in an annual savings of approximately $45 million. In addition, we have implemented numerous cost reduction initiatives and process improvements which we believe will result in meaningful savings from (i) the successful renegotiation of unfavorable sourcing contracts; (ii) relocation of tantalum manufacturing to Mexico and Suzhou, China; and (iii) the integration of Evox Rifa and Arcotronics.
Leverage Our Technological Competence and Expand Our Leadership in Specialty Products. We continue to leverage our technological competence to introduce new products in a timely and cost efficient manner and generate an increasing portion of our sales from new and customized solutions to improve financial performance as well as to meet our customers' varied and evolving capacitor needs. We believe that by continuing to build on our strength in the higher growth and higher margin specialty segments of the capacitor market, we will be well positioned to achieve our long-term growth targets while also improving our profitability. During fiscal year 2010, we introduced 32,172 new products of which 249 were first to market, and specialty products accounted for 29.6% of our revenue over this period. In the fourth quarter of fiscal year 2010, Ceramic launched two product platforms, the "High Temperature Surface Mount Devices" and "DSCC Small Case Size MLCC", which contributed approximately 28,000 of the new products introduced in fiscal year 2010.
Further Expand Our Broad Capacitance Capabilities. We define ourselves as "The Capacitance Company" and strive to be the supplier of choice for all our customers' capacitance needs across the full spectrum of dielectric materials including tantalum, ceramic, solid and electrolytic aluminum, film and paper. While we believe we have the most complete line of capacitor technologies across these primary capacitor types, we intend to continue to research additional capacitance technologies and solutions in order to maximize the breadth of our product offerings.
Selectively Target Complementary Acquisitions. We expect to continue to evaluate and pursue strategic acquisition opportunities, some of which may be significant in size, which would enable us to enhance our competitive position and expand our market presence. Our strategy is to acquire complementary capacitor and other related businesses that would allow us to leverage our business model, including those involved in other passive components that are synergistic with our customers' technologies and current product offerings.
31
Promote the KEMET Brand Globally. We are focused on promoting the KEMET brand globally by highlighting the high quality and high reliability of our products and our superior customer service. We will continue to market our products to new and existing customers around the world in order to expand our business. We continue to be recognized by our customers as a leading global supplier. For example, in November 2009, we received the "Outstanding Performance Award" for quality and delivery from Sanmina, a leading EMS provider.
Global Sales & Marketing Strategy. Our motto "Think Global Act Local" describes our approach to sales and marketing. Each of our three sales regions (Americas, EMEA and APAC) has account managers, field application engineers and strategic marketing managers in the region. In addition, we also have local customer and quality-control support in each region. This organizational structure allows us to respond to the needs of our customers on a timely basis and in their native language. The regions are managed locally and report to a senior manager who is on the KEMET Leadership Team. Furthermore, this organizational structure ensures the efficient communication of our global goals and strategies and allows us to serve the language, cultural and other region-specific needs of our customers.
We manufacture capacitors in Bulgaria, China, Finland, Germany, Indonesia, Italy, Mexico, Portugal, Sweden, the United Kingdom, and the United States. Commodity manufacturing in the United States has been substantially relocated to our lower-cost manufacturing facilities in Mexico and China. Production that remains in the United States focuses primarily on early-stage manufacturing of new products and other specialty products for which customers are predominantly located in North America.
The market for all of our capacitors is highly competitive. The capacitor industry is characterized by, among other factors, a long-term trend toward lower prices for capacitors, low transportation costs, and few import barriers. Competitive factors that influence the market for our products include product quality, customer service, technical innovation, pricing and timely delivery. It is our belief that we compete favorably on the basis of each of these factors.
KEMET is organized into three distinct business groups: Tantalum, Ceramic, and Film and Electrolytic. Each business group is responsible for the operations of certain manufacturing sites as well as all related research and development efforts. The sales and marketing functions are shared by each of the business groups and the costs of which are allocated to the business groups. In addition, all corporate costs are allocated to the business groups. See Note 8, "Segment and Geographic Information" to our consolidated financial statements.
We believe our Mexican operations are among the most cost efficient in the world, and they continue to be our primary production facilities supporting North America and, to a large extent, European customers. We also believe that our China manufacturing facilities benefit from low production costs and proximity to large and growing markets, which have caused some of our key customers to relocate production facilities to Asia, particularly China. As a result, one of our strategies is to continue to shift production to low-cost locations which provide us the best opportunity to be a low-cost producer of capacitors.
Net sales for the quarter ended March 31, 2010 were $213.0 million, which is a 56.6% increase over the same quarter last fiscal year and a 6.5% increase over the prior fiscal quarter ended December 31, 2009. Net income was $0.3 million, or $0.00 per share for the fourth quarter of fiscal year 2010 compared to net income of $2.4 million or $0.03 per share for the same quarter last year and compared to net loss of $1.8 million or $(0.02) per share for the prior fiscal quarter ended December 31, 2009.
On April 8, 2010, we reported that we reached an agreement with three labor unions in Italy and with the regional government in Emilia Romagna, Italy to proceed with our planned restructuring
32
process. The Company intends to focus on producing specialty products in Europe and the U.S. and shift standard and commodity production to lower cost regions.
In December 2009, in an effort consistent with our cost reduction measures, we plan to relocate our Amsterdam Hub facility from the Netherlands to the Czech Republic, effective July 2010. We expect this relocation to allow shipping lane optimization and customer consolidation (bi-weekly or weekly) for all import shipments. Our European manufacturing plants will continue to ship direct to 'local' customers (i.e. customers located in the same country as the plant).
On May 5, 2010, we completed a private placement of $230.0 million in aggregate principal amount of our 10.5% Senior Notes due 2018 to several Initial Purchasers represented by Banc of America Securities LLC pursuant to an exemption from the registration requirements under the Securities Act of 1933, as amended (the "Securities Act"). The Initial Purchasers subsequently sold the 10.5% Senior Notes to qualified institutional buyers pursuant to Rule 144A under the Securities Act and to persons outside of the United States pursuant to Regulation S under the Securities Act.
The private placement of the 10.5% Senior Notes resulted in proceeds to the Company of $222.2 million. We used a portion of the proceeds of the private placement to repay all of its outstanding indebtedness under our credit facility with K Financing, LLC. Our €60 million credit facility and €35 million credit facility with UniCredit and our term loan with Vishay and we used a portion of the remaining proceeds to fund a previously announced tender offer to purchase $40.5 million in aggregate principal amount of our Convertible Notes and to pay costs incurred in connection with the private placement, the tender offer and the foregoing repayments. We incurred approximately $6.4 million in costs related to the execution of the offering, and these costs are capitalized and will be amortized over the term of the 10.5% Senior Notes.
The 10.5% Senior Notes were issued pursuant to a 10.5% Senior Notes Indenture, dated as of May 5, 2010, by and among the Company, the Company's Guarantors and Wilmington Trust Company, as trustee (the "Trustee"). The 10.5% Senior Notes will mature on May 1, 2018, and bear interest at a stated rate of 10.5% per annum, payable semi-annually in cash in arrears on May 1 and November 1 of each year, beginning on November 1, 2010. The 10.5% Senior Notes are our senior obligations and will be guaranteed by each of the Guarantors and secured by a first priority lien on 51% of our capital stock of certain of our foreign restricted subsidiaries.
The terms of the 10.5% Senior Notes Indenture will, among other things, limit our ability and the ability of our restricted subsidiaries to (i) incur additional indebtedness or issue certain preferred stock; (ii) pay dividends on, or make distributions in respect of, our capital stock or repurchase our capital stock; (iii) make certain investments or other restricted payments; (iv) sell certain assets; (v) create liens or use assets as security in other transactions; (vi) enter into sale and leaseback transactions; (vii) merge, consolidate or transfer or dispose of substantially all assets; (viii) engage in certain transactions with affiliates; and (ix) designate subsidiaries as unrestricted subsidiaries. These covenants are subject to a number of important limitations and exceptions that are described in the 10.5% Senior Notes Indenture.
The 10.5% Senior Notes will be redeemable, in whole or in part, on any time on or after May 1, 2014, at the redemption prices specified in the 10.5% Senior Notes Indenture. At any time prior to May 1, 2013, we may redeem up to 35% of the aggregate principal amount of the 10.5% Senior Notes with the net cash proceeds from certain equity offerings at a redemption price equal to 110.5% of the principal amount thereof, together with accrued and unpaid interest, if any, to the redemption date. In addition, at any time prior to May 1, 2014, we may redeem the 10.5% Senior Notes, in whole or in part, at a redemption price equal to 100% of the principal amount of the 10.5% Senior Notes so redeemed, plus a "make whole" premium and together with accrued and unpaid interest, if any, to the redemption date.
33
Upon the occurrence of a change of control triggering event specified in the 10.5% Senior Notes Indenture, we must offer to purchase the 10.5% Senior Notes at a redemption price equal to 101% of the principal amount thereof, plus accrued and unpaid interest, if any, to the date of purchase.
The 10.5% Senior Notes Indenture provides for customary events of default (subject in certain cases to customary grace and cure periods), which include nonpayment, breach of covenants in the 10.5% Senior Notes Indenture, payment defaults or acceleration of other indebtedness, a failure to pay certain judgments and certain events of bankruptcy and insolvency. The 10.5% Senior Notes Indenture also provides for events of default with respect to the collateral, which include default in the performance of (or repudiation, disaffirmation or judgment of unenforceability or assertion of unenforceability) by us or a Guarantor with respect to the provision of security documents under the 10.5% Senior Notes Indenture. These events of default are subject to a number of important qualifications, limitations and exceptions that are described in the 10.5% Senior Notes Indenture. Generally, if an event of default occurs, the Trustee or holders of at least 25% in principal amount of the then outstanding 10.5% Senior Notes may declare the principal of and accrued but unpaid interest, including additional interest, on all the 10.5% Senior Notes to be due and payable.
On May 17, 2010, we consummated a tender offer to purchase $40.5 million in aggregate principal amount of our Convertible Notes. We used $37.9 million from the bond offering discussed above to extinguish the tendered notes. We incurred approximately $0.2 million in costs related to the execution of this tender offer, these costs will be included in the loss on extinguishment.
Registration Rights Agreement
On May 5, 2010, in connection with the private placement of the 10.5% Senior Notes, the Company, the Guarantors and the initial purchasers of the 10.5% Senior Notes entered into the Registration Rights Agreement. The terms of the Registration Rights Agreement require the Company and the Guarantors to (i) use their commercially reasonable efforts to file with the Securities and Exchange Commission within 210 days after the date of the initial issuance of the 10.5% Senior Notes, a registration statement with respect to an offer to exchange the 10.5% Senior Notes for a new issue of debt securities registered under the Securities Act, with terms substantially identical to those of the 10.5% Senior Notes (except for provisions relating to the transfer restrictions and payment of additional interest); (ii) use our commercially reasonable efforts to consummate such exchange offer within 270 days after the date of the initial issuance of the 10.5% Senior Notes; and (iii) in certain circumstances, file a shelf registration statement for the resale of the 10.5% Senior Notes. If the Company and the Guarantors fail to satisfy our registration obligations under the Registration Rights Agreement, then we will be required to pay additional interest to the holders of the 10.5% Senior Notes, up to a maximum additional interest rate of 1.0% per annum.
The foregoing description of the 10.5% Senior Notes Indenture and the Registration Rights Agreement does not purport to be complete and is qualified in its entirety by reference to the full text of the 10.5% Senior Notes Indenture and Registration Rights Agreement.
Acquisitions
Arcotronics Italia S.p.A.
On October 12, 2007, pursuant to the terms of a Stock Purchase Agreement between KEMET Electronics Corporation, our wholly-owned subsidiary, and Blue Skye (Lux) S.a r.l. ("Blue Skye"), we acquired 100% of Arcotronics Italia S.p.A. ("Arcotronics") from Blue Skye. The acquisition included manufacturing facilities in Sasso Marconi, Monghidoro, and Vergato, Italy; Landsberg, Germany; Towcester, United Kingdom; Kyustendil, Bulgaria; and Anting-Shanghai, China, and is included in Film and Electrolytic.
34
We paid €17.5 million ($24.8 million) for 100% of the outstanding share capital of Arcotronics, assumed net financial debt of €98.0 million ($138.9 million) and certain other long-term liabilities of Arcotronics totaling €35.1 million ($49.8 million).
In connection with the acquisition, we entered into a Senior Facility Agreement with UniCredit whereby UniCredit agreed to lend to us up to €47.0 million ($66.8 million). We used a portion of this facility to repay a portion of the outstanding indebtedness of Arcotronics, with the balance available for general corporate purposes. In May 2010, this debt was extinguished, see Note 18, "Subsequent Events" for further discussion.
Evox Rifa Group Oyj
On April 24, 2007, pursuant to the terms of a Combination Agreement between KEMET Electronics Corporation and Evox Rifa Group Oyj ("Evox Rifa"), we purchased 92.7% of Evox Rifa pursuant to a tender offer completed on April 12, 2007. Evox Rifa had 178.2 million shares outstanding at the time of the commencement of the tender offer. We purchased 165.2 million shares at a price of €0.12 per share or €19.8 million ($27.0 million). We announced at the time that we intended to acquire the remaining outstanding shares pursuant to a squeeze-out process. Following the settlement of the completion trades relating to the tender offer, Evox Rifa became our subsidiary. In September 2007, we completed the squeeze-out process and purchased the remaining outstanding shares of Evox Rifa for €1.8 million ($2.4 million). This additional amount is considered part of the purchase price of the acquisition. This acquisition is also included in Film and Electrolytic.
In addition, pursuant to the tender offer, we offered to acquire all of the outstanding loan notes under the convertible capital loan issued by Evox Rifa for consideration corresponding to the aggregate of the nominal amount per loan note of €100 plus accrued interest up to and including the closing date of the tender offer. The outstanding amount of the loan notes and accrued interest at the time of the commencement of the tender offer was €5.9 million ($8.1 million). Holders of 95.7% of the convertible capital loan notes issued by Evox Rifa tendered their loan notes pursuant to the tender offer and consequently, we redeemed these notes as of April 24, 2007. In addition to the payment made for the shares and loan notes, we assumed €19.5 million ($26.6 million) in outstanding indebtedness of Evox Rifa.
Off-Balance Sheet Arrangements
Other than operating lease commitments, we are not a party to any material off-balance sheet financing arrangements that have, or are reasonably likely to have, a current or future material effect on our financial condition, revenues, expenses, results of operations, liquidity, capital expenditures or capital resources.
Critical Accounting Policies
Our accounting policies are summarized in Note 1, "Organization and Significant Accounting Policies" to the consolidated financial statements. The following identifies a number of policies which require significant judgments and estimates, or are otherwise deemed critical to our financial statements.
Our estimates and assumptions are based on historical data and other assumptions that we believe are reasonable. These estimates and assumptions affect the reported amounts of assets and liabilities and the disclosure of contingent assets and liabilities at the date of the financial statements. In addition, they affect the reported amounts of revenues and expenses during the reporting period.
Our judgments are based on our assessment as to the effect certain estimates, assumptions, or future trends or events may have on the financial condition and results of operations reported in the
35
consolidated financial statements. Readers should understand that actual future results could differ from these estimates, assumptions, and judgments.
A quantitative sensitivity analysis is provided where that information is reasonably available, can be reliably estimated and provides material information to investors. The amounts used to assess sensitivity (i.e., 1% , 10%, etc.) are included to allow readers of this Annual Report on Form 10-K to understand a general cause and effect of changes in the estimates and do not represent our predictions of variability. For all of these estimates, it should be noted that future events rarely develop exactly as forecast, and estimates require regular review and adjustment. We believe the following critical accounting policies contain the most significant judgments and estimates used in the preparation of the consolidated financial statements:
- •
- ASSET IMPAIRMENT—GOODWILL AND LONG-LIVED ASSETS. Goodwill, which represents the excess of purchase price over fair value of net assets acquired, and intangible assets with indefinite useful lives are no longer amortized but are tested for impairment at least on an annual. We perform our impairment test during the first quarter of each fiscal year and when otherwise warranted.
We are organized into three distinct business groups: Tantalum, Ceramic and Film and Electrolytic. We evaluate our goodwill on a reporting unit basis. This requires us to estimate the fair value of the reporting units based on the future net cash flows expected to be generated. The impairment test involves a comparison of the fair value of each reporting unit, with the corresponding carrying amounts. If the reporting unit's carrying amount exceeds its fair value, then an indication exists that the reporting unit's goodwill may be impaired. The impairment to be recognized is measured by the amount by which the carrying value of the reporting unit's goodwill being measured exceeds its implied fair value. The implied fair value of goodwill is the excess of the fair value of the reporting unit over the sum of the amounts assigned to identified net assets. As a result, the implied fair value of goodwill is generally the residual amount that results from subtracting the value of net assets including all tangible assets and identified intangible assets from the fair value of the reporting unit's fair value. We determined the fair value of our reporting units using an income-based, discounted cash flow ("DCF") analysis, and market-based approaches (Guideline Publicly Traded Company Method and Guideline Transaction Method) which examine transactions in the marketplace involving the sale of the stocks of similar publicly-owned companies, or the sale of entire companies engaged in operations similar to KEMET. In addition to the above described reporting unit valuation techniques, our goodwill impairment assessment also considers our aggregate fair value based upon the value of our outstanding shares of common stock.
Long-lived assets and intangible assets subject to amortization are reviewed for impairment whenever events or changes in circumstances indicate that the carrying amount of a long-lived asset or group of assets may not be recoverable. A long-lived asset classified as held for sale is initially measured and reported at the lower of its carrying amount or fair value less cost to sell. Long-lived assets to be disposed of other than by sale are classified as held and used until the long-lived asset is disposed of.
Tests for the recoverability of a long-lived asset to be held and used are performed by comparing the carrying amount of the long-lived asset to the sum of the estimated future undiscounted cash flows expected to be generated by the asset. In estimating the future undiscounted cash flows, we use future projections of cash flows directly associated with, and which are expected to arise as a direct result of, the use and eventual disposition of the assets. These assumptions include, among other estimates, periods of operation and projections of sales and cost of sales. Changes in any of these estimates could have a material effect on the estimated future undiscounted cash flows expected to be generated by the asset. If it is determined that the book value of a
36
- •
- REVENUE RECOGNITION. We recognize revenue only when all of the following criteria are met: (1) persuasive evidence of an arrangement exists, (2) delivery has occurred or services have been rendered, (3) the price to the buyer is fixed or determinable, and (4) collectibility is reasonably assured.
long-lived asset is not recoverable, an impairment loss would be calculated equal to the excess of the carrying amount of the long-lived asset over its fair value. The fair value is calculated as the discounted cash flows of the underlying assets. The Company reviewed its long-lived assets for recoverability during the fourth quarter of fiscal year 2010 and determined that the projected undiscounted cash flows were adequate to cover the carrying value of the assets. A 10% decline in the Company's forecasted cash flows would not have resulted in a failure of the undiscounted cash flow test.
We perform impairment tests on our goodwill and intangible assets with indefinite useful life during the first quarter of each fiscal year and when otherwise warranted. In the first quarter of fiscal year 2010, we completed our impairment test on our intangible assets with indefinite useful life and concluded that no further impairment existed. A one percent increase or decrease in the discount rate used in the valuation would have resulted in changes in the fair value of ($4.2) million and $5.2 million, respectively.
In the first quarter of fiscal year 2009, we hired an independent appraisal firm to test goodwill for impairment. We recorded a goodwill impairment charge of $88.6 million based on the annual impairment test, which represented all of the Ceramic goodwill balance and $76.2 million of the Film and Electrolytic goodwill balance. Also occurring in the first quarter of fiscal year 2009, and in part as a result of the goodwill impairment testing, we hired an independent appraisal firm to test the long-lived assets of Ceramic for impairment. As a result of this testing, Ceramic recorded a $5.3 million impairment charge to write off all of its other intangible assets and recorded a $58.6 million impairment charge to write down long-lived assets. We hired an independent appraisal firm to test goodwill and our long-lived assets groups for impairment as of September 30, 2008. These impairment tests resulted in a second quarter goodwill impairment charge of $85.7 million to write off all of the remaining goodwill of Film and Electrolytic and Tantalum. Utilizing an independent appraisal firm, we also completed long-lived asset impairment tests in the third and fourth quarters of fiscal year 2009 and concluded that no further impairment existed. The goodwill impairment and long-lived asset charge to earnings were non-cash in nature.
The goodwill and long-lived asset impairment reviews are highly subjective and involve the use of significant estimates and assumptions in order to calculate the impairment charges. Estimates of business enterprise fair value use discounted cash flow and other fair value appraisal models and involve making assumptions for future sales trends, market conditions, growth rates, cost reduction initiatives and cash flows for the next several years. Future changes in assumptions may negatively impact future valuations. In future tests for recoverability, adverse changes in undiscounted cash flow assumptions could result in an impairment of certain long-lived assets that would require a non-cash charge to the Consolidated Statements of Operations and may have a material effect on our financial condition and operating results
A portion of sales consists of products designed to meet customer specific requirements. These products typically have stricter tolerances making them useful to the specific customer requesting the product and to customers with similar or less stringent requirements. Products with customer specific requirements are tested and approved by the customer before we mass produce and ship the products. We recognize revenue at shipment as the sales terms for products produced with customer specific requirements do not contain a final customer acceptance provision or other provisions that are unique and would otherwise allow the customer different acceptance rights.
37
- •
- PENSION AND POST-RETIREMENT
BENEFITS. Our management, with the assistance of actuarial firms, perform actuarial valuations of the fair values of our pension and
post-retirement plans' benefit obligations. We make certain assumptions that have a significant effect on the calculated fair value of the obligations such as
the:
- •
- weighted-average discount rate—used to arrive at the net present value of the obligation;
- •
- salary increases—used to calculate the impact future pay increases will have on post-retirement
obligations; and
- •
- medical cost inflation—used to calculate the impact future medical costs will have on post-retirement obligations.
A portion of sales is made to distributors under agreements allowing certain rights of return and price protection on unsold merchandise held by distributors. Our distributor policy includes inventory price protection and "ship-from-stock and debit" ("SFSD") programs common in the industry. The price protection policy protects the value of the distributors' inventory in the event we reduce our published selling price to distributors. This program allows the distributor to debit us for the difference between our list price and the lower authorized price for specific parts. We establish price protection reserves on specific parts residing in distributors' inventories in the period that the price protection is formally authorized by KEMET.
The SFSD program provides a mechanism for the distributor to meet a competitive price after obtaining authorization from the local Company sales office. This program allows the distributor to ship its higher-priced inventory and debit us for the difference between our list price and the lower authorized price for that specific transaction. We established reserves for our SFSD program based primarily on historical SFSD activity and certain distributors' actual inventory levels comprising approximately 90% of the total global distributor inventory related to customers which participate in the SFSD program. Estimates are evaluated on a quarterly basis, if these estimates were changed by 1% in fiscal year 2010, Net sales would be impacted by $0.6 million.
The establishment of these reserves is recognized as a component of the line item "Net sales" on the Consolidated Statements of Operations, while the associated reserves are included in the line item "Accounts receivable" on the Consolidated Balance Sheets.
- •
- INCOME TAXES. Income taxes are accounted for under the asset and liability method. Deferred tax assets and liabilities are recognized for the future tax consequences attributable to differences between the financial statement carrying amounts of existing assets and liabilities and their respective tax bases and operating loss and tax credit carryforwards. Deferred tax assets and liabilities are measured using enacted tax rates. Valuation allowances are recognized to reduce deferred tax assets to the amount that is more likely than not to be realized.
We understand that these assumptions directly impact the actuarial valuation of the obligations recorded on the Consolidated Balance Sheets and the income or expense that flows through the Consolidated Statements of Operations.
We base our assumptions on either historical or market data that we considers reasonable. Variations in these assumptions could have a significant effect on the amounts reported in Consolidated Balance Sheets and the Consolidated Statements of Operations. The most critical assumption relates to the discount rate. A 25 basis point increase or decrease in the discount rate would result in changes to the projected benefit obligation of $(1.3) million and $1.5 million, respectively.
We believe that it is more likely than not that a portion of the deferred tax assets in various jurisdictions will not be realized, based on the scheduled reversal of deferred tax liabilities, the
38
- •
- INVENTORIES. Inventories are valued at the lower of cost or market, with cost determined under the first-in, first-out method and market based upon net realizable value. The valuation of inventories requires us to make estimates. We also must assess the prices at which it believes the finished goods inventory can be sold compared to its cost. A sharp decrease in demand could adversely impact earnings as the reserve estimates could increase.
recent history of cumulative losses, and the insufficient evidence of projected future taxable income to overcome the loss history. We have provided a valuation allowance related to any benefits from income taxes resulting from the application of a statutory tax rate to the deferred tax assets. We continue to have net deferred tax assets (future tax benefits) in several jurisdictions which we expect to realize assuming, based on certain estimates and assumptions, sufficient taxable income can be generated to utilize these deferred tax benefits. If these estimates and related assumptions change in the future, we may be required to reduce the value of the deferred tax assets resulting in additional tax expense.
FASB ASC 740 addresses the accounting for uncertainty in income taxes recognized in the financial statements. FASB ASC 740 provides guidance on the financial statement recognition and measurement of tax position taken or expected to be taken in a tax return. The accounting rules require that we recognize in our financial statements, the impact of a tax position, if that position is "more likely than not" of being sustained on audit, based on the technical merits of the position. We adopted the provisions regarding the uncertainty of income taxes effective April 1, 2007. Any accruals for estimated interest and penalties would be recorded as a component of income tax expense.
To the extent that the provision for income taxes changed by 1% of loss before income taxes, consolidated net loss would change by $0.6 million in fiscal year 2010.
Results of Operations
Historically, revenues and earnings may or may not be representative of future operating results due to various economic and other factors. The following table sets forth the Condensed Consolidated Statements of Operations for the periods indicated (amounts in thousands):
| |
Fiscal Years Ended March 31, | |||||||||||
|---|---|---|---|---|---|---|---|---|---|---|---|---|
| |
2010 | 2009 | 2008 | |||||||||
Net sales |
$ | 736,335 | $ | 804,385 | $ | 850,120 | ||||||
Operating costs and expenses: |
||||||||||||
Cost of sales |
611,638 | 736,551 | 696,806 | |||||||||
Selling, general and administrative expenses |
86,085 | 93,505 | 97,639 | |||||||||
Research and development |
22,064 | 28,956 | 35,699 | |||||||||
Restructuring charges |
9,198 | 30,874 | 25,341 | |||||||||
Goodwill Impairment |
— | 174,327 | — | |||||||||
Write down of long-lived assets |
656 | 67,624 | 4,218 | |||||||||
Net gain on sales and disposals of assets |
(1,003 | ) | (25,505 | ) | (702 | ) | ||||||
Curtailment gains on benefit plans |
— | (30,835 | ) | — | ||||||||
Operating income (loss) |
7,697 | (271,112 | ) | (8,881 | ) | |||||||
Other (income) expense, net |
72,108 |
17,299 |
11,223 |
|||||||||
Loss before income taxes |
(64,411 | ) | (288,411 | ) | (20,104 | ) | ||||||
Income tax expense (benefit) |
5,036 | (3,202 | ) | 5,111 | ||||||||
Net loss |
$ | (69,447 | ) | $ | (285,209 | ) | $ | (25,215 | ) | |||
39
Comparison of Fiscal Year 2010 to Fiscal Year 2009
Overview:
Net sales:
Net sales for fiscal year 2010 were $736.3 million, which represented an 8.5% decrease from fiscal year 2009 net sales of $804.4 million. Film and Electrolytic sales decreased $40.4 million while Tantalum and Ceramic sales decreased by $22.9 million and $4.8 million, respectively. Unit sales volume for fiscal year 2010 decreased 18.8% as compared to fiscal year 2009. Unit sales volume and revenue were negatively affected by the global economic downturn that adversely impacted all regions as well as the weak automotive market, a decline in the DC Film product line due to lower demand in the consumer, lighting, and automotive industries and a softening in the Hi-CV market in Asia. Average selling prices increased 10.8% for fiscal year 2010 as compared to fiscal year 2009 primarily due a positive product mix shift to polymer products for Tantalum. This increase was partially offset by an unfavorable product mix shift in Film & Electrolytic as our most significant sales decrease occurred with industrial customers who purchase our highest technology products that typically have the highest average selling price. Improving economic conditions led to higher sales in each of the quarters following the fourth quarter of fiscal year 2009 when the impact of the economic downturn had its most adverse affect on our sales and net sales declined to $136.0 million. Net sales for the first quarter of fiscal year 2010 improved to $150.2 million, a 10.4% increase over the fourth quarter of fiscal year 2009, and our net sales improved to $173.3 million in the second quarter of fiscal year 2010, a 15.4% increase compared to first fiscal quarter of fiscal year 2010. Similarly, our net sales further improved to $199.9 million in the third quarter of fiscal year 2010, a 15.3% increase compared to the second quarter of fiscal year 2010, and our net sales improved to $213.0 million in the fourth quarter of fiscal year 2010, a 6.5% increase compared to the third fiscal quarter of fiscal year 2010.
By region, 24% of net sales for the year ended March 31, 2010 were to customers in the Americas, 39% were to customers in APAC, and 37% were to customers in EMEA. For the year ended March 31, 2009, 25% of net sales were to customers in the Americas, 35% were to customers in APAC, and 40% were to customers in EMEA.
By channel, 48% of net sales for the year ended March 31, 2010, were to distribution customers, 15% were to EMS customers, and 37% were to OEM customers. For the year ended March 31, 2009, 47% of net sales were to distribution customers, 20% were to EMS customers, and 33% were to OEM customers.
Gross Margin:
Gross margin for the fiscal year ended March 31, 2010 increased to 16.9% of net sales from 8.4% of net sales in the prior year. Several factors contributed to the increase in gross margin percentage in fiscal year 2010. Cost savings from several cost reduction plans that were initiated throughout fiscal year 2009 were partially responsible for the improvement. In fiscal year 2009, we incurred costs in conjunction with the relocation and start up of equipment in China and a $7.5 million lower of cost or market charge to adjust Ceramic Hi-CV inventory to its net realizable value. In addition, there was an overall increase in average selling prices which contributed to the increase in gross margin. These improvements were offset by the negative gross margin in Film and Electrolytic. In the second quarter of fiscal year 2010, we initiated a restructuring plan to reposition our European business; however, the benefits of this restructuring activity are not expected to be realized until future periods. During the course of this restructuring effort, the Company expects to spend approximately $35 million to $40 million to reposition our European manufacturing base. Our expectation is an improvement in our European operating results by approximately $10 million in fiscal year 2011 compared to fiscal year 2010, and to improve approximately $42 million in fiscal year 2012 versus fiscal year 2010. The plan is expected to take approximately two to three years to complete.
40
Selling, general and administrative expenses:
SG&A expenses were $86.1 million, or 11.7% of net sales for fiscal year 2010 compared to $93.5 million, or 11.6% of net sales for fiscal year 2009. The $7.4 million decrease in SG&A expenses for fiscal year 2010 compared to fiscal year 2009 includes a decrease of $5.9 million in selling expenses primarily attributable to cost reductions resulting from our reduction in workforce, a 10% wage reduction for all salaried employees effective January 1, 2009 (where possible) and the temporary suspension of the match in our U.S. defined contribution retirement plan, reducing it from 6% to 0%. Effective August 1, 2009, we reactivated our U.S. defined contribution retirement plan match, and in Mexico and China we retracted the 10% wage reduction. Effective October 1, 2009, we also retracted our 10% wage reduction in the U.S. In addition, during fiscal year 2010, costs related to integrating our acquisitions were $5.2 million lower, bad debt expense was $1.3 million lower and pension charges were $2.8 million lower. In addition, we reduced redundant administrative expenses primarily within Film and Electrolytic and reduced legal expenses. The reduction in these costs was offset by an increase of $10.0 million related to incentive accruals, information systems, and depreciation.
Restructuring Charges:
During fiscal year 2010, we recognized charges of $9.2 million for reductions in workforce primarily associated with a headcount reduction of 32 employees in Portugal, a headcount reduction of 57 employees in Finland, and a headcount reduction of 85 employees in Italy. There were also headcount reductions at the executive level related to our initiative to reduce overhead within the Company as a whole. In addition to the headcount reduction in Portugal, management incurred charges related to the relocation of equipment from Portugal to Mexico. Machinery not used for production in Portugal and not relocated to Mexico were disposed of and as such the Company recorded an impairment charge of $0.7 million to write down the equipment to scrap value. Overall, we incurred charges of $1.6 million related to the relocation of equipment to Mexico from Portugal and various other locations. The restructuring plan includes implementing programs to make the Company more competitive, removing excess capacity, moving production to lower cost locations, and eliminating unnecessary costs throughout the Company. During fiscal year 2009, we recognized charges of $30.9 million for reductions in workforce worldwide in each of our business groups related to three cost reduction plans. We recognized charges of $4.9 million primarily for reductions in workforce in Film and Electrolytic. We recognized charges of $3.5 million related primarily to the reduction of approximately 1,500 manufacturing positions representing approximately 14% of our workforce. We recognized charges of $16.1 million related to the rationalization of corporate staff and manufacturing support functions in the U.S., Europe, Mexico, and Asia. Approximately 640 employees were affected by this action. Additionally, during fiscal year 2009, we incurred expenses of $5.5 million for the relocation of equipment.
Goodwill Impairment and Write Down of Long-Lived Assets:
We tested goodwill for impairment during the first and second quarters of fiscal year 2009. Due to reduced earnings and cash flows caused by macro-economic factors, excess capacity issues and delays in integrating recently acquired businesses, we reduced our earnings forecast in conjunction with such testing. As a result, our impairment testing for fiscal year 2009 led to a $174.3 million non-cash goodwill impairment charge to write off all of the carrying value of our goodwill. We determined the business enterprise fair value by using both an income approach and a market approach. Film and Electrolytic recorded a $137.5 million impairment charge, Tantalum recorded a $24.4 million impairment charge, and Ceramic recorded a $12.4 million impairment charge.
In addition, and partially as a result of the goodwill impairment testing, Ceramic recorded a $5.3 million impairment charge to write off all of its other intangible assets and recorded a $58.6 million impairment charge to write down its long-lived assets. Also, we closed a research and
41
development facility located in Heidenheim, Germany that served Tantalum. As part of this closure, we abandoned certain long-lived assets and incurred $1.2 million in impairment charges related to the abandonment.
In fiscal year 2010, the Company recorded an impairment charge of $0.7 million to write down equipment that wasn't being used in Portugal to scrap value.
Research and development:
Research and development expenses were $22.1 million, or 3.0% of net sales for fiscal year 2010, compared to $29.0 million, or 3.6% of net sales for fiscal year 2009. The 23.8% decrease resulted from savings from our reduction in workforce, a 10% wage reduction for all salaried employees effective January 1, 2009 (where possible) and the temporary suspension of the match in our U.S. defined contribution retirement plan, reducing it from 6% to 0%.
Operating income (loss):
Operating income for the fiscal year 2010 was $7.7 million compared to an operating loss of $271.1 million in the prior fiscal year. In fiscal year 2009, we incurred non-cash charges of $242.0 million for goodwill impairment and the write down of long-lived assets compared to $0.7 million in fiscal year 2010. Increased average selling prices and decreased costs led to a gross margin increase of $56.9 million in fiscal year 2010 as compared to fiscal year 2009. Additionally, operating expenses were $14.3 million lower than in fiscal year 2009 and restructuring charges were $21.7 million lower than fiscal year 2009. These favorable items were partially offset by a decrease in gains on the sales and disposals of assets of $24.5 million in fiscal year 2009 compared to fiscal year 2010 and curtailment gains on benefit plans of $30.8 million in fiscal year 2009.
Other (income) expense, net:
Other (income) expense, net was $72.1 million in fiscal year 2010 compared to $17.3 million in fiscal year 2009, an increase of $54.8 million. The increase in expense primarily related to an $81.1 million increase in value of the Closing Warrant, an increase of $18.2 million in foreign currency translation losses and a $0.4 million decrease in interest income. These increases in expense and decrease in income were partially offset by a $3.8 million decrease in interest expense and a gain on early extinguishment of debt of $38.9 million in fiscal year 2010 compared to a loss on early extinguishment of debt of $2.2 million in fiscal year 2009.
Income taxes:
The effective income tax rate for fiscal year 2010 was (7.8)%, resulting in an income tax expense of $5.0 million. This compares to an effective income tax rate of 1.1% for fiscal year 2009 that resulted in an income tax benefit of $3.2 million. The fiscal year 2010 income tax expense is primarily comprised of an income tax expense resulting from operations in certain foreign jurisdictions totaling $4.1 million. The $4.1 million income tax expense from foreign operations includes a $2.8 million increase in the valuation allowance reserve of a subsidiary operating in Italy. In addition, there is a $1.0 million state income tax expense, primarily due to the gain on the early extinguishment of debt. No federal income tax expense is recognized for the U.S. taxable income for fiscal year 2010 due to the utilization of a portion of the federal net operating loss carryforward resulting in a partial release of the valuation allowance. Future fluctuations in the valuation allowance are expected to result in an income tax rate below the 30% to 36% historical average.
42
Segment Review:
The following table sets forth the operating income (loss) for each of our business segments for the fiscal years 2010 and 2009 respectively. The table also sets forth each of the segments' net sales as a percent to total net sales, the net income (loss) components as a percent to total net sales, and the percentage increase or decrease of such components over the prior year (amounts in thousands, except percentages):
| |
For the Fiscal Years Ended | ||||||||||||||
|---|---|---|---|---|---|---|---|---|---|---|---|---|---|---|---|
| |
March 31, 2010 | March 31, 2009 | |||||||||||||
| |
Amount | % to Total Sales | Amount | % to Total Sales | |||||||||||
Net sales |
|||||||||||||||
Tantalum |
$ | 343,797 | 46.7 | % | $ | 366,675 | 45.6 | % | |||||||
Ceramic |
171,153 | 23.2 | % | 175,916 | 21.9 | % | |||||||||
Film and Electrolytic |
221,385 | 30.1 | % | 261,794 | 32.5 | % | |||||||||
Total |
$ | 736,335 | 100.0 | % | $ | 804,385 | 100.0 | % | |||||||
Gross margin |
|||||||||||||||
Tantalum |
$ | 77,882 | 10.6 | % | $ | 52,709 | 6.6 | % | |||||||
Ceramic |
50,490 | 6.9 | % | 9,874 | 1.2 | % | |||||||||
Film and Electrolytic |
(3,675 | ) | -0.5 | % | 5,251 | 0.7 | % | ||||||||
Total |
124,697 | 16.9 | % | 67,834 | 8.4 | % | |||||||||
SG&A expenses |
|||||||||||||||
Tantalum |
36,948 | 5.0 | % | 37,062 | 4.6 | % | |||||||||
Ceramic |
19,223 | 2.6 | % | 21,803 | 2.7 | % | |||||||||
Film and Electrolytic |
29,914 | 4.1 | % | 34,640 | 4.3 | % | |||||||||
Total |
86,085 | 11.7 | % | 93,505 | 11.6 | % | |||||||||
R&D expenses |
|||||||||||||||
Tantalum |
11,139 | 1.5 | % | 13,999 | 1.7 | % | |||||||||
Ceramic |
6,167 | 0.8 | % | 8,291 | 1.0 | % | |||||||||
Film and Electrolytic |
4,758 | 0.6 | % | 6,666 | 0.8 | % | |||||||||
Total |
22,064 | 3.0 | % | 28,956 | 3.6 | % | |||||||||
Restructuring charges |
|||||||||||||||
Tantalum |
1,941 | 0.3 | % | 11,388 | 1.4 | % | |||||||||
Ceramic |
543 | 0.1 | % | 7,143 | 0.9 | % | |||||||||
Film and Electrolytic |
6,714 | 0.9 | % | 12,343 | 1.5 | % | |||||||||
Total |
9,198 | 1.2 | % | 30,874 | 3.8 | % | |||||||||
Goodwill impairment charges |
|||||||||||||||
Tantalum |
— | — | 24,378 | 3.0 | % | ||||||||||
Ceramic |
— | — | 12,418 | 1.5 | % | ||||||||||
Film and Electrolytic |
— | — | 137,531 | 17.1 | % | ||||||||||
Total |
— | — | 174,327 | 21.7 | % | ||||||||||
|
|||||||||||||||
43
| |
For the Fiscal Years Ended | ||||||||||||||
|---|---|---|---|---|---|---|---|---|---|---|---|---|---|---|---|
| |
March 31, 2010 | March 31, 2009 | |||||||||||||
| |
Amount | % to Total Sales | Amount | % to Total Sales | |||||||||||
| Write down of long-lived assets | |||||||||||||||
Tantalum |
656 | 0.1 | % | 1,855 | 0.2 | % | |||||||||
Ceramic |
— | — | 65,769 | 8.2 | % | ||||||||||
Total |
656 | 0.1 | % | 67,624 | 8.4 | % | |||||||||
(Gain) loss on sales and disposals of assets |
|||||||||||||||
Tantalum |
(1,226 | ) | -0.2 | % | (26,435 | ) | -3.3 | % | |||||||
Ceramic |
183 | — | 1,123 | 0.1 | % | ||||||||||
Film and Electrolytic |
40 | — | (193 | ) | — | ||||||||||
Total |
(1,003 | ) | -0.1 | % | (25,505 | ) | -3.2 | % | |||||||
Curtailment gain on benefit plans |
|||||||||||||||
Tantalum |
— | — | (22,856 | ) | -2.8 | % | |||||||||
Ceramic |
— | — | (7,979 | ) | -1.0 | % | |||||||||
Total |
— | — | (30,835 | ) | -3.8 | % | |||||||||
Operating income (loss) |
|||||||||||||||
Tantalum |
28,424 | 3.9 | % | 13,318 | 1.7 | % | |||||||||
Ceramic |
24,374 | 3.3 | % | (98,694 | ) | -12.3 | % | ||||||||
Film and Electrolytic |
(45,101 | ) | -6.1 | % | (185,736 | ) | -23.1 | % | |||||||
Total |
7,697 | 1.0 | % | (271,112 | ) | -33.7 | % | ||||||||
Other expense, net |
72,108 | 9.8 | % | 17,299 | 2.2 | % | |||||||||
Loss before income taxes |
(64,411 | ) | -8.7 | % | (288,411 | ) | -35.9 | % | |||||||
Income tax expense (benefit) |
5,036 | 0.7 | % | (3,202 | ) | -0.4 | % | ||||||||
Net loss |
$ | (69,447 | ) | -9.4 | % | $ | (285,209 | ) | -35.5 | % | |||||
Tantalum
Net sales—Net sales decreased $22.9 million or 6.2% during fiscal year 2010, as compared to fiscal year 2009. Unit sales volume for fiscal year 2010 decreased 18.2% as compared to fiscal year 2009. Unit sales volume and revenue were negatively affected by the global economic downturn that adversely impacted all regions as well as the weak automotive market in the U.S. and Europe. Average selling prices increased 14.6% for fiscal year 2010 as compared to fiscal year 2009 due to a favorable product mix shift to polymer products. Volumes for Tantalum products continued to be very strong in Asia, where sales represented 47.9% of total tantalum revenue.
Gross Margin—Gross margin increased $25.2 million during fiscal year 2010 as compared to fiscal year 2009. As a percent of Tantalum net sales, gross margin increased to 22.7% during fiscal year 2010 as compared to 14.4% in fiscal year 2009. The primary contributors to the higher gross margin percentage were the cost savings initiated throughout fiscal year 2009 through reductions in headcount and other manufacturing expenses, which were realized in fiscal year 2010. Additionally, there was an increase in sales of higher margin polymer and specialty products which contributed to the increase in gross margin percentage.
44
Operating income—Operating income for fiscal year 2010 was $28.4 million as compared to an operating income of $13.3 million for fiscal year 2009. Operating income was favorably impacted by a $25.2 million increase in gross margin, a $9.4 million decrease in restructuring costs, no charges for goodwill impairment in fiscal year 2010 compared to charges of $24.4 million in fiscal year 2009, a reduction of $1.2 million in the write down of long-lived assets in fiscal year 2010 compared to fiscal year 2009, the reduction in operating expenses of $3.0 million related to the closure of a research and development facility located in Heidenheim, Germany, and company-wide restructuring efforts. Offsets to the gains were a decrease of $25.2 million in gains on the sales and disposals of assets and a decrease of $22.9 million in curtailment gains on benefit plans.
Ceramic
Net sales—Net sales decreased $4.8 million or 2.7% during fiscal year 2010, as compared to fiscal year 2009. The decrease was attributable to lower volumes. Volumes decreased 2.8% during fiscal year 2010, as compared to fiscal year 2009 due primarily to the lingering effects of the global economic downturn as well as softening in the Hi-CV market in Asia and a weakening of the automotive markets in the U.S. and Europe. Average selling prices in fiscal year 2010 increased 1% compared to fiscal year 2009.
Gross Margin—Gross margin increased $40.6 million during fiscal year 2010 as compared to fiscal year 2009. As a percent of Ceramic net sales, gross margin increased to 29.5% during fiscal year 2010 as compared to 5.6% during fiscal year 2009. A significant contributor to the lower gross margin in fiscal year 2009 was a $7.5 million lower-of-cost-or-market charge to adjust Hi-CV inventory to its net realizable value. Price decreases in Hi-CV products in Asia caused the net realizable value of the inventory to fall below its carrying value. Additionally, we continue to improve our gross margin through cost reductions, product and region mix improvements and improvements in production efficiencies.
Operating income (loss)—Operating income improved from a loss of $98.7 million during fiscal year 2009 to an operating income of $24.4 million during fiscal year 2010. The increase in operating income of $123.1 million was attributable to the $40.6 million increase in gross margin as well as the absence in fiscal year 2010 of charges for goodwill impairment and the write down of long-lived assets compared to charges of $78.2 million in fiscal year 2009. In addition, compared to fiscal year 2009, restructuring charges decreased by $6.6 million, operating expenses decreased $4.7 million, and loss on sales and disposals of assets decreased $0.9 million in fiscal year 2010.
Film and Electrolytic
Net sales—Net sales decreased by $40.4 million or 15.4% in fiscal year 2010, as compared to fiscal year 2009. Unit sales volume for the fiscal year 2010 decreased 19.1% as compared to fiscal year 2009. Average selling prices decreased 2.0% for fiscal year 2010 as compared to fiscal year 2009. Sales volumes declined in the DC Film product line due to lower demand in the consumer, lighting, and automotive industries. The average sales price decreased due to a mix shift in Film & Electrolytic as our most significant sales decrease occurred with industrial customers who purchase our highest technology products that typically have the highest average selling price.
Gross Margin—Gross margin decreased $8.9 million during fiscal year 2010 as compared to fiscal year 2009. As a percent to Film and Electrolytic net sales, gross margin decreased to negative 1.7% during fiscal year 2010 from a positive 2.0% during fiscal year 2009. The primary contributors to the lower gross margin percent were the decline in volume and average selling prices mentioned above. The lower sales levels were not sufficient to cover fixed costs; and therefore, gross margin declined by $8.9 million in fiscal year 2010 as compared to fiscal year 2009. In fiscal year 2010, we initiated a
45
restructuring plan primarily designed to improve the operating results of Film and Electrolytic. We expect the plan will take approximately two to three years to complete.
Operating income (loss)—Operating loss was $45.1 million in fiscal year 2010, compared to $185.7 million in fiscal year 2009. The improvement in operating loss of $140.6 million was attributable primarily to the non-cash goodwill impairment charge of $137.5 million taken in fiscal year 2009. Additionally, operating expenses decreased $6.6 million and restructuring charges decreased $5.6 million in fiscal year 2010 compared to fiscal year 2009. Offsetting these items was a decrease of $8.9 million in gross margin in fiscal year 2010, compared to fiscal year 2009, and no losses on the sales and disposals of assets in fiscal year 2010 compared to a loss on sales and disposals of assets of $0.2 million in fiscal year 2009.
Comparison of Fiscal Year 2009 to Fiscal Year 2008
Overview:
Net sales:
Net sales for fiscal year 2009 were $804.4 million, which represented a 5.4% decrease from fiscal year 2008 net sales of $850.1 million. Film and Electrolytic sales increased $60.6 million while Tantalum and Ceramic sales decreased by $56.6 million and $49.7 million, respectively. The Arcotronics business was acquired near the beginning of the third quarter of fiscal year 2008. Accordingly, the increase in Film and Electrolytic sales occurred because fiscal year 2009 contained a full year of Arcotronics' sales while fiscal year 2008 contained slightly less than two quarters of Arcotronics' sales. The global economic downturn adversely affected sales throughout the year leading to lower sales in Tantalum and Ceramic, and weaker than expected sales in Film and Electrolytic. Additionally, the downturn worsened over the course of fiscal year 2009 and led to sequentially decreasing sales in each quarter, particularly in the fourth quarter. This decrease in sales is attributable to distributors reducing their inventories in order to allow them to operate in line with forecasted customer demand, and to lower demand from our EMS and OEM customers.
By region, 25% of net sales for the year ended March 31, 2009 were to customers in the Americas, 35% were to customers in APAC, and 40% were to customers in EMEA. For the year ended March 31, 2008, 28% of net sales were to customers in the Americas, 36% were to customers in APAC, and 36% were to customers in EMEA.
By channel, 47.4% of net sales for the year ended March 31, 2009, were to distribution customers, 19.4% were to EMS customers, and 33.2% were to OEM customers. For the year ended March 31, 2008, 47.6% of net sales were to distribution customers, 17.5% were to EMS customers, and 34.9% were to OEM customers.
Gross Margin:
Gross margin for the fiscal year ended March 31, 2009 decreased from 18.0% of net sales in the prior year to 8.4% of net sales. Several factors contributed to the decrease in gross margin percentage in fiscal year 2009. In the first half of the year, we experienced higher manufacturing costs related to inflation in the utility, freight and distribution areas as well as increased costs in conjunction with the relocation and start up of equipment in China. Additionally, we recorded a $7.5 million lower of cost or market charge to adjust Ceramic Hi-CV inventory to its net realizable value. Price decreases in Hi-CV products in Asia caused the net realizable value of the inventory to fall below its carrying value. In the last half of the year, particularly the fourth quarter, gross margin as a percent to sales was down because of the unfavorable absorption impact of lower sales on manufacturing fixed costs. While improved manufacturing performance and the benefits of our cost savings plans led to lower manufacturing costs, these reductions were not enough to offset the impact of lower volume. Lower
46
volume had a particularly unfavorable gross margin impact in Film and Electrolytic, where the pace of our restructuring and cost reduction efforts have slowed considerably because of our liquidity situation.
Selling, general and administrative expenses:
SG&A expenses were $93.5 million or 11.6% of net sales for fiscal year 2009 compared to $97.6 million, or 11.5% of net sales for fiscal year 2008. The decrease was primarily due to cost reductions resulting from our rationalization plan announced in the second quarter of fiscal year 2009; we began to see savings from the plan in the second half of fiscal year 2009. Partially offsetting these savings were $2.3 million in additional bad debt expense, an additional $2.8 million in pension charges and $1.0 million in higher incentive accruals compared to fiscal year 2008. In addition, integration expenses were up $0.9 million in fiscal year 2009 compared to fiscal year 2008 and were primarily associated with integrating our Evox Rifa and Arcotronics acquisitions.
Research and development:
Research and development expenses were $29.0 million, or 3.6% of net sales for fiscal year 2009, compared to $35.7 million, or 4.2% of net sales for fiscal year 2008. The acquisition of the Arcotronics business added $1.9 million in R&D expenses in fiscal year 2009 while the savings from the rationalization plan more than offset this increase.
Operating (loss):
The operating loss for the fiscal year 2009 was $271.1 million compared to operating loss of $8.9 million in the prior fiscal year. We incurred non-cash charges of $242.0 million for goodwill impairment and the write down of long-lived assets in fiscal year 2009 compared to $4.2 million in fiscal year 2008. Lower volume led to a gross margin decrease of $86.6 million in fiscal year 2009 as compared to fiscal year 2008. Additionally, operating expenses were $12.0 million lower than in fiscal year 2008 and restructuring charges were $5.5 million higher than fiscal year 2008. These unfavorable items were partially offset by gains on the sales and disposals of assets $25.5 million in fiscal year 2009 compared to $0.7 million in fiscal year 2008 and curtailment gains on benefit plans of $30.8 million in fiscal year 2009.
Other (income) expense, net:
Other (income) expense, net was $17.3 million in fiscal year 2009 compared to $11.2 million in fiscal year 2008, an increase of $6.1 million. The increase in expense resulted from a $5.4 million decrease in interest income, an $8.1 million increase in interest expense and a loss on early retirement of debt of $2.2 million compared to fiscal year 2008. These increases in expense were partially offset by a $9.7 million increase in other income which primarily relates to foreign exchange gains.
Income taxes:
The effective tax rate for fiscal year 2009 was 1.1%, resulting in a tax benefit of $3.2 million. This compares to an effective tax rate of (25.4)% for fiscal year 2008 that resulted in a tax expense of $5.1 million. The $3.2 million net income tax benefit is primarily comprised from operations in certain foreign jurisdictions, totaling a $3.6 million tax benefit. In addition, there is a $0.6 million income tax expense relating to FIN No. 48 adjustments and a $0.2 million income tax benefit primarily from the recognition of Texas credits. No tax benefit was recognized for the U.S. tax loss for fiscal year 2009 due to the establishment of a valuation allowance.
47
Segment Review:
The following chart highlights the net sales and operating income (loss) by segment for the fiscal years shown (amounts in thousands):
| |
For the Fiscal Years Ended | ||||||||||||||
|---|---|---|---|---|---|---|---|---|---|---|---|---|---|---|---|
| |
March 31, 2009 | March 31, 2008 | |||||||||||||
| |
Amount | % to Total Sales | Amount | % to Total Sales | |||||||||||
Net sales |
|||||||||||||||
Tantalum |
$ | 366,675 | 45.6 | % | $ | 423,320 | 49.8 | % | |||||||
Ceramic |
175,916 | 21.9 | % | 225,610 | 26.5 | % | |||||||||
Film and Electrolytic |
261,794 | 32.5 | % | 201,190 | 23.7 | % | |||||||||
Total |
$ | 804,385 | 100.0 | % | $ | 850,120 | 100.0 | % | |||||||
Gross margin |
|||||||||||||||
Tantalum |
$ | 52,709 | 6.6 | % | $ | 79,618 | 9.4 | % | |||||||
Ceramic |
9,874 | 1.2 | % | 41,013 | 4.8 | % | |||||||||
Film and Electrolytic |
5,251 | 0.7 | % | 32,683 | 3.8 | % | |||||||||
Total |
67,834 | 8.4 | % | 153,314 | 18.0 | % | |||||||||
SG&A expenses |
|||||||||||||||
Tantalum |
37,062 | 4.6 | % | 40,704 | 4.8 | % | |||||||||
Ceramic |
21,803 | 2.7 | % | 26,602 | 3.1 | % | |||||||||
Film and Electrolytic |
34,640 | 4.3 | % | 30,333 | 3.6 | % | |||||||||
Total |
93,505 | 11.6 | % | 97,639 | 11.5 | % | |||||||||
R&D expenses |
|||||||||||||||
Tantalum |
13,999 | 1.7 | % | 17,844 | 2.1 | % | |||||||||
Ceramic |
8,291 | 1.0 | % | 14,033 | 1.7 | % | |||||||||
Film and Electrolytic |
6,666 | 0.8 | % | 3,822 | 0.4 | % | |||||||||
Total |
28,956 | 3.6 | % | 35,699 | 4.2 | % | |||||||||
Restructuring charges |
|||||||||||||||
Tantalum |
11,388 | 1.4 | % | 19,046 | 2.2 | % | |||||||||
Ceramic |
7,143 | 0.9 | % | 5,125 | 0.6 | % | |||||||||
Film and Electrolytic |
12,343 | 1.5 | % | 1,170 | 0.1 | % | |||||||||
Total |
30,874 | 3.8 | % | 25,341 | 3.0 | % | |||||||||
Goodwill impairment charges |
|||||||||||||||
Tantalum |
24,378 | 3.0 | % | — | — | ||||||||||
Ceramic |
12,418 | 1.5 | % | — | — | ||||||||||
Film and Electrolytic |
137,531 | 17.1 | % | — | — | ||||||||||
Total |
174,327 | 21.7 | % | — | — | ||||||||||
Write down of long-lived assets |
|||||||||||||||
Tantalum |
1,855 | 0.2 | % | 4,218 | 0.5 | % | |||||||||
Ceramic |
65,769 | 8.2 | % | — | — | ||||||||||
Total |
67,624 | 8.4 | % | 4,218 | 0.5 | % | |||||||||
(Gain) loss on sales and disposals of assets |
|||||||||||||||
Tantalum |
(26,435 | ) | -3.3 | % | (442 | ) | -0.1 | % | |||||||
Ceramic |
1,123 | 0.1 | % | (260 | ) | — | |||||||||
Film and Electrolytic |
(193 | ) | — | — | — | ||||||||||
Total |
(25,505 | ) | -3.2 | % | (702 | ) | -0.1 | % | |||||||
48
| |
For the Fiscal Years Ended | ||||||||||||||
|---|---|---|---|---|---|---|---|---|---|---|---|---|---|---|---|
| |
March 31, 2009 | March 31, 2008 | |||||||||||||
| |
Amount | % to Total Sales | Amount | % to Total Sales | |||||||||||
Curtailment gain on benefit plans |
|||||||||||||||
Tantalum |
(22,856 | ) | -2.8 | % | — | — | |||||||||
Ceramic |
(7,979 | ) | -1.0 | % | — | — | |||||||||
Total |
(30,835 | ) | -3.8 | % | — | — | |||||||||
Operating income (loss) |
|||||||||||||||
Tantalum |
13,318 | 1.7 | % | (1,752 | ) | -0.2 | % | ||||||||
Ceramic |
(98,694 | ) | -12.3 | % | (4,487 | ) | -0.5 | % | |||||||
Film and Electrolytic |
(185,736 | ) | -23.1 | % | (2,642 | ) | -0.3 | % | |||||||
Total |
(271,112 | ) | -33.7 | % | (8,881 | ) | -1.0 | % | |||||||
Other expense, net |
17,299 | 2.2 | % | 11,223 | 0.4 | % | |||||||||
Loss before income taxes |
(288,411 | ) | -35.9 | % | (20,104 | ) | -1.5 | % | |||||||
Income tax expense (benefit) |
(3,202 | ) | -0.4 | % | 5,111 | 0.6 | % | ||||||||
Net loss |
$ | (285,209 | ) | -35.5 | % | $ | (25,215 | ) | -2.1 | % | |||||
Tantalum
Net sales—Net sales decreased $56.6 million or 13.4% during fiscal year 2009, as compared to fiscal year 2008. Unit sales volume for fiscal year 2009 decreased 15.8% as compared to fiscal year 2008. Unit sales volume and revenue were negatively affected by the global economic downturn that adversely impacted all regions as well as the weak automotive market in the United States and Europe. Average selling prices increased 2.8% for fiscal year 2009 as compared to fiscal year 2008 due to a favorable product mix shift, as specialty product shipments represented a larger share of Tantalum revenue.
Gross Margin—Gross margin decreased $27.4 million during fiscal year 2009 as compared to fiscal year 2008. As a percent of Tantalum net sales, gross margin decreased to 14.4% during fiscal year 2009 as compared to 18.8% in fiscal year 2008. The primary contributor to the lower gross margin was lower volume driven by the global economic downturn affecting all regions. Operational cost reductions were implemented, however the reductions were not enough to offset the revenue decline. Additionally, margins were adversely affected by increases in manufacturing costs related to inflation in the utility and freight distribution areas.
Operating income (loss)—Operating income for fiscal year 2009 was $13.3 million as compared to an operating loss of $1.8 million for fiscal year 2008. Operating income was favorably impacted $26.4 million by the gain on the sales and disposals of assets, curtailment gains on benefit plans of $22.9 million, and reductions in restructuring costs of $7.7 million. Offsets to the gains were a non-cash $24.4 million goodwill impairment charge, and lower revenue impacted by the global economic downturn, which led to lower gross margin. The lower revenue impact was partially offset by reduced operating expenses of $8.0 million primarily as a result of our rationalization plan initiated on July 31, 2008.
49
Net sales—Net sales decreased $49.7 million or 22.0% during fiscal year 2009, as compared to fiscal year 2008. The decrease is primarily attributed to lower volumes, partially offset by higher average selling prices. Volumes decreased 28.8% during fiscal year 2009, as compared to fiscal year 2008 due primarily to the global economic downturn as well as softening in the Hi-CV market in Asia and weak automotive markets in the United States and Europe. Average selling prices increased in fiscal year 2009 by 9.5% due primarily to product and region mix improvements over last year, partially offset by price decreases in Hi-CV products in Asia.
Gross Margin—Gross margin decreased $31.5 million during fiscal year 2009 as compared to fiscal year 2008. As a percent of Ceramic net sales, gross margin decreased to 5.6% during fiscal year 2009 as compared to 18.2% during fiscal year 2008. The primary contributor to the lower gross margin was lower volume driven by the global economic downturn affecting all regions. Also, a significant contributor to the lower gross margin was a $7.5 million lower-of-cost-or-market charge to adjust Hi-CV inventory to its net realizable value. Price decreases in Hi-CV products in Asia caused the net realizable value of the inventory to fall below its carrying value. Also adversely affecting gross margins in fiscal year 2009 were increases in manufacturing costs related to inflation in the utility and freight distribution areas.
Operating income (loss)—Operating loss increased from a loss of $4.5 million during fiscal year 2008 to an operating loss of $98.7 million during fiscal year 2009. The operating loss increase of $94.2 million was attributable to charges of $78.2 million for goodwill impairment and the write down of long-lived assets, a decrease of $31.5 million related to gross margin and a $2.0 million increase in restructuring charges. These unfavorable items were partially offset by lower operating expenses of $10.9 million which primarily resulted from the initiation of our rationalization plan on July 31, 2008.
Film and Electrolytic
Film and Electrolytic was created with the acquisition of Evox Rifa in April 2007 and Arcotronics in October 2007. Accordingly, the financial results for the twelve months of fiscal year 2008 include approximately eleven months of Evox Rifa activity and approximately six months of Arcotronics activity.
Net sales—Net sales increased by $60.6 million or 30.1% in fiscal year 2009, as compared to fiscal year 2008. The Arcotronics business, which was acquired at the beginning of the third quarter of fiscal year 2008, accounted for $61.6 million of the $60.6 million increase. Film and Electrolytic experienced declining sales in the third and fourth quarters of fiscal year 2009 due to the global economic downturn.
Gross Margin—Gross margin decreased $27.7 million during fiscal year 2009 as compared to fiscal year 2008. As a percent of Film and Electrolytic net sales, gross margin decreased to 2.0% during fiscal year 2009 as compared to 16.2% during fiscal year 2008. Declining revenue was the primary cause of the drop in gross margin. Despite the cost cutting initiatives executed through head count reductions and temporary layoffs in Italy, expenses were not reduced enough to offset the revenue decline in third and fourth quarters of fiscal year 2009.
Operating income (loss)—Operating loss for fiscal year 2009 was $185.7 million which was primarily due to a non-cash goodwill impairment charge of $137.5 million. Additionally, lower gross margin, restructuring charges of $12.3 million related to reduction-in-force activity and moving production lines to lower cost regions of the world, and integration costs of $5.2 million also contributed to the operating loss.
50
Liquidity and Capital Resources
Our liquidity needs arise from working capital requirements, acquisitions, capital expenditures, principal and interest payments on debt, and costs associated with the implementation of our restructuring plan. Historically, these cash needs have been met by cash flows from operations, borrowings under credit agreements and existing cash balances.
On May 5, 2010, we completed a private placement of $230.0 million in aggregate principal amount of our 10.5% Senior Notes due 2018. The proceeds of the private placement were used to repay all of its outstanding indebtedness under our credit facility with K Financing, LLC, our €60 million credit facility and €35 million credit facility with UniCredit and our term loan with Vishay We used a portion of the remaining proceeds to fund a previously announced tender offer to purchase $40.5 million in aggregate principal amount of our Convertible Notes and to pay costs incurred in connection with the private placement, the tender offer and the foregoing repayments. We made a principal payment related to UniCredit Facility A on April 1, 2010 for €7.7 million ($10.4 million). The execution of the private placement reduced our short term debt by $18.8 million.
Based on our current operating plans management believes that cash generated from operations will be sufficient to cover our operating requirements for the next twelve months, including interest payments and expected capital expenditures of $20-$25 million.
Our cash and cash equivalents increased by $40.0 million for the year ended March 31, 2010, decreased by $42.2 million for the year ended March 31, 2009 and decreased by $124.3 million for the year ended March 31, 2008 as follows (amounts in thousands):
| |
Fiscal Years Ended March 31, | ||||||||||
|---|---|---|---|---|---|---|---|---|---|---|---|
| |
2010 | 2009 | 2008 | ||||||||
Cash provided by (used in) operating activities |
$ | 54,620 | $ | 5,725 | $ | (20,563 | ) | ||||
Cash provided by (used in) investing activities |
(11,421 | ) | 7,229 | (59,453 | ) | ||||||
Cash used in financing activities |
(2,912 | ) | (53,495 | ) | (46,253 | ) | |||||
Effects of foreign currency fluctuations on cash |
(292 | ) | (1,638 | ) | 1,963 | ||||||
Net increase (decrease) in cash and cash equivalents |
$ | 39,995 | $ | (42,179 | ) | $ | (124,306 | ) | |||
Fiscal Year 2010 compared to Fiscal Year 2009
Operations:
Cash flows from operations were $54.6 million which was an improvement of $48.9 million in fiscal year 2010 as compared to fiscal year 2009 despite a decline in net sales. We continued to focus on managing our working capital which led to a reduction in inventory of $7.2 million. In addition, we increased accounts payable through the negotiation of better terms by $26.6 million and accrued expenses and income taxes by $10.6 million. This was partially offset by an increase in accounts receivable of $18.3 million which was a result of an increase in net sales for the fourth quarter of fiscal year 2010 compared to the fourth quarter of fiscal year 2009, a prepaid and other current assets increase of $5.6 million, and an other non-current obligation decrease of $4.4 million. Additionally, large non-cash items effected net income in fiscal year 2010 but did not affect cash provided by operations. These items included increase in warrant value of $81.1 million, a gain on early extinguishment of debt of $38.9 million, depreciation and amortization of $52.6 million and amortization of debt discount and debt issuance costs of $13.4 million.
51
Investing:
Cash used in investing activities was $11.4 million in fiscal year 2010 compared to cash generated in investing activities of $7.2 million in fiscal year 2009. Capital expenditures were $12.9 million in fiscal year 2010, down from capital expenditures of $30.5 million in fiscal year 2009 due to restrictions we put on capital expenditures in an effort to improve cash flow and to comply with our debt covenants. Proceeds from the sale and disposal of assets generated $1.5 million in fiscal year 2010 related to the release of escrow funds held as part of the sale of wet tantalum assets in fiscal year 2009 while proceeds from the sale of assets generated $34.9 million in cash during the same period last year.
Financing:
Cash used in financing activities was $2.9 million in fiscal year 2010 as compared to $53.5 million in fiscal year 2009.
In fiscal year 2010, proceeds from the issuance of debt resulted primarily from the Platinum Term Loan, the Platinum Line of Credit Loan, and the Platinum Working Capital Loan. Approximately $37.8 million in proceeds from the Platinum Term Loan were used to retire $93.9 million in aggregate principal amount of the Convertible Notes (representing 53.7% of the outstanding Convertible Notes) that were validly tendered on June 26, 2009. Proceeds of $10.0 million from the Platinum Line of Credit Loan were used primarily to pay the fees and expenses related to execution of the tender offer. Proceeds of $10.0 million from the Platinum Working Capital Loan were used for general corporate purposes. The gain on the early extinguishment of the Convertible Notes is shown on the line item "(Gain) loss on early extinguishment of debt" on the Consolidated Statements of Operations.
In fiscal year 2010, payments of debt related primarily to retirement of the Convertible Notes discussed above as well as principal payments on UniCredit Facility A and Facility B.
In fiscal year 2009, our payments of debt related primarily to the Senior Notes. In the first quarter of fiscal year 2009, we paid $20.0 million of the outstanding principal balance on our Senior Notes in accordance with the Senior Note agreement. On September 19, 2008, we prepaid our remaining obligations under the Senior Notes, including the outstanding principal balance of $40.0 million, a make-whole amount of $2.0 million and a prepayment fee of $0.2 million. The make-whole amount and prepayment fee are shown on the line item "Loss on early retirement of debt" on the Consolidated Statements of Operations.
In fiscal year 2009, our proceeds from the issuance of debt relates primarily to a loan from Vishay. As part of the sale of the wet tantalum capacitor assets to Vishay, we entered into a three-year term loan agreement. The loan was for $15 million and carries an interest rate of LIBOR plus 4% which is payable monthly. The entire principal amount of $15 million matures on September 15, 2011 and can be prepaid without penalty. The loan is secured by certain accounts receivable of KEMET.
Commitments
At March 31, 2010, we had contractual obligations in the form of non-cancelable operating leases and debt, including interest payments (see Note 2, "Debt" to our consolidated financial statements),
52
European social security, pension benefits, and other post-retirement benefits as follows (amounts in thousands):
| |
|
Payments due by period | ||||||||||||||
|---|---|---|---|---|---|---|---|---|---|---|---|---|---|---|---|---|
Contractual obligations
|
Total | Less than 1 year |
1 - 3 years | 3 - 5 years | More than 5 years |
|||||||||||
Debt obligations(1)(2) |
$ | 294,596 | $ | 17,880 | $ | 4,381 | $ | 1,754 | $ | 270,581 | ||||||
Interest obligations(2) |
213,716 | 25,262 | 51,393 | 50,738 | 86,323 | |||||||||||
European social security |
12,094 | 5,057 | 7,037 | — | — | |||||||||||
Pension benefits(3) |
19,799 | 2,897 | 2,806 | 3,349 | 10,747 | |||||||||||
Operating lease obligations |
20,955 | 7,422 | 9,555 | 2,726 | 1,252 | |||||||||||
Other post-retirement benefits(3) |
1,366 | 163 | 321 | 299 | 583 | |||||||||||
|
$ | 562,526 | $ | 58,681 | $ | 75,493 | $ | 58,866 | $ | 369,486 | ||||||
- (1)
- Holders
of the Convertible Notes have the right to require us to repurchase for cash all or a portion of their Convertible Notes on November 15,
2011, 2016 and 2021 at a repurchase price equal to 100% of the principal amount of the Convertible Notes to be repurchased plus accrued and unpaid interest, if any, in each case, up to but not
including, the date of repurchase.
- (2)
- Debt
and interest obligations have been adjusted to reflect the refinancing of debt which occurred subsequent to March 31, 2010. See Note 18,
"Subsequent Events" for further discussion of the refinancing.
- (3)
- Reflects the expected benefit payments through 2019.
Non-GAAP Financial Measures
To complement our consolidated statements of operations and cash flows, we use non-GAAP financial measures of Adjusted operating income (loss), Adjusted net income (loss) and Adjusted EBITDA. We believe that Adjusted operating income (loss), Adjusted net income (loss) and Adjusted EBITDA are complements to U.S. GAAP amounts and such measures are useful to investors. The presentation of these non-GAAP measures is not meant to be considered in isolation or as an alternative to net income as an indicator of our performance, or as an alternative to cash flows from operating activities as a measure of liquidity.
Adjusted operating income is calculated as follows (amounts in thousands):
| |
Fiscal Years Ended March 31, | |||||||||
|---|---|---|---|---|---|---|---|---|---|---|
| |
2010 | 2009 | 2008 | |||||||
Operating income (loss) |
$ | 7,697 | $ | (271,112 | ) | $ | (8,881 | ) | ||
Adjustments: |
||||||||||
Restructuring charges |
9,198 | 30,874 | 25,341 | |||||||
Goodwill impairment |
— | 174,327 | — | |||||||
Write down of long-lived assets |
656 | 67,624 | 4,218 | |||||||
Gain on sales and disposals of assets |
(1,003 | ) | (25,505 | ) | (702 | ) | ||||
Curtailment gains on benefit plans |
— | (30,835 | ) | — | ||||||
Cancellation of incentive plan |
1,161 | — | — | |||||||
Write off of capitalized advisor fees |
413 | — | — | |||||||
Inventory write downs |
— | 16,500 | — | |||||||
Acquisitons integration costs |
— | 5,254 | 4,339 | |||||||
Total adjustments |
10,425 | 238,239 | 33,196 | |||||||
Adjusted operating income (loss) |
$ | 18,122 | $ | (32,873 | ) | $ | 24,315 | |||
53
Adjusted net income (loss) is calculated as follows (amounts in thousands):
| |
Fiscal Years Ended March 31, | |||||||||
|---|---|---|---|---|---|---|---|---|---|---|
| |
2010 | 2009 | 2008 | |||||||
Net loss |
$ | (69,447 | ) | $ | (285,209 | ) | $ | (25,215 | ) | |
Adjustments: |
||||||||||
Amortization included in interest expense |
13,392 | 9,918 | 8,791 | |||||||
Restructuring charges |
9,198 | 30,874 | 25,341 | |||||||
Goodwill impairment |
— | 174,327 | — | |||||||
Write down of long-lived assets |
656 | 67,624 | 4,218 | |||||||
Curtailment gains on benefit plans |
— | (30,835 | ) | — | ||||||
Gain on sales and disposals of assets |
(1,003 | ) | (25,505 | ) | (702 | ) | ||||
Cancellation of incentive plan |
1,161 | — | — | |||||||
Write off of capitalized advisor fees |
413 | — | — | |||||||
(Gain) loss on early extinguishment of debt |
(38,921 | ) | 2,212 | — | ||||||
Increase in value of warrant |
81,088 | — | — | |||||||
Inventory write downs |
— | 16,500 | — | |||||||
Acquisitions integration costs |
— | 5,254 | 4,339 | |||||||
Tax impact of adjustments |
65 | (10,140 | ) | (1,138 | ) | |||||
Total adjustments |
66,049 | 240,229 | 40,849 | |||||||
Adjusted net income (loss) |
$ | (3,398 | ) | $ | (44,980 | ) | $ | 15,634 | ||
Adjusted EBITDA is calculated as follows (amounts in thousands):
| |
Fiscal Years Ended March 31, | |||||||||
|---|---|---|---|---|---|---|---|---|---|---|
| |
2010 | 2009(1) | 2008(1) | |||||||
Net loss |
$ | (69,447 | ) | $ | (285,209 | ) | $ | (25,215 | ) | |
Adjustments: |
||||||||||
Income tax expense (benefit) |
5,036 | (3,202 | ) | 5,111 | ||||||
Interest expense, net |
25,820 | 29,171 | 15,635 | |||||||
Depreciation and amortization |
52,644 | 58,125 | 52,375 | |||||||
Share-based compensation |
1,865 | 1,070 | 3,340 | |||||||
Increase in value of warrant |
81,088 | — | — | |||||||
Goodwill impairment |
— | 174,327 | — | |||||||
Write down of long-lived assets |
656 | 67,624 | 4,218 | |||||||
Gain on sales and disposals of assets |
(1,003 | ) | (25,505 | ) | (702 | ) | ||||
Curtailment gains on benefit plans |
— | (30,835 | ) | — | ||||||
(Gain) loss on early extinguishment of debt |
(38,921 | ) | 2,212 | — | ||||||
Foreign exchange transaction (gain) loss |
4,106 | (14,079 | ) | (5,316 | ) | |||||
Inventory write downs |
— | 16,500 | — | |||||||
Acquisitions integration costs |
— | 5,254 | 4,339 | |||||||
Restructuring charges |
9,198 | 30,874 | 25,341 | |||||||
Total adjustments |
140,489 | 311,536 | 104,341 | |||||||
Adjusted EBITDA |
$ | 71,042 | $ | 26,327 | $ | 79,126 | ||||
- (1)
- Certain prior periods have been adjusted to conform to current period presentation which is determined by management.
54
Adjusted operating income (loss) represents operating income (loss), excluding adjustments which are outlined in the quantitative reconciliation provided above. We use Adjusted operating income (loss) to facilitate our analysis and understanding of our business operations and believe that Adjusted operating income (loss) is useful to investors because it provides a supplemental way to understand the underlying operating performance of the Company. Adjusted operating income (loss) should not be considered as an alternative to operating income or any other performance measure derived in accordance with U.S. GAAP.
Adjusted net income (loss) represents net loss, excluding adjustments which are more specifically outlined in the quantitative reconciliation provided above. We use Adjusted net loss to evaluate the Company's operating performance and believe that Adjusted net loss is useful to investors because it provides a supplemental way to understand the underlying operating performance of the Company. Adjusted net loss should not be considered as an alternative to net income, operating income or any other performance measures derived in accordance with U.S. GAAP.
Adjusted EBITDA represents net income (loss) before income tax expense, interest expense, net, and depreciation and amortization, adjusted to exclude restructuring charges, impairment write-downs, share-based compensation expense, increase in value of warrant, gains on the curtailment of benefits, gain/loss on the disposal of assets, gain/loss on the early retirement of debt, foreign exchange transaction gain/loss, inventory write downs and acquisitions integration costs. We present Adjusted EBITDA as a supplemental measure of our performance and ability to service debt. We also present Adjusted EBITDA because we believe such measure is frequently used by securities analysts, investors and other interested parties in the evaluation of companies in our industry.
We believe Adjusted EBITDA is an appropriate supplemental measure of debt service capacity, because cash expenditures on interest are, by definition, available to pay interest, and tax expense is inversely correlated to interest expense because tax expense goes down as deductible interest expense goes up; depreciation and amortization are non-cash charges. The other items excluded from Adjusted EBITDA are excluded in order to better reflect our continuing operations.
In evaluating Adjusted EBITDA, you should be aware that in the future we may incur expenses similar to the adjustments noted above. Our presentation of Adjusted EBITDA should not be construed as an inference that our future results will be unaffected by these types of adjustments. Adjusted EBITDA is not a measurement of our financial performance under U.S. GAAP and should not be considered as an alternative to net income, operating income or any other performance measures derived in accordance with U.S. GAAP or as an alternative to cash flow from operating activities as a measure of our liquidity.
Our Adjusted EBITDA measure has limitations as an analytical tool, and you should not consider it in isolation or as a substitute for analysis of our results as reported under U.S. GAAP. Some of these limitations are:
- •
- it does not reflect our cash expenditures, future requirements for capital expenditures or contractual commitments;
- •
- it does not reflect changes in, or cash requirements for, our working capital needs;
- •
- it does not reflect the significant interest expense or the cash requirements necessary to service interest or principal
payments on our debt;
- •
- although depreciation and amortization are non-cash charges, the assets being depreciated and amortized will
often have to be replaced in the future, and our Adjusted EBITDA measure does not reflect any cash requirements for such replacements;
- •
- it is not adjusted for all non-cash income or expense items that are reflected in our statements of cash flows;
55
- •
- it does not reflect the impact of earnings or charges resulting from matters we consider not be indicative of our ongoing
operations;
- •
- it does not reflect limitations on or costs related to transferring earnings from our subsidiaries to us; and
- •
- other companies in our industry may calculate this measure differently than we do, limiting its usefulness as a comparative measure.
Because of these limitations, Adjusted EBITDA should not be considered as a measure of discretionary cash available to us to invest in the growth of our business or as a measure of cash that will be available to us to meet our obligations. You should compensate for these limitations by relying primarily on our U.S. GAAP results and using Adjusted EBITDA only supplementally.
Recent Accounting Pronouncements
In January 2010, the FASB issued Accounting Standard Update ("ASU") No. 2010-06, "Fair Value Measurements and Disclosures (Topic 820): Improving Disclosures about Fair Value Measurements". This ASU provides amendments to FASB ASC 820 which requires new disclosures related to assets measured at fair value. In addition, this ASU includes amendments to the guidance on employers' disclosures related to the classification of postretirement benefit plan assets and the related fair value measurement of those classifications. This update was effective December 15, 2009. The adoption of ASU No. 2010-06 did not have an impact on our consolidated results of operations or financial position.
In February 2010, the FASB issued ASU No. 2010-09, "Subsequent Events (Topic 855): Amendments to certain Recognition and Disclosure Requirements". An entity that is an SEC filer is not required to disclose the date through which subsequent events have been evaluated. This change alleviates potential conflicts between the ASC and the SEC's requirements. In addition, the scope of the "reissuance" disclosure requirements is refined to include revised financial statements only. This update was effective February 24, 2010. The adoption of ASU No. 2010-09 did not have a material impact on our consolidated financial position or results of operations.
In June 2009, the Financial Accounting Standards Board ("FASB") issued guidance which established the FASB Accounting Standards Codification ("FASB ASC") as the source of authoritative U.S. GAAP to be applied by nongovernmental entities, except for the rules and interpretive releases of the SEC under authority of federal securities laws, which are sources of authoritative U.S. GAAP for SEC registrants. All guidance contained in the codification carries an equal level of authority. The codification does not change U.S. GAAP. Instead, it takes the thousands of individual pronouncements that currently comprise U.S. GAAP and reorganizes them into approximately 90 accounting topics, and displays all topics using a consistent structure. Contents in each topic are further organized first by subtopic, then section and finally paragraph. The paragraph level is the only level that contains substantive content. Citing particular content in the codification involves specifying the unique numeric path to the content through the topic, subtopic, section and paragraph structure. The FASB ASC was effective for us in the second fiscal quarter of 2010 and superseded all existing non-SEC accounting and reporting standards. All non-grandfathered accounting not included in the FASB ASC will be considered non-authoritative. There was no impact on our consolidated financial statements upon adoption. However, this standard impacted our financial reporting as we use the new codification when referring to U.S. GAAP in our financial statements.
In May 2009, the FASB issued guidance which established general standards of accounting for and disclosure of events that occur after the balance sheet date but before financial statements are issued or are available to be issued. This guidance sets forth the period after the balance sheet date during which management should evaluate events or transactions that may occur for potential recognition or
56
disclosure in the financial statements, the circumstances under which an entity should recognize events or transactions occurring after the balance sheet date, and the disclosures that should be made about such events or transactions. This guidance was effective for reporting periods ending after June 15, 2009 and did not result in significant changes in subsequent events that an entity reports, either through recognition or disclosure, in our financial statements.
In April 2009, the FASB issued guidance which increased the frequency of fair value disclosures to a quarterly instead of an annual basis. This guidance was effective for interim and annual periods ending after June 15, 2009 or the first quarter of fiscal year 2010 for us. The adoption of this accounting guidance did not impact our consolidated results of operations or financial position.
In December 2008, the FASB staff issued FSP SFAS 132(R)-1, "Employers' Disclosures about Postretirement Benefit Plan Assets" (FASB ASC Topic 715-20-65-2). This guidance requires enhanced disclosures about plan assets of a defined benefit pension or other postretirement plan. We adopted this guidance for its March 31, 2010 annual report. The adoption of this guidance did not have a material effect on our consolidated results of operations or financial position.
In May 2008, the FASB issued guidance which required issuers of convertible debt that may be settled wholly or partly in cash when converted to account for the debt and equity components separately. This guidance was effective for fiscal years beginning after December 15, 2008, or fiscal year 2010 for us, and must be applied retrospectively to all periods presented. This guidance was retroactively adopted and is therefore reflected in all periods presented.
In April 2008, the FASB issued FSP FAS 142-3, "Determination of the Useful Life of Intangible Assets", ("FSP FAS 142-3") (FASB ASC Topic 350-30-65). This guidance amends the list of factors an entity should consider in developing renewal or extension assumptions when determining the useful life of recognized intangible assets under FASB No. 142 (FASB ASC Topic 350), "Goodwill and Other Intangible Assets". This guidance applies to (i) intangible assets that are acquired individually or with a group of other assets and (ii) intangible assets acquired in both business combinations and asset acquisitions. This guidance removes the requirement for an entity to consider whether an intangible asset can be renewed without substantial cost or material modifications to the existing terms and conditions. This guidance replaces the previous useful-live assessment criteria with a requirement that an entity consider its own experience in renewing similar arrangements. This guidance is effective for financial statements issued for fiscal years beginning after December 15, 2008 and must be applied prospectively only to intangible assets acquired after the FSP's effective date. We will adhere to this guidance for intangible assets acquired in the future (we did not acquire any intangible assets in fiscal year 2010).
In December 2007, the FASB issued SFAS No. 141R, "Business Combinations", now included within FASB ASC 805 "Business Combinations" ("FASB ASC 805"). FASB ASC 805 establishes principles and requirements for how an acquirer recognizes and measures in its financial statements the identifiable assets acquired, the liabilities assumed, any noncontrolling interest in the acquiree and the goodwill acquired. FASB ASC 805 also establishes disclosure requirements which will enable users to evaluate the nature and financial effects of the business combination. This standard is effective for fiscal years beginning after December 15, 2008 and early adoption was prohibited. The adoption did not have an impact on our consolidated results of operations or financial position.
In September 2007, the FASB issued guidance which addresses the determination of whether an instrument (or an embedded feature) is indexed to an entity's own stock, which is the first part of the scope exception in FASB ASC 815-10-15. If an instrument (or an embedded feature) that has the characteristics of a derivative instrument under FASB ASC 815-10-15 is indexed to an entity's own stock, it is still necessary to evaluate whether it is classified in stockholders' equity (or would be classified in stockholders' equity if it were a freestanding instrument). See Note 1, "Warrant Liability", for discussion of the impact of our adoption of this guidance as of April 1, 2009.
57
Effect of Inflation
Inflation generally affects us by increasing the cost of labor, equipment, and raw materials. We do not believe that inflation has had any material effect on our business over the past three fiscal years except for the following discussion in Commodity Price Risk.
ITEM 7A. QUANTITATIVE AND QUALITATIVE DISCLOSURES ABOUT MARKET RISK.
Interest Rate Risk
Subsequent to March 31, 2010, a majority of our variable interest debt was extinguished, see Note 18, "Subsequent Events" for further discussion. We are exposed to interest rate risk through our other borrowing activities, which had an outstanding balance as of March 31, 2010 of $13.6 million. The other debt has a variable interest rate and a 1% change in the interest rate would yield a $0.1 million change in interest expense.
Foreign Currency Exchange Rate Risk
Given our international operations and sales, we are exposed to movements in foreign exchange rates. Of these, the most significant are currently the Euro and the Mexican peso. A portion of our sales to our customers and operating costs in Europe are denominated in Euro creating an exposure to foreign currency exchange rates. Also, a portion of our costs in our Mexican operations are denominated in Mexican pesos, creating an exposure to foreign currency exchange rates. Additionally, certain of our non-U.S. subsidiaries make sales denominated in U.S. dollars which expose them to foreign currency transaction gains and losses. Historically, in order to minimize our exposure, we periodically entered into forward foreign exchange contracts in which the future cash flows were hedged against the U.S. dollar. In the event we were to establish a revolving line of credit or foreign exchange line of credit, we will consider entering into forward exchange contracts.
Commodity Price Risk
The principal raw materials used in the manufacture of our products are tantalum powder, palladium, aluminum and silver. These materials are considered commodities and are subject to price volatility. Due to market constraints, we no longer purchase tantalum powder under long-term contracts. Instead, we forecast our tantalum needs for the short-term (twelve weeks) and make purchases based upon those forecasts; we currently have purchase agreements outstanding three to six months. While the financial impact of these decisions are short-term in nature given that we are not currently party to any long-term supply agreements, they could impact our financial performance from period to period given that we do not hedge any of our raw material exposure and we may be unable to pass on to a significant number of our customers any fluctuations in our raw material costs. Additionally, any delays in obtaining raw materials for our products could hinder our ability to manufacture our products, negatively impacting our competitive position and our relationships with our customers.
Presently, a limited number of suppliers process tantalum ore into capacitor-grade tantalum powder. We believe the tantalum our operations require is generally available in sufficient quantities to meet our requirements and that there are a sufficient number of tantalum processors relative to foreseeable demand. Although limited, additional suppliers have emerged in the market. This fact, along with our effort to broaden the number of qualified suppliers, should minimize our commodity price risk exposure. However, an increase in the price of tantalum that we are unable to pass on to our customers, could have an adverse affect on our profitability.
Palladium is a precious metal used in the manufacture of multilayer ceramic capacitors and is mined primarily in Russia and South Africa. We are aggressively pursuing ways to reduce palladium
58
usage in ceramic capacitors in order to minimize the price risk. The amount of palladium that we require has generally been available in sufficient quantities, however of the price of palladium is driven by the market which has shown significant price fluctuations. For instance, in fiscal year 2009, the price of palladium fluctuated between $177 and $444 per troy ounce. Price increases and our inability to pass such increases on to our customers could have an adverse effect on profitability.
Silver and aluminum have generally been available in sufficient quantities, and we believe there are a sufficient number of suppliers from which we can purchase our requirements. In addition, while silver was previously primarily purchased on the spot and forward markets, we now manage silver inventory levels to maintain close to a zero balance in an effort to remain lean. An increase in the price of silver that we are unable to pass on to our customers, however, could have an adverse affect on our profitability.
ITEM 8. FINANCIAL STATEMENTS AND SUPPLEMENTARY DATA.
The response to this item is submitted as a separate section of this Form 10-K. See Item 15.
ITEM 9. CHANGES IN AND DISAGREEMENTS WITH ACCOUNTANTS ON ACCOUNTING AND FINANCIAL DISCLOSURE
None.
ITEM 9A. CONTROLS AND PROCEDURES.
Disclosure Controls and Procedures
As of March 31, 2010, an evaluation of the effectiveness of the Company's disclosure controls and procedures (as defined in Rule 13a-15(e) and 15d-15(e) promulgated under the Securities Exchange Act of 1934, as amended (the "Exchange Act")) was performed under the supervision and with the participation of the Company's management, including the Chief Executive Officer and Chief Financial Officer. Based on that evaluation, the Company's Chief Executive Officer and Chief Financial Officer have concluded that the Company's disclosure controls and procedures are effective to ensure that information required to be disclosed by the Company in its reports that it files or submits under the Exchange Act is recorded, processed, summarized and reported within the time periods specified in the Securities and Exchange Commission rules and forms, and that information required to be disclosed by the Company in the reports the Company files or submits under the Exchange Act is accumulated and communicated to the Company's management, including its Chief Executive Officer and Chief Financial Officer, as appropriate to allow timely decisions regarding required disclosure.
Internal Control over Financial Reporting
The Company's management is responsible for establishing and maintaining adequate internal control over financial reporting (as defined in Rule 13a-15(f) and 15d-15(f) promulgated under the Exchange Act). Internal control over financial reporting is a process, designed by, or under the supervision of, an entity's principal executive and principal financial officers, and effected by an entity's board of directors, management and other personnel, to provide reasonable assurance regarding the reliability of financial reporting and the preparation of consolidated financial statements for external purposes in accordance with generally accepted accounting principles. Internal control over financial reporting includes those policies and procedures that (1) pertain to the maintenance of records that, in reasonable detail, accurately and fairly reflect the transactions and the dispositions of the assets of the entity; (2) provide reasonable assurance that transactions are recorded as necessary to permit preparation of financial statements in accordance with generally accepted accounting principles, and that receipts and expenditures of the entity are being made only in accordance with authorizations of the management and directors of the entity; and (3) provide reasonable assurance regarding prevention
59
or timely detection of unauthorized acquisition, use, or disposition of the entity's assets that could have a material effect on its consolidated financial statements.
Because of its inherent limitations, internal control over financial reporting may not prevent or detect misstatements. Also, projections of any evaluation of effectiveness to future periods are subject to the risk that controls may become inadequate because of changes in conditions, or that the degree of compliance with the policies or procedures may deteriorate.
Under the supervision and with the participation of the Company's management, including the Company's Chief Executive Officer and Chief Financial Officer, the Company's management conducted an assessment of the effectiveness of its internal control over financial reporting based on the criteria set forth in the Internal Control—Integrated Framework issued by the Committee of Sponsoring Organizations of the Treadway Commission ("COSO").
Based on that assessment, as of March 31, 2010, the Company's management concluded that its internal control over financial reporting was effective.
Ernst & Young LLP, our independent registered public accounting firm has issued an attestation report on the Company's internal control over financial reporting, which is on page 71 of this annual report on Form 10-K.
(d) Changes in Internal Control over Financial Reporting
There was no change in the Company's internal control over financial reporting during the fiscal quarter ended March 31, 2010, that has materially affected, or is reasonably likely to materially affect, the Company's internal control over financial reporting.
None.
60
ITEM 10. DIRECTORS, EXECUTIVE OFFICERS, AND CORPORATE GOVERNANCE.
Audit Committee
KEMET has an Audit Committee made up of the following independent, non-management directors: Joseph V. Borruso, E. Erwin Maddrey, II (Chairman of Audit Committee), Wilfried Backes, and Robert G. Paul. Mr. Maddrey is KEMET's "Audit Committee Financial Expert"; however, both Dr. Backes and Mr. Paul have prior financial statement experience. Messrs. Maddrey and Paul have served on audit committees with other companies. The Charter for KEMET's Audit Committee (the "Charter") can be found in the Company's definitive proxy statement for its annual stockholders' meeting to be held on July 28, 2010, which is incorporated herein by reference. The Charter can also be downloaded, free of charge, from KEMET's website at http://www.kemet.com. KEMET has a Nominating and Corporate Governance Committee made up of the following independent, non-management directors: Gurminder S. Bedi (Chairman), E. Erwin Maddrey, II, Joseph D. Swann and Wilfried Backes.
Other Information
Other than the information under "Executive Officers" and "Key Employees" under Part I, Item 4A, the other information required by Item 10 is incorporated by reference from the Company's definitive proxy statement for its annual stockholders meeting to be held on July 28, 2010.
ITEM 11. EXECUTIVE COMPENSATION.
The information required by Item 11 is incorporated by reference from the Company's definitive proxy statement for its annual stockholders' meeting to be held on July 28, 2010. The information specified in Item 402(k) and (1) of Regulation S-K and set forth in the Company's definitive proxy statement for its annual stockholders' meeting to be held on July 28, 2010, is incorporated herein by reference.
ITEM 12. SECURITY OWNERSHIP OF CERTAIN BENEFICIAL OWNERS AND MANAGEMENT AND RELATED STOCKHOLDER MATTERS.
The information required by Item 12 is incorporated by reference from the Company's definitive proxy statement for its annual stockholders' meeting to be held on July 28, 2010, and from "Equity Compensation Plan Disclosure" in Item 5 hereof.
ITEM 13. CERTAIN RELATIONSHIPS AND RELATED TRANSACTIONS AND DIRECTOR INDEPENDENCE.
The information required by Item 13 is incorporated by reference from the Company's definitive proxy statement for its annual stockholders' meeting to be held on July 28, 2010.
ITEM 14. PRINCIPAL ACCOUNTANT FEES AND SERVICES.
The information required by Item 14 is incorporated by reference from the Company's definitive proxy statement for its annual stockholders' meeting to be held on July 28, 2010.
61
ITEM 15. EXHIBITS AND FINANCIAL STATEMENT SCHEDULES.
- (a)
- (1) Financial Statements
The following financial statements are filed as a part of this report:
- (a)
- (2) Financial Statement Schedules
Financial statement schedules are omitted because they are not applicable or because the required information is included in the consolidated financial statements or notes thereto.
- (a)
- (3) List of Exhibits
The following exhibits are filed herewith or are incorporated by reference to exhibits previously filed with the SEC:
| 2.1 | Asset and Share Purchase Agreement dated December 12, 2005, between EPCOS AG, KEMET Electronics GmbH, KEMET Electronics S.A., and KEMET Corporation (the "Company" or KEMET Corporation) (incorporated by reference to Exhibit 99.2 to the Company's Current Report on Form 8-K/A dated April 20, 2006). | ||
2.2 |
Amendment Agreement dated April 13, 2006, to the Asset and Share Purchase Agreement dated December 12, 2005 between EPCOS AG, KEMET Electronics GmbH, KEMET Electronics S.A., and the Company (incorporated by reference to Exhibit 99.7 to the Company's Current Report on Form 8-K/A dated April 20, 2006). |
||
2.3 |
Asset Purchase Agreement dated December 12, 2005, as amended on April 13, 2006, between EPCOS AG, KEMET Electronics (Suzhou) Co., Ltd., and the Company (incorporated by reference to Exhibit 99.3 to the Company's Current Report on Form 8-K/A dated April 20, 2006). |
||
2.4 |
Restated Heidenheim Manufacturing and Supply Agreement dated April 13, 2006, between EPCOS AG, EPCOS Portugal, the Company, and KEMET Electronics Corporation (incorporated by reference to Exhibit 99.4 to the Company's Current Report on Form 8-K/A dated April 20, 2006). |
||
2.5 |
Substitution Agreement (Asset and Share Purchase Agreement) dated April 13, 2006, between EPCOS AG, KEMET Electronics GmbH, KEMET Electronics S.A., the Company, and KEMET Electronics Corporation (incorporated by reference to Exhibit 99.5 to the Company's Current Report on Form 8-K/A dated April 20, 2006). |
62
| 2.6 | Substitution Agreement (regarding Asset Purchase Agreement dated December 12, 2005) dated April 13, 2006, between EPCOS AG, KEMET Electronics (Suzhou) Co., Ltd., KEMET Electronics Corporation, and the Company (incorporated by reference to Exhibit 99.6 to the Company's Current Report on Form 8-K/A dated April 20, 2006). | ||
2.7 |
Sale and Purchase Agreement dated August 10, 2007 between Blue Skye (Lux) S.a r.l. and KEMET Electronics Corporation (incorporated by reference to Exhibit 99.2 to the Company's Current Report on Form 8-K dated August 16, 2007). |
||
3.1 |
Restated Certificate of Incorporation of the Company, as amended to date (incorporated by reference to Exhibit 3.1 to the Company's Quarterly Report on Form 10-Q for the quarter ended December 31, 1992). |
||
3.2 |
Amended and Restated By-laws of KEMET Corporation, effective June 5, 2008 (incorporated by reference to Exhibit 3.2 to the Company's Current Report on Form 8-K dated June 3, 2008). |
||
4.1 |
Certificate representing shares of Common Stock of the Company (incorporated by reference to Exhibit 4.1 to the Company's Registration Statement on Form S-1 [Reg. No. 33-48056]). |
||
4.2 |
Registration Rights Agreement, dated as of November 1, 2006, by and among the Company, Credit Suisse Securities (USA) LLC, and Deutsche Bank Securities Inc. (incorporated by reference to Exhibit 4.2 to the Company's Registration Statement on Form S-3 [Reg. No. 333-140943] filed on February 28, 2007). |
||
4.3 |
Indenture, dated as of November 1, 2006, by and among the Company and Wilmington Trust Company, as Trustee (incorporated by reference to Exhibit 4.3 to the Company's Registration Statement on Form S-3 [Reg. No. 333-140943] filed on February 28, 2007). |
||
4.4 |
Form of 2.25% Convertible Senior Note due 2026 (included in Exhibit 4.3). |
||
4.5 |
Indenture, dated May 5, 2010, by and among the Company, certain subsidiary guarantors named therein and Wilmington Trust Company, as trustee (incorporated by reference to Exhibit 4.1 to the Company's Current Report on Form 8-K dated May 5, 2010). |
||
4.6 |
Registration Rights Agreement, dated May 5, 2010, by and among the Company, certain subsidiary guarantors named therein and the initial purchasers named therein (incorporated by reference to Exhibit 4.2 to the Company's Current Report on Form 8-K dated May 5, 2010). |
||
10.1 |
Registration Agreement, dated as of December 21, 1990, by and among the Company and each of the investors and executives listed on the schedule of investors and executives attached thereto (incorporated by reference to Exhibit 10.3 to the Company's Registration Statement on Form S-1 [Reg. No. 33-48056]). |
||
10.2 |
Form of Amendment No. 1 to Registration Agreement, dated as of April 28, 1994 (incorporated by reference to Exhibit 10.3.1 to the Company's Registration Statement on Form S-1 [Reg. No. 33-61898]). |
||
10.3 |
Services Agreement, dated as of December 21, 1990, as amended as of March 30, 1992, by and between the Company and KEMET Electronics Corporation (incorporated by reference to Exhibit 10.4 to the Company's Registration Statement on Form S-1 [Reg. No. 33-48056]). |
||
10.4 |
Form of Grant of Nonqualified Stock Option, dated April 6, 1992, by and between the Company and each of the executives listed on the schedule attached thereto (incorporated by reference to Exhibit 10.12.1 to the Company's Registration Statement on Form S-1 [Reg. No. 33-48056]).* |
||
10.5 |
Form of KEMET Electronics Corporation Distributor Agreement (incorporated by reference to Exhibit 10.16 to the Company's Registration Statement on Form S-1 [Reg. No. 33-48056]). |
63
| 10.6 | Form of KEMET Electronics Corporation Standard Order Acknowledgment, Quotation, and Volume Purchase Agreement (incorporated by reference to Exhibit 10.17 to the Company's Registration Statement on Form S-1 [Reg. No. 33-48056]). | ||
10.7 |
Form of KEMET Electronics Corporation Product Warranty (incorporated by reference to Exhibit 10.18 to the Company's Registration Statement on Form S-1 [Reg. No. 33-48056]). |
||
10.8 |
Amendment No. 1 to Stock Purchase and Sale Agreement, dated as of December 21, 1990. The Company agrees to furnish supplementally to the SEC a copy of any omitted schedule or exhibit to the Agreement upon Request by the SEC (incorporated by reference to Exhibit 10.20.1 to the Company's Registration Statement on Form S-1 [Reg. No. 33-48056]). |
||
10.9 |
Form of Deferred Compensation Plan for Key Managers effective as of January 1, 1995 (incorporated by reference to Exhibit 10.30 to the Company's Annual Report on Form 10-K for the year ended March 31, 1995).* |
||
10.10 |
Form of Collateral Assignment and Split Dollar Insurance (incorporated by reference to Exhibit 10.31 to the Company's Annual Report of Form 10-K for the year ended March 31, 1995). |
||
10.11 |
1995 Executive Stock Option Plan by and between the Company and each of the executives listed on the schedule attached thereto (incorporated by reference to Exhibit 10.33 to the Company's Annual Report on Form 10-K for the year ended March 31, 1996).* |
||
10.12 |
Executive Bonus Plan by and between the Company and each of the executives listed on the schedule attached thereto (incorporated by reference to Exhibit 10.34 to the Company's Annual Report on Form 10-K for the year ended March 31, 1996).* |
||
10.13 |
Amendment No. 2 to Services Agreement by and between the Company and KEMET Electronics Corporation (incorporated by reference to Exhibit 10.4.1 to the Company's Annual Report on Form 10-K for the year ended March 31, 1996). |
||
10.14 |
Amendment No. 3 to Services Agreement dated as of January 1, 1996, by and between the Company and KEMET Electronics Corporation (incorporated by reference to Exhibit 10.4.2 to the Company's Annual Report on Form 10-K for the year ended March 31, 1996). |
||
10.15 |
Amendment No. 4 to Services Agreement dated as of March 1, 1996, by and between the Company and KEMET Electronics Corporation (incorporated by reference to Exhibit 10.4.3 to the Company's Annual Report on Form 10-K for the year ended March 31, 1996). |
||
10.16 |
1992 Key Employee Stock Option Plan (incorporated by reference to Exhibit 10.16 to the Company's Annual Report on Form 10-K for the year ended March 31, 2009).* |
||
10.17 |
Amendment No. 1 to KEMET Corporation 1992 Key Employee Stock Option Plan effective October 23, 2000 (incorporated by reference to Exhibit 10.1 to the Company's Quarterly Report on Form 10-Q for the quarter ended December 31, 2000).* |
||
10.18 |
1992 Executive Stock Option Plan (incorporated by reference to Exhibit 10.12 to the Company's Registration Statement on Form S-1 [Reg. No. 33-48056]).* |
||
10.19 |
2004 Long-Term Equity Incentive Plan (incorporated by reference to Exhibit 4.3 to the Company's Registration Statement on Form S-8 [Reg. No. 333-123308]).* |
||
10.20 |
Purchase Agreement, dated as of November 1, 2006, by and among the Company, Credit Suisse Securities (USA) LLC, and Deutsche Bank Securities Inc. (incorporated by reference to Exhibit 1.01 to the Company's Registration Statement on Form S-3 [Reg. No. 333-140943] filed on February 28, 2007). |
64
| 10.21 | Amendment to the Compensation Plan of the Chief Executive Officer and other executive officers effective May 3, 2006 (incorporated by reference to the Company's Current Report on Form 8-K dated May 9, 2006).* | ||
10.22 |
Amendment to the Compensation Plan of the Chief Executive Officer and other executive officers effective July 19, 2006 (incorporated by reference to the Company's Current Report on Form 8-K dated July 25, 2006).* |
||
10.23 |
Amendment to the Compensation Plan of Chief Executive Officer and other executive officers effective March 28, 2007 (incorporated by reference to the Company's Current Report on Form 8-K dated April 3, 2007).* |
||
10.24 |
Amendment to the Compensation Plan of the Chief Executive Officer and other executive officers effective May 8, 2007 (incorporated by reference to the Company's Current Report on Form 8-K dated May 14, 2007).* |
||
10.25 |
Amendment to the Compensation Plan of the Chief Executive Officer and other executive officers effective May 16, 2007 (incorporated by reference to the Company's Current Report on Form 8-K dated May 23, 2007).* |
||
10.26 |
Amendment to the Compensation Plan of the Chief Executive Officer and other executive officers dated May 5, 2008 (incorporated by reference to the Company's Current Report on Form 8-K dated May 5, 2008).* |
||
10.27 |
Confidential Separation Agreement between David E. Gable and KEMET Corporation, dated as of June 1, 2008 (incorporated by reference to Exhibit 99.1 to the Company's Current Report on Form 8-K dated June 13, 2008).* |
||
10.28 |
Loan Agreement by Certified Private Agreement dated September 29, 2008 between UniCredit Corporate Banking S.p.A. and KEMET Corporation (English translation) (incorporated by reference to Exhibit 99.1 to the Company's Current Report on Form 8-K dated October 21, 2008). |
||
10.29 |
Mortgage Deed dated September 29, 2008 between UniCredit Corporate Banking S.p.A. and Arcotronics Industries S.r.l. (English translation) (incorporated by reference to Exhibit 99.2 to the Company's Current Report on Form 8-K dated October 21, 2008). |
||
10.30 |
Addendum dated April 3, 2009, to Mortgage Deed dated September 29, 2008 between UniCredit Corporate Banking S.p.A. and Arcotronics Industries S.r.l. (English translation) (incorporated by reference to Exhibit 10.29 to the Company's Annual Report on Form 10-K for the year ended March 31, 2009). |
||
10.31 |
Deed of Pledge of Stocks dated October 21, 2008 among UniCredit Corporate Banking S.p.A., KEMET Electronics Corporation and Arcotronics Italia S.p.A. (English translation) (incorporated by reference to Exhibit 99.3 to the Company's Current Report on Form 8-K dated October 21, 2008). |
||
10.32 |
Deed of Pledge of Shares dated October 21, 2008 among UniCredit Corporate Banking S.p.A., Arcotronics Italia S.p.A. and Arcotronics Industries S.r.l. (English translation) (incorporated by reference to Exhibit 99.4 to the Company's Current Report on Form 8-K dated October 21, 2008). |
||
10.33 |
Deed of Assignment of Credit for Guaranty Purposes dated October 21, 2008 among UniCredit Corporate Banking S.p.A., KEMET Corporation, KEMET Electronics Corporation, Arcotronics Italia S.p.A., Arcotronics Industries S.r.l., Arcotronics Hightech S.r.l. and Arcotronics Technologies S.r.l. (English translation) (incorporated by reference to Exhibit 99.5 to the Company's Current Report on Form 8-K dated October 21, 2008). |
65
| 10.34 | Letter of Extension Agreement dated April 3, 2009 to Credit Line Granted by UniCredit Corporate Banking S.p.A. to KEMET Corporation dated October, 2007 (incorporated by reference to Exhibit 10.33 to the Company's Annual Report on Form 10-K for the year ended March 31, 2009). | ||
10.35 |
Loan Agreement, dated as of September 15, 2008 between KEMET Electronics Corporation and Vishay Intertechnology, Inc. (incorporated by reference to Exhibit 10.6 to the Company's Quarterly Report Form 10-Q for the quarter ended September 30, 2008). |
||
10.36 |
Pledge and Security Agreement, dated as of September 15, 2008 made by KEMET Electronics Corporation in favor of Vishay Intertechnology, Inc. (incorporated by reference to Exhibit 10.7 to the Company's Quarterly Report on Form 10-Q for the quarter ended September 30, 2008). |
||
10.37 |
Asset Purchase Agreement, dated as of September 15, 2008, by and between KEMET Electronics Corporation and Siliconix Technology C.V. (incorporated by reference to Exhibit 10.8 to the Company's Quarterly Report on Form 10-Q for the quarter ended September 30, 2008). |
||
10.38 |
Summary of Non-Employee Director Compensation (incorporated by reference to Exhibit 10.1 to the Company's Quarterly Report on Form 10-Q for the quarter ended December 31, 2008).* |
||
10.39 |
Form of Indemnification Agreement (incorporated by reference to Exhibit 10.1 to the Company's Current Report on Form 8-K dated April 22, 2009).* |
||
10.40 |
Credit Agreement, dated as of May 5, 2009, by and among the Company, K Financing, LLC and the other guarantor parties thereto (incorporated by reference to Exhibit (b)(1) filed with the Company's Schedule TO, filed on May 5, 2009). |
||
10.41 |
Amended and Restated Credit Agreement, dated as of June 7, 2009, by and among the Company, K Financing, LLC and the other parties thereto (incorporated by reference to Exhibit (b)(1) filed with the Company's Amendment No. 3 to Schedule TO, filed on June 8, 2009). |
||
10.42 |
Amendment No. 1 to Amended and Restated Credit Agreement entered into on June 7, 2009, by and among the Company, K Financing, LLC and the other parties thereto, dated June 21, 2009 (incorporated by reference to Exhibit (b)(2) filed with the Company's Amendment No. 5 to Schedule TO, filed with the SEC on June 22, 2009). |
||
10.43 |
Amendment No. 2 to Amended and Restated Credit Agreement entered into on June 7, 2009, by and among the Company, K Financing, LLC and other parties thereto, dated September 30, 2009 (incorporated by reference to Exhibit 10.1 to the Company's Current Report on Form 8-K, filed on October 6, 2009). |
||
10.44 |
Amendment Agreement to the Credit Line Agreement entered into on October 3, 2007 by and between UniCredit Corporate Banking S.p.A. and the Company, dated April 30, 2009 (incorporated by reference to Exhibit (d)(12) filed with the Company's Schedule TO, filed on June 15, 2009). |
||
10.45 |
Amendment to the Credit Line Agreement entered into on October 3, 2007 as amended on April 30, 2009 and May 25, 2009, by and between UniCredit Corporate Banking S.p.A. and the Company, dated May 25, 2009 (incorporated by reference to Exhibit (d)(13) filed with the Company's Schedule TO, filed on June 15, 2009). |
||
10.46 |
Amendment to the Loan Agreement entered into on April 30, 2009, by and between UniCredit Corporate Banking S.p.A. and the Company, dated June 1, 2009 (incorporated by reference to Exhibit (d)(14) filed with the Company's Schedule TO, filed on June 15, 2009). |
66
| 10.47 | Commitment Letter to the Company by UniCredit Corporate Banking S.p.A., dated April 30, 2009 (incorporated by reference to Exhibit (d)(15) filed with the Company's Schedule TO, filed on June 15, 2009). | ||
10.48 |
Amendment to the Loan Agreement by Certified Private Agreement entered into September 29, 2008 by and between UniCredit Corporate Banking S.p.A. and the Company, dated April 30, 2009 (English translation) (incorporated by reference to Exhibit (d)(16) filed with the Company's Schedule TO, filed on June 15, 2009). |
||
10.49 |
Amendment to the Loan Agreement by Certified Private Agreement entered into September 29, 2008 as amended on April 30, 2009 by and between UniCredit Corporate Banking S.p.A. and the Company, dated June 1, 2009 (English translation) (incorporated by reference to Exhibit (d)(17) filed with the Company's Schedule TO, filed on June 15, 2009). |
||
10.50 |
Amendment No. 2 to Amended and Restated Credit Agreement entered into on June 7, 2009, by and among the Company, K Financing, LLC and other parties thereto, dated September 30, 2009 (incorporated by reference to Exhibit 10.1 to the Company's Current Report on Form 8-K dated September 30, 2009). |
||
10.51 |
Amendment to the Loan Agreement by Certified Private Agreement entered into September 29, 2008 by and between UniCredit Corporate Banking S.p.A. and the Company, dated October 1, 2009 (English translation) (incorporated by reference to Exhibit 10.2 to the Company's Current Report on Form 8-K dated September 30, 2009). |
||
10.52 |
Amendment to the Compensation Plan of the Company's executive officers (incorporated by reference to the Company's Current Report on Form 8-K dated July 29, 2009).* |
||
10.53 |
Warrant to Purchase Common Stock, dated June 30, 2009, issued by the Company to K Financing, LLC (incorporated by reference to Exhibit 10.1 to the Company's Current Report on Form 8-K dated June 30, 2009). |
||
10.54 |
Investor Rights Agreement, dated June 30, 2009, between the Company and K Financing, LLC (incorporated by reference to Exhibit 10.2 to the Company's Current Report on Form 8-K dated June 30, 2009). |
||
10.55 |
Corporate Advisory Services Agreement, dated June 30, 2009, between the Company and Platinum Equity Advisors, LLC (incorporated by reference to Exhibit 10.3 to the Company's Current Report on Form 8-K dated June 30, 2009). |
||
10.56 |
Purchase Agreement, dated April 21, 2010, by and among the Company, certain subsidiary guarantors named therein and Banc of America Securities LLC, as representative of the several initial purchasers (incorporated by reference to Exhibit 10.1 to the Company's Current Report on Form 8-K dated April 21, 2010). |
||
10.57 |
Employment Agreement between the Company and Per Olof-Lööf dated January 27, 2010 (incorporated by reference to Exhibit 10.1 to the Company's Current Report on Form 8-K dated January 27, 2010).* |
||
10.58 |
Change in Control Severance Compensation Agreement dated July 28, 2008, between the Company and Per-Olof Lööf (incorporated by reference to Exhibit 10.45 to the Company's Annual Report on Form 10-K for the year ended March 31, 2009).* |
||
10.59 |
Change in Control Severance Compensation Agreement dated July 28, 2008, between the Company and William M. Lowe, Jr. (incorporated by reference to Exhibit 10.46 to the Company's Annual Report on Form 10-K for the year ended March 31, 2009).* |
67
| 10.60 | Change in Control Severance Compensation Agreement dated September 8, 2008, between the Company and Robert Argüelles (incorporated by reference to Exhibit 10.47 to the Company's Annual Report on Form 10-K for the year ended March 31, 2009).* | ||
10.61 |
Change in Control Severance Compensation Agreement dated July 28, 2008, between the Company and Conrado Hinojosa (incorporated by reference to Exhibit 10.48 to the Company's Annual Report on Form 10-K for the year ended March 31, 2009).* |
||
10.62 |
Change in Control Severance Compensation Agreement dated July 28, 2008, between the Company and Marc Kotelon (incorporated by reference to Exhibit 10.49 to the Company's Annual Report on Form 10-K for the year ended March 31, 2009).* |
||
10.63 |
Change in Control Severance Compensation Agreement dated July 28, 2008, between the Company and Charles C. Meeks, Jr. (incorporated by reference to Exhibit 10.50 to the Company's Annual Report on Form 10-K for the year ended March 31, 2009).* |
||
10.64 |
Change in Control Severance Compensation Agreement dated July 28, 2008, between the Company and Kirk D. Shockley (incorporated by reference to Exhibit 10.51 to the Company's Annual Report on Form 10-K for the year ended March 31, 2009).* |
||
10.65 |
Change in Control Severance Compensation Agreement dated July 28, 2008, between the Company and Daniel E. LaMorte (incorporated by reference to Exhibit 10.52 to the Company's Annual Report on Form 10-K for the year ended March 31, 2009).* |
||
10.66 |
Change in Control Severance Compensation Agreement dated July 28, 2008, between the Company and Dr. Philip M. Lessner (incorporated by reference to Exhibit 10.53 to the Company's Annual Report on Form 10-K for the year ended March 31, 2009).* |
||
10.67 |
Change in Control Severance Compensation Agreement dated July 28, 2008, between the Company and Larry C. McAdams (incorporated by reference to Exhibit 10.54 to the Company's Annual Report on Form 10-K for the year ended March 31, 2009).* |
||
10.68 |
Change in Control Severance Compensation Agreement dated July 28, 2008, between the Company and Daniel F. Persico (incorporated by reference to Exhibit 10.55 to the Company's Annual Report on Form 10-K for the year ended March 31, 2009).* |
||
10.69 |
Second Amended and Restated KEMET Corporation Deferred Compensation Plan (incorporated by reference to Exhibit 10.56 to the Company's Annual Report on Form 10-K for the year ended March 31, 2009).* |
||
14.1 |
KEMET Corporation's Code of Business Integrity and Ethics (incorporated by reference to Exhibit 10.19 to the Company's Annual Report on Form 10-K for the year ended March 31, 2007). |
||
14.2 |
KEMET Corporation's Global Code of Conduct (incorporated by reference to Exhibit 14.1 to the Company's Current Report on Form 8-K dated May 3, 2010). |
||
21.1 |
Subsidiaries of KEMET Corporation |
||
23.1 |
Consent of Independent Registered Public Accounting Firm, Ernst & Young LLP |
||
23.2 |
Consent of Independent Registered Public Accounting Firm, KPMG LLP |
||
23.3 |
Consent of Independent Registered Public Accounting Firm, Deloitte & Touche S.P.A. |
||
31.1 |
Certification of the Chief Executive Officer Pursuant to Section 302 |
||
31.2 |
Certification of the Chief Financial Officer Pursuant to Section 302 |
||
32.1 |
Certification of the Chief Executive Officer Pursuant to Section 906 |
68
| 32.2 | Certification of the Chief Financial Officer Pursuant to Section 906 |
- *
- Exhibit is a management contract or a compensatory plan or arrangement.
69
Report of Independent Registered Public Accounting Firm
The Board of Directors and Stockholders of KEMET Corporation
We have audited the accompanying consolidated balance sheet of KEMET Corporation and subsidiaries as of March 31, 2010 and the related consolidated statements of operations, stockholders' equity and comprehensive income (loss), and cash flows for the year then ended. These financial statements are the responsibility of the Company's management. Our responsibility is to express an opinion on these financial statements based on our audit.
We conducted our audit in accordance with the standards of the Public Company Accounting Oversight Board (United States). Those standards require that we plan and perform the audit to obtain reasonable assurance about whether the financial statements are free of material misstatement. An audit includes examining, on a test basis, evidence supporting the amounts and disclosures in the financial statements. An audit also includes assessing the accounting principles used and significant estimates made by management, as well as evaluating the overall financial statement presentation. We believe that our audit provides a reasonable basis for our opinion.
In our opinion, the financial statements referred to above present fairly, in all material respects, the consolidated financial position of KEMET Corporation and subsidiaries at March 31, 2010, and the consolidated results of their operations and their cash flows for the year then ended, in conformity with U.S. generally accepted accounting principles.
We also have audited, in accordance with the standards of the Public Company Accounting Oversight Board (United States), KEMET Corporation's internal control over financial reporting as of March 31, 2010, based on criteria established in Internal Control—Integrated Framework issued by the Committee of Sponsoring Organizations of the Treadway Commission and our report dated May 25, 2010 expressed an unqualified opinion thereon.
| /s/ Ernst & Young LLP |
Greenville,
South Carolina
May 25, 2010
70
Report of Independent Registered Public Accounting Firm
The Board of Directors and Stockholders of KEMET Corporation
We have audited KEMET Corporation's internal control over financial reporting as of March 31, 2010, based on criteria established in Internal Control—Integrated Framework issued by the Committee of Sponsoring Organizations of the Treadway Commission (the COSO criteria). KEMET Corporation's management is responsible for maintaining effective internal control over financial reporting, and for its assessment of the effectiveness of internal control over financial reporting included in the accompanying Management's Report on Internal Control Over Financial Reporting. Our responsibility is to express an opinion on the company's internal control over financial reporting based on our audit.
We conducted our audit in accordance with the standards of the Public Company Accounting Oversight Board (United States). Those standards require that we plan and perform the audit to obtain reasonable assurance about whether effective internal control over financial reporting was maintained in all material respects. Our audit included obtaining an understanding of internal control over financial reporting, assessing the risk that a material weakness exists, testing and evaluating the design and operating effectiveness of internal control based on the assessed risk, and performing such other procedures as we considered necessary in the circumstances. We believe that our audit provides a reasonable basis for our opinion.
A company's internal control over financial reporting is a process designed to provide reasonable assurance regarding the reliability of financial reporting and the preparation of financial statements for external purposes in accordance with generally accepted accounting principles. A company's internal control over financial reporting includes those policies and procedures that (1) pertain to the maintenance of records that, in reasonable detail, accurately and fairly reflect the transactions and dispositions of the assets of the company; (2) provide reasonable assurance that transactions are recorded as necessary to permit preparation of financial statements in accordance with generally accepted accounting principles, and that receipts and expenditures of the company are being made only in accordance with authorizations of management and directors of the company; and (3) provide reasonable assurance regarding prevention or timely detection of unauthorized acquisition, use, or disposition of the company's assets that could have a material effect on the financial statements.
Because of its inherent limitations, internal control over financial reporting may not prevent or detect misstatements. Also, projections of any evaluation of effectiveness to future periods are subject to the risk that controls may become inadequate because of changes in conditions, or that the degree of compliance with the policies or procedures may deteriorate.
In our opinion, KEMET Corporation maintained, in all material respects, effective internal control over financial reporting as of March 31, 2010, based on the COSO criteria.
We also have audited, in accordance with the standards of the Public Company Accounting Oversight Board (United States), the consolidated balance sheet of KEMET Corporation and subsidiaries as of March 31, 2010, and the related consolidated statements of operations, stockholders' equity, and cash flows for the year then ended, and our report dated May 25, 2010 expressed an unqualified opinion thereon.
| /s/ Ernst & Young LLP |
Greenville,
South Carolina
May 25, 2010
71
Report of Independent Registered Public Accounting Firm
The
Board of Directors
KEMET Corporation:
We have audited the accompanying consolidated balance sheet of KEMET Corporation and subsidiaries as of March 31, 2009, and the related consolidated statements of operations, stockholders' equity and comprehensive income (loss), and cash flows for each of the years in the two-year period ended March 31, 2009. These consolidated financial statements are the responsibility of the Company's management. Our responsibility is to express an opinion on these consolidated financial statements based on our audits. We did not audit the consolidated financial statements of Arcotronics Italia S.p.A and subsidiaries (Arcotronics Group), a wholly-owned subsidiary, which statements reflect total assets constituting approximately 20 percent in 2009, and total net sales constituting approximately 19 percent and 10 percent in 2009 and 2008, respectively, of the related consolidated totals. Those statements were audited by other auditors whose report has been furnished to us, and our opinion, insofar as it relates to the amounts included for Arcotronics Group, is based solely on the report of the other auditors.
We conducted our audits in accordance with the standards of the Public Company Accounting Oversight Board (United States). Those standards require that we plan and perform the audit to obtain reasonable assurance about whether the financial statements are free of material misstatement. An audit includes examining, on a test basis, evidence supporting the amounts and disclosures in the financial statements. An audit also includes assessing the accounting principles used and significant estimates made by management, as well as evaluating the overall financial statement presentation. We believe that our audits and the report of the other auditors provide a reasonable basis for our opinion.
In our opinion, based on our audits and the report of the other auditors, the consolidated financial statements referred to above present fairly, in all material respects, the financial position of KEMET Corporation and subsidiaries as of March 31, 2009, and the results of their operations and their cash flows for each of the years in the two-year period ended March 31, 2009 in conformity with U.S. generally accepted accounting principles.
As discussed in Note 10 to the consolidated financial statements as previously filed November 5, 2009, the Company adopted the provisions of FASB Interpretation No. 48, Accounting for Uncertainty in Income Taxes-an interpretation of FASB Statement No. 109), as of April 1, 2007.
As discussed in Note 2b to the consolidated financial statements as previously filed November 5, 2009, the Company adopted the provisions of FASB Staff Position No. APB 14-1, Accounting for Convertible Debt Instruments That May Be Settled in Cash upon Conversion (Including Partial Cash Settlement), as of April 1, 2009, and accordingly, adjusted the previously issued consolidated balance sheets as of March 31, 2009 and 2008 and related statements of operations, stockholders' equity and comprehensive income (loss) and cash flows for each of the years in the three-year period ended March 31, 2009.
The accompanying consolidated financial statements have been prepared assuming that the Company will continue as a going concern. As discussed in Note 2a to the consolidated financial statements as previously filed November 5, 2009, the Company has experienced a decline in net sales, profitability and liquidity during the year ended March 31, 2009. As further disclosed in Note 2a, the Company currently forecasts that it will meet the financial covenants required by its debt agreements with lenders at each of the measurement dates during fiscal year 2010. Given the degree of uncertainty with respect to the near-term outlook for the global economy and the possible effects on the Company's operations, there is significant uncertainty as to whether the Company's forecasts will be achieved. Furthermore, the Company currently anticipates that it will continue to experience severe pressure on its liquidity during fiscal year 2010. These matters raise substantial doubt about the Company's ability to continue as a going concern. Management's plans in regard to these matters are
72
also described in Note 2a to the consolidated financial statements as previously filed November 5, 2009. The consolidated financial statements do not include any adjustments that might result from the outcome of this uncertainty.
| /s/ KPMG LLP KPMG LLP |
Greenville, South Carolina
June 30, 2009, except with respect to the change in accounting for convertible debt to reflect the adoption of the provisions of FASB Staff Position No. APB 14-1, as to which the date is as of November 5, 2009.
73
REPORT OF INDEPENDENT REGISTERED PUBLIC ACCOUNTING FIRM
To the Board of Directors and Stockholder of
ARCOTRONICS ITALIA S.p.A.
Sasso Marconi, Italy
We have audited the consolidated balance sheets of Arcotronics Italia S.p.A. and subsidiaries (the "Company") (a wholly owned subsidiary of KEMET Electronics Corporation, the "Parent Company") as of March 31, 2009, and the related consolidated statements of operations, stockholders' equity (deficit), and cash flows for the year ended March 31, 2009 and the period from October 12, 2007 (acquisition date) to March 31, 2008 (all expressed in euros and not separately presented herein). These financial statements are the responsibility of the Company's management. Our responsibility is to express an opinion on these financial statements based on our audits.
We conducted our audits in accordance with the standards of the Public Company Accounting Oversight Board (United States). Those standards require that we plan and perform the audit to obtain reasonable assurance about whether the financial statements are free of material misstatement. An audit includes examining, on a test basis, evidence supporting the amounts and disclosures in the financial statements. An audit also includes assessing the accounting principles used and significant estimates made by management, as well as evaluating the overall financial statement presentation. We believe that our audits provide a reasonable basis for our opinion.
In our opinion, such consolidated financial statements present fairly, in all material respects, the financial position of Arcotronics Italia S.p.A. and subsidiaries as of March 31, 2009, and the results of their operations and their cash flows for the year ended March 31, 2009 and the period from October 12, 2007 (acquisition date) to March 31, 2008, in conformity with accounting principles generally accepted in the United States of America.
The consolidated financial statements for the year ended March 31, 2009, have been prepared assuming that the Company will continue as a going concern. As discussed in Note 3 to the consolidated financial statements, the Company's recurring losses from operations, stockholders' deficit, and inability to generate sufficient cash flow to meet its obligations and sustain its operations, including restructuring plans, raise substantial doubt about its ability to continue as a going concern. Management's plans concerning these matters are also discussed in Note 3 to the consolidated financial statements. The consolidated financial statements do not include any adjustments that might result from the outcome of this uncertainty.
DELOITTE & TOUCHE S.p.A.
/s/
DELOITTE & TOUCHE S.p.A.
Bologna, Italy
June 29, 2009
74
KEMET CORPORATION AND SUBSIDIARIES
Consolidated Balance Sheets
(Amounts in thousands except per share data)
| |
March 31, | ||||||||
|---|---|---|---|---|---|---|---|---|---|
| |
2010 | 2009 | |||||||
ASSETS |
|||||||||
Current assets: |
|||||||||
Cash and cash equivalents |
$ | 79,199 | $ | 39,204 | |||||
Accounts receivable, net |
141,795 | 120,139 | |||||||
Inventories, net |
150,508 | 154,981 | |||||||
Prepaid and other current assets |
14,380 | 11,245 | |||||||
Deferred income taxes |
2,129 | 151 | |||||||
Total current assets |
388,011 | 325,720 | |||||||
Property, plant and equipment, net |
319,878 | 357,977 | |||||||
Intangible assets, net |
21,806 | 24,094 | |||||||
Other assets |
11,266 | 6,360 | |||||||
Total assets |
$ | 740,961 | $ | 714,151 | |||||
LIABILITIES AND STOCKHOLDERS' EQUITY |
|||||||||
Current liabilities: |
|||||||||
Current portion of long-term debt |
$ | 17,880 | $ | 25,994 | |||||
Accounts payable |
78,829 | 49,864 | |||||||
Accrued expenses |
63,606 | 53,593 | |||||||
Income taxes payable |
1,096 | 1,127 | |||||||
Total current liabilities |
161,411 | 130,578 | |||||||
Long-term debt |
231,629 | 280,752 | |||||||
Other non-current obligations |
55,626 | 57,316 | |||||||
Deferred income taxes |
8,023 | 5,466 | |||||||
Commitments and contingencies |
|||||||||
Stockholders' equity: |
|||||||||
Common stock, par value $0.01, authorized 300,000, shares issued 88,525 shares at March 31, 2010 and 2009, respectively |
885 | 885 | |||||||
Additional paid-in capital |
479,115 | 367,257 | |||||||
Retained deficit |
(150,789 | ) | (81,342 | ) | |||||
Accumulated other comprehensive income |
11,990 | 12,663 | |||||||
Treasury stock, at cost (7,390 and 7,714 shares at March 31, 2010 and 2009, respectively) |
(56,929 | ) | (59,424 | ) | |||||
Total stockholders' equity |
284,272 | 240,039 | |||||||
Total liabilities and stockholders' equity |
$ | 740,961 | $ | 714,151 | |||||
See accompanying notes to consolidated financial statements.
75
KEMET CORPORATION AND SUBSIDIARIES
Consolidated Statements of Operations
(Amounts in thousands except per share data)
| |
Fiscal Years Ended March 31, | ||||||||||||
|---|---|---|---|---|---|---|---|---|---|---|---|---|---|
| |
2010 | 2009 | 2008 | ||||||||||
Net sales |
$ | 736,335 | $ | 804,385 | $ | 850,120 | |||||||
Operating costs and expenses: |
|||||||||||||
Cost of sales |
611,638 | 736,551 | 696,806 | ||||||||||
Selling, general and administrative expenses |
86,085 | 93,505 | 97,639 | ||||||||||
Research and development |
22,064 | 28,956 | 35,699 | ||||||||||
Restructuring charges |
9,198 | 30,874 | 25,341 | ||||||||||
Goodwill impairment |
— | 174,327 | — | ||||||||||
Write down of long-lived assets |
656 | 67,624 | 4,218 | ||||||||||
Net gain on sales and disposals of assets |
(1,003 | ) | (25,505 | ) | (702 | ) | |||||||
Curtailment gains on benefit plans |
— | (30,835 | ) | — | |||||||||
Total operating costs and expenses |
728,638 | 1,075,497 | 859,001 | ||||||||||
Operating income (loss) |
7,697 | (271,112 | ) | (8,881 | ) | ||||||||
Other (income) expense: |
|||||||||||||
Interest income |
(188 | ) | (618 | ) | (6,061 | ) | |||||||
Interest expense |
26,008 | 29,789 | 21,696 | ||||||||||
Increase in value of warrant |
81,088 | — | — | ||||||||||
(Gain) loss on early extinguishment of debt |
(38,921 | ) | 2,212 | — | |||||||||
Other (income) expense, net |
4,121 | (14,084 | ) | (4,412 | ) | ||||||||
Loss before income taxes |
(64,411 | ) | (288,411 | ) | (20,104 | ) | |||||||
Income tax expense (benefit) |
5,036 | (3,202 | ) | 5,111 | |||||||||
Net loss |
$ | (69,447 | ) | $ | (285,209 | ) | $ | (25,215 | ) | ||||
Net loss per share: |
|||||||||||||
Basic and diluted |
$ | (0.86 | ) | $ | (3.54 | ) | $ | (0.30 | ) | ||||
See accompanying notes to consolidated financial statements.
76
KEMET CORPORATION AND SUBSIDIARIES
Consolidated Statements of Changes in Stockholders' Equity and Comprehensive Income (Loss)
(Amounts in thousands)
| |
Shares Outstanding |
Common Stock |
Additional Paid-In Capital |
Retained Earnings (Deficit) |
Accumulated Other Comprehensive Income (Loss) |
Treasury Stock |
Total Stock- holders' Equity |
||||||||||||||||
|---|---|---|---|---|---|---|---|---|---|---|---|---|---|---|---|---|---|---|---|---|---|---|---|
Balance at March 31, 2007 |
83,752 | $ | 882 | $ | 365,411 | $ | 225,427 | $ | 30,418 | $ | (44,719 | ) | $ | 577,419 | |||||||||
Adjustment to adopt FASB ASC 740-10 |
— | — | — | 3,655 | — | — | 3,655 | ||||||||||||||||
Comprehensive income (loss): |
|||||||||||||||||||||||
Net loss |
— | — | — | (25,215 | ) | — | — | (25,215 | ) | ||||||||||||||
Unrealized gain (loss) on foreign exchange contracts, net |
— | — | — | — | (91 | ) | — | (91 | ) | ||||||||||||||
Changes in pension net prior service credit and actuarial gains, net |
— | — | — | — | 154 | — | 154 | ||||||||||||||||
Changes in retirement plan net prior service credit and actuarial gains, net |
— | — | — | — | (1,213 | ) | — | (1,213 | ) | ||||||||||||||
Foreign currency translation |
— | — | — | — | 35,205 | — | 35,205 | ||||||||||||||||
Mark to market U.S. treasuries |
— | — | — | — | 1,092 | — | 1,092 | ||||||||||||||||
Total comprehensive income |
9,932 | ||||||||||||||||||||||
Exercise of stock options |
22 | — | (91 | ) | — | — | 222 | 131 | |||||||||||||||
Stock-based compensation expense |
— | — | 3,340 | — | — | — | 3,340 | ||||||||||||||||
Vesting of restricted stock |
150 | — | (1,524 | ) | — | — | 1,524 | — | |||||||||||||||
Purchases of stock by employee savings plan |
85 | — | 575 | — | — | — | 575 | ||||||||||||||||
Treasury stock repurchase |
(3,719 | ) | — | — | — | — | (18,221 | ) | (18,221 | ) | |||||||||||||
Balance at March 31, 2008 |
80,290 | 882 | 367,711 | 203,867 | 65,565 | (61,194 | ) | 576,831 | |||||||||||||||
Comprehensive income (loss): |
|||||||||||||||||||||||
Net loss |
— | — | — | (285,209 | ) | — | — | (285,209 | ) | ||||||||||||||
Unrealized gain (loss) on foreign exchange contracts, net |
— | — | — | — | (763 | ) | — | (763 | ) | ||||||||||||||
Changes in pension net prior service credit and actuarial gains, net |
— | — | — | — | (2,677 | ) | — | (2,677 | ) | ||||||||||||||
Changes in retirement plan net prior service credit and actuarial gains, net |
— | — | — | — | (19,209 | ) | — | (19,209 | ) | ||||||||||||||
Foreign currency translation |
— | — | — | — | (30,253 | ) | — | (30,253 | ) | ||||||||||||||
Total comprehensive loss |
(338,111 | ) | |||||||||||||||||||||
Stock-based compensation expense |
— | — | 1,070 | — | — | — | 1,070 | ||||||||||||||||
Vesting of restricted stock |
236 | — | (1,770 | ) | — | — | 1,770 | — | |||||||||||||||
Purchases of stock by employee savings plan |
285 | 3 | 246 | — | — | — | 249 | ||||||||||||||||
Balance at March 31, 2009 |
80,811 | 885 | 367,257 | (81,342 | ) | 12,663 | (59,424 | ) | 240,039 | ||||||||||||||
Comprehensive income (loss): |
|||||||||||||||||||||||
Net loss |
— | — | — | (69,447 | ) | — | — | (69,447 | ) | ||||||||||||||
Changes in pension net prior service credit and actuarial gains, net |
— | — | — | — | (560 | ) | — | (560 | ) | ||||||||||||||
Changes in retirement plan net prior service credit and actuarial gains, net |
— | — | — | — | (2,090 | ) | — | (2,090 | ) | ||||||||||||||
Foreign currency translation |
— | — | — | — | 1,977 | — | 1,977 | ||||||||||||||||
Total comprehensive loss |
(70,120 | ) | |||||||||||||||||||||
Issuance of warrant |
— | — | 112,488 | 112,488 | |||||||||||||||||||
Stock-based compensation expense |
— | — | 1,865 | — | — | — | 1,865 | ||||||||||||||||
Vesting of restricted stock |
324 | — | (2,495 | ) | — | — | 2,495 | — | |||||||||||||||
Purchases of stock by employee savings plan |
— | — | — | — | — | — | — | ||||||||||||||||
Balance at March 31, 2010 |
81,135 | $ | 885 | $ | 479,115 | $ | (150,789 | ) | $ | 11,990 | $ | (56,929 | ) | $ | 284,272 | ||||||||
See accompanying notes to consolidated financial statements.
77
KEMET CORPORATION AND SUBSIDIARIES
Consolidated Statements of Cash Flows
(Amounts in thousands)
| |
Fiscal Years Ended March 31, | ||||||||||||||
|---|---|---|---|---|---|---|---|---|---|---|---|---|---|---|---|
| |
2010 | 2009 | 2008 | ||||||||||||
Sources (uses) of cash and cash equivalents |
|||||||||||||||
Operating activities: |
|||||||||||||||
Net loss |
$ | (69,447 | ) | $ | (285,209 | ) | $ | (25,215 | ) | ||||||
Adjustments to reconcile net loss to net cash provided by (used in) operating activities: |
|||||||||||||||
Increase in value of warrant |
81,088 | — | — | ||||||||||||
Goodwill impairment |
— | 174,327 | — | ||||||||||||
Gain on early extinguishment of debt |
(38,921 | ) | — | — | |||||||||||
Depreciation and amortization |
52,644 | 58,125 | 52,375 | ||||||||||||
Amortization of debt discount and debt issuance costs |
13,392 | 9,918 | 8,769 | ||||||||||||
Write down of long-lived assets |
656 | 67,624 | 4,218 | ||||||||||||
Net gain on sales and disposals of assets |
(1,003 | ) | (25,505 | ) | (702 | ) | |||||||||
Curtailment gains on benefit plans |
— | (30,835 | ) | — | |||||||||||
Stock-based compensation expense |
1,865 | 1,070 | 3,340 | ||||||||||||
Pension and other post-retirement benefits |
(2,716 | ) | (3,742 | ) | 1,059 | ||||||||||
Deferred income taxes |
2,051 | (8,146 | ) | 2,342 | |||||||||||
Changes in assets and liabilities: |
|||||||||||||||
Accounts receivable |
(18,263 | ) | 44,777 | 1,810 | |||||||||||
Inventories |
7,168 | 71,308 | (8,214 | ) | |||||||||||
Prepaid expenses and other current assets |
(5,647 | ) | 4,055 | 3,217 | |||||||||||
Accounts payable |
26,605 | (67,356 | ) | (15,499 | ) | ||||||||||
Accrued expenses and income taxes |
10,647 | (490 | ) | (43,542 | ) | ||||||||||
Deferred income taxes payable |
(1,472 | ) | (2,906 | ) | (5,751 | ) | |||||||||
Other non-current obligations |
(4,366 | ) | (1,290 | ) | 1,276 | ||||||||||
Other |
339 | — | (46 | ) | |||||||||||
Net cash provided by (used in) operating activities |
54,620 | 5,725 | (20,563 | ) | |||||||||||
Investing activities: |
|||||||||||||||
Capital expenditures |
(12,921 | ) | (30,541 | ) | (43,605 | ) | |||||||||
Proceeds from sale of assets |
1,500 | 34,870 | 3,018 | ||||||||||||
Acquisitions, net of cash received |
— | (1,000 | ) | (69,896 | ) | ||||||||||
Change in restricted cash |
— | 3,900 | (37 | ) | |||||||||||
Proceeds from sale of fuel cell business |
— | — | 5,759 | ||||||||||||
Proceeds from maturity of short-term investments |
— | — | 46,076 | ||||||||||||
Other |
— | — | (768 | ) | |||||||||||
Net cash provided by (used in) investing activities |
(11,421 | ) | 7,229 | (59,453 | ) | ||||||||||
Financing activities: |
|||||||||||||||
Proceeds from issuance of debt |
62,393 | 23,317 | 142,014 | ||||||||||||
Payment of long-term debt |
(57,494 | ) | (75,487 | ) | (170,150 | ) | |||||||||
Debt extinguishment and issuance costs |
(7,811 | ) | (1,574 | ) | (602 | ) | |||||||||
Proceeds from sale of common stock to employee savings plan |
— | 249 | 575 | ||||||||||||
Purchases of treasury stock |
— | — | (18,221 | ) | |||||||||||
Proceeds from exercise of stock options |
— | — | 131 | ||||||||||||
Net cash used in financing activities |
(2,912 | ) | (53,495 | ) | (46,253 | ) | |||||||||
Net increase (decrease) in cash and cash equivalents |
40,287 | (40,541 | ) | (126,269 | ) | ||||||||||
Effect of foreign currency fluctuations on cash |
(292 | ) | (1,638 | ) | 1,963 | ||||||||||
Cash and cash equivalents at beginning of fiscal year |
39,204 | 81,383 | 205,689 | ||||||||||||
Cash and cash equivalents at end of fiscal year |
$ | 79,199 | $ | 39,204 | $ | 81,383 | |||||||||
Supplemental Cash Flow Statement Information: |
|||||||||||||||
Interest paid, net of capitalized interest |
$ | 16,107 | $ | 21,255 | $ | 9,330 | |||||||||
Income taxes paid |
3,910 | 5,199 | 6,198 | ||||||||||||
See accompanying notes to the consolidated financial statements.
78
KEMET CORPORATION AND SUBSIDIARIES
Notes to Consolidated Financial Statements
Note 1: Organization and Significant Accounting Policies
Nature of Business and Organization
KEMET Corporation which together with its subsidiaries is referred to herein as "KEMET" or the "Company" is a leading manufacturer of tantalum capacitors, multilayer ceramic capacitors, film capacitors, electrolytic capacitors, paper capacitors and solid aluminum capacitors. The Company is headquartered in Greenville, South Carolina, and has manufacturing plants and distribution centers located in the United States, Mexico, Europe and Asia. Additionally, the Company has wholly-owned foreign subsidiaries which primarily provide sales support for KEMET's products in foreign markets.
KEMET is organized into three distinct business groups: the Tantalum Business Group ("Tantalum"), the Ceramic Business Group ("Ceramic") and the Film and Electrolytic Business Group ("Film and Electrolytic"). Each business group is responsible for the operations of certain manufacturing sites as well as all related research and development efforts. The sales and marketing functions are shared by each of the business groups and the costs of which are allocated to the business groups based on the business groups' respective budgeted net sales.
During fiscal year 2009, the Company had experienced declines in net sales, profitability and liquidity and had forecasted that it would meet the financial covenants required by its debt agreements with lenders at each of the measurement dates during fiscal year 2010 by a narrow margin. Given the degree of uncertainty with respect to the near-term outlook for the global economy and the possible effects on the Company's operations, there was significant uncertainty as to whether the Company's forecasts would be achieved. Furthermore, the Company anticipated that it would continue to experience severe pressure on its liquidity during fiscal year 2010. These matters raised substantial doubt about the Company's ability to continue as a going concern. The Company's previous independent registered public accounting firms included an explanatory paragraph in their audit reports for the Company's 2009 consolidated financial statements and the consolidated financial statements of Arcotronics Italia S.p.A. ("Arcotronics"), that indicated there was uncertainty that the Company would continue as a going concern.
As of March 31, 2010, the Company's independent registered public accounting firm issued an unqualified opinion that did not include an explanatory paragraph with respect to going concern uncertainty. In the first quarter of fiscal year 2010, the Company consummated a tender offer to extinguish $93.9 million in aggregate principal amount of the 2.25% Convertible Senior Notes (the "Convertible Notes") and executed the Revised Amended and Restated Platinum Credit Facility with K Financing as amended on September 30, 2009 (the "Revised Amended and Restated Platinum Credit Facility") and amendments to the UniCredit Corporate Banking S.p.A. ("UniCredit") facilities which improved the Company's liquidity. On May 5, 2010, the Company completed a private placement of $230.0 million of 10.5% Senior Notes due 2018, see Note 18, "Subsequent Events." In addition, during fiscal year 2010, the Company's liquidity improved as a result of management initiated cost reductions and working capital initiatives, and increases in net sales. Improving global economic conditions led to higher sales in each of the quarters following the fourth quarter of fiscal year 2009 when the impact of the economic downturn had its most adverse affect on the Company's sales. Net sales for the first quarter of fiscal year 2010 improved to $150.2 million, a 10.4% increase over the fourth quarter of fiscal year 2009, and net sales improved to $173.3 million in the second quarter of fiscal year 2010, a 15.4% increase compared to first quarter of fiscal year 2010. Similarly, net sales further improved to $199.9 million in the third quarter of fiscal year 2010, a 15.3% increase compared to the second quarter
79
KEMET CORPORATION AND SUBSIDIARIES
Notes to Consolidated Financial Statements (Continued)
Note 1: Organization and Significant Accounting Policies (Continued)
of fiscal year 2010, and net sales improved to $213.0 million in the fourth quarter of fiscal year 2010, a 6.5% increase compared to the third quarter of fiscal year 2010.
Basis of Presentation
Certain amounts for fiscal years 2009 and 2008 have been reclassified to conform with the fiscal year 2010 presentation.
Principles of Consolidation
The accompanying consolidated financial statements of the Company include the accounts of its wholly-owned subsidiaries. All significant intercompany balances and transactions have been eliminated in consolidation.
Cash Equivalents
Cash equivalents of $28.8 million and $11.3 million at March 31, 2010 and 2009, respectively, consist of money market accounts with an initial term of less than three months. For purposes of the Consolidated Statements of Cash Flows, the Company considers all highly liquid debt instruments with original maturities of three months or less to be cash equivalents.
Restricted Cash
During April 2006 and in conjunction with a contractual provision in a commercial agreement, KEMET put in place a performance bond in the amount of €2.5 million through a European bank. An interest-bearing deposit was placed with a European bank for €2.8 million. The deposit is in KEMET's name and KEMET receives all interest earned by this deposit. However, the deposit is pledged to the European bank, and the bank can use the money should a valid claim be made against the bond. The bond was terminated in January 2009 and the restricted cash in support of the bond was released.
A guarantee was issued by a European bank on behalf of the Company in August 2006 in conjunction with the establishment of a Valued-Added Tax ("VAT") registration in The Netherlands.
The bank guarantee is in the amount of €1.5 million ($2.0 million). An interest-bearing deposit was placed with a European bank for €1.7 million ($2.3 million). The deposit is in KEMET's name and KEMET receives all interest earned by this deposit. However, the deposit is pledged to the European bank, and the bank can use the money should a valid claim be made. The bank guarantee has no expiration date.
Derivative Financial Instruments
The Company has historically entered into forward contracts to buy Mexican pesos for periods and amounts consistent with the related underlying cash flow exposures. These contracts were designated as hedges at inception and monitored for effectiveness on a routine basis. In the event the Company were to establish a revolving line of credit or foreign exchange line of credit, we will consider entering into forward exchange contracts. As of March 31, 2010 and 2009, the Company did not have any outstanding forward contracts.
80
KEMET CORPORATION AND SUBSIDIARIES
Notes to Consolidated Financial Statements (Continued)
Note 1: Organization and Significant Accounting Policies (Continued)
Inventories
Inventories are stated at the lower of cost or market. The carrying value of inventory is reviewed and adjusted based on slow moving and obsolete items, historical shipments, customer forecasts and backlog and technology developments. Inventory costs include material, labor and manufacturing overhead and are determined by the "first-in, first-out" ("FIFO") method. The Company has consigned inventory at certain customer locations totaling $7.6 million and $5.6 million at March 31, 2010 and 2009, respectively.
Property and Equipment
Property and equipment are carried at cost. Depreciation is calculated principally using the straight-line method over the estimated useful lives of the respective assets. Leasehold improvements are amortized using the straight-line method over the shorter of the estimated useful lives of the assets or the terms of the respective leases. Maintenance costs are expensed; expenditures for renewals and improvements are generally capitalized. Upon sale or retirement of property and equipment, the related cost and accumulated depreciation are removed and any gain or loss is recognized. A long-lived asset classified as held for sale is initially measured and reported at the lower of its carrying amount or fair value less cost to sell. Long-lived assets to be disposed of other than by sale are classified as held and used until the long-lived asset is disposed of. Depreciation expense was $50.0 million, $54.5 million and $49.8 million for the years ended March 31, 2010, 2009 and 2008, respectively.
The Company evaluates long-lived assets for impairment whenever events or changes in circumstances indicate that the carrying amount of an asset may not be recoverable. Reviews are regularly performed to determine whether facts and circumstances exist which indicate that the carrying amount of assets may not be recoverable. The Company assesses the recoverability of its assets by comparing the projected undiscounted net cash flows associated with the related asset or group of assets over their remaining lives against their respective carrying amounts. If it is determined that the book value of a long-lived asset is not recoverable, an impairment loss would be calculated equal to the excess of the carrying amount of the long-lived asset over its fair value. The fair value is calculated as the discounted cash flows of the underlying assets. The Company has to make certain assumptions as to the future cash flows to be generated by the underlying assets. Those assumptions include the amount of volume increases, average selling price decreases, anticipated cost reductions, and the estimated remaining useful life of the equipment. Future changes in assumptions may negatively impact future valuations. Fair market value is based on the undiscounted cash flows that the assets will generate over their remaining useful lives or other valuation techniques. In future tests for recoverability, adverse changes in undiscounted cash flow assumptions could result in an impairment of certain long-lived assets that would require a non-cash charge to the Consolidated Statements of Operations and may have a material effect on the Company's financial condition and operating results. The Company recorded $0.7 million, $62.3 million and $4.2 million in impairment charges for the fiscal years 2010, 2009 and 2008, respectively.
Goodwill
Goodwill and other intangible assets with indefinite useful lives are not amortized but are subject to annual impairment tests during the first quarter of each fiscal year and when otherwise warranted. During fiscal year 2009, the Company recorded an impairment for its entire goodwill balance.
81
KEMET CORPORATION AND SUBSIDIARIES
Notes to Consolidated Financial Statements (Continued)
Note 1: Organization and Significant Accounting Policies (Continued)
The Company is organized into three distinct business groups: Tantalum, Ceramic, and Film and Electrolytic. The Company evaluates its goodwill and intangible asset with indefinite useful lives on a reporting unit basis. This requires the Company to estimate the fair value of the reporting units based on the future net cash flows expected to be generated. The impairment test involves a comparison of the fair value of each reporting unit, with the corresponding carrying amounts. If the reporting unit's carrying amount exceeds its fair value, then an indication exists that the reporting unit's goodwill and intangible asset with indefinite useful lives may be impaired. The impairment to be recognized is measured by the amount by which the carrying value of the reporting unit's goodwill being measured exceeds its implied fair value. The implied fair value of goodwill is the excess of the fair value of the reporting unit over the sum of the amounts assigned to identified net assets. As a result, the implied fair value of goodwill is generally the residual amount that results from subtracting the value of net assets including all tangible assets and identified intangible assets from the fair value of the reporting unit's fair value. The Company determined the fair value of its reporting units using an income-based, discounted cash flow ("DCF") analysis, and market-based approaches (Guideline Publicly Traded Company Method and Guideline Transaction Method) which examine transactions in the marketplace involving the sale of the stocks of similar publicly owned companies, or the sale of entire companies engaged in operations similar to KEMET. In addition to the above described reporting unit valuation techniques, the Company's goodwill and intangible asset with indefinite useful lives impairment assessment also considers the Company's aggregate fair value based upon the value of the Company's outstanding shares of common stock.
The impairment review of goodwill and intangible assets with indefinite useful lives are highly subjective and involve the use of significant estimates and assumptions in order to calculate the impairment charges. Estimates of business enterprise fair value use discounted cash flow and other fair value appraisal models and involve making assumptions for future sales trends, market conditions, growth rates, cost reduction initiatives and cash flows for the next several years. Future changes in assumptions may negatively impact future valuations.
Deferred Income Taxes
Income taxes are accounted for under the asset and liability method. Deferred tax assets and liabilities are recognized for the future tax consequences attributable to differences between the financial statement carrying amounts of existing assets and liabilities and their respective tax basis and operating loss and tax credit carryforwards. Deferred tax assets and liabilities are measured using enacted tax rates expected to apply to taxable income in fiscal years in which those temporary differences are expected to be recovered or settled. The effect on deferred tax assets and liabilities of a change in tax rates is recognized in income in the period that includes the enactment date. A valuation allowance is recorded to reduce the carrying amounts of deferred tax assets unless it is more likely than not that such assets will be realized.
Stock-based Compensation
The value of each equity-based award is estimated on the date of grant using the Black-Scholes option-pricing model. The Black-Scholes model takes into account volatility in the price of the Company's stock, the risk-free interest rate, the estimated life of the equity-based award, the closing market price of the Company's stock on the grant date and the exercise price. The estimates utilized in the Black-Scholes calculation involve inherent uncertainties and the application of management
82
KEMET CORPORATION AND SUBSIDIARIES
Notes to Consolidated Financial Statements (Continued)
Note 1: Organization and Significant Accounting Policies (Continued)
judgment. In addition, we are required to estimate the expected forfeiture rate and only recognize expense for those options expected to vest.
Concentrations of Credit and Other Risks
The Company sells to customers globally. Credit evaluations of its customers' financial condition are performed periodically, and the Company generally does not require collateral from its customers. TTI, Inc. accounted for over $86.5 million, $81.6 million and $101.0 million of the Company's net sales in fiscal years 2010, 2009 and 2008, respectively. There were no customers' accounts receivable balances exceeding 10% of gross accounts receivable at March 31, 2010 or March 31, 2009.
The Company, as well as the industry, utilizes electronics distributors for a large percentage of its sales. Electronics distributors are an effective means to distribute the products to the end-users. For fiscal years ended March 31, 2010, 2009, and 2008, net sales to electronics distributors accounted for 48%, 47%, and 48%, respectively, of the Company's total net sales.
Foreign Subsidiaries
Financial statements of certain of the Company's foreign subsidiaries are prepared using the U.S. dollar as their functional currency. Translation of these foreign operations, as well as gains and losses from non-U.S. dollar foreign currency transactions, such as those resulting from the settlement of foreign receivables or payables, are reported in the Consolidated Statements of Operations.
Translation of other foreign operations to U.S. dollars occurs using the current exchange rate for balance sheet accounts and an average exchange rate for results of operations. Such translation gains or losses are recognized as a component of equity in accumulated other comprehensive income ("AOCI").
Comprehensive Income (Loss)
Comprehensive income (loss) consists of net income (losses), currency forward contract gains (losses), currency translation gains (losses), unrealized investment gains (losses) from available-for-sale securities, defined benefit plan adjustments including those adjustments which result from changes in net prior service credit and actuarial gains (losses), and is presented in the Consolidated Statements of Changes in Stockholders' Equity and Comprehensive Income (Loss).
83
KEMET CORPORATION AND SUBSIDIARIES
Notes to Consolidated Financial Statements (Continued)
Note 1: Organization and Significant Accounting Policies (Continued)
The following summary sets forth the components of accumulated other comprehensive income (loss) contained in the stockholders' equity section of the Consolidated Balance Sheets (amounts in thousands):
| |
Currency Forward Contract Gains (Losses) |
Foreign Currency Translation Gains (Losses) |
Defined Benefit Post-retirement Plan Adjustments |
Defined Benefit Pension Plans |
Net Accumulated Other Comprehensive Income (Loss) |
|||||||||||
|---|---|---|---|---|---|---|---|---|---|---|---|---|---|---|---|---|
Balance at March 31, 2008 |
$ | 763 | $ | 42,468 | $ | 22,180 | $ | 154 | $ | 65,565 | ||||||
2009 Activity(1) |
(763 | ) | (30,253 | ) | (19,209 | ) | (2,677 | ) | (52,902 | ) | ||||||
Balance at March 31, 2009 |
— | 12,215 | 2,971 | (2,523 | ) | 12,663 | ||||||||||
2010 Activity(2) |
— | 1,977 | (560 | ) | (2,090 | ) | (673 | ) | ||||||||
Balance at March 31, 2010 |
$ | — | $ | 14,192 | $ | 2,411 | $ | (4,613 | ) | $ | 11,990 | |||||
- (1)
- Due
primarily to established valuation allowances, there was no significant deferred tax effect associated with AOCI movement.
- (2)
- Activity within the defined benefit pension plans is net of a tax benefit of $1.1 million.
Warrant Liability
Concurrent with the consummation of the tender offer as discussed in Note 2, "Debt", the Company issued K Financing, LLC ("K Financing") a warrant (the "Closing Warrant") to purchase up to 80,544,685 shares of the Company's common stock, subject to certain adjustments, representing approximately 49.9% of the Company's outstanding common stock on a post-Closing Warrant basis. The Closing Warrant was subsequently transferred to K Equity, LLC ("K Equity"). The Closing Warrant was exercisable at a purchase price of $0.50 per share, subject to an adjustment which reduces the exercise price to a floor of $0.35 per share based on a sliding scale once the aggregate borrowings under the Platinum Line of Credit Loan (as defined below) and the Platinum Working Capital Loan exceed $12.5 million, at any time prior to the tenth anniversary of the Closing Warrant's date of issuance. The floor exercise price was reached on September 29, 2009 when the aggregate borrowings under the Platinum Line of Credit Loan and the Platinum Working Capital Loan (as defined below) reached $20.0 million. The Closing Warrant may be exercised in exchange for cash, by means of net settlement of a corresponding portion of amounts owed by the Company under the Revised Amended and Restated Platinum Credit Facility, by cashless exercise to the extent of appreciation in the value of the Company's common stock above the exercise price of the Closing Warrant, or by combination of the preceding alternatives.
84
KEMET CORPORATION AND SUBSIDIARIES
Notes to Consolidated Financial Statements (Continued)
Note 1: Organization and Significant Accounting Policies (Continued)
Warrants may be classified as assets or liabilities (derivative accounting), temporary equity, or permanent equity, depending on the terms of the specific warrant agreement. The Closing Warrant issued to K Financing under the Platinum Credit Facility (as defined below) was reviewed as of June 30, 2009, the date of issuance, to determine whether it meets the definition of a derivative. The Company's evaluation of the Closing Warrant as of the date of issuance concluded that it was not indexed to the Company's stock since the strike price was not fixed and as such were treated as a freestanding derivative liability. On September 29, 2009, the Company borrowed $10.0 million from the Platinum Working Capital Loan for general corporate purposes. As a result of this additional borrowing, the strike price of the Closing Warrant was fixed at $0.35 per share as of September 29, 2009 and the Company assessed whether the Closing Warrant still met the definition of a derivative. The Company's evaluation of the Closing Warrant as of September 29, 2009, concluded that the Closing Warrant is indexed to the Company's own stock and should be classified as a component of equity. The Company valued the Closing Warrant immediately prior to the strike price becoming fixed and recorded a mark-to-market adjustment of $81.1 million through earnings. Subsequent to the strike price becoming fixed, the Company reclassified the warrant liability of $112.5 million into the line item "Additional paid-in capital" on the Consolidated Balance Sheets and the Closing Warrant will no longer be marked-to-market.
The Company estimated the fair value of the Closing Warrant using the Black-Scholes option pricing model using the following assumptions:
| |
September 30, 2009 |
|
|---|---|---|
Expected life |
9.75 years | |
Expected volatility |
66.0% | |
Risk-free interest rate |
3.5% | |
Dividends |
0% |
Fair Value Measurement
The Company utilizes three levels of inputs to measure the fair value of (a) nonfinancial assets and liabilities that are recognized or disclosed at fair value in the Company's consolidated financial statements on a recurring basis (at least annually) and (b) all financial assets and liabilities. Fair value is defined as the exchange price that would be received for an asset or paid to transfer a liability (an exit price) in the principal or most advantageous market for the asset or liability in an orderly transaction between market participants on the measurement date. Valuation techniques used to measure fair value must maximize the use of observable inputs and minimize the use of unobservable inputs.
The first two inputs are considered observable and the last is considered unobservable. The levels of inputs are as follows:
- •
- Level 1—Quoted prices in active markets for identical assets or liabilities.
- •
- Level 2—Inputs other than Level 1 that are observable, either directly or indirectly, such as quoted prices for similar assets or liabilities, quoted prices in markets that are not active, or other inputs that are observable or can be corroborated by observable market data for substantially the full term of the assets or liabilities.
85
KEMET CORPORATION AND SUBSIDIARIES
Notes to Consolidated Financial Statements (Continued)
Note 1: Organization and Significant Accounting Policies (Continued)
- •
- Level 3—Unobservable inputs that are supported by little or no market activity and that are significant to the fair value of the assets or liabilities.
Assets measured at fair value on a recurring basis as of March 31, 2010 are as follows (amounts in thousands):
| |
|
Fair Value Measurement Using |
|
Fair Value Measurement Using |
|||||||||||||||||||||
|---|---|---|---|---|---|---|---|---|---|---|---|---|---|---|---|---|---|---|---|---|---|---|---|---|---|
| |
Fair Value March 31, 2010 |
Fair Value March 31, 2009 |
|||||||||||||||||||||||
| |
Level 1 | Level 2 | Level 3 | Level 1 | Level 2 | Level 3 | |||||||||||||||||||
Assets: |
|||||||||||||||||||||||||
Money markets(1) |
$ | 28,761 | $ | 28,761 | $ | — | $ | — | $ | 11,285 | $ | 11,285 | $ | — | $ | — | |||||||||
Long-term debt |
260,496 | 70,492 | 190,004 | 122,650 | 24,938 | 97,712 | |||||||||||||||||||
- (1)
- Included in the line item "Cash and cash equivalents" on the Consolidated Balance Sheets.
Revenue Recognition
The Company recognizes revenue only when all of the following criteria are met: (1) persuasive evidence of an arrangement exists, (2) delivery has occurred or services have been rendered, (3) the seller's price to the buyer is fixed or determinable, and (4) collectibility is reasonably assured. Net sales is presented net of any taxes collected from customers and remitted to government entities.
A portion of sales is related to products designed to meet customer specific requirements. These products typically have stricter tolerances making them useful to the specific customer requesting the product and to customers with similar or less stringent requirements. Products with customer specific requirements are tested and approved by the customer before the Company mass produces and ships the product. The Company recognizes revenue at shipment as the sales terms for products produced with customer specific requirements do not contain a final customer acceptance provision or other provisions that are unique and would otherwise allow the customer different acceptance rights.
A portion of sales is made to distributors under agreements allowing certain rights of return and price protection on unsold merchandise held by distributors. The Company's distributor policy includes inventory price protection and "ship-from-stock and debit" ("SFSD") programs common in the industry.
The SFSD program provides a mechanism for the distributor to meet a competitive price after obtaining authorization from the local Company sales office. This program allows the distributor to ship its higher-priced inventory and debit the Company for the difference between KEMET's list price and the lower authorized price for that specific transaction. The Company establishes reserves for its SFSD program based primarily on historical SFSD activity and on the actual inventory levels of certain distributor customers. The actual inventory levels at these distributors comprise approximately 90% of the total global distributor inventory related to customers who participate in the SFSD Program.
Primarily all of the Company's distributors have the right to return to KEMET a certain portion of the purchased inventory, which, in general, will not exceed 5% of their purchases from the previous fiscal quarter. KEMET estimates future returns based on historical patterns of the distributors and records an allowance on the Consolidated Balance Sheets. The Company also offers volume based rebates.
86
KEMET CORPORATION AND SUBSIDIARIES
Notes to Consolidated Financial Statements (Continued)
Note 1: Organization and Significant Accounting Policies (Continued)
The establishment of sales allowances is recognized as a component of the line item "Net sales" on the Consolidated Statements of Operations, while the associated reserves are included in the line item "Accounts receivable, net" on the Consolidated Balance Sheets.
The Company provides a limited warranty to its customers that the products meet certain specifications. The warranty period is generally limited to one year, and the Company's liability under the warranty is generally limited to a replacement of the product or refund of the purchase price of the product. Warranty costs were less than 1% of net sales for the fiscal years ended March 31, 2010, 2009 and 2008. The Company recognizes warranty costs when losses are both probable and reasonably estimable.
Allowance for Doubtful Accounts
The Company evaluates the collectibility of trade receivables through the analysis of customer accounts. When the Company becomes aware that a specific customer has filed for bankruptcy, has begun closing or liquidation proceedings, has become insolvent or is in financial distress, the Company records a specific allowance for the doubtful account to reduce the related receivable to the amount the Company believes is collectible. If circumstances related to specific customers change, the Company's estimates of the recoverability of receivables could be adjusted. Accounts are written off after all means of collection, including legal action, have been exhausted.
Factoring of Receivables
Film and Electrolytic factors a portion of its accounts receivables through factoring transactions. As of March 31, 2010 and 2009 all factoring transactions were with recourse to the seller. These transactions do not meet the derecognition requirements. Consequently, as of March 31, 2010 and 2009, respectively, €1.7 million ($2.3 million) and €1.7 million ($2.3 million) of receivables sold through factoring transactions are recorded on the Consolidated Balance Sheets in the line item "Accounts receivable, net." A corresponding liability, amounting to €1.1 million ($1.5 million) and €1.1 million ($1.5 million) as of March 31, 2010 and 2009, respectively related to the advance cash received from the factoring agent, is recorded in the line item "Current portion of long-term debt" on the Consolidated Balance Sheets.
Shipping and Handling Costs
The Company's shipping and handling costs are reflected in the line item "Cost of sales" on the Consolidated Statements of Operations. Shipping and handling costs were $21.1 million, $26.6 million, and $19.5 million in the fiscal years ended March 31, 2010, 2009, and 2008, respectively.
Income (Loss) per Share
Basic income (loss) per share is computed using the weighted-average number of shares outstanding. Diluted income (loss) per share is computed using the weighted-average number of shares outstanding adjusted for the incremental shares attributed to the Closing Warrant, outstanding options to purchase common stock and for any put options issued by the Company, if such effects are dilutive.
87
KEMET CORPORATION AND SUBSIDIARIES
Notes to Consolidated Financial Statements (Continued)
Note 1: Organization and Significant Accounting Policies (Continued)
Environmental Cost
The Company recognizes liabilities for environmental remediation when it is probable that a liability has been incurred and can be reasonably estimated. The Company determines its liability on a site-by-site basis, and it is not discounted or reduced for anticipated recoveries from insurance carriers. In the event of anticipated insurance recoveries, such amounts would be presented on a gross basis in other current or non-current assets, as appropriate. Expenditures that extend the life of the related property or mitigate or prevent future environmental contamination are capitalized.
Use of Estimates
The preparation of consolidated financial statements in conformity with U.S. generally accepted accounting principles requires management to make a number of estimates and assumptions. These estimates and assumptions affect the reported amounts of assets and liabilities and the disclosure of contingent assets and liabilities at the date of the financial statements. In addition, they affect the reported amounts of revenues and expenses during the reporting period. Significant items subject to such estimates and assumptions include impairment of property and equipment, intangibles and goodwill; valuation allowances for accounts receivables, price protection and customers' returns, and deferred income taxes; environmental liabilities; valuation of derivative instruments and assets and obligations related to employee benefits. Actual results could differ from these estimates and assumptions.
Impact of Recently Issued Accounting Standards
In January 2010, the FASB issued Accounting Standard Update ("ASU") No. 2010-06, "Fair Value Measurements and Disclosures (Topic 820): Improving Disclosures about Fair Value Measurements". This ASU provides amendments to FASB ASC 820 which requires new disclosures related to assets measured at fair value. In addition, this ASU includes amendments to the guidance on employers' disclosures related to the classification of postretirement benefit plan assets and the related fair value measurement of those classifications. This update was effective December 15, 2009. The adoption of ASU No. 2010-06 did not have an impact on the Company's consolidated results of operations or financial position.
In February 2010, the FASB issued ASU No. 2010-09, "Subsequent Events (Topic 855): Amendments to certain Recognition and Disclosure Requirements". An entity that is an SEC filer is not required to disclose the date through which subsequent events have been evaluated. This change alleviates potential conflicts between the ASC and the SEC's requirements. In addition the scope of the "reissuance" disclosure requirements is refined to include revised financial statements only. This update was effective February 24, 2010. The adoption of ASU No. 2010-09 did not have a material impact on the Company's consolidated financial position or results of operations.
In June 2009, the Financial Accounting Standards Board ("FASB") issued guidance which established the FASB Accounting Standards Codification ("FASB ASC") as the source of authoritative U.S. GAAP to be applied by nongovernmental entities, except for the rules and interpretive releases of the SEC under authority of federal securities laws, which are sources of authoritative U.S. GAAP for SEC registrants. All guidance contained in the codification carries an equal level of authority. The codification does not change U.S. GAAP. Instead, it takes the individual pronouncements that currently comprise U.S. GAAP and reorganizes them into approximately 90 accounting topics, and displays all
88
KEMET CORPORATION AND SUBSIDIARIES
Notes to Consolidated Financial Statements (Continued)
Note 1: Organization and Significant Accounting Policies (Continued)
topics using a consistent structure. Contents in each topic are further organized first by subtopic, then section and finally paragraph. The paragraph level is the only level that contains substantive content. Citing particular content in the codification involves specifying the unique numeric path to the content through the topic, subtopic, section and paragraph structure. The FASB ASC was effective for us in the second fiscal quarter of 2010 and superseded all existing non-SEC accounting and reporting standards. All non-grandfathered accounting not included in the FASB ASC will be considered non-authoritative. There was no impact on our consolidated financial statements upon adoption.
In May 2009, the FASB issued guidance which established general standards of accounting for and disclosure of events that occur after the balance sheet date but before financial statements are issued or are available to be issued. This guidance sets forth the period after the balance sheet date during which management should evaluate events or transactions that may occur for potential recognition or disclosure in the financial statements, the circumstances under which an entity should recognize events or transactions occurring after the balance sheet date, and the disclosures that should be made about such events or transactions. This guidance was effective for reporting periods ending after June 15, 2009 and did not result in significant changes in subsequent events that an entity reports, either through recognition or disclosure, in our financial statements.
In April 2009, the FASB issued guidance which increased the frequency of fair value disclosures to a quarterly instead of an annual basis. This guidance was effective for interim and annual periods ending after June 15, 2009 or the first quarter of fiscal year 2010 for us. The adoption of this accounting guidance did not impact our consolidated results of operations or financial position.
In December 2008, the FASB staff issued FSP SFAS 132(R)-1, "Employers' Disclosures about Postretirement Benefit Plan Assets" (FASB ASC Topic 715-20-65-2). This guidance requires enhanced disclosures about plan assets of a defined benefit pension or other postretirement plan. The Company adopted this guidance for its March 31, 2010 annual report. The adoption of this guidance did not have an impact on the Company's consolidated results of operations or financial position.
In May 2008, the FASB issued guidance which required issuers of convertible debt that may be settled wholly or partly in cash when converted to account for the debt and equity components separately. This guidance was effective for fiscal years beginning after December 15, 2008, or fiscal year 2010 for us, and must be applied retrospectively to all periods presented. This guidance was retroactively adopted and is therefore reflected in all periods presented.
In April 2008, the FASB issued FSP FAS 142-3, "Determination of the Useful Life of Intangible Assets", ("FSP FAS 142-3") (FASB ASC Topic 350-30-65). This guidance amends the list of factors an entity should consider in developing renewal or extension assumptions when determining the useful life of recognized intangible assets under FASB No. 142 (FASB ASC Topic 350), "Goodwill and Other Intangible Assets". This guidance applies to (i) intangible assets that are acquired individually or with a group of other assets and (ii) intangible assets acquired in both business combinations and asset acquisitions. This guidance removes the requirement for an entity to consider whether an intangible asset can be renewed without substantial cost or material modifications to the existing terms and conditions. This guidance replaces the previous useful-live assessment criteria with a requirement that an entity consider its own experience in renewing similar arrangements. This guidance is effective for financial statements issued for fiscal years beginning after December 15, 2008 and must be applied prospectively only to intangible assets acquired after the FSP's effective date. The Company will adhere
89
KEMET CORPORATION AND SUBSIDIARIES
Notes to Consolidated Financial Statements (Continued)
Note 1: Organization and Significant Accounting Policies (Continued)
to this guidance for intangible assets acquired in the future (the Company did not acquire any intangible assets in fiscal year 2010).
In December 2007, the FASB issued SFAS No. 141R, "Business Combinations", now included within FASB ASC 805 "Business Combinations" ("FASB ASC 805"). FASB ASC 805 establishes principles and requirements for how an acquirer recognizes and measures in its financial statements the identifiable assets acquired, the liabilities assumed, any noncontrolling interest in the acquiree and the goodwill acquired. FASB ASC 805 also establishes disclosure requirements which will enable users to evaluate the nature and financial effects of the business combination. This standard is effective for fiscal years beginning after December 15, 2008 and early adoption was prohibited. The adoption did not have an impact on the Company's consolidated results of operations or financial position.
In September 2007, the FASB issued guidance which addresses the determination of whether an instrument (or an embedded feature) is indexed to an entity's own stock, which is the first part of the scope exception in FASB ASC 815-10-15. If an instrument (or an embedded feature) that has the characteristics of a derivative instrument under FASB ASC 815-10-15 is indexed to an entity's own stock, it is still necessary to evaluate whether it is classified in stockholders' equity (or would be classified in stockholders' equity if it were a freestanding instrument). See Note 1, "Warrant Liability", for discussion of the impact of our adoption of this guidance as of April 1, 2009.
Note 2: Debt
A summary of debt is as follows (amounts in thousands):
| |
March 31, | ||||||
|---|---|---|---|---|---|---|---|
| |
2010 | 2009 | |||||
Convertible Debt, net of discount of $7,861 and $26,359 as of March 31, 2010 and March 31, 2009, respectively |
$ | 73,220 | $ | 148,641 | |||
UniCredit Agreement-A (€53,201 and €60,000 as of March 31, 2010 and March 31, 2009, respectively) |
71,710 | 79,848 | |||||
UniCredit Agreement-B (€33,000 and €35,000 as of March 31, 2010 and March 31, 2009, respectively) |
44,481 | 46,578 | |||||
Platinum Term Loan, net of discount of $22,308 as of March 31, 2010 |
15,525 | — | |||||
Platinum Line of Credit, net of discount of $4,056 as of March 31, 2010 |
5,944 | — | |||||
Platinum Working Capital Loan |
10,000 | — | |||||
Vishay |
15,000 | 15,000 | |||||
Other |
13,629 | 16,679 | |||||
Total debt |
249,509 | 306,746 | |||||
Current maturities |
(17,880 | ) | (25,994 | ) | |||
Total long-term debt |
$ | 231,629 | $ | 280,752 | |||
90
KEMET CORPORATION AND SUBSIDIARIES
Notes to Consolidated Financial Statements (Continued)
Note 2: Debt (Continued)
On May 5, 2010, the Company completed a private placement of $230.0 million in aggregate principal amount of the Company's 10.5% Senior Notes due 2018 (the "10.5% Senior Notes"). The proceeds of the private placement were used to repay all of its outstanding indebtedness under the Company's credit facility with K Financing, LLC, the Company's €60 million credit facility and €35 million credit facility with UniCredit and the Company's term loan with Vishay Intertechnology, Inc. ("Vishay") The Company used a portion of the remaining proceeds to fund a previously announced tender offer to purchase $40.5 million in aggregate principal amount of the Company's 2.25% Convertible Senior Notes due 2026 and to pay a majority of the costs incurred in connection with the private placement, the tender offer and the foregoing repayments. See Note 18, "Subsequent Events" for further discussion of this private placement. Due to this refinancing, the Company has classified all amounts outstanding to UniCredit as long-term with the exception of €7.7 million related to a principal payment which was made on April 1, 2010. The remainder of the March 31, 2010 current maturities is comprised of principal payments related to other debt.
The line item "Interest expense" on the Consolidated Statements of Operations for the fiscal years 2010, 2009 and 2008, respectively, is as follows (amounts in thousands):
| |
Fiscal Years Ended March 31, | ||||||||||
|---|---|---|---|---|---|---|---|---|---|---|---|
| |
2010 | 2009 | 2008 | ||||||||
Contractual interest expense |
$ | 12,616 | $ | 19,871 | $ | 12,905 | |||||
Amortization of debt issuance costs |
2,788 | 1,588 | 1,169 | ||||||||
Amortization of debt discount |
10,604 | 8,330 | 7,622 | ||||||||
Total interest expense |
$ | 26,008 | $ | 29,789 | $ | 21,696 | |||||
Platinum Credit Facility
On May 5, 2009, the Company executed a credit facility with K Financing, an affiliate of Platinum Equity Capital Partners II, L.P. (the "Platinum Credit Facility"). The Platinum Credit Facility consists of a term loan of $37.8 million ("Platinum Term Loan"), a line of credit loan ("Platinum Line of Credit Loan") that may be borrowed from time to time (but not reborrowed after being repaid) of up to $12.5 million and a working capital loan ("Platinum Working Capital Loan") of up to $12.5 million. Subject to the amount available to be borrowed, which is based on the Company's book-to-bill ratio, and certain terms and conditions, the Company may borrow, pay or repay and reborrow amounts under the Platinum Working Capital Loan. The Platinum Term Loan was used for the purchase of Convertible Notes which is more fully described below. Additionally, funds from the Platinum Line of Credit Loan and Platinum Working Capital Loan under the Platinum Credit Facility are available to the Company, for limited purposes, subject to the satisfaction or waiver of certain conditions.
On June 30, 2009, the Company drew $10.0 million from the Platinum Line of Credit Loan and used it primarily to pay the fees and expenses related to execution of the tender offer (described below) and the execution of the Platinum Credit Facility. The Company incurred $3.6 million in fees and expense reimbursements related to the execution of the tender offer, $4.2 million related to the execution of the Platinum Credit Facility, and $1.4 million related to the amendments of the UniCredit facilities. In addition, the Company will pay K Financing a success fee of $5.0 million, payable at the time of repayment in full of the Platinum Term Loan, whether at maturity or otherwise. This success fee is included in "Other non-current obligations" on the Consolidated Balance Sheets as of March 31,
91
KEMET CORPORATION AND SUBSIDIARIES
Notes to Consolidated Financial Statements (Continued)
Note 2: Debt (Continued)
2010. On September 29, 2009, the Company borrowed $10.0 million on the Platinum Working Capital Loan for general corporate purposes. The Company currently has $2.5 million in availability under the Platinum Working Capital Loan based on the Company's book-to-bill ratio calculated on March 31, 2010. The amount available to be borrowed under the Platinum Working Capital Loan is based upon the Company's book-to-bill ratio in effect at the time of the borrowing. In the event the Company's book-to-bill ratio subsequently falls below the minimum level required for the amount of the then outstanding borrowing under the Platinum Working Capital Loan, the amount borrowed in excess of the amount available to be borrowed is subject to repayment.
The Platinum Term Loan accrues interest at an annual rate of 9% for cash payment until June 30, 2010. At the Company's option, after June 30, 2010, the Platinum Term Loan will accrue interest at an annual rate of 9% for cash payment, or cash and payment in-kind ("PIK") interest at the rate of 12% per annum, with the cash portion being 5% and the PIK portion being 7%. The Platinum Working Capital Loan and the Platinum Line of Credit Loan will accrue interest at a rate equal to the greater of (i) LIBOR plus 7%, or (ii) 10%, payable monthly in arrears. In the event more than $8.8 million in aggregate principal amount of the Convertible Notes remain outstanding as of March 1, 2011, then the maturity date of the Platinum Term Loan, the Platinum Line of Credit Loan and the Platinum Working Capital Loan are accelerated to March 1, 2011. If the aggregate principal amount of the Convertible Notes outstanding at March 1, 2011 is less than or equal to $8.8 million, the maturity date of the Platinum Term Loan will be November 15, 2012 and the maturity date for the Platinum Line of Credit Loan and the Platinum Working Capital Loan will be July 15, 2011.
The Revised Amended and Restated Platinum Credit Facility contains certain financial maintenance covenants, including requirements that the Company maintain a minimum consolidated EBITDA, as defined in the agreement, and a minimum fixed charge coverage ratio. In addition to the financial covenants, the Revised Amended and Restated Platinum Credit Facility also contains limitations on capital expenditures, the incurrence of indebtedness, the granting of liens, the sale of assets, sale and leaseback transactions, fundamental corporate changes, entering into investments, the payment of dividends, voluntary or optional payment and prepayment of indebtedness (including the Convertible Notes) and other limitations customary to secured credit facilities. On September 30, 2009, the Company entered into Amendment No. 2 (the "Amendment") to the Revised Amended and Restated Platinum Credit Facility. Under the terms of the Amendment, the definition of "Test Period" under the Revised Amended and Restated Platinum Credit Facility was amended to eliminate the inclusion of the Company's fiscal quarter ended June 30, 2009 in the calculation of the Consolidated Fixed Charge Coverage Ratio financial covenant.
The Company's obligations to K Financing arising under the Revised Amended and Restated Platinum Credit Facility are secured by substantially all of the Company's assets located in the United States, Mexico, Indonesia and China (other than accounts receivable owing by account debtors located in the United States, Singapore and Hong Kong, which exclusively secure obligations to an affiliate of Vishay). As further described in the Offer to Purchase, in connection with entering into the Revised Amended and Restated Platinum Credit Facility, K Financing and UniCredit entered into a letter of understanding with respect to their respective guarantor and collateral pools and the Company's assets in Europe that are not pledged to either lender. The letter of understanding also sets forth each lender's agreement not to interfere with the other's exercise of remedies pertaining to their respective collateral pools.
92
KEMET CORPORATION AND SUBSIDIARIES
Notes to Consolidated Financial Statements (Continued)
Note 2: Debt (Continued)
Concurrent with the consummation of the tender offer, the Company issued K Financing the Closing Warrant to purchase up to 80,544,685 shares of its common stock, subject to certain adjustments, representing approximately 49.9% of the Company's outstanding common stock on a post-Closing Warrant basis. The Closing Warrant was subsequently transferred to K Equity.
The Company also entered into an Investor Rights Agreement (the "Investor Rights Agreement") with K Financing. Pursuant to the terms of the Investor Rights Agreement, the Company has, subject to certain terms and conditions, granted Board of Directors ("Board") observation rights to K Financing which would permit K Financing to designate up to three individuals to observe Board meetings and receive information provided to the Board. In addition, the Investor Rights Agreement provides K Financing with certain preemptive rights. Subject to the terms and limitations described in the Investor Rights Agreement, in connection with any proposed issuance of securities, the Company would be required to offer to sell to K Financing a pro rata portion of such securities equal to the percentage determined by dividing the number of shares of common stock held by K Financing plus the number of shares of common stock issuable upon exercise of the Closing Warrant, by the total number of shares of common stock then outstanding on a fully diluted basis. The Investor Rights Agreement also provides K Financing with certain registration and information rights.
The Company also entered into a Corporate Advisory Services Agreement with Platinum Equity Advisors, LLC ("Platinum Advisors") for a term of the later of (i) June 30, 2013 and (ii) the termination of the Credit Facility, pursuant to which the Company will pay an annual fee of $1.5 million to Platinum Advisors for certain advisory services. In addition, the Platinum Credit Facility includes various fees totaling $0.7 million per year for administration and collateral management and the Company incurs a fee of 1% per annum for unused capacity under the Platinum Line of Credit Loan and the Platinum Working Capital Loan.
At the date of issuance, the Company allocated $31.4 million of the proceeds from the issuance of the Platinum Term Loan and the draw-down on the Platinum Line of Credit Loan to warrant liability. The Company allocated the remainder of the issuance proceeds to the Platinum Term Loan and the Platinum Line of Credit Loan ($12.0 million and $4.4 million, respectively) based upon their relative fair values. The carrying amount of the Platinum Term Loan and the Platinum Line of Credit Loan will be increased by quarterly accretion to the line item "Interest expense" on the Consolidated Statements of Operations under the effective interest method over their respective terms of approximately 3.4 years and 2.0 years.
The Company recorded deferred financing costs of $5.5 million at the issuance date, and a long-term obligation has been recognized related to the unpaid success fee. These deferred financing costs will be allocated between the various loan components and amortized under the effective interest method over the respective term.
Convertible Debt
In November 2006, the Company sold and issued $160.0 million of the Convertible Notes to qualified institutional buyers pursuant to Rule 144A of the Securities Act of 1933, as amended. The Convertible Notes are unsecured obligations and rank equally with the Company's existing and future unsubordinated and unsecured obligations and are junior to any of the Company's future secured obligations to the extent of the value of the collateral securing such obligations. In connection with the
93
KEMET CORPORATION AND SUBSIDIARIES
Notes to Consolidated Financial Statements (Continued)
Note 2: Debt (Continued)
issuance and sale of the Convertible Notes, the Company entered into an indenture (the "Convertible Notes Indenture") dated as of November 1, 2006 with Wilmington Trust Company, as trustee.
In connection with the above referenced transaction, the Company also granted the initial purchasers a 30-day option to purchase up to $15.0 million aggregate principal amount of additional Convertible Notes. The Initial Purchasers exercised this option on November 9, 2006, thereby resulting in the sale of an additional $15.0 million aggregate principal amount of the Convertible Notes on November 13, 2006, resulting in a total of $175.0 million aggregate principal amount of Convertible Notes issued.
The Convertible Notes bear interest at a rate of 2.25% per annum, payable in cash semi-annually in arrears on each May 15 and November 15 beginning May 15, 2007. The Convertible Notes are convertible into (i) cash in an amount equal to the lesser of the principal amount of the Convertible Notes and the conversion value of the Convertible Notes on the conversion date and (ii) cash or shares of the Company's common stock ("Common Stock") or a combination of cash and shares of the Common Stock, at the Company's option, to the extent the conversion value at that time exceeds the principal amount of the Convertible Notes, at any time prior to the close of business on the business day immediately preceding the maturity date of the Convertible Notes, unless the Company has redeemed or purchased the Convertible Notes, subject to certain conditions. The initial conversion rate was 103.0928 shares of Common Stock per $1,000 principal amount of the Convertible Notes, which represents an initial conversion price of approximately $9.70 per share, subject to adjustments.
The holder may surrender the holder's Convertible Notes for conversion if any of the following conditions is satisfied:
- •
- During any fiscal quarter, the closing sale price of the Common Stock for at least 20 trading days in the period of 30
consecutive trading days ending on the last trading day of the preceding fiscal quarter exceeds 130% of the conversion price per share on such last trading day;
- •
- The Company has called the Convertible Notes for redemption;
- •
- The average of the trading prices of the Convertible Notes for any five consecutive trading day period is less than 98% of
the average of the conversion values of the Convertible Notes during that period;
- •
- The Company makes certain significant distributions to the holders of the Common Stock; or
- •
- In connection with a transaction or event constituting a "fundamental change" (as defined in the Convertible Notes Indenture).
The Company received net proceeds from the sale of the Convertible Notes of approximately $170.2 million, after deducting discounts and offering expenses of approximately $4.8 million. Net proceeds from the sale were used to repurchase 3.3 million shares of Common Stock at a cost of approximately $24.9 million (concurrent with the initial closing of the Convertible Notes offering). Debt issuance costs related to the Convertible Notes were $2.5 million and have been recorded in the line item "Other assets" on the accompanying Consolidated Balance Sheets. Debt issuance costs are being amortized over a period of five years.
Issuance and transaction costs incurred at the time of the issuance of the Convertible Notes with third parties are allocated to the liability and equity components and accounted for as debt issuance
94
KEMET CORPORATION AND SUBSIDIARIES
Notes to Consolidated Financial Statements (Continued)
Note 2: Debt (Continued)
costs and equity issuance costs, respectively. Debt issuance costs related to the Convertible Notes, net of amortization, were $0.5 million and $1.8 million as of March 31, 2010 and 2009, respectively. Equity issuance costs were $1.3 million as of March 31, 2010 and 2009. The deferred tax liability and a corresponding valuation allowance adjustment in the same amount related to the Convertible Notes were $3.0 million and $10.0 million as of March 31, 2010 and 2009, respectively.
As of March 31, 2010, the remaining unamortized debt discount of the Convertible Notes will be amortized over a period of 19 months, the remaining expected term of the Convertible Notes. The effective interest rate on the liability component is 9.1% on an annual basis.
On June 26, 2009, $93.9 million in aggregate principal amount of the Convertible Notes were validly tendered (representing 53.7% of the outstanding Convertible Notes). Holders of the Convertible Notes received $400 for each $1,000 principal amount of Convertible Notes purchased in the tender offer (a total of $37.6 million), plus accrued and unpaid interest to, but not including, the date of payment for the Convertible Notes accepted for payment. As a result of the consummated tender offer, on June 30, 2009, the Company extinguished the tendered Convertible Notes. In addition, the Company incurred $3.6 million in fees related to the tender offer. The tendered Convertible Notes had a carrying value of $81.0 million and unamortized debt issuance costs of $0.9 million. The extinguishment of these Convertible Notes resulted in a net gain of $38.9 million included in the line item "(Gain) loss on early extinguishment of debt" on the Consolidated Statements of Operations for the fiscal year ended March 31, 2010.
The calculation of the gain is as follows (amounts in thousands):
Reacquisition Price: |
|||||
Cash paid |
$ | 37,568 | |||
Add: tender offer fees |
3,605 | ||||
|
41,173 | ||||
Extinguished Debt: |
|||||
Carrying amount of debt |
80,987 | ||||
Unamortized debt cost |
(893 | ) | |||
|
80,094 | ||||
Net Gain: |
$ |
38,921 |
|||
Due to the adoption and retrospective application of FASB ASC 470-20—"Debt With Conversion and Other Options" effective April 1, 2009, the $93.9 million aggregate principal amount of the tendered Convertible Notes had a carrying value of $81.0 million. On November 5, 2009, we filed a Form 8-K to reflect the retrospective application in the financial statements as a result of the adoption of FASB ASC 470-20.
The terms of the Convertible Notes are governed by the Convertible Notes Indenture. The Convertible Notes mature on November 15, 2026 unless earlier redeemed, repurchased or converted. The Company may redeem the Convertible Notes for cash, either in whole or in part, anytime after November 20, 2011 at a redemption price equal to 100% of the principal amount of the Convertible Notes to be redeemed plus accrued and unpaid interest, including additional interest, if any, up to but
95
KEMET CORPORATION AND SUBSIDIARIES
Notes to Consolidated Financial Statements (Continued)
Note 2: Debt (Continued)
not including the date of redemption. In addition, holders of the Convertible Notes will have the right to require the Company to repurchase for cash all or a portion of their Convertible Notes on November 15, 2011, 2016 and 2021, at a repurchase price equal to 100% of the principal amount of the Convertible Notes to be repurchased plus accrued and unpaid interest, if any, in each case, up to but not including, the date of repurchase.
The Convertible Notes are convertible into Common Stock at a rate equal to 103.0928 shares per $1,000 principal amount of the Convertible Notes (equal to an initial conversion price of approximately $9.70 per share), subject to adjustment as described in the Convertible Notes Indenture. Upon conversion, the Company will deliver for each $1,000 principal amount of Convertible Notes, an amount consisting of cash equal to the lesser of $1,000 and the conversion value (as defined in the Convertible Notes Indenture) and, to the extent that the conversion value exceeds $1,000, at the Company's election, cash or shares of Common Stock with respect to the remainder. The contingent conversion feature was not required to be bifurcated and accounted for separately.
If the Company undergoes a "fundamental change", holders of the Convertible Notes will have the right, subject to certain conditions, to require the Company to repurchase for cash all or a portion of their Convertible Notes at a repurchase price equal to 100% of the principal amount of the Convertible Notes to be repurchased plus accrued and unpaid interest, including contingent interest and additional amounts, if any. One occurrence creating a "fundamental change" is the Company's common stock ceasing to be listed on the New York Stock Exchange ("NYSE") or another national securities exchange in the United States, without then being quoted on an established automated over-the-counter trading market in the United States The transfer of the trading of the Company's stock from the NYSE to the OTC Bulletin Board did not constitute a "fundamental change." An additional occurrence creating a "fundamental change" would be any failure to repay UniCredit amounts when due.
The Company will pay a make-whole premium on the Convertible Notes converted in connection with any fundamental change that occurs prior to November 20, 2011. The amount of the make-whole premium, if any, will be based on the Company's stock price and the effective date of the fundamental change. The maximum make-whole premium, expressed as a number of additional shares of the Common Stock to be received per $1,000 principal amount of the Convertible Notes, would be 30.95 upon the conversion of Convertible Notes in connection with the occurrence of a fundamental change prior to November 1, 2010, or November 20, 2011 if the stock price at that date is $7.46 per share of Common Stock. The Convertible Notes Indenture contains a detailed description of how the make-whole premium will be determined and a table showing the make-whole premium that would apply at various stock prices and fundamental change effective dates. No make-whole premium will be paid if the price of the Common Stock on the effective date of the fundamental change is less than $7.46. Any make-whole premium will be payable in shares of Common Stock (or the consideration into which the Company's Common Stock has been exchanged in the fundamental change) on the conversion date for the Convertible Notes converted in connection with the fundamental change.
The estimated fair value of the Convertible Notes, based on quoted market prices as of March 31, 2010 and March 31, 2009, was approximately $71 million and $25 million, respectively. The Company had interest payable related to the Convertible Notes included in the line item "Accrued expenses" on its Consolidated Balance Sheets of $0.7 million and $1.5 million at March 31, 2010 and March 31, 2009, respectively.
96
KEMET CORPORATION AND SUBSIDIARIES
Notes to Consolidated Financial Statements (Continued)
Note 2: Debt (Continued)
UniCredit
In October 2007, in connection with the completion of the acquisition of Arcotronics, the Company entered into a Senior Facility Agreement ("Facility B") with UniCredit whereby UniCredit agreed to lend to the Company up to €47 million ($68.8 million). The Company's initial drawdown of €45.8 million ($67.1 million) was used to repay certain outstanding indebtedness of Arcotronics and for general corporate purposes. On December 20, 2007, the Company borrowed an additional €1.0 million ($1.5 million) in connection with the refinancing of certain third party indebtedness.
In December 2007, in connection with the refinancing of certain third party indebtedness acquired as part of the acquisition of Arcotronics, the Company entered into a credit facility with UniCredit whereby UniCredit agreed to lend to the Company €50 million ($73.2 million). The Company used the proceeds from this borrowing, together with cash on hand and the drawdown of €1.0 million ($1.5 million) under a separate credit facility with UniCredit, to refinance third party indebtedness of Arcotronics.
In October 2008, the Company entered into Facility A with UniCredit. Facility A is effective for a four and one-half year term that terminates on April 1, 2013. Proceeds from Facility A in the amount of €50 million ($73.2 million) were used to pay off the above mentioned separate credit facility with UniCredit with a scheduled maturity date of December 2008. Additional proceeds from Facility A in the amount of €10.0 million ($14.6 million) were applied to reduce the outstanding principal of Facility B with UniCredit with a scheduled maturity date of April 2009.
On April 3, 2009, the Company entered into an agreement to extend and restructure Facility B. Facility B remained unsecured and does not contain any covenants, however it contains cross acceleration provisions linked to Facility A and bears interest at a rate of six-month EURIBOR plus 2.5 percent. Like Facility A, Facility B includes a subjective acceleration clause.
In April 2009, the Company also entered into amendments to Facility A and Facility B with UniCredit which, among other things, modified the financial covenants under Facility A and modified the amortization schedules under Facility A and Facility B. These amendments to the UniCredit facilities became effective June 30, 2009 upon the consummation of the tender offer.
Material terms and conditions of Facility A are as follows:
| (i | ) | Maturity: | April 1, 2013 | ||
| (ii | ) | Interest Rate: | Floating at six-month EURIBOR plus 2.5% | ||
| (iii | ) | Structure: | Secured with Italian real property, certain European accounts receivable and shares of two of the Company's Italian subsidiaries |
Material terms and conditions of Facility B are as follows:
| (i | ) | Maturity: | April 1, 2013 | ||
| (ii | ) | Interest Rate: | Floating at six-month EURIBOR plus 2.5% | ||
| (iii | ) | Structure: | Unsecured |
97
KEMET CORPORATION AND SUBSIDIARIES
Notes to Consolidated Financial Statements (Continued)
Note 2: Debt (Continued)
The Company is subject to covenants under Facility A which, among other things, restrict its ability to make capital expenditures above certain thresholds and require it to meet financial tests related principally to a fixed charge coverage ratio and profitability. Effective as of September 30, 2009, the Company entered into an amendment to Facility A. Under the terms of the amendment, the amortization schedule of Facility A was modified, including the addition of an October 1, 2009 principal installment, and the definition of "Test Period" was amended to eliminate the inclusion of the Company's fiscal quarter ended June 30, 2009 in the calculation of the Consolidated Fixed Charge Coverage Ratio financial covenant. Additionally, under the amendment, the Company is prohibited from amending or entering into certain third-party loan agreements without, respectively, securing the prior written consent of, or providing prior written notice to, UniCredit. In connection with the amendment, the Company simultaneously executed a fee letter in which it agreed to pay to UniCredit an amendment fee and reimburse it for certain legal expenses incurred in relation to the amendment. These fees were $1.5 million and will be amortized as an adjustment of interest expense over the remaining term of the Facility.
Vishay Loan
In the second quarter of fiscal year 2009, the Company sold assets related to the production and sale of wet tantalum capacitors to a subsidiary of Vishay. The Company received $33.7 million in cash proceeds, net of amounts held in escrow, from the sale of these assets. At the same time, the Company entered into a three-year term loan agreement for $15.0 million and a security agreement with Vishay. The loan carries an interest rate of LIBOR plus 4% which is payable monthly. The entire principal amount of $15.0 million matures on September 15, 2011 and can be prepaid without penalty. Pursuant to the security agreement, the loan is secured by certain accounts receivable of the Company.
The following table highlights the Company's annual maturities of debt (amounts in thousands):
| |
Annual Maturities of Debt Fiscal Years Ended March 31,(1) |
||||||||||||||||||
|---|---|---|---|---|---|---|---|---|---|---|---|---|---|---|---|---|---|---|---|
| |
2011 | 2012 | 2013 | 2014 | 2015 | Thereafter | |||||||||||||
Convertible Debt(2) |
$ | — | $ | — | $ | — | $ | — | $ | — | $ | 40,581 | |||||||
10.5% Senior Notes |
— | — | — | — | — | 230,000 | |||||||||||||
UniCredit Facility A |
10,385 | — | — | — | — | — | |||||||||||||
Other |
7,495 | 3,143 | 1,238 | 1,246 | 508 | — | |||||||||||||
|
$ | 17,880 | $ | 3,143 | $ | 1,238 | $ | 1,246 | $ | 508 | $ | 270,581 | |||||||
- (1)
- Table
has been adjusted to reflect the refinancing of debt which occurred subsequent to March 31, 2010, see Note 18, "Subsequent Events" for
further discussion of the refinancing.
- (2)
- Holders of the Convertible Notes have the right to require the Company to repurchase for cash all or a portion of their Convertible Notes on November 15, 2011, 2016 and 2021 at a repurchase price equal to 100% of the principal amount of the Convertible Notes to be repurchased plus accrued and unpaid interest, if any, in each case, up to but not including, the date of repurchase.
98
KEMET CORPORATION AND SUBSIDIARIES
Notes to Consolidated Financial Statements (Continued)
Note 3: Impairment Charges
During fiscal years 2010, 2009 and 2008, the Company incurred impairment charges totaling $0.7 million, $242.0 million and $4.2 million, respectively.
The Company's goodwill and indefinite-lived intangible assets are tested for impairment at least on an annual basis. The impairment test involves a comparison of the fair value of its reporting units, with their respective carrying amounts. If the reporting unit's aggregate carrying amount exceeds its fair value, then an indication exists that the reporting unit's goodwill may be impaired. The impairment to be recognized is measured by the amount by which the carrying value of the reporting unit's goodwill being measured exceeds its implied fair value, up to the total amount of its assets. The Company determines the fair value of a reporting unit using an income-based approach, discounted cash flow analysis, and market based approaches (Guideline Publicly Traded Company Method and Guideline Transaction Method).
For purposes of the goodwill impairment test, the Company has identified the following three reporting units: Tantalum, Ceramic, and Film and Electrolytic. Goodwill and indefinite-lived intangible assets, are tested annually for impairment during the first quarter of each fiscal year and upon the occurrence of certain events or substantive changes in circumstances. In fiscal year 2010, the Company initiated the first phase of a restructuring plan to reduce costs in Film and Electrolytic. Machinery not used for production in Portugal and not relocated to Mexico were disposed of and as such the Company recorded an impairment charge of $0.7 million to write down the equipment to scrap value.
In connection with the performance of its fiscal year 2009 annual impairment analyses, the Company hired an independent appraisal firm to test goodwill for impairment. The Company recorded goodwill impairments of $88.6 million in connection with its 2009 annual impairment test. This impairment was a result of the Company revising its earnings forecast used in the Company's analysis due to reduced earnings and cash flows caused by macro-economic factors, excess capacity issues in the industry and delays in integrating recently acquired businesses. The asset impairments recorded reduced the carrying values of goodwill in Film and Electrolytic and Ceramic by $76.2 million and $12.4 million, respectively.
One of the factors that determine whether or not goodwill is impaired is the market value of the Company's common stock. During the second quarter of fiscal year 2009, the Company's stock price declined significantly below the level the Company considered in performing its annual impairment review as of June 30, 2008. As such, the Company hired an independent appraisal firm to test goodwill for impairment again as of September 30, 2008. This impairment test resulted in a second quarter goodwill impairment charge of $85.7 million to write off all of the remaining goodwill of Film and Electrolytic, and Tantalum. These impairment charges are aggregated and reported in the line item "Goodwill impairment" on the Consolidated Statements of Operations.
Long-lived assets and intangible assets subject to amortization are reviewed for impairment whenever events or changes in circumstances indicate that the carrying amount of a long-lived asset or group of assets may not be recoverable.
Based in part upon the first quarter of fiscal year 2009 impairment of goodwill, the Company determined that there was an indication that the carrying amount of certain long-lived asset groups might not be recoverable and tested the long-lived assets of Ceramic for impairment. The Company hired an independent appraisal firm to estimate the fair value of the Company's asset groups for impairment purposes. Tests for the recoverability of a long-lived asset to be held and used are
99
KEMET CORPORATION AND SUBSIDIARIES
Notes to Consolidated Financial Statements (Continued)
Note 3: Impairment Charges (Continued)
performed by comparing the carrying amount of the long-lived asset to the sum of the estimated future net undiscounted cash flows expected to be generated by the asset. In estimating the future undiscounted cash flows, the Company uses future projections of cash flows directly associated with, and which are expected to arise as a direct result of, the use and eventual disposition of the assets. These assumptions include, among other estimates, periods of operation and projections of sales and cost of sales. Changes in any of these estimates could have a material effect on the estimated future undiscounted cash flows expected to be generated by the asset. In the first quarter of fiscal year 2009, it was determined that the book value of the long-lived assets of Ceramic was not fully recoverable, and an impairment charge of $58.6 million was recorded, equal to the excess of the carrying amount of the long-lived assets over their fair value. The fair value was established on the basis of fair value in exchange. Fair value in exchange is defined as the price at which the property would change hands between a willing buyer and a willing seller, neither being under any compulsion to buy or sell and both having reasonable knowledge of relevant facts. In addition in the first quarter of fiscal year 2009, Ceramic recorded a $5.3 million impairment charge to write off all of its other intangible assets. These impairment charges are reported in the line item "Write down of long-lived assets" on the Consolidated Statements of Operations.
Utilizing an independent appraisal firm, KEMET also completed long-lived asset impairment tests in the second, third and fourth quarters of fiscal year 2009 and concluded that no further impairment existed.
At March 31, 2009, the Company recognized an impairment of $2.5 million which primarily relates to a manufacturing facility as the carrying amount of the facility is considered not fully recoverable based on an independent appraisal dated February 28, 2009. In addition, a research and development facility located in Heidenheim, Germany was closed and $1.2 million was recognized as an impairment due to the abandonment of long-lived assets.
During the third quarter of fiscal year 2008, Tantalum recognized a $1.2 million charge to reduce the carrying value of an idle facility located in Mauldin, South Carolina, which was classified as held for sale as of March 31, 2008. The write-down was based on an offer to purchase which ultimately did not result in a sale of the property. Also, in the third fiscal quarter, the Company recorded a $0.9 million impairment charge relating to a manufacturing facility in Heidenheim, Germany, which was included in the manufacturing relocation plan. During the fourth quarter of fiscal year 2008, Tantalum determined that certain equipment in the Evora, Portugal plant would be scrapped; and as a result, an impairment charge of $2.1 million was recorded to reduce the carrying value to the estimated scrap value. These impairment charges are recorded in the line item "Write down of long-lived assets" on the Consolidated Statements of Operations.
Note 4: Restructuring
Since the end of fiscal year 2002, the Company has initiated several restructuring programs (the "Plan") in order to reduce costs, to remove excess capacity, and to make the Company more competitive on a world-wide basis. Since the goals of each of these restructuring programs fall into one of the rationales listed above, the Company has elected to disclose the impacts on an annual basis rather than by each restructuring program.
100
KEMET CORPORATION AND SUBSIDIARIES
Notes to Consolidated Financial Statements (Continued)
Note 4: Restructuring (Continued)
A summary of the expenses aggregated on the Consolidated Statements of Operations line item "Restructuring charges" in the fiscal years ended March 31, 2010, 2009, and 2008, is as follows (amounts in thousands):
| |
Fiscal Years Ended March 31, | |||||||||
|---|---|---|---|---|---|---|---|---|---|---|
| |
2010 | 2009 | 2008 | |||||||
Manufacturing relocation costs |
$ | 1,559 | $ | 5,451 | $ | 8,157 | ||||
Personnel reduction costs |
7,639 | 25,423 | 17,184 | |||||||
Restructuring charges |
$ | 9,198 | $ | 30,874 | $ | 25,341 | ||||
Fiscal Year Ended March 31, 2010
In fiscal year 2010, the Company initiated the first phase of a restructuring plan to restructure Film and Electrolytic and to reduce overhead within the Company as a whole. Restructuring expense in fiscal year 2010 relate to this new plan and are primarily comprised of a headcount reduction of 57 employees in Finland, a headcount reduction of 32 employees in Portugal and a headcount reduction of 85 employees in Italy. There were also several headcount reductions at the executive level related to the Company's initiative to reduce overhead within the Company as a whole. In addition to the headcount reduction in Portugal, the Company incurred charges related to the relocation of equipment from Portugal to Mexico. Machinery not used for production in Portugal and not relocated to Mexico were disposed of and as such the Company recorded an impairment charge of $0.7 million to write down the equipment to scrap value. Overall, the Company incurred charges of $1.6 million related to the relocation of equipment to Mexico from Portugal and various other locations. The restructuring plan includes implementing programs to make the Company more competitive, removing excess capacity, moving production to lower cost locations, and eliminating unnecessary costs throughout the Company. Management anticipates incurring additional restructuring charges of approximately $30 million in fiscal year 2011. Restructuring charges of $9.2 million were incurred in fiscal year 2010 and $8.4 million remains as a liability on the Consolidated Balance Sheets at March 31, 2010. The Company expects the Film and Electrolytic restructuring plan to take approximately two to three years to complete.
Restructuring payments in the fiscal year ended March 31, 2010 primarily relate to a plan that was initiated in the second quarter of fiscal year 2009 to reduce the workforce in the Film and Electrolytic operations in the United Kingdom and France and to agreements with the labor unions representing employees at the Company's facilities in Italy. Restructuring expenses related to this plan were incurred in fiscal year 2009. The labor unions agreements allowed the Company to place up to 260 workers, on a rotation basis, on the Cassia Integrazione Guadagni Straordinaria ("CIGS") plan to save labor costs. CIGS is a temporary plan to save labor costs whereby a company may temporarily "lay off" employees while the government continues to pay their wages for a certain period of time, with a maximum of 36 months for the program. The employees who are in CIGS are not working, but are still employed by the Company. Only employees that are not classified as management or executive level personnel can participate in the CIGS program. Upon termination of the plan, the affected employees return to work. Total expenses incurred related to this plan were $5.2 million; restructuring charges of $2.4 million remain as a liability on the Consolidated Balance Sheets at March 31, 2010.
101
KEMET CORPORATION AND SUBSIDIARIES
Notes to Consolidated Financial Statements (Continued)
Note 4: Restructuring (Continued)
In addition to these two plans, the Company has initiated several restructuring programs over the past several fiscal years in order to reduce costs, remove excess capacity and make the Company more competitive on a worldwide basis. Since the goals of each of these restructuring programs fall into one of the rationales listed above, the Company has elected to disclose the annual impact of total restructuring rather than by each restructuring program.
Fiscal Year Ended March 31, 2009
Restructuring charges incurred during fiscal year 2009 totaled $30.9 million. The Company announced three initiatives to reduce fixed costs to be more in line with lower sales volumes. During the first quarter of fiscal year 2009, the Company recognized charges of $4.9 million primarily for reductions in workforce in Film and Electrolytic. In the second quarter of fiscal year 2009, the Company recognized charges of $16.1 million related to the rationalization of corporate staff and manufacturing support functions in the United States, Europe, Mexico, and Asia. Approximately 640 employees were affected by this action. During the third quarter of fiscal year 2009, the Company recognized charges of $3.5 million related primarily to the reduction of approximately 1,500 manufacturing positions representing approximately 14% of the Company's workforce. During the fourth quarter of fiscal year 2009, the Company incurred expenses of $0.9 million primarily related to the closing of sales offices. The Company also incurred expenses of $5.5 million related to the Company's manufacturing relocation plan.
Fiscal Year Ended March 31, 2008
Restructuring charges incurred during fiscal year 2008 totaled $25.3 million. These charges were primarily incurred as part of the Plan announced in July 2003 that included moving manufacturing operations from the United States to lower cost facilities in Mexico and China. There were global reductions in the Company's workforce throughout the year. The Company recognized expenditures of $8.2 million relating to the manufacturing relocation plan.
102
KEMET CORPORATION AND SUBSIDIARIES
Notes to Consolidated Financial Statements (Continued)
Note 4: Restructuring (Continued)
A reconciliation of the beginning and ending liability balances for restructuring charges included in the line items "Accrued expenses" and "Other non-current obligations" on the Consolidated Balance Sheets were as follows (amounts in thousands):
| |
Personnel Reductions |
Manufacturing Relocations |
|||||
|---|---|---|---|---|---|---|---|
Balance at March 31, 2007 |
$ | 941 | $ | — | |||
Costs charged to expense |
17,184 | 8,157 | |||||
Costs paid or settled |
(16,316 | ) | (8,157 | ) | |||
Change in foreign exchange |
26 | — | |||||
Balance at March 31, 2008 |
1,835 | — | |||||
Costs charged to expense |
25,423 |
5,451 |
|||||
Costs paid or settled |
(18,832 | ) | (5,451 | ) | |||
Change in foreign exchange |
(533 | ) | — | ||||
Balance at March 31, 2009 |
7,893 | — | |||||
Costs charged to expense |
7,639 |
1,559 |
|||||
Costs paid or settled |
(7,343 | ) | (1,559 | ) | |||
Change in foreign exchange |
209 | — | |||||
Balance at March 31, 2010 |
$ | 8,398 | $ | — | |||
Note 5: Goodwill and Intangible Assets
The Company tests goodwill and intangible assets with indefinite useful lives for impairment at least on an annual basis. During fiscal year 2009, the Company recognized an impairment of $174.3 million, reducing its goodwill balance to zero. Additionally, the Company recognized an impairment of $5.3 million related to intangible assets in Ceramic.
The changes in the carrying amount of goodwill for the year ended March 31, 2009 are as follows (amounts in thousands):
| |
Fiscal Year Ended March 31, 2009 |
|||
|---|---|---|---|---|
Balance at the beginning of fiscal year |
$ | 182,273 | ||
Impairment charges |
(174,327 | ) | ||
Adjustment related to prior year opening balance sheet deferred tax calculation |
(2,902 | ) | ||
Effect of foreign currency fluctuations |
(5,044 | ) | ||
Balance at the end of fiscal year |
$ | — | ||
103
KEMET CORPORATION AND SUBSIDIARIES
Notes to Consolidated Financial Statements (Continued)
Note 5: Goodwill and Intangible Assets (Continued)
In fiscal year 2008, the Company acquired Arcotronics Italia S.p.A. ("Arcotronics"), for a purchase price of $24.8 million and $8.5 million for acquisition related costs. The acquisition included manufacturing operations as well as certain research and development, marketing, and sales functions in various locations, primarily within Europe. Arcotronics is managed and reported under Film and Electrolytic. Goodwill and amortized intangibles related to the acquisition of Arcotronics amounted to $129.0 million and $11.2 million, respectively, at March 31, 2008. As previously noted, goodwill related to this acquisition was written off during fiscal year 2009.
In fiscal year 2008, the Company acquired Evox Rifa for a purchase price of $40.8 million, including $2.8 million for acquisition related costs. The acquisition included manufacturing operations as well as certain research and development, marketing, and sales functions in various locations, primarily within Europe. Evox Rifa is managed and reported under Film and Electrolytic. Goodwill and amortized intangibles related to the acquisition of Evox Rifa amounted to $17.9 million and $11.4 million, respectively, at March 31, 2008. As previously noted, goodwill related to this acquisition was written off during fiscal year 2009.
The following table highlights the Company's other intangible assets (amounts in thousands):
| |
March 31, 2010 | March 31, 2009 | |||||||||||||
|---|---|---|---|---|---|---|---|---|---|---|---|---|---|---|---|
| |
Carrying Amount |
Accumulated Amortization |
Carrying Amount |
Accumulated Amortization |
|||||||||||
Indefinite Lived Intangibles: |
|||||||||||||||
Trademarks |
$ | 7,617 | $ | — | $ | 7,617 | $ | — | |||||||
Amortized Intangibles: |
|||||||||||||||
Customer relationships, patents and other (3 - 18 years) |
18,911 | 4,729 | 21,447 | 4,970 | |||||||||||
|
$ | 26,528 | $ | 4,729 | $ | 29,064 | $ | 4,970 | |||||||
For fiscal years ended March 31, 2010, 2009 and 2008 amortization related to intangibles was $2.6 million, $3.7 million and $1.8 million, respectively. The weighted average useful live of amortized intangibles was 11 years and 12 years in fiscal years ended March 31, 2010 and 2009, respectively. Estimated amortization of intangible assets for the next five fiscal years and thereafter is $1.9 million, $1.4 million, $1.3 million, $0.8 million, $0.8 million and $8.0 million.
Note 6: Asset Sales
Tantalum completed two sales of fixed assets during fiscal year 2009. In the second quarter of fiscal year 2009, the Company sold assets related to the production and sale of wet tantalum capacitors to a subsidiary of Vishay. Cash proceeds of $33.7 million were received, net of amounts held in escrow, from the sale of these assets. At the same time, the Company entered into a three-year term loan for $15.0 million with Vishay. The sale resulted in a pre-tax gain of $28.3 million, which is net of related fees and amounts held in escrow. Proceeds of $1.5 million were held in escrow to secure the Company's obligations under the sales agreement and the Company received the entire $1.5 million in March 2010. The Company recorded the release of escrow funds as an additional gain of $1.5 million in fiscal year 2010 in the line item "Net gain on sales and disposals of assets" in the Consolidated Statements of Operations. Annual revenues generated from these assets were approximately $16.0 million.
104
KEMET CORPORATION AND SUBSIDIARIES
Notes to Consolidated Financial Statements (Continued)
Note 6: Asset Sales (Continued)
Also during the second quarter of fiscal year 2009, the Company sold a property which was classified as held for sale as of March 31, 2008. Proceeds from this sale were $1.2 million which approximated the carrying value.
In the ordinary course of business, the Company incurs losses due to the obsolescence and disposal of fixed assets. The net losses incurred in the ordinary course of business totaled $0.5 million, $2.8 million and $0.7 million in fiscal years 2010, 2009 and 2008, respectively and are included in the line item "Net gain on sales and disposals of assets" in the Consolidated Statements of Operations.
Note 7: Commitments
The Company has agreements with distributors and certain other customers that, under certain conditions, allow for returns of overstocked inventory, provide protection against price reductions initiated by the Company and grants other sales allowances. Allowances for these commitments are included in the Consolidated Balance Sheets as reductions in trade accounts receivable. The Company adjusts sales based on historical experience. Charges against sales in fiscal years 2010, 2009 and 2008 were $56.5 million, $58.0 million and $67.6 million, respectively. Actual applications against the allowances in fiscal years 2010, 2009 and 2008 were $55.5 million, $58.9 million and $68.1 million, respectively.
The Company's leases are primarily for distribution facilities or sales offices that expire principally between 2009 and 2018. A number of leases require the Company to pay certain executory costs (taxes, insurance, and maintenance) and contain certain renewal and purchase options. Annual rental expenses for operating leases were included in results of operations and were $7.3 million, $4.1 million and $4.2 million in fiscal years 2010, 2009, and 2008, respectively.
During fiscal year 2005, the Company subleased to a third party a 60,000 square foot facility and then leased back 5,000 square feet of this facility. Annual rental income from the sublease is included in the Consolidated Statements of Operations and was $0.2 million for fiscal years 2010, 2009 and 2008. The sublease rental expense was $0.2 million in fiscal years 2010, 2009, and 2008.
Future minimum lease payments over the next five fiscal years and thereafter under non-cancelable operating leases at March 31, 2010, are as follows (amounts in thousands):
| |
Fiscal Years Ended March 31, | |
|
|||||||||||||||||||
|---|---|---|---|---|---|---|---|---|---|---|---|---|---|---|---|---|---|---|---|---|---|---|
| |
2011 | 2012 | 2013 | 2014 | 2015 | Thereafter | Total | |||||||||||||||
Minimum lease payments |
$ | 7,660 | $ | 5,547 | $ | 4,497 | $ | 2,156 | $ | 1,074 | $ | 1,273 | $ | 22,207 | ||||||||
Sublease rental income |
(238 | ) | (238 | ) | (251 | ) | (252 | ) | (252 | ) | (21 | ) | (1,252 | ) | ||||||||
Net minimum lease payments |
$ | 7,422 | $ | 5,309 | $ | 4,246 | $ | 1,904 | $ | 822 | $ | 1,252 | $ | 20,955 | ||||||||
Note 8: Segment and Geographic Information
The Company is organized into three distinct business groups: Tantalum, Ceramic, and Film and Electrolytic based primarily on products lines. Each business group is responsible for the operations of certain manufacturing sites as well as all related research and development efforts. The sales and marketing functions are shared by each of the business groups and the costs of which are allocated to the business groups based on the business groups' respective budgeted net sales.
105
KEMET CORPORATION AND SUBSIDIARIES
Notes to Consolidated Financial Statements (Continued)
Note 8: Segment and Geographic Information (Continued)
Tantalum
Tantalum operates in five manufacturing sites in Portugal, Mexico and China and maintains a product innovation center in the United States. This business group produces tantalum and aluminum polymer capacitors. Tantalum products are sold in all regions of the world.
Ceramic
Ceramic operates in two manufacturing locations in Mexico and a finishing plant in China and maintains a product innovation center in the United States. This business group produces ceramic capacitors. Ceramic products are sold in all regions of the world.
Film and Electrolytic
Film and Electrolytic operates thirteen manufacturing sites throughout Europe and Asia and maintains a product innovation center in Sweden. This business group produces film, paper, and electrolytic capacitors. Film and Electrolytic products are sold in all regions in the world.
The following tables summarize information about each segment's net sales, operating income (loss), depreciation and amortization, capitalized expenditures and total assets (amounts in thousands):
| |
Fiscal Years Ended March 31, | ||||||||||
|---|---|---|---|---|---|---|---|---|---|---|---|
| |
2010 | 2009 | 2008 | ||||||||
Net sales: |
|||||||||||
Tantalum |
$ | 343,797 | $ | 366,675 | $ | 423,320 | |||||
Ceramic |
171,153 | 175,916 | 225,610 | ||||||||
Film and Electrolytic |
221,385 | 261,794 | 201,190 | ||||||||
|
$ | 736,335 | $ | 804,385 | $ | 850,120 | |||||
Operating income (loss)(1)(2)(3): |
|||||||||||
Tantalum |
$ | 28,424 | $ | 13,318 | $ | (1,752 | ) | ||||
Ceramic |
24,374 | (98,694 | ) | (4,487 | ) | ||||||
Film and Electrolytic |
(45,101 | ) | (185,736 | ) | (2,642 | ) | |||||
|
$ | 7,697 | $ | (271,112 | ) | $ | (8,881 | ) | |||
Depreciation and amortization: |
|||||||||||
Tantalum |
$ | 29,938 | $ | 32,921 | $ | 32,181 | |||||
Ceramic |
9,012 | 11,432 | 14,204 | ||||||||
Film and Electrolytic |
13,694 | 13,772 | 5,990 | ||||||||
|
$ | 52,644 | $ | 58,125 | $ | 52,375 | |||||
Capital expenditures: |
|||||||||||
Tantalum |
$ | 6,572 | $ | 10,766 | $ | 17,933 | |||||
Ceramic |
2,603 | 10,662 | 21,855 | ||||||||
Film and Electrolytic |
3,746 | 9,113 | 3,817 | ||||||||
|
$ | 12,921 | $ | 30,541 | $ | 43,605 | |||||
106
KEMET CORPORATION AND SUBSIDIARIES
Notes to Consolidated Financial Statements (Continued)
Note 8: Segment and Geographic Information (Continued)
| |
March 31, | |||||||
|---|---|---|---|---|---|---|---|---|
| |
2010 | 2009 | ||||||
Total assets: |
||||||||
Tantalum |
$ | 378,344 | $ | 357,075 | ||||
Ceramic |
169,564 | 155,558 | ||||||
Film and Electrolytic |
193,053 | 201,518 | ||||||
|
$ | 740,961 | $ | 714,151 | ||||
- (1)
- Restructuring charges included in Operating income (loss) were as follows (amounts in thousands):
| |
Fiscal Years Ended March 31, | ||||||||||
|---|---|---|---|---|---|---|---|---|---|---|---|
| |
2010 | 2009 | 2008 | ||||||||
Total restructuring: |
|||||||||||
Tantalum |
$ | 1,941 | $ | 11,388 | $ | 19,046 | |||||
Ceramic |
543 | 7,143 | 5,125 | ||||||||
Film and Electrolytic |
6,714 | 12,343 | 1,170 | ||||||||
|
$ | 9,198 | $ | 30,874 | $ | 25,341 | |||||
- (2)
- Impairment charges and write downs included in Operating income (loss) were as follows (amounts in thousands):
| |
Fiscal Years Ended March 31, | ||||||||||
|---|---|---|---|---|---|---|---|---|---|---|---|
| |
2010 | 2009 | 2008 | ||||||||
Impairment charges and write downs: |
|||||||||||
Tantalum |
$ | 656 | $ | 26,233 | $ | 4,218 | |||||
Ceramic |
— | 78,187 | — | ||||||||
Film and Electrolytic |
— | 137,531 | — | ||||||||
|
$ | 656 | $ | 241,951 | $ | 4,218 | |||||
- (3)
- (Gain) loss on sales and disposals of assets included in Operating income (loss) were as follows (amounts in thousands):
| |
Fiscal Years Ended March 31, | ||||||||||
|---|---|---|---|---|---|---|---|---|---|---|---|
| |
2010 | 2009 | 2008 | ||||||||
(Gain) loss on sale and disposals of assets: |
|||||||||||
Tantalum |
$ | (1,226 | ) | $ | (26,435 | ) | $ | (442 | ) | ||
Ceramic |
183 | 1,123 | (260 | ) | |||||||
Film and Electrolytic |
40 | (193 | ) | — | |||||||
|
$ | (1,003 | ) | $ | (25,505 | ) | $ | (702 | ) | ||
107
KEMET CORPORATION AND SUBSIDIARIES
Notes to Consolidated Financial Statements (Continued)
Note 8: Segment and Geographic Information (Continued)
The following highlights net sales by geographic location (amounts in thousands):
| |
Fiscal Years Ended March 31,(1) | |||||||||
|---|---|---|---|---|---|---|---|---|---|---|
| |
2010 | 2009 | 2008 | |||||||
United States |
$ | 167,638 | $ | 184,496 | $ | 212,021 | ||||
Hong Kong |
128,292 | 111,460 | 109,604 | |||||||
Europe(2)(3) |
119,709 | 144,567 | 186,229 | |||||||
Germany |
89,737 | 105,288 | 81,689 | |||||||
China |
71,963 | 86,140 | 74,426 | |||||||
Asia Pacific(2)(3) |
55,745 | 43,775 | 83,258 | |||||||
Singapore |
29,045 | 40,649 | 40,567 | |||||||
Italy |
25,155 | 36,977 | 14,982 | |||||||
United Kingdom |
19,485 | 20,809 | 16,074 | |||||||
Finland |
17,084 | 17,069 | 8,575 | |||||||
Other countries(2) |
12,502 | 13,155 | 22,695 | |||||||
|
$ | 736,355 | $ | 804,385 | $ | 850,120 | ||||
- (1)
- Revenues
are attributed to countries or regions based on the location of the customer. The Company sold $86.5 million, $81.6 million and
$101.0 million in fiscal years 2010, 2009 and 2008, respectively, to one customer, TTI, Inc.
- (2)
- No
country included in this caption exceeded 2% of consolidated net sales for 2010, 2009, and 2008.
- (3)
- Excluding the specific countries listed in this table.
The following geographic information includes long-lived assets, based on physical location (amounts in thousands):
| |
March 31, | ||||||
|---|---|---|---|---|---|---|---|
| |
2010 | 2009 | |||||
Mexico |
$ | 74,148 | $ | 82,066 | |||
Italy |
57,351 | 60,374 | |||||
Portugal |
66,451 | 78,459 | |||||
United States |
56,478 | 63,551 | |||||
China |
43,597 | 49,394 | |||||
Indonesia |
7,210 | 7,275 | |||||
Finland |
10,222 | 12,406 | |||||
United Kingdom |
8,967 | 9,594 | |||||
Other |
17,260 | 18,952 | |||||
|
$ | 341,684 | $ | 382,071 | |||
108
KEMET CORPORATION AND SUBSIDIARIES
Notes to Consolidated Financial Statements (Continued)
Note 9: Pension and Other Post-retirement Benefit Plans
The Company sponsors defined benefit pension plans which include seven in Europe, one in Singapore and two in Mexico. The Company funds the pension liabilities in accordance with laws and regulations applicable to those plans.
The Company has two post-retirement benefit plans: health care and life insurance benefits for certain retired United States employees who reach retirement age while working for the Company. The health care plan is contributory, with participants' contributions adjusted annually. The life insurance plan is non-contributory.
Effective March 1, 2009, the Company amended its post-retirement health care and life insurance benefit plans to eliminate all obligations for non-Union Carbide Corporation ("Union Carbide") grandfathered retirees. As a result of this amendment, the Company recognized a curtailment gain of $30.6 million.
109
KEMET CORPORATION AND SUBSIDIARIES
Notes to Consolidated Financial Statements (Continued)
Note 9: Pension and Other Post-retirement Benefit Plans (Continued)
A summary of the changes in benefit obligations and plan assets is as follows (amounts in thousands):
| |
Pension | Other Benefits | |||||||||||
|---|---|---|---|---|---|---|---|---|---|---|---|---|---|
| |
2010 | 2009 | 2010 | 2009 | |||||||||
Change in Benefit Obligation |
|||||||||||||
Benefit obligation at beginning of the year |
$ | 29,992 | $ | 28,973 | $ | 1,554 | $ | 15,602 | |||||
Service cost |
977 | 663 | — | 89 | |||||||||
Interest cost |
1,775 | 1,441 | 77 | 638 | |||||||||
Plan participants' contributions |
58 | 60 | 441 | 1,402 | |||||||||
Actuarial (gain) loss |
3,569 | 1,487 | 172 | (935 | ) | ||||||||
Foreign currency exchange rate change |
1,402 | (5,985 | ) | — | — | ||||||||
Gross benefits paid |
(1,492 | ) | (1,197 | ) | (849 | ) | (3,075 | ) | |||||
Plan amendments and other |
494 | 4,779 | — | (12,167 | ) | ||||||||
Curtailments |
— | (229 | ) | — | — | ||||||||
Benefit obligation at end of year |
$ | 36,775 | $ | 29,992 | $ | 1,395 | $ | 1,554 | |||||
Change in Plan Assets |
|||||||||||||
Fair value of plan assets at beginning of year |
$ | 10,730 | $ | 14,367 | $ | — | $ | — | |||||
Actual return on plan assets |
1,600 | (966 | ) | — | — | ||||||||
Foreign currency exchange rate changes |
627 | (2,697 | ) | — | — | ||||||||
Employer contributions |
1,343 | 1,163 | 408 | 1,673 | |||||||||
Plan participants' contributions |
58 | 60 | 441 | 1,402 | |||||||||
Gross benefits paid |
(1,492 | ) | (1,197 | ) | (849 | ) | (3,075 | ) | |||||
Fair value of plan assets at end of year |
$ | 12,866 | $ | 10,730 | $ | — | $ | — | |||||
Funded status at end of year |
|||||||||||||
Fair value of plan assets |
$ | 12,866 | $ | 10,730 | $ | — | $ | — | |||||
Benefit obligations |
(36,775 | ) | (29,992 | ) | (1,395 | ) | (1,554 | ) | |||||
Amount recognized at end of year |
$ | (23,909 | ) | $ | (19,262 | ) | $ | (1,395 | ) | $ | (1,554 | ) | |
The Company expects to contribute $2.8 million to the pension plans in fiscal year 2011, which includes benefit payments to be made for unfunded plans.
The Company expects to make no contributions to fund the post-retirement health care and life insurance benefit plans in fiscal year 2011 as the Company's policy is to pay benefits as costs are incurred.
110
KEMET CORPORATION AND SUBSIDIARIES
Notes to Consolidated Financial Statements (Continued)
Note 9: Pension and Other Post-retirement Benefit Plans (Continued)
Amounts recognized in the Consolidated Balance Sheets consist of the following (amounts in thousands):
| |
Pension | Other Benefits | |||||||||||
|---|---|---|---|---|---|---|---|---|---|---|---|---|---|
| |
2010 | 2009 | 2010 | 2009 | |||||||||
Noncurrent asset |
$ | — | $ | 65 | $ | — | $ | — | |||||
Current liability |
(1,953 | ) | (1,439 | ) | (159 | ) | (157 | ) | |||||
Noncurrent liability |
(21,956 | ) | (17,888 | ) | (1,236 | ) | (1,397 | ) | |||||
Amount recognized, end of year |
$ | (23,909 | ) | $ | (19,262 | ) | $ | (1,395 | ) | $ | (1,554 | ) | |
Amounts recognized in Accumulated other comprehensive income (loss), net of tax of $1.1 million and zero as of March 31, 2010 and 2009, respectively, consist of the following (amounts in thousands):
| |
Pension | Other Benefits | |||||||||||
|---|---|---|---|---|---|---|---|---|---|---|---|---|---|
| |
2010 | 2009 | 2010 | 2009 | |||||||||
Net actuarial loss (gain) |
$ | 5,677 | $ | 2,347 | $ | (2,410 | ) | $ | (2,971 | ) | |||
Prior service cost (credit) |
165 | 176 | — | — | |||||||||
Accumulated other comprehensive income |
$ | 5,842 | $ | 2,523 | $ | (2,410 | ) | $ | (2,971 | ) | |||
Components of benefit costs consist of the following (amounts in thousands):
| |
Pension | Other Benefits | ||||||||||||||||||
|---|---|---|---|---|---|---|---|---|---|---|---|---|---|---|---|---|---|---|---|---|
| |
2010 | 2009 | 2008 | 2010 | 2009 | 2008 | ||||||||||||||
Net service cost |
$ | 977 | $ | 662 | $ | 616 | $ | — | $ | 89 | $ | 117 | ||||||||
Interest cost |
1,725 | 1,441 | 941 | 77 | 638 | 933 | ||||||||||||||
Expected return on plan assets |
(586 | ) | (676 | ) | (482 | ) | — | — | — | |||||||||||
Amortization: |
||||||||||||||||||||
Actuarial gain |
(541 | ) | (3 | ) | — | (388 | ) | (218 | ) | (7 | ) | |||||||||
Prior service (credit) cost |
21 | 24 | 20 | — | (1,459 | ) | (2,376 | ) | ||||||||||||
Curtailment gain |
— | (201 | ) | (806 | ) | — | (30,634 | ) | — | |||||||||||
Net periodic benefit cost (credit) |
$ | 1,596 | $ | 1,247 | $ | 289 | $ | (311 | ) | $ | (31,584 | ) | $ | (1,333 | ) | |||||
The estimated amounts that will be amortized from accumulated other comprehensive income into net periodic benefit costs in fiscal year 2011 are actuarial gains of $(193,000), and prior service costs of $21,000.
111
KEMET CORPORATION AND SUBSIDIARIES
Notes to Consolidated Financial Statements (Continued)
Note 9: Pension and Other Post-retirement Benefit Plans (Continued)
The asset allocation for the Company's defined benefit pension plans at March 31, 2010 and the target allocation for 2010, by asset category, are as follows:
Asset Category
|
Target Allocation |
Plan Assets at March 31, 2010 |
|||||
|---|---|---|---|---|---|---|---|
Insurance(1) |
60 | % | 53.6 | % | |||
International equities |
15 | 28.2 | |||||
International bonds |
15 | 17.8 | |||||
Cash and cash equivalents |
10 | 0.4 | |||||
|
100 | % | 100.0 | % | |||
- (1)
- Primarily comprised of assets held by the defined benefit pension plan in Switzerland. These assets are fully insured and the insurance company guarantees that the defined benefit pension plan is fully funded. These assets are also guaranteed by the government in Switzerland.
The Company's investment strategy for its defined benefit pension plans is to maximize long-term rate of return on plan assets within an acceptable level of risk in order to minimize the cost of providing pension benefits. The investment policy establishes a target allocation range for each asset class and the fund is managed within those ranges. The plans use a number of investment approaches including insurance products, equity and fixed income funds in which the underlying securities are marketable in order to achieve this target allocation. Certain plans invest solely in insurance products. The Company continuously monitors the performance of the overall pension assets portfolio, asset allocation policies, and the performance of individual pension asset managers and makes adjustments and changes, as required. The Company does not manage any assets internally, does not have any passive investments in index funds, and does not directly utilize futures, options, or other derivative instruments or hedging strategies with regard to the pension plans; however, the investment mandate of some pension asset managers allows the use of the foregoing as components of their portfolio management strategies.
The expected rate of return was determined by modeling the expected long-term rates of return for broad categories of investments held by the plan against a number of various potential economic scenarios.
112
KEMET CORPORATION AND SUBSIDIARIES
Notes to Consolidated Financial Statements (Continued)
Note 9: Pension and Other Post-retirement Benefit Plans (Continued)
Other changes in plan assets and benefit obligations recognized in Accumulated other comprehensive income (loss) are as follows (amounts in thousands):
| |
Pension | Other Benefits | |||||||||||||||||
|---|---|---|---|---|---|---|---|---|---|---|---|---|---|---|---|---|---|---|---|
| |
2010 | 2009 | 2008 | 2010 | 2009 | 2008 | |||||||||||||
Curtailment effects |
$ | — | $ | — | $ | — | $ | — | $ | 30,311 | $ | — | |||||||
Current year actuarial (gain) loss |
2,556 | 3,129 | (854 | ) | 172 | (935 | ) | (1,291 | ) | ||||||||||
Foreign currency exchange rate changes |
243 | (402 | ) | — | 388 | — | — | ||||||||||||
Amortization of actuarial gain |
541 | 3 | — | — | 218 | 7 | |||||||||||||
Current year prior service (credit) cost |
— | (29 | ) | 34 | — | (12,167 | ) | 121 | |||||||||||
Amortization of prior service credit (cost) |
(21 | ) | (24 | ) | (20 | ) | — | 1,782 | 2,376 | ||||||||||
Total recognized in other comprehensive income |
$ | 3,319 | $ | 2,677 | $ | (840 | ) | $ | 560 | $ | 19,209 | $ | 1,213 | ||||||
Total recognized in net periodic benefit cost and other comprehensive income (loss) |
$ | 4,915 | $ | 3,924 | $ | (551 | ) | $ | 249 | $ | (12,375 | ) | $ | (120 | ) | ||||
In fiscal year 2009, the Company amended its post-retirement plan to eliminate all obligations for non-Union Carbide grandfathered retirees.
Each of these changes has been factored into the following benefit payments schedule for the next ten fiscal years. The Company expects to have benefit payments in the future as follows (amounts in thousands):
| |
Expected benefit payments | ||||||||||||||||||
|---|---|---|---|---|---|---|---|---|---|---|---|---|---|---|---|---|---|---|---|
| |
2011 | 2012 | 2013 | 2014 | 2015 | 2016 - 2020 | |||||||||||||
Pension benefits |
$ | 2,897 | $ | 1,331 | $ | 1,475 | $ | 1,706 | $ | 1,643 | $ | 10,747 | |||||||
Other benefits |
163 | 161 | 160 | 152 | 147 | 583 | |||||||||||||
|
$ | 3,060 | $ | 1,492 | $ | 1,635 | $ | 1,858 | $ | 1,790 | $ | 11,330 | |||||||
113
KEMET CORPORATION AND SUBSIDIARIES
Notes to Consolidated Financial Statements (Continued)
Note 9: Pension and Other Post-retirement Benefit Plans (Continued)
The following weighted-average assumptions were used to determine the projected benefit obligation at the measurement date and the net periodic cost for the pension and post-retirement plan (amounts in thousands except percentages):
| |
Pension | Other Benefits | |||||||||||||
|---|---|---|---|---|---|---|---|---|---|---|---|---|---|---|---|
| |
2010 | 2009 | 2010 | 2009 | |||||||||||
Projected benefit obligation: |
|||||||||||||||
Discount rate |
5.1 | % | 5.5 | % | 4.7 | % | 5.9 | % | |||||||
Rate of compensation increase |
2.9 | % | 2.8 | % | — | — | |||||||||
Net periodic benefit cost: |
|||||||||||||||
Discount rate |
5.6 | % | 5.6 | % | 5.9 | % | 6.0 | % | |||||||
Rate of compensation increase |
2.3 | % | 2.3 | % | — | — | |||||||||
Expected return on plan assets |
5.5 | % | 5.5 | % | — | — | |||||||||
Health care cost trend on covered charges |
— | — | 8.0 | % | 8.0 | % | |||||||||
|
decreasing to | decreasing to | |||||||||||||
|
ultimate trend | ultimate trend | |||||||||||||
|
of 5% in 2016 | of 5% in 2015 | |||||||||||||
Sensitivity of retiree welfare results |
|||||||||||||||
Effect of a one percentage point increase in assumed health care cost trend: |
|||||||||||||||
—On total service and interest costs components |
$ | 2 | $ | 32 | |||||||||||
—On post-retirement benefits obligation |
33 | 42 | |||||||||||||
Effect of a one percentage point decrease in assumed health care cost trend: |
|||||||||||||||
—On total service and interest costs components |
(2 | ) | (28 | ) | |||||||||||
—On post-retirement benefits obligation |
(30 | ) | (38 | ) | |||||||||||
The measurement date used to determine pension and post-retirement benefits is March 31.
The Company evaluated input from its third-party actuary to determine the appropriate discount rate. The determination of the discount rate is based on various factors such as the rate on bonds, term of the expected payouts, and long-term inflation factors.
114
KEMET CORPORATION AND SUBSIDIARIES
Notes to Consolidated Financial Statements (Continued)
Note 9: Pension and Other Post-retirement Benefit Plans (Continued)
The following table sets forth by level, within the fair value hierarchy as described in Note 1, the pension plan's assets, required to be carried at fair value on a recurring basis as of March 31, 2010 (amounts in thousands):
| |
|
Fair Value Measurement Using |
|
Fair Value Measurement Using |
||||||||||||||||||||||
|---|---|---|---|---|---|---|---|---|---|---|---|---|---|---|---|---|---|---|---|---|---|---|---|---|---|---|
| |
Fair Value March 31, 2010 |
Fair Value March 31, 2009 |
||||||||||||||||||||||||
| |
Level 1 | Level 2 | Level 3 | Level 1 | Level 2 | Level 3 | ||||||||||||||||||||
Assets: |
||||||||||||||||||||||||||
Cash and cash equivalents |
$ | 50 | $ | 50 | $ | — | $ | — | $ | 38 | $ | 38 | $ | — | $ | — | ||||||||||
Equity securities: |
||||||||||||||||||||||||||
International equities |
3,619 | 3,619 | — | — | 2,334 | 2,334 | — | — | ||||||||||||||||||
Fixed income securities: |
||||||||||||||||||||||||||
International bonds |
2,295 | 2,295 | — | — | 1,914 | 1,914 | — | — | ||||||||||||||||||
Insurance Contracts |
6,902 | — | — | 6,902 | 6,444 | — | — | 6,444 | ||||||||||||||||||
Total |
$ | 12,866 | $ | 5,964 | $ | — | $ | 6,902 | $ | 10,730 | $ | 4,286 | $ | — | $ | 6,444 | ||||||||||
The table below sets forth a summary of changes in the fair value of the domestic pension plan's Level 3 assets for the fiscal year ended March 31, 2010 (amounts in thousands):
Balance as of April 1, 2009 |
$ | 6,444 | ||
Actual return on plan assets |
57 | |||
Employer contributions |
570 | |||
Employee contributions |
58 | |||
Benefits paid |
(674 | ) | ||
Foreign currency exchange rate change |
447 | |||
Balance as of March 31, 2010 |
$ | 6,902 | ||
The Company also sponsors a deferred compensation plan for highly compensated employees. The plan is non-qualified and allows certain employees to contribute to the plan. Losses net of the Company matches related to the deferred compensation plan were $0.5 million in fiscal year 2010, $0.7 million in fiscal year 2009, and $0.3 million in fiscal year 2008. Total benefits accrued under this plan were $1.5 million at March 31, 2010 and $1.2 million at March 31, 2009.
In addition, the Company has a defined contribution retirement plan (the "Savings Plan") in which all United States employees who meet certain eligibility requirements may participate. A participant may direct the Company to contribute amounts, based on a percentage of the participant's compensation, to the Savings Plan through the execution of salary reduction agreements. In addition, the participants may elect to make after-tax contributions. Until January 1, 2009, the Company matched contributions to the Savings Plan up to 6% of the employee's salary. Effective January 1, 2009, the Company temporarily suspended its matching contributions, reducing contributions from 6% to 0%. Effective August 1, 2009, the Company reactivated our U.S. defined contribution retirement plan match. The Company made matching contributions of $1.0 million, $1.6 million, and $2.4 million in fiscal years 2010, 2009, and 2008, respectively. As part of the Savings Plan, employees were previously able to elect to purchase the Company's stock. Effective January 1, 2009, the option to elect purchases
115
KEMET CORPORATION AND SUBSIDIARIES
Notes to Consolidated Financial Statements (Continued)
Note 9: Pension and Other Post-retirement Benefit Plans (Continued)
of KEMET stock was eliminated. For fiscal years 2009 and 2008, the Savings Plan purchased 284,765 shares and 85,394 shares of KEMET stock, respectively.
Note 10: Income Taxes
The components of income (loss) before income taxes consist of (amounts in thousands):
| |
Fiscal Years Ended March 31, | |||||||||
|---|---|---|---|---|---|---|---|---|---|---|
| |
2010 | 2009 | 2008 | |||||||
Domestic (U.S.) |
$ | (72,265 | ) | $ | (140,663 | ) | $ | (40,855 | ) | |
Foreign (Outside U.S.) |
7,854 | (147,748 | ) | 20,751 | ||||||
|
$ | (64,411 | ) | $ | (288,411 | ) | $ | (20,104 | ) | |
The provision for Income tax expense (benefit) is as follows (amounts in thousands):
| |
Fiscal Years Ended March 31, | ||||||||||
|---|---|---|---|---|---|---|---|---|---|---|---|
| |
2010 | 2009 | 2008 | ||||||||
Current: |
|||||||||||
Federal |
$ | — | $ | 274 | $ | (961 | ) | ||||
State and local |
627 | 96 | 45 | ||||||||
Foreign |
2,358 | 4,574 | 3,685 | ||||||||
|
2,985 | 4,944 | 2,769 | ||||||||
Deferred: |
|||||||||||
State and local |
358 | (227 | ) | (1,996 | ) | ||||||
Foreign |
1,693 | (7,919 | ) | 4,338 | |||||||
|
2,051 | (8,146 | ) | 2,342 | |||||||
Provision (benefit) for income taxes |
$ | 5,036 | $ | (3,202 | ) | $ | 5,111 | ||||
116
KEMET CORPORATION AND SUBSIDIARIES
Notes to Consolidated Financial Statements (Continued)
Note 10: Income Taxes (Continued)
A reconciliation of the statutory federal income tax rate to the effective income tax rate is as follows:
| |
Fiscal Years Ended March 31, |
|||||||||
|---|---|---|---|---|---|---|---|---|---|---|
| |
2010 | 2009 | 2008 | |||||||
Statutory federal income tax rate |
35.0 | % | 35.0 | % | 35.0 | % | ||||
Goodwill impairment |
— | (21.3 | ) | — | ||||||
Taxable foreign source income |
(12.1 | ) | (4.3 | ) | (8.7 | ) | ||||
Tax credits |
(9.4 | ) | 3.3 | 38.4 | ||||||
Other permanent items |
(0.9 | ) | (0.1 | ) | (4.2 | ) | ||||
Change in valuation allowance |
(17.6 | ) | (10.8 | ) | (89.7 | ) | ||||
State income taxes, net of federal taxes |
(0.7 | ) | 0.4 | 3.7 | ||||||
Effect of foreign operations |
(2.0 | ) | (0.9 | ) | (3.8 | ) | ||||
Change in tax exposure reserves |
(0.1 | ) | (0.1 | ) | — | |||||
Benefit from amended federal returns |
— | — | 5.3 | |||||||
Other |
— | (0.1 | ) | (1.4 | ) | |||||
Effective income tax rate |
(7.8 | )% | 1.1 | % | (25.4 | )% | ||||
The components of deferred tax assets and liabilities are as follows (amounts in thousands):
| |
March 31, | ||||||||
|---|---|---|---|---|---|---|---|---|---|
| |
2010 | 2009 | |||||||
Deferred tax assets: |
|||||||||
Net operating loss carryforwards |
$ | 150,081 | $ | 168,086 | |||||
Stock warrant |
43,870 | — | |||||||
Tax credits |
16,156 | 25,507 | |||||||
Medical and employee benefits |
9,313 | 8,341 | |||||||
Sales allowances and inventory reserves |
7,049 | 9,979 | |||||||
Stock options |
3,727 | 3,316 | |||||||
Other |
8,060 | 8,547 | |||||||
Gross deferred tax assets |
238,256 | 223,776 | |||||||
Less valuation allowance |
(206,087 |
) |
(195,586 |
) |
|||||
Net deferred tax assets |
32,169 | 28,190 | |||||||
Deferred tax liabilities: |
|||||||||
Depreciation and differences in basis |
(18,278 | ) | (16,922 | ) | |||||
Amortization of intangibles and debt discounts |
(15,166 | ) | (12,858 | ) | |||||
Non-amortized intangibles |
(2,581 | ) | (2,569 | ) | |||||
Other |
(2,038 | ) | (1,156 | ) | |||||
Gross deferred tax liabilities |
(38,063 | ) | (33,505 | ) | |||||
Net deferred tax liability |
$ | (5,894 | ) | $ | (5,315 | ) | |||
117
KEMET CORPORATION AND SUBSIDIARIES
Notes to Consolidated Financial Statements (Continued)
Note 10: Income Taxes (Continued)
The change in net deferred income tax asset (liability) for the current year is presented below (amounts in thousands):
| |
Fiscal Year 2010 |
|||
|---|---|---|---|---|
Balance at March 31, 2009 |
$ | (5,315 | ) | |
Deferred income taxes related to continuing operations |
(2,051 | ) | ||
Deferred income taxes related to other comprehensive income |
1,065 | |||
Foreign currency translation |
407 | |||
Balance at March 31, 2010 |
$ | (5,894 | ) | |
As of March 31, 2010 and 2009, the Company's gross deferred tax assets are reduced by a valuation allowance of $206.1 million and $195.6 million, respectively. A full valuation allowance on U.S. and certain foreign jurisdiction's net deferred tax assets was determined to be necessary based on the existence of significant negative evidence such as a cumulative three-year loss of the Company. The valuation allowance increased $10.5 million during fiscal year 2010. The valuation allowance increase from the mark-to-market adjustment was partially offset by a reduction in the valuation allowance related to the utilization of federal and state net operating loss carryforwards during fiscal year 2010 and a reduction in foreign tax credits claimed.
In assessing the realizability of deferred tax assets, management considers whether it is more likely than not that some portion or all of the deferred tax assets will not be realized. The ultimate realization of deferred tax assets is dependent upon the generation of future taxable income during the periods in which those temporary differences become deductible. Management considers the scheduled reversal of deferred tax liabilities, projected future taxable income, and tax planning strategies in making this assessment. Based upon the level of historical taxable income and projections for future taxable income over the periods in which the deferred tax assets are deductible, management believes it is more likely than not that the Company will realize the benefits of these deductible differences, net of the existing valuation allowances as of March 31, 2010. The amount of deferred tax assets considered realizable; however, could be reduced in the near term if estimates of future taxable income during the carryforward period are reduced.
As of March 31, 2010, the Company has U.S. net operating loss carryforwards for federal and state income tax purposes of $290.2 million and $339.7 million, respectively. These net operating losses are available to offset future federal and state taxable income, if any, through 2029. Foreign subsidiaries in Italy, Portugal, Finland, Sweden, China, Switzerland, and Bulgaria had net operating loss carryforwards totaling $152.0 million of which $16.0 million will expire in one year if unused. There is a greater likelihood of not realizing the future tax benefits of these deferred tax assets; and accordingly, the Company has recorded valuation allowances related to the net deferred tax assets in these jurisdictions.
Utilization of the Company's net operating loss carryforwards may be subject to substantial annual limitation due to the ownership change limitations provided by the Internal Revenue Code of 1986, as amended (the "Code") and similar state provisions. Such an annual limitation could result in the expiration of the net operating loss and tax credit carryforwards before utilization. The issuance of the Closing Warrant may have given rise to an "ownership change" for purposes of Section 382 of the Code. If such an ownership change were deemed to have occurred, the amount of our taxable income
118
KEMET CORPORATION AND SUBSIDIARIES
Notes to Consolidated Financial Statements (Continued)
Note 10: Income Taxes (Continued)
that could be offset by the Company's net operating loss carryovers in taxable years after the ownership change would be severely limited. While the Company believes that the issuance of the Closing Warrant did not result in an ownership change for purposes of Section 382 of the Code, there is no assurance that the Company's view will be unchallenged. Moreover, a future exercise of part or all of the Closing Warrant may give rise to an ownership change in the future.
At March 31, 2010, $0.6 million of the $150.1 million deferred tax asset for net operating losses represented losses generated by stock option deductions in excess of book expense. The valuation allowance related to the $0.6 million deferred tax asset generated by stock option deductions would be credited to equity when recognized.
Deferred tax expense (benefit) of $1.1 million was attributed to other comprehensive income (loss) for the fiscal year ended March 31, 2010.
The Company conducts business in China through subsidiaries that qualify for a tax holiday. The tax holiday will terminate on January 1, 2012 for one subsidiary, and January 1, 2013 for two other subsidiaries. For calendar years 2009, 2010 and 2011 the statutory tax rate of 25% is reduced to 10%, 11% and 24%, respectively for the one subsidiary. For the other two subsidiaries, for calendar years 2009, 2010, 2011 and 2012, the statutory rate of 25% is reduced to 0%, 12.5%, 12.5% and 12.5%, respectively. For the fiscal year ended March 31, 2010, the Company realized a tax benefit of $1.5 million from the tax holiday.
At March 31, 2010, unremitted earnings of the subsidiaries outside the United States were deemed to be permanently invested. The Company has $43.4 million of unremitted foreign earnings. No current plans are expected for repatriation and no deferred tax liability was recognized with regard to such earnings. It is not practicable to estimate the income tax liability that might be incurred if such earnings were remitted to the United States.
At March 31, 2010, the Company had $5.0 million of unrecognized tax benefits. A reconciliation of gross unrecognized tax benefits (excluding interest and penalties) is as follows (amounts in thousands):
| |
Fiscal Years Ended March 31, |
||||||
|---|---|---|---|---|---|---|---|
| |
2010 | 2009 | |||||
Beginning of fiscal year |
$ | 5,010 | $ | 4,995 | |||
Additions for tax positions of the current year |
266 | 283 | |||||
Additions for tax positions of prior years |
56 | 430 | |||||
Reductions for tax positions of prior years |
— | (128 | ) | ||||
Lapse in statute of limitations |
— | (48 | ) | ||||
Settlements |
(322 | ) | (522 | ) | |||
End of fiscal year |
$ | 5,010 | $ | 5,010 | |||
At March 31, 2010 $0.4 million of the $5.0 million of unrecognized tax benefits would affect the Company's effective tax rate, if recognized. The Company does not expect that the balances with respect to its uncertain tax positions will change significantly during fiscal year 2011.
The Company files income tax returns in the U.S. and multiple foreign jurisdictions, including various state and local jurisdictions. The U.S. Internal Revenue Service concluded its examinations of
119
KEMET CORPORATION AND SUBSIDIARIES
Notes to Consolidated Financial Statements (Continued)
Note 10: Income Taxes (Continued)
the Company's U.S. federal tax returns for all tax years through 2003. Because of net operating losses, the Company's U.S. federal returns for 2003 and later years will remain subject to examination until the losses are utilized. With few exceptions, the Company is no longer subject to foreign income tax examinations by tax authorities for years before fiscal year 2004.
The Company recognizes potential accrued interest and penalties related to unrecognized tax benefits within its global operations in income tax expense. The Company had $0.2 million and $0.3 million of accrued interest and penalties at March 31, 2010 and March 31, 2009, respectively, which is included as a component of income tax expense. During fiscal year 2010, the Company did not recognize any potential interest associated with uncertain tax positions. To the extent interest and penalties are not assessed with respect to uncertain tax positions, amounts accrued will be reduced and reflected as a reduction of the overall income tax provision.
Note 11: Stock-Based Compensation
The Company's stock-based compensation plans are broad-based, long-term retention programs intended to attract and retain talented employees and align stockholder and employee interests. The major components of share-based compensation expense are as follows (amounts in thousands):
| |
Fiscal Years Ended March 31, | |||||||||
|---|---|---|---|---|---|---|---|---|---|---|
| |
2010 | 2009 | 2008 | |||||||
Employee stock options |
$ | 665 | $ | 1,158 | $ | 1,622 | ||||
Performance vesting stock options |
— | — | 940 | |||||||
Restricted stock |
39 | 238 | 452 | |||||||
Long-term incentive plan |
1,161 | (326 | ) | 326 | ||||||
|
$ | 1,865 | $ | 1,070 | $ | 3,340 | ||||
For fiscal years 2010, 2009 and 2008, compensation expense associated with all stock-based compensation plans of $1.4 million, $0.8 million and $1.9 million, respectively was recorded in the line item "Selling, general and administrative expense" on the Consolidated Statements of Operations. For fiscal years 2010, 2009 and 2008, compensation expense associated with all share-based compensation plans of $0.5 million, $0.3 million and $1.4 million, respectively was recorded in the line item "Cost of sales" on the Consolidated Statements of Operations.
Employee Stock Options
At March 31, 2010, the Company had three option plans that reserved shares of common stock for issuance to executives and key employees: the 1992 Key Employee Stock Option Plan, the 1995 Executive Stock Plan, and the 2004 Long-Term Equity Incentive Plan. All of these plans were approved by the Company's stockholders. These plans authorized the grant of up to 12.1 million shares of the Company's common stock. The Company has no plans to purchase additional shares in conjunction with its employee stock option program in the near future. Options issued under these plans vest in one or two years and expire ten years from the grant date.
120
KEMET CORPORATION AND SUBSIDIARIES
Notes to Consolidated Financial Statements (Continued)
Note 11: Stock-Based Compensation (Continued)
Employee stock option activity for fiscal year 2010 is as follows (amounts in thousands, except exercise price, fair value and contractual life):
| |
Options | Weighted- Average Exercise Price |
|||||
|---|---|---|---|---|---|---|---|
Outstanding at March 31, 2009 |
3,527 | $ | 8.26 | ||||
Granted |
1,667 | 1.03 | |||||
Forfeited |
(93 | ) | 6.35 | ||||
Expired |
(461 | ) | 11.80 | ||||
Outstanding at March 31, 2010 |
4,640 | 5.35 | |||||
Exercisable at March 31, 2010 |
2,360 | $ | 9.51 | ||||
Remaining weighted average contractual life of options exercisable (years) |
4.8 |
||||||
The weighed average grant-date fair value during fiscal years 2010, 2009 and 2008 was $0.49, $0.47 and $3.45. The total estimated fair value of shares vested during fiscal years 2010, 2009 and 2008 was $1.3 million, $1.3 million and $3.4 million, respectively.
The following table sets forth the exercise prices, the number of options outstanding and exercisable and the remaining contractual lives of the Company's stock options as of March 31, 2010 (amounts in thousands except exercise price and contractual life):
| Options Outstanding | Options Exercisable | |||||||||||||||
|---|---|---|---|---|---|---|---|---|---|---|---|---|---|---|---|---|
Range of Exercise Prices ($) |
Number Outstanding at 3/31/10 |
Weighted-Average Remaining Contractual Life (years) |
Weighted-Average Exercise Price ($) |
Number Exercisable at 3/31/10 |
Weighted-Average Exercise Price ($) |
|||||||||||
| 0.29 to 0.57 | 826 | 9.3 | 0.57 | — | — | |||||||||||
| 0.58 to 1.32 | 538 | 8.6 | 0.78 | — | — | |||||||||||
| 1.33 to 2.77 | 915 | 9.5 | 1.62 | — | — | |||||||||||
| 2.78 to 7.25 | 601 | 5.5 | 6.97 | 600 | 6.97 | |||||||||||
| 7.26 to 7.72 | 635 | 7.2 | 7.57 | 635 | 7.57 | |||||||||||
| 7.73 to 11.50 | 485 | 4.1 | 8.44 | 485 | 8.44 | |||||||||||
| 11.51 to 14.50 | 356 | 3.6 | 12.77 | 356 | 12.77 | |||||||||||
| 14.51 to 17.50 | 284 | 1.3 | 16.93 | 284 | 16.93 | |||||||||||
| 4,640 | 7.0 | 5.35 | 2,360 | 9.51 | ||||||||||||
As of March 31, 2010, the intrinsic value related to options outstanding or exercisable was $1.0 million. Total unrecognized compensation cost, net of estimated forfeitures, related to non-vested options was $1.0 million as of March 31, 2010. This cost is expected to be recognized over a weighted-average period of 1.5 years. At March 31, 2010 and 2009, respectively, the weighted average exercise price of stock options expected to vest was $1.04 and $3.64, respectively.
The Company measures the fair value of each employee stock option grant at the date of grant using a Black-Scholes option pricing model. This model requires the input of assumptions regarding a
121
KEMET CORPORATION AND SUBSIDIARIES
Notes to Consolidated Financial Statements (Continued)
Note 11: Stock-Based Compensation (Continued)
number of complex and subjective variables that will usually have a significant impact on the fair value estimate. The following table summarizes the weighted average assumptions used in the Black-Scholes valuation model to value stock option grants:
| |
Fiscal Years Ended March 31, |
||||||||||
|---|---|---|---|---|---|---|---|---|---|---|---|
| |
2010 | 2009 | 2008 | ||||||||
Assumptions: |
|||||||||||
Expected volatility |
64.6 | % | 58.8 | % | 40.5 | % | |||||
Risk-free interest rate |
3.2 | % | 3.5 | % | 3.6 | % | |||||
Expected option lives in years |
3.2 | 3.5 | 6.0 | ||||||||
Dividend yield |
— | — | — | ||||||||
The expected volatility is based on a seven year historical volatility calculation of the Company's stock price. The risk-free rate is based on the U.S. Treasury yield with a maturity commensurate with the expected term, which was between three years and six years for the fiscal years ended March 31, 2010, 2009 and 2008. The expected term is based on the Company's historical option term which considers the weighted-average vesting, contractual term and two-year cliff vesting. In addition, stock-based compensation expense is calculated based on the number of awards that are ultimately expected to vest, and therefore has been reduced for estimated forfeitures. The Company's estimate of expected forfeitures is based on the Company's actual historical annual forfeiture rate of 3.6%. The estimated forfeiture rate, which is evaluated each balance sheet date throughout the life of the award, provides a time-based adjustment of forfeited shares. The estimated forfeiture rate is reassessed at each balance sheet date and may change based on new facts and circumstances. The dividend yield is based on a set dividend rate of 0.0% as the Company has not paid and does not anticipate paying dividends.
All options plans provide that options to purchase shares be supported by the Company's authorized but unissued common stock or treasury stock. All restricted stock and performance awards are also supported by the Company's authorized but unissued common stock or treasury stock. The prices of the options granted pursuant to these plans are not less than 100% of the value of the shares on the date of the grant.
Performance Vesting Stock Options
During fiscal year 2006, the Company issued 500,000 performance awards with a weighted-average exercise price of $8.05 to the Chief Executive Officer which will entitle him to receive shares of common stock if and when the stock price maintains certain thresholds. These awards are open ended until they vest and will have a ten-year life after vesting or will expire on the third year following retirement, whichever comes first. Effective March 4, 2010, 250,000 of these awards were voluntarily relinquished and no concurrent grant, replacement award or other valuable consideration was provided.
The weighted-average grant-date fair value of these awards was $5.64 per share.
122
KEMET CORPORATION AND SUBSIDIARIES
Notes to Consolidated Financial Statements (Continued)
Note 11: Stock-Based Compensation (Continued)
The Company measured the fair value of each performance stock award at the date of grant using the Monte Carlo option pricing model with the following assumptions:
| |
Fiscal Year Ended March 31, 2007 |
||||
|---|---|---|---|---|---|
Assumptions: |
|||||
Expected volatility |
49.2 | % | |||
Risk-free interest rate |
4.5 | % | |||
Expected option lives in years |
6.0 | ||||
Dividend yield |
— | ||||
Restricted stock activity for fiscal year 2010 is as follows (amounts in thousands except fair value):
| |
Shares | Weighted- average Fair Value on Grant Date ($) |
|||||
|---|---|---|---|---|---|---|---|
Non-vested restricted stock at beginning of period |
18 | 0.51 | |||||
Granted |
318 | 1.26 | |||||
Vested |
(68 | ) | 0.35 | ||||
Non-vested restricted stock at end of period |
268 | 1.44 | |||||
Restricted Stock
The Company grants shares of restricted stock to members of the Board of Directors and the Chief Executive Officer. Restricted stock granted to the Board of Directors vests in one year while restricted stock granted to the Chief Executive Officer vests immediately. The contractual term on restricted stock is indefinite. As of March 31, 2010, unrecognized compensation costs related to the unvested restricted stock share based compensation arrangements granted was $0.4 million. The expense is estimated to be recognized over a period of one year. As of March 31, 2009, unrecognized compensation costs related to the unvested restricted stock share based compensation arrangements granted was $9,000. The costs were recognized over a period of one year.
Restricted Stock and Long-Term Incentive Plans ("LTIP")
2007/2008 LTIP
In fiscal year 2007, the Board of Directors approved a long-term incentive plan ("2007/2008 LTIP") which entitled the holders to receive restricted shares of common stock in May 2008 if certain performance measures were met as compared to a peer group index and if the Company met a prescribed two year earnings per share target for the combined fiscal years ending in March 2007 and 2008. Effective May 15, 2008, the measurement date, management determined that the earnings per share target was achieved and as such 180,000 shares were owed to plan participants.
123
KEMET CORPORATION AND SUBSIDIARIES
Notes to Consolidated Financial Statements (Continued)
Note 11: Stock-Based Compensation (Continued)
The Company measured the fair value of each peer company performance stock award at the date of grant using the Monte Carlo option pricing model with the following assumptions:
| |
Fiscal Year Ended March 31, 2007 |
|||
|---|---|---|---|---|
Assumptions: |
||||
Expected volatility |
38.0 | % | ||
Risk-free interest rate |
4.8 | % | ||
Expected option lives in years |
1.5 | |||
Dividend yield |
— | |||
2008/2009 LTIP
In fiscal year 2008, the Board of Directors approved a long-term incentive plan ("2008/2009 LTIP") which entitled the participants to receive up to 134,153 shares of common stock of the Company in May 2009 if certain performance measures were met as compared to the S&P 600 Smallcap Index and up to 249,140 shares if the Company met a prescribed two year earnings per share target. During the first quarter of fiscal year 2009, all of the participants in the 2008/2009 LTIP entered into cancellation agreements; and accordingly, the 2008/2009 LTIP was cancelled.
The Company measured the fair value of each peer company performance stock award at the date of grant using the Monte Carlo option pricing model with the following assumptions:
| |
Fiscal Year Ended March 31, 2008 | ||||
|---|---|---|---|---|---|
Assumptions: |
|||||
Expected volatility |
38.0 | % | |||
Risk-free interest rate |
4.8 | % | |||
Expected option lives in years |
1.5 | ||||
Dividend yield |
— | ||||
2009/2010 LTIP
During the first quarter of fiscal year 2009, the Board of Directors approved a long-term incentive plan ("2009/2010 LTIP") based upon the achievement of an earnings per share target for the combined fiscal years ending in March 2009 and 2010. These awards vest on the measurement date of May 15, 2010.
The 2009/2010 LTIP entitles the participants to receive up to 685,799 shares of KEMET common stock if the target financial metric is realized. Each fiscal quarter, the Company assessed the likelihood of meeting the target financial metric and concluded in each quarter that the target would not be achieved. Accordingly, no compensation expense was recorded during fiscal year 2010 or 2009.
2010/2011 LTIP
During the first quarter of fiscal year 2010, the Board of Directors approved a new long-term incentive plan ("2010/2011 LTIP") based upon the achievement of an EBITDA target for the combined
124
KEMET CORPORATION AND SUBSIDIARIES
Notes to Consolidated Financial Statements (Continued)
Note 11: Stock-Based Compensation (Continued)
fiscal years ending in March 2010 and 2011. The 2010/2011 LTIP provides for an award which will be paid out in cash.
The 2010/2011 LTIP entitles the participants to receive cash and at the time of the award and at the sole discretion of the compensation committee they may receive up to 15% of the award as shares of KEMET common stock. Each fiscal quarter the Company assessed the likelihood of meeting the target financial metric and recognized compensation expense for fiscal year 2010 of $2.2 million and the related liability is reflected in the line item "Other non-current obligations" on the Consolidated Balance Sheets.
In the Operating activities section of the Consolidated Statements of Cash Flows, stock-based compensation expense was treated as an adjustment to net loss for fiscal years 2010, 2009 and 2008.
Note 12: Supplemental Balance Sheets and Statements of Operations Detail (amounts in thousands)
| |
March 31, | |||||||
|---|---|---|---|---|---|---|---|---|
| |
2010 | 2009 | ||||||
Accounts receivable: |
||||||||
Trade |
$ | 144,889 | $ | 128,778 | ||||
Other |
10,731 | 7,307 | ||||||
|
155,620 | 136,085 | ||||||
Allowance for doubtful accounts |
(2,925 | ) | (4,000 | ) | ||||
Ship-from-stock and debit |
(7,404 | ) | (8,551 | ) | ||||
Returns |
(1,685 | ) | (1,405 | ) | ||||
Rebates |
(1,096 | ) | (174 | ) | ||||
Price protection |
(346 | ) | (164 | ) | ||||
Other |
(369 | ) | (1,652 | ) | ||||
|
$ | 141,795 | $ | 120,139 | ||||
Inventories: |
||||||||
Raw materials and supplies |
$ | 60,758 | $ | 59,687 | ||||
Work in process |
52,158 | 48,105 | ||||||
Finished goods |
37,592 | 47,189 | ||||||
|
$ | 150,508 | $ | 154,981 | ||||
125
KEMET CORPORATION AND SUBSIDIARIES
Notes to Consolidated Financial Statements (Continued)
Note 12: Supplemental Balance Sheets and Statements of Operations Detail (amounts in thousands) (Continued)
| |
|
March 31, | ||||||||
|---|---|---|---|---|---|---|---|---|---|---|
| |
Useful life (years) | |||||||||
| |
2010 | 2009 | ||||||||
Property, plant and equipment: |
||||||||||
Land and land improvements |
20 | $ | 22,939 | $ | 22,765 | |||||
Buildings |
20 - 40 | 141,617 | 138,341 | |||||||
Machinery and equipment |
10 | 775,899 | 771,274 | |||||||
Furniture and fixtures |
4 - 10 | 53,520 | 49,553 | |||||||
Construction in progress |
12,861 | 23,010 | ||||||||
Total property and equipment |
1,006,836 | 1,004,943 | ||||||||
Accumulated depreciation |
(686,958 | ) | (646,966 | ) | ||||||
|
$ | 319,878 | $ | 357,977 | ||||||
Accrued expenses: |
||||||||||
Salaries, wages, and related employee costs |
$ | 22,382 | $ | 13,971 | ||||||
Vacation |
10,673 | 10,455 | ||||||||
European social security accrual |
5,057 | 4,534 | ||||||||
Restructuring |
8,121 | 5,643 | ||||||||
Interest |
2,661 | 4,254 | ||||||||
Distribution expense |
2,592 | 2,468 | ||||||||
Pension and postretirement medical plans |
2,112 | 1,596 | ||||||||
Other |
10,008 | 10,672 | ||||||||
|
$ | 63,606 | $ | 53,593 | ||||||
Other non-current obligations: |
||||||||||
Pension and postretirement medical plans |
$ | 23,191 | $ | 19,285 | ||||||
Employee separation liability |
20,059 | 21,140 | ||||||||
European social security accrual |
7,037 | 12,018 | ||||||||
Long term incentive plan accrual |
2,170 | — | ||||||||
Deferred compensation |
1,558 | 1,192 | ||||||||
Long-term lease |
589 | 567 | ||||||||
Non-current restructuring |
276 | 2,250 | ||||||||
Other |
746 | 864 | ||||||||
|
$ | 55,626 | $ | 57,316 | ||||||
126
KEMET CORPORATION AND SUBSIDIARIES
Notes to Consolidated Financial Statements (Continued)
Note 12: Supplemental Balance Sheets and Statements of Operations Detail (amounts in thousands) (Continued)
| |
Fiscal Years Ended March 31, | ||||||||||
|---|---|---|---|---|---|---|---|---|---|---|---|
| |
2010 | 2009 | 2008 | ||||||||
Other (income) expense, net: |
|||||||||||
Foreign exchange transaction (gains) losses, net |
$ | 4,105 | $ | (14,079 | ) | $ | (5,316 | ) | |||
Loss on sale of securities |
— | — | 341 | ||||||||
Other |
16 | (5 | ) | 563 | |||||||
|
$ | 4,121 | $ | (14,084 | ) | $ | (4,412 | ) | |||
Note 13: Contingencies
The Company or its subsidiaries are at any one time parties to a number of lawsuits arising out of their respective operations, including workers' compensation or work place safety cases, some of which involve claims of substantial damages. Although there can be no assurance, based upon information known to the Company, the Company does not believe that any liability which might result from an adverse determination of such lawsuits would have a material adverse effect on the Company's financial condition or results of operations.
Note 14: Loss Per Share
Basic earnings per share calculation is based on the weighted-average number of common shares outstanding. Diluted earnings per share calculation is based on the weighted-average number of common shares outstanding adjusted by the number of additional shares that would have been outstanding had the potentially dilutive common shares been issued. Potentially dilutive shares of common stock include stock options and Closing Warrant.
The following table presents the basic and diluted weighted-average number of shares of common stock (amounts in thousands, except per share data):
| |
Fiscal Years Ended March 31, | ||||||||||
|---|---|---|---|---|---|---|---|---|---|---|---|
| |
2010 | 2009 | 2008 | ||||||||
Net loss |
$ | (69,447 | ) | $ | (285,209 | ) | $ | (25,215 | ) | ||
Weighted-average common shares outstanding |
80,912 |
80,572 |
83,400 |
||||||||
Effect of potentially dilutive securities: |
|||||||||||
Stock options and Closing Warrant |
— | — | — | ||||||||
Weighted-average shares outstanding (diluted) |
80,912 | 80,572 | 83,400 | ||||||||
Basic and diluted loss per share |
$ | (0.86 | ) | $ | (3.54 | ) | $ | (0.30 | ) | ||
Note 15: Common Stock
The Board of Directors previously authorized a share buyback program to purchase up to 11.3 million shares of its common stock on the open market. On February 1, 2008, the Company announced that it was reactivating its share buyback program. Under the terms of the approval by its Board, the Company is authorized to repurchase up to 5.9 million shares of its common stock. Through March 31, 2008, the Company purchased 3.7 million shares for $18.2 million and no additional shares
127
KEMET CORPORATION AND SUBSIDIARIES
Notes to Consolidated Financial Statements (Continued)
Note 15: Common Stock (Continued)
were repurchased during fiscal years 2010 and 2009. At March 31, 2010 and 2009, the Company held 7.4 million shares and 7.7 million, respectively shares of treasury stock at a cost of $56.9 million and $59.4 million, respectively.
Note 16: Acquisitions
Fiscal Year 2008 Acquisitions
Evox Rifa Group Oyj
On April 24, 2007, pursuant to the terms of a Combination Agreement between KEMET Electronics Corporation, a wholly-owned subsidiary of KEMET Corporation, and Evox Rifa, the Company purchased 92.7% of Evox Rifa pursuant to a tender offer which commenced on March 12, 2007, and was completed on April 12, 2007. Evox Rifa had 178.2 million shares outstanding at the time of the commencement of the tender offer. The Company purchased 165.2 million shares at a price of €0.12 per share or €19.8 million ($27.0 million). The Company announced at the time that it intended to acquire the remaining outstanding shares pursuant to a squeeze-out process. Following the settlement of the completion trades relating to the tender offer, Evox Rifa became a subsidiary of the Company. In September 2007, the Company completed the squeeze-out process and accordingly, purchased the remaining outstanding shares of Evox Rifa for €1.8 million ($2.4 million). This additional amount is considered part of the purchase price of the acquisition.
In addition, pursuant to the tender offer, the Company offered to acquire all of the outstanding loan notes under the convertible capital loan issued by Evox Rifa for a consideration corresponding to the aggregate of the nominal amount per loan note of €100 plus accrued interest up to and including the closing date of the tender offer. The outstanding amount of the loan notes and accrued interest at the time of the commencement of the tender offer totaled €5.9 million ($8.1 million). Holders of 95.7% of the convertible capital loan notes issued by Evox Rifa tendered their loan notes pursuant to the tender offer; and consequently, the Company redeemed these notes as of April 24, 2007. In addition to the payment made for the shares and loan notes, the Company assumed €19.5 million ($26.6 million) in outstanding indebtedness of Evox Rifa.
The Company acquired Evox Rifa to expand its product offerings and technology base and to strengthen its business in the European marketplace.
The acquisition of Evox Rifa, included in operating results from the acquisition date, was accounted for using the purchase method and accordingly, the purchase price was allocated to the assets purchased and liabilities assumed based upon their respective fair values at the date of the acquisition. The fair value, at the date of acquisition, of the net assets acquired and the liabilities assumed were $105.2 million and $64.4 million, respectively. The excess of the purchase price over the fair value of the net assets acquired, at the acquisition date, of $15.3 million was recorded as goodwill. Goodwill is not deductible for tax purposes. The fair value of intangible assets, other than goodwill, was $10.0 million and based, in part, on a valuation using an income approach and estimates and assumptions provided by management.
128
KEMET CORPORATION AND SUBSIDIARIES
Notes to Consolidated Financial Statements (Continued)
Note 16: Acquisitions (Continued)
The total purchase price for Evox Rifa was $40.8 million and is comprised of (amounts in millions):
Common stock purchases |
$ | 29.9 | ||
Acquisition of convertible debt |
8.1 | |||
Acquisition related costs |
2.8 | |||
|
$ | 40.8 | ||
The purchase price was determined through arms-length negotiations between representatives of the Company and Evox Rifa.
The following table presents the final allocations of the aggregate purchase price based on the assets and liabilities estimated fair values (amounts in millions):
| |
Fair Value | |||
|---|---|---|---|---|
Cash |
$ | 1.7 | ||
Accounts receivable |
23.7 | |||
Inventories |
24.1 | |||
Other current assets |
1.8 | |||
Property, plant and equipment |
28.6 | |||
Intangible assets |
10.0 | |||
Goodwill |
15.3 | |||
Current liabilities |
(46.5 | ) | ||
Other long-term obligations |
(17.9 | ) | ||
Total net assets acquired |
$ | 40.8 | ||
The assigned fair value of $10.0 million relating to intangible assets includes values of $6.4 million for customer relationships, $3.1 million for technology, and $0.5 million for favorable lease-hold agreements. In fiscal year 2009, all of the goodwill related to Evox Rifa was impaired.
Arcotronics Italia S.p.A.
On October 12, 2007, pursuant to the terms of a Stock Purchase Agreement between KEMET Electronics Corporation, a wholly owned subsidiary of KEMET Corporation, and Blue Skye (Lux) S.à r.l. ("Blue Skye"), the Company purchased 100% of Arcotronics from Blue Skye. The acquisition includes manufacturing facilities in Sasso Marconi, Monghidoro, and Vergato, Italy; Landsberg, Germany; Towcester, United Kingdom; Kyustendil, Bulgaria; and Anting-Shanghai, China.
The Company paid €17.5 million ($24.8 million) for 100% of the outstanding share capital of Arcotronics, assumed net financial debt of €98.0 million ($138.9 million), and certain other long-term liabilities of the company totaling €35.1 million ($49.8 million).
The Company acquired Arcotronics to expand its newly-acquired Film and Electrolytic business segment on a global scale. The Company was specifically attracted to Arcotronics' product offerings and technology base.
129
KEMET CORPORATION AND SUBSIDIARIES
Notes to Consolidated Financial Statements (Continued)
Note 16: Acquisitions (Continued)
The acquisition of Arcotronics, included in operating results from the acquisition date, was accounted for using the purchase method of accounting. Accordingly, the purchase price was allocated to the assets purchased and liabilities assumed based upon their fair values at the date of the acquisition. The fair value of the net assets acquired and the liabilities assumed were $212.4 million and $294.9 million, respectively. The allocation of the purchase price was based upon their respective fair values at the date of acquisition. The excess of the purchase price over the fair values of the net assets acquired of $115.7 million was recorded as goodwill. Goodwill is not deductible for income tax purposes. The fair value of intangible assets, other than goodwill, was $10.8 million and based, in part, on a valuation using an income approach and estimates and assumptions provided by management.
In connection with the acquisition, the Company entered into credit facilities with UniCredit whereby UniCredit agreed to lend to the Company up to €47.0 million ($66.8 million). The Company used a portion of this facility to repay a portion of the outstanding indebtedness of Arcotronics, with the balance available for general corporate purposes.
The total purchase price for Arcotronics was $33.3 million which includes (amounts in millions):
Common stock purchases |
$ | 24.8 | ||
Acquisition related costs |
8.5 | |||
Total purchase price |
$ | 33.3 | ||
The purchase price was determined through arms-length negotiations between representatives of the Company and Blue Skye.
The following table presents the final allocations of the aggregate purchase price based on the assets and liabilities estimated fair values (amounts in millions):
| |
Fair Value | |||
|---|---|---|---|---|
Cash |
$ | 2.6 | ||
Accounts receivable |
62.2 | |||
Inventories |
42.4 | |||
Assets held for sale |
5.7 | |||
Other current assets |
3.1 | |||
Property, plant and equipment |
84.2 | |||
Other long term assets |
1.6 | |||
Intangible assets |
10.8 | |||
Goodwill |
115.7 | |||
Current liabilities |
(106.3 | ) | ||
Short- and long-term debt |
(138.9 | ) | ||
Other long-term obligations |
(49.8 | ) | ||
Total net assets acquired |
$ | 33.3 | ||
In fiscal year 2009, all of the goodwill related to Arcotronics was impaired.
130
KEMET CORPORATION AND SUBSIDIARIES
Notes to Consolidated Financial Statements (Continued)
Note 16: Acquisitions (Continued)
The following table presents the amounts assigned to intangible assets (amounts in millions except useful life data):
| |
Fair Value |
Useful Life (years) |
|||||
|---|---|---|---|---|---|---|---|
Customer relationships |
$ | 7.3 | 16 | ||||
Trademarks |
2.8 | 3 | |||||
Technology and other |
0.7 | 5 | |||||
|
$ | 10.8 | |||||
Subsequent to the acquisition, on November 28, 2007, the Company entered into a Quota Purchase Agreement (the "Agreement") with Morphic Business Development AB ("Morphic"), whereby the Company sold to Morphic its 80% corporate capital share in Arcotronics Fuel Cells S.r.l. In conjunction with the Agreement, Morphic paid consideration for the purchase of the aforementioned shares the amount of €4.0 million ($5.7 million). No gain or loss was recorded as a result of this sale.
Unaudited Pro Forma Financial Information
The unaudited financial information in the table below summarizes the combined results of operations of the Company, Arcotronics and Evox Rifa, on a pro forma basis, as though the companies had been combined as of the beginning of each of the periods presented. The pro forma financial information is presented for informational purposes only and is not indicative of the results of operations that would have been achieved if the acquisitions had taken place at the beginning of fiscal year 2008 (amounts in millions, except per share data):
Net sales |
$ | 949.9 | ||
Net loss |
(33.0 | ) | ||
Net loss per share: |
||||
Basic and diluted |
$ | (0.40 | ) |
The above amounts for the fiscal year ended March 31, 2008 reflect adjustments for depreciation of the revalued properties, amortization of the intangibles acquired, a reduction in interest income for the cash used to purchase the business, a reduction in the interest expense on the convertible notes that the Company purchased, and related tax effects for the aforementioned adjustments. The unaudited pro forma financial information for fiscal year 2008 combines the historical results of the Company and six months of pro forma results for Arcotronics. The pro forma amounts do not include anticipated synergies from the acquisition.
Note 17: Quarterly Results of Operations (Unaudited)
The following table sets forth certain quarterly information for fiscal years 2010 and 2009. This information, in the opinion of our management, reflects all adjustments (consisting only of normal recurring adjustments) necessary to present fairly this information when read in conjunction with the
131
KEMET CORPORATION AND SUBSIDIARIES
Notes to Consolidated Financial Statements (Continued)
Note 17: Quarterly Results of Operations (Unaudited) (Continued)
consolidated financial statements and notes thereto included elsewhere herein (amounts in thousands except per share data):
| |
Fiscal Year 2010 Quarters Ended | ||||||||||||
|---|---|---|---|---|---|---|---|---|---|---|---|---|---|
| |
30-Jun | 30-Sep | 31-Dec | 31-Mar | |||||||||
Net sales |
$ | 150,167 | $ | 173,265 | $ | 199,923 | $ | 212,980 | |||||
Operating income (loss)(1) |
(2,501 | ) | (2,887 | ) | 6,236 | 6,849 | |||||||
Net income (loss) |
25,090 | (93,075 | ) | (1,779 | ) | 317 | |||||||
Net income (loss) per share (basic and diluted) |
$ | 0.31 | $ | (1.15 | ) | $ | (0.02 | ) | $ | — | |||
| |
Fiscal Year 2009 Quarters Ended | ||||||||||||
|---|---|---|---|---|---|---|---|---|---|---|---|---|---|
| |
30-Jun | 30-Sep | 31-Dec | 31-Mar | |||||||||
Net sales(2) |
$ | 242,844 | $ | 234,819 | $ | 190,679 | $ | 136,043 | |||||
Operating income (loss)(1) |
(180,631 | ) | (79,478 | ) | (8,191 | ) | (2,812 | ) | |||||
Net income (loss) |
(189,375 | ) | (85,068 | ) | (13,148 | ) | 2,382 | ||||||
Net income (loss) per share (basic and diluted) |
$ | (2.36 | ) | $ | (1.06 | ) | $ | (0.16 | ) | $ | 0.03 | ||
- (1)
- Operating
income (loss) as a percentage of net sales fluctuates from quarter to quarter due to a number of factors, including net sales fluctuations,
restructuring and impairment charges, product mix, the timing and expense of moving product lines to lower-cost locations, and the relative mix of sales among distributors, original
equipment manufacturers, electronic manufacturing service providers and non-recurring charges including goodwill impairment, the write-down of long lived assets, the net gain
on sales and disposals of assets and curtailment gains on benefit plans.
- (2)
- The global economic downturn worsened over the course of fiscal year 2009 and led to sequentially decreasing sales in each quarter, particularly in the fourth quarter. This decrease in sales is attributable to distributors reducing their inventories in order to allow them to operate in line with forecasted customer demand and lower demand from our electronic manufacturing services and original equipment manufacturing customers.
Note 18: Subsequent Events
The Company has evaluated events and material transactions for potential recognition or disclosure occurring between the end of the Company's fiscal year and the time that this Form 10-K was filed with the SEC.
On May 5, 2010, the Company completed a private placement of $230.0 million in aggregate principal amount of the Company's 10.5% Senior Notes due 2018 to several initial purchasers (the "Initial Purchasers") represented by Banc of America Securities LLC pursuant to an exemption from the registration requirements under the Securities Act of 1933, as amended (the "Securities Act"). The Initial Purchasers subsequently sold the 10.5% Senior Notes to qualified institutional buyers pursuant to Rule 144A under the Securities Act and to persons outside of the United States pursuant to Regulation S under the Securities Act.
The private placement of the 10.5% Senior Notes resulted in proceeds to the Company of $222.2 million. The Company used a portion of the proceeds of the private placement to repay all of its outstanding indebtedness under the Company's credit facility with K Financing, LLC, the
132
KEMET CORPORATION AND SUBSIDIARIES
Notes to Consolidated Financial Statements (Continued)
Note 18: Subsequent Events (Continued)
Company's €60 million credit facility and €35 million credit facility with UniCredit and the Company's term loan with Vishay and used a portion of the remaining proceeds to fund a previously announced tender offer to purchase $40.5 million in aggregate principal amount of the Company's Convertible Notes due 2026 and to pay costs incurred in connection with the private placement, the tender offer and the foregoing repayments. The Company incurred approximately $6.4 million in fees and expense reimbursements related to the execution of this offering, these costs are capitalized and will be amortized over the term of the 10.5% Senior Notes.
The 10.5% Senior Notes were issued pursuant to an Indenture (the "10.5% Senior Notes Indenture"), dated as of May 5, 2010, by and among the Company, the Company's domestic restricted subsidiaries (the "Guarantors") and Wilmington Trust Company, as trustee (the "Trustee"). The 10.5% Senior Notes will mature on May 1, 2018, and bear interest at a stated rate of 10.5% per annum, payable semi-annually in cash in arrears on May 1 and November 1 of each year, beginning on November 1, 2010. The 10.5% Senior Notes are senior obligations of the Company and will be guaranteed by each of the Guarantors and secured by a first priority lien on 51% of the capital stock of certain of the Company's foreign restricted subsidiaries.
The terms of the 10.5% Senior Notes Indenture will, among other things, limit the ability of the Company and its restricted subsidiaries to (i) incur additional indebtedness or issue certain preferred stock; (ii) pay dividends on, or make distributions in respect of, their capital stock or repurchase their capital stock; (iii) make certain investments or other restricted payments; (iv) sell certain assets; (v) create liens or use assets as security in other transactions; (vi) enter into sale and leaseback transactions; (vii) merge, consolidate or transfer or dispose of substantially all of their assets; (viii) engage in certain transactions with affiliates; and (ix) designate their subsidiaries as unrestricted subsidiaries. These covenants are subject to a number of important limitations and exceptions that are described in the 10.5% Senior Notes Indenture.
The 10.5% Senior Notes will be redeemable, in whole or in part, on any time on or after May 1, 2014, at the redemption prices specified in the 10.5% Senior Notes Indenture. At any time prior to May 1, 2013, the Company may redeem up to 35% of the aggregate principal amount of the 10.5% Senior Notes with the net cash proceeds from certain equity offerings at a redemption price equal to 110.5% of the principal amount thereof, together with accrued and unpaid interest, if any, to the redemption date. In addition, at any time prior to May 1, 2014, the Company may redeem the 10.5% Senior Notes, in whole or in part, at a redemption price equal to 100% of the principal amount of the 10.5% Senior Notes so redeemed, plus a "make whole" premium and together with accrued and unpaid interest, if any, to the redemption date.
Upon the occurrence of a change of control triggering event specified in the 10.5% Senior Notes Indenture, the Company must offer to purchase the 10.5% Senior Notes at a redemption price equal to 101% of the principal amount thereof, plus accrued and unpaid interest, if any, to the date of purchase.
The 10.5% Senior Notes Indenture provides for customary events of default (subject in certain cases to customary grace and cure periods), which include nonpayment, breach of covenants in the 10.5% Senior Notes Indenture, payment defaults or acceleration of other indebtedness, a failure to pay certain judgments and certain events of bankruptcy and insolvency. The 10.5% Senior Notes Indenture also provides for events of default with respect to the collateral, which include default in the performance of (or repudiation, disaffirmation or judgment of unenforceability or assertion of unenforceability) by the Company or a Guarantor with respect to the provision of security documents
133
KEMET CORPORATION AND SUBSIDIARIES
Notes to Consolidated Financial Statements (Continued)
Note 18: Subsequent Events (Continued)
under the 10.5% Senior Notes Indenture. These events of default are subject to a number of important qualifications, limitations and exceptions that are described in the 10.5% Senior Notes Indenture. Generally, if an event of default occurs, the Trustee or holders of at least 25% in principal amount of the then outstanding 10.5% Senior Notes may declare the principal of and accrued but unpaid interest, including additional interest, on all the 10.5% Senior Notes to be due and payable.
On May 17, 2010, the Company consummated a tender offer tender offer to purchase $40.5 million in aggregate principal amount of the Company's Convertible Notes. The Company used $37.9 million from the bond offering discussed above to extinguish the tendered notes. The Company incurred approximately $0.2 million in fees and expense reimbursements related to the execution of this tender offer, these fees will be included in the loss on extinguishment. The Company funded these costs primarily with proceeds from the 10.5% Senior Notes offering.
Registration Rights Agreement
On May 5, 2010, in connection with the private placement of the 10.5% Senior Notes, the Company, the Guarantors and the initial purchasers of the 10.5% Senior Notes entered into a Registration Rights Agreement (the "Registration Rights Agreement"). The terms of the Registration Rights Agreement require the Company and the Guarantors to (i) use their commercially reasonable efforts to file with the Securities and Exchange Commission within 210 days after the date of the initial issuance of the 10.5% Senior Notes, a registration statement with respect to an offer to exchange the 10.5% Senior Notes for a new issue of debt securities registered under the Securities Act, with terms substantially identical to those of the 10.5% Senior Notes (except for provisions relating to the transfer restrictions and payment of additional interest); (ii) use their commercially reasonable efforts to consummate such exchange offer within 270 days after the date of the initial issuance of the 10.5% Senior Notes; and (iii) in certain circumstances, file a shelf registration statement for the resale of the 10.5% Senior Notes. If the Company and the Guarantors fail to satisfy their registration obligations under the Registration Rights Agreement, then the Company will be required to pay additional interest to the holders of the 10.5% Senior Notes, up to a maximum additional interest rate of 1.0% per annum.
The foregoing description of the 10.5% Senior Notes Indenture and the Registration Rights Agreement does not purport to be complete and is qualified in its entirety by reference to the full text of the 10.5% Senior Notes Indenture and Registration Rights Agreement.
134
Pursuant to the requirements of Section 13 or 15(d) of the Securities Exchange Act of 1934, the registrant has duly caused this report to be signed on its behalf by the undersigned, thereunto duly authorized.
| KEMET CORPORATION (Registrant) |
||
Date: May 25, 2010 |
/s/ WILLIAM M. LOWE, JR. William M. Lowe, Jr. Executive Vice President and Chief Financial Officer |
Pursuant to the requirements of the Securities Exchange Act of 1934, this report has been signed below by the following persons on behalf of the registrant and in the capacities and on the dates indicated.
| Date: May 25, 2010 | /s/ PER-OLOF LOOF Per-Olof Loof Chief Executive Officer and Director (Principal Executive Officer) |
|
Date: May 25, 2010 |
/s/ WILLIAM M. LOWE, JR. William M. Lowe, Jr. Executive Vice President and Chief Financial Officer (Principal Accounting and Financial Officer) |
|
Date: |
Frank G. Brandenberg Chairman and Director |
|
Date: May 25, 2010 |
/s/ DR. WILFRIED BACKES Dr. Wilfried Backes Director |
|
Date: May 25, 2010 |
/s/ GURMINDER S. BEDI Gurminder S. Bedi Director |
|
Date: May 25, 2010 |
/s/ JOSEPH V. BORRUSO Joseph V. Borruso Director |
135
| Date: May 25, 2010 | /s/ E. ERWIN MADDREY, II E. Erwin Maddrey, II Director |
|
Date: May 25, 2010 |
/s/ ROBERT G. PAUL Robert G. Paul Director |
|
Date: May 25, 2010 |
/s/ JOSEPH D. SWANN Joseph D. Swann Director |
136