Attached files
| file | filename |
|---|---|
| EX-31.1 - EXHIBIT - INDEPENDENT BANK CORP | exhibit311.htm |
| EX-32.1 - EXHIBIT - INDEPENDENT BANK CORP | exhibit321-indb10xka.htm |
| EX-23.1 - EXHIBIT - INDEPENDENT BANK CORP | exhibit231-indb10xka.htm |
| EX-31.2 - EXHIBIT - INDEPENDENT BANK CORP | exhibit312-indb10xka.htm |
| EX-31.3 - EXHIBIT - INDEPENDENT BANK CORP | exhibit313-indb10xka.htm |
| EX-32.2 - EXHIBIT - INDEPENDENT BANK CORP | exhibit322-indb10xka.htm |
United States Securities and Exchange Commission
Washington, D.C. 20549
FORM 10-K/A
(Amendment No. 1)
x | ANNUAL REPORT PURSUANT TO SECTION 13 OR 15(d) OF THE SECURITIES EXCHANGE ACT OF 1934 |
For the fiscal year ended December 31, 2012
or
o | TRANSITION REPORT PURSUANT TO SECTION 13 OR 15(d) OF THE SECURITIES EXCHANGE ACT OF 1934 |
For the transition period from to
Commission File Number: 1-9047
Independent Bank Corp.
(Exact name of registrant as specified in its charter)
Massachusetts | 04-2870273 |
(State or other jurisdiction of incorporation or organization) | (I.R.S. Employer Identification No.) |
Office Address: 2036 Washington Street, Hanover Massachusetts Mailing Address: 288 Union Street, Rockland, Massachusetts (Address of principal executive offices) | 02339 02370 (Zip Code) |
Registrant’s telephone number, including area code:
(781) 878-6100
Securities registered pursuant to Section 12(b) of the Act:
Title of each class | Name of each exchange on which registered |
Common Stock, $.0l par value per share | NASDAQ Global Select Market |
Preferred Stock Purchase Rights | NASDAQ Global Select Market |
Securities registered pursuant to section 12(g) of the Act:
None
Indicate by check mark if the registrant is a well-known seasoned issuer, as defined in Rule 405 of the Securities Act. Yes o No x
Indicate by check mark if the registrant is not required to file reports pursuant to Section 13 or Section 15(d) of the Act. Yes o No x
Indicate by check mark whether the registrant (1) has filed all reports required by Section 13 or 15(d) of the Securities Exchange Act of 1934 during the preceding 12 months (or for such shorter period that the registrant was required to file such reports), and (2) has been subject to such filing requirements for the past 90 days. Yes x No o
Indicate by check mark whether the registrant has submitted electronically and posted on its corporate Website, if any, every Interactive Data File required to be submitted and posted pursuant to Rule 405 of Regulation S-T (232.405 of this chapter) during the preceding 12 months (or for such shorter period that the registrant was required to submit and post such files). Yes x No o
Indicate by check mark if disclosure of delinquent filers pursuant to Item 405 of Regulation S-K (229.405 of this chapter) is not contained herein, and will not be contained, to the best of registrant’s knowledge, in definitive proxy or information statements incorporated by reference in Part III of this Form 10-K or any amendment to this Form 10-K. x
Indicate by check mark whether the registrant is a large accelerated filer, an accelerated filer, a non-accelerated filer or a smaller reporting company. See the definitions of “large accelerated filer,: “accelerated filer” and “smaller reporting company” in Rule 12b-2 of the Exchange Act. (check one):
Large Accelerated filer o | Accelerated filer x | Non-accelerated filer o | Smaller reporting company o | |||
Indicate by check mark whether the registrant is a shell company (as defined in Rule 12b-2 of the Exchange Act). Yes o No x
The aggregate market value of the voting common stock held by non-affiliates of the registrant, computed by reference to the closing price of such stock on June 30, 2012, was approximately $585,587,884.
Indicate the number of shares outstanding of each of the registrant’s classes of common stock, as of the latest practicable date. February 28, 2013 22,776,461
DOCUMENTS INCORPORATED BY REFERENCE
List hereunder the following documents if incorporated by reference and the Part of the Form 10-K (e.g., Part I, Part II, etc.) into which the document is incorporated: (1) Any annual report to security holders; (2) Any proxy or information statement; and (3) Any prospectus filed pursuant to Rule 424(b) or (c) under the Securities Act of 1933. The listed documents should be clearly described for identification purposes (e.g., annual report to security holders for fiscal year ended December 24, 1980).
Portions of the Registrant’s definitive proxy statement for its 2013 Annual Meeting of Stockholders are incorporated into Part III, Items 10-13 of this Form 10-K.
______________________________________________________________________________________________________
EXPLANATORY NOTE
We are filing this Amendment No. 1 (this “Amendment”) to our Annual Report on Form 10-K for the fiscal year ended December 31, 2012 (the “Form 10-K”) to correct omissions from Items 7 and 9A in the initial Form 10-K filing and to correct a typographical error on the certification included as Exhibit 31.1 to the initial Form 10-K filing, as described below.
In Item 7. Management's Discussion and Analysis of Financial Condition and Results of Operations (“MD&A”) of the Form 10-K, the text indicating that the numbers of certain tables and charts appearing in the Executive Level Overview portion of the MD&A are reflected in thousands of dollars was inadvertently omitted from the table/chart header. This text is included where applicable in the version of Item 7 filed with this Amendment.
This Amendment also includes the conformed signature of Ernst & Young LLP on the Report of Independent Registered Public Accounting Firm (the “Report”) in Item 9A. Controls and Procedures. The Report had been physically signed by Ernst & Young LLP prior to the initial Form 10-K filing, but the conformed signature was unintentionally omitted from the initial Form 10-K when filed.
This Amendment also includes an amended form of the certification filed as Exhibit 31.1 to the initial 10-K filing that corrects a typographical error with respect to the date of the certificate. The amended Exhibit 31.1 included with this Amendment properly reflects the date the certificate was executed, which was the date of the filing March 12, 2013, while the version of this certification included with the initial 10-K filing stated the date of the certification as March 13, 2013.
Other than the above mentioned changes, we have made no other changes to Items 7 or 9A or to Exhibit 31.1 as they appeared in the initial Form 10-K filing. This Amendment does not amend any other information set forth in the initial Form 10-K, and we have not updated disclosures contained therein to reflect any events that may have occurred at a date subsequent to the date the initial Form 10-K was filed.
______________________________________________________________________________________________________
ITEM 7. MANAGEMENT'S DISCUSSION AND ANAYLISIS OF FINANCIAL CONDITION AND RESULTS OF OPERATIONS
The Company is a state chartered, federally registered bank holding company, incorporated in 1985. The Company is the sole stockholder of Rockland Trust, a Massachusetts trust company chartered in 1907. For a full list of corporate entities see Item 1 “Business — General” hereto.
All material intercompany balances and transactions have been eliminated in consolidation. When necessary, certain amounts in prior year financial statements have been reclassified to conform to the current year’s presentation. The following should be read in conjunction with the Consolidated Financial Statements and related notes thereto.
Executive Level Overview
2012 Results
The Company reported net income of $42.6 million in 2012 as compared to $45.4 million in 2011. 2012 was negatively impacted by merger and acquisition expenses, goodwill impairment and a higher provision for loan losses associated with strong growth in the loan portfolio as well as increased loan losses, primarily due to a commercial loan fraud.
Management considers certain of these items to be non-core in nature and presents the following discussion of operating earnings as a non-GAAP measure, intended to provide the reader with a sense of the performance of its core banking business.
Net income on an operating basis improved to $47.1 million in 2012, as compared to $45.5 million in 2011, an increase of 3.6%. These results were due to a combination of:
• | Strong organic loan growth (+8.3%) and organic deposit growth (+8.1%) |
• | Declining net interest margin, reflecting the challenging interest rate environment |
• | Solid growth in noninterest income (+16.4%) |
• | Good expense control |
• | Increased provision for loan losses |
The following table illustrates key performance measures for the periods indicated:
Years Ended December 31 | |||||||
2012 | 2011 | ||||||
(Dollars in thousands, except per share data) | |||||||
Net income | $ | 42,627 | $ | 45,436 | |||
Net income on an operating basis | $ | 47,097 | $ | 45,456 | |||
Diluted earnings per share | $ | 1.95 | $ | 2.12 | |||
Diluted earnings per share on an operating basis | $ | 2.16 | $ | 2.12 | |||
Return on average assets | 0.83 | % | 0.96 | % | |||
Return on average common equity | 8.66 | % | 9.93 | % | |||
Net interest margin | 3.75 | % | 3.90 | % | |||
Recognizing the importance of noninterest income, management continued to focus on growing this category. 2012 represented strong growth in noninterest income in the absolute (+16.4%) and as a percentage of total revenue (increased to 26.0%).
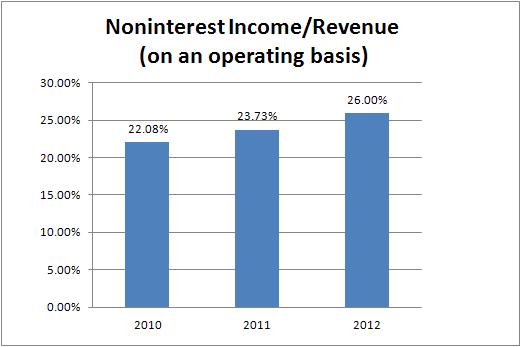
The increases in noninterest income for the year ended 2012 were driven by the following items:
• | Interchange and ATM fees increased to by 26.5% to $9.8 million in 2012, from $7.7 million in 2011. The increase was partially due to increased debit card usage by the Bank's customers following increased promotion and sales activities. |
• | Mortgage banking income is up $2.3 million, reflective of strong mortgage originations and refinancing activity due to the low rate environment. |
• | Investment management income also increased by $1.2 million as assets under management has steadily climbed to $2.2 billion at December 31, 2012 |
Noninterest expense increased over the prior year by 9.4% to $159.5 million. The increase in noninterest expense is largely related to the Bank's merger and acquisition expenses of $6.7 million and a $2.2 million goodwill impairment charge. Exclusive of these and other non-core charges, noninterest expense was well contained, increasing by 3.8% from the prior year. The Company's efficiency ratio, on an operating basis, has seen improvement during 2012, decreasing to 64.5%. The following chart shows the improving trends in the Company's efficiency ratio, on an operating basis, over the past three years:
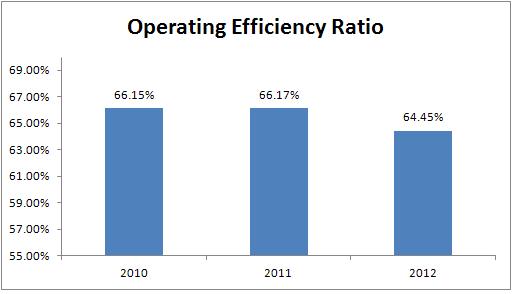
(1) The operating efficiency ratio is calculated by dividing noninterest expense by the sum of net interest income and noninterest income.
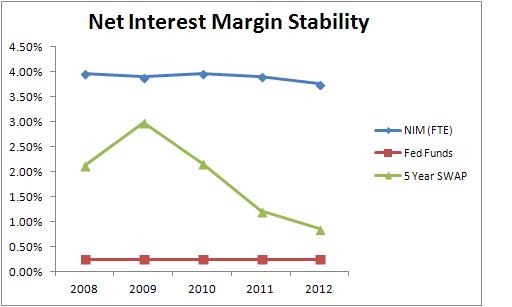
The net interest margin for the year decreased to 3.75%, down 15 basis points from the prior year, due to the prolonged low rate environment. However, the Company has been able to counter this pressure with the robust loan growth, especially within its commercial and home equity portfolios, both of which experienced double digit organic growth for the year, with commercial increasing by 11.7% and home equity increasing by 14.1%. The Company continues to focus on its ability to generate commercial loan originations as part of its strategic growth plan and was successful in doing so, originating $896.9 million in commercial loans during 2012. The following table shows the stability in the net interest margin as compared to the federal funds rate and the 5 year swap rate over the past five years:
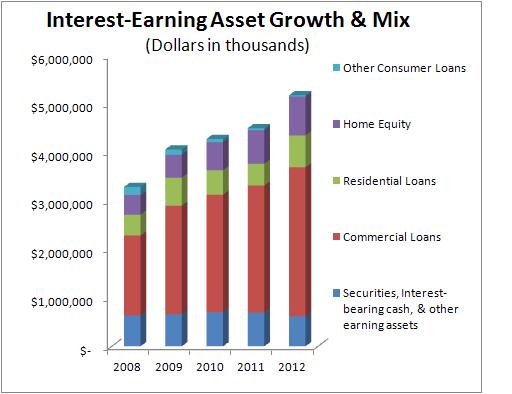
Management's approach to balance sheet strategy and the net interest margin continues to emphasize:
• | Growth in commercial and home equity lending |
• | Funding by core deposits |
• | Structure asset generation with a keen view toward interest-rate sensitivity. |
• | Disciplined asset quality |
• | Avoid security purchases in this low rate environment |
The following tables reflect this continued strategy:
In terms of asset quality, the Company's trends were stable in 2012 and remain strong with nonperforming assets representing only 0.74% of total assets at December 31, 2012, a decrease from 0.75% at December 31, 2011. Delinquency levels also remained low at 0.82% of total loans at December 31, 2012. Management continues to apply a disciplined approach to underwriting and maintains high credit standards.
The provision for loan losses was $18.1 million and $11.5 million for the years ended December 31, 2012 and 2011, respectively. The increase in provisioning levels is the result of shifts in the composition of loan portfolio mix, as certain portfolios require different levels of allowance allocations based upon the risks associated with each portfolio, as well as portfolio growth of outstanding balances, offset by improvements in certain asset quality measures. Net-charge-offs increased during 2012 to $14.5 million, from $9.5 million in the prior year, the increase in charge-offs in 2012 was largely impacted by a customer fraud situation, resulting in a charge-off of $4.8 million. The allowance for loan losses as a percent of loans was 1.15% at December 31, 2012, as compared to 1.27% at December 31, 2012. This decrease is largely attributable to the acquired loans which are accounted for at fair value, with no carryover of the related allowance.
Central Bancorp., Inc. Acquisition
The Company announced and closed the acquisition of Central Bancorp., Inc. in 2012, adding 9 full service branches in the contiguous and demographically attractive Middlesex County market area, enhancing the Company's already strong presence in Eastern Massachusetts. The total transaction was valued at $52.0 million and was comprised of 60% stock and 40% cash consideration. The following map shows the acquired Central branches to the existing Rockland Trust branches:
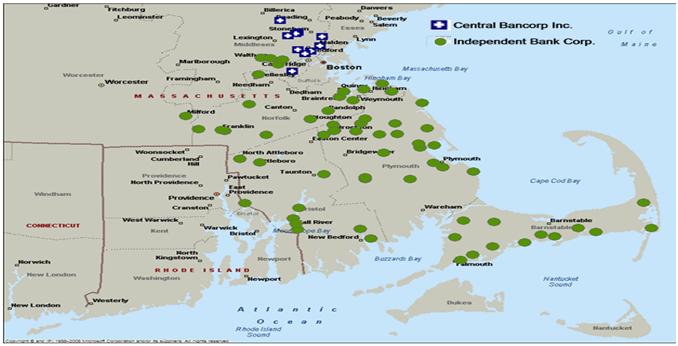
Source: Microsoft MapPoint
The acquisition added loans of $450.7 million and acquired deposits of $357.4 million, at fair value. The following table shows the breakout of the acquired loans and deposits by type:
Loans Acquired (1) | Deposits Acquired | |||||||
(Dollars in thousands) | (Dollars in thousands) | |||||||
Commercial and industrial | $ | 536 | Demand deposits | $ | 75,438 | |||
Commercial real estate | 139,148 | Savings and interest checking | 65,110 | |||||
Residential real estate | 259,637 | Money market | 72,849 | |||||
Home equity and other consumer | 9,107 | Time certificates of deposits | 144,037 | |||||
Total | $ | 408,428 | Total | $ | 357,434 | |||
(1) Subsequent to the acquisition, on November 9, 2012 the Company sold approximately $42.2 million of performing jumbo residential mortgages
acquired in the transaction.
2013 Outlook
Despite the industry challenges of a modestly improving economy, increased competition, continued pressure on the net interest margin and increased regulatory and compliance requirements, management anticipates that the continuation of its strategy to grow solid core banking relationships with existing customers, while continually adding new relationships in the attractive markets of Eastern Massachusetts and Rhode Island, will allow for an increase in diluted earnings per share for 2013 to a range of $2.28 to $2.38, on an operating basis, as compared to the diluted earnings per share of $2.16 for 2012, on an operating basis.
Non-GAAP Measures
When management assesses the Company’s financial performance for purposes of making day-to-day and strategic decisions, it does so based upon the performance of its core banking business, which is primarily derived from the combination of net interest income and noninterest or fee income, reduced by operating expenses, the provision for loan losses, and the impact of income taxes. The Company’s financial performance is determined in accordance with Generally Accepted Accounting Principles (“GAAP”) which sometimes includes gains or losses due to items that management believes are unrelated to its core banking business and will not have a material financial impact on operating results in future periods, such as gains or losses on the sales of securities, merger and acquisition expenses, and other items. Management, therefore, also computes the Company’s non-GAAP operating earnings, which excludes these items, to measure the strength
of the Company’s core banking business and to identify trends that may to some extent be obscured by such gains or losses.
Management’s computation of the Company’s non-GAAP operating earnings information is set forth because management believes it may be useful for investors to have access to the same analytical tool used by management to evaluate the Company’s core operational performance so that investors may assess the Company’s overall financial health and identify business and performance trends that may be more difficult to identify and evaluate when noncore items are included. Management also believes that the computation of non-GAAP operating earnings may facilitate the comparison of the Company to other companies in the financial services industry.
Non-GAAP operating earnings should not be considered a substitute for GAAP results. An item which management deems to be noncore and excludes when computing non-GAAP operating earnings can be of substantial importance to the Company’s results for any particular quarter or year. The Company’s non-GAAP operating earning information set forth is not necessarily comparable to non-GAAP information which may be presented by other companies.
The following tables summarizes the impact of noncore items recorded for the time periods indicated below and reconciles them in accordance with GAAP:
Years Ended December 31 | |||||||||||||||||||||||
Net Income | Diluted Earnings Per Share | ||||||||||||||||||||||
2012 | 2011 | 2010 | 2012 | 2011 | 2010 | ||||||||||||||||||
(Dollars in thousands) | |||||||||||||||||||||||
As reported (GAAP) | |||||||||||||||||||||||
Net income | $ | 42,627 | $ | 45,436 | $ | 40,240 | $ | 1.95 | $ | 2.12 | $ | 1.90 | |||||||||||
Non-GAAP measures | |||||||||||||||||||||||
Noninterest income components | |||||||||||||||||||||||
Net gain on sale of securities, net of tax | (3 | ) | (428 | ) | (271 | ) | — | (0.02 | ) | (0.01 | ) | ||||||||||||
Proceeds from life insurance policies, tax exempt | (1,307 | ) | — | — | (0.06 | ) | — | — | |||||||||||||||
Noninterest expense components | |||||||||||||||||||||||
Prepayment fees on borrowings, net of tax | 4 | 448 | — | — | 0.02 | — | |||||||||||||||||
Merger and acquisition expenses, net of tax | 4,459 | — | — | 0.21 | — | — | |||||||||||||||||
Fair value mark on a terminated hedging relationship | — | — | 328 | — | — | 0.01 | |||||||||||||||||
Goodwill impairment, net of tax | 1,317 | — | — | 0.06 | — | — | |||||||||||||||||
Total impact of noncore items | 4,470 | 20 | 57 | 0.21 | — | — | |||||||||||||||||
As adjusted (non-GAAP) | $ | 47,097 | $ | 45,456 | $ | 40,297 | $ | 2.16 | $ | 2.12 | $ | 1.90 | |||||||||||
The following table summarizes the impact of noncore items on the calculation of the Company's efficiency ratio for the periods indicated:
Years Ended December 31 | ||||||||||||
2012 | 2011 | 2010 | ||||||||||
(Dollars in thousands) | ||||||||||||
Noninterest expense (GAAP) | $ | 159,459 | $ | 145,713 | $ | 139,745 | (a) | |||||
Merger & acquisition | (6,741 | ) | — | — | ||||||||
Goodwill impairment | (2,227 | ) | — | — | ||||||||
Prepayment fees on borrowings | (7 | ) | (757 | ) | — | |||||||
Fair value mark on a terminated hedging relationship | — | — | (554 | ) | ||||||||
Noninterest expense on an operating basis | $ | 150,484 | $ | 144,956 | $ | 139,191 | (b) | |||||
Noninterest income (GAAP) | $ | 62,016 | $ | 52,700 | $ | 46,906 | (c) | |||||
Net gain on sale of securities | (5 | ) | (723 | ) | (458 | ) | ||||||
Proceeds from life insurance policies | (1,307 | ) | — | — | ||||||||
Noninterest income on an operating basis | $ | 60,704 | $ | 51,977 | $ | 46,448 | (d) | |||||
Net interest income | $ | 172,799 | $ | 167,079 | $ | 163,961 | (e) | |||||
Total revenue (GAAP) | $ | 234,815 | $ | 219,779 | $ | 210,867 | (c+e) | |||||
Total operating revenue | $ | 233,503 | $ | 219,056 | $ | 210,409 | (d+e) | |||||
Ratio | ||||||||||||
Efficiency ratio (GAAP) | 67.91 | % | 66.30 | % | 66.27 | % | (a/(c+e)) | |||||
Operating efficiency ratio | 64.45 | % | 66.17 | % | 66.15 | % | (b/(d+e)) | |||||
Financial Position
Securities Portfolio The Company’s securities portfolio may consist of trading securities, securities available for sale, and securities which management intends to hold until maturity. Securities decreased by $10.9 million, or 2.1%, at December 31, 2012 as compared to December 31, 2011. The ratio of securities to total assets as of December 31, 2012 was 8.8%, compared to 10.4% at December 31, 2011.
The Company continually reviews investment securities for the presence of other-than-temporary impairment (“OTTI”). Further analysis of the Company’s OTTI can be found in Note 3 “Securities” within Notes to Consolidated Financial Statements included in Item 8 hereof.
During 2012, the Company transferred equity securities classified previously as trading to available for sale. As of December 31, 2011, the Company had $8.2 million of securities classified as trading.
The following table sets forth the fair value of available for sale securities and the amortized cost of held to maturity securities along with the percentage distribution:
Table 1 — Fair Value of Securities Available for Sale and Amortized Cost of Securities Held to Maturity
December 31 | ||||||||||||||||||||
2012 | 2011 | 2010 | ||||||||||||||||||
Amount | Percent | Amount | Percent | Amount | Percent | |||||||||||||||
(Dollars in thousands) | ||||||||||||||||||||
Fair value of securities available for sale | ||||||||||||||||||||
U.S. treasury securities | $ | — | — | $ | — | — | % | $ | 717 | 0.2 | % | |||||||||
U.S. government agency securities | 20,822 | 6.3 | % | |||||||||||||||||
Agency mortgage-backed securities | 221,425 | 67.2 | % | 238,391 | 78.1 | % | 313,302 | 83.1 | % | |||||||||||
Agency collateralized mortgage obligations | 68,376 | 20.8 | % | 53,801 | 17.6 | % | 46,135 | 12.2 | % | |||||||||||
Private mortgage-backed securities | 3,532 | 1.1 | % | 6,110 | 2.0 | % | 10,254 | 2.7 | % | |||||||||||
Single issuer trust preferred securities issued by banks | 2,240 | 0.7 | % | 4,210 | 1.4 | % | 4,221 | 1.1 | % | |||||||||||
Pooled trust preferred securities issued by banks and insurers | 2,981 | 0.9 | % | 2,820 | 0.9 | % | 2,828 | 0.7 | % | |||||||||||
Marketable securities | 9,910 | 3.0 | % | — | — | % | — | — | % | |||||||||||
Total fair value of securities available for sale | $ | 329,286 | 100.0 | % | $ | 305,332 | 100.0 | % | $ | 377,457 | 100.0 | % | ||||||||
Amortized cost of securities held to maturity | ||||||||||||||||||||
U.S. treasury securities | $ | 1,013 | 0.6 | % | $ | 1,014 | 0.5 | % | $ | — | — | |||||||||
Agency mortgage-backed securities | 72,360 | 40.6 | % | 109,553 | 53.5 | % | 95,697 | 47.2 | % | |||||||||||
Agency collateralized mortgage obligations | 97,507 | 54.6 | % | 77,804 | 38.0 | % | 89,823 | 44.3 | % | |||||||||||
State, county and municipal securities | 915 | 0.5 | % | 3,576 | 1.7 | % | 10,562 | 5.2 | % | |||||||||||
Single issuer trust preferred securities issued by banks | 1,516 | 0.9 | % | 8,000 | 3.9 | % | 6,650 | 3.3 | % | |||||||||||
Corporate debt securities | 5,007 | 2.8 | % | 5,009 | 2.4 | % | — | — | % | |||||||||||
Total amortized cost of securities held to maturity | $ | 178,318 | 100.0 | % | $ | 204,956 | 100.0 | % | $ | 202,732 | 100.0 | % | ||||||||
Total | $ | 507,604 | $ | 510,288 | $ | 580,189 | ||||||||||||||
The Company’s available for sale securities are carried at fair value and are categorized within the fair value hierarchy based on the observability of model inputs. Securities which require inputs that are both significant to the fair value measurement and unobservable are classified as Level 3. As of December 31, 2012 and 2011, the Company had $6.5 million and $13.1 million of securities categorized as Level 3.
The following tables set forth contractual maturities of the Bank’s securities portfolio at December 31, 2012. Actual maturities will differ from contractual maturities because borrowers may have the right to call or prepay obligations with or without call or prepayment penalties.
Table 2 — Fair Value of Securities Available for Sale and Amortized Cost of Securities Held to Maturity, Amounts Maturing
Within One Year | One year to Five Years | Five Years to Ten Years | Over Ten Years | Total | ||||||||||||||||||||||||||||||
Amount | Weighted Average Yield | Amount | Weighted Average Yield | Amount | Weighted Average Yield | Amount | Weighted Average Yield | Amount | Weighted Average Yield | |||||||||||||||||||||||||
(Dollars in thousands) | ||||||||||||||||||||||||||||||||||
Fair value of securities available for sale | ||||||||||||||||||||||||||||||||||
U.S. government agency securities | $ | — | — | $ | — | — | $ | 20,822 | 2.1 | % | $ | — | — | $ | 20,822 | 2.1 | % | |||||||||||||||||
Agency mortgage-backed securities | 235 | 4.0 | % | 1,179 | 5.6 | % | 52,699 | 3.9 | % | 167,312 | 3.9 | % | 221,425 | 3.9 | % | |||||||||||||||||||
Agency collateralized mortgage obligations | — | — | 1,722 | 4.1 | % | 3,554 | 4.0 | % | 63,100 | 1.8 | % | 68,376 | 2.0 | % | ||||||||||||||||||||
Private mortgage-backed securities | — | — | — | — | 2,436 | 6.0 | % | 1,096 | 6.0 | % | 3,532 | 6.0 | % | |||||||||||||||||||||
Single issuer trust preferred securities issued by banks | — | — | — | — | — | — | 2,240 | 5.1 | % | 2,240 | 5.1 | % | ||||||||||||||||||||||
Pooled trust preferred securities issued by banks and insurers | — | — | — | — | — | — | 2,981 | 1.0 | % | 2,981 | 1.0 | % | ||||||||||||||||||||||
Marketable securities(1) | — | — | — | — | — | — | 9,910 | — | 9,910 | — | ||||||||||||||||||||||||
Total fair value of securities available for sale | $ | 235 | 4.0 | % | $ | 2,901 | 4.7 | % | $ | 79,511 | 3.5 | % | $ | 246,639 | 3.3 | % | $ | 329,286 | 3.4 | % | ||||||||||||||
Amortized cost of securities held to maturity | ||||||||||||||||||||||||||||||||||
U.S. Treasury securities | $ | — | — | $ | — | — | $ | 1,013 | 3.0 | % | $ | — | — | $ | 1,013 | 3.0 | % | |||||||||||||||||
Agency mortgage-backed securities | — | — | 786 | 5.5 | % | — | — | 71,574 | 3.5 | % | 72,360 | 3.5 | % | |||||||||||||||||||||
Agency collateralized mortgage obligations | — | — | — | — | — | — | 97,507 | 2.5 | % | 97,507 | 2.5 | % | ||||||||||||||||||||||
State, county and municipal securities | 239 | 4.7 | % | 676 | 4.8 | % | — | — | — | — | 915 | 4.8 | % | |||||||||||||||||||||
Single issuer trust preferred securities issued by banks | — | — | — | — | — | — | 1,516 | 7.4 | % | 1,516 | 7.4 | % | ||||||||||||||||||||||
Corporate debt securities | — | — | 5,007 | 3.4 | % | — | — | — | — | 5,007 | 3.4 | % | ||||||||||||||||||||||
Total amortized cost of securities held to maturity | $ | 239 | 4.7 | % | $ | 6,469 | 3.8 | % | $ | 1,013 | 3.0 | % | $ | 170,597 | 2.9 | % | $ | 178,318 | 3.0 | % | ||||||||||||||
Total | $ | 474 | 4.4 | % | $ | 9,370 | 4.1 | % | $ | 80,524 | 3.5 | % | $ | 417,236 | 3.2 | % | $ | 507,604 | 3.2 | % | ||||||||||||||
(1) Marketable securities have no contractual maturity and are excluded from the weighted average yield and amounts maturing.
As of December 31, 2012, the weighted average life of the securities portfolio was 4.6 years and the modified duration was 4.0 years.
Residential Mortgage Loan Sales The Company’s primary loan sale activity arises from the sale of government sponsored enterprise eligible residential mortgage loans to other financial institutions. During 2012 and 2011, the Bank originated residential loans with the intention of selling them in the secondary market. Loans are sold with servicing rights released and with servicing rights retained. The table below reflects the origination of these loans during the periods indicated:
Table 3 — Residential Mortgage Loan Sales
December 31 | |||||||
2012 | 2011 | ||||||
(Dollars in thousands) | |||||||
Loans originated and sold with servicing rights released | $ | 313,329 | $ | 270,357 | |||
Loans originated and sold with servicing rights retained | $ | 33,393 | $ | 8,627 | |||
The Company originates and sells loans to third parties and recognizes a mortgage servicing rights asset when it sells a loan with servicing rights retained. When a loan is sold, the Company enters into agreements that contain representations and warranties about the
characteristics of the loans sold and their origination. The Company may be required to either repurchase mortgage loans or to indemnify the purchaser from losses if representations and warranties are breached. During the year ended December 31, 2012 and 2011 the Company incurred losses of $304,000 and $222,000 on loans that were agreed to be repurchased. The Company has not at this time established a reserve for loan repurchases because it believes the amount of probable losses is not reasonably estimable and material losses are not probable.
Forward sale contracts of mortgage loans, considered derivative instruments for accounting purposes, are utilized by the Company in its efforts to manage risk of loss associated with its mortgage loan commitments and mortgage loans held for sale. Prior to closing and funding certain one-to-four residential mortgage loans, an interest rate lock commitment is generally extended to the borrower. During the period from commitment date to closing date, the Company is subject to the risk that market rates of interest may change. If market rates rise, investors generally will pay less to purchase such loans resulting in a reduction in the gain on sale of the loans or, possibly, a loss. In an effort to mitigate such risk, forward delivery sales commitments are executed, under which the Company agrees to deliver whole mortgage loans to various investors. See Note 11, “Derivative and Hedging Activities” within Notes to Consolidated Financial Statements included in Item 8 hereof for more information on mortgage loan commitments and forward sales agreements.
Loan Portfolio Management continues to focus on growth in the commercial and home equity lending categories, while placing less emphasis on the other lending categories. Although deemphasizing certain lending categories has led to a slower growth rate than what otherwise might have been realized, management believes the change to be prudent, given the prevailing interest rate and economic environment, as well as strategic priorities. The following table sets forth information concerning the composition of the Bank’s loan portfolio by loan type at the dates indicated:
Table 4 — Loan Portfolio Composition
December 31 | ||||||||||||||||||||||||||||||||||
2012 | 2011 | 2010 | 2009 | 2008 | ||||||||||||||||||||||||||||||
(Dollars in thousands) | ||||||||||||||||||||||||||||||||||
Amount | Percent | Amount | Percent | Amount | Percent | Amount | Percent | Amount | Percent | |||||||||||||||||||||||||
Commercial and industrial | $ | 687,511 | 15.2 | % | $ | 575,716 | 15.2 | % | $ | 502,952 | 14.1 | % | $ | 373,531 | 11.0 | % | $ | 270,832 | 10.2 | % | ||||||||||||||
Commercial real estate | 2,122,153 | 46.9 | % | 1,847,654 | 48.6 | % | 1,717,118 | 48.4 | % | 1,614,474 | 47.5 | % | 1,126,295 | 42.4 | % | |||||||||||||||||||
Commercial construction | 188,768 | 4.2 | % | 128,904 | 3.4 | % | 129,421 | 3.6 | % | 175,312 | 5.2 | % | 171,955 | 6.5 | % | |||||||||||||||||||
Small business | 78,594 | 1.7 | % | 78,509 | 2.1 | % | 80,026 | 2.3 | % | 82,569 | 2.4 | % | 86,670 | 3.3 | % | |||||||||||||||||||
Residential real estate | 604,668 | 13.4 | % | 416,570 | 11.0 | % | 473,936 | 13.3 | % | 555,306 | 16.4 | % | 413,024 | 15.6 | % | |||||||||||||||||||
Residential construction | 8,213 | 0.2 | % | 9,631 | 0.3 | % | 4,175 | 0.1 | % | 10,736 | 0.3 | % | 10,950 | 0.4 | % | |||||||||||||||||||
Home equity | 802,149 | 17.8 | % | 696,063 | 18.3 | % | 579,278 | 16.3 | % | 471,862 | 13.9 | % | 406,240 | 15.3 | % | |||||||||||||||||||
Consumer — other | 26,955 | 0.6 | % | 41,343 | 1.1 | % | 68,773 | 1.9 | % | 111,725 | 3.3 | % | 166,570 | 6.3 | % | |||||||||||||||||||
Gross loans | 4,519,011 | 100.0 | % | 3,794,390 | 100.0 | % | 3,555,679 | 100.0 | % | 3,395,515 | 100.0 | % | 2,652,536 | 100.0 | % | |||||||||||||||||||
Allowance for loan losses | 51,834 | 48,260 | 46,255 | 42,361 | 37,049 | |||||||||||||||||||||||||||||
Net loans | $ | 4,467,177 | $ | 3,746,130 | $ | 3,509,424 | $ | 3,353,154 | $ | 2,615,487 | ||||||||||||||||||||||||
The following table summarizes loan growth during the year ending December 31, 2012:
Table 5 - Components of Loan Growth/(Decline)
Organic Growth/(Decline) % | |||||||||||||||||||
December 31 | Central Acquisition | Organic Growth/(Decline) | |||||||||||||||||
2012 | 2011 | ||||||||||||||||||
(Dollars in thousands) | |||||||||||||||||||
Commercial and industrial | $ | 687,511 | $ | 575,716 | $ | 536 | $ | 111,259 | 19.3 | % | |||||||||
Commercial real estate | 2,122,153 | 1,847,654 | 139,148 | 135,351 | 7.3 | % | |||||||||||||
Commercial construction | 188,768 | 128,904 | — | 59,864 | 46.4 | % | |||||||||||||
Small business | 78,594 | 78,509 | — | 85 | 0.1 | % | |||||||||||||
Residential real estate | 604,668 | 416,570 | 259,637 | (1) | (71,539 | ) | (17.2 | )% | |||||||||||
Residential construction | 8,213 | 9,631 | — | (1,418 | ) | (14.7 | )% | ||||||||||||
Home equity | 802,149 | 696,063 | 8,281 | 97,805 | 14.1 | % | |||||||||||||
Consumer - other | 26,955 | 41,343 | 826 | (15,214 | ) | (36.8 | )% | ||||||||||||
Total loans | $ | 4,519,011 | $ | 3,794,390 | $ | 408,428 | $ | 316,193 | 8.3 | % | |||||||||
(1) Excludes $42.2 million of acquired loans which were sold subsequent to the closing of the acquisition.
The following table sets forth the scheduled contractual amortization of the Bank’s loan portfolio at December 31, 2012. Loans having no schedule of repayments or no stated maturity are reported as due in one year or less. The following table also sets forth the rate structure of loans scheduled to mature after one year:
Table 6 — Scheduled Contractual Loan Amortization
December 31, 2012 | ||||||||||||||||||||||||||||||||||||
Commercial | Commercial Real Estate | Commercial Construction | Small Business | Residential Real Estate | Residential Construction | Home Equity | Consumer Other | Total | ||||||||||||||||||||||||||||
(Dollars in thousands) | ||||||||||||||||||||||||||||||||||||
Amounts due in: | ||||||||||||||||||||||||||||||||||||
One year or less | $ | 247,905 | $ | 240,210 | $ | 49,068 | $ | 15,240 | $ | 27,694 | $ | 8,213 | $ | 21,919 | $ | 15,429 | $ | 625,678 | ||||||||||||||||||
After one year through five years | 267,512 | 1,119,046 | 63,511 | 33,179 | 91,202 | — | 90,673 | 8,860 | 1,673,983 | |||||||||||||||||||||||||||
Beyond five years | 172,094 | 762,897 | 76,189 | 30,175 | 485,772 | — | 689,557 | 2,666 | 2,219,350 | |||||||||||||||||||||||||||
Total | $ | 687,511 | $ | 2,122,153 | $ | 188,768 | (1) | $ | 78,594 | $ | 604,668 | $ | 8,213 | $ | 802,149 | $ | 26,955 | $ | 4,519,011 | |||||||||||||||||
Interest rate terms on amounts due after one year: | ||||||||||||||||||||||||||||||||||||
Fixed rate | $ | 177,186 | $ | 711,376 | $ | 38,359 | $ | 32,596 | $ | 420,142 | $ | — | $ | 343,880 | $ | 11,526 | 1,735,065 | |||||||||||||||||||
Adjustable rate | 262,420 | 1,170,567 | 101,341 | 30,758 | 156,832 | — | 436,350 | — | 2,158,268 | |||||||||||||||||||||||||||
(1) | Includes certain construction loans that will convert to commercial mortgages and will be reclassified to commercial real estate upon the completion of the construction phase. |
As of December 31, 2012, $5.1 million of loans scheduled to mature within one year were nonperforming.
Generally, the actual maturity of loans is substantially shorter than their contractual maturity due to prepayments and, in the case of real estate loans, due-on-sale clauses, which generally gives the Bank the right to declare a loan immediately due and payable in the event that, among other things, the borrower sells the property subject to the mortgage and the loan is not repaid. The average life of real estate loans tends to increase when current real estate loan rates are higher than rates on mortgages in the portfolio and, conversely, tends to decrease when rates on mortgages in the portfolio are higher than current real estate loan rates. Under the latter scenario, the weighted average yield on the portfolio tends to decrease as higher yielding loans are repaid or refinanced at lower rates. Due to the fact that the Bank may, consistent with industry practice, renew a significant portion of commercial and commercial real estate loans at or immediately prior to their maturity by renewing the loans on substantially similar or revised terms, the principal repayments actually received by the Bank are anticipated to be significantly less than the amounts contractually due in any particular period. In other circumstances, a loan, or a portion of a loan, may not be repaid due to the borrower’s inability to satisfy the contractual obligations of the loan.
Asset Quality The Company continually monitors the asset quality of the loan portfolio using all available information. Based on this information, loans demonstrating certain payment issues or other weaknesses may be categorized as delinquent, impaired, nonperforming and/or put on nonaccrual status. Additionally, in the course of resolving such loans, the Company may choose to restructure the contractual terms of certain loans to match the borrower’s ability to repay the loan based on their current financial condition. If a restructured loan meets certain criteria, it may be categorized as a troubled debt restructuring (TDR).
Delinquency The Bank’s philosophy toward managing its loan portfolios is predicated upon careful monitoring, which stresses early detection and response to delinquent and default situations. The Bank considers a loan to have defaulted when it reaches 90 days past due. The Bank seeks to make arrangements to resolve any delinquent or default situation over the shortest possible time frame. Generally, the Bank requires that a delinquency notice be mailed to a borrower upon expiration of a grace period (typically no longer than 15 days beyond the due date). Reminder notices may be sent and telephone calls may be made prior to the expiration of the grace period. If the delinquent status is not resolved within a reasonable time frame following the mailing of a delinquency notice, the Bank’s personnel charged with managing its loan portfolios contact the borrower to ascertain the reasons for delinquency and the prospects for payment. Any subsequent actions taken to resolve the delinquency will depend upon the nature of the loan and the length of time that the loan has been delinquent. The borrower’s needs are considered as much as reasonably possible without jeopardizing the Bank’s position. A late charge is usually assessed on loans upon expiration of the grace period.
Nonaccrual Loans As a general rule, within commercial real estate or home equity categories, loans more than 90 days past due with respect to principal or interest are classified as nonaccrual loans. As permitted by banking regulations, certain consumer loans past due 90 days or more continue to accrue interest. In addition, certain commercial and real estate loans that are more than 90 days past due may be kept on an accruing status if the loans are well secured and in the process of collection. Income accruals are suspended on all nonaccrual loans and all previously accrued and uncollected interest is reversed against current income. A loan remains on nonaccrual status until it becomes current with respect to principal and interest (and in certain instances remains current for up to six months), when the loan is liquidated, or when the loan is determined to be uncollectible and is charged-off against the allowance for loan losses.
Troubled Debt Restructurings In the course of resolving problem loans, the Bank may choose to restructure the contractual terms of certain loans. The Bank attempts to work-out an alternative payment schedule with the borrower in order to avoid or cure a default. Any loans that are modified are reviewed by the Bank to identify if a TDR has occurred, which is when, for economic or legal reasons related to a borrower’s financial difficulties, the Bank grants a concession to the borrower that it would not otherwise consider. Terms may be modified to fit the ability of the borrower to repay in line with its current financial status and the restructuring of the loan may include adjustments to interest rates, extensions of maturity, consumer loans where the borrower's obligations have been effectively discharged through Chapter 7 Bankruptcy and the borrower has not reaffirmed the debt to the Bank, and other actions intended to minimize economic loss and avoid foreclosure or repossession of collateral. If such efforts by the Bank do not result in satisfactory performance, the loan is referred to legal counsel, at which time foreclosure proceedings are initiated. At any time prior to a sale of the property at foreclosure, the Bank may terminate foreclosure proceedings if the borrower is able to work-out a satisfactory payment plan.
It is the Bank’s policy to have any restructured loans which are on nonaccrual status prior to being modified remain on nonaccrual status for six months, subsequent to being modified, before management considers its return to accrual status. If the restructured loan is on accrual status prior to being modified, it is reviewed to determine if the modified loan should remain on accrual status. Loans that are considered TDRs are classified as performing, unless they are on nonaccrual status or greater than 90 days delinquent. Loans classified as TDRs remain classified as such, for the life of the loan, except in limited circumstances, when it is determined that the borrower is performing under modified terms and the restructuring agreement specified an interest rate greater than or equal to an acceptable market rate for a comparable new loan at the time of the restructuring.
Purchased Credit Impaired Loans Purchased Credit Impaired (“PCI”) loans are acquired loans which had evidence of deterioration in credit quality since origination and for which it is probable that all contractually required payments will not be collected. The PCI loans are recorded at fair value without any carryover of the allowance for loan losses. The excess cash flows expected to be collected over the carrying amount of the loans, referred to as the "accretable yield", is accreted into interest income over the life of the loans using the effective yield method. Accordingly, PCI loans are not subject to classification as nonaccrual in the same manner as originated loans, rather they are considered to be accruing loans because their interest income recognized relates to the accretable yield and not to contractual interest payments. The carrying amount of these purchased credit impaired loans was $32.1 million as of December 31, 2012. See Note 4, "Loans, Allowance for Loan Losses and Credit Quality" within Notes to Consolidated Financial Statements included in Item 8 hereof for more information.
Nonperforming Assets Nonperforming assets are comprised of nonperforming loans, nonperforming securities, Other Real Estate Owned (“OREO”), and other assets in possession. Nonperforming loans consist of nonaccrual loans and loans that are more than 90 days past due but still accruing interest.
Nonperforming securities consist of securities that are on nonaccrual status. The Company holds six collateralized debt obligation securities (“CDOs”) comprised of pools of trust preferred securities issued by banks and insurance companies, which are currently deferring interest payments on certain tranches within the bonds’ structures including the tranches held by the Company. The bonds are anticipated to continue to defer interest until cash flows are sufficient to satisfy certain collateralization levels designed to protect more senior tranches. As
a result the Company has placed the six securities on nonaccrual status and has reversed any previously accrued income related to these securities.
OREO consists of real estate properties, which have served as collateral to secure loans, that are controlled or owned by the Bank. These properties are recorded at fair value less estimated costs to sell at the date control is established, resulting in a new cost basis. The amount by which the recorded investment in the loan exceeds the fair value (net of estimated costs to sell) of the foreclosed asset is charged to the allowance for loan losses. Subsequent declines in the fair value of the foreclosed asset below the new cost basis are recorded through the use of a valuation allowance. Subsequent increases in the fair value are recorded as reductions in the allowance, but not below zero. All costs incurred thereafter in maintaining the property are charged to noninterest expense. In the event the real estate is utilized as a rental property, rental income and expenses are recorded as incurred and included in noninterest income and noninterest expense, respectively.
Other assets in possession primarily consist of foreclosed non-real estate assets deemed to be in control of the Company.
The following table sets forth information regarding nonperforming assets held by the Bank at the dates indicated:
Table 7 — Nonperforming Assets
December 31 | |||||||||||||||||||
2012 | 2011 | 2010 | 2009 | 2008 | |||||||||||||||
(Dollars in thousands) | |||||||||||||||||||
Loans accounted for on a nonaccrual basis(1) | |||||||||||||||||||
Commercial and industrial | $ | 2,666 | $ | 1,883 | $ | 3,123 | $ | 4,205 | $ | 1,942 | |||||||||
Commercial real estate | 6,574 | 13,109 | 9,836 | 18,525 | 12,370 | ||||||||||||||
Small business | 570 | 542 | 887 | 793 | 1,111 | ||||||||||||||
Residential real estate | 11,472 | 9,867 | 6,728 | 10,829 | 9,394 | ||||||||||||||
Home equity | 7,311 | 3,130 | 1,752 | 1,166 | 1,090 | ||||||||||||||
Consumer — other | 121 | 381 | 505 | 373 | 751 | ||||||||||||||
Total | $ | 28,714 | $ | 28,912 | $ | 22,831 | $ | 35,891 | $ | 26,658 | |||||||||
Loans past due 90 days or more but still accruing | |||||||||||||||||||
Home equity | $ | — | $ | — | $ | 4 | $ | — | $ | — | |||||||||
Consumer — other | 52 | 41 | 273 | 292 | 275 | ||||||||||||||
Total | $ | 52 | $ | 41 | $ | 277 | $ | 292 | $ | 275 | |||||||||
Total nonperforming loans | $ | 28,766 | $ | 28,953 | $ | 23,108 | $ | 36,183 | $ | 26,933 | |||||||||
Nonaccrual securities(2) | 1,511 | 1,272 | 1,051 | 920 | 910 | ||||||||||||||
Other assets in possession | 176 | 266 | 61 | 148 | 231 | ||||||||||||||
Other real estate owned | 11,974 | 6,658 | 7,273 | 3,994 | 1,809 | ||||||||||||||
Total nonperforming assets | $ | 42,427 | $ | 37,149 | $ | 31,493 | $ | 41,245 | $ | 29,883 | |||||||||
Nonperforming loans as a percent of gross loans | 0.64 | % | 0.76 | % | 0.65 | % | 1.07 | % | 1.02 | % | |||||||||
Nonperforming assets as a percent of total assets | 0.74 | % | 0.75 | % | 0.67 | % | 0.92 | % | 0.82 | % | |||||||||
(1) | Included in these amounts were $6.6 million, $9.2 million, $4.0 million, $3.4 million, and $74,000 of TDRs on nonaccrual at December 31, 2012, 2011, 2010, 2009 and 2008, respectively. |
(2) | Amounts represent the fair value of nonaccrual securities. The Company had six nonaccrual securities in 2012, 2011, 2010 and 2009, and five nonaccrual securities in 2008. |
The following table summarizes the changes in nonperforming assets for the periods indicated:
Table 8 - Activity in Nonperforming Assets
Years Ended December 31 | |||||||||||||
2012 | 2011 | ||||||||||||
(Dollars in thousands) | |||||||||||||
Nonperforming assets beginning balance | $ | 37,149 | $ | 31,493 | |||||||||
New to nonperforming | 42,606 | 40,290 | |||||||||||
Loans charged-off | (16,591 | ) | (11,341 | ) | |||||||||
Loans paid-off | (10,381 | ) | (10,593 | ) | |||||||||
Loans restored to accrual status | (9,091 | ) | (5,465 | ) | |||||||||
Loans transferred to other real estate owned/other assets | (7,061 | ) | (6,285 | ) | |||||||||
Change to other real estate owned: | |||||||||||||
New to other real estate owned | 7,061 | 6,285 | |||||||||||
Acquired other real estate owned | 2,633 | ||||||||||||
Valuation write down | (776 | ) | (1,569 | ) | |||||||||
Sale of other real estate owned | (5,871 | ) | (6,479 | ) | |||||||||
Development of other real estate owned | 2,269 | 938 | |||||||||||
Other | — | 210 | |||||||||||
Total change to other real estate owned | 5,316 | (615 | ) | ||||||||||
Change in fair value on nonaccrual securities | 239 | 221 | |||||||||||
Other | 241 | (556 | ) | ||||||||||
Nonperforming assets ending balance | $ | 42,427 | $ | 37,149 | |||||||||
The following table sets forth information regarding troubled debt restructured loans as of the dates indicated:
Table 9 — Troubled Debt Restructurings
December 31 | |||||||||||||||||||
2012 | 2011 | 2010 | 2009 | 2008 | |||||||||||||||
(Dollars in thousands) | |||||||||||||||||||
Performing troubled debt restructurings | $ | 46,764 | $ | 37,151 | $ | 26,091 | $ | 10,484 | $ | 1,063 | |||||||||
Nonaccrual troubled debt restructurings | 6,554 | 9,230 | 3,982 | 3,498 | 74 | ||||||||||||||
Total | $ | 53,318 | $ | 46,381 | $ | 30,073 | $ | 13,982 | $ | 1,137 | |||||||||
Performing troubled debt restructurings as a % of total loans | 1.03 | % | 0.98 | % | 0.73 | % | 0.31 | % | 0.04 | % | |||||||||
Nonaccrual troubled debt restructurings as a % of total loans | 0.15 | % | 0.24 | % | 0.11 | % | 0.10 | % | — | % | |||||||||
Total troubled debt restructurings as a % of total loans | 1.18 | % | 1.22 | % | 0.84 | % | 0.41 | % | 0.04 | % | |||||||||
The following table summarizes changes in TDRs for the periods indicated:
Table 10 - Activity in Troubled Debt Restructurings
December 31 | |||||||
2012 | 2011 | ||||||
(Dollars in thousands) | |||||||
TDRs beginning balance | $ | 46,381 | $ | 30,073 | |||
New to TDR status | 8,350 | 22,485 | |||||
Court ordered concessions (1) | 5,143 | — | |||||
Paydowns | (6,080 | ) | (5,646 | ) | |||
Charge-offs | (476 | ) | (531 | ) | |||
Loans removed from TDR status | — | — | |||||
TDRs ending balance | $ | 53,318 | $ | 46,381 | |||
(1) Represents consumer loans where the borrower's obligation has been effectively discharged through Chapter 7 Bankruptcy and the borrower has not reaffirmed the debt for all applicable prior periods.
Income accruals are suspended on all nonaccrual loans and all previously accrued and uncollected interest is reversed against current income. The table below shows interest income that was recognized or collected on all nonaccrual loans and performing TDRs as of the dates indicated:
Table 11 — Interest Income Recognized/Collected on Nonaccrual Loans and Troubled Debt Restructured Loans
Years Ended December 31 | |||||||||||
2012 | 2011 | 2010 | |||||||||
(Dollars in thousands) | |||||||||||
Interest income that would have been recognized if nonaccruing loans had been performing | $ | 2,623 | $ | 1,739 | $ | 2,749 | |||||
Interest income recognized on TDRs still accruing | 2,609 | 2,140 | 1,425 | ||||||||
Interest collected on nonaccrual loans and TDRs and included in interest income | $ | 3,642 | $ | 2,708 | $ | 1,874 | |||||
A loan is considered impaired when, based on current information and events, it is probable that the Bank will be unable to collect the scheduled payments of principal or interest when due according to the contractual terms of the loan agreement. Factors considered by management in determining impairment include payment status, collateral value, and the probability of collecting scheduled principal and interest payments when due. Loans that experience insignificant payment delays and payment shortfalls generally are not classified as impaired. Management determines the significance of payment delays and payment shortfalls on a case-by-case basis, taking into consideration all of the circumstances surrounding the loan and the borrower, including the length of the delay, the reasons for the delay, the borrower’s prior payment record, and the amount of the shortfall in relation to the principal and interest owed.
Impairment is measured on a loan by loan basis for commercial and industrial, commercial real estate, commercial construction, and small business categories and for all loans identified as a troubled debt restructuring by comparing the loan’s value to either the present value of expected future cash flows discounted at the loan’s effective interest rate, the loan’s obtainable market price, or the fair value of the collateral if the loan is collateral dependent. For impaired loans deemed collateral dependent, where impairment is measured using the fair value of the collateral, the Bank will either order a new appraisal or use another available source of collateral assessment such as a broker’s opinion of value to determine a reasonable estimate of the fair value of the collateral.
At December 31, 2012, impaired loans included all commercial and industrial loans, commercial real estate loans, commercial construction, and small business loans that are on nonaccrual status, TDRs, and other loans that have been categorized as impaired. Total impaired loans at December 31, 2012 and 2011 were $66.7 million and $61.7 million, respectively. For additional information regarding the Bank’s asset quality, including delinquent loans, nonaccruals, TDRs, and impaired loans, see Note 4, “Loans, Allowance for Loan Losses, and Credit Quality” within Notes to Consolidated Financial Statements included in Item 8 hereof.
Potential problem loans are any loans which are not included in nonaccrual or nonperforming loans, where known information about possible credit problems of the borrowers causes management to have concerns as to the ability of such borrowers to comply with present loan repayment terms. The table below shows the potential problem commercial loans at the time periods indicated:
Table 12 — Potential Problem Commercial Loans
December 31 | |||||||
2012 | 2011 | ||||||
(Dollars in thousands) | |||||||
Number of loan relationships | 70 | 64 | |||||
Aggregate outstanding balance | $ | 110,624 | $ | 113,641 | |||
At December 31, 2012, these potential problem loans continued to perform with respect to payments. Management actively monitors these loans and strives to minimize any possible adverse impact to the Bank.
Allowance for Loan Losses The allowance for loan losses is maintained at a level that management considers adequate to provide for probable loan losses based upon evaluation of known and inherent risks in the loan portfolio. The allowance is increased by providing for loan losses through a charge to provision for loan losses and by recoveries of loans previously charged-off and is reduced by loans charged-off.
While management uses available information to recognize losses on loans, future additions to the allowance may be necessary based on increases in nonperforming loans, changes in economic conditions, or for other reasons. Additionally, various regulatory agencies, as an integral part of the Bank’s examination process, periodically assess the adequacy of the allowance for loan losses and may require it to increase its provision for loan losses or recognize further loan charge-offs.
As of December 31, 2012, the allowance for loan losses totaled $51.8 million, or 1.15% of total loans as compared to $48.3 million, or 1.27% of total loans, at December 31, 2011. The increase in the amount of allowance is driven by shifts in the composition of the loan portfolio mix and loan growth, offset by improvements in certain asset quality measures. The decrease in the amount of the allowance as a percentage of loans is largely attributable to the acquired loans which are accounted for at fair value, with no carryover of the related allowance.
The following table summarizes changes in the allowance for loan losses and other selected statistics for the periods presented:
Table 13 — Summary of Changes in the Allowance for Loan Losses
December 31 | |||||||||||||||||||
2012 | 2011 | 2010 | 2009 | 2008 | |||||||||||||||
(Dollars in thousands) | |||||||||||||||||||
Average total loans | $ | 4,022,349 | $ | 3,681,418 | $ | 3,434,769 | $ | 3,177,949 | $ | 2,489,028 | |||||||||
Allowance for loan losses, beginning of year | $ | 48,260 | $ | 46,255 | $ | 42,361 | $ | 37,049 | $ | 26,831 | |||||||||
Charged-off loans: | |||||||||||||||||||
Commercial and industrial | 6,191 | 2,888 | 5,170 | 1,663 | 595 | ||||||||||||||
Commercial real estate | 4,348 | 2,631 | 3,448 | 834 | — | ||||||||||||||
Commercial construction | — | 769 | 1,716 | 2,679 | — | ||||||||||||||
Small business | 616 | 1,190 | 2,279 | 2,047 | 1,350 | ||||||||||||||
Residential real estate | 1,094 | 559 | 557 | 829 | 362 | ||||||||||||||
Home equity | 3,178 | 1,626 | 939 | 1,799 | 1,200 | ||||||||||||||
Consumer — other | 1,165 | 1,678 | 2,078 | 3,404 | 3,631 | ||||||||||||||
Total charged-off loans | 16,592 | 11,341 | 16,187 | 13,255 | 7,138 | ||||||||||||||
Recoveries on loans previously charged-off | |||||||||||||||||||
Commercial and industrial | 963 | 420 | 361 | 27 | 168 | ||||||||||||||
Commercial real estate | 188 | 97 | 1 | — | — | ||||||||||||||
Commercial construction | — | 500 | — | — | — | ||||||||||||||
Small business | 134 | 160 | 217 | 204 | 159 | ||||||||||||||
Residential real estate | 151 | — | 59 | 105 | — | ||||||||||||||
Home equity | 93 | 52 | 131 | 41 | 5 | ||||||||||||||
Consumer — other | 581 | 635 | 657 | 855 | 612 | ||||||||||||||
Total recoveries | 2,110 | 1,864 | 1,426 | 1,232 | 944 | ||||||||||||||
Net loans charged-off | |||||||||||||||||||
Commercial and industrial | 5,228 | 2,468 | 4,809 | 1,636 | 427 | ||||||||||||||
Commercial real estate | 4,160 | 2,534 | 3,447 | 834 | — | ||||||||||||||
Commercial construction | — | 269 | 1,716 | 2,679 | — | ||||||||||||||
Small business | 482 | 1,030 | 2,062 | 1,843 | 1,191 | ||||||||||||||
Residential real estate | 943 | 559 | 498 | 724 | 362 | ||||||||||||||
Home equity | 3,085 | 1,574 | 808 | 1,758 | 1,195 | ||||||||||||||
Consumer — other | 584 | 1,043 | 1,421 | 2,549 | 3,019 | ||||||||||||||
Total net loans charged-off | 14,482 | 9,477 | 14,761 | 12,023 | 6,194 | ||||||||||||||
Allowance related to business combinations | — | — | — | — | 5,524 | ||||||||||||||
Provision for loan losses | 18,056 | 11,482 | 18,655 | 17,335 | 10,888 | ||||||||||||||
Total allowances for loan losses, end of year | $ | 51,834 | $ | 48,260 | $ | 46,255 | $ | 42,361 | $ | 37,049 | |||||||||
Net loans charged-off as a percent of average total loans | 0.36 | % | 0.26 | % | 0.43 | % | 0.38 | % | 0.25 | % | |||||||||
Allowance for loan losses as a percent of total loans | 1.15 | % | 1.27 | % | 1.30 | % | 1.25 | % | 1.40 | % | |||||||||
Allowance for loan losses as a percent of nonperforming loans | 180.19 | % | 166.68 | % | 200.17 | % | 117.07 | % | 137.56 | % | |||||||||
Net loans charged-off as a percent of allowance for loan losses | 27.94 | % | 19.64 | % | 31.91 | % | 28.38 | % | 16.72 | % | |||||||||
Recoveries as a percent of charge-offs | 12.72 | % | 16.44 | % | 8.81 | % | 9.29 | % | 13.22 | % | |||||||||
For purposes of the allowance for loan losses, management segregates the loan portfolio into the portfolio segments detailed in the table below. The allocation of the allowance for loan losses is made to each loan category using the analytical techniques and estimation methods described herein. While these amounts represent management’s best estimate of the distribution of probable losses at the evaluation dates, they are not necessarily indicative of either the categories in which actual losses may occur or the extent of such actual losses that may be recognized within each category. Each of these loan categories possess unique risk characteristics that are considered when determining the appropriate level of allowance for each segment. The total allowance is available to absorb losses from any segment of the loan portfolio.
The following table sets forth the allocation of the allowance for loan losses by loan category at the dates indicated:
Table 14 — Summary of Allocation of Allowance for Loan Losses
December 31 | ||||||||||||||||||||||||||||||||||
2012 | 2011 | 2010 | 2009 | 2008 | ||||||||||||||||||||||||||||||
Allowance Amount | Percent of Loans In Category To Total Loans | Allowance Amount | Percent of Loans In Category To Total Loans | Allowance Amount | Percent of Loans In Category To Total Loans | Allowance Amount | Percent of Loans In Category To Total Loans | Allowance Amount | Percent of Loans In Category To Total Loans | |||||||||||||||||||||||||
(Dollars in thousands) | ||||||||||||||||||||||||||||||||||
Allocated Allowance | ||||||||||||||||||||||||||||||||||
Commercial and industrial | $ | 13,461 | 15.2 | % | $ | 11,682 | 15.2 | % | $ | 10,423 | 14.1 | % | $ | 7,545 | 11.0 | % | $ | 5,532 | 10.2 | % | ||||||||||||||
Commercial real estate | 22,598 | 46.9 | % | 23,514 | 48.6 | % | 21,939 | 48.4 | % | 19,451 | 47.5 | % | 15,942 | 42.4 | % | |||||||||||||||||||
Commercial construction | 2,811 | 4.2 | % | 2,076 | 3.4 | % | 2,145 | 3.6 | % | 2,457 | 5.5 | % | 4,203 | 6.9 | % | |||||||||||||||||||
Small business | 1,524 | 1.7 | % | 1,896 | 2.1 | % | 3,740 | 2.3 | % | 3,372 | 2.4 | % | 2,170 | 3.3 | % | |||||||||||||||||||
Residential real estate | 2,930 | 13.6 | % | 3,113 | 11.3 | % | 2,915 | 13.4 | % | 2,840 | 16.4 | % | 2,447 | 15.6 | % | |||||||||||||||||||
Home equity | 7,703 | 17.8 | % | 4,597 | 18.3 | % | 3,369 | 16.3 | % | 3,945 | 13.9 | % | 3,091 | 15.3 | % | |||||||||||||||||||
Consumer — other | 807 | 0.6 | % | 1,382 | 1.1 | % | 1,724 | 1.9 | % | 2,751 | 3.3 | % | 3,664 | 6.3 | % | |||||||||||||||||||
Total | $ | 51,834 | 100.0 | % | $ | 48,260 | 100.0 | % | $ | 46,255 | 100.0 | % | $ | 42,361 | 100.0 | % | $ | 37,049 | 100.0 | % | ||||||||||||||
To determine if a loan should be charged-off, all possible sources of repayment are analyzed. Possible sources of repayment include the potential for future cash flows, the value of the Bank’s collateral, and the strength of co-makers or guarantors. When available information confirms that specific loans or portions thereof are uncollectible, these amounts are promptly charged-off against the allowance for loan losses and any recoveries of such previously charged-off amounts are credited to the allowance.
Regardless of whether a loan is unsecured or collateralized, the Company charges off the amount of any confirmed loan loss in the period when the loans, or portions of loans, are deemed uncollectible. For troubled, collateral-dependent loans, loss-confirming events may include an appraisal or other valuation that reflects a shortfall between the value of the collateral and the book value of the loan or receivable, or a deficiency balance following the sale of the collateral. During 2012 allowance amounts increased by approximately $3.6 million to $51.8 million at December 31, 2012.
For additional information regarding the Bank’s allowance for loan losses, see Note 1, “Summary of Significant Accounting Policies” and Note 4, “Loans, Allowance for Loan Losses, and Credit Quality” within Notes to Consolidated Financial Statements included in Item 8 hereof.
Federal Home Loan Bank Stock The Bank held an investment in Federal Home Loan Bank (“FHLB”) of Boston's stock, which amounted to $41.8 million at December 31, 2012 and $35.9 million at December 31, 2011, respectively. The increase during 2012 in the Company's investment in FHLB stock is primarily due to the Central acquisition. The FHLB is a cooperative that provides services to its member banking institutions. The primary reason for the FHLB of Boston membership is to gain access to a reliable source of wholesale funding, particularly term funding, as a tool to manage interest rate risk. The purchase of stock in the FHLB is a requirement for a member to gain access to funding. The Company purchases FHLB stock proportional to the volume of funding received and views the purchases as a necessary long-term investment for the purposes of balance sheet liquidity and not for investment return.
Goodwill and Identifiable Intangible Assets Goodwill and Identifiable Intangible Assets were $162.1 million and $140.7 million at December 31, 2012 and December 31, 2011, respectively. For additional information regarding the goodwill and identifiable intangible assets, see Note 6, “Goodwill and Identifiable Intangible Assets” within Notes to Consolidated Financial Statements included in Item 8 hereof.
The Company performed its annual goodwill impairment testing during the third quarter of 2012, and concluded that $2.2 million of goodwill was impaired. This amount represents the total amount of goodwill relating to Compass Exchange Advisors, LLC ("Compass") which was acquired in January of 2007. Compass’ business model success is closely correlated to the volume of U.S. commercial real estate
transactions and the interest rate spread that can be obtained on short-term funds among other factors. A sharp reduction in real estate transactions and the projected continuation of low interest rates resulted in the impairment being recognized. Goodwill is evaluated for impairment at least annually, or more often if warranted, using a combined qualitative and quantitative impairment approach. The initial qualitative approach assesses whether the existence of events or circumstances led to a determination that it is more likely than not that the fair value of a reporting unit is less than its carrying amount. If, after assessing the totality of events and circumstances, the Company determines it is more likely than not that the fair value is less than carrying value the two step quantitative impairment test is performed. Step one of the quantitative impairment testing compares book value to the fair value of the reporting unit. If test one is failed, a more detailed analysis is performed, which involves measuring the excess of the fair value of the reporting unit, as determined in step one, over the aggregate fair value of the individual assets, liabilities, and identifiable intangibles as if the reporting unit was being acquired in a business combination. Step 1 of the impairment testing was passed for all reporting units during 2012, with the exception of Compass.
Cash Surrender Value of Life Insurance Policies The Bank holds life insurance policies for the purpose of offsetting the Bank’s future obligations to its employees under its retirement and benefits plans. The cash surrender value of life insurance policies was $97.3 million and $86.1 million at December 31, 2012 and December 31, 2011, respectively. The Bank recorded tax exempt income from the life insurance policies of $3.1 million in 2012, $3.2 million in 2011, and in 2010. Also during 2012, the Company recognized a gain on life insurance policies in the amount of $1.3 million, relating to proceeds from death benefits. The death benefit proceeds are also tax-exempt income to the Company.
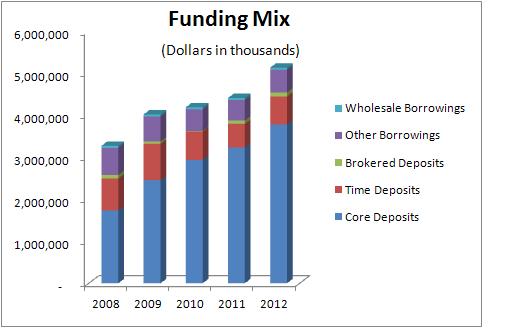
Deposits As of December 31, 2012, deposits of $4.5 billion were $669.8 million, or 17.3%, higher than the prior year-end. Core deposits, which the Company defines as nontime and nonbrokered deposits, increased by $546.9 million, or 16.9%, during 2012 and now comprise 83.2% of total deposits. The Company experienced growth in all categories of deposits, fueled by increases in business deposits from commercial loan customers, inflows of municipal deposits and higher consumer deposits resulting from an increased advertising presence. The growth was also significantly impacted by the Central acquisition.
The following table summarizes the organic deposit growth during the periods indicated:
Table 15 - Components of Deposit Growth
Organic | ||||||||||||||||||
December 31 | Central | Organic | Growth/(Decline) | |||||||||||||||
2012 | 2011 | Acquisition | Growth/(Decline) | % | ||||||||||||||
(Dollars in thousands) | ||||||||||||||||||
Demand deposits | $ | 1,248,394 | $ | 992,418 | $ | 75,438 | $ | 180,538 | 18.2 | % | ||||||||
Savings and interest checking accounts | 1,691,187 | 1,473,812 | 65,110 | 152,265 | 10.3 | % | ||||||||||||
Money market | 853,971 | 780,437 | 72,849 | 685 | 0.1 | % | ||||||||||||
Time certificates of deposit | 753,125 | 630,162 | 144,037 | (21,074 | ) | (3.3 | )% | |||||||||||
Total deposits | $ | 4,546,677 | $ | 3,876,829 | $ | 357,434 | $ | 312,414 | 8.1 | % | ||||||||
The following table sets forth the average balances of the Bank’s deposits for the periods indicated:
Table 16 — Average Balances of Deposits
December 31 | ||||||||||||||||||||
2012 | 2011 | 2010 | ||||||||||||||||||
Amount | Percent | Amount | Percent | Amount | Percent | |||||||||||||||
(Dollars in thousands) | ||||||||||||||||||||
Demand deposits | $ | 1,070,577 | 26.7 | % | $ | 910,701 | 24.9 | % | $ | 773,718 | 22.0 | % | ||||||||
Savings and interest checking | 1,484,758 | 37.1 | % | 1,355,478 | 37.2 | % | 1,183,247 | 33.7 | % | |||||||||||
Money market | 803,656 | 20.1 | % | 728,380 | 19.9 | % | 739,264 | 21.1 | % | |||||||||||
Time certificates of deposits | 646,873 | 16.1 | % | 656,486 | 18.0 | % | 814,462 | 23.2 | % | |||||||||||
Total | $ | 4,005,864 | 100.0 | % | $ | 3,651,045 | 100.0 | % | $ | 3,510,691 | 100.0 | % | ||||||||
The following table sets forth the maturities of the Bank’s time certificates of deposits in the amount of $100,000 or more as of December 31, 2012:
Table 17 — Maturities of Time Certificates of Deposits $100,000 and Over
Balance | Percentage | |||||
(Dollars in thousands) | ||||||
1 to 3 months | $ | 100,209 | 31.6 | % | ||
4 to 6 months | 48,620 | 15.3 | % | |||
7 to 12 months | 72,740 | 22.9 | % | |||
Over 12 months | 95,869 | 30.2 | % | |||
Total | $ | 317,438 | 100.0 | % | ||
The Bank also participates in the Certificate of Deposit Registry Service (“CDARS”) program, allowing the Bank to provide easy access to multi-million dollar FDIC deposit insurance protection on certificate of deposits investments for consumers, businesses and public entities. The economic downturn and subsequent flight to safety makes CDARS an attractive product for customers. In addition, the Bank may occasionally raise funds through brokered certificates of deposit. This channel allows the Bank to seek additional funding in potentially large quantities by attracting deposits from outside the Bank’s core market. The following table sets forth the Bank’s brokered deposits as of the dates indicated:
Table 18 — Brokered Deposits
December 31 | |||||||
2012 | 2011 | ||||||
(Dollars in thousands) | |||||||
CDARS | $ | 72,218 | $ | 55,150 | |||
Brokered certificates of deposit | 13,815 | 13,815 | |||||
Brokered money market | 10,000 | 10,000 | |||||
Total brokered deposits | $ | 96,033 | $ | 78,965 | |||
Borrowings The following table shows the balance of borrowings at the periods indicated:
Table 19 — Borrowings by Category
December 31 | ||||||||||
2012 | 2011 | % Change | ||||||||
(Dollars in thousands) | ||||||||||
Federal Home Loan Bank and other borrowings | $ | 283,569 | $ | 229,701 | 23.5 | % | ||||
Wholesale repurchase agreements | 50,000 | 50,000 | — | % | ||||||
Customer repurchase agreements | 153,359 | 166,128 | (7.7 | )% | ||||||
Junior subordinated debentures | 74,127 | 61,857 | 19.8 | % | ||||||
Subordinated debentures | 30,000 | 30,000 | — | % | ||||||
Total | $ | 591,055 | $ | 537,686 | 9.9 | % | ||||
The increase in the borrowings for 2012 are primarily related to the acquired Central borrowings. See Note 8, "Borrowings" within Notes to Consolidated Financial Statements included in Item 8 hereof for more information regarding borrowings.
Capital Resources The Federal Reserve, the FDIC, and other regulatory agencies have established capital guidelines for banks and bank holding companies. Risk-based capital guidelines issued by the federal regulatory agencies require banks to meet a minimum Tier 1 risk-based capital ratio of 4.0% and a total risk-based capital ratio of 8.0%. A minimum requirement of 4.0% Tier 1 leverage capital is also mandated. At December 31, 2012, the Company and the Bank exceeded the minimum requirements for all regulatory capital ratios. See Note 17, “Regulatory Capital Requirements” within Notes to Consolidated Financial Statements included in Item 8 hereof for more information regarding capital requirements.
Mortgage Banking The Bank originates residential loans for both its portfolio and with the intention of selling them in the secondary market. The Bank’s mortgage banking income consists primarily of revenue from premiums received on loans sold with servicing released, origination fees, and gains and losses on sold mortgages less related commission expense. The following table shows the total residential loans that were closed and the amounts which were held in the portfolio or sold/held for sale in the secondary market during the periods indicated:
Table 20 — Closed Residential Real Estate Loans
Years Ended December 31 | |||||||||||
2012 | 2011 | 2010 | |||||||||
(Dollars in thousands) | |||||||||||
Held in portfolio | $ | 47,205 | $ | 63,824 | $ | 63,273 | |||||
Sold/held for sale in the secondary market | 373,063 | 270,427 | 357,527 | ||||||||
Total closed loans | $ | 420,268 | $ | 334,251 | $ | 420,800 | |||||
Included in the mortgage banking income results is the impact of the Bank’s mortgage servicing assets. Servicing assets are recognized as separate assets when rights are acquired through sale of loans with servicing rights retained. The principal balance of loans serviced by the Bank on behalf of investors amounted to $198.8 million at December 31, 2012 and $229.1 million at December 31, 2011. Upon sale, the mortgage servicing asset is established, which represents the then current estimated fair value based on market prices for comparable mortgage servicing contracts, when available, or alternatively is based on a valuation model that calculates the present value of estimated future net servicing income. The valuation model incorporates assumptions that market participants would use in estimating future net servicing income, such as the cost to service, the discount rate, an inflation rate, ancillary income, prepayment speeds and default rates and losses. Impairment is determined by stratifying the rights based on predominant characteristics, such as interest rate, loan type and investor type. Impairment is recognized through a valuation allowance, to the extent that fair value is less than the capitalized amount. If the Company later determines that all or a portion of the impairment no longer exists, a reduction of the allowance may be recorded as an increase to income. Servicing rights are recorded in other assets in the consolidated balance sheets, are amortized in proportion to and over the period of estimated net servicing income, and are assessed for impairment based on fair value at each reporting date.
The following table shows fair value of the servicing rights associated with these loans and the changes for the periods indicated:
Table 21 — Mortgage Servicing Asset
2012 | 2011 | ||||||
(Dollars in thousands) | |||||||
Balance as of January 1 | $ | 1,098 | $ | 1,619 | |||
Additions | 272 | 75 | |||||
Amortization | (522 | ) | (547 | ) | |||
Change in valuation allowance (1) | 51 | (49 | ) | ||||
Balance as of December 31 | $ | 899 | $ | 1,098 | |||
(1) The Company's valuation allowance related to mortgage servicing rights was $525,000 and $576,000 at December 31, 2012 and 2011, respectively, and are reflected in the balances shown above.
Results of Operations
Table 22 — Summary of Results of Operations
Years Ended December 31 | |||||||
2012 | 2011 | ||||||
(Dollars in thousands) | |||||||
Net income | $ | 42,627 | $ | 45,436 | |||
Diluted earnings per share | $ | 1.95 | $ | 2.12 | |||
Return on average assets | 0.83 | % | 0.96 | % | |||
Return on average equity | 8.66 | % | 9.93 | % | |||
Stockholders' equity as % of assets | 9.19 | % | 9.44 | % | |||
Net Interest Income The amount of net interest income is affected by changes in interest rates and by the volume, mix, and interest rate sensitivity of interest-earning assets and interest-bearing liabilities.
On a fully tax-equivalent basis, net interest income was $173.9 million in 2012, a 3.3% increase from 2011 net interest income of $168.4 million.
The following table presents the Company’s average balances, net interest income, interest rate spread, and net interest margin for 2012, 2011, and 2010. Nontaxable income from loans and securities is presented on a fully tax-equivalent basis whereby tax-exempt income is adjusted upward by an amount equivalent to the prevailing income taxes that would have been paid if the income had been fully taxable.
Table 23 — Average Balance, Interest Earned/Paid & Average Yields
Years Ended December 31 | ||||||||||||||||||||||||||||||||
2012 | 2011 | 2010 | ||||||||||||||||||||||||||||||
AVERAGE BALANCE | INTEREST EARNED/ PAID | AVERAGE YIELD | AVERAGE BALANCE | INTEREST EARNED/ PAID | AVERAGE YIELD | AVERAGE BALANCE | INTEREST EARNED/ PAID | AVERAGE YIELD | ||||||||||||||||||||||||
(Dollars in thousands) | ||||||||||||||||||||||||||||||||
Interest-earning assets | ||||||||||||||||||||||||||||||||
Interest earning deposits with banks, federal funds sold, and short term investments | $ | 54,483 | $ | 132 | 0.24 | % | $ | 65,053 | $ | 162 | 0.25 | % | $ | 132,019 | $ | 337 | 0.26 | % | ||||||||||||||
Securities | ||||||||||||||||||||||||||||||||
Trading assets | 1,365 | 37 | 2.71 | % | 8,329 | 285 | 3.42 | % | 7,225 | 262 | 3.63 | % | ||||||||||||||||||||
Taxable investment securities | 524,466 | 16,643 | 3.17 | % | 540,564 | 20,041 | 3.71 | % | 569,069 | 23,722 | 4.17 | % | ||||||||||||||||||||
Non-taxable investment securities(1) | 1,746 | 140 | 8.02 | % | 7,471 | 560 | 7.50 | % | 15,877 | 1,138 | 7.17 | % | ||||||||||||||||||||
Total securities | 527,577 | 16,820 | 3.19 | % | 556,364 | 20,886 | 3.75 | % | 592,171 | 25,122 | 4.24 | % | ||||||||||||||||||||
Loans held for sale | 29,928 | 988 | 3.30 | % | 14,646 | 482 | 3.29 | % | 16,266 | 666 | 4.09 | % | ||||||||||||||||||||
Loans(2) | ||||||||||||||||||||||||||||||||
Commercial and industrial | 625,789 | 25,309 | 4.04 | % | 538,805 | 22,867 | 4.24 | % | 427,004 | 19,457 | 4.56 | % | ||||||||||||||||||||
Commercial real estate (1) | 1,923,602 | 93,582 | 4.86 | % | 1,792,247 | 93,604 | 5.22 | % | 1,646,419 | 94,217 | 5.72 | % | ||||||||||||||||||||
Commercial construction | 159,271 | 6,698 | 4.21 | % | 126,083 | 5,805 | 4.60 | % | 155,524 | 7,507 | 4.83 | % | ||||||||||||||||||||
Small business | 79,092 | 4,509 | 5.70 | % | 78,851 | 4,606 | 5.84 | % | 81,091 | 4,829 | 5.96 | % | ||||||||||||||||||||
Total commercial | 2,787,754 | 130,098 | 4.67 | % | 2,535,986 | 126,882 | 5.00 | % | 2,310,038 | 126,010 | 5.45 | % | ||||||||||||||||||||
Residential real estate | 425,084 | 17,848 | 4.20 | % | 450,501 | 20,203 | 4.48 | % | 525,203 | 25,235 | 4.80 | % | ||||||||||||||||||||
Residential construction | 11,653 | 482 | 4.14 | % | 5,685 | 260 | 4.57 | % | 6,565 | 334 | 5.09 | % | ||||||||||||||||||||
Home equity | 765,228 | 28,124 | 3.68 | % | 635,695 | 24,015 | 3.78 | % | 504,886 | 19,369 | 3.84 | % | ||||||||||||||||||||
Total consumer real estate | 1,201,965 | 46,454 | 3.86 | % | 1,091,881 | 44,478 | 4.07 | % | 1,036,654 | 44,938 | 4.33 | % | ||||||||||||||||||||
Consumer — other | 32,630 | 2,785 | 8.54 | % | 53,551 | 4,171 | 7.79 | % | 88,077 | 6,799 | 7.72 | % | ||||||||||||||||||||
Total loans | 4,022,349 | 179,337 | 4.46 | % | 3,681,418 | 175,531 | 4.77 | % | 3,434,769 | 177,747 | 5.17 | % | ||||||||||||||||||||
Total Interest-Earning Assets | $ | 4,634,337 | $ | 197,277 | 4.26 | % | $ | 4,317,481 | $ | 197,061 | 4.56 | % | $ | 4,175,225 | $ | 203,872 | 4.88 | % | ||||||||||||||
Cash and Due from Banks | 67,085 | 55,897 | 62,103 | |||||||||||||||||||||||||||||
Federal Home Loan Bank Stock | 35,155 | 35,854 | 35,854 | |||||||||||||||||||||||||||||
Other Assets | 377,450 | 336,617 | 316,234 | |||||||||||||||||||||||||||||
Total Assets | $ | 5,114,027 | $ | 4,745,849 | $ | 4,589,416 | ||||||||||||||||||||||||||
Interest-bearing liabilities | ||||||||||||||||||||||||||||||||
Deposits | ||||||||||||||||||||||||||||||||
Savings and interest checking accounts | $ | 1,484,758 | $ | 2,820 | 0.19 | % | $ | 1,355,478 | $ | 3,216 | 0.24 | % | $ | 1,183,247 | $ | 4,397 | 0.37 | % | ||||||||||||||
Money market | 803,656 | 2,461 | 0.31 | % | 728,380 | 3,050 | 0.42 | % | 739,264 | 4,565 | 0.62 | % | ||||||||||||||||||||
Time certificates of deposits | 646,873 | 5,422 | 0.84 | % | 656,486 | 7,089 | 1.08 | % | 814,462 | 11,292 | 1.39 | % | ||||||||||||||||||||
Total interest bearing deposits | 2,935,287 | 10,703 | 0.36 | % | 2,740,344 | 13,355 | 0.49 | % | 2,736,973 | 20,254 | 0.74 | % | ||||||||||||||||||||
Borrowings | ||||||||||||||||||||||||||||||||
Federal Home Loan Bank and other borrowings | 224,553 | 5,277 | 2.35 | % | 284,400 | 7,199 | 2.53 | % | 320,953 | 9,589 | 2.99 | % | ||||||||||||||||||||
Wholesale repurchase agreements | 50,000 | 1,162 | 2.32 | % | 50,000 | 1,748 | 3.50 | % | 50,000 | 2,116 | 4.23 | % | ||||||||||||||||||||
Customer repurchase agreements | 160,589 | 325 | 0.20 | % | 143,904 | 536 | 0.37 | % | 132,467 | 968 | 0.73 | % | ||||||||||||||||||||
Junior subordinated debentures | 63,549 | 3,749 | 5.90 | % | 61,857 | 3,663 | 5.92 | % | 61,857 | 3,666 | 5.93 | % | ||||||||||||||||||||
Subordinated debt | 30,000 | 2,177 | 7.26 | % | 30,000 | 2,171 | 7.24 | % | 30,000 | 2,170 | 7.23 | % | ||||||||||||||||||||
Total borrowings | 528,691 | 12,690 | 2.40 | % | 570,161 | 15,317 | 2.69 | % | 595,277 | 18,509 | 3.11 | % | ||||||||||||||||||||
Total interest-bearing liabilities | $ | 3,463,978 | $ | 23,393 | 0.68 | % | $ | 3,310,505 | $ | 28,672 | 0.87 | % | $ | 3,332,250 | $ | 38,763 | 1.16 | % | ||||||||||||||
Demand deposits | 1,070,577 | 910,701 | 773,718 | |||||||||||||||||||||||||||||
Other liabilities | 87,104 | 67,221 | 58,199 | |||||||||||||||||||||||||||||
Total liabilities | $ | 4,621,659 | $ | 4,288,427 | $ | 4,164,167 | ||||||||||||||||||||||||||
Stockholders’ equity | 492,368 | 457,422 | 425,249 | |||||||||||||||||||||||||||||
Total liabilities and stockholders’ equity | $ | 5,114,027 | $ | 4,745,849 | $ | 4,589,416 | ||||||||||||||||||||||||||
Net interest income(1) | $ | 173,884 | $ | 168,389 | $ | 165,109 | ||||||||||||||||||||||||||
Interest rate spread(3) | 3.58 | % | 3.69 | % | 3.72 | % | ||||||||||||||||||||||||||
Net interest margin(4) | 3.75 | % | 3.90 | % | 3.95 | % | ||||||||||||||||||||||||||
Supplemental Information | ||||||||||||||||||||||||||||||||
Total deposits, including demand deposits | $ | 4,005,864 | $ | 10,703 | $ | 3,651,045 | $ | 13,355 | $ | 3,510,691 | $ | 20,254 | ||||||||||||||||||||
Cost of total deposits | 0.27 | % | 0.37 | % | 0.58 | % | ||||||||||||||||||||||||||
Total funding liabilities, including demand deposits | $ | 4,534,555 | $ | 23,393 | $ | 4,221,206 | $ | 28,672 | $ | 4,105,968 | $ | 38,763 | ||||||||||||||||||||
Cost of total funding liabilities | 0.52 | % | 0.68 | % | 0.94 | % | ||||||||||||||||||||||||||
(1) | The total amount of adjustment to present interest income and yield on a fully tax-equivalent basis is $1.1 million, $1.3 million and $1.1 million in 2012, 2011, and 2010, respectively. The FTE adjustment relates to nontaxable investment securities with average balances of $1.7 million, $7.5 million, and $15.9 million, in 2012, 2011, and 2010 respectively, and nontaxable industrial development bonds with average balance of $36.3 million, $37.6 million, and $32.2 million in 2012, 2011, and 2010, respectively. |
(2) | Average nonaccruing loans are included in loans. |
(3) | Interest rate spread represents the difference between the weighted average yield on interest-earning assets and the weighted average costs of interest-bearing liabilities. |
(4) | Net interest margin represents net interest income as a percentage of average interest-earning assets. |
The following table presents certain information on a fully-tax equivalent basis regarding changes in the Company’s interest income and interest expense for the periods indicated. For each category of interest-earning assets and interest-bearing liabilities, information is provided with respect to changes attributable to (1) changes in rate (change in rate multiplied by prior year volume), (2) changes in volume (change in volume multiplied by prior year rate) and (3) changes in volume/rate (change in rate multiplied by change in volume) which is allocated to the change due to rate column.
Table 24 — Volume Rate Analysis
Years Ended December 31 | |||||||||||||||||||||||||||||||||||
2012 Compared To 2011 | 2011 Compared To 2010 | 2010 Compared To 2009 | |||||||||||||||||||||||||||||||||
Change Due to Rate(1) | Change Due to Volume | Total Change | Change Due to Rate(1) | Change Due to Volume | Total Change | Change Due to Rate(1) | Change Due to Volume | Total Change | |||||||||||||||||||||||||||
(Dollars in thousands) | |||||||||||||||||||||||||||||||||||
Income on interest-earning assets | |||||||||||||||||||||||||||||||||||
Interest earning deposits, federal funds sold and short term investments | $ | (4 | ) | $ | (26 | ) | $ | (30 | ) | $ | (4 | ) | $ | (171 | ) | $ | (175 | ) | $ | (232 | ) | $ | 279 | $ | 47 | ||||||||||
Securities | |||||||||||||||||||||||||||||||||||
Trading assets | (10 | ) | (238 | ) | (248 | ) | (17 | ) | 40 | 23 | 120 | (97 | ) | 23 | |||||||||||||||||||||
Taxable securities | (2,801 | ) | (597 | ) | (3,398 | ) | (2,493 | ) | (1,188 | ) | (3,681 | ) | (3,024 | ) | (1,710 | ) | (4,734 | ) | |||||||||||||||||
Non-taxable securities(2) | 9 | (429 | ) | (420 | ) | 25 | (603 | ) | (578 | ) | 118 | (437 | ) | (319 | ) | ||||||||||||||||||||
Total securities | (4,066 | ) | (4,236 | ) | (5,030 | ) | |||||||||||||||||||||||||||||
Loans held for sale | 3 | 503 | 506 | (118 | ) | (66 | ) | (184 | ) | (48 | ) | 85 | 37 | ||||||||||||||||||||||
Loans | |||||||||||||||||||||||||||||||||||
Commercial and industrial | (1,250 | ) | 3,692 | 2,442 | (1,684 | ) | 5,094 | 3,410 | (773 | ) | 4,275 | 3,502 | |||||||||||||||||||||||
Commercial real estate | (6,882 | ) | 6,860 | (22 | ) | (8,958 | ) | 8,345 | (613 | ) | (5,585 | ) | 13,786 | 8,201 | |||||||||||||||||||||
Commercial construction | (635 | ) | 1,528 | 893 | (281 | ) | (1,421 | ) | (1,702 | ) | (130 | ) | (1,865 | ) | (1,995 | ) | |||||||||||||||||||
Small business | (111 | ) | 14 | (97 | ) | (90 | ) | (133 | ) | (223 | ) | (45 | ) | (269 | ) | (314 | ) | ||||||||||||||||||
Total commercial | 3,216 | 872 | 9,394 | ||||||||||||||||||||||||||||||||
Residential real estate | (1,215 | ) | (1,140 | ) | (2,355 | ) | (1,443 | ) | (3,589 | ) | (5,032 | ) | (1,214 | ) | (884 | ) | (2,098 | ) | |||||||||||||||||
Residential construction | (51 | ) | 273 | 222 | (29 | ) | (45 | ) | (74 | ) | (79 | ) | (392 | ) | (471 | ) | |||||||||||||||||||
Home equity | (784 | ) | 4,893 | 4,109 | (372 | ) | 5,018 | 4,646 | (384 | ) | 2,230 | 1,846 | |||||||||||||||||||||||
Total consumer real estate | 1,976 | (460 | ) | (723 | ) | ||||||||||||||||||||||||||||||
Total other consumer | 244 | (1,630 | ) | (1,386 | ) | 37 | (2,665 | ) | (2,628 | ) | 280 | (3,819 | ) | (3,539 | ) | ||||||||||||||||||||
Loans(2)(3) | 3,806 | (2,216 | ) | 5,132 | |||||||||||||||||||||||||||||||
Total | $ | 216 | $ | (6,811 | ) | $ | 186 | ||||||||||||||||||||||||||||
Expense of interest-bearing liabilities | |||||||||||||||||||||||||||||||||||
Deposits | |||||||||||||||||||||||||||||||||||
Savings and interest checking accounts | $ | (703 | ) | $ | 307 | $ | (396 | ) | $ | (1,821 | ) | $ | 640 | $ | (1,181 | ) | $ | (1,757 | ) | $ | 1,401 | $ | (356 | ) | |||||||||||
Money market | (904 | ) | 315 | (589 | ) | (1,448 | ) | (67 | ) | (1,515 | ) | (3,004 | ) | 1,024 | (1,980 | ) | |||||||||||||||||||
Time certificates of deposits | (1,563 | ) | (104 | ) | (1,667 | ) | (2,013 | ) | (2,190 | ) | (4,203 | ) | (6,260 | ) | (2,313 | ) | (8,573 | ) | |||||||||||||||||
Total interest-bearing deposits | (2,652 | ) | (6,899 | ) | (10,909 | ) | |||||||||||||||||||||||||||||
Borrowings | |||||||||||||||||||||||||||||||||||
Federal Home Loan Bank and other borrowings | (407 | ) | (1,515 | ) | (1,922 | ) | (1,298 | ) | (1,092 | ) | (2,390 | ) | 641 | (2,571 | ) | (1,930 | ) | ||||||||||||||||||
Wholesale repurchase agreements | (586 | ) | — | (586 | ) | (368 | ) | — | (368 | ) | 11 | — | 11 | ||||||||||||||||||||||
Customer repurchase agreements | (273 | ) | 62 | (211 | ) | (516 | ) | 84 | (432 | ) | (341 | ) | 18 | (323 | ) | ||||||||||||||||||||
Junior subordinated debentures | (14 | ) | 100 | 86 | (3 | ) | — | (3 | ) | (73 | ) | — | (73 | ) | |||||||||||||||||||||
Subordinated debt | 6 | — | 6 | 1 | — | 1 | (8 | ) | — | (8 | ) | ||||||||||||||||||||||||
Total borrowings | (2,627 | ) | (3,192 | ) | (2,323 | ) | |||||||||||||||||||||||||||||
Total | $ | (5,279 | ) | $ | (10,091 | ) | $ | (13,232 | ) | ||||||||||||||||||||||||||
Change in net interest income | $ | 5,495 | $ | 3,280 | $ | 13,418 | |||||||||||||||||||||||||||||
(1) | The changes for each category of interest income and expense are divided between the portion of change attributable to the variance in volume and the portion of the change attributable to the variances in rate for that category. The unallocated change in rate or volume variance has been allocated to the rate variances. |
(2) | The total amount of adjustment to present interest income and yield on a fully tax-equivalent basis is $1.1 million, $1.3 million, and $1.1 million in 2012, 2011, and 2010, respectively. |
(3) | Loans include portfolio loans and nonaccrual loans, however unpaid interest on nonaccrual loans has not been included for purposes of determining interest income. |
The increase in net interest income is driven mainly by reductions in the Company’s overall cost of funding, stemming from the Company’s strategy to create a funding mix that focuses on core deposits. Although average loan balances increased, a reduction in loan yields, as well as a decline in the size of and yield on the securities portfolio, reduced overall growth in interest income.
Provision For Loan Losses The provision for loan losses represents the charge to expense that is required to maintain an adequate level of allowance for loan losses. The provision for loan losses totaled $18.1 million in 2012, compared with $11.5 million in 2011, an increase of $6.6 million. The Company’s allowance for loan losses, as a percentage of total loans, was 1.15%, as compared to 1.27% at December 31, 2011. The decrease in this percentage is driven by loans acquired in connection with the Central acquisition which have been recorded at fair value, including a reduction for estimated credit losses and without carryover of the respective portfolio's historical allowance for loan losses.
The increase in the amount of the provision for loan losses is the result of shifts in the composition of loan portfolio mix, as certain portfolios require different levels of allowance allocation based upon the risks associated with each portfolio, as well as portfolio growth of outstanding balances, offset by improvements in certain asset quality measures. Net charge-offs for the year ended December 31, 2012 totaled $14.5 million, an increase of $5.0 million from the prior year. The increase in net charge-offs was largely impacted by a customer fraud situation, which resulted in a net charge-off of $4.8 million.
Although the national economic environment remains challenging, regional and local general economic conditions continued to show improvement during 2012, as measured in terms of employment levels, statewide economic activity, and other regional economic indicators. Local residential real estate market fundamentals were improved during 2012 characterized by a higher level of home sales, lower inventory levels, and stabilized prices compared to the same period in 2011. Additionally, completed foreclosure activity declined during 2012. Regional commercial real estate market conditions were mixed, with some areas experiencing a continued recovery, and others still exhibiting higher vacancy rates and negative absorption. Leading economic indicators signal continued economic improvement through the first part of 2013; however, uncertainty persists and economic growth is expected to be slow.
Management’s periodic evaluation of the adequacy of the allowance for loan losses considers past loan loss experience, known and inherent risks in the loan portfolio, adverse situations which may affect the borrowers’ ability to repay, the estimated value of the underlying collateral, if any, and current economic conditions. Substantial portions of the Bank’s loans are secured by real estate in Massachusetts and Rhode Island. Accordingly, the ultimate collectability of a substantial portion of the Bank’s loan portfolio is susceptible to changes in property values within those states.
Noninterest Income The following table sets forth information regarding noninterest income for the periods shown:
Table 25 — Noninterest Income
Years Ended December 31 | ||||||||||||||
Change | ||||||||||||||
2012 | 2011 | Amount | % | |||||||||||
(Dollars in thousands) | ||||||||||||||
Service charges on deposit accounts | $ | 15,930 | $ | 16,628 | $ | (698 | ) | (4.2 | )% | |||||
Interchange and ATM fees | 9,783 | 7,733 | 2,050 | 26.5 | % | |||||||||
Investment management | 14,779 | 13,532 | 1,247 | 9.2 | % | |||||||||
Mortgage banking income | 6,500 | 4,197 | 2,303 | 54.9 | % | |||||||||
Increase in cash surrender value of life insurance policies | 3,114 | 3,170 | (56 | ) | (1.8 | )% | ||||||||
Gains realized on life insurance policies | 1,307 | — | 1,307 | 100.0 | % | |||||||||
Loan level derivative income | 3,457 | 2,093 | 1,364 | 65.2 | % | |||||||||
Net gain on sales of securities | 5 | 723 | (718 | ) | (99.3 | )% | ||||||||
Net impairment losses recognized in earnings on securities | (76 | ) | (243 | ) | 167 | (68.7 | )% | |||||||
Other noninterest income | 7,217 | 4,867 | 2,350 | 48.3 | % | |||||||||
Total | $ | 62,016 | $ | 52,700 | $ | 9,316 | 17.7 | % | ||||||
Noninterest income, which is generated by deposit account service charges, interchange and ATM fees, investment management services, mortgage banking activities, cash surrender value of life insurance, and miscellaneous other sources, amounted to $62.0 million in 2012, a $9.3 million, or 17.7%, increase from the prior year. The primary reasons for the variances in the noninterest income category shown in the preceding table are noted below:
Service charges on deposit accounts, which represented 25.7% of total noninterest income, decreased from $16.6 million in 2011 to $15.9 million in 2012, mainly due to a decrease in customer utilization of overdraft privileges on checking accounts.
Interchange and ATM fees increased $2.1 million, or 26.5%, due to increased debit card usage by the Bank’s customers, driven by increased promotion, marketing campaigns, and sales activity.
Investment management revenue increased by $1.2 million, or 9.2%, for the year ended December 31, 2012, as compared to the same period in 2011. The increase is attributable to strong sales results and general market appreciation, as well as an increase in assets under administration, which had risen to $2.2 billion at December 31, 2012 representing a 31.0% increase from the prior year.
Mortgage banking revenue of $6.5 million in 2012, increased by 54.9% from the $4.2 million recorded in 2011, reflective of strong mortgage originations and refinancing activity due to the low rate environment.
The Company received proceeds on life insurance policies in the amount of $2.7 million during the third quarter, resulting in a gain of $1.3 million. The gain represented tax-exempt income to the Company. There were no such proceeds received in the prior year.
The loan level derivative income increased $1.4 million, or 65.2%, driven by increased activity by the Company's commercial customers. This service is used to offer customers a longer term fixed rate cash flow on loans while allowing the Bank to manage interest rate risk.
Other noninterest income increased by $2.4 million, or 48.3%, for the year ended December 31, 2012, as compared to the same period in 2011, driven by $798,000 associated with the purchase of tax credits, $431,000 attributable to the change in the fair value of the Company’s trading securities from the prior year, as well as increases in various other categories, including merchant processing income and asset-based lending fee income.
Noninterest Expense The following table sets forth information regarding noninterest expense for the periods shown:
Table 26 — Noninterest Expense
Years Ended December 31 | ||||||||||||||
Change | ||||||||||||||
2012 | 2011 | Amount | % | |||||||||||
(Dollars in thousands) | ||||||||||||||
Salaries and employee benefits | $ | 84,014 | $ | 81,275 | $ | 2,739 | 3.4 | % | ||||||
Occupancy and equipment expenses | 17,307 | 16,916 | 391 | 2.3 | % | |||||||||
Data processing and facilities management | 4,644 | 4,891 | (247 | ) | -5.1 | % | ||||||||
Advertising | 3,949 | 3,876 | 73 | 1.9 | % | |||||||||
FDIC assessment | 3,232 | 3,496 | (264 | ) | -7.6 | % | ||||||||
Consulting | 2,801 | 2,660 | 141 | 5.3 | % | |||||||||
Legal fees | 2,223 | 2,262 | (39 | ) | -1.7 | % | ||||||||
Merger & acquisitions expenses | 6,741 | — | 6,741 | 100.0 | % | |||||||||
Goodwill impairment | 2,227 | — | 2,227 | 100.0 | % | |||||||||
Telecommunications | 2,324 | 2,092 | 232 | 11.1 | % | |||||||||
Prepayment fees on borrowings | 7 | 757 | (750 | ) | (99.1 | )% | ||||||||
Other noninterest expense | 29,990 | 27,488 | 2,502 | 9.1 | % | |||||||||
Total | $ | 159,459 | $ | 145,713 | $ | 13,746 | 9.4 | % | ||||||
Inclusive of merger and integration costs, noninterest expense increased by $13.7 million, or 9.4%, during the year ended December 31, 2012 as compared to the same period in 2011. Excluding merger and acquisition, goodwill impairment and other noncore items, noninterest expenses were well contained increasing only 3.8% over the prior year. The primary reasons for the variances in the noninterest expense category shown in the preceding table are noted below:
Salaries and employee benefits increased by $2.7 million, or 3.4%, for the year ended December 31, 2012, as compared to the same period in 2011, mainly attributable to an increase in commissions earned, benefit plan expenses, as well as the inclusion of Central's employee base in the fourth quarter of 2012.
Occupancy and equipment expenses increased by $391,000, or 2.3% due partly to acquired Central facilities offset by decreases in costs related to snow removal.
Merger and acquisition expenses associated with the Central Acquisition were $6.7 million for the year ended 2012.
During 2012 the Company recorded a $2.2 million goodwill impairment charge, which represented the total amount of goodwill relating to Compass Exchange Advisors, LLC which was acquired in January 2007. There were no other goodwill impairment charges recognized during the year ended 2012 or in the prior year.
Total other noninterest expense increased by $2.5 million, or 9.1%, for the year ended December 31, 2012, as compared to the same period in 2011. The increase is primarily attributable to the increases in the following: contract labor increased $640,000 driven by the outsourcing of various mortgage banking functions, internet banking increased by $453,000 due to implementation of to a new on-line banking vendor, debit card expense increased $387,000 due to increased customer usage, and appraisal costs increased by $327,000 due to loan growth experienced during the year.
Income Taxes The tax effect of all income and expense transactions is recognized by the Company in each year’s consolidated statements of income, regardless of the year in which the transactions are reported for income tax purposes. The following table sets forth information regarding the Company’s tax provision and applicable tax rates for the periods indicated:
Table 27 — Tax Provision and Applicable Tax Rates
December 31 | |||||||||||
2012 | 2011 | 2010 | |||||||||
(Dollars in thousands) | |||||||||||
Combined federal and state income tax provisions | $ | 14,673 | $ | 17,148 | $ | 12,227 | |||||
Effective income tax rates | 25.6 | % | 27.4 | % | 23.3 | % | |||||
Blended federal and state statutory tax rate | 40.9 | % | 41.2 | % | 41.5 | % | |||||
Effective July 1, 2008 Massachusetts state legislation was passed which enacted corporate tax reform. As a result of that legislation, the state tax rate was reduced by 1.5% over a three year period which began on January 1, 2010 and has resulted in a blended statutory rate of 40.9% in 2012. The Company's effective rate, which is lower than the statutory rate, is attributable to certain tax preference assets such as the non-taxable increase in cash surrender value of life insurance and tax exempt bonds as well as federal tax credits recognized, primarily in connection with the New Markets Tax Credit (“NMTC”) program. The decrease in the Company’s effective tax rate in 2012 was primarily attributable to additional New Markets Tax Credits awarded in 2012 as well as an increase in tax exempt income.
As of December 31, 2012, the Company has been awarded a total of $191.0 million in tax credit allocation authority under the Federal New Markets Tax Credit Program. Tax credits are eligible to be recognized over a seven year period totaling 39.0% of the total award, as capital is invested into a subsidiary which will lend to qualifying businesses in low income communities. Accordingly, the Company has received and continues to receive eligible aggregated tax credits totaling $74.5 million. The following table details the tax credit recognition by year associated with this program:
Table 28 — New Markets Tax Credit Recognition Schedule
Investment | Prior Years | 2012 | 2013 | 2014 | 2015 | 2016 | Thereafter | Total Credits | |||||||||||||||||||||||||||
(Dollars in thousands) | |||||||||||||||||||||||||||||||||||
2004 | $ | 15.0 | M | $ | 5,850 | $ | — | $ | — | $ | — | $ | — | $ | — | $ | — | $ | 5,850 | ||||||||||||||||
2005 | 15.0 | M | 5,850 | — | — | — | — | — | — | 5,850 | |||||||||||||||||||||||||
2007 | 38.2 | M | 10,314 | 2,292 | 2,292 | — | — | — | — | 14,898 | |||||||||||||||||||||||||
2008 | 6.8 | M | 1,428 | 408 | 408 | 408 | — | — | — | 2,652 | |||||||||||||||||||||||||
2009 | 10.0 | M | 1,500 | 600 | 600 | 600 | 600 | — | — | 3,900 | |||||||||||||||||||||||||
2010 | 40.0 | M | 4,000 | 2,000 | 2,400 | 2,400 | 2,400 | 2,400 | — | 15,600 | |||||||||||||||||||||||||
2012 | 21.4 | M | — | 1,071 | 1,071 | 1,071 | 1,285 | 1,285 | 2,570 | 8,353 | |||||||||||||||||||||||||
2013* | 44.6 | M | — | — | 2,229 | 2,229 | 2,229 | 2,675 | 8,025 | 17,387 | |||||||||||||||||||||||||
Total | $ | 191.0 | M | $ | 28,942 | $ | 6,371 | $ | 9,000 | $ | 6,708 | $ | 6,514 | $ | 6,360 | $ | 10,595 | $ | 74,490 | ||||||||||||||||
* Amount anticipated to be invested.
Deferred tax assets generally represent items that can be used as a tax deduction or credit in future income tax returns, for which a financial statement tax benefit has already been recognized. The realization of the net deferred tax asset generally depends upon future levels of taxable income and the existence of prior years’ taxable income to which carry-back refund claims could be made. If current available information makes it more likely than not that a deferred tax asset will be fully realized, a valuation allowance is established. Deferred tax assets are measured using enacted tax rates expected to apply to taxable income in the years in which the temporary differences are expected to be recovered or settled. The effect of a change in enacted tax rates on the deferred tax assets is recognized in income in the period that includes the enactment date. The deferred tax asset was $25.3 million and $16.1 million at December 31, 2012 and 2011, respectively. The
Company had no recorded deferred tax valuation allowance as of December 31, 2012 and 2011.
Dividends The Company declared cash dividends of $0.84 per common share in 2012 and $0.76 in 2011. The 2012 and 2011 ratio of dividends paid to earnings was 52.77% and 35.88%, respectively. The increase in the payout ratio for 2012 is due to the acceleration of the payment of the Company's fourth quarter dividend, which was paid on December 31, 2012, and would have been typically paid during the second week of the following month.
Since substantially all of the funds available for the payment of dividends are derived from the Bank, future dividends of the Company will depend on the earnings of the Bank, its financial condition, its need for funds, applicable governmental policies and regulations, and other such matters as the Board of Directors deem appropriate.
Comparison of 2011 vs. 2010 The Company’s total assets were $5.0 billion, which represents an increase of $274.5 million, or 5.8%, at December 31, 2011 compared to December 31, 2010. Total average assets were $4.7 billion and $4.6 billion in 2011 and 2010, respectively. Total securities of $518.5 million, at December 31, 2011, decreased $69.3 million compared to the $587.8 million reported on December 31, 2010. Total loans of $3.8 billion, at December 31, 2011 increased $238.7 million compared to the prior year ended December 31, 2010. Total deposits of $3.9 billion at December 31, 2011 reflected an increase of $249.0 million, or 6.9%, compared to December 31, 2010. Borrowings decreased by $27.7 million, or 4.9%, during the year ended December 31, 2011. Stockholders’ equity increased by $32.6 million in 2011.
Net income for 2011 was $45.4 million, or $2.12 per diluted share, compared to $40.2 million, or $1.90 per diluted share, in 2010. Return on average assets and return on average common equity were 0.96% and 9.93%, respectively, for 2011 and 0.88% and 9.46%, respectively, for 2010.
On a fully tax-equivalent basis, net interest income was $168.4 million in 2011, a 2.0% increase from 2010 net interest income of $165.1 million. The increase in net interest income was driven mainly by reductions in the Company’s overall cost of funding, stemming from the Company’s strategy to create a funding mix that focuses on core deposits. Although average loan balances increased, a reduction in loan yields, as well as a decline in the size of and yield on the securities portfolio, reduced overall growth in interest income.
Interest expense for the year ended December 31, 2011 decreased to $28.7 million from the $38.8 million recorded in 2010, a decrease of $10.1 million, or 26.0%. The total cost of funds decreased 26 basis points to 0.68% for 2011 as compared to 0.94% for 2010. Average interest-bearing deposits increased $3.4 million, or 0.1%, over the prior year while the cost of these deposits decreased from 0.74% in 2010 to 0.49% in 2011 primarily attributable to the active management of the Company's deposit costs.
Average borrowings decreased in 2011 by $25.1 million, or 4.2%, from the 2010 average balance, with the average cost of borrowings decreasing to 2.69% from 3.11%.
The provision for loan losses totaled $11.5 million in 2011, compared with $18.7 million in 2010, a decrease of $7.2 million. The Company’s allowance for loan losses, as a percentage of total loans, was 1.27%, as compared to 1.30% at December 31, 2010. For the year ended December 31, 2011, net loan charge-offs totaled $9.5 million, a decrease of $5.3 million from the prior year.
The decrease in the amount of the provision for loan losses is the result of improvements in certain asset quality measures, offset by shifts in the composition of loan portfolio mix, as certain portfolios require different levels of allowance allocation based upon the risks associated with each portfolio, as well as portfolio growth of outstanding balances. While the total loan portfolio increased by 6.7% for the year ended December 31, 2011, growth among the commercial components of 8.3% continued to outpace the consumer lending components which increased 3.3%. These lending categories each exhibit different credit risk characteristics.
Noninterest income, which is generated by deposit account service charges, interchange and ATM fees, investment management services, mortgage banking activities, an increase in cash surrender value of life insurance, and miscellaneous other sources, amounted to $52.7 million in 2011, a $5.8 million, or 12.4%, increase from the prior year.
Service charges on deposit accounts, which represented 31.6% of total noninterest income in 2011, increased from $13.6 million in 2010 to $16.6 million in 2011, mainly due to increased customer utilization of overdraft privileges on checking accounts.
Interchange and ATM fees increased $2.6 million, or 52.1%, the increase was partially due to a reclassification of interchange income that was previously recorded as a net expense in other noninterest expense amounting to $1.5 million, as well as increased debit card usage by the Bank's customers. Debit card usage had increased due to marketing promotions related to a debit card point program.
Investment management revenue increased by $1.8 million, or 15.4%, for the year ended December 31, 2011, as compared to the same period in 2010. Assets under administration at December 31, 2011 were $1.7 billion, an increase of $79.9 million, or 5.1%, as compared to December 31, 2010. This increase is largely due to strong sales results and general market appreciation.
Mortgage banking revenue of $4.2 million in 2011, decreased by 16.7% from the $5.0 million recorded in 2010, reflective of a lower volume of mortgage originations due to a decline in refinancing activity experienced in 2011 as compared to prior year.
A $723,000 net gain on the sale of securities was recorded for the year ended December 31, 2011 as compared to a $458,000 net gain on the sale of securities for the year ended December 31, 2010.
The Company recorded total credit related impairment charges on certain pooled trust preferred securities and one private mortgage-backed security of $234,000 and $334,000, for the years ended December 31, 2011 and December 31, 2010, respectively.
Other noninterest income decreased by $1.2 million, or 14.3%, for the year ended December 31, 2011, as compared to the same period in 2010, largely attributable to decreases in income from the Company’s loan level derivatives program and the change in the fair value of the Company's trading securities.
Noninterest expense increased by $6.0 million, or 4.3%, during the year ended December 31, 2011 as compared to the same period in 2010. The primary reasons for the increase in noninterest expense by category are noted below:
Salaries and employee benefits increased by $4.3 million, or 5.6%, for the year ended December 31, 2011, as compared to the same period in 2010, attributable to incremental hiring, expansion of the commercial banking business to support growth initiatives, higher levels of performance based incentive compensation and other benefit expenses.
Occupancy and equipment expenses increased by $905,000, or 5.7% due to increased rent of leased property, snow removal and impairment on fixed assets associated with branch closings.
Advertising increased by $1.7 million, or 78.5%, due to an increase in marketing efforts to promote the Bank's growth, largely in the consumer categories of loans and deposits.
FDIC assessment decreased by $1.8 million, or 33.4% due to a lower assessment rate that was effective starting in the second quarter of 2011.
During the fourth quarter of 2011, the Company prepaid $28.0 million of borrowings, resulting in a prepayment penalty of $757,000.
Total other noninterest expense increased by $1.8 million, or 7.1%, for the year ended December 31, 2011, as compared to the same period in 2010. The increase is primarily attributable to the increases in other real estate owned valuation write-offs of $1.2 million and increases in foreclosure expenses of $800,000.
Risk Management
The Company’s Board of Directors and Executive Management have identified significant risk categories which affect the Company. The risk categories include: credit risk, operations risk, compliance risk, reputation risk, strategic risk, market risk and liquidity risk. The Board of Directors has approved a Risk Management Policy that addresses each category of risk. The Chief Executive Officer, Chief Financial Officer, Chief Technology and Operations Officer, Executive Vice President of Commercial Lending and other members of management provide regular reports to the Board of Directors, identifying key risk issues and plans to address these issues. The Board of Directors will ensure the level of risk is within limits established by both the Risk Management Policy and other previously approved policies.
Credit Risk Credit risk represents the possibility that customers may not repay loans or other contractual obligations according to their terms due to a decline in their credit quality. In some cases, the collateral securing the payment of the loans may be sufficient to assure repayment, but in other cases the Company may experience significant credit losses which could have an adverse effect on its operating results. The Company makes various assumptions and judgments about the collectability of its loan portfolio, including the creditworthiness of borrowers and the value of the real estate and other assets serving as collateral for the repayment of loans. For further discussion regarding the credit risk and the credit quality of the Company’s loan portfolio, see Note 4, “Loans, Allowance for Loan Losses, and Credit Quality” within Notes to Consolidated Financial Statements included in Item 8 hereof.
Operations Risk Operations risk is the risk of loss due to human behavior, inadequate or failed internal systems and controls, and external influences such as market conditions, fraudulent activities, disasters and security risks. The Company continuously strives to strengthen its system of internal controls, operating processes and employee awareness. The Bank has an Operations Risk Management Committee that meets monthly and reports to the Board quarterly or more frequently if events occur that warrant reporting to the Board more frequently. The committee is chaired by the Chief Technology and Operations Officer and members of the Committee include representatives from Audit, Finance, Technology, Compliance, Information Security and periodic attendance from business units throughout the organization. An operations risk management dashboard is updated quarterly and reviewed with the Board.
Compliance Risk Compliance risk represents the risk of regulatory sanctions or financial loss resulting from the Company’s failure to comply with rules and regulations issued by the various banking agencies, the U.S. Securities and Exchange Commission, and the NASDAQ Stock Market, and standards of good banking practice. Activities which may expose the Company to compliance risk include, but are not limited to, those dealing with the prevention of money laundering, privacy and data protection, adherence to all applicable laws and regulations, community reinvestment initiatives and employment and tax matters. Compliance risk is mitigated through the use of written policies and procedures, training of staff, and monitoring of activities for adherence to those procedures.
Strategic and Reputation Risk Strategic and reputation risk represent the risk of loss due to impairment of reputation, failure to fully develop and execute business plans, and failure to assess current and new opportunities in business, markets and products. Mitigation of strategic and/or reputational risk is achieved through robust annual strategic planning and frequent executive strategic reviews, ongoing competitive and technological observation, rigorous assessment processes of new product, new branch, and new business initiatives, adherence
to ethical standards and a philosophy of customer advocacy, a structured process of customer complaint resolution, and ongoing reputational monitoring and management tools.
Market Risk Market risk is the sensitivity of income to changes in interest rates, foreign exchange rates, commodity prices and other market-driven rates or prices. Interest rate sensitivity is the most significant market risk to which the Company is exposed.
Interest rate risk is the sensitivity of income to changes in interest rates. Changes in interest rates, as well as fluctuations in the level and duration of assets and liabilities, affect net interest income, the Company’s primary source of revenue. Interest rate risk arises directly from the Company’s core banking activities. In addition to directly impacting net interest income, changes in the level of interest rates can also affect the amount of loans originated, the timing of cash flows on loans and securities, and the fair value of securities and derivatives, as well as other effects.
The primary goal of interest rate risk management is to control this risk within limits approved by the Board of Directors. These limits reflect the Company’s tolerance for interest rate risk over both short-term and long-term horizons. The Company attempts to control interest rate risk by identifying, quantifying, and where appropriate, hedging its exposure. If assets and liabilities do not re-price simultaneously and in equal volume, the potential for interest rate exposure exists. It is management’s objective to maintain stability in the growth of net interest income through the maintenance of an appropriate mix of interest-earning assets and interest-bearing liabilities and, when necessary, within prudent limits, through the use of off-balance sheet hedging instruments such as interest rate swaps, floors and caps.
The Company quantifies its interest rate exposures using net interest income simulation models, as well as simpler gap analysis, and Economic Value of Equity analysis. Key assumptions in these simulation analyses relate to behavior of interest rates and behavior of the Company’s deposit and loan customers. The most material assumptions relate to the prepayment of mortgage assets (including mortgage loans and mortgage-backed securities) and the life and sensitivity of nonmaturity deposits (e.g. DDA, NOW, savings and money market). In the case of prepayment of mortgage assets, assumptions are derived from published dealer median prepayment estimates for comparable mortgage loans. The risk of prepayment tends to increase when interest rates fall. Since future prepayment behavior of loan customers is uncertain, the resultant interest rate sensitivity of loans cannot be determined exactly.
The Company’s policy on interest-rate risk simulation specifies that for all "core" interest rate scenarios, estimated net interest income for the subsequent one-year period, should not decline by more than 10%. The Company's core scenarios for December 31, 2012, included five instantaneous parallel shifts (“shock”) to market interest rates, and four gradual (12 to 24 months) shifts in interest rates:
Table 29 — Interest Rate Sensitivity
Years Ended December 31 | |||
2012 | 2011 | ||
Parallel rate shocks (basis points) | |||
-100 | (0.50)% | n/a | |
+100 | 4.20% | n/a | |
+200 | 8.10% | n/a | |
+300 | 12.00% | 9.90% | |
+400 | 15.70% | n/a | |
Gradual rate shifts (basis points) | |||
+100 over 12 months | 0.30% | (0.10)% | |
+200 over 12 months | 3.50% | 2.60% | |
+400 over 24 months | 3.60% | 2.70% | |
Flat +500 over 12 months | 4.40% | 3.20% | |
The Company's policy on interest rate risk simulation also specifies that estimated net interest income for the second year of all “core scenarios” should decline by less than 15.0%. The Company was well within policy limits at December 31, 2012 and 2011. It should be emphasized, however, that the results are dependent on material assumptions such as those discussed above. For instance, asymmetrical rate behavior can have a material impact on the simulation results. If competition for deposits forced the Company to raise rates on those liabilities quicker than is assumed in the simulation analysis without a corresponding increase in asset yields, net interest income may be negatively impacted. Alternatively, if the Company is able to lag increases in deposit rates as loans re-price upward, net interest income would be positively impacted.
The most significant factors affecting market risk exposure of the Company’s net interest income during 2012 were (i) the shape of the U.S. Government securities and interest rate swap yield curve, (ii) the level of U.S. prime interest rate and LIBOR rates, and (iii) the level of interest rates being offered on long-term fixed rate loans.
The Company manages the interest rate risk inherent in both its loan and borrowing portfolios by utilizing interest rate swap agreements and interest rate caps and floors. An interest rate swap is an agreement whereby one party agrees to pay a floating rate of interest on a notional principal amount in exchange for receiving a fixed rate of interest on the same notional amount for a predetermined period of time from a second party. Interest rate caps and floors are agreements whereby one party agrees to pay a floating rate of interest on a notional principal amount for a predetermined period of time to a second party if certain market interest rate thresholds are realized. The amounts relating to the notional principal amount are not actually exchanged. See Note 11, “Derivatives and Hedging Activities” within Notes to Consolidated Financial Statements included in Item 8 hereof for additional information regarding the Company’s Derivative Financial Instruments.
The Company manages the interest rate risk inherent in its mortgage banking operations by entering into forward sales contracts. An increase in market interest rates between the time the Company commits to terms on a loan and the time the Company ultimately sells the loan in the secondary market will have the effect of reducing the gain (or increasing the loss) the Company records on the sale. The Company attempts to mitigate this risk by entering into forward sales commitments in amounts sufficient to cover all closed loans and interest rate-locked loan commitments.
The Company’s earnings are not directly or materially impacted by movements in foreign currency rates or commodity prices. Movements in equity prices may have a modest impact on earnings by affecting the volume of activity or the amount of fees from investment-related business lines, as well as changes in the fair value of trading securities, if any. (See Note 3, “Securities” within the Notes to the Consolidated Financial Statements included in Item 8 hereof).
Liquidity Risk Liquidity risk is the risk that the Company will not have the ability to generate adequate amounts of cash in the most economical way for the institution to meet its ongoing obligations to pay deposit withdrawals, service borrowings, and to fund loan commitments. The Company’s primary sources of funds are deposits, borrowings, and the amortization, prepayment and maturities of loans and securities. The Bank utilizes its extensive branch network to access retail customers who provide a stable base of in-market core deposits. These funds are principally comprised of demand deposits, interest checking accounts, savings accounts, and money market accounts. Deposit levels are greatly influenced by interest rates, economic conditions, and competitive factors.
The Company actively manages its liquidity position under the direction of the Asset/ Liability Committee (ALCO). The Company’s primary measure of short-term liquidity is the Basic Surplus/Deficit as a percentage of assets. This ratio, which is an analysis of the relationship between liquid assets and short-term liabilities relative to total assets, was well within policy limits at December 31, 2012. The Basic Surplus measure is affected primarily by changes in deposits, securities and short-term investments, loans and borrowings. An increase in deposits, without a corresponding increase in nonliquid assets, will improve the Basic Surplus measure, whereas, an increase in loans, with no increase in deposits, will decrease the measure. Other factors affecting the Basic Surplus measure include collateral requirements at the FHLB, changes in the securities portfolio, and the mix of deposits.
The Bank is careful to increase deposits without adversely impacting the weighted average cost of those funds. As part of a prudent liquidity risk management practice, the Company maintains various liquidity sources, some of which are only accessed on a contingency basis. Accordingly, management has implemented funding strategies that include FHLB advances, Federal Reserve Bank borrowing capacity and repurchase agreement lines. These nondeposit funds are also viewed as a contingent source of liquidity and, when profitable lending and investment opportunities exist, access to such funds provides a means to grow the balance sheet.
Borrowing capacity at the FHLB and the Federal Reserve is impacted by the amount and type of assets available to be pledged. For example, a prime, one-to-four family, residential loan, may provide 75 cents of borrowing capacity for every $1.00 pledged, whereas, a commercial loan may provide a lower amount. As a result, the Company’s strategic lending decisions can also affect its liquidity position.
The Company can raise additional liquidity through the issuance of equity or unsecured debt privately or publicly. Additionally, the Company is able to enter into additional repurchase agreements or acquire brokered deposits at its discretion. The availability and cost of equity or debt on an unsecured basis is dependent on many factors. Some factors that will impact this source of liquidity are the Company’s financial position, the market environment, and the Company’s credit rating. As such, the Company is careful to monitor the various factors that could impact its ability to raise liquidity through these channels.
The table below shows outstanding borrowing balances and the remaining unused liquidity capacity from various sources as of the periods indicated:
Table 30 — Sources of Liquidity
December 31 | |||||||||||||||||
2012 | 2011 | ||||||||||||||||
Outstanding | Additional Borrowing Capacity | Outstanding | Additional Borrowing Capacity | ||||||||||||||
(Dollars in thousands) | |||||||||||||||||
Federal Home Loan Bank of Boston | $ | 271,569 | $ | 661,922 | $ | 229,701 | $ | 526,556 | |||||||||
Federal Reserve Bank of Boston | — | 766,195 | — | 618,787 | |||||||||||||
Unpledged securities | — | 114,953 | — | 83,791 | |||||||||||||
Wholesale repurchase agreements | 50,000 | — | (1) | 50,000 | — | (1) | |||||||||||
Customer repurchase agreements | 153,359 | — | (1) | 166,128 | — | (1) | |||||||||||
Junior subordinated debentures | 74,127 | — | (1) | 61,857 | — | (1) | |||||||||||
Subordinated debt | 30,000 | — | (1) | 30,000 | — | (1) | |||||||||||
Parent Company line of credit | 12,000 | 8,000 | — | — | |||||||||||||
Brokered deposits(2) | 96,033 | — | (1) | 78,965 | — | (1) | |||||||||||
$ | 687,088 | $ | 1,551,070 | $ | 616,651 | $ | 1,229,134 | ||||||||||
(1) | The additional borrowing capacity has not been assessed for these categories. |
(2) | Inclusive of $72.2 million and $55.2 million of brokered deposits acquired through participation in the CDARS program as of December 31, 2012 and 2011, respectively. |
In addition to policies used for managing operational liquidity, the Board of Directors and the Asset/Liability Committee of the Bank recognize the need to establish reasonable guidelines for managing through an environment of heightened liquidity risk. Catalysts for elevated liquidity risk can be Bank-specific issues and/or systemic industry-wide events. It is, therefore, the responsibility of the Board and ALCO to institute systems and controls to provide advanced detection of potentially significant funding shortages, establish methods for assessing and monitoring risk levels, and institute prompt responses that may alleviate/circumvent a potential liquidity crisis. As such, the Board of Directors and the ALCO have put a Liquidity Contingency Plan in place. The overall goal of this plan is to provide a framework for the Bank to help detect liquidity problems promptly and appropriately address potential liquidity problems in a timely manner. In a period of perceived heightened liquidity risk, the Liquidity Contingency Plan provides for the establishment of a Liquidity Crisis Task Force. The Liquidity Crisis Task Force is responsible for monitoring the potential for a liquidity crisis and for establishing and executing an appropriate response.
Contractual Obligations, Commitments, Contingencies, and Off-Balance Sheet Financial Instruments
The Company has entered into contractual obligations, commitments, and off-balance sheet financial instruments. The following tables summarize the Company’s contractual obligations, other commitments, contingencies, and off-balance sheet financial instruments at December 31, 2012:
Table 31 — Contractual Obligations, Commitments, Contingencies, and Off-Balance Sheet
Financial Instruments by Maturity
Payments Due — By Period | |||||||||||||||||||
Contractual Obligations, Commitments and Contingencies | Total | Less than One Year | One to Three Years | Four to Five Years | After Five Years | ||||||||||||||
(Dollars in thousands) | |||||||||||||||||||
FHLB advances(1) | $ | 261,134 | $ | 163,134 | $ | 18,000 | $ | 75,000 | $ | 5,000 | |||||||||
Junior subordinated debentures(1) | 73,198 | — | — | — | 73,198 | ||||||||||||||
Subordinated debt | 30,000 | — | — | — | 30,000 | ||||||||||||||
Time certificates of deposits | 753,125 | 518,957 | 165,637 | 68,477 | 54 | ||||||||||||||
All other deposits with no maturity | 3,793,552 | 3,793,552 | — | — | — | ||||||||||||||
Lease obligations | 55,571 | 7,540 | 14,614 | 13,040 | 20,377 | ||||||||||||||
Data processing and core systems | 20,287 | 5,312 | 9,632 | 4,212 | 1,131 | ||||||||||||||
Other vendor contracts | 5,839 | 2,147 | 2,444 | 1,248 | — | ||||||||||||||
Retirement benefit obligations(2) | 30,896 | 333 | 711 | 887 | 28,965 | ||||||||||||||
Other | |||||||||||||||||||
Wholesale repurchase agreements | 50,000 | — | 50,000 | — | — | ||||||||||||||
Customer repurchase agreements | 153,359 | 153,359 | — | — | — | ||||||||||||||
Other borrowings | 12,000 | 12,000 | — | — | — | ||||||||||||||
Total Contractual Obligations | $ | 5,238,961 | $ | 4,656,334 | $ | 261,038 | $ | 162,864 | $ | 158,725 | |||||||||
Amount of Commitment Expiring — By Period | |||||||||||||||||||
Off-Balance Sheet Financial Instruments | Total | Less than One Year | One to Three Years | Four to Five Years | After Five Years | ||||||||||||||
Lines of credit | $ | 595,028 | $ | 132,120 | $ | 74 | $ | — | $ | 462,834 | |||||||||
Standby letters of credit | 25,468 | 25,366 | 102 | — | — | ||||||||||||||
Other loan commitments | 842,407 | 527,635 | 24,412 | 63,650 | 226,710 | ||||||||||||||
Forward commitments to sell loans | 106,307 | 106,307 | — | — | — | ||||||||||||||
Interest rate swaps - notional value(3) | 200,000 | 50,000 | 75,000 | 50,000 | 25,000 | ||||||||||||||
Customer-related positions | |||||||||||||||||||
Foreign exchange contracts - notional value(4) | 42,516 | 42,516 | — | — | — | ||||||||||||||
Loan level interest rate swaps - notional value(5) | 502,248 | 16,766 | 171,283 | 88,656 | 225,543 | ||||||||||||||
Total Commitments | $ | 2,313,974 | $ | 900,710 | $ | 270,871 | $ | 202,306 | $ | 940,087 | |||||||||
(1) | The Company has hedged certain short-term borrowings and variable rate junior subordinated debentures, effectively converting the borrowings to a fixed rate. Amounts maturing represent contractual amounts due and exclude any amortization of fair value marks associated with acquired borrowings. |
(2) | Retirement benefit obligations include expected contributions to the Company’s frozen pension plan, post retirement plan, and supplemental executive retirement plans. Expected contributions for the pension plan have been included only through plan year July 1, 2012 — June 30, 2013. Contributions beyond this plan year cannot be quantified as they will be determined based upon the return on the investments in the plan and the discount rate used to quantify the liability. Expected contributions for the post retirement plan and supplemental executive retirement plans include obligations that are payable over the life of the participants. |
(3) | Interest rate swaps on borrowings and junior subordinated debentures (Bank pays fixed, receives variable). Amounts relating to the notional principal amounts are not actually exchanged. |
(4) | Offsetting positions to interest rate foreign exchange contracts offered to commercial borrowers through the Company’s derivative Program. Amounts relating to the notional principal amounts are not actually exchanged. |
(5) | Offsetting positions to Interest rate swaps offered to commercial borrowers through the Company’s loan-level derivative program. Amounts relating to the notional principal amounts are not actually exchanged. |
Impact of Inflation and Changing Prices
The consolidated financial statements and related notes thereto presented elsewhere herein have been prepared in accordance with accounting principles generally accepted in the United States of America which require the measurement of financial position and operating results in terms of historical dollars without considering changes in the relative purchasing power of money over time due to inflation.
The financial nature of the Company’s consolidated financial statements is more clearly affected by changes in interest rates than by inflation. Interest rates do not necessarily fluctuate in the same direction or in the same magnitude as the prices of goods and services. However, inflation does affect the Company because, as prices increase, the money supply grows and interest rates are affected by inflationary
expectations. The impact on the Company is a noted increase in the size of loan requests with resulting growth in total assets. In addition, operating expenses may increase without a corresponding increase in productivity. There is no precise method, however, to measure the effects of inflation on the Company’s consolidated financial statements. Accordingly, any examination or analysis of the financial statements should take into consideration the possible effects of inflation.
Critical Accounting Policies and Estimates
Critical accounting policies are defined as those that are reflective of significant judgments and uncertainties, and could potentially result in materially different results under different assumptions and conditions. Management believes that the Company’s most critical accounting policies upon which the Company’s financial condition depends, and which involve the most complex or subjective decisions or assessments, are as follows:
Allowance for Loan Losses The Company’s allowance for loan losses provides for probable losses based upon evaluations of known and inherent risks in the loan portfolio. Arriving at an appropriate amount of allowance for loan losses involves a high degree of judgment.
The Company makes use of two types of allowances for loan losses: specific and general. A specific allowance may be assigned to a loan that is considered to be impaired. Certain loans are evaluated individually for impairment and are judged to be impaired when management believes it is probable that the Bank will not collect all of the contractual interest and principal payments as scheduled in the loan agreement. Judgment is required with respect to designating a loan as impaired and determining the amount of the required specific allowance. Management’s judgment is based upon its assessment of probability of default, loss given default, and exposure at default. Changes in these estimates could be due to a number of circumstances which may have a direct impact on the provision for loan losses and may result in changes to the amount of allowance.
The general allowance is determined based upon the application of the Company’s methodology for assessing the adequacy of the allowance for loan losses, which considers historical and expected loss factors, loan portfolio composition and other relevant indicators. This methodology involves management’s judgment regarding the application and use of such factors, including the effects of changes to the prevailing economic environment in its estimate of the required amounts of general allowance.
The allowance is increased by provisions for loan losses and by recoveries of loans previously charged-off and is reduced by loans charged-off. For additional discussion of the Company’s methodology of assessing the adequacy of the allowance for loan losses, see Note 4, “Loans, Allowance for Loan Losses, and Credit Quality” within Notes to Consolidated Financial Statements included in Item 8 hereof.
Income Taxes The Company accounts for income taxes using two components of income tax expense, current and deferred. Accrued taxes represent the net estimated amount due to or to be received from taxing authorities in the current year. In estimating accrued taxes, management assesses the relative merits and risks of the appropriate tax treatment of transactions taking into account statutory, judicial, and regulatory guidance in the context of the Company’s tax position. Deferred tax assets and liabilities represent the future effects on income taxes that result from temporary differences between the tax basis of assets and liabilities and their reported amounts in the financial statements, and carry-forwards that exist at the end of a period. Deferred tax assets and liabilities are measured using enacted tax rates and provisions of the enacted tax law and are not discounted to reflect the time-value of money. The effect of any change in enacted tax rates on deferred tax assets and liabilities is recognized in income in the period that includes the enactment date. Deferred tax assets are assessed for recoverability. The Company would record a valuation allowance if it believes based on available evidence that it is more likely than not that the deferred tax assets recognized will not be realized before their expiration. The amount of the deferred tax asset recognized and considered realizable could be reduced if projected income is not achieved due to various factors such as unfavorable business conditions. If projected income is not expected to be achieved, the Company would record a valuation allowance to reduce its deferred tax assets to the amount that it believes can be realized in its future tax returns. The Company had no recorded deferred tax valuation allowance as of December 31, 2012. Additionally, deferred tax assets and liabilities are calculated based on tax rates expected to be in effect in future periods. Previously recorded tax assets and liabilities need to be adjusted when the expected date of the future event is revised based upon current information. The Company may also record an unrecognized tax benefit related to uncertain tax positions taken by the Company on its tax returns for which there is less than a 50% likelihood of being recognized upon a tax examination. All movements in unrecognized tax benefits are recognized through the provision for income taxes. Taxes are discussed in more detail in Note 12, “Income Taxes” within Notes to the Consolidated Financial Statements included in Item 8 hereof.
Valuation of Goodwill/Intangible Assets and Analysis for Impairment The Company has increased its market share through the acquisition of entire financial institutions accounted for under the acquisition method of accounting, as well as from the acquisition of branches (not the entire institution) and other nonbanking entities. For all acquisitions, the Company is required to record assets acquired and liabilities assumed at their fair value, which is an estimate determined by the use of internal or other valuation techniques. Goodwill is evaluated for impairment at least annually, or more often if warranted, using a combined qualitative and quantitative impairment approach. The initial qualitative approach assesses whether the existence of events or circumstances led to a determination that it is more likely than not that the fair value of a reporting unit is less than its carrying amount. If, after assessing the totality of events and circumstances, the Company determines it is more likely than not that the fair value is less than carrying value the two step quantitative impairment test is performed. Step one of the quantitative impairment testing compares book value to the fair value of the reporting unit. If test one is failed, a more detailed analysis is performed, which involves measuring the excess of the fair value of the reporting unit, as determined in step one, over the aggregate fair value of the individual assets, liabilities, and identifiable intangibles as if the reporting unit was being acquired in a business combination.
Goodwill impairment charges totaling $2.2 million dollars, associated with the asset purchase of Compass on January 1, 2007, were recorded during 2012. Compass’ business model success is closely correlated to the volume of U.S. commercial real estate transactions and the interest rate spread that can be obtained on short-term funds among other factors. A sharpened reduction in real estate transactions and the projected continuation of low interest rates resulted in the impairment being recognized. Step 1 of the impairment testing was passed for all other reporting units during 2012. The remainder of the Company’s goodwill relates to acquisitions that are fully integrated into the retail banking operations, which management does not consider to be at risk of failing Step 1 in the near future. The Company’s intangible assets are subject to amortization and are reviewed for impairment whenever events or changes in circumstances indicate that the carrying amount may not be receivable. If applicable, the Company tests each of the intangibles by comparing the carrying value of the intangible to the sum of the undiscounted cash flows expected to result from the use and eventual disposition of the asset.
Valuation of Securities and Analysis for Impairment Securities that the Company has the ability and intent to hold until maturity are classified as securities held-to-maturity and are accounted for using historical cost, adjusted for amortization of premium and accretion of discount. Trading securities are carried at fair value, with unrealized gains and losses recorded in other noninterest income. All other securities are classified as securities available-for-sale and are carried at fair market value. The fair values of securities are based on either quoted market price or third party pricing services. In general, the third-party pricing services employ various methodologies, including but not limited to, broker quotes and proprietary models. Management does not typically adjust the prices received from third-party pricing services. Depending upon the type of security, management employs various techniques to analyze the pricing it receives from third-parties, such as reviewing model inputs, reviewing comparable trades, analyzing changes in market yields and, in certain instances, reviewing the underlying collateral of the security. Management reviews changes in fair values from period to period and performs testing to ensure that the prices received from the third parties are consistent with their expectation of the market.
Management determines if the market for a security is active primarily based upon the frequency of which the security, or similar securities, are traded. For securities which are determined to have an inactive market, fair value models are calibrated and to the extent possible, significant inputs are back tested on a quarterly basis. The third-party service provider performs calibration and testing of the models by comparing anticipated inputs to actual results, on a quarterly basis. Unrealized gains and losses on securities available-for-sale are reported, on an after-tax basis, as a separate component of stockholders’ equity in accumulated other comprehensive income.
On a quarterly basis, the Company makes an assessment to determine whether there have been any events or circumstances to indicate that a security for which there is an unrealized loss is impaired on an other-than-temporary basis. The Company considers many factors, including the severity and duration of the impairment; the Company’s intent to sell the security, or whether it is more likely than not that the Company will be required to sell the debt security before its anticipated recovery, recent events specific to the issuer or industry; and for debt securities, external credit ratings and recent downgrades. The term other-than-temporary is not intended to indicate that the decline is permanent. It indicates that the prospects for near-term recovery are not necessarily favorable or that there is a lack of evidence to support fair values greater than or equal to the carrying value of the investment. Estimates of the expected cash flows for investment securities that potentially may be deemed to have OTTI begin with the contractual cash flows of the security. This amount is then reduced by an estimate of probable credit losses associated with the security. When estimating the extent of probable losses on the securities, management considers the strength of the underlying issuers of the securities. Indicators of diminished credit quality of the issuers include defaults, interest deferrals, or “payments in kind.” Numerous factors are considered when estimating the ultimate realizability of the cash flow for each individual security. The resulting estimate of cash flows after considering credit is then subject to a present value computation using a discount rate equal to the current yield used to accrete the beneficial interest or, the effective interest rate implicit in the security at the date of acquisition. If the present value of the estimated cash flows is less than the current amortized cost basis, an OTTI is considered to have occurred and the security is written down to the fair value indicated by the cash flows analysis. Any portion of decline in fair value considered to be an OTTI charge that is not due to the reduction in cash flows due to credit is considered a decline due to other factors such as liquidity or interest rates and accordingly is recorded in other comprehensive income. Any portion of the decline which is related to credit is recorded in earnings.
Recent Accounting Developments
See Note 1, “Summary of Significant Accounting Policies” within Notes to Consolidated Financial Statements included in Item 8 hereof.
ITEM 9A. CONTROLS AND PROCEDURES
Conclusion Regarding the Effectiveness of Disclosure Controls and Procedures The Company carried out an evaluation, under the supervision and with the participation of the Company’s management, including the Company’s Chief Executive Officer along with the Company’s Chief Financial Officer, of the effectiveness of the design and operation of the Company’s disclosure controls and procedures, as such term is defined under Rule 13a-15(e) promulgated under the Securities Exchange Act of 1934, as amended (the “Exchange Act”). Based upon that evaluation, the Company’s Chief Executive Officer along with the Company’s Chief Financial Officer concluded that the Company’s disclosure controls and procedures are effective as of the end of the period covered by this annual report.
Changes in Internal Controls over Financial Reporting There were no changes in our internal control over financial reporting that occurred during the fourth quarter that have materially affected, or are reasonably likely to materially affect, the Company’s internal controls over financial reporting.
Management’s Report on Internal Control Over Financial Reporting Management of Independent Bank Corp. is responsible for establishing and maintaining adequate internal control over financial reporting. Internal control over financial reporting is defined in Rule 13a-15(f) under the Exchange Act as a process designed by, or under the supervision of, the Company’s principal executive and principal financial officers and effected by the Company’s Board of Directors, management and other personnel, to provide reasonable assurance regarding the reliability of financial reporting and the preparation of financial statements for external purposes in accordance with generally accepted accounting principles. Independent Bank Corp.’s internal control over financial reporting includes those policies and procedures that:
(i) pertain to the maintenance of records that in reasonable detail accurately and fairly reflects the transactions and disposition of the assets of the Company;
(ii) provide reasonable assurance that transactions are recorded as necessary to permit preparation of financial statements in accordance with generally accepted accounting principles, and that receipts and expenditures of the Company are being made only in accordance with authorizations of management and directors of the Company; and
(iii) provide reasonable assurance regarding prevention or timely detection of unauthorized acquisition, use or disposition of the Company’s assets that could have a material effect on the financial statements.
Because of its inherent limitations, internal control over financial reporting may not prevent or detect misstatements. Also, projections of any evaluation of effectiveness to future periods are subject to the risk that controls may become inadequate because of changes in conditions, or that the degree of compliance with the policies or procedures may deteriorate.
Management assessed the effectiveness of the Company’s internal control over financial reporting as of December 31, 2012. In making this assessment, management used the criteria set forth by the Committee of Sponsoring Organizations of the Treadway Commission (COSO) in Internal Control-Integrated Framework.
Based on our assessment and those criteria, management believes that the Company maintained effective internal control over financial reporting as of December 31, 2012.
Independent Bank Corp.’s independent registered public accounting firm has issued a report on the Company’s internal control over financial reporting. That report appears below.
Report of Independent Registered Public Accounting Firm
The Board of Directors and Shareholders of
Independent Bank Corp.:
We have audited Independent Bank Corp. and subsidiaries’ (the “Company”) internal control over financial reporting as of December 31, 2012, based on criteria established in Internal Control – Integrated Framework issued by the Committee of Sponsoring Organizations of the Treadway Commission (“the COSO Criteria”). The Company’s management is responsible for maintaining effective internal control over financial reporting and for its assessment of the effectiveness of internal control over financial reporting included in the accompanying Management Report on Internal Control Over Financial Reporting. Our responsibility is to express an opinion on the Company’s internal control over financial reporting based on our audit.
We conducted our audit in accordance with the standards of the Public Company Accounting Oversight Board (United States). Those standards require that we plan and perform the audit to obtain reasonable assurance about whether effective internal control over financial reporting was maintained in all material respects. Our audit included obtaining an understanding of internal control over financial reporting, assessing the risk that a material weakness exists, testing and evaluating the design and operating effectiveness of internal control based on the assessed risk and performing such other procedures as we considered necessary in the circumstances. We believe that our audit provides a reasonable basis for our opinion.
A company’s internal control over financial reporting is a process designed to provide reasonable assurance regarding the reliability of financial reporting and the preparation of financial statements for external purposes in accordance with generally accepted accounting principles. A company’s internal control over financial reporting includes those policies and procedures that (1) pertain to the maintenance of records that, in reasonable detail, accurately and fairly reflect the transactions and dispositions of the assets of the company; (2) provide reasonable assurance that transactions are recorded as necessary to permit preparation of financial statements in accordance with generally accepted accounting principles, and that receipts and expenditures of the company are being made only in accordance with authorizations of management and directors of the company; and (3) provide reasonable assurance regarding prevention or timely detection of unauthorized acquisition use or disposition of the Company’s assets that could have a material effect on the financial statements.
Because of its inherent limitations, internal control over financial reporting may not prevent or detect misstatements. Also, projections of any evaluation of effectiveness to future periods are subject to the risk that controls may become inadequate because of changes in conditions, or that the degree of compliance with the policies or procedures may deteriorate.
In our opinion, Independent Bank Corp. and subsidiaries maintained, in all material respects, effective internal control over financial reporting as of December 31, 2012, based on the COSO criteria.
We also have audited, in accordance with the standards of the Public Company Accounting Oversight Board (United States), the 2012 consolidated financial statements of Independent Bank Corp. and subsidiaries and our report dated March 12, 2013 expressed an unqualified opinion thereon.
/s/ Ernst & Young LLP
Boston, Massachusetts
March 12, 2013
SIGNATURES
Pursuant to the requirements of Section 13 or 15(d) of the Securities Exchange Act of 1934, the Registrant has duly caused this report to be signed on its behalf by the undersigned, thereunto duly authorized.
INDEPENDENT BANK CORP. |
/s/ CHRISTOPHER ODDLEIFSON |
CHRISTOPHER ODDLEIFSON, Chief Executive Officer and President |
Date: March 18, 2013
Pursuant to the requirements of the Securities Exchange Act of 1934, this report has been signed below by the following persons on behalf of the Registrant and in the capacities and on the dates indicated.
* | Director and Chairman of the Board | Date: March 18, 2013 |
Donna L. Abelli | ||
* | CFO (Principal Financial Officer) | Date: March 18, 2013 |
Denis K. Sheahan | ||
* | Controller | Date: March 18, 2013 |
Barry H. Jensen | (Principal Accounting Officer) | |
* | Director | Date: March 18, 2013 |
Richard S. Anderson | ||
* | Director | Date: March 18, 2013 |
William P. Bissonnette | ||
* | Director | Date: March 18, 2013 |
Benjamin A. Gilmore, II | ||
* | Director | Date: March 18, 2013 |
Kevin J. Jones | ||
* | Director | Date: March 18, 2013 |
Eileen C. Miskell | ||
* | Director | Date: March 18, 2013 |
John J. Morrissey | ||
* | Director | Date: March 18, 2013 |
Daniel F. O’ Brien | ||
* | Director | Date: March 18, 2013 |
Carl Ribeiro | ||
* | Director | Date: March 18, 2013 |
Richard H. Sgarzi | ||
* | Director | Date: March 18, 2013 |
John H. Spurr, Jr. | ||
* | Director | Date: March 18, 2013 |
Robert D. Sullivan | ||
* | Director | Date: March 18, 2013 |
Brian S. Tedeschi | ||
* | Director | Date: March 18, 2013 |
Thomas R. Venables | ||
/s/ CHRISTOPHER ODDLEIFSON | Director CEO/President | Date: March 18, 2013 |
*Christopher Oddleifson as Attorney-in-Fact | (Principal Executive Officer) | |