Attached files
| file | filename |
|---|---|
| 8-K - FORM 8-K - Oritani Financial Corp | d490310d8k.htm |
 Keefe,
Bruyette & Woods Keefe, Bruyette & Woods
Boston Bank Conference
Boston Bank Conference
February 28, 2013
February 28, 2013
Exhibit 99.1 |
 Forward-Looking Statements
•
This
presentation
contains
forward-looking
statements,
which
can
be
identified
by
the
use
of
words
such
as
“estimate,”
“project,”
“believe,”
“intend,”
“anticipate,”
“plan,”
“seek,”
“expect”
and words of similar meaning. These forward-looking statements include, but are not
limited to: statements of our goals, intentions and expectations;
statements regarding our business plans, prospects, growth and operating strategies;
statements regarding the asset quality of our loan and investment portfolios; and
estimates of our risks and future costs and benefits.
•
These
forward-looking
statements
are
based
on
current
beliefs
and
expectations
of
our
management
and
are
inherently
subject
to
significant
business,
economic and competitive uncertainties and contingencies, many of which are beyond our
control. In addition, these forward-looking statements are subject to assumptions
with respect to future business strategies and decisions that are subject to change.
•
The following factors, among others, could cause actual results to differ materially from
the anticipated results or other expectations expressed in the forward-looking
statements: changes
in
laws
or
government
regulations
or
policies
affecting
financial
institutions,
including
changes
in
regulatory fees
and
capital
requirements;
general economic conditions, either nationally or in our market areas, that are worse than
expected; estimates of our risks and future costs and benefits.
competition among depository and other financial institutions;
inflation and changes in the interest rate environment that reduce our margins or reduce
the fair value of financial instruments; adverse changes in the securities markets;
our ability to enter new markets successfully and capitalize on growth opportunities;
our ability to successfully integrate acquired entities, if any;
changes in consumer spending, borrowing and savings habits;
changes in our organization, compensation and benefit plans;
our ability to continue to increase and manage our commercial and residential real estate,
multi-family, and commercial and industrial loans; possible impairments of securities held by us, including those issued by government
entities and government sponsored enterprises; the level of future deposit premium assessments;
the
impact
of
the
current
recession
on
our
loan
portfolio
(including
cash
flow
and
collateral
values),
investment
portfolio,
customers
and
capital market
activities;
changes in the financial performance and/or condition of our borrowers; and
the effect of changes in accounting policies and practices, as may be adopted by the
regulatory agencies, as well as the Securities and Exchange Commission, the Public
Company Accounting Oversight Board, the Financial Accounting Standards Board and other accounting standard setters.
•
Because of these and other uncertainties, our actual future results may be materially
different from the results indicated by these forward-looking statements. |
 Oritani Today
3
Oritani Bank is a New Jersey-chartered savings bank
headquartered in the Township of Washington, New
Jersey, with a longstanding history of community
banking since 1911
Focuses on organic growth of loan portfolio through
commercial real estate and multifamily loan originations
Gross loans have increased from $1.5 billion on
June 30, 2010 to $2.2 billion as of December 31,
2012
Operates 25 branches in demographically attractive
Northern New Jersey
Converted
to
MHC
structure
on
January 24 ,
2007,
raising $122 million of gross proceeds
Completed second-step conversion transaction on
June 24 , 2010 raising $414 million of gross proceeds;
experienced strong organic growth thereafter
Source: SNL Financial. Deposit information as of June 30, 2012.
New Jersey Franchise demographic information weighted by deposits by county.
th
rd
3
th
County
Rank
Branches
Company
Deposits
in Market
($000)
Deposit
Market
Share
(%)
Projected
Population
Change
2011-2016
(%)
Median
HH
Income
2011
($)
Projected
HH Income
Change
2011-2016
(%)
Bergen
9
17
1,176,354
2.96
0.70
79,903
14.56
Hudson
18
5
139,856
0.52
1.88
46,525
17.37
Passaic
16
2
70,442
0.67
0.34
58,123
20.53
Essex
30
1
23,618
0.09
(0.02)
52,839
18.16
Total
25
1,410,270
New Jersey Franchise
0.79
75,052
15.20
State of New Jersey
1.50
67,128
18.98
National
3.42
50,227
14.55
One of the largest community banking institutions in
Northern New Jersey
Oritani ranks
in
deposit
market
share
in
Bergen
County
with
17
branches;
ranks
among
New
Jersey based institutions
th
9 |
 Experienced Management Team
4
Experienced, shareholder-focused board and management
Kevin J. Lynch –
Chairman, President and Chief Executive Officer
President and Chief Executive Officer of Oritani Bank since 1993, President and
Chief Executive Officer of Oritani Financial Corp. since its creation in
1998 Serves as a director of the FHLB-NY, serving on its Executive,
Compensation and Housing Committees John M. Fields, Jr. –
Executive Vice President and Chief Financial Officer
Employed with Oritani since 1999; prior experience as chief accounting officer at a
publicly-traded financial institution CPA designation
Michael A. DeBernardi -
Director, Executive Vice President and Chief Operating Officer
Served
as
Lead
Director
until
appointed
Executive
Vice
President
and
Chief
Operating
Officer
in
April
2008
Oritani’s Chief Risk Officer
Thomas G. Guinan –
Executive Vice President and Chief Lending Officer
Employed
with
Oritani
since
2003;
oversees
all
aspects
of
retail
and
commercial
lending
operations
Previously
served
as
senior
vice
president
of
commercial
lending
at
a
local
financial
institution
Philip M. Wyks –
Senior Vice President and Corporate Secretary
Employed with Oritani since 1976
Director of Thrift Institutions Community Investment Corporation, a subsidiary of
the New Jersey League of Community Bankers |
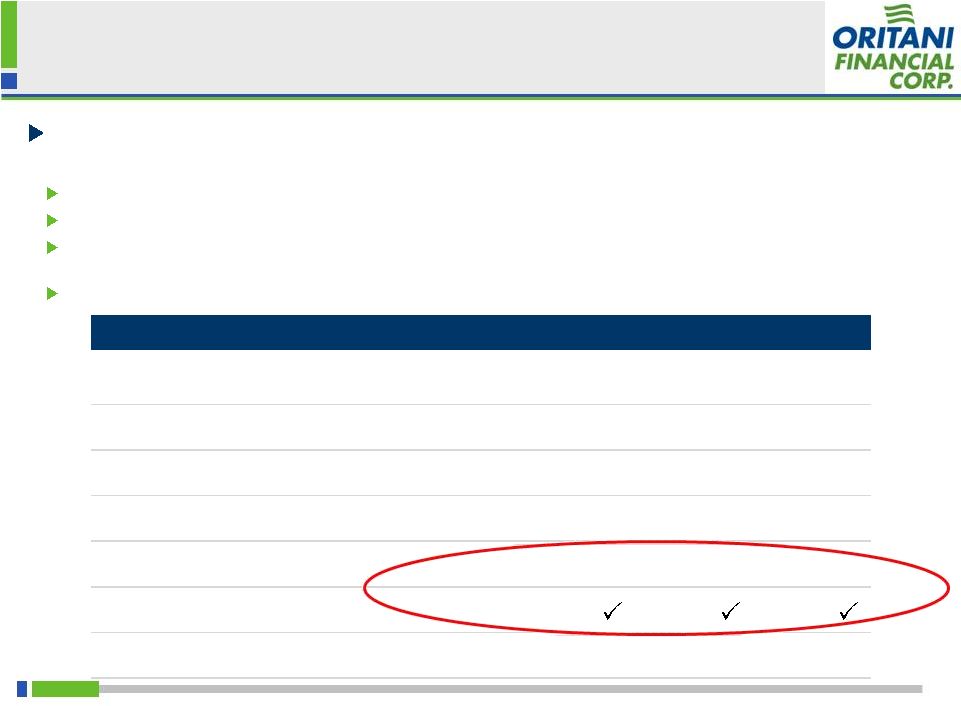
 Highlights of
Business Strategy 5
Continue to focus on organic multifamily and commercial real estate originations.
Aggressively remedy delinquent loans.
Maintain and increase core deposits.
Expand market share within primary market area.
Continue to emphasize operating efficiencies and cost control.
Other Strategic Decisions pertinent to shareholders
Robust history of stock repurchases. Currently an open repurchase
authorization for 1.8 million shares.
Strong recurring dividend.
Special Dividend of $0.40 per share in November, 2012.
Executive management and the Board of Directors are materially invested in the
stock of Oritani Financial Corp. |
   Dollars in Thousands
except per share amounts
Q2 2013
Q2 2012
YoY
Change
Assets
$2,809,686
$2,603,143
7.9%
Gross Loans
$2,214,071
$1,851,983
19.6%
Non-time Deposits
$841,292
$722,225
16.5%
Basic Earnings Per Share
$0.21
$0.18
15.8%
TBV Per Share
$11.15
$11.14
0.1%
Common Shares Outstanding
45,381,531
45,477,534
(0.2%)
Dividends Per Share*
$0.15
$0.125
20.0%
Non-Performing Assets
$32,218
$23,195
38.9%
Second Quarter Financial Highlights
6
Stable asset growth
Driven by prudent loan
underwriting
Strong core deposit growth
CRE and multi-family loan
growth initiative translating to
bottom line
Shareholder oriented capital
management
Repurchase program
Increased dividends
$0.40 special dividend in
Q2 2013
Proactive approach to non-
performers
*Q2 2013 is presented excluding a special dividend of $0.40 per share.
|
  Strong
Asset Growth Trajectory 7
Oritani continues to experience strong balance sheet growth fueled by CRE and
multifamily originations
Dollars in thousands |
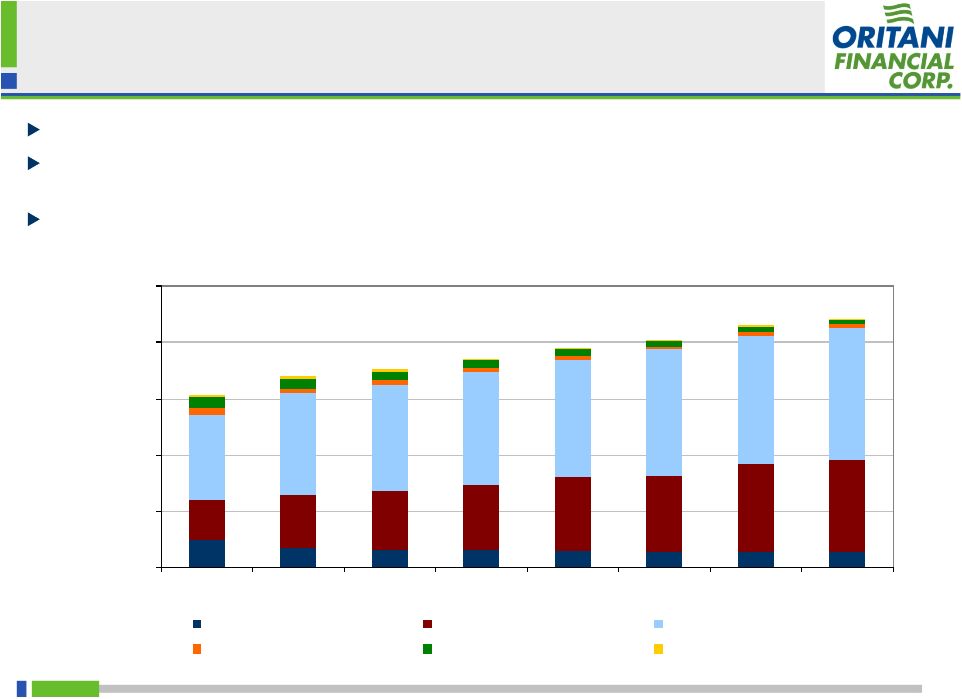 $1.53 B
$1.70 B
$1.76 B
$1.85 B
$1.94 B
$2.02 B
$2.15 B
$2.21 B
$0
$500,000
$1,000,000
$1,500,000
$2,000,000
$2,500,000
2010
2011
Q1 2012
Q2 2012
Q3 2012
Q4 2012
Q1 2013
Q2 2013
Residential
Multi-family
Commercial Real Estate
Second Mortgage and Equity
Construction and Land
Other + Deferred Fees
Stable, Disciplined Loan Growth
8
Oritani’s
focus
on
commercial
real
estate
and
multifamily
loans
has
been
a
source
of
strength
Commercial
real
estate
loans
increased
from
$760
million
at
June
30,
2010
to
$1.2
billion
as
of
December 31, 2012
Multifamily loans increased from $360 million at June 30, 2010 to $828 million as of
December 31, 2012
Dollars in thousands
TOTAL LOANS |
 Market Area Loan Portfolio
9
New Jersey (57%)
New York (28%)
Pennsylvania (12%)
Connecticut (2%)
Other (1%)
Oritani’s
market
area
for
multifamily
and
commercial
real
estate
lending
is
generally
about
150
miles
from
our
headquarters
in
Bergen
County,
New
Jersey.
It
includes
the
entire
state
of
NJ,
the
broader
New
York
metropolitan
area,
southern
New
York,
eastern
Pennsylvania,
and
southern
Connecticut.
Our
multifamily
and
commercial
real
estate
portfolio
at
December
31,
2012
consists
almost
entirely
of
organic
originations
within
our
lending
market
area. |
  Continued Focus on Core Deposit Growth
10
Oritani’s core deposit gathering efforts have resulted in improved funding
costs for the Company
Dollars in thousands |
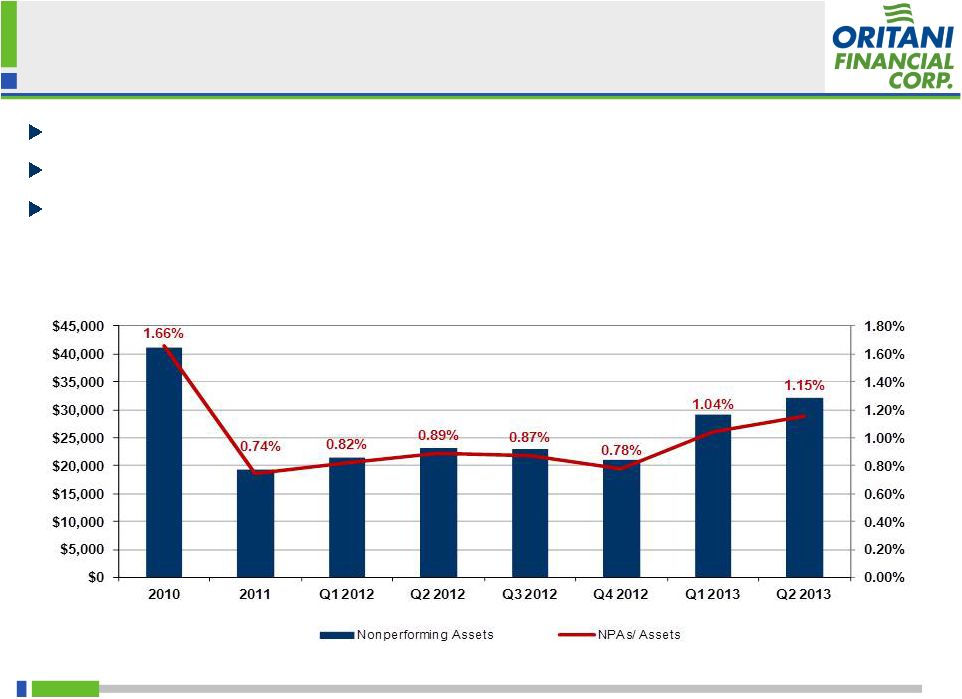 Disciplined Underwriting Culture
11
Oritani’s asset quality profile has remained strong in a difficult operating
environment Maintain disciplined underwriting standards and proactive
approach to problem assets Granular detail of the larger components of
nonaccrual loans is provided in the 10Q. Management believes that
several of the larger non-performing assets may be on the cusp of
favorable resolution. Dollars in thousands |
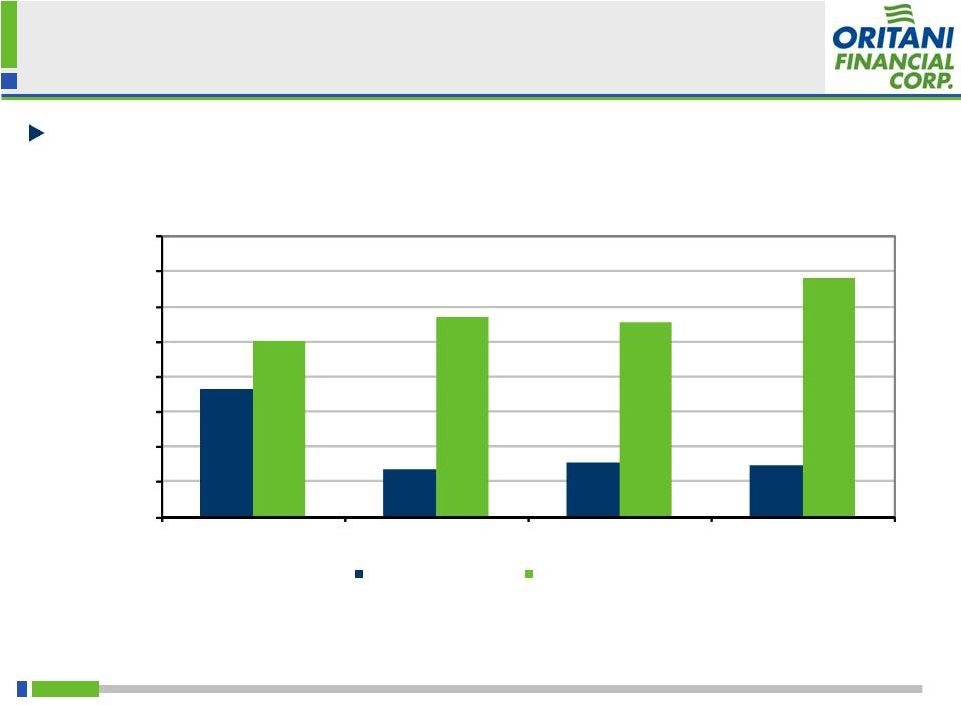
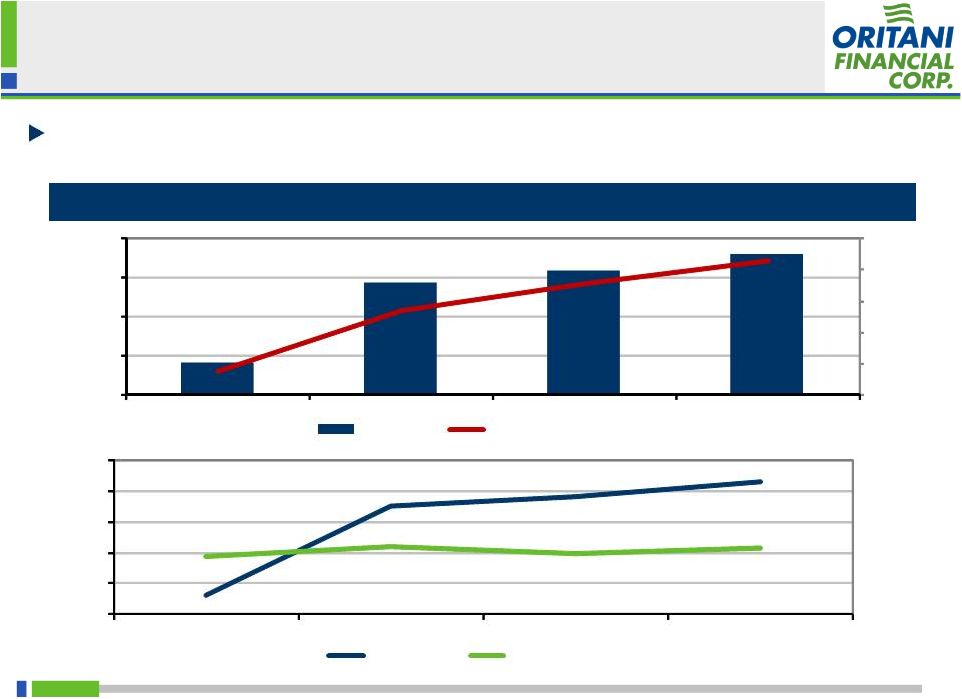 Steady Improving Profitability In Volatile
Environment
12
Oritani’s shareholder capital management has helped drive improved EPS and
ROAA
Net
Income
Trends
Since
2
Step
Conversion
(Dollars
in
thousands
except
per
share
amounts)
Note: YTD Q2 2013 figures shown on an annualized basis.
ORIT peers comprised of BRKL, DCOM, FFIC, FLIC, HVB, ISBC,
KRNY, LBAI, NBTB, NFBK, OCFC, PBNY, STL and SUBK.
1.50%
1.25%
1.00%
0.75%
0.50%
0.25%
0.73%
0.41%
2010
2011
2012
YTD Q2 2013
ORIT ROAA
Median Peer ROAA
1.13%
0.80%
1.21%
0.74%
1.32%
0.79%
$40,000
$30,000
$20,000
$10,000
$0
Net Income
Basic Earnings Per Share
$8,364
$0.15
$28,507
$0.54
$31,650
$0.71
$35,914
$0.86
$1.00
$0.80
$0.60
$0.40
$0.20
$0.00
nd
2010
2011
2012
YTD Q2 2013 |
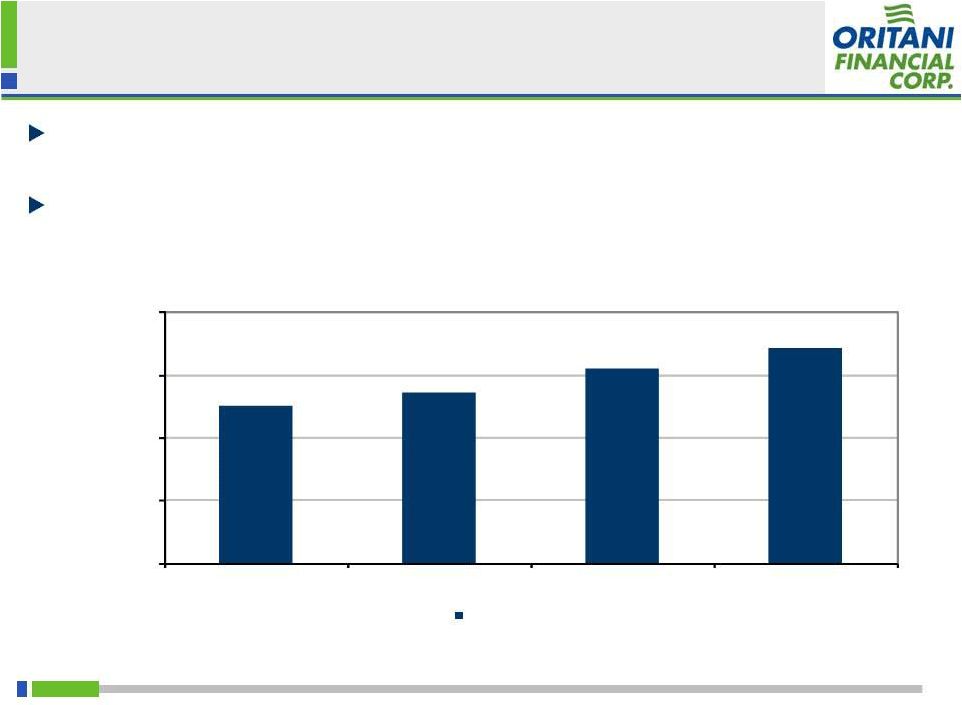 Strong Net Interest Margin
Oritani’s spread and margin increased steadily over the 2012 fiscal year
and this
trend has extended into the current year to date
On a quarterly basis, spread and margin contracted slightly as of December 31,
2012. Factors impacting Oritani’s spread and margin are discussed
in detail in the 12/31/2012 10Q.
3.25%
3.36%
3.55%
3.71%
2.00%
2.50%
3.00%
3.50%
4.00%
2010
2011
2012
YTD Q2 2013
Net Interest Margin
13 |
 Continued Focus on Cost Control
14
Oritani has been keenly focused on controlling costs while growing top line
revenues throughout a volatile environment
ORIT
peers
comprised
of
BRKL,
DCOM,
FFIC,
FLIC,
HVB,
ISBC,
KRNY,
LBAI,
NBTB,
NFBK,
OCFC,
PBNY,
STL
and
SUBK.
*Excludes non-recurring expense associated with the accelerated vesting of stock
awards and options triggered by the second step transaction and income from problem loan dispositions.
Including these items, the actual efficiency ratio was 62.5%
ORIT Efficiency Ratio
Median Peer Efficiency Ratio
70.0%
65.0%
60.0%
55.0%
50.0%
45.0%
40.0%
35.0%
30.0%
2010
2011
2012
YTD Q2 2013
48.2%*
55.0%
36.7%
58.5%
37.7%
57.7%
37.2%
63.9% |
  Shareholder Friendly Capital Management
15
Oritani strives to balance its strategy of deploying excess capital in a
shareholder friendly manner while also maintaining healthy capital levels
June 22, 2011: Announced share repurchase program for 10% of outstanding
shares September 14, 2011: Announced second share repurchase for another 10%
of outstanding shares November 14, 2011: Announced third share repurchase
program for 5% of outstanding shares, with 1,801,381 shares yet to be
repurchased as of December 31, 2012 November 20, 2012: Declared special
dividend of $0.40 per share *YTD through Q2 2013.
**YTD dividend presented annualized, excluding a special dividend of $0.40 per share
declared on 11/20/2012. 2010
2011
2012
YTD*
Tier 1 Ratio
38.4%
34.2%
23.2%
21.2%
Total RBC Ratio
39.6%
35.5%
24.5%
22.4%
Tier 1 To Average Assets
31.6%
25.1%
19.0%
18.2%
TCE Ratio
26.0%
24.9%
18.9%
18.0%
Dividends Per Share**
$0.18
$0.38
$0.50
$0.60
Share Repurchase Plan
n/a
Common Shares Outstanding
56,202,485
55,513,265
45,198,765
45,381,531 |
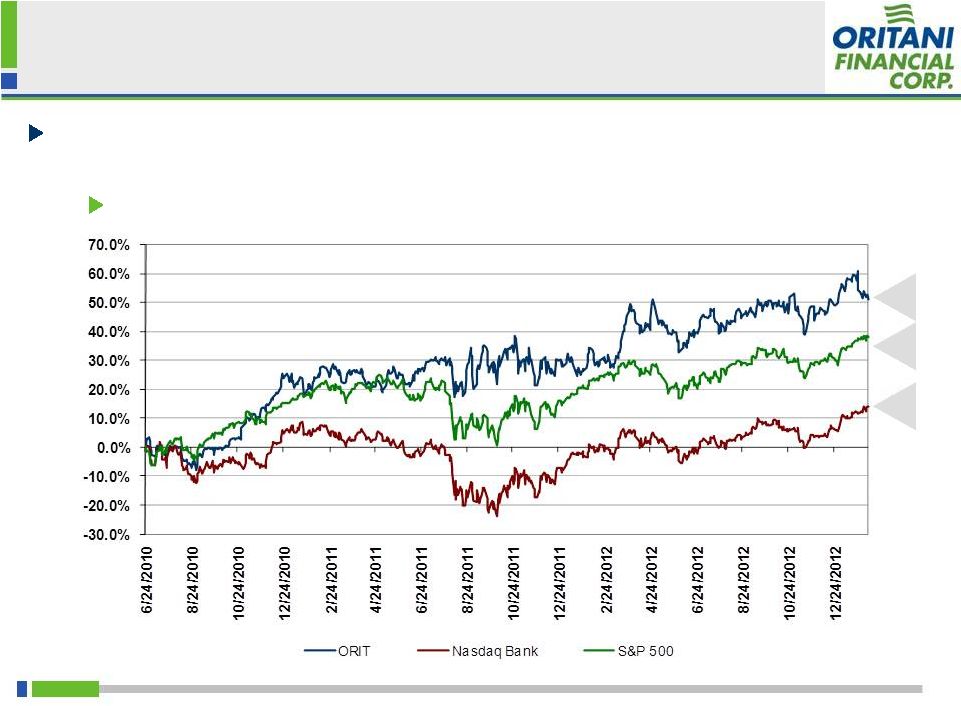 Price Performance Since 2
16
Since Oritani’s 2 step conversion, the Company has
significantly outperformed both the Nasdaq Bank Index and the S&P
500 Oritani’s business model has provided stability in difficult
markets Source: SNL Financial
Data as of February 7, 2013
51%
38%
14%
nd
nd
Step Conversion |
 QUESTIONS
&
ANSWERS |