Attached files
| file | filename |
|---|---|
| 8-K - 8-K - KAPSTONE PAPER & PACKAGING CORP | a13-4746_18k.htm |
| EX-99.1 - EX-99.1 - KAPSTONE PAPER & PACKAGING CORP | a13-4746_1ex99d1.htm |
Exhibit 99.2
|
|
2012 Fourth Quarter and Full Year Review Roger W. Stone Chairman and Chief Executive Officer Andrea K. Tarbox Vice President and Chief Financial Officer February 13, 2013 |
|
|
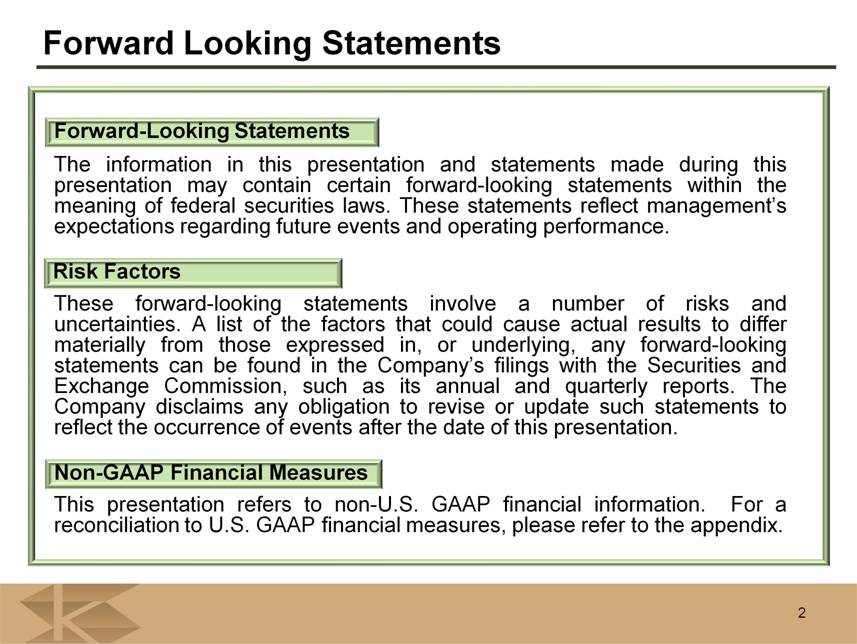
Forward Looking Statements The information in this presentation and statements made during this presentation may contain certain forward-looking statements within the meaning of federal securities laws. These statements reflect management’s expectations regarding future events and operating performance. These forward-looking statements involve a number of risks and uncertainties. A list of the factors that could cause actual results to differ materially from those expressed in, or underlying, any forward-looking statements can be found in the Company’s filings with the Securities and Exchange Commission, such as its annual and quarterly reports. The Company disclaims any obligation to revise or update such statements to reflect the occurrence of events after the date of this presentation. This presentation refers to non-U.S. GAAP financial information. For a reconciliation to U.S. GAAP financial measures, please refer to the appendix. Forward-Looking Statements Non-GAAP Financial Measures Risk Factors 2 |
|
|
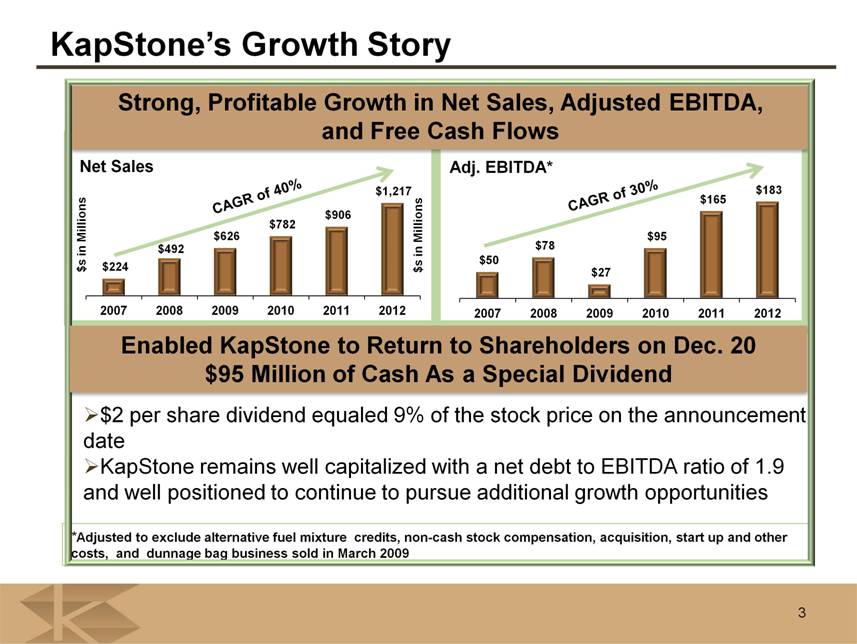
Strong, Profitable Growth in Net Sales, Adjusted EBITDA, and Free Cash Flows 3 $s in Millions CAGR of 30% CAGR of 40% KapStone’s Growth Story Net Sales Adj. EBITDA* *Adjusted to exclude alternative fuel mixture credits, non-cash stock compensation, acquisition, start up and other costs, and dunnage bag business sold in March 2009 Enabled KapStone to Return to Shareholders on Dec. 20 $95 Million of Cash As a Special Dividend $2 per share dividend equaled 9% of the stock price on the announcement date KapStone remains well capitalized with a net debt to EBITDA ratio of 1.9 and well positioned to continue to pursue additional growth opportunities |
|
|
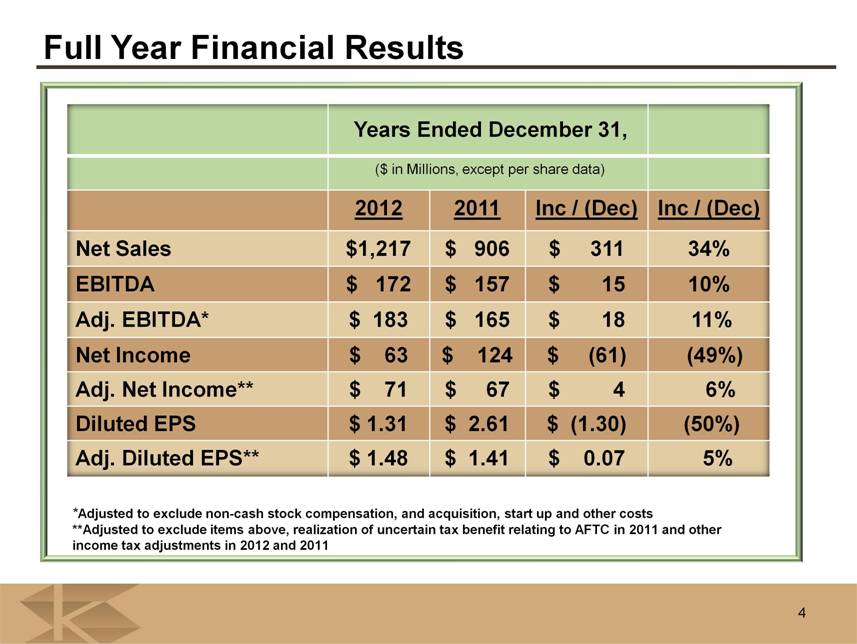
Full Year Financial Results *Adjusted to exclude non-cash stock compensation, and acquisition, start up and other costs **Adjusted to exclude items above, realization of uncertain tax benefit relating to AFTC in 2011 and other income tax adjustments in 2012 and 2011 Years Ended December 31, ($ in Millions, except per share data) 20122012 2011 2011 Inc / (Dec) Inc / (Dec) Inc / (Dec) Inc / (Dec) Net Sales $1,217 $ 906 $ 311 34% EBITDAEBITDA $ 172$ 172 $ 157$ 157 $ 15 $ 15 10%10% Adj. EBITDA* $ 183 $ 165 $ 18 11% Net Income Net Income $ 63$ 63 $ 124$ 124 $ (61)$ (61) (49%)(49%) Adj. Net Income** $ 71 $ 67 $ 4 6% Diluted EPS Diluted EPS $1.31 $ 1.31 $2.61 $ 2.61 $ (1.30) $ (1.30) (50%)(50%) Adj. Diluted EPS** $ 1.48 $ 1.41 $ 0.07 5% 4 |
|
|
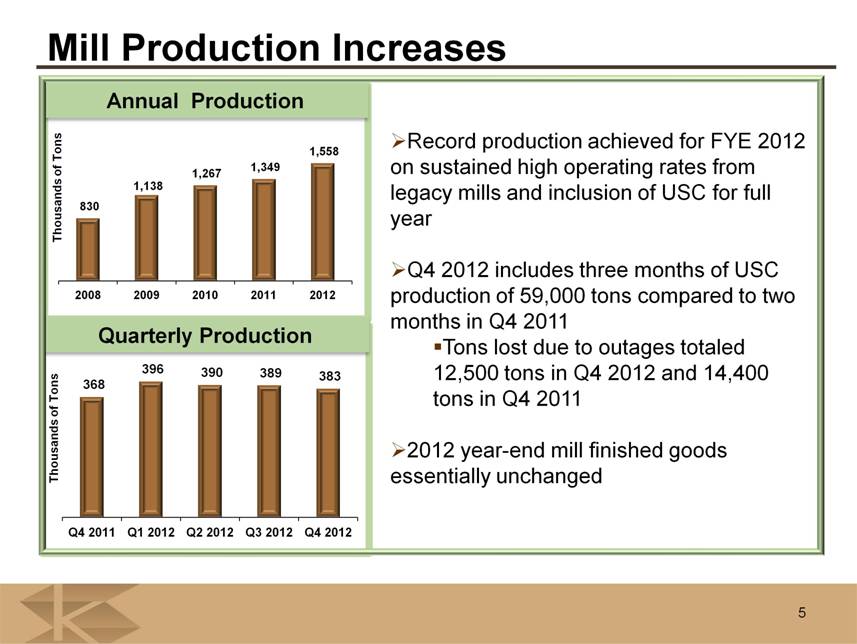
5 Thousands of Tons Thousands of Tons Annual Production Mill Production Increases Record production achieved for FYE 2012 on sustained high operating rates from legacy mills and inclusion of USC for full year Q4 2012 includes three months of USC production of 59,000 tons compared to two months in Q4 2011 Tons lost due to outages totaled 12,500 tons in Q4 2012 and 14,400 tons in Q4 2011 2012 year-end mill finished goods essentially unchanged Quarterly Production |
|
|
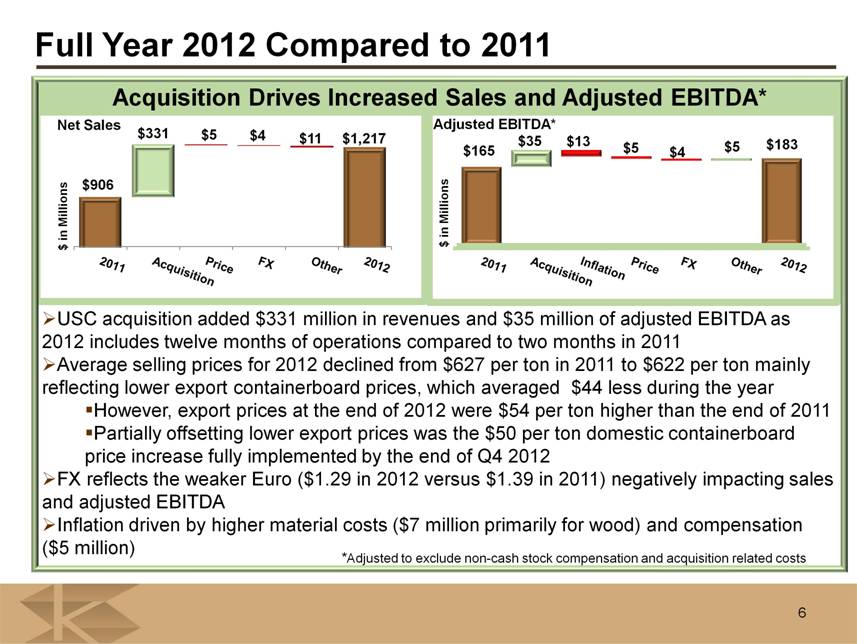
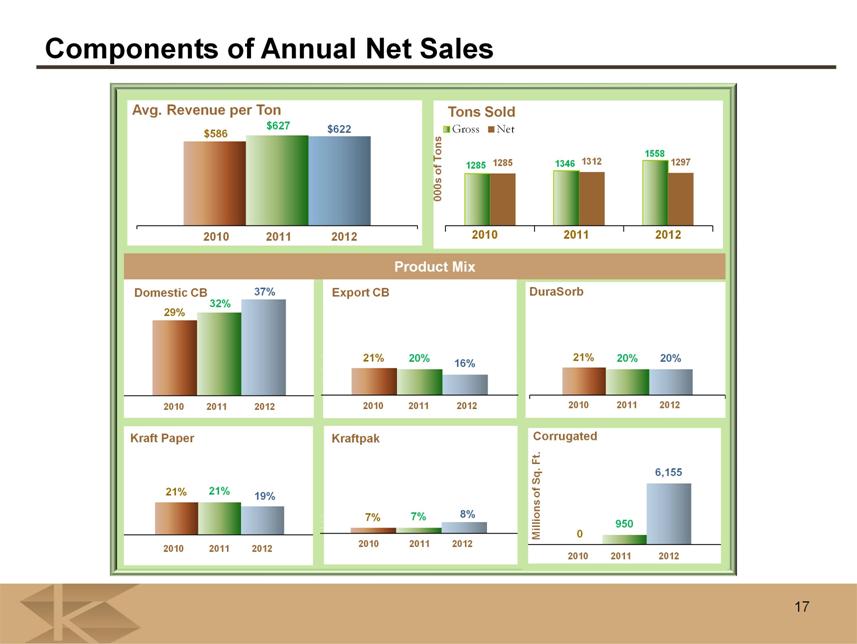
6 Full Year 2012 Compared to 2011 *Adjusted to exclude non-cash stock compensation and acquisition related costs Acquisition Drives Increased Sales and Adjusted EBITDA* USC acquisition added $331 million in revenues and $35 million of adjusted EBITDA as 2012 includes twelve months of operations compared to two months in 2011 Average selling prices for 2012 declined from $627 per ton in 2011 to $622 per ton mainly reflecting lower export containerboard prices, which averaged $44 less during the year However, export prices at the end of 2012 were $54 per ton higher than the end of 2011 Partially offsetting lower export prices was the $50 per ton domestic containerboard price increase fully implemented by the end of Q4 2012 FX reflects the weaker Euro ($1.29 in 2012 versus $1.39 in 2011) negatively impacting sales and adjusted EBITDA Inflation driven by higher material costs ($7 million primarily for wood) and compensation ($5 million) Net Sales Adjusted EBITDA* |
|
|
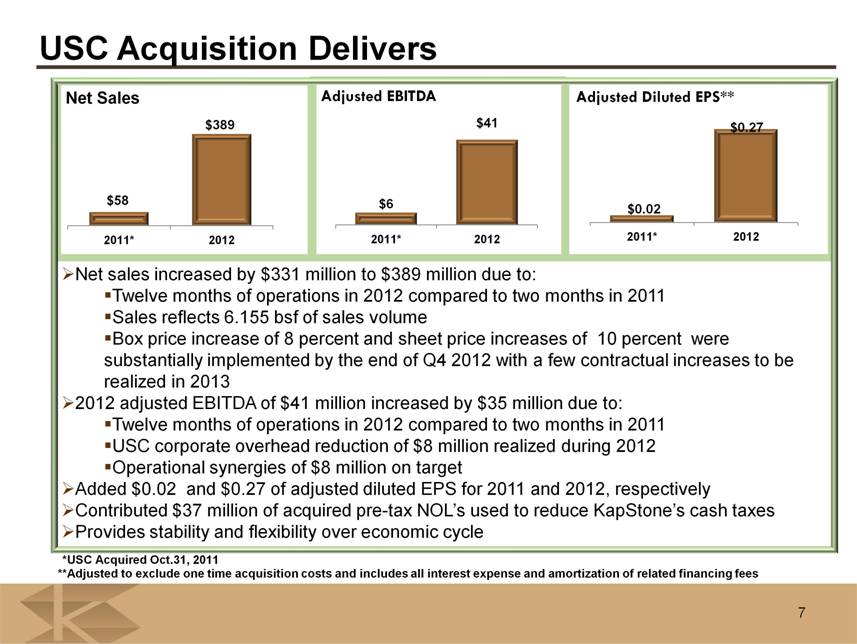
Net sales increased by $331 million to $389 million due to: Twelve months of operations in 2012 compared to two months in 2011 Sales reflects 6.155 bsf of sales volume Box price increase of 8 percent and sheet price increases of 10 percent were substantially implemented by the end of Q4 2012 with a few contractual increases to be realized in 2013 2012 adjusted EBITDA of $41 million increased by $35 million due to: Twelve months of operations in 2012 compared to two months in 2011 USC corporate overhead reduction of $8 million realized during 2012 Operational synergies of $8 million on target Added $0.02 and $0.27 of adjusted diluted EPS for 2011 and 2012, respectively Contributed $37 million of acquired pre-tax NOL’s used to reduce KapStone’s cash taxes Provides stability and flexibility over economic cycle 7 USC Acquisition Delivers *USC Acquired Oct.31, 2011 7 **Adjusted to exclude one time acquisition costs and includes all interest expense and amortization of related financing fees |
|
|
Fourth Quarter Financial Results 8 *Adjusted to exclude non-cash stock compensation and acquisition, start up and other costs **Adjusted to exclude items above, realization of unrecognized tax benefit in 2011 and income tax adjustments in 2012 ($ in Millions, except per share data) Q4 2012 Q4 2011 Inc/(Dec) Q3 2012 Inc/(Dec) Net Sales $ 301 $ 269 12% $ 310 (3%) EBITDA $ 36 $ 35 3% $ 47 (23%) Adj EBITDA*Adj. EBITDA $ 38$ 38 $38 $ 38 --%% $ 49$ 49 (22%)(22%) Net Income $ 10 $ 74 (86%) $ 18 (44%) Adj. Net Income** $ 13 $ 14 (7%) $ 20 (35%) Diluted EPS $ 0.22 $ 1.56 (86%) $ 0.38 (42%) Adj. Diluted EPS** $ 0.28 $ 0.29 (3%) $ 0.41 (32%) |
|
|
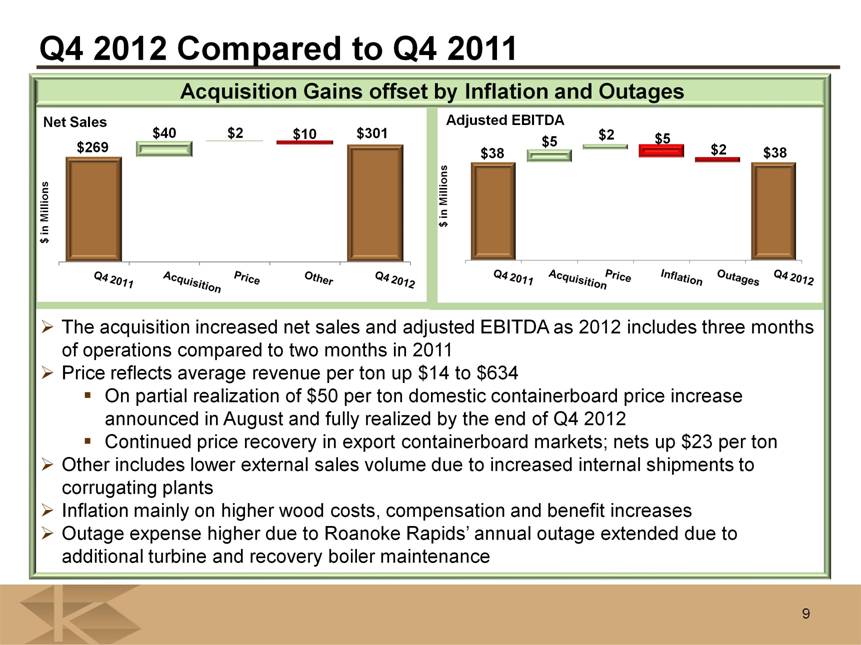
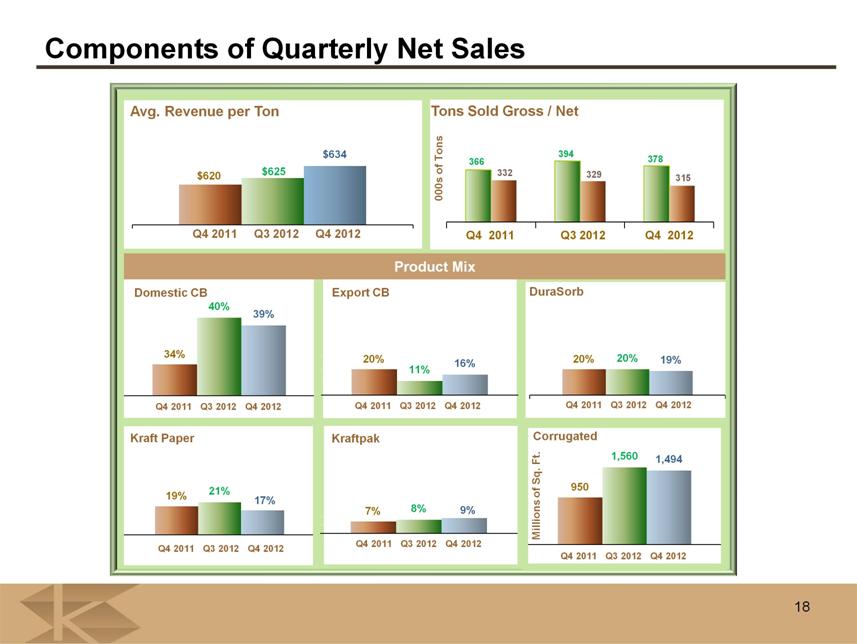
Adjusted EBITDA $269 $40 $2 $10 $301 $38 $5 $2 $5 $2 $38 Q4 2011 Acquisition Price Other Q4 2012 Acquisition Gains offset by Inflation and Outages 9 Q4 2012 Compared to Q4 2011 The acquisition increased net sales and adjusted EBITDA as 2012 includes three months of operations compared to two months in 2011 Price reflects average revenue per ton up $14 to $634 On partial realization of $50 per ton domestic containerboard price increase announced in August and fully realized by the end of Q4 2012 Continued price recovery in export containerboard markets; nets up $23 per ton Other includes lower external sales volume due to increased internal shipments to corrugating plants Inflation mainly on higher wood costs, compensation and benefit increases Outage expense higher due to Roanoke Rapids’ annual outage extended due to additional turbine and recovery boiler maintenance Net Sales $ in Millions |
|
|
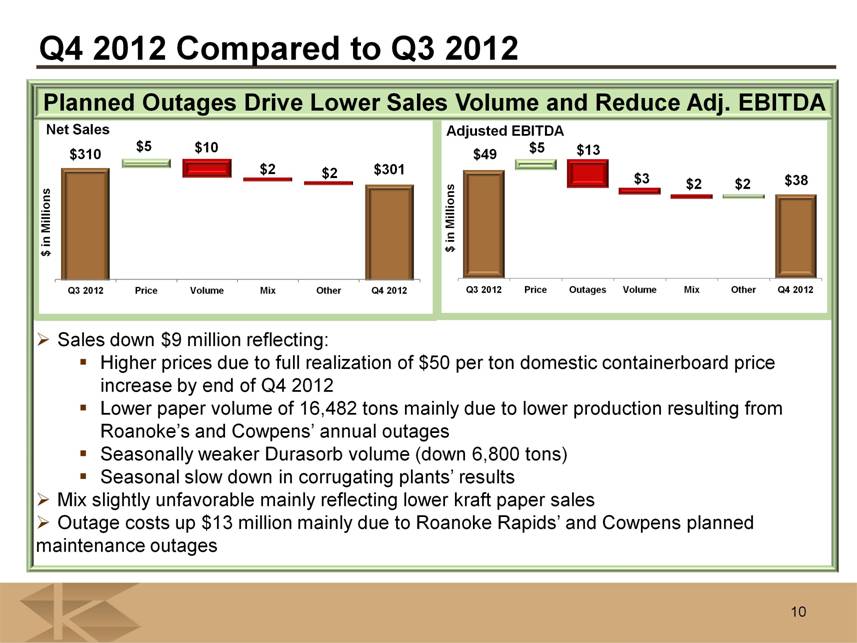
Adjusted EBITDA $310 $5 $10 $2 $2 $301 $49 $5 $13 $3 $2 $2 $38 Q3 2012 Price Outages Volume Mix Other Q4 2012 Planned Outages Drive Lower Sales Volume and Reduce Adj. EBITDA 10 Q4 2012 Compared to Q3 2012 Sales down $9 million reflecting: Higher prices due to full realization of $50 per ton domestic containerboard price increase by end of Q4 2012 Lower paper volume of 16,482 tons mainly due to lower production resulting from Roanoke’s and Cowpens’ annual outages Seasonally weaker Durasorb volume (down 6,800 tons) Seasonal slow down in corrugating plants’ results Mix slightly unfavorable mainly reflecting lower kraft paper sales Outage costs up $13 million mainly due to Roanoke Rapids’ and Cowpens planned maintenance outages Net Sales |
|
|
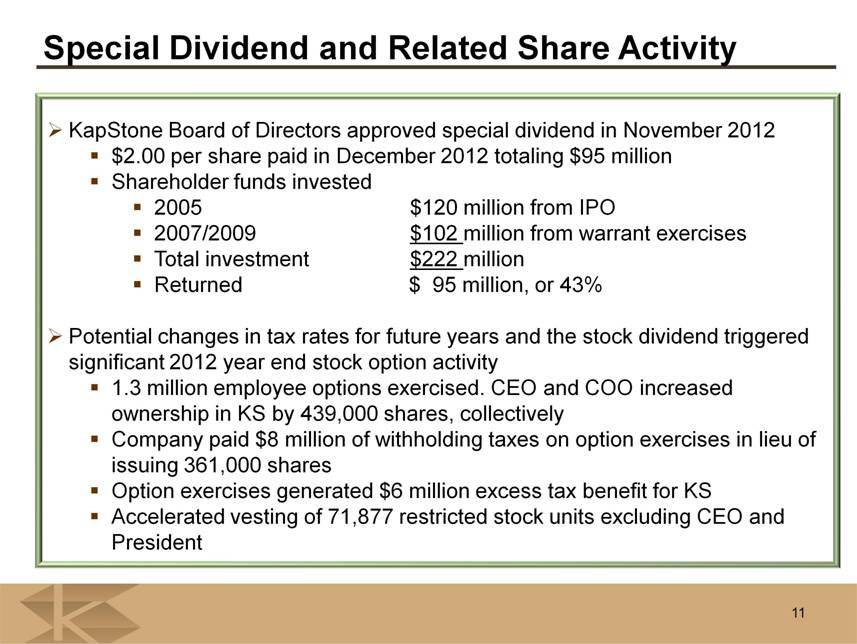
KapStone Board of Directors approved special dividend in November 2012 $2.00 per share paid in December 2012 totaling $95 million Shareholder funds invested 2005 $120 million from IPO 2007/2009 $102 million from warrant exercises Total investment $222 million Returned $ 95 million, or 43% Potential changes in tax rates for future years and the stock dividend triggered significant 2012 year end stock option activity 1.3 million employee options exercised. CEO and COO increased ownership in KS by 439,000 shares, collectively Company paid $8 million of withholding taxes on option exercises in lieu of issuing 361,000 shares Option exercises generated $6 million excess tax benefit for KS Accelerated vesting of 71,877 restricted stock units excluding CEO and President Special Dividend and Related Share Activity 11 |
|
|
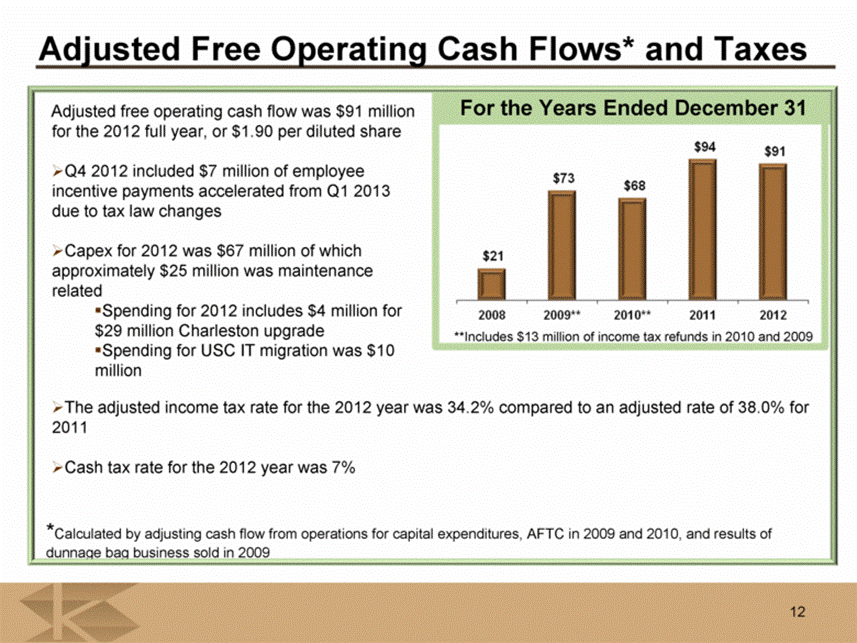
Adjusted Free Operating Cash Flows* and Taxes Adjusted free operating cash flow was $91 million for the 2012 full year, or $1.90 per diluted share Q4 2012 included $7 million of employee incentive payments accelerated from Q1 2013 due to tax law changes Capex for 2012 was $67 million of which approximately $25 million was maintenance related Spending for 2012 includes $4 million for $29 million Charleston upgrade Spending for USC IT migration was $10 million *Calculated by adjusting cash flow from operations for capital expenditures, AFTC in 2009 and 2010, and results of dunnage bag business sold in 2009 For the Years Ended December 31 12 **Includes $13 million of income tax refunds in 2010 and 2009 The adjusted income tax rate for the 2012 year was 34.2% compared to an adjusted rate of 38.0% for 2011 Cash tax rate for the 2012 year was 7% |
|
|
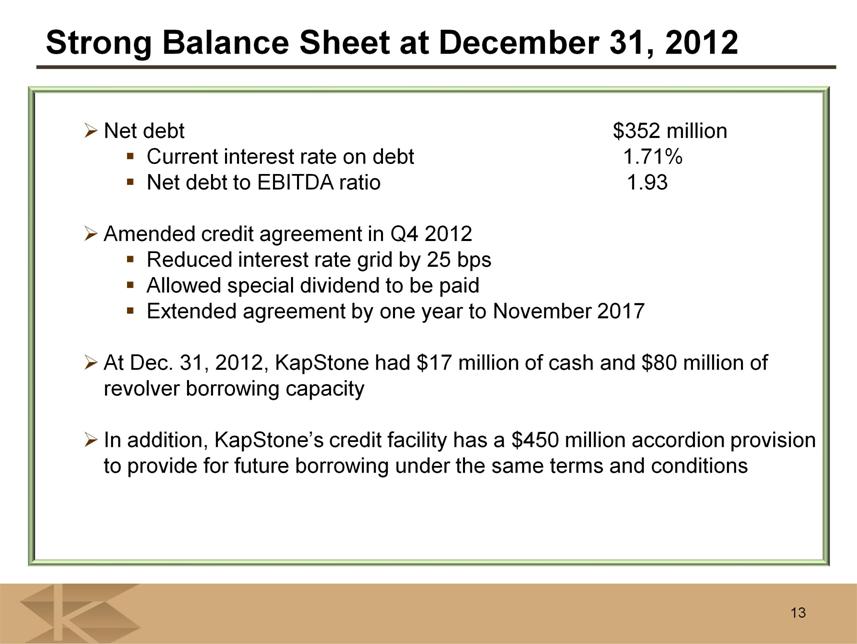
Strong Balance Sheet at December 31, 2012 13 Net debt $352 million Current interest rate on debt 1.71% Net debt to EBITDA ratio 1.93 Amended credit agreement in Q4 2012 Reduced interest rate grid by 25 bps Allowed special dividend to be paid Extended agreement by one year to November 2017 At Dec. 31, 2012, KapStone had $17 million of cash and $80 million of revolver borrowing capacity In addition, KapStone’s credit facility has a $450 million accordion provision to provide for future borrowing under the same terms and conditions |
|
|
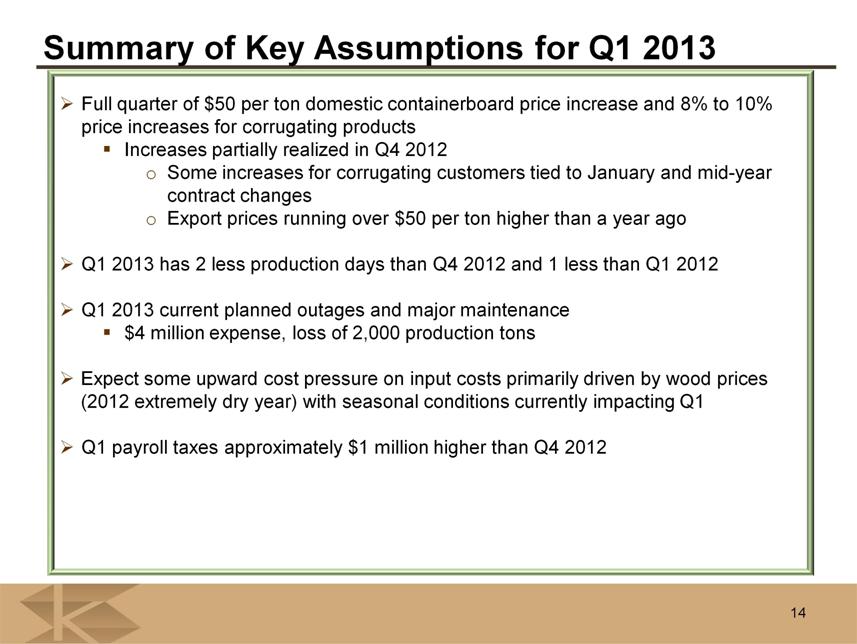
Summary of Key Assumptions for Q1 2013 Full quarter of $50 per ton domestic containerboard price increase and 8% to 10% price increases for corrugating products Increases partially realized in Q4 2012 Some increases for corrugating customers tied to January and mid-year contract changes Export prices running over $50 per ton higher than a year ago Q1 2013 has 2 less production days than Q4 2012 and 1 less than Q1 2012 Q1 2013 current planned outages and major maintenance $4 million expense, loss of 2,000 production tons Expect some upward cost pressure on input costs primarily driven by wood prices (2012 extremely dry year) with seasonal conditions currently impacting Q1 Q1 payroll taxes approximately $1 million higher than Q4 2012 14 |
|
|
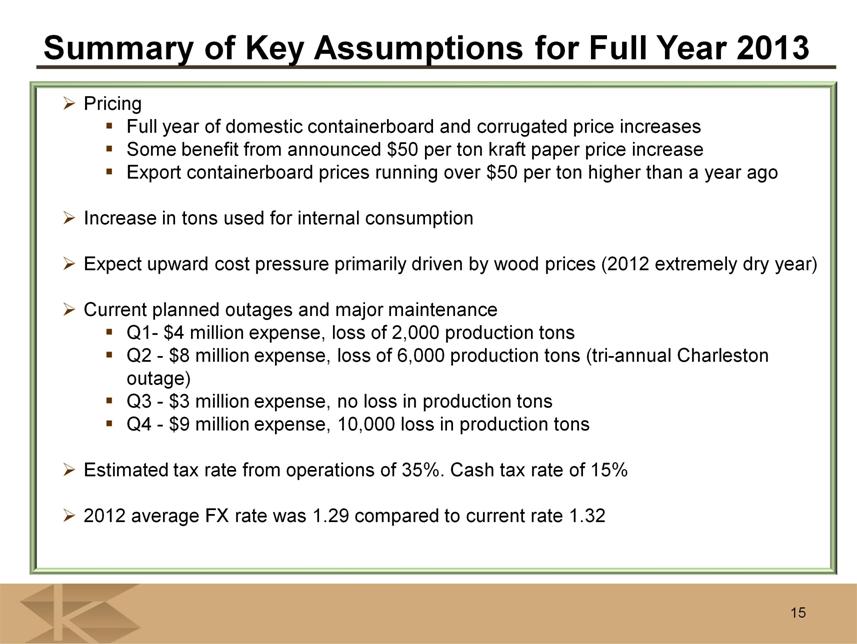
Summary of Key Assumptions for Full Year 2013 Pricing Full year of domestic containerboard and corrugated price increases Some benefit from announced $50 per ton kraft paper price increase Export containerboard prices running over $50 per ton higher than a year ago Increase in tons used for internal consumption Expect upward cost pressure primarily driven by wood prices (2012 extremely dry year) Current planned outages and major maintenance Q1- $4 million expense, loss of 2,000 production tons Q2 - $8 million expense, loss of 6,000 production tons (tri-annual Charleston outage) Q3 - $3 million expense, no loss in production tons Q4 - $9 million expense, 10,000 loss in production tons Estimated tax rate from operations of 35%. Cash tax rate of 15% 2012 average FX rate was 1.29 compared to current rate 1.32 15 |
|
|
Appendix |
|
|
17 Components of Annual Net Sales Domestic CB DuraSorb Kraft Paper Kraftpak Product Mix |
|
|
18 Components of Quarterly Net Sales Avg. Revenue per Ton Domestic CB DuraSorb Kraft Paper Kraftpak Product Mix Desktop.lnk |


