Attached files
| file | filename |
|---|---|
| 8-K - FORM 8-K - AVEO PHARMACEUTICALS, INC. | d485072d8k.htm |
 AVEO 4Q12 Results Conference Call
and Tivozanib Update
February 13, 2013
1
Exhibit 99.1 |
 Forward-Looking Statements
This presentation contains forward-looking statements that involve substantial
risks and uncertainties. All statements, other than statements of historical
facts, contained in this presentation
are
forward-looking
statements.
The
words
“anticipate,”
“believe,”
“estimate,”
“expect,”
“intend,”
“may,”
“plan,”
“predict,”
“project,”
“target,”
“potential,”
“will,”
“would,”
“could,”
“should,”
“continue,”
“contemplate,”
or the negative of these terms or other similar expressions are
intended to identify forward-looking statements, although not all
forward-looking statements contain these identifying words. These
forward-looking statements include, among others, statements about: the
potential therapeutic advantages and benefits of tivozanib; the timing
and
results
of
our
ongoing
clinical
trials;
and
the
potential
of
tivozanib
to
obtain
regulatory
approval
and enter the advanced renal cell cancer market.
Actual
results
or
events
could
differ
materially
from
the
plans,
intentions
and
expectations
disclosed in the forward-looking statements we make due to a number of
important factors, including risks and uncertainties relating to: our ability
to successfully develop, test and gain regulatory approval of our
product candidates, including regulatory approval of tivozanib to treat
advanced
renal
cell
cancer;
our
ability
to
obtain,
maintain
and
enforce
intellectual
property
rights;
competition; our dependence on our alliance partners and other third parties; our
ability to obtain necessary
financing;
adverse
economic
conditions;
and
those
risk
factors
discussed
in
the
“Risk
Factors”
and elsewhere in our Current Report on Form 8-K that was filed with the
Securities and Exchange Commission (“SEC”) on January 16,
2013, and other periodic filings we make with the SEC. All
forward-looking statements contained in this presentation speak only as of the date of
this presentation, and we undertake no obligation to update any of these
statements, except as required by law.
2 |
 Tivozanib Update:
Bill Slichenmyer, MD
Chief Medical Officer
February 13, 2013
3 |
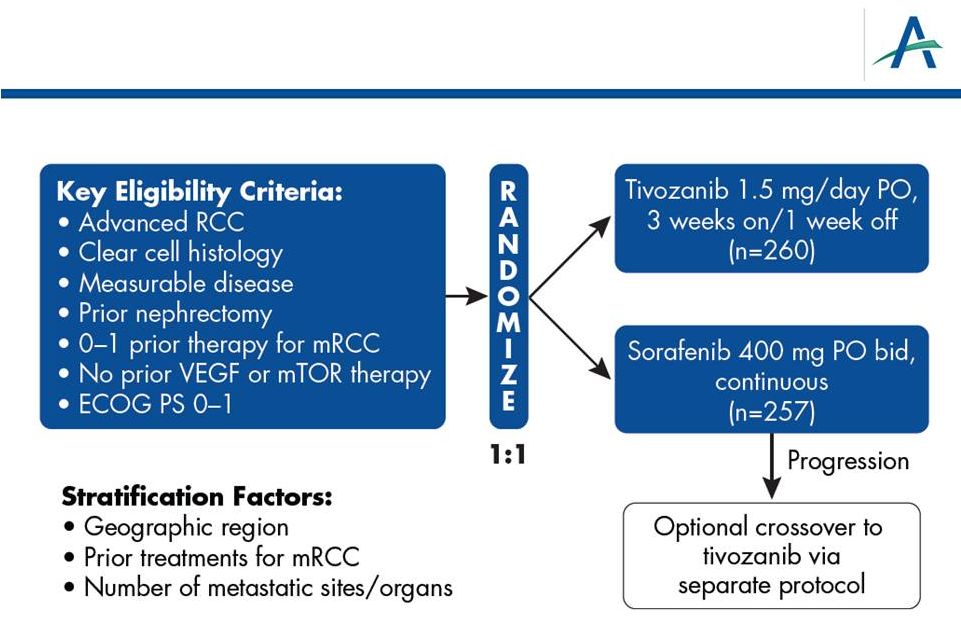 TIVO-1: Phase 3 Superiority Study of Tivozanib vs. Sorafenib
as First-line Targeted Therapy for Advanced RCC
4 |
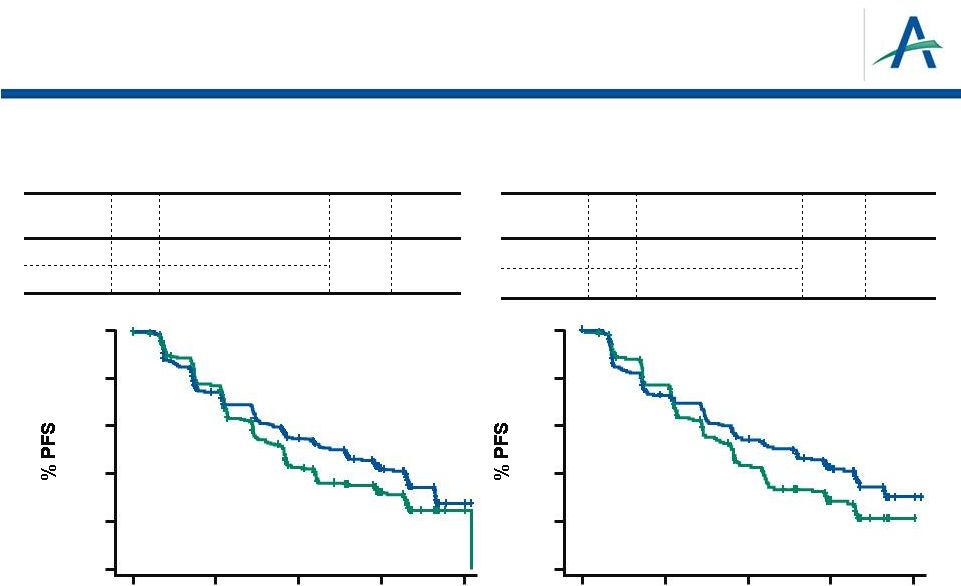 Overall
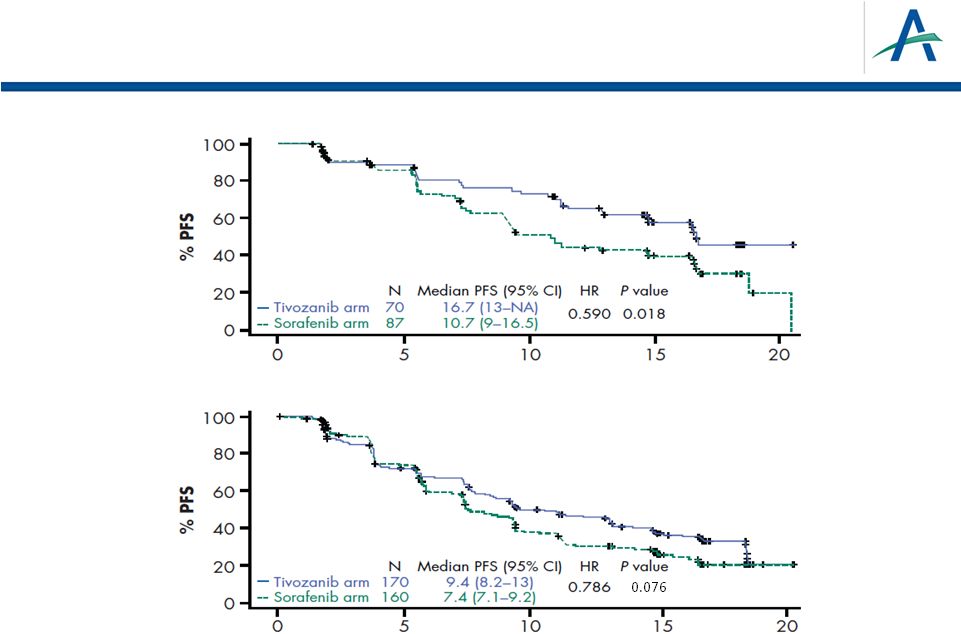
TIVO-1 Primary Endpoint: PFS by Independent Review
Treatment Naïve for Metastatic RCC
n
Median PFS (95% CI)
HR
P
Value
Tivozanib
260
11.9 mos (9.3-14.7)
0.797
0.042
Sorafenib
257
9.1 mos (7.3-9.5)
n
Median PFS (95% CI)
HR
P
Value
Tivozanib
181
12.7 mos (9.1-15.0)
0.756
0.037
Sorafenib
181
9.1 mos (7.3-10.8)
CI=confidence interval; HR= hazard ratio
Motzer, et al., ASCO 2012
5
0
5
10
15
20
0
20
40
60
80
100
0
20
40
60
80
100
0
5
10
15
20
Time (months)
Time (months) |
 February 12, 2013
6
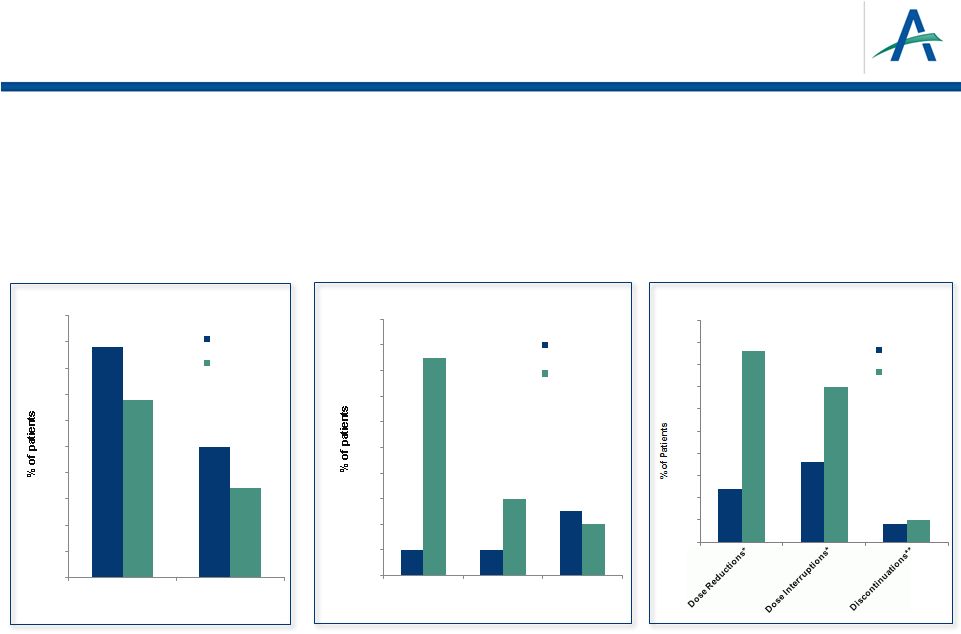
•
>1,000 subjects treated with tivozanib
•
Lower rates than sorafenib for common adverse events and dose modifications
•
Rate of fatal AEs consistent with reports from past pivotal RCC trials
Dose Adjustments
Motzer, et al., ASCO 2012
*
Due to AE’s
**Due to treatment-related AE’s
Tivozanib Safety Profile
44
25
34
17
0
5
10
15
20
25
30
35
40
45
50
All Grades
Grades 3/4
Treatment Emergent Hypertension
tivozanib
sorafenib
2
2
5
17
6
4
0
2
4
6
8
10
12
14
16
18
20
Hand-Foot
Syndrome
Diarrhea
Fatigue
Other Common Treatment Emergent AEs
(Grades 3/4 )
tivozanib
sorafenib
12
18
4
43
35
5
0
5
10
15
20
25
30
35
40
45
50
tivozanib
sorafenib |
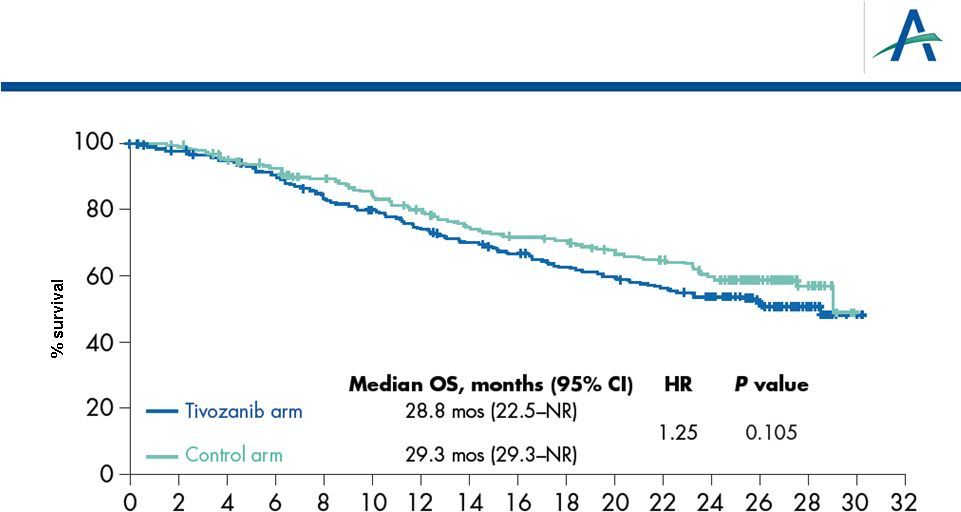
 Overall Survival
•
Overall Survival (OS) is secondary endpoint in TIVO-1
•
Results from interim analysis were disclosed in May 2012
7 |
 2013 ASCO GU Symposia:
TIVO-1 Data Presentations
8 |
 Five
Posters to be Presented at ASCO GU 1.
Overall Survival in TIVO-1: Motzer et al.
Title: Overall Survival Results from a Phase 3 Study of Tivozanib Hydrochloride vs
Sorafenib in Patients with Renal Cell Carcinoma
Abstract : 350
2.
Tivozanib
in
2
Line
Following
Sorafenib:
Motzer
et
al.
Title: Efficacy and Safety Data from Patients with Advanced Renal Cell Cancer
Treated with Tivozanib Hydrochloride After Progression on Sorafenib
Abstract : 364
3.
Subgroup Analyses from TIVO-1: Hutson et al.
Title: Subgroup Analyses of a Phase 3 Trial Comparing Tivozanib Hydrochloride vs
Sorafenib as Initial Targeted Therapy for Patients with Metastatic Renal
Cell Carcinoma Abstract : 354
4.
Quality of Life Results from TIVO-1: Cella et al.
Title: Treatment Benefit of Tivozanib Hydrochloride versus Sorafenib on
Health-Related Quality of Life among Patients with Advanced/Metastatic
Renal Cell Carcinoma Abstract : 355
5.
Hypoxia Signature and Tivozanib Activity: Robinson et al.
Title: Relationship of Hypoxia Signature with Variant Subgroup of Clear Cell Renal
Cell Carcinoma (ccRCC) and its Association with Clinical Activity on
Tivozanib Hydrochloride Abstract : 361
9
nd
#
#
#
#
# |
 Overall Survival in TIVO-1:
Motzer et al.
Abstract #350
10 |
 11
Protocol-Specified, Final OS Analysis
Final OS analysis conducted, per protocol, at two years following
last patient enrolled (August 2012)
0.4%
8.3%
15%
21%
28%
37%
43%
48%
53%
57%
59%
61%
67%
58%
100%
% of control arm
pts crossed over
to tivozanib
Time (months) |
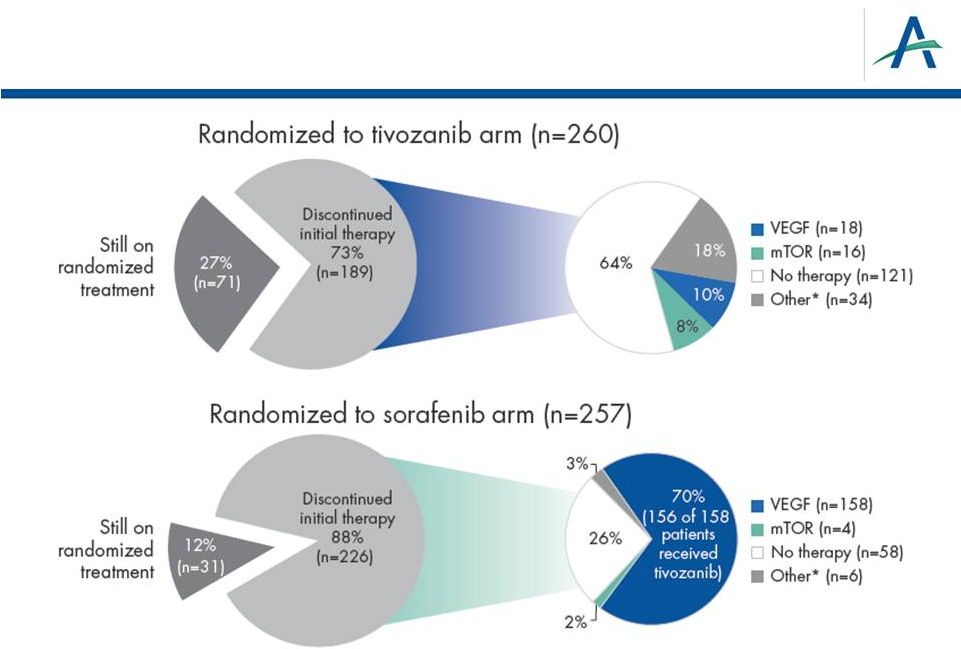 Use
of Next-Line Treatments 12
*Other includes radiotherapy, cytokine or other therapy
|
 OS in
Patients from North America/Western Europe 13 |
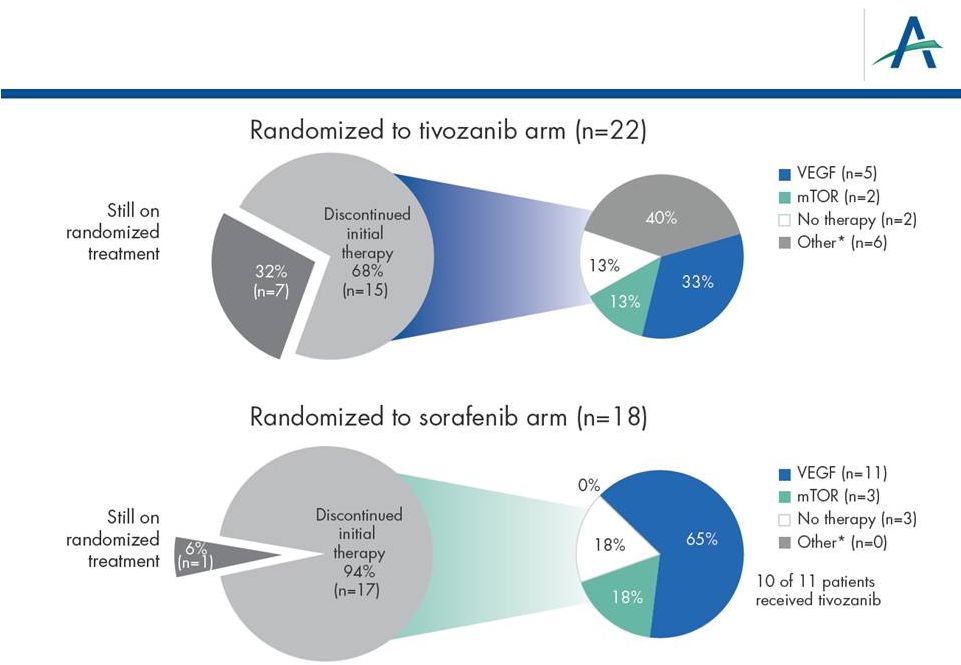 Use
of Next-line Therapies in North America/Western Europe 14
*Other includes radiotherapy, cytokine or other therapy
|
 Next-line Therapy and
Overall Survival
Motzer, et al. Abstract #350, continued
15 |
 Comparisons of Subgroups who Received Comparable
Next-line Therapy
•
Multiple factors limit validity of comparisons in the following
Kaplan-Meier displays, including
–
Exploratory analyses conducted post-hoc
–
Patients are classified in these subgroups based on decisions
about next-line therapy, which are potentially biased
–
Small subsets leading to imprecise survival estimates
16 |
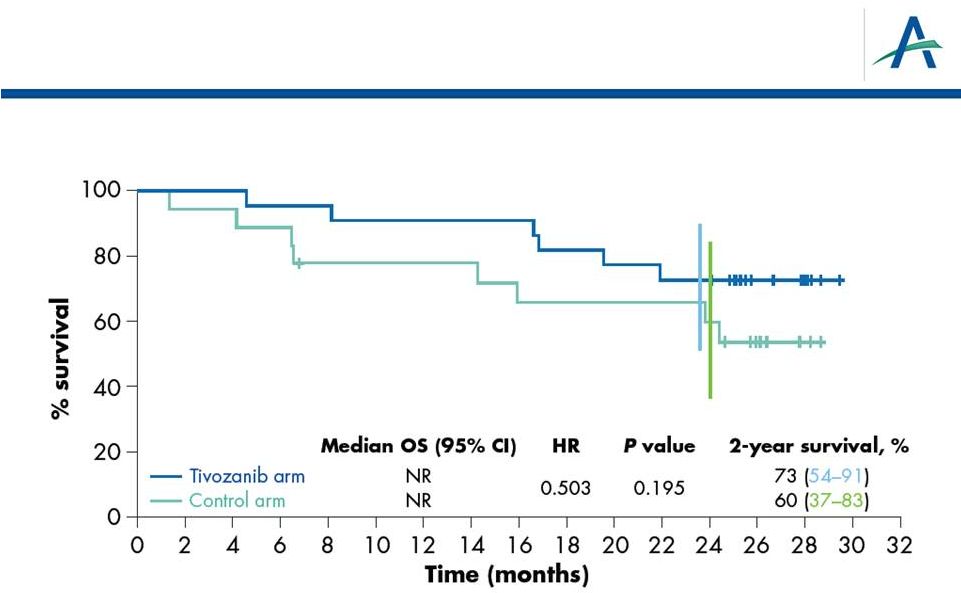
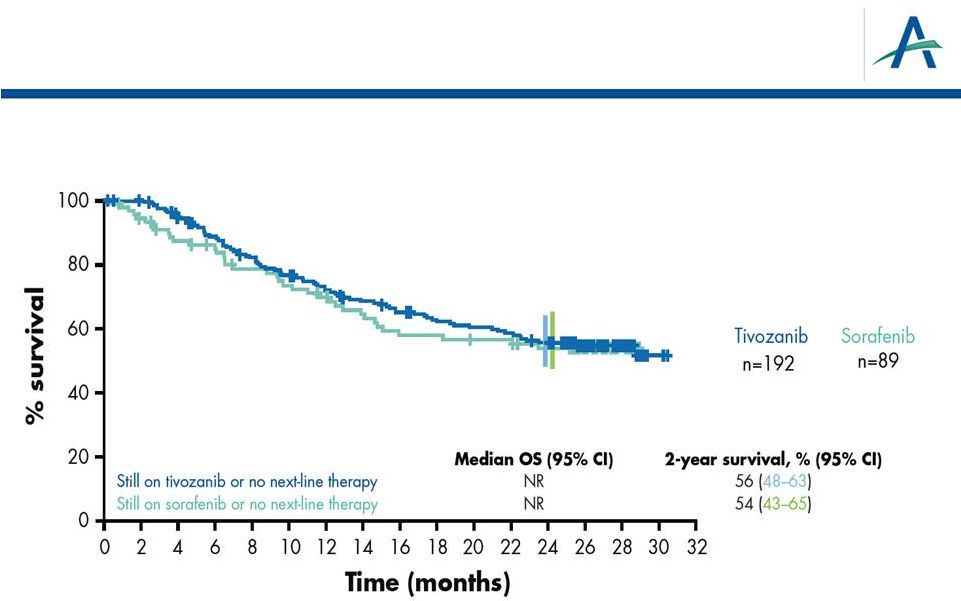 Subset
of
Patients
Who
Have
Received
No
2
-Line
Therapy:
“1 vs 1”
HR=0.917
P
17
“1 vs 1 treatment”
=0.662
nd |
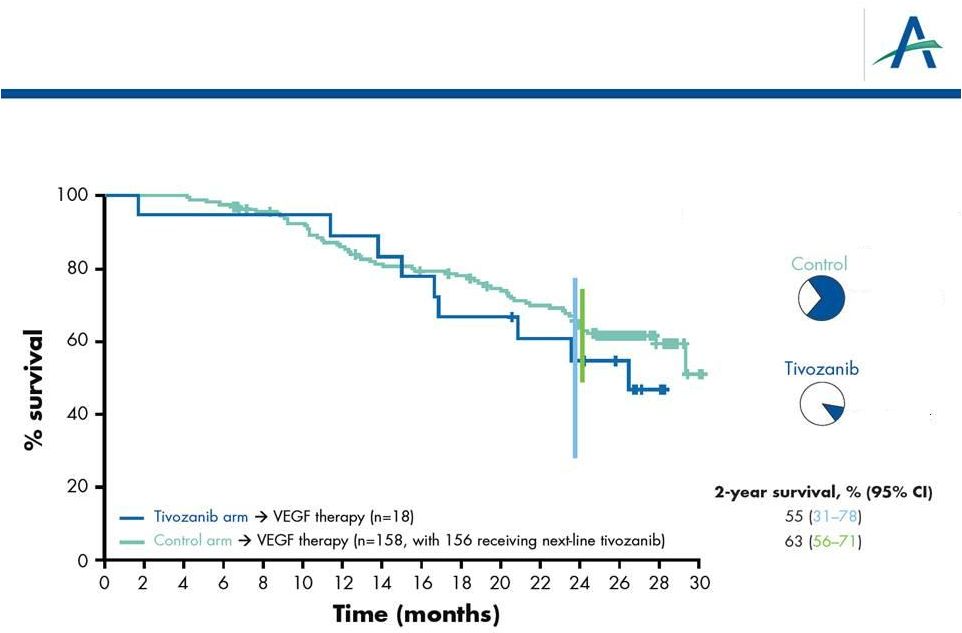 OS
Analysis of “2 vs 2” Lines of Treatment:
Next-line VEGF Treatment Only
18
HR=1.37
% of patients with next-line
anti-VEGF therapy
70% anti-VEGF
10% anti-VEGF
P
=0.382 |
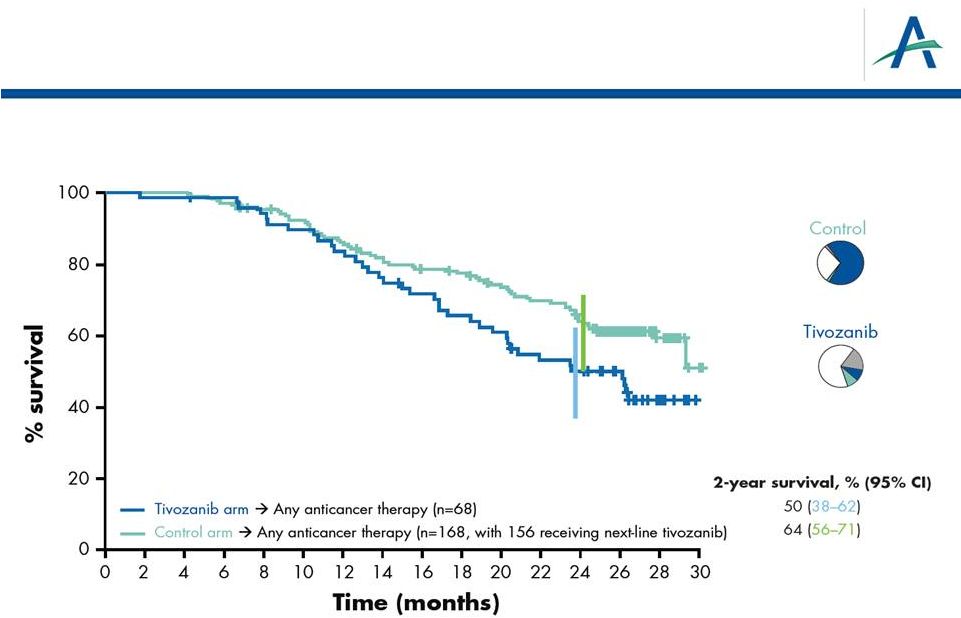 OS
Analysis of “2 vs 2” Lines of Treatment:
Any Anticancer Treatment
19
HR=1.58
P
=0.027
% of patients with next-line
other/VEGF/mTOR therapy
18% other
10% VEGF
8% mTOR
3% other
70% VEGF
2% mTOR |
 Tivozanib
in
2
Line
Following
Sorafenib: Motzer et al.
Abstract #364
20
nd |
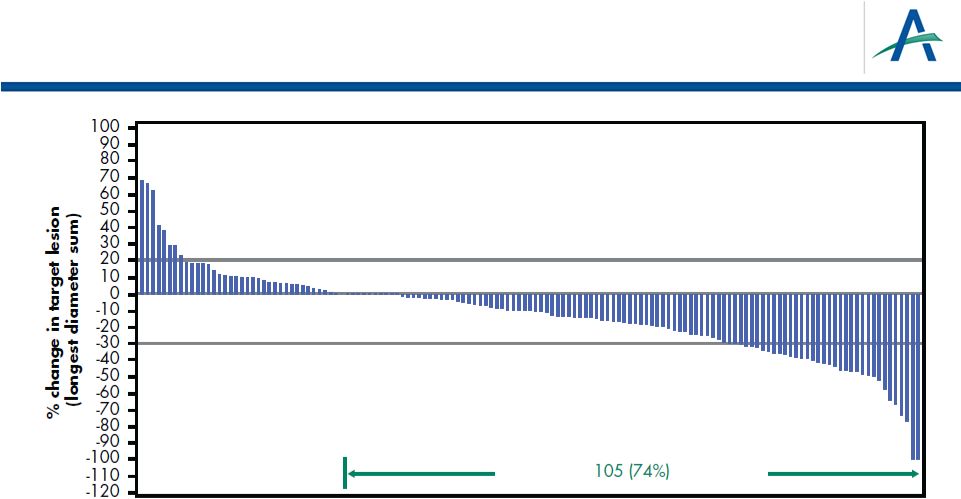 Change From Baseline for Target Lesions
(Investigator Assessment)
21
141 patients had measurable disease at baseline and at least one
subsequent scan
*9 additional unconfirmed responses
ORR (confirmed + unconfirmed) = 19%
Overall Response Rate (confirmed)* = 13% |
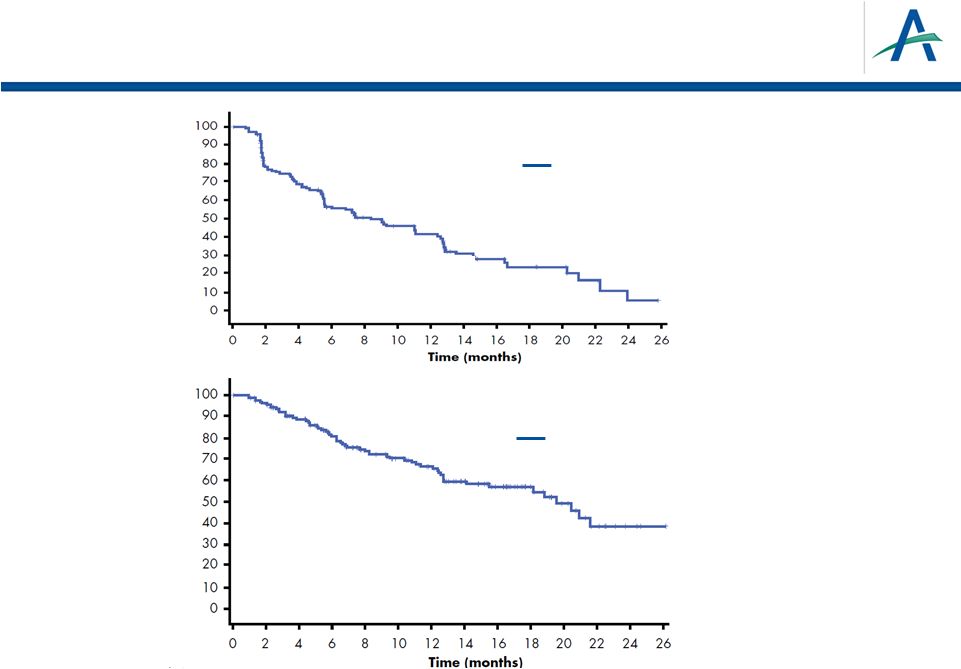 PFS
and OS for Patients Receiving Tivozanib after Progression on
Sorafenib Median PFS = 8.4 months
95% CI: 5.5-12.4
Median OS = 19.6 months
95% CI: 14.1-NA
tivozanib
% PFS
% OS
22
tivozanib |
 Subgroup Analyses from TIVO-1:
Hutson et al.
Abstract #354
23 |
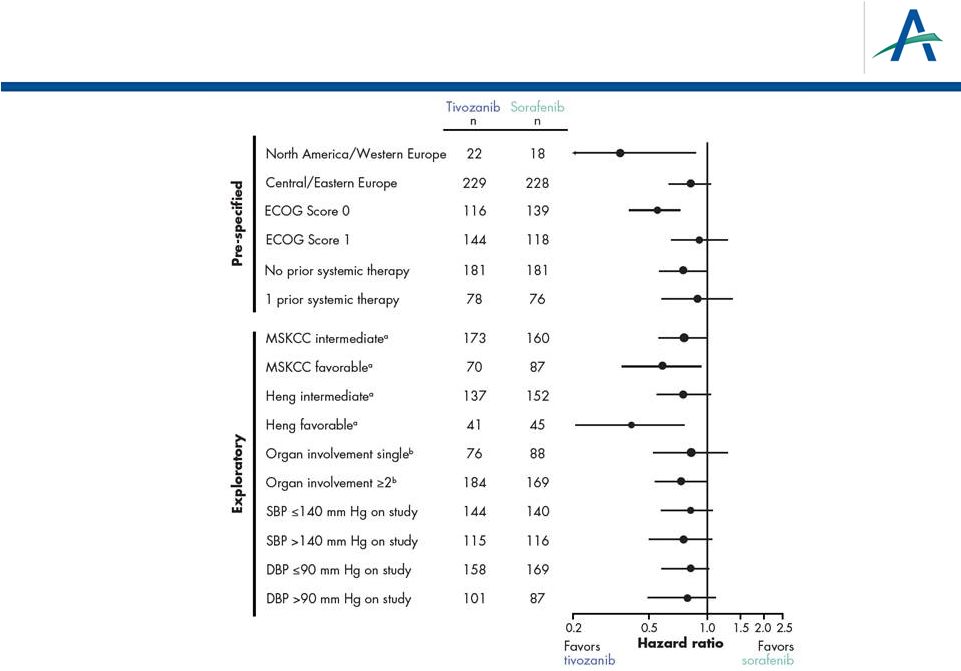 Forest Plot of PFS Hazard Ratios by Independent
Radiological Review Assessment
24
a
MSKCC
and
Heng
“poor”
prognostic
subgroups
too
small
to
estimate
HR;
therefore
exclude
b
By
independent
radiological
review
assessment |
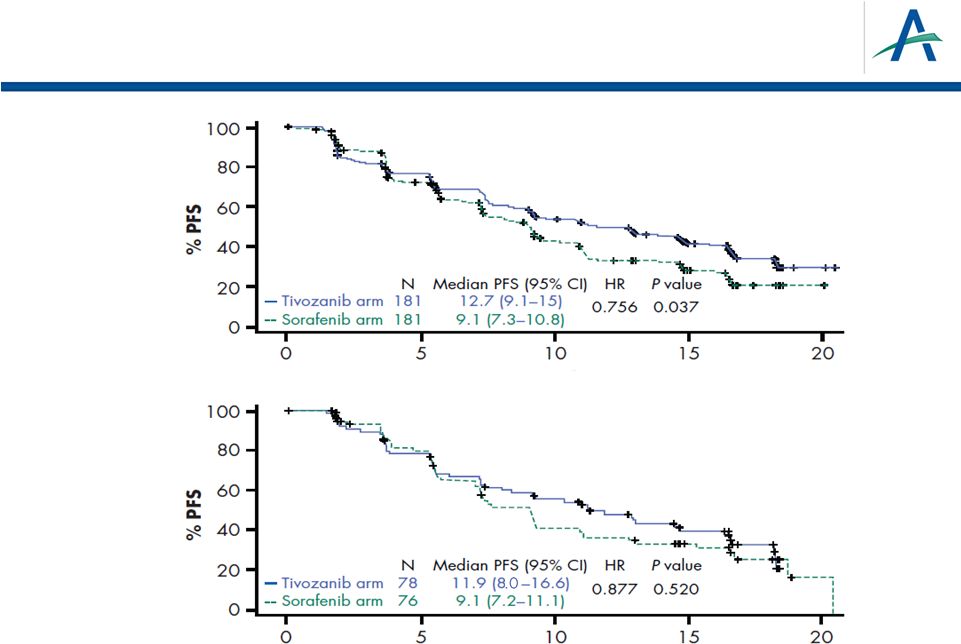 PFS
by Prior Treatment History Time (months)
Time (months)
No prior
systemic
therapy for
metastatic
disease
One prior
systemic
therapy for
metastatic
disease
25 |
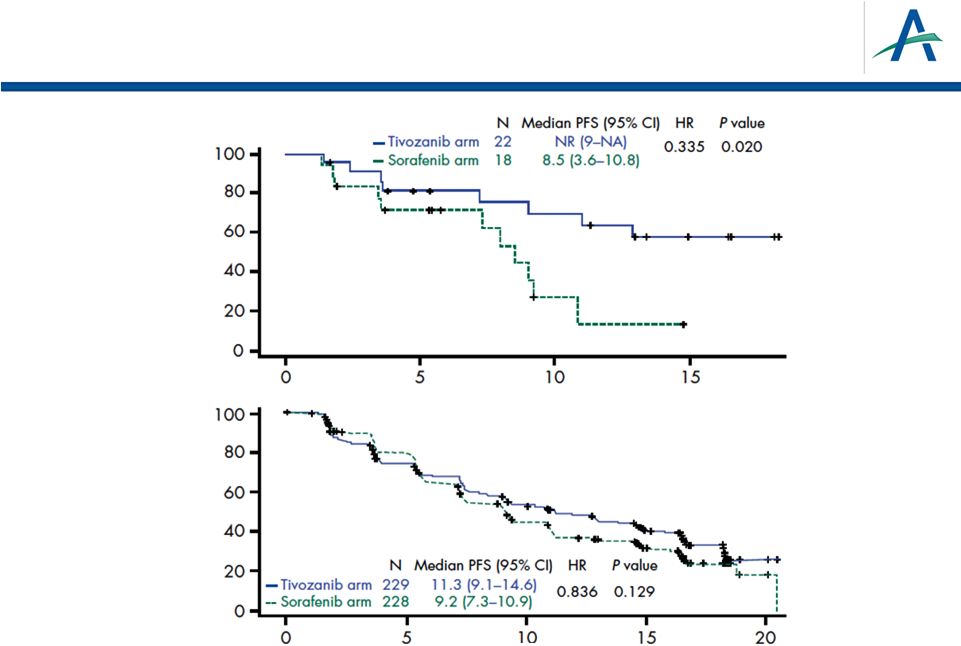 PFS
in North America/Western Europe and Central Europe Time (months)
Time (months)
Central / Eastern
Europe
North America /
Western Europe
26 |
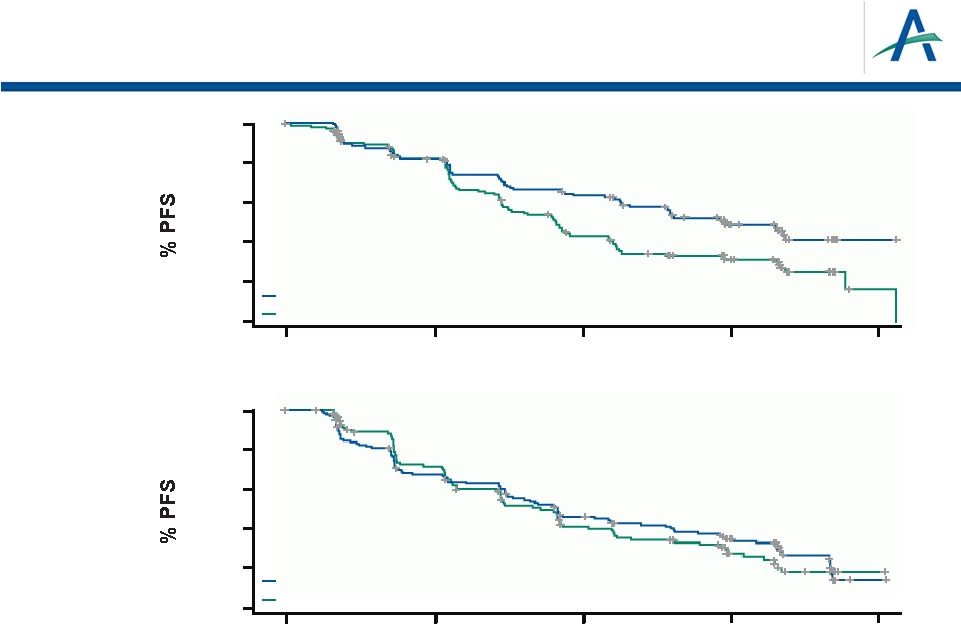 27
ECOG Score 0
ECOG Score 1
Time (months)
Time (months)
0
20
40
60
80
100
0
20
40
60
80
100
0
5
10
15
20
0
5
10
15
20
Tivozanib arm
116
14.8 (11.3–NR)
N
Median PFS (95% CI)
HR
P
value
0.617
0.004
Sorafenib arm
139
9.1 (7.5–11)
Tivozanib arm
144
9.1 (7.5–12.9)
N
Median PFS (95% CI)
HR
P
value
0.920
0.588
Sorafenib arm
118
9 (7.2–10.9)
PFS by ECOG Performance Status Score |
 PFS
by MSKCC Favorable or Intermediate Score Time (months)
Time (months)
MSKCC
intermediate
MSKCC
favorable
MSKCC “poor”
prognostic subgroup too small to estimate HR,
therefore excluded
28 |
 On
Study BP and PFS 29
On-study BP, mm Hg
Tivozanib
Sorafenib
mPFS (95% CI)
n
mPFS (95% CI)
n
P
value
SBP
140
9.0 (7.2–11.3)
144
5.8 (5.5–9.0)
140
0.142
SBP >140
16.7 (12.9–18.3)
115
11.1 (9.2–14.7)
116
0.076
DBP
90
9.1 (7.5–12.7)
158
7.3 (5.7–9.1)
169
0.156
DBP >90
18.3 (12.9–NA)
101
11.0 (9.3–16.4)
87
0.154 |
 Quality of Life Results from TIVO-1:
Cella et al.
Abstract #355
30 |
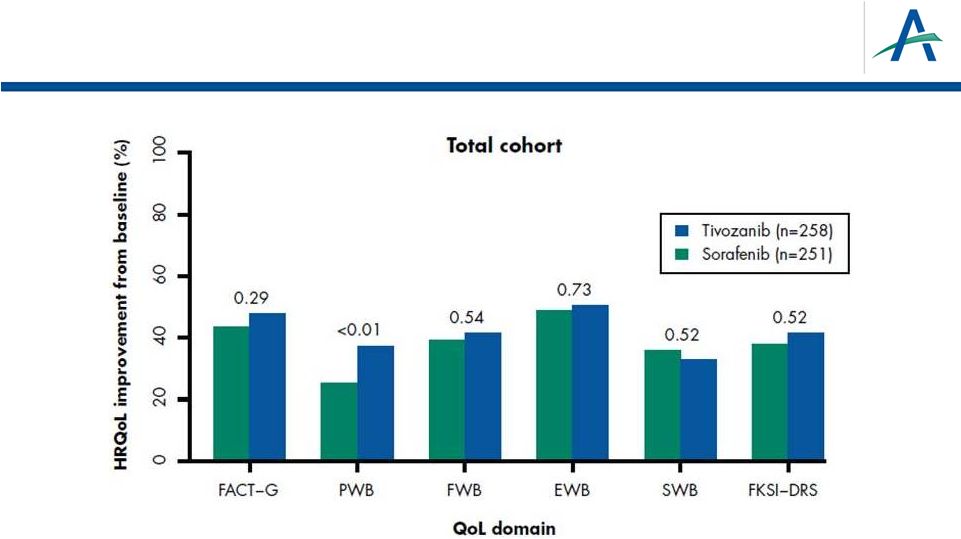 More
Patients Experience Health-related QOL Improvement on Tivozanib than on
Sorafenib Across Most QOL Domains 31
•
Numeric differences favoring tivozanib were observed regarding improvement rates
across all subgroups and HRQoL scores, except Social Well Being (SWB).
•
Statistically significant difference in rates of improvement was observed in the
Physical Well Being (PWB) score for the total cohort with a consistent trend
across several subgroups. |
 Conclusions
•
Primary
endpoint
(PFS
superiority)
met
in
TIVO-1,
and
favorable
safety profile demonstrated
•
Final overall survival (secondary endpoint) results reported
–
OS medians OS are 28.8 and 29.3 months in the tivozanib and
comparator arms, respectively; Hazard Ratio is 1.25 with p-value of
0.105
–
Numerically longer OS observed in comparator arm associated with
higher rate of use of active next-line therapy, predominantly tivozanib
as crossover therapy after progression on sorafenib
•
In patients who progressed on sorafenib and then received
tivozanib, median PFS of 8.4 months observed
–
Tumor regression observed in 74% leading to ORR of 13%
•
PFS benefit for tivozanib over sorafenib consistent across
numerous subsets
•
More patients experienced Health-Related QOL improvement on
tivozanib than on sorafenib across most QOL domains
32 |
 AVEO 4Q12 Results Conference Call
and Tivozanib Update
February 13, 2013
33 |