Attached files
| file | filename |
|---|---|
| 8-K - 8-K - PennyMac Mortgage Investment Trust | a2212771z8-k.htm |
| EX-1.5 - EX-1.5 - PennyMac Mortgage Investment Trust | a2212771zex-1_5.htm |
| EX-1.2 - EX-1.2 - PennyMac Mortgage Investment Trust | a2212771zex-1_2.htm |
| EX-1.3 - EX-1.3 - PennyMac Mortgage Investment Trust | a2212771zex-1_3.htm |
| EX-1.7 - EX-1.7 - PennyMac Mortgage Investment Trust | a2212771zex-1_7.htm |
| EX-1.4 - EX-1.4 - PennyMac Mortgage Investment Trust | a2212771zex-1_4.htm |
| EX-1.6 - EX-1.6 - PennyMac Mortgage Investment Trust | a2212771zex-1_6.htm |
| EX-1.1 - EX-1.1 - PennyMac Mortgage Investment Trust | a2212771zex-1_1.htm |
| EX-99.1 - EX-99.1 - PennyMac Mortgage Investment Trust | a2212771zex-99_1.htm |
Exhibit 99.2
|
|
PennyMac Mortgage Investment Trust February 7, 2013 Fourth Quarter 2012 Earnings Report |

|
|
4Q12 Earnings Report 2 This presentation contains forward-looking statements within the meaning of Section 21E of the Securities Exchange Act of 1934, as amended, regarding management’s beliefs, estimates, projections and assumptions with respect to, among other things, the Company’s financial results, future operations, business plans and investment strategies, as well as industry and market conditions, all of which are subject to change. Words like “believe,” “expect,” “anticipate,” “promise,” “plan,” and other expressions or words of similar meanings, as well as future or conditional verbs such as “will,” “would,” “should,” “could,” or “may” are generally intended to identify forward-looking statements. Actual results and operations for any future period may vary materially from those projected herein, from past results discussed herein, or illustrative examples provided herein. Factors which could cause actual results to differ materially from historical results or those anticipated include, but are not limited to: changes in general business, economic, market and employment conditions from those expected; continued declines in residential real estate and disruption in the U.S. housing market; the availability of, and level of competition for, attractive risk-adjusted investment opportunities in residential mortgage loans and mortgage-related assets that satisfy our investment objectives and investment strategies; changes in our investment or operational objectives and strategies, including any new lines of business; the concentration of credit risks to which we are exposed; the availability, terms and deployment of short-term and long-term capital; unanticipated increases in financing and other costs, including a rise in interest rates; the performance, financial condition and liquidity of borrowers; increased rates of delinquency or decreased recovery rates on our investments; increased prepayments of the mortgage and other loans underlying our investments; changes in regulations or the occurrence of other events that impact the business, operation or prospects of government sponsored enterprises; changes in government support of homeownership; changes in governmental regulations, accounting treatment, tax rates and similar matters; and our ability to satisfy complex rules in order to qualify as a REIT for U.S. federal income tax purposes. You should not place undue reliance on any forward-looking statement and should consider all of the uncertainties and risks described above, as well as those more fully discussed in reports and other documents filed by the Company with the Securities and Exchange Commission from time to time. The Company undertakes no obligation to publicly update or revise any forward-looking statements or any other information contained herein, and the statements made in this presentation are current as of the date of this presentation only. Forward-Looking Statements |
|
|
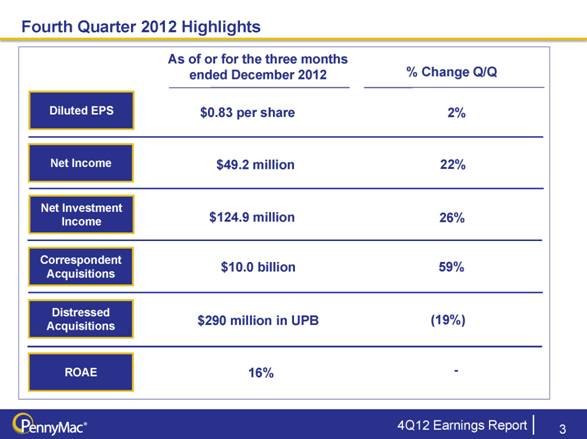
4Q12 Earnings Report 3 Fourth Quarter 2012 Highlights Net Income Net Investment Income Correspondent Acquisitions Distressed Acquisitions As of or for the three months ended December 2012 Diluted EPS $49.2 million $124.9 million $0.83 per share $290 million in UPB $10.0 billion ROAE % Change Q/Q 22% 2% 59% (19%) 26% 16% - |
|
|
4Q12 Earnings Report 4 Full Year 2012 Highlights Net Income Net Investment Income Correspondent Acquisitions Distressed Acquisitions Diluted EPS $138.2 million $335.2 million $3.14 per share $1.0 billion in UPB $21.5 billion ROAE % Change Y/Y 115% 161% 1,587% 2% 30% 16% 4% As of or for the twelve months ended December 2012 |

|
|
PMT is an Externally Managed REIT, with a Broad Array of Residential Mortgage Investments 4Q12 Earnings Report 5 to invest in residential mortgage assets PMT utilizes its equity and modest leverage... driving quality investor returns through dividends and capital appreciation PMT’s 3 year total return: 91% providing solid earnings and dividend growth... Mortgage Assets... ($ in millions) Capital and Financing Capacity ($ in millions) 1 2 3 4 |

|
|
4Q12 Earnings Report 6 PMT’s investment returns are achieved through the investment management capabilities of PCM and the mortgage banking services provided by PLS. These services include: Specialized investment management for PMT, including sourcing, capital markets analytics and valuation, due diligence, portfolio strategy for distressed investments, and overall portfolio management Special servicing for PMT’s distressed whole loan investments, including execution of loan modification and property resolution programs, and subservicing for PMT’s prime mortgage assets Mortgage banking services for PMT’s correspondent and warehouse lending activities, including loan fulfillment, secondary marketing and hedging, counterparty review and relationship management Governed by a Management Agreement, Flow Servicing Agreement, Mortgage Banking and Warehouse Services Agreement, and other associated agreements, which were amended effective February 1, 2013 Revisions to these agreements include, but are not limited to: Establishes a four-year term for all services, subject to periodic assessment of fees Provides for exclusivity of correspondent lending fulfillment to PMT Better aligns PCM’s incentives under the Management Agreement with PMT’s performance Provides remuneration to PMT for a percentage of the MSR value on refinanced loans recaptured by PLS PMT’s Returns are Driven By the Synergistic Relationship with PCM and PLS Please see 8-K filed February 7, 2013. The above summary highlights various components of the “revised agreements” and is not intended to be comprehensive or provide guidance as to the relative materiality of any component of such agreements. Investors should read the agreements in their entirety to fully ascertain the full extent of the agreements and their impact on PMT. See page 24 of the Appendix for a pro forma financial analysis under the revised agreements. |

|
|
Outlook for Key Mortgage Market Drivers and Implications for PMT 4Q12 Earnings Report 7 Regulatory / Government Economy Capital flow into residential mortgage investments is expected to remain strong Margins to continue moving towards normalization as new competitors emerge Ability to pursue organic growth capabilities critical to long-term viability Implications for PMT Driver Competitive Environment Origination Market Refinance activity to diminish as marginally higher rates are anticipated to reduce demand Increased home purchase demand expected to partially offset lower refinance activity Continued modest recovery in prices nationally, the pace of which will vary geographically Improved consumer perception on home ownership Housing starts and home sales to benefit from a stabilization in prices and improved affordability Housing Outlook Residential real estate investment is expected to grow momentum aiding overall growth Continued modest improvement in labor markets QM rules provide clarity and are an important milestone on the path to market normalization Ongoing GSE involvement in mortgage finance is essential to the nascent housing recovery Continued focus on deepening relationships and growing correspondent seller network Focused growth strategies in jumbo and the re-emergence of non-agency securitization Continuing to differentiate through best-in-class execution of PLS Growing and pursuing investments to deliver solid returns through the cycle Improving home prices positively affect the fair value of distressed loans Higher volume of home purchase loans available for acquisition Improved mortgage demand as unemployment slowly declines Distressed whole loan supply to increase as banks continue to reduce legacy assets Regulatory clarity helps define risks and provides a framework for the ongoing recovery of the housing market and the re-emergence of non-agency securitization |

|
|
Mortgage Investment Activities |

|
|
4Q12 Earnings Report 9 Correspondent Lending Continues Solid Performance in 4Q12 Correspondent Acquisitions Volume and Mix Correspondent loan acquisitions totaled $10.0 billion in 4Q12, up 59% vs. 3Q12 Conventional and jumbo loan purchases reached $6.5 billion and locks totaled $7.0 billion Margins remain elevated versus historical levels, and increased slightly from 3Q12 The ratio of net gain on mortgage loans acquired for sale to locks rose in 4Q12 versus 3Q12 The market is expected to begin transitioning to a more normalized margin environment in 2013 Targeting $4 billion in total correspondent acquisitions per month by December 2013 Expect continued volume growth in correspondent, but at appropriate returns on equity Non-agency products (Jumbo) Expanding network of correspondent seller relationships Final QM rules announced in January provide clarity and are an important step toward mortgage market normalization ($ in millions) UPB Key Metrics – 4Q12 For FHA/VA, PMT earns a sourcing fee and interest income for its holding period and does not pay a fulfillment fee. Excludes streamline refinancing activity for FHA (1) (2) (3) CLG Business Partners 140 Net Worth > $10 million 85 Credit Conventional FHA WA FICO 766 711 WA DTI 32 40 % Purchase 30% 54% % CA 38% 42% |

|
|
4Q12 Earnings Report 10 Distressed whole loan purchases totaled $290 million in UPB during 4Q12 Purchases in the quarter were largely comprised of nonperforming loans Flow of distressed loan pools available for review remains robust Fair value of acquisitions during the quarter was $130 million Acquisition price to UPB averaged 45% in 4Q12 Purchased an additional $173 million in UPB of nonperforming loans thus far in 1Q13 Flow of distressed whole loans available for sale is anticipated to rise Additional participants are looking to sell legacy assets and free up capital Currently targeting levered returns in the range of 16% - 23%(1) depending on delinquency status Leverage on distressed whole loans at quarter end was modest at 0.4X Distressed Whole Loan Purchases Remained Active in 4Q12 Distressed Whole Loan Purchase Activity ($ in millions) UPB (1) Targeted gross returns including the effect of leverage before corporate operating and other administrative expenses. Includes both nonperforming and reperforming loans. (2) Performance status as of the date of acquisition. Distressed Whole Loan Acquisitions ($ in thousands) Fair Value UPB Distressed mortgage loans (2) Performing 5,718 $ 12,437 $ Nonperforming 124,609 277,899 130,328 $ 290,336 $ Quarter Ended December 31, 2012 |

|
|
4Q12 Earnings Report 11 Gains on mortgage loans rose 44% from 3Q12 as a result of improving loan performance, home prices and higher refinance activity Loan performance improved due to lower delinquencies and solid progress toward resolution Actual home prices reported during the fourth quarter positively impacted loan valuations CoreLogic’s national home price index rose 8.3% from year ago levels(1) and has posted 10 consecutive monthly increases The forecasted magnitude of future home price declines improved modestly quarter over quarter Reflects the perceived stabilization of the real estate market The number of loans that paid off during the fourth quarter increased compared to the prior quarter, driving higher payoff-related gains Distressed Whole Loan Investments Benefit from Housing Market Stabilization Realized and Unrealized Gains on Mortgage Loans Baseline Forward Curve – HPI Forecast(2) (1) Corelogic HPI index as of December 2012 (2) Moody’s Analytics – National averages Quarter ended ($ in thousands) December 31, 2012 Valuation Changes: Performing Loans 3,335 $ Nonperfoming Loans 30,418 33,753 Payoffs 4,355 38,108 $ Baseline December 2012 Curve Baseline September 2012 Curve Trough Drop (from baseline as of date) (1.40)% (2.00)% Trough Date Feb-13 Feb-13 Return to current levels Sep-13 Oct-13 |

|
|
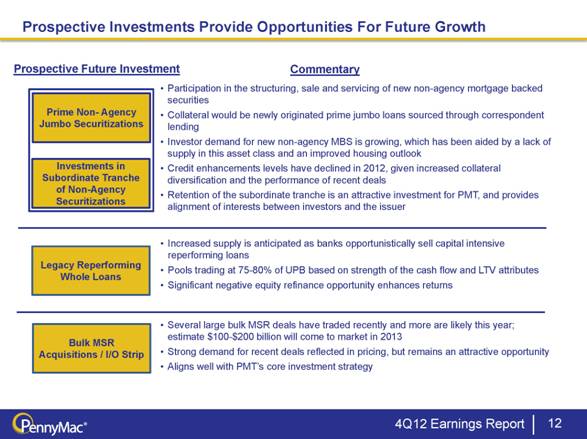
4Q12 Earnings Report 12 Prospective Investments Provide Opportunities For Future Growth Prospective Future Investment Commentary Participation in the structuring, sale and servicing of new non-agency mortgage backed securities Collateral would be newly originated prime jumbo loans sourced through correspondent lending Investor demand for new non-agency MBS is growing, which has been aided by a lack of supply in this asset class and an improved housing outlook Credit enhancements levels have declined in 2012, given increased collateral diversification and the performance of recent deals Retention of the subordinate tranche is an attractive investment for PMT, and provides alignment of interests between investors and the issuer Several large bulk MSR deals have traded recently and more are likely this year; estimate $100-$200 billion will come to market in 2013 Strong demand for recent deals reflected in pricing, but remains an attractive opportunity Aligns well with PMT’s core investment strategy Prime Non- Agency Jumbo Securitizations Bulk MSR Acquisitions / I/O Strip Legacy Reperforming Whole Loans Increased supply is anticipated as banks opportunistically sell capital intensive reperforming loans Pools trading at 75-80% of UPB based on strength of the cash flow and LTV attributes Significant negative equity refinance opportunity enhances returns Investments in Subordinate Tranche of Non-Agency Securitizations |
|
|
Financial Results |

|
|
4Q12 Earnings Report 14 Mortgage related assets continued to grow, increasing 14% Q/Q to $2.4 billion Growth primarily resulted from distressed whole loan acquisition and a growing pipeline of correspondent loans acquired for sale MSRs grew 95% on continued strong volume growth by Correspondent Lending Growth in Mortgage Assets and Earnings Continued in 4Q12 Pretax Earnings and Net Income Mortgage Assets Net income rose 22% Q/Q on strong operational performance and a lower effective tax rate Total pretax income rose 11% Q/Q, driven by record results in both operating segments ($ in millions) ($ in millions) MBS Distressed Whole Loans REO Correspondent Loans Inventory MSRs Correspondent Investments Net Income |

|
|
4Q12 Earnings Report 15 Investment Activities Deliver Solid Fourth Quarter Performance Pretax income increased 13% Q/Q, resulting from higher investment balances and improved home price performance Revenues increased 12% Q/Q from a solid 46% increase in net gain on investments Loss in other income of $5.6 million due to LOCOM adjustments for selected high balance REOs and increased property tax and preservation costs Expenses increased 10% Q/Q, due to a rise in management fee expense and higher professional services expense Annualized total return on distressed loan investments was over 20% in 4Q12(1) Investment Activities Segment Pretax Income Total return represents the sum of the interest yield and the net gain on the respective investment and does not take into account any associated expenses. (Unaudited) Quarter Ended ($ in thousands) December 31, 2012 September 30, 2012 Revenues: Net gain on investments 38,108 $ 26,061 $ Interest income 12,680 13,586 Other income (5,605) 775 Total revenues 45,183 40,422 Expenses: Interest 4,692 4,931 Servicing 4,932 5,148 Other 11,237 8,801 Total expenses 20,861 18,880 Pre-tax income 24,322 $ 21,542 $ |

|
|
4Q12 Earnings Report 16 Correspondent Lending Pretax Income Grows as Loan Purchase Volumes Rise Correspondent segment pretax income rose 9% Q/Q to $41 million as a result of strong growth in correspondent loan purchase volumes Net gain on mortgage loans acquired for sale increased 33% Q/Q Other income increase driven by a doubling of loan origination fee revenue Loan fulfillment fees increased 84% Q/Q, commensurate with conventional loan sales volume Correspondent Lending Segment Pretax Income (Unaudited) Quarter Ended ($ in thousands) December 31, 2012 September 30, 2012 Revenues: Interest income 7,604 $ 6,159 $ Net gain on mortgage loans acquired for sale 66,465 49,793 Other income 5,665 2,837 Total revenues 79,734 58,789 Expenses: Interest 5,291 3,366 Servicing 68 60 Loan fulfillment fees 31,809 17,258 Other 1,585 678 Total expenses 38,753 21,362 Pre-tax income 40,981 $ 37,427 $ |

|
|
Net Gain On Mortgage Loans Acquired for Sale Up On Strong Correspondent Performance 4Q12 Earnings Report 17 Net gain on mortgage loans acquired for sale reached $66 million in 4Q12, a 33% quarter-over-quarter increase Growth in net gain on mortgage loans acquired for sale resulted from strong growth in correspondent lock volume Margin as measured by net gain on mortgage loans acquired for sale to lock volume rose 4bps quarter over quarter Low mortgage rates resulting from QE3 drove wider margins, which narrowed as the quarter progressed Margins are expected to move toward normalization in 2013, however, many variables will impact what the new normal will be Net gain on mortgage loans acquired for sale Net gain on mortgage loans acquired for sale margins ($ in millions) December 30, 2012 September 30, 2012 Net gain on mortgage loans acquired for sale 66.47 $ 49.79 $ Volume of conventional and jumbo interest rate lock commitments (IRLC) 7,010.26 $ 5,466.39 $ Ratio of net gain on mortgage loans acquired for sale to IRLC 0.95% 0.91% Quarter Ended Quarter ended December 31, 2012 ($ in thousands) MSR Value - originated in period $68,033 Rep & Warrant provision (2,063) Cash gain (loss) (25,079) Change in fair value of commitments to purchase loans (20,556) Change in fair value related to loans and hedging 46,130 Net gain on mortgage loans acquired for sale $66,465 |

|
|
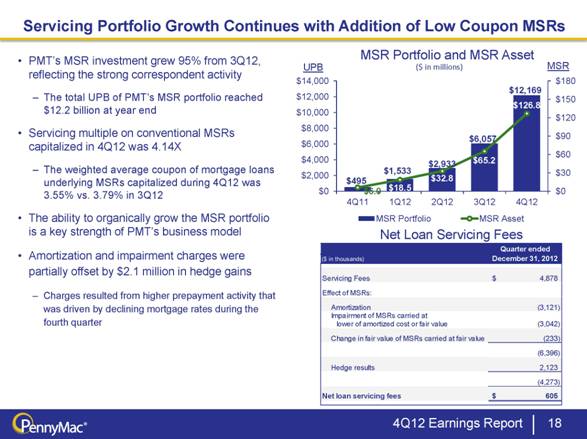
4Q12 Earnings Report 18 Servicing Portfolio Growth Continues with Addition of Low Coupon MSRs PMT’s MSR investment grew 95% from 3Q12, reflecting the strong correspondent activity The total UPB of PMT’s MSR portfolio reached $12.2 billion at year end Servicing multiple on conventional MSRs capitalized in 4Q12 was 4.14X The weighted average coupon of mortgage loans underlying MSRs capitalized during 4Q12 was 3.55% vs. 3.79% in 3Q12 The ability to organically grow the MSR portfolio is a key strength of PMT’s business model Amortization and impairment charges were partially offset by $2.1 million in hedge gains Charges resulted from higher prepayment activity that was driven by declining mortgage rates during the fourth quarter Net Loan Servicing Fees MSR Portfolio and MSR Asset ($ in millions) Quarter ended ($ in thousands) December 31, 2012 Servicing Fees 4,878 $ Effect of MSRs: Amortization (3,121) Impairment of MSRs carried at lower of amortized cost or fair value (3,042) Change in fair value of MSRs carried at fair value (233) (6,396) Hedge results 2,123 (4,273) Net loan servicing fees 605 $ MSR Portfolio MSR Asset MSR UPB |
|
|
Key Takeaways |

|
|
4Q12 Earnings Report 20 Residential mortgage market opportunities remain significant Stabilization in housing benefits both correspondent acquisitions and distressed whole loan values Correspondent acquisition volumes expected to grow Targeting $4 billion of total correspondent acquisitions per month by December 2013 Deepening relationships and expanding product penetration, i.e. Jumbo Best-in-class service and execution by our fulfillment provider Robust market for distressed whole loans expected in 2013 Addressable market for non-performing loans anticipated to grow with additional participants seeking to sell Reperforming whole loan market also expected to grow The non-agency securitization market is expected to grow Non-agency MBS issuance is a key opportunity PMT would likely retain subordinate tranches as investments Relationships with PCM and PLS provide PMT the ability to pursue a wide range of residential mortgage investments Key Takeaways |

|
|
Appendix |

|
|
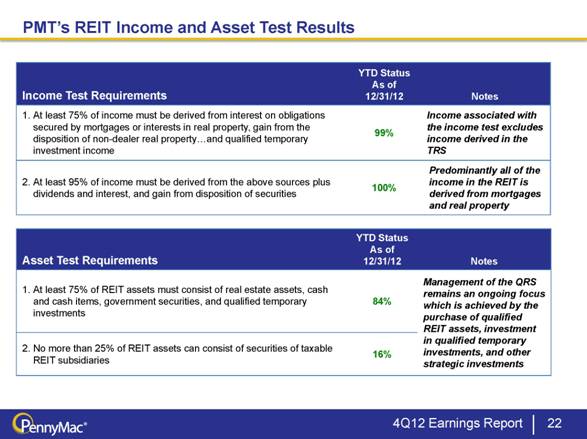
4Q12 Earnings Report 22 PMT’s REIT Income and Asset Test Results Income Test Requirements YTD Status As of 12/31/12 Notes At least 75% of income must be derived from interest on obligations secured by mortgages or interests in real property, gain from the disposition of non-dealer real propertyand qualified temporary investment income 99% Income associated with the income test excludes income derived in the TRS At least 95% of income must be derived from the above sources plus dividends and interest, and gain from disposition of securities 100% Predominantly all of the income in the REIT is derived from mortgages and real property Asset Test Requirements YTD Status As of 12/31/12 Notes At least 75% of REIT assets must consist of real estate assets, cash and cash items, government securities, and qualified temporary investments 84% Management of the QRS remains an ongoing focus which is achieved by the purchase of qualified REIT assets, investment in qualified temporary investments, and other strategic investments No more than 25% of REIT assets can consist of securities of taxable REIT subsidiaries 16% |
|
|
Portfolio Acquisitions Are Progressing in Line With Expectations 4Q12 Earnings Report 23 (1) Ratio of unpaid principal balance remaining to unpaid principal balance at acquisition Purchase 4Q12 Purchase 4Q12 Purchase 4Q12 Purchase 4Q12 Balance ($mm) 182.7 $ 78.6 Balance ($mm) 195.5 $ 70.4 Balance ($mm) 146.2 $ 56.0 Balance ($mm) 277.8 $ 151.2 Pool Factor (1) 1.00 0.43 Pool Factor (1) 1.00 0.36 Pool Factor (1) 1.00 0.38 Pool Factor (1) 1.00 0.54 Current 6.2% 27.0% Current 5.1% 27.6% Current 1.2% 27.7% Current 5.0% 28.9% 30 1.6% 4.7% 30 2.0% 5.0% 30 0.4% 5.3% 30 4.0% 6.2% 60 5.8% 4.1% 60 4.1% 4.2% 60 1.3% 3.0% 60 5.1% 5.3% 90+ 37.8% 19.0% 90+ 42.8% 19.0% 90+ 38.2% 17.3% 90+ 26.8% 13.7% FC 46.4% 34.2% FC 45.9% 34.6% FC 58.9% 35.1% FC 59.1% 34.5% REO 2.3% 11.0% REO 0.0% 9.6% REO 0.0% 11.5% REO 0.0% 11.3% Purchase 4Q12 Purchase 4Q12 Purchase 4Q12 Purchase 4Q12 Balance ($mm) 515.1 $ 321.6 Balance ($mm) 259.8 $ 183.0 Balance ($mm) 542.6 $ 327.0 Balance ($mm) 49.0 $ 42.9 Pool Factor (1) 1.00 0.62 Pool Factor (1) 1.00 0.70 Pool Factor (1) 1.00 0.60 Pool Factor (1) 1.00 0.88 Current 2.0% 25.6% Current 11.5% 29.8% Current 0.6% 11.1% Current 0.2% 18.3% 30 1.9% 5.4% 30 6.5% 6.2% 30 1.3% 3.7% 30 0.1% 1.8% 60 3.9% 2.7% 60 5.2% 4.2% 60 2.0% 2.3% 60 0.2% 1.6% 90+ 25.9% 13.7% 90+ 31.2% 16.6% 90+ 22.6% 19.2% 90+ 70.4% 32.9% FC 66.3% 43.7% FC 43.9% 33.5% FC 73.0% 50.9% FC 29.0% 43.2% REO 0.0% 8.9% REO 1.7% 9.8% REO 0.4% 12.8% REO 0.0% 2.2% Purchase 4Q12 Purchase 4Q12 Balance ($mm) 402.5 $ 371.6 Balance ($mm) 357.2 $ 349.9 Pool Factor (1) 1.00 0.92 Pool Factor (1) 1.00 0.98 Current 45.0% 47.0% Current 0.0% 1.2% 30 4.0% 4.5% 30 0.0% 0.0% 60 4.3% 2.7% 60 0.1% 0.1% 90+ 31.3% 23.0% 90+ 49.1% 47.6% FC 15.3% 20.2% FC 50.8% 48.4% REO 0.1% 2.5% REO 0.0% 2.7% 4Q10 1Q11 2Q11 3Q11 4Q11 1Q12 2Q12 3Q12 No Pools Purchased in this Quarter. 1Q10 2Q10 3Q10 |

|
|
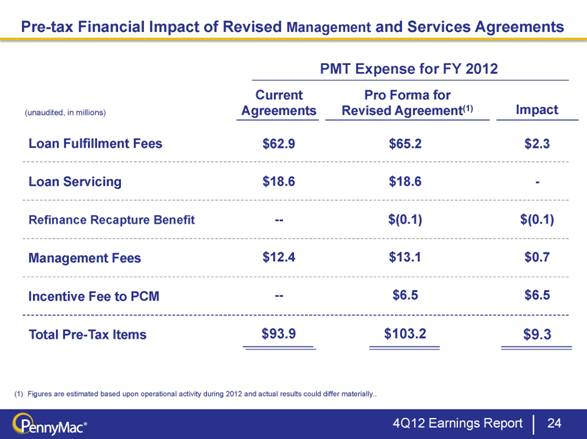
4Q12 Earnings Report 24 Pre-tax Financial Impact of Revised Management and Services Agreements PMT Expense for FY 2012 Current Agreements Pro Forma for Revised Agreement(1) Loan Fulfillment Fees Loan Servicing Refinance Recapture Benefit Management Fees Incentive Fee to PCM Total Pre-Tax Items Impact $62.9 (unaudited, in millions) $18.6 -- $12.4 -- $93.9 $65.2 $18.6 $(0.1) $13.1 $6.5 $103.2 $2.3 - $(0.1) $0.7 $6.5 $9.3 Figures are estimated based upon operational activity during 2012 and actual results could differ materially |