Attached files
| file | filename |
|---|---|
| 8-K - 8-K - Silicon Graphics International Corp | form8-kx2q13earningspaoapp.htm |
Exhibit 99.1
SGI REPORTS SECOND QUARTER
FISCAL YEAR 2013 FINANCIAL RESULTS
FREMONT, Calif., Jan. 30, 2013 - SGI (NASDAQ:SGI), the trusted leader in technical computing, today reported financial results for its second fiscal quarter ended Dec. 28, 2012. Total revenue for the second fiscal quarter was $171 million, which compares with $193 million in the previous quarter and $195 million in the second fiscal quarter of 2012.
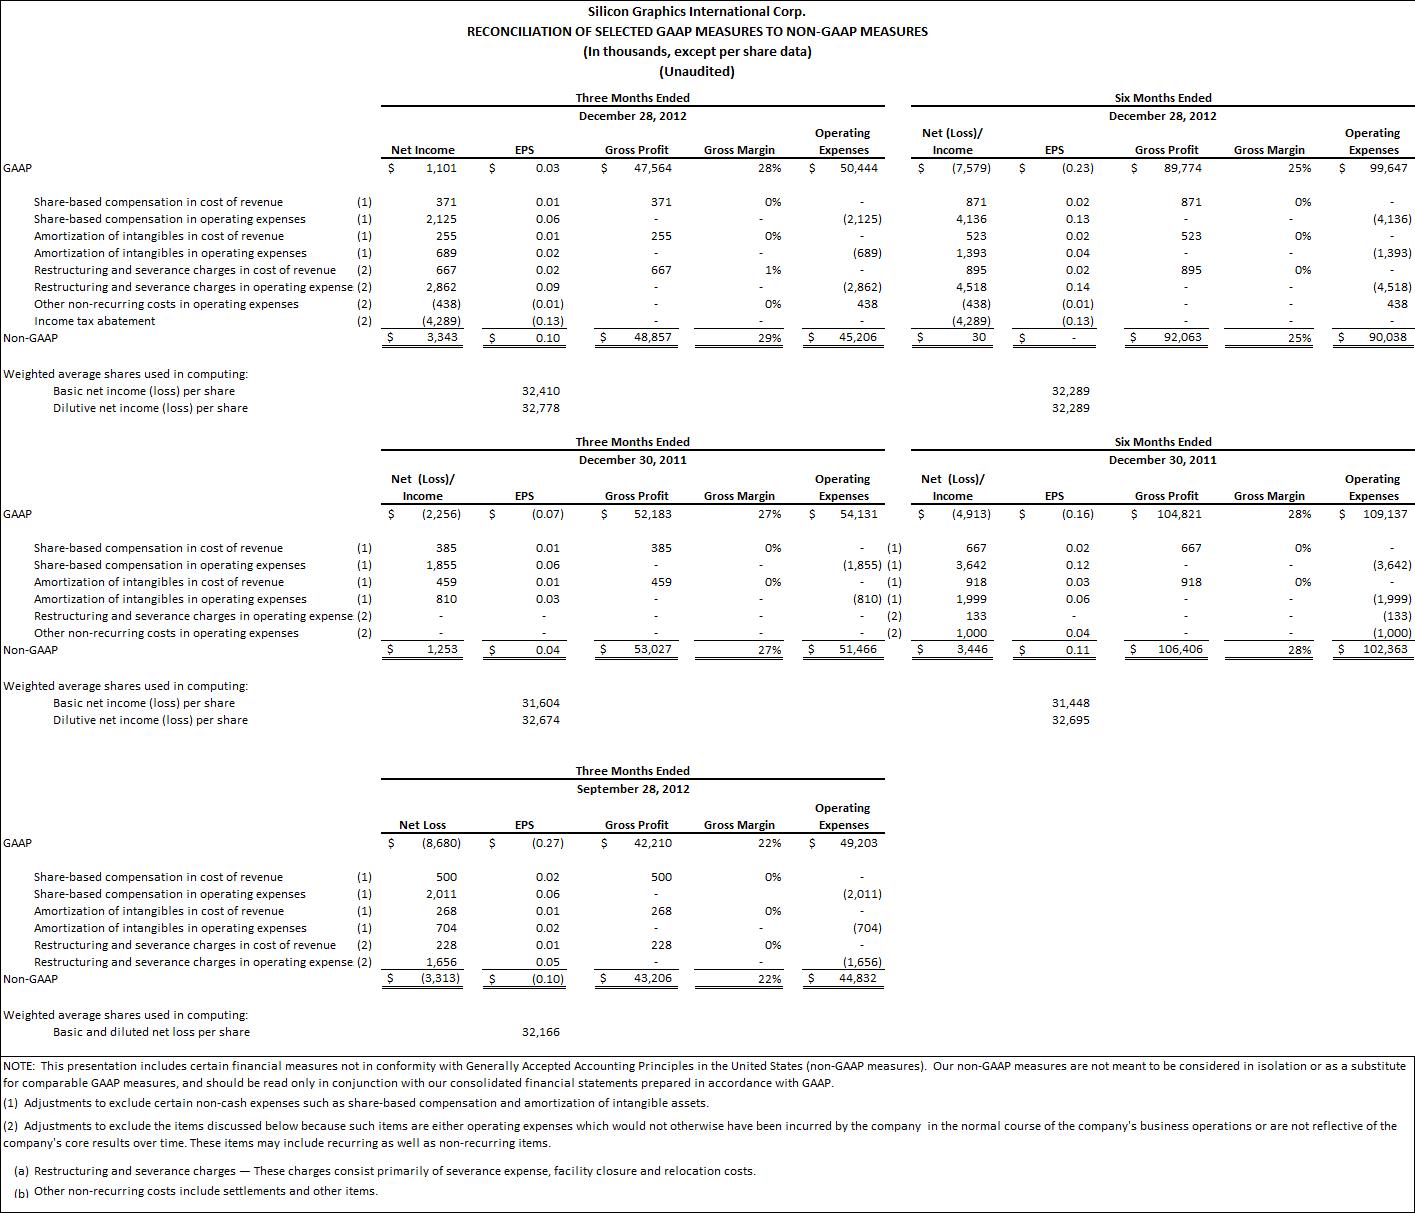
GAAP net income for the second quarter was $1 million, or $0.03 per share, which compares with a net loss of $9 million, or ($0.27) per share, in the prior quarter, and a net loss of $2 million, or ($0.07) per share, in the second quarter of fiscal 2012. Non-GAAP net income for the quarter was $3 million, or $0.10 per share, which compares with a non-GAAP net loss of $3 million, or ($0.10) per share, in the prior quarter and non-GAAP net income of $1 million, or $0.04 per share, in the year-ago period. GAAP net income includes the impact of a non-cash $4 million tax-related benefit, which is excluded from the non-GAAP results.
“Final results for the quarter were consistent with the preliminary results announced on Jan. 15, 2013, and reflected our significant progress to date in the company's turnaround,” said Jorge Titinger, president and chief executive officer. “We are excited about the near-term opportunity to continue to improve profitability as we drive our longer-term strategic product and marketing initiatives in Big Data and HPC that we believe will deliver above-market growth and higher margins over time.”
Highlights
• | On Jan. 22, 2013, the company announced an OEM partnership with Scality for a Scale-Out Storage solution, built on the extreme density of the SGI® Modular InfiniteStorageTM (SGI MIS) platform. |
• | SGI announced on Jan. 21, 2013 that it named Cassio Conceicao as Executive Vice President and Chief Operating Officer, a new position at the company. |
• | On Jan. 15, 2013, the company announced that its board of directors authorized a $15 million stock repurchase plan. |
• | On Nov. 14, 2012, SGI won the HPCwire Readers' Choice Award for "Top Supercomputing Achievement" for its contribution to the NASA Ames Pleiades supercomputer. The company also received the Editor's Choice Award for "Best use of HPC in 'edge HPC' application" for its SGI® UV™ 2000's historical mapping and exploration of Wikipedia. |
• | The company announced on Nov. 11, 2012, a win with the Central Research Institute of Electric Power Industry, a joint research institute of electric power companies in Japan, which plans to implement one of the largest and fastest cluster systems with a theoretical computing performance of up to 670 teraflops for scientific calculation. |
Outlook for Fiscal Q3 2013
The company provides technical computing solutions to large government, public, and commercial customers. Any given customer deal can include a varying mix of compute and storage hardware, software, and services, and generally will carry terms that result in most of the product revenue associated with the deal being recognized upon final shipment or acceptance of the system. The timing of final delivery or acceptance of large deals is difficult to predict and can cause significant swings in quarterly revenue. Management provides guidance on quarterly revenue and other items based on its current expectations of the timing of revenue and associated costs; however there can be no assurance that revenues and associated costs will be recognized according to expected schedules and management assumes no obligation to update its guidance if the timing of revenues or other circumstances in the business differ from current expectations.
For the third quarter ending Mar. 29, 2013, the company is providing the following guidance:
• | Revenue for the third fiscal quarter is expected to be $200 million to $230 million and is expected to include up to $50 million of low-margin deals previously discussed in our earnings call reporting financial results for our first quarter fiscal 2013. |
• | Over the second half of its fiscal year ending June 2013, the company continues to expect total revenues of $400 million to $420 million, including the final $50 million of the low-margin deals. |
• | GAAP net loss per share for the third fiscal quarter is expected to be ($0.12) to ($0.06). |
• | Non-GAAP net income per share for the third fiscal quarter is expected to be $0.12 to $0.18 and is expected to exclude approximately $8 million of restructuring and severance charges, stock-based compensation expense, and intangibles amortization. |
A live webcast of the earnings conference call will be available on the Investor Relations section of SGI's website at investors.sgi.com. The public can also listen to the earnings conference call at 2:00 p.m. PT (5:00 p.m. ET) by dialing (888) 463-5422 (toll-free) or (970) 315-0484 (international).
1
A replay of the webcast will be available approximately two hours after the conclusion of the call and will remain available until the next earnings call. An audio replay of the conference call will also be made available approximately two hours after the conclusion of the call. The audio replay will remain available for five days and can be accessed by dialing (855) 859-2056 (toll-free) or (404) 537-3406 (international) and entering the confirmation code: 86586511.
About SGI
SGI, the trusted leader in technical computing, is focused on helping customers solve their most demanding business and technology challenges. Visit sgi.com for more information.
Cautionary Statement Regarding Forward Looking Statements
The statements made in this press release regarding projected financial results, financial objectives, and strategic plans, including SGI's Q3 FY13 financial guidance and certain statements made in the earnings conference call, are forward-looking statements within the meaning of the safe harbor provisions of Section 21E of the Securities Exchange Act of 1934. Actual results could differ materially from those described by these statements due to a number of uncertainties, including, but not limited to:
• | Fluctuations in the buying patterns and sizes of customer orders from one quarter to the next; |
• | Increased competition causing SGI to sell products or services at lower margins than expected; |
• | Lengthy acceptance cycles of SGI's products by certain customers, development or product delivery delays, and delays in obtaining necessary components from suppliers, contractual provisions or other reasons; |
• | The addition of new customers or loss of existing customers; |
• | Customer concentration risks; |
• | Substantial sales to U.S. government entities, which are subject to the government's budgetary constraints; |
• | Write-off of excess and obsolete inventory; |
• | Unexpected changes in the price for, and the availability of, components from SGI's suppliers; |
• | SGI's ability to enhance its products with new and better designs and functionality; |
• | Actions taken by competitors, such as new product announcements or introductions or changes in pricing; and |
• | Market acceptance of newer products. |
In addition, SGI's actual revenue, gross margin, earnings per share and other projections on a GAAP and non-GAAP basis for the fiscal quarter ending March 29, 2013 could differ materially from the targets stated under “Outlook for Fiscal Q3 2013” above for a number of reasons, including, but not limited to (i) application of the actual consolidated GAAP and non-GAAP tax rates for such periods, or judgment by management to increase or decrease an income tax asset or liability, (ii) a determination by SGI that any portion of its goodwill or intangible assets have become impaired, (iii) changes in the anticipated amount of employee stock-based compensation expense recognized on SGI's financial statements, (iv) increases or decreases to estimated capital expenditures, (v) changes driven by new accounting rules, regulations, interpretations or guidance, (vi) changes in the anticipated amounts and timing of restructuring charges to be incurred and cost savings expected to be realized from our restructuring actions in Europe, (vii) charges or gains resulting from litigation or dispute settlement, and (viii) other risks as detailed in SGI's filings with the Securities and Exchange Commission (“SEC”), including those described in SGI's Annual Report on Form 10-K under the caption “Risk Factors” filed with the SEC on September 10, 2012, which are available at the SEC's web site at http://www.sec.gov. You are cautioned not to place undue reliance on forward-looking statements, which speak only as of the date of this announcement. SGI undertakes no obligation to update the information in this earnings release or the related earnings conference call, whether as a result of new information, future events or otherwise, unless otherwise required by law.
Use of Non-GAAP Financial Measures
This press release and the related earnings conference call include financial measures that are not determined in accordance with U.S. general accepted accounting principles (“GAAP”), including non-GAAP gross profit and gross margin, non-GAAP operating expenses, non-GAAP net income (loss) and non-GAAP basic and diluted net income (loss) per share. These non-GAAP measures are not based on any comprehensive set of accounting rules or principles and management exercises judgment in determining which items should be excluded in the calculation of non-GAAP measures. In addition, these non-GAAP measures may be different from non-GAAP measures used by other companies. While we believe that non-GAAP measures have limitations in that they do not reflect all of the amounts associated with our results of operations as determined in accordance with GAAP, we believe that non-GAAP measures are valuable in evaluating the company's operating performance and analyzing our business operations. Management excludes the following items from one or more of non-GAAP measures: (1) share-based compensation; (2) amortization of intangible assets; (3) restructuring and severance charges; and (4) other non-recurring costs, including settlements and other items. These measures are adjusted as described in the reconciliation of GAAP and non-GAAP numbers at the end of this release, but these adjustments should not be construed as an inference that all of these adjustments or costs are unusual, infrequent or non-recurring.
2
In addition, management uses these non-GAAP financial measures to facilitate its review of the comparability of SGI's core operating performance on a period to period basis as well as to better understand the fundamental economics of a specific period's operational and financial performance. Management uses this view of SGI's operating performance for purposes of comparison with its business plan and individual operating budgets and allocations of resources.
Management also believes that the non-GAAP financial measures provide additional insight for analysts and investors in evaluating SGI's financial and operational performance in the same way that management evaluates the company's financial performance. However, these non-GAAP financial measures have limitations as an analytical tool, as they exclude the financial impact of transactions necessary or advisable for the conduct of SGI's business, such as the granting of equity compensation awards and are not intended to be an alternative to financial measures prepared in accordance with GAAP. Hence, to compensate for these limitations, management does not review these non-GAAP financial metrics in isolation from its GAAP results, nor should investors. Pursuant to the requirements of SEC Regulation G, a detailed reconciliation between SGI's GAAP and non-GAAP financial results is provided at the end of this press release. Investors are advised to carefully review and consider this information as well as the GAAP financial results that are disclosed in SGI's SEC filings.
Contact Information:
John Swenson
SGI Investor Relations
+1-510-933-8370
jswenson@sgi.com
© 2013 SGI. SGI and its product names and logos are trademarks or registered trademarks of Silicon Graphics International Corp. or its subsidiaries in the United States and/or other countries. All other trademarks are property of their respective holders.
3
Silicon Graphics International Corp. | |||||||||||||||||||
UNAUDITED CONDENSED CONSOLIDATED STATEMENTS OF OPERATIONS | |||||||||||||||||||
(In thousands, except per share amounts) | |||||||||||||||||||
Three Months Ended | Six Months Ended | ||||||||||||||||||
December 28, | December 30, | December 28, | December 30, | ||||||||||||||||
2012 | 2011 | 2012 | 2011 | ||||||||||||||||
Revenue | $ | 171,226 | $ | 195,214 | $ | 364,107 | $ | 374,109 | |||||||||||
Cost of revenue | 123,662 | 143,031 | 274,333 | 269,288 | |||||||||||||||
Gross profit | 47,564 | 52,183 | 89,774 | 104,821 | |||||||||||||||
Operating expenses: | |||||||||||||||||||
Research and development | 15,530 | 16,255 | 29,499 | 32,445 | |||||||||||||||
Sales and marketing | 19,664 | 23,100 | 39,235 | 44,898 | |||||||||||||||
General and administrative | 12,383 | 14,799 | 26,572 | 31,684 | |||||||||||||||
Restructuring | 2,867 | (23 | ) | 4,341 | 110 | ||||||||||||||
Total operating expenses | 50,444 | 54,131 | 99,647 | 109,137 | |||||||||||||||
Loss from operations | (2,880 | ) | (1,948 | ) | (9,873 | ) | (4,316 | ) | |||||||||||
Interest income (expense), net | (112 | ) | 74 | (267 | ) | (24 | ) | ||||||||||||
Other income (expense), net | 213 | (285 | ) | (894 | ) | (1,143 | ) | ||||||||||||
Total other income (expense), net | 101 | (211 | ) | (1,161 | ) | (1,167 | ) | ||||||||||||
Loss before income taxes | (2,779 | ) | (2,159 | ) | (11,034 | ) | (5,483 | ) | |||||||||||
Income tax (benefit) provision | (3,880 | ) | 97 | (3,455 | ) | (570 | ) | ||||||||||||
Net income (loss) | $ | 1,101 | $ | (2,256 | ) | $ | (7,579 | ) | $ | (4,913 | ) | ||||||||
Basic net income (loss) per share | $ | 0.03 | $ | (0.07 | ) | $ | (0.23 | ) | $ | (0.16 | ) | ||||||||
Diluted net income (loss) per share | $ | 0.03 | $ | (0.07 | ) | $ | (0.23 | ) | $ | (0.16 | ) | ||||||||
Shares used in computing basic net income (loss) per share | 32,410 | 31,604 | 32,289 | 31,448 | |||||||||||||||
Shares used in computing diluted net income (loss) per share | 32,778 | 31,604 | 32,289 | 31,448 | |||||||||||||||
Share-based compensation by category is as follows: | |||||||||||||||||||
Cost of revenue | $ | 371 | $ | 385 | $ | 871 | $ | 667 | |||||||||||
Research and development | 588 | 507 | 1,127 | 1,022 | |||||||||||||||
Sales and marketing | 423 | 439 | 809 | 800 | |||||||||||||||
General and administrative | 1,114 | 909 | 2,200 | 1,820 | |||||||||||||||
Total | $ | 2,496 | $ | 2,240 | $ | 5,007 | $ | 4,309 | |||||||||||
4
Silicon Graphics International Corp. | ||||||||||||
UNAUDITED CONDENSED CONSOLIDATED BALANCE SHEETS | ||||||||||||
(In thousands) | ||||||||||||
December 28, | June 29, | |||||||||||
2012 | 2012 | |||||||||||
ASSETS | ||||||||||||
Current assets: | ||||||||||||
Cash and cash equivalents | $ | 124,145 | $ | 104,851 | ||||||||
Current portion of restricted cash | 1,290 | 980 | ||||||||||
Accounts receivable, net | 88,636 | 98,293 | ||||||||||
Inventories | 146,897 | 123,391 | ||||||||||
Deferred cost of revenue | 35,301 | 49,407 | ||||||||||
Prepaid expenses and other current assets | 15,228 | 18,443 | ||||||||||
Total current assets | 411,497 | 395,365 | ||||||||||
Non-current portion of restricted cash | 2,957 | 3,088 | ||||||||||
Property and equipment, net | 27,217 | 27,404 | ||||||||||
Intangible assets, net | 6,344 | 8,675 | ||||||||||
Non-current portion of deferred cost of revenue | 10,743 | 17,466 | ||||||||||
Other assets | 45,729 | 44,882 | ||||||||||
Total assets | $ | 504,487 | $ | 496,880 | ||||||||
LIABILITIES AND STOCKHOLDERS' EQUITY | ||||||||||||
Current liabilities: | ||||||||||||
Accounts payable | $ | 58,398 | $ | 69,448 | ||||||||
Credit facility | — | 15,200 | ||||||||||
Accrued compensation | 23,490 | 24,246 | ||||||||||
Other current liabilities | 52,982 | 48,587 | ||||||||||
Current portion of deferred revenue | 170,816 | 124,924 | ||||||||||
Total current liabilities | 305,686 | 282,405 | ||||||||||
Non-current portion of deferred revenue | 53,508 | 64,717 | ||||||||||
Long-term income taxes payable | 17,734 | 20,568 | ||||||||||
Retirement benefit obligations | 11,815 | 11,484 | ||||||||||
Other non-current liabilities | 5,447 | 6,814 | ||||||||||
Total liabilities | 394,190 | 385,988 | ||||||||||
Stockholders’ equity | 110,297 | 110,892 | ||||||||||
Total liabilities and stockholders’ equity | $ | 504,487 | $ | 496,880 | ||||||||
5
6
7
SILICON GRAPHICS INTERNATIONAL CORP. AND SUBSIDIARIES | ||||||||||||||||||||||||
TRENDED FINANCIAL DATA | ||||||||||||||||||||||||
(In thousands, except per share amounts) | ||||||||||||||||||||||||
(Unaudited) | ||||||||||||||||||||||||
Q1 FY12 | Q2 FY12 | Q3 FY12 | Q4 FY12 | Q1 FY13 | Q2 FY13 | |||||||||||||||||||
Revenue | ||||||||||||||||||||||||
Product Revenue | $ | 128,952 | $ | 143,043 | $ | 150,239 | $ | 134,499 | $ | 146,315 | $ | 128,040 | ||||||||||||
Service Revenue | 49,943 | 52,171 | 49,151 | 44,989 | 46,566 | 43,186 | ||||||||||||||||||
Total revenue | $ | 178,895 | $ | 195,214 | $ | 199,390 | $ | 179,488 | $ | 192,881 | $ | 171,226 | ||||||||||||
Cost of revenue | ||||||||||||||||||||||||
Product | $ | 99,767 | $ | 112,316 | $ | 121,263 | $ | 113,800 | $ | 122,597 | $ | 97,350 | ||||||||||||
Service | 26,489 | 30,715 | 26,617 | 28,202 | 28,074 | 26,312 | ||||||||||||||||||
Total Cost of revenue | $ | 126,257 | $ | 143,031 | $ | 147,880 | $ | 142,002 | $ | 150,671 | $ | 123,662 | ||||||||||||
Gross margin by Product and Service | ||||||||||||||||||||||||
Product Gross Margin | 22.6 | % | 21.5 | % | 19.3 | % | 15.4 | % | 16.2 | % | 24.0 | % | ||||||||||||
Service Gross Margin | 47.0 | % | 41.1 | % | 45.8 | % | 37.3 | % | 39.7 | % | 39.1 | % | ||||||||||||
Total gross margin | 29.4 | % | 26.7 | % | 25.8 | % | 20.9 | % | 21.9 | % | 27.8 | % | ||||||||||||
Total operating expenses | $ | 55,006 | $ | 54,131 | $ | 53,001 | $ | 53,122 | $ | 49,203 | $ | 50,444 | ||||||||||||
Net income (loss) | $ | (2,657 | ) | $ | (2,256 | ) | $ | (1,162 | ) | $ | (18,386 | ) | $ | (8,680 | ) | $ | 1,101 | |||||||
Earnings per share | ||||||||||||||||||||||||
Basic net income (loss) per share | $ | (0.08 | ) | $ | (0.07 | ) | $ | (0.04 | ) | $ | (0.58 | ) | $ | (0.27 | ) | $ | 0.03 | |||||||
Diluted net income (loss) per share | $ | (0.08 | ) | $ | (0.07 | ) | $ | (0.04 | ) | $ | (0.58 | ) | $ | (0.27 | ) | $ | 0.03 | |||||||
Shares used in computing net income (loss) per share | ||||||||||||||||||||||||
Basic | 31,303 | 31,604 | 31,783 | 31,947 | 32,166 | 32,410 | ||||||||||||||||||
Diluted | 31,303 | 31,604 | 31,783 | 31,947 | 32,166 | 32,778 | ||||||||||||||||||
8
SILICON GRAPHICS INTERNATIONAL CORP. AND SUBSIDIARIES | |||||||||||||||||||||||||
TRENDED FINANCIAL DATA | |||||||||||||||||||||||||
(In thousands) | |||||||||||||||||||||||||
(Unaudited) | |||||||||||||||||||||||||
Q1 FY12 | Q2 FY12 | Q3 FY12 | Q4 FY12 | Q1 FY13 | Q2 FY13 | ||||||||||||||||||||
Total Revenue | |||||||||||||||||||||||||
Americas | $ | 112,392 | $ | 109,721 | $ | 128,321 | $ | 123,311 | $ | 123,385 | $ | 112,358 | |||||||||||||
APJ | 40,106 | 56,873 | 44,660 | 28,753 | 44,434 | 27,735 | |||||||||||||||||||
EMEA | 26,397 | 28,620 | 26,409 | 27,424 | 25,062 | 31,133 | |||||||||||||||||||
Total revenue | $ | 178,895 | $ | 195,214 | $ | 199,390 | $ | 179,488 | $ | 192,881 | $ | 171,226 | |||||||||||||
Product Revenue | |||||||||||||||||||||||||
Americas | $ | 89,056 | $ | 88,429 | $ | 107,580 | $ | 102,100 | $ | 101,642 | $ | 91,698 | |||||||||||||
APJ | 21,801 | 34,090 | 25,253 | 13,350 | 26,821 | 12,605 | |||||||||||||||||||
EMEA | 18,095 | 20,524 | 17,406 | 19,049 | 17,852 | 23,737 | |||||||||||||||||||
Total product revenue | $ | 128,952 | $ | 143,043 | $ | 150,239 | $ | 134,499 | $ | 146,315 | $ | 128,040 | |||||||||||||
Service Revenue | |||||||||||||||||||||||||
Americas | $ | 23,336 | $ | 21,292 | $ | 20,741 | $ | 21,212 | $ | 21,743 | $ | 20,660 | |||||||||||||
APJ | 18,305 | 22,783 | 19,407 | 15,403 | 17,613 | 15,130 | |||||||||||||||||||
EMEA | 8,302 | 8,096 | 9,003 | 8,374 | 7,210 | 7,396 | |||||||||||||||||||
Total service revenue | $ | 49,943 | $ | 52,171 | $ | 49,151 | $ | 44,989 | $ | 46,566 | $ | 43,186 | |||||||||||||
Operating profit (loss) - GAAP | |||||||||||||||||||||||||
Americas | $ | (133 | ) | $ | 1,868 | $ | (2,083 | ) | $ | (10,346 | ) | $ | 1,576 | $ | 3,055 | ||||||||||
APJ | 78 | 1,883 | 1,749 | (332 | ) | (1,411 | ) | (1,265 | ) | ||||||||||||||||
EMEA | (2,313 | ) | (5,699 | ) | (1,157 | ) | (4,958 | ) | (7,158 | ) | (4,670 | ) | |||||||||||||
Total operating profit (loss) | $ | (2,368 | ) | $ | (1,948 | ) | $ | (1,491 | ) | $ | (15,636 | ) | $ | (6,993 | ) | $ | (2,880 | ) | |||||||
9