Attached files
Table of Contents
UNITED STATES
SECURITIES AND EXCHANGE COMMISSION
Washington, D.C. 20549
FORM 10-K
(Mark One)
| x | Annual Report pursuant to Section 13 or 15(d) of the Securities Exchange Act of 1934 |
For the fiscal year ended June 25, 2010.
| ¨ | Transition report pursuant to Section 13 or 15(d) of the Securities Exchange Act of 1934 |
For the transition period to
Commission File Number 000-51333
SILICON GRAPHICS INTERNATIONAL CORP.
(Exact name of registrant as specified in its charter)
| Delaware | 32-0047154 | |
| (State or Other Jurisdiction of Incorporation or Organization) |
(I.R.S. Employer Identification No.) |
46600 Landing Parkway
Fremont, California 94538
(Address of principal executive offices, including zip code)
(510) 933-8300
(Registrant’s telephone number, including area code)
Securities registered pursuant to Section 12(b) of the Act:
| Title of each class |
Name of each exchange on which registered | |
| Common Stock, $0.001 par value per share | The NASDAQ Stock Market, Inc. |
Securities registered pursuant to Section 12(g) of the Act:
None
Indicate by check mark whether the registrant is a well-known seasoned issuer, as defined in Rule 405 of the Securities Act. Yes ¨ No x
Indicate by check mark if the registrant is not required to file reports pursuant to Section 13 or Section 15(d) of the Act. Yes ¨ No x
Indicate by check mark whether the registrant (1) has filed all reports required to be filed by Section 13 or 15(d) of the Securities Exchange Act of 1934 during the preceding 12 months (or for such shorter period that the registrant was required to file such reports) and (2) has been subject to such filing requirements for the past 90 days. Yes x No ¨
Indicate by check mark whether the registrant has submitted electronically and posted on its corporate Web site, if any, every Interactive Data File required to be submitted and posted pursuant to Rule 405 of Regulation S-T (§ 232.405 of this chapter) during the preceding 12 months (or for such shorter period that the registrant was required to submit and post such files). Yes ¨ No x
Indicate by check mark if disclosure of delinquent filers pursuant to Item 405 of Regulation S-K is not contained herein, and will not be contained, to the best of registrant’s knowledge, in definitive proxy or information statements incorporated by reference in Part III of this Form 10-K or any amendment to this Form 10-K. ¨
Indicate by check mark whether the registrant is a large accelerated filer, an accelerated filer, a non-accelerated filer, or a smaller reporting company. See the definition of “large accelerated filer”, “accelerated filer” and “smaller reporting company” in Rule 12b-2 of the Exchange Act. (Check one):
| Large accelerated filer ¨ |
Accelerated filer x | Non-accelerated filer ¨ | Smaller reporting company ¨ |
Indicate by check mark whether the registrant is a shell company (as defined in Rule 12b-2 of the Exchange Act). Yes ¨ No x
As of December 25, 2009, the aggregate market value of the voting stock held by non-affiliates of the registrant, computed by reference to the last sale price of such stock as of such date on the NASDAQ Global Select Market, was approximately $124,530,691. Excludes an aggregate of 17,224,162 shares of common stock held by officers and directors and by each person known by the registrant to own 5% or more of the outstanding common stock as of December 25, 2009. Exclusion of shares held by any of these persons should not be construed to indicate that such person possesses the power, direct or indirect, to direct or cause the direction of the management or policies of the registrant, or that such person is controlled by or under common control with the registrant.
As of September 1, 2010, there were 30,696,726 shares of the registrant’s common stock outstanding.
DOCUMENTS INCORPORATED BY REFERENCE.
Portions of the registrant’s definitive proxy statement for its 2010 Annual Meeting of Stockholders to be filed with the Commission within 120 days after the close of the registrant’s fiscal year are incorporated by reference into Part III of this report.
Table of Contents
SILICON GRAPHICS INTERNATIONAL CORP.
ANNUAL REPORT ON FORM 10-K
FOR THE YEAR ENDED JUNE 25, 2010
TABLE OF CONTENTS
| Page | ||||
| Item 1. |
2 | |||
| Item 1A. |
17 | |||
| Item 1B. |
32 | |||
| Item 2. |
32 | |||
| Item 3. |
33 | |||
| Item 4. |
34 | |||
| Item 5. |
35 | |||
| Item 6. |
37 | |||
| Item 7. |
Management’s Discussion and Analysis of Financial Condition and Results of Operations |
39 | ||
| Item 7A. |
62 | |||
| Item 8. |
64 | |||
| Item 9. |
Changes in and Disagreements with Accountants on Accounting and Financial Disclosure |
111 | ||
| Item 9A. |
111 | |||
| Item 9B. |
114 | |||
| Item 10. |
115 | |||
| Item 11. |
115 | |||
| Item 12. |
Security Ownership of Certain Beneficial Owners and Management and Related Stockholder Matters |
115 | ||
| Item 13. |
Certain Relationships and Related Transactions, and Director Independence |
115 | ||
| Item 14. |
115 | |||
| Item 15. |
116 | |||
| 117 | ||||
Table of Contents
CAUTIONARY STATEMENT REGARDING FORWARD-LOOKING INFORMATION
This Annual Report on Form 10-K contains forward-looking statements within the meaning of Section 27A of the Securities Act of 1933 and Section 21E of the Securities Exchange Act of 1934. All statements included or incorporated by reference in this Form 10-K other than statements of historical fact, are forward-looking statements. Investors can identify these and other forward-looking statements by the use of words such as “estimate,” “may,” “will,” “could,” “anticipate,” “expect,” “intend,” “believe,” “continue” or the negative of such terms, or other similar expressions. Forward-looking statements also include the assumptions underlying or relating to such statements.
Our actual results could differ materially from those projected in the forward-looking statements included herein as a result of a number of factors, risks and uncertainties, including, among others, the risk factors set forth in “Item 1A—Risk Factors ,”and Item 7—“Management’s Discussion and Analysis of Financial Condition and Results of Operations” in this Form 10-K and elsewhere in this Form 10-K and the risks detailed from time to time in Silicon Graphics International Corp.’s future U.S. Securities and Exchange Commission reports. The information included in this Form 10-K is as of the filing date with the Securities and Exchange Commission and future events or circumstances could differ materially from the forward-looking statements included herein. We assume no duty to update any of the forward-looking statements after the date of this report or to conform these statements to actual results except as required by law. Accordingly, we caution readers not to place undue reliance on such statements.
“Silicon Graphics,” “SGI,” “Eco-Logical,” “RapidScale,” “Roamer,” “CloudRack,” “ICE Cube,” “MobiRack,” “Rackable,” “Altix,” “CXFS,” “NUMAlink,” “Octane,” “Origin,” “REACT,” “SGI FullCare,” “SGI FullExpress,” “SGI Global Developer Program,” “SGI ProPack,” “COPAN” and the “Silicon Graphics” logo are trademarks or registered trademarks of Silicon Graphics International Corp. or its subsidiaries in the U.S. and/or other countries. Other trademarks or service marks appearing in this report may be trademarks or service marks of other owners.
1
Table of Contents
Overview
We are a global leader in large-scale clustered computing and storage, high-performance compute and storage, and data center technologies integrated with a choice of software, customer support services and professional services. We are dedicated to solving the IT industry’s most demanding business and technology challenges by delivering clustered computing and storage solutions, high performance computing and storage solutions, Eco-Logical™ data center solutions, software and services. We develop, market, and sell a broad line of low cost, mid-range and high-end computing servers and data storage as well as differentiating software. We sell data center infrastructure products purpose-built for large-scale data center deployments. In addition, we provide global customer support and professional services related to our products. We enable enterprises to meet their computing and storage requirements at a lower total cost of ownership and provide them greater flexibility and scalability. We are also a leading developer of enterprise class, high-performance features for the Linux operating system that provide our customers with a standard Linux operating environment combined with our differentiated yet un-intrusive Linux capabilities that are designed to improve performance, simplify system management, and provide a more robust development environment.
We pioneered Eco-Logical data center design with innovative technologies in the areas of chassis and cabinet design, power distribution techniques, cooling techniques, and hardware-based remote management capabilities. We refer to these advantages as “Eco-Logical,” a term we trademarked to best describe our environmentally-friendly, efficient products. The term “eco” refers to the fact that our products are environmentally-friendly and efficient, while the term “logical” describes the ability of these products to enable smart, practical solutions for our end users. We offer compute servers using our Rackable™ half-depth rackmount design, enabling back-to-back mounting for higher server density and improved thermal management. We also offer compute servers using our CloudRack™ tray-based design that deliver similar advantages in a front-to-back cooling model. Data center products include ICE Cube™, a modular data center which augments or replaces traditional brick-and-mortar facilities and MobiRack™ for mobile, all-in-one data center capabilities for field deployments.
Our products and services are used by the scientific, technical, and business communities to solve challenging data-intensive computing, data storage and management problems. These problems typically require large amounts of computing power and fast and efficient data movement both within the computing system and to and from large-scale data storage installations. Enterprises have also begun to deploy large-scale computing and storage installations by aggregating large numbers of relatively inexpensive, open-standard modular computing and storage systems. Our end-users employ our systems to access, analyze, transform, manage, visualize and store very large amounts of data in real time or near real time by running low-cost operating systems such as Linux® and Microsoft® Windows® and, we believe, enable enterprises to meet their computing and storage requirements at a lower total cost of ownership and provide enterprises with greater flexibility and scalability. The vertical markets we serve include defense and strategic systems, weather and climate, physical sciences, life sciences, energy (including oil and gas), aerospace and automotive, media and entertainment, semiconductor design, manufacturing, financial services, data centers, and business intelligence and data analytics.
Applications for our systems within these vertical markets include simulating global climate changes, accelerating engineering of new automotive designs, supporting homeland security initiatives, providing real-time fraud detection, streaming media from Internet-video to film and gaining business intelligence through data-mining. Our global services organization facilitates rapid installation and implementation of our products, assists in optimizing the use of our products, maintains their availability to serve our customers and educates customers to increase productivity.
From developing custom semi-conductors to data center solutions, we differentiate by scaling for compute and data intensive workloads of our customers’ most demanding applications. We have 1,325 employees
2
Table of Contents
worldwide, which consist of 1,264 full time employees and 61 temporary or contract employees. We sell and market our systems, technologies, software, and services, to enterprises in 26 countries through our direct and indirect sales force including original equipment manufacturers, system integrators and value added resellers. In the year ended June 25, 2010, six-months ended June 26, 2009, and the year ended January 3, 2009, international sales were approximately 25%, 25% and 8%, respectively, of our total revenue.
Acquisition of Silicon Graphics, Inc.
On May 8, 2009 (the “Closing Date”), we completed the acquisition of substantially all of the assets of Silicon Graphics, Inc. (“Legacy SGI”), excluding certain assets unrelated to the ongoing business, including certain of Legacy SGI’s non-U.S. subsidiaries and operations and assumed certain liabilities (together, the “Net Assets”). The acquisition was consummated pursuant to the terms of an Asset Purchase Agreement dated as of March 31, 2009 and as amended on April 30, 2009 (as amended, the “Agreement”). As Legacy SGI and certain of its affiliates had filed bankruptcy petitions and motions for voluntary Chapter 11 reorganization, the Agreement was subject to the approval of the United States Bankruptcy Court for the Southern District of New York (the “Bankruptcy Court”). On April 30, 2009, the Agreement and the transactions contemplated thereby were approved by the Bankruptcy Court, allowing us to complete the acquisition under Section 363 of the U.S. Bankruptcy Code. Under the terms of the Agreement, we acquired the Net Assets for a purchase price of approximately $42.5 million in cash.
Change in Corporate Name and Trading Symbol
We were originally incorporated as Rackable Corporation and later changed to Rackable Systems, Inc. On May 18, 2009, we changed our name to Silicon Graphics International Corp. (“SGI”) and changed our NASDAQ stock ticker symbol from “RACK” to “SGI.”
Change in fiscal year
On June 19, 2009, the Board of Directors approved a change in our fiscal year end from the Saturday closest to December 31st of each year to the last Friday in June of each year. As a result of this change, we had a six month transition period beginning on January 4, 2009 and ending on June 26, 2009, consisting of 25 weeks. Accordingly, our fiscal year 2010 began on June 27, 2009 and ended on June 25, 2010.
Included in this report are our consolidated balance sheets as of June 25, 2010 and June 26, 2009, the consolidated statements of operations, statements of stockholders’ equity, and cash flows for the 52-week fiscal year ended June 25, 2010 (“2010”), 53-week fiscal year ended January 3, 2009 (“2008”), and 52-week fiscal year ended December 29, 2007 (“2007”), and the 25-week, six month transition period ended June 26, 2009.
Segment Information
Our operating segments are determined based upon several criteria including: our internal organizational structure; the manner in which our operations are managed; the criteria used by our Chief Executive Officer, the Chief Operating Decision Maker (“CODM”), to evaluate segment performance; and the availability of separate financial information. Our business is organized as two operating segments, products and services. Due to their similar economic characteristics, production processes, and distribution methods, we group the product lines as the product operating segment and service offerings as the service operating segment. Our CODM reviews financial information presented on a consolidated basis, accompanied by disaggregated information about revenue by product and service for purposes of allocating resources and evaluating financial performance. The products and services metrics are derived on a contractual basis.
Our product revenue is comprised of sales of our broad line of low-cost, mid-range and high-end scale-out and scale-up servers and data storage solutions, as well as sales of a variety of software products that increase the efficiency, performance, and manageability of the systems or software applications for server and storage management. Our servers and data storage solutions are based on the Intel® Xeon® processors, industry standard graphics processors, and the Linux or Microsoft® Windows® operating systems. Our servers include products
3
Table of Contents
sold under the Altix® Supercomputer, Altix ICE Clusters, CloudRack, and Rackable Rackmount server brand names. Our data storage solutions are sold under the SGI InfiniteStorage and COPAN™ brand names.
Our service revenue is comprised of sales from two types of services: customer support services and professional services. Our customer support organization provides ongoing maintenance and technical support for our products and some third party products, as well as contracted maintenance services, hardware deployment services (install and de-install), time and materials-based services and spare parts. Our professional services organization provides technology consulting, project management, managed services, customer education, and third-party products needed to complete customer installations, all of which help our customers realize the full value of their information technology investments.
During the year ended June 25, 2010 and the six months ended June 26, 2009, product revenue represented approximately 63% and 76% of total revenue, respectively, and service revenue represented approximately 37% and 24% of total revenue, respectively. Prior to the acquisition of Legacy SGI, service revenue was immaterial; therefore, the years ended January 3, 2009 and December 29, 2007 have not been presented to reflect the new operating segments.
Customers
For the year ended June 25, 2010, Amazon accounted for approximately 20% of our revenue. For the year ended January 3, 2009, Amazon and Microsoft accounted for approximately 35% and 14% of our revenue, respectively. For the six months ended June 26, 2009, Amazon and Microsoft accounted for 30% and 13% of our revenue, respectively. No other customers accounted for more than 10% of our revenue for years ended June 25, 2010, January 3, 2009, and December 29, 2008 and the six months ended June 26, 2009. Our sales to the U.S. government, which have been historically less than 10% of our revenues, are made to and through numerous government agencies and to integrators and resellers that work with those agencies.
Information regarding revenue and operating profit by reportable segments and revenue from our customers and long-lived assets by geographic region is presented in Note 20 to the consolidated financial statements included in Part II, Item 8 of this Report and in “Management’s Discussion and Analysis of Financial Condition and Results of Operations” in Part II, Item 7 of this Report.
Products
We provide a broad line of products designed to address the demands of technical computing and data management applications. These products allow our customers to run data-intensive applications rapidly and to store their data. Our core products are computing systems and storage products based on the Intel Xeon processors and the Linux or Windows operating system. Our storage product lines integrate disk systems, ranging from entry-level disk arrays to complex storage systems.
Our products predominantly utilize a software environment that is based on the industry-standard Linux operating system and comprehensive data management tools, as well as open source software and our own execution, development and administrative tools and utilities. We believe that our integrated software stack and the features of our architecture and hardware differentiate our product offerings in performance and ease of use. Our products can be customized to meet end-user requirements and were developed to permit easy hardware and software installation, both to add capacity and to take advantage of future technology advances.
We design our products for performance, quick deployment, efficient operation, high system availability and efficient serviceability. Our servers incorporate premium quality components, selected for superior functionality and reliability. In addition, we design our systems to minimize the number and complexity of interconnects for power and data transfer in order to improve reliability, speed of implementation and serviceability.
4
Table of Contents
We group our products into six categories: Scale Up Servers, Scale Out Servers, Workgroup Servers, Data Storage Systems, Software, and Data Center Infrastructure:
Scale Up Servers:
| • | Altix® UV: SGI Altix UV targets high-end supercomputing, large-scale databases and data analytic environments. SGI Altix UV leverages next generation Intel® Xeon® x86 processors to deliver the fastest and most scalable shared memory supercomputer in the world. Altix UV enables scaling from 32 to 2,048 processing cores with architectural provisioning for up to 262,144 cores, while supporting up to 16 terabytes of global shared memory in a single system image (SSI). Superior performance is built into every SGI Altix UV system, leveraging our high speed 15 gigabytes per second interconnect NUMAlink® 5 and MPI Offload Engine (MOE) acceleration. Based on open standards, the system’s x86 architecture leverages quad-, six- or eight-core Intel® Xeon® 7500 series processors. This allows for the use of completely unmodified Novell® SLES® or Red Hat® Enterprise Linux® server operating systems. Altix UV is ideal for open source, custom and commercial applications, ranging from technical computing applications like ANSYS FLUENT to enterprise applications like Oracle. |
| • | Altix® 450/4700: Altix 450 and 4700 are our prior-generation Intel® Itanium processor based scale-up supercomputing systems. Altix 450 scales from 2 to 38 processors (4 to 76 cores) and up to 864 gigabytes of globally addressable memory. Altix 4700 scales from 2 to 512 sockets (4 to 1024 cores) and up to 128 gigabytes of globally addressable memory. Both models are supported by a complete technical computing solution stack running on industry-standard Linux® operating systems with the choice of Novell® SUSE® LINUX Enterprise Server or Red Hat® Enterprise Linux® Advanced Server operating systems. |
Scale Out Servers:
| • | Rackable (including Altix® XE servers): Rackable servers are comprised of industry-standard rackmount compatible form factors and are available in both half-depth and standard-depth form factors. Our flagship half-depth servers are high-density, rack-mounted systems designed specifically for large-scale data center environments. This line of servers utilizes our half-depth, back-to-back chassis design to increase physical server density, reducing floor space requirements. When deployed in our cabinets, we are generally able to offer approximately twice the server or processor density of traditional rack-mount solutions. We provide a range of power and heat management techniques that enable our servers to operate effectively at these density levels. These servers also provide configurable components, front-facing cable connections for enhanced serviceability and remote management functionality either based on our proprietary Roamer™ or industry-standard IPMI-based technologies. Our standard-depth servers consist of several models marketed under the Rackable and Altix® XE brands. These models leverage reseller and OEM relationships from companies such as SuperMicro Computer, Inc. Standard-depth servers are generally deployed in situations requiring redundant power supplies and/or installation into existing third-party racks with front-to-back cooling (also known as “hot-aisle/cold-aisle” deployments). The standard-depth servers offer a broader range of add-in card or disk drive expansion options than what can be accommodated in our half-depth offerings. They are also used in conjunction with our other scale-up and scale-out computing systems as management nodes. |
| • | CloudRack™: Sold as a rack-level solution, CloudRack C2 cabinets support up to 38 trays—a proprietary, coverless form factor that yields a high degree of flexibility and server density while conforming to industry-standard hot-aisle/cold-aisle data center environments. In addition to improved serviceability due to easy access to server components, the tray form factor enables CloudRack to be optimized for use of open-standard components at the motherboard, processor, Dynamic Random Access Memory (“DRAM”) and disk drive level. CloudRack’s advanced thermal design eliminates all cooling fans at the server level, instead relying on larger cabinet-level cooling technology. This increases reliability while reducing power consumption. This design offers advantages for many data |
5
Table of Contents
| center environments, especially those focused on cloud computing. We also offer CloudRack X2 which supports up to nine trays in an industry-standard rackmount enclosure. |
| • | Altix® ICE: Altix ICE 8400, with its innovative blade design and quad data rate InfiniBand® interconnect, is our primary scale-out solution for large technical computing clusters. Altix ICE makes it easy to affordably scale up to 65,536 compute nodes. Its open x86 architecture makes it equally simple to deploy commercial, open source or custom applications on completely unmodified Novell® SLES® or Red Hat® Enterprise Linux® operating systems. In addition to support for Intel® Xeon® 5500 and 5600 series processors, we also announced our intention to release blades supporting AMD® Opteron™ processors starting the first quarter of fiscal year 2011. |
Workgroup Servers:
| • | Origin® 400: First introduced in March 2010, Origin 400 is an integrated workgroup blade system that features compute and storage area network (SAN) storage functionality, making it ideal for remote offices and small to medium-sized enterprises. Origin 400 delivers highly differentiated enterprise features, such as virtualization capabilities that provide maximum flexibility and eliminate the need to over invest in hardware. Extensive software certifications, including VMware®, Linux®, SAP®, Microsoft® Windows®, Microsoft® Exchange and Microsoft® SQL Server®, ensure suitability for a large number of applications. Origin 400 is a single platform that functions seamlessly as a web server, applications server, email server and backend database server. It addresses a variety of enterprise verticals, including regional healthcare, education, local government, retail, software development, call centers, community banking, accounting and legal. |
| • | Octane™ III: Octane III is our first personal supercomputer, taking high-performance computing to a new level by combining the immense power and performance capabilities of a high-performance desk side cluster with the portability and usability of a workstation. Octane III is uniquely suited for workplace environments and supports a vast range of distributed technical computing applications. Octane III is office-ready with a pedestal, one-by-two foot form factor, whisper-quiet operation, easy-to-use features, low maintenance requirements and support for standard office power outlets. While a typical workstation has only eight cores and moderate memory capacity, the superior design of the Octane III permits up to 120 high-performance cores and nearly 1 terabyte of memory for unparalleled performance. |
Data Storage Systems:
Our InfiniteStorage product line is comprised of direct attached storage (DAS), SAN, and network-attached storage (NAS), solutions designed to meet the needs of technical and cloud computing and persistent data.
| • | EBOD: Our expansion bunch of disk (EBOD) products are available in both half-depth and full depth configurations in order to maximize density, performance and capacity, depending on our customer needs. |
| • | Storage Servers: Leveraging our unique server expertise and adding high performance input/output (“I/O”) capabilities, the Storage Server line-up is composed of both half-depth and full-depth servers. Scaling from 8 to 36 drives per server, and with a wide variety of network interfaces, this product line is the foundation for many of our storage solutions, which combines hardware and software to offer differentiated solutions that address core customer needs. |
| • | Entry Level RAID: Our Entry Level redundant array of independent disk (RAID) products are focused on delivering a high price/performance ratio. Easily deployable, this line of products works equally well for small work groups, small to medium size enterprises and small data centers. With a wide range of host interfaces and feature functionality, this product line offers customers flexibility to tune their storage array to their exact requirements. |
6
Table of Contents
| • | Enterprise RAID: Our InfiniteStorage 4000 series of RAID systems meets the reliability, availability and serviceability requirements for Enterprise data storage needs. Scalable up to 480 disk drives, this family of products features both robust hardware and copy feature services such as Snap Shot and Remote Mirroring, enabling data protection and disaster recovery strategies. |
| • | InfiniteStorage SP Line: Introduced in May 2010, the InfiniteStorage Select Product (“SP”) line was specifically introduced to meet the need of heterogeneous environments and the need to integrate tightly with common enterprise applications. With plug-ins for applications like Oracle, VMware and Microsoft Exchange, the InfiniteStorage SP line seamlessly integrates into a wide variety of environments. |
| • | HPC RAID: Our InfiniteStorage 6120 and 15000 are designed to meet the high performance and capacity requirements found in typical high performance compute (“HPC”) workloads. Offering scalability to 1,200 disk drives, guaranteed latency and extremely high bandwidth, our HPC RAID systems are suitable for the requirements of digital media, supercomputing, life sciences and remote sensor acquisition. |
| • | NAS products: We offer two distinct NAS solutions. First is our File Serving solution, which is a scalable high performance file serving solution focused on low cost performance and serving over high performance networks such as InfiniBand. Second is our NAS line of network file solutions which is focused equally on high performance and enterprise data protection requirements. Both of these solutions serve as gateways in front of the SGI InfiniteStorage RAID systems mentioned above. |
| • | MAID Systems: In February 2010, we acquired COPAN Systems, Inc. (“COPAN”) and its massive array of idle disks (“MAID”) storage platform. Intended to address the needs of long-term data storage in organizations, the COPAN platform is purpose built to meet persistent data handling requirements. Key to this is the ability to take disk drives completely off-line, thereby providing significant cost savings on power and cooling. In addition, COPAN’s unique packaging enables density levels unseen in typical RAID systems. The COPAN systems are available in both VTL (virtual tape library) and native MAID (disk target) configurations. In June 2010, we announced plans to deliver the next generation of COPAN platforms, significantly improving performance and increasing the number of drives that can be initiated at any one time to 50% of the array. |
Software:
Our software stack for technical computing runs on standard, unmodified distributions of Novell® SLES® or Red Hat® Enterprise Linux® server operating systems. We also sell and support Novell® SLED®, Red Hat Enterprise Linux Desktop, Microsoft Windows Server 2008 and 2008 R2, Microsoft HPC Server 2008, and Microsoft Windows 7 on selected systems. We also certify selected servers for use with VMware ESX.
| • | SGI Management Center: SGI Management Center is the current generation of our system management software drawing on our expertise in providing the highest performance and ease of use on cluster and single system image systems. It provides a consistent management interface and workflow for all SGI systems, with support for Altix ICE systems expected to be introduced in Fall 2010. SGI Management Center is a full remote system management console with an advanced graphical user interface (GUI) which monitors essential system metrics and initiates management actions from a single point of control. SGI Management Center is designed to reduce the time and resources spent by customers administering their systems by streamlining software maintenance procedures and automating repetitive tasks. The comprehensive features of SGI Management Center are designed to lower customer’s cost of operation, increase productivity, and provide for optimal use of our systems. |
| • | SGI ProPack™: SGI ProPack for Linux improves performance and provides key additional capabilities for developers of technical computing applications on all of our systems supported on standard Linux distributions. SGI ProPack for Linux provides features that accelerate applications, enable development of parallel and real-time applications, and manage system resources for SGI’s large scalable servers, |
7
Table of Contents
| clusters and storage. SGI ProPack includes such components as the SGI Message Passing Toolkit (MPT) for very high levels of scalability and performance of MPI applications on our systems, the SGI MPI PerfBoost which accelerates applications written for third-party MPI libraries on SGI systems, the SGI REACT™ for Linux hard real-time performance, and many other run-time and compile-time tools in a single software library. |
| • | SGI® Tempo: SGI Tempo is cluster management software which enables administrators to install, configure, provision, and manage an SGI Altix ICE from a single rack to thousands of nodes. SGI Tempo cluster management software is designed for rapid deployment, efficient scaling, and reliable operations in the most demanding technical computing data centers. While leveraging available open source tools for familiar cluster operations, it also provides a scalable and reliable hierarchical management framework (HMF) which speeds deployment while improving performance and resiliency of the management functions. In addition, SGI Tempo provides an innovative approach to diskless boot operations which reduces overall memory capacity requirements for diskless servers and increases reliability of the compute node by alleviating the need for a local hard drive which is a common failure component. |
| • | SGI Foundation Software: SGI Foundation Software is our suite of support tools and utilities that enable our servers to run more reliably, with improved support, and enable new server capabilities. SGI Foundation software includes key capabilities to monitor and proactively manage memory component failures in our servers, which minimizes or eliminates impact of these failures on system users. SGI Foundation Software also includes customized simple network management protocol (“SNMP”) interfaces for many of our systems, allowing them to interface easily to Enterprise Management Systems. |
| • | DMF: Our Data Migration Facility (DMF) creates and automatically manages a tiered virtual storage environment that significantly reduces customer equipment and operating costs, improves service levels and lowers customer data risks. DMF incorporates industry leading features such as automatic data migration, automatic data recall, file and volume level migration policies, custom migration policies through user-defined plug-ins, accelerated data access, partial file migration and recall, Active Backup, GUI-based administration and tape library management. Currently, DMF is deployed at customer sites managing multiple petabytes of data, nearly one billion files, and runs storage devices at their maximum rated speed. DMF operates in the background so there is no interruption or degradation of service to end users and applications. |
| • | CXFS™: Our CXFS software provides no-compromise data sharing, enhanced workflow, and reduced costs in data-intensive environments. It eliminates file duplication and the time it takes to move large files over networks. CXFS significantly boosts productivity where large files are shared by multiple processes in a workflow. Because it uses a SAN infrastructure, CXFS delivers much greater I/O performance and bandwidth than any network data-sharing mechanism, such as network file system (“NFS”) or common internet file system (“CIFS”). |
Data Center Infrastructure:
| • | ICE Cube: In March 2007, we launched and sold our first modular data center, which is a self-contained, portable data center featuring extreme server and storage density with highly efficient cooling and serviceability. Later that year, we released the newest generation of the product, known as “ICE Cube.” Designed to augment or replace traditional brick-and-mortar data centers of any size, ICE Cube features density levels of up to 46,080 processing cores in a forty feet-by-eight feet container, or up to 29.8 petabytes of storage and is ideal for data centers facing power and space limitations. Our introduction marked the first-ever known deployment of a modular data center, and we are seeing strong interest in this model given the growing challenges many large-scale data centers face today around power, cooling and space. In May 2010, we introduced six new models, including universal models that support all of our server and storage products in addition to wide support for rackmount systems from other vendors. |
8
Table of Contents
| • | MobiRack: MobiRack is a line of mobile, all-in-one data center cabinets designed for field deployments. |
In addition to selling these products to customers, we also make select products available through Cyclone™, our Cloud Computing offering. A customer using Cyclone pays for access over the Internet to our high performance computing servers and attached storage systems on a per core hour basis.
Global Services
Our global services organization is comprised of customer support services and professional services which function as a single business unit. Both customer support services and professional services develop and implement complete services solutions for our customers, as well as provide a complete suite of support and maintenance offerings to address the requirements and business strategies of our customers, distributors and resellers.
Our global services organization offers market competitive warranties, from one (1) to three (3) years and warranty upgrade options for products sold by our internal direct sales team and approved distributors and resellers. The global services organizations use existing processes, tools and services in order to leverage our existing investments and capabilities that work within our current environment. We are committed to fulfilling all contractual service level agreements to meet our customer’s maintenance and support requirements ranging from SGI® FullCare 8x5™ support to the SGI® FullExpress™ 24X7 for the most mission critical environments. Our support services may include hardware and software maintenance in support of our systems, installation project management, system installation, spares management, site preparation and technical training for our systems as well as all software upgrades and updates. Delivery of services may also be provided using our approved distributors and resellers or other approved third-party providers.
Customer Support. Our customers may purchase customer support services that include various levels of support. We offer several levels of support that vary depending on specific services, response times, coverage hours and duration. In addition to our standard offerings, our customer support services provide a potential competitive advantage due to our long term relationships with our customer base as well as the expertise of our systems engineers. This enables us to leverage our high quality service personnel and strong customer relationships to also offer multi-vendor support as part of our standard service offerings. Upon the acquisition of Legacy SGI, we consolidated the support programs to now offer a single comprehensive suite of support programs for all of our customers.
Professional Services. Our professional services group provides fee-based consultative services to our customers and system integrators. We architect, design, implement, and manage or assist with the management of complex, complete solutions for our customers’ information technology infrastructure. Our engagements are used to ensure customer success with our product and technology. This is done with custom time and materials or fixed price contract consulting services, through standard installation and value-add services offerings, and through long-term on-site staff augmentation services. We also obtain and integrate third party hardware and software products into solutions we sell and implement for our customers and system integrators. Through our on-site staff augmentation services, we develop and maintain long-term relationships with our customers which allow us to more closely understand their IT requirements.
Sales and Distribution
We sell our systems and services primarily through our direct sales force and distributors, system integrators, value-added resellers, OEMs and channel partners. Our sales teams consist of sales representatives and sales engineers, who are supported by channel, inside sales, sales support and professional services personnel. Our professional services and engineering personnel collaborate with our sales teams in all stages of the sales and integration process, including developing proposals that address the technical requirements of our customers, performing proofs of concept and benchmarking system performance.
9
Table of Contents
By selling our products through our direct sales team, we are able to maintain close client contact and feedback throughout the entire sales process. Our sales process begins with leads generated through targeted marketing programs and by our inside sales team, which are then logged, qualified and assigned to an account executive. After an initial lead qualification, our sales executives and sales engineers collect information regarding the customer’s data center environment and application requirements. We then collaborate with the customer’s technical point of contact and our own internal technical resources to agree upon a particular system configuration for the customer. For larger customers, we allow evaluation of one or more hardware configurations to enable the customer to conduct their own benchmarking analyses. While we tailor solutions for most customers, there is substantial commonality in underlying components, so we are able to mitigate the impact on our manufacturing and sourcing operations.
We currently have direct sales personnel in 19 countries—the United States, United Kingdom, Germany, Australia, France, China, India, Czech Republic, Canada, Spain, Israel, Netherlands, Brazil, Italy, Sweden, Singapore, Switzerland, Malaysia and Austria. We augment our sales coverage with indirect coverage via distributor and channel partner arrangements in countries in which we have a presence. We are engaged in a multi-year program to further develop additional channel partner relationships in order to improve our indirect sales efforts, expand our customer base and enter new markets. Our direct sales personnel are responsible for managing all direct or indirect sales with specific named accounts and our channel sales personnel are responsible for managing all sales that are not with specific named accounts.
In our largest markets, our sales representatives have a vertical market focus to more effectively leverage their domain expertise. We establish direct sales groups focused on different segments. One group concentrates on the defense and intelligence, scientific research and higher education markets while the second focuses on the commercial business intelligence and data analytics market. We have developed expertise in a number of vertical market segments, including weather and climate; physical sciences; life sciences; energy, aerospace and automotive; financial services; internet and media and entertainment. In support of this increased vertical market segment sales focus, we have begun a program to identify typical customer workflows in each vertical market segment in order to configure standard solutions offerings that include our hardware, software, storage and professional services.
We have increased our sales and marketing efforts recently in the commercial business intelligence and data analytics markets in an effort to expand our penetration of these markets. We also intend to expand our targeted customer base to include all organizations with technical computing requirements, the largest firms through our direct selling force and the more modest sized regional firms through our channel partners. Our channel program is designed to work with those partners who provide additional geographic and vertical market coverage for SGI-based solutions. We have created a channel council to increase communication between channel partners and our executive team in order to guide this program.
We will work with customers to arrange financing options through lease transactions with third-party financial institutions and assist in the remarketing of off-lease systems.
Marketing
Our marketing organization is active in all markets in which we sell products and services and continuously executes on programs that encompass sales tools, brand awareness, and demand generation. The marketing team consists of product marketing, field marketing, corporate marketing, and channel marketing. In order to drive market demand, we create and deliver on a number of marketing vehicles including industry and customer events, webinars, case studies, advertisements and white papers to showcase and demonstrate the capabilities of our systems. Our marketing channels include a mix of product-based marketing activities which leverage our hardware and software expertise and our industry-based activities which leverage our deep understanding of customer challenges and applications. Our marketing team also works with industry experts, analysts and members of the press to generate awareness about our products and services. Using our history and experience in
10
Table of Contents
the technical computing community, we issue white papers on technology trends such as performance ratings, benchmark results, power, cooling and system management. As both exhibitors and speakers, we participate in over 50 events worldwide on an annual basis, thereby maintaining a constant presence with our customers, prospects, and industry influencers.
We maintain active programs to encourage independent software development on our differentiated platforms. Through our Solution Network Program™, we provide software, marketing support and access to hardware to attract and enable software developers to leverage the differentiations in our hardware and software products in their applications and hence add value to our customers. This program includes the key Independent Software Vendor’s (“ISV”) covering all our target market segments and provides technical information to ISVs for developing, porting, tuning and differentiating their applications and opportunities for promoting their SGI-based solutions. We also engage in co-marketing activities with many of our ISVs.
We also develop co-marketing partnerships with our major customers and suppliers. We provide and maintain a comprehensive channel portal and marketing program, which provides significant marketing support to an active and established base of channel partners worldwide.
Research and Development
Our research and development organization includes hardware design engineers, software architects and developers, and storage engineers. We focus our research and development efforts where we believe differentiation from a standard component, product or technology holds the highest potential for increasing our market share. These include shared memory computing system architecture; integrated system implementation optimized for space, power, performance, reliability and usability; the Linux development and operating environment; software to exploit the differentiated features of our computing platforms; and storage software to enable better performance, scalability and ease of management of large amounts of data. We have developed cooperative working relationships with many of the world’s most advanced technology companies, such as AMD and Intel, to leverage their research and development capabilities. Additionally, we work closely with our customers to develop product innovations and incorporate these into subsequent product design. This cooperative approach allows us to develop products that meet our customers’ needs in a cost-effective manner. We monitor new technology developments, new component availability, and the impact of evolving standards through customer and supplier collaboration. From time to time, we accept third-party funding, provided the work being funded is consistent with and contributes to our strategic roadmap.
UV System development. We have invested significantly in the development of application-specific integrated circuits (ASICs) and interconnect technology in order to create next-generation shared-memory systems. We have recently completed the introduction of the Altix UV shared-memory system based on the fifth-generation of our NUMAlink interconnect and NUMAflex architecture. This architecture is intended to increase substantially the performance and scalability of our single system image shared-memory products, as well as to incorporate hybrid processing elements and provide optimized features to enhance application performance on a cluster computing system. We are currently developing the sixth-generation of this same architecture.
System architecture and hardware design. We also recently introduced the Altix ICE 8400, which offers superior system configuration flexibility and is based on InfiniBand interconnect. We continue to emphasize scalability, extremely dense packaging, dramatic power and thermal efficiency, enterprise-class reliability, availability and serviceability features, impressive configurability, and strong interoperability in our designs. We expect these design efforts to enable us to introduce products that reach broader market segments.
Software. Our research and development efforts include the development of software tools and utilities that facilitate more efficient management and operation of our systems as well as enable software applications to run faster on our systems. In addition, we continue to enhance our software development and operating environments. Our experience in creating and implementing complex systems benefits our development of
11
Table of Contents
new tools. Leveraging this experience, we have developed the SGI Management Center as a means for accelerating results. SGI Management Center is a premier software environment for high performance technical computing. It is a complete, integrated environment from desk side to supercomputer. It consists of extensible SGI software based on open standards and services that improve the productivity of users, developers, and system administrators.
Storage. We develop software for file serving, data management and energy efficient data archival for petascale environments. We select “best-in-class” storage hardware, including disk arrays and controllers from OEM suppliers that meet the particular needs of our customers’ applications and environments. Our engineers design software for efficient data access and management of these storage systems and we qualify storage systems ranging from small appliances to enterprise-class storage systems. We strive to tightly integrate the storage software and the hardware systems. We optimize the software that we include in our storage solutions for capacity-driven and performance-driven applications and environments.
Modular Data Center. We have revolutionized data center design principles through the development of ICE Cube. ICE Cube meets the need for data center facility capacity with a just-in-time approach, minimizing up-front costs. Our engineers have designed multiple container models to provide the configurability to address varying IT and site requirements—all while delivering extraordinary density levels of up to 46,080 computational cores or 29.8 petabytes of data storage per container. We have designed ICE Cube models to accommodate varying types of IT equipment with ease, including third-party equipment as well as SGI server and storage systems. These many advantages make ICE Cube the ideal data center solution for a wide range of deployment scenarios, augmenting or replacing traditional data centers of any size.
Through our global benchmarking center and our solutions center, we provide access to a full range of our server, storage hardware and software, integrated in a wide variety of configurations, for application testing, benchmarking and performance tuning by end-users. At these centers, our personnel, including our application benchmarking team and domain, algorithm, technical computing and facility experts, work with end-users to build and optimize large-scale cluster computing systems, conduct proof-of-concept testing and simulate end-user environments. Through these centers, we also provide demonstrations of the standardized SGI workflow solutions that we have developed and are developing for their vertical markets. In addition, our global developer program provides ISVs, systems integrators and consultants technical information for developing and porting their applications, as well as access to our online systems to streamline the implementation.
During the years ended June 25, 2010, January 3, 2009, and December 29, 2007, and the six months ended June 26, 2009, our research and development expenses were $56.9 million, $14.9 million, $13.8 million, and $10.7 million, respectively, representing 14%, 6%, 4%, and 10% of total revenue in each respective period. During the year ended June 25, 2010 and the six months ended June 26, 2009, we received $2.0 million and $0.9 million, respectively, in third-party funding which offset a portion of our research and development expenses. During the years ended January 3, 2009 and December 29, 2007, we did not receive any third-party funding.
We believe that focused investments in research and development are critical to our future performance and competitiveness in the marketplace. Our investments in this area will directly relate to enhancement of our current product line, development of new products that achieve market acceptance, and our ability to meet an expanding range of customer requirements. As such, we expect to continue to spend on current and future product development efforts.
Manufacturing and Operations
Our sole manufacturing facility, located in Chippewa Falls, Wisconsin, is responsible for worldwide production, supply-chain management and order fulfillment. Our manufacturing operations involve the on-site assembly and testing of high-level subassemblies, subsystems and complete systems, configured to customer
12
Table of Contents
specifications. We subject complete systems to environmental and functional testing prior to shipment. Our consolidated worldwide manufacturing operations increase our control over our supply chain and our inventories.
Our supply base is composed of suppliers that meet our rigorous quality and technology standards. We maximize the use of industry-standard components in our products to reduce cost, and we custom design components where we believe that doing so adds value to the customer. We have established close relationships with key suppliers and work closely with them on new product introduction plans, strategic inventories, and internal and external manufacturing schedules and levels. Consistent with industry practice, we acquire components through a combination of formal purchase orders, supplier contracts and open orders based on projected demand information. These purchase commitments typically cover our requirements for periods ranging from 30 to 120 days.
Competition
The server and storage markets are highly competitive, with rapid technological advances and constantly improving price/performance ratios. These advances and pricing pressures result in frequent product introductions and short product life cycles. We believe that purchasers make buying decisions based on many factors, including: product quality and reliability, ease of system management, application availability, price/performance ratios, software functionality, product features, total cost of ownership, and quality customer service and support. We believe we compete effectively in each of these areas by providing differentiated products and services that address the needs of our customers.
The market for our products is highly competitive, rapidly evolving and subject to changing technology, customer needs and new product introductions. In the server market, we compete primarily with large and build-to-order vendors of x86 servers based in the United States, such as Dell Inc. (“Dell”), Hewlett-Packard Company (“HP”), International Business Machines Corporation (“IBM”), and Oracle Corporation (“Oracle”). In the storage market, we compete primarily with EMC Corporation (“EMC”), NetApp Inc. (“NetApp”) and Hitachi Data Systems, Inc. (“HDS”). In all of our markets we compete principally on the basis of product features and performance, build-to-order capabilities, total cost of ownership, customer service, configurability and manageability and the ability to deliver environmentally friendly solutions. The ability of competitors to leverage multiple business lines, which we do not offer, allows them to target customers with benefits and deeper discounted pricing. Also, as we continue to enter international markets, we anticipate facing additional competition from foreign vendors.
Our largest competitors have far greater resources, greater name recognition, larger customer bases and greater financial, technical, sales and marketing resources. For the largest systems in the supercomputing category, our principal competitor is IBM. We also compete with other systems manufacturers and resellers of systems based on x86 class processors with our CloudRack, Rackable and Altix ICE product lines. Because a computing system is a substantial investment that can require extensive service and support commitments, our smaller size can have a significant competitive impact. In some instances, the diversified business of our competitors can support deep discounting to gain market share in the technical computing market. In addition, particularly in the storage market, there are many new companies that are competing with us and rapidly introducing new products and technology.
Proprietary Rights and Licenses
We rely on a combination of patent, trademark, copyright and trade secret laws and disclosure restrictions to protect our intellectual property rights. We also enter into confidentiality and proprietary rights agreements with our employees, consultants and other third parties. We currently have issued and have pending approximately 600 U.S. patents in the United States and abroad, and we intend to continue to protect our intellectual property with patents. We also hold various U.S. and foreign trademarks as well as copyrights in our original software. Although we believe the ownership of patents, copyrights, trademarks and service marks, and trade secrets is an
13
Table of Contents
important factor in our business and that our success depends in part on ownership rights, we rely primarily on the innovative skills, technical competence, and marketing abilities of our personnel to differentiate our products and services within the marketplace.
As is customary in our industry, we license from third parties a wide range of software, including the Linux, Microsoft CCS and UNIX operating systems, for internal use and use by our customers. We also license various patents and trade secrets of third parties through agreements such as patent or technology licenses or cross-licenses. In some cases, our intellectual property is licensed to third parties.
Our success will depend in part on our ability to protect our intellectual property portfolio and proprietary information. From time to time, we may need to enforce our intellectual property rights through litigation. If a claim is asserted that we have infringed the intellectual property rights of a third party, we may be required to seek licenses under those intellectual property rights, if available, pay damages and/or redesign our products. If we were to litigate, we would incur significant costs, litigation may be a significant distraction for our management team, and we might not ultimately prevail. Litigation or changes in the interpretation of intellectual property laws could expand or reduce the extent to which we or our competitors are able to protect intellectual property and could require significant changes in product design. Because of technological changes and the extent of issued patents in our industry, it is possible certain components of our products and business methods may unknowingly infringe existing patents of others. Our industry has seen a substantial increase in litigation with respect to intellectual property matters, and we have been engaged in intellectual property disputes as a defendant as well as in an effort to protect our rights. We expect that we will engage in patent infringement litigation from time to time. See Part I, Item 1A. “Risk Factors” in this Annual Report on Form 10-K.
Backlog
We manufacture products based on a combination of specific order requirements and forecasts of our customers’ demand. Orders are generally placed by customers on an as-needed basis. An accepted order can be canceled only with our written consent, and only on terms that will indemnify us against resulting losses, including, but not limited to, any costs already incurred in performing the order. In certain circumstances, purchase orders are subject to change with respect to quantity of product or timing of delivery resulting from changes in customer requirements. Our business is characterized by seasonal and intra-quarter variability in demand, as well as short lead-times and product delivery schedules. Accordingly, backlog at any given time may not be a meaningful indicator of future revenue.
Environmental Laws
Certain of our products and operations are regulated under various laws in the U.S., Europe and other parts of the world relating to the environment, including laws and regulations that can limit the use of certain substances in our products or require us to recycle our products when they become waste. It is our policy to ensure that our operations and products comply with environmental laws at all times. We track regulatory developments that may impact our business and devote resources toward developing strategies for compliance with new requirements as they are enacted.
Employees
As of June 25, 2010, we had 1,325 employees which consist of 1,264 full time employees and 61 temporary or contract employees. Our future success will require that we continue to retain and motivate highly qualified technical, sales, marketing, finance and management personnel. We have never had a work stoppage, and no employees are represented by a labor union. We have workers’ councils where required by the European Union or other applicable laws.
14
Table of Contents
Corporate Data
We were originally incorporated as Rackable Corporation and later changed our name to Rackable Systems, Inc. (“Rackable Systems”). Rackable Systems was incorporated in the state of Delaware in December 2002 in connection with the acquisition of substantially all of the assets and liabilities of Rackable Systems’ predecessor company. On May 8, 2009, we completed the acquisition of substantially all of the assets, excluding certain assets unrelated to the ongoing business, and assumed certain liabilities of Silicon Graphics, Inc. Effective May 18, 2009, Rackable Systems changed its name to Silicon Graphics International Corp.
Our website address is www.sgi.com. Our annual reports on Form 10-K, quarterly reports on Form 10-Q and 10-QT, current reports on Form 8-K, and amendments to those reports are available, without charge, on the investor relations section of our website, www.sgi.com, as soon as reasonably practicable after they are electronically filed with or furnished to the SEC. Our Corporate Governance Guidelines, Code of Business Conduct and Ethics and the charters of the Audit Committee, Compensation Committee, Strategic Planning Committee and Nominating and Corporate Governance Committee of our Board of Directors are also posted on our website at http://investors.sgi.com/. Copies are also available, without charge, from the Corporate Secretary, Silicon Graphics International Corp., 46600 Landing Parkway, Fremont, CA 94538. The information contained in, or that can be accessed through, our website is not incorporated by reference herein.
Executive Officers of the Registrant
Our executive officers, their ages and positions as of September 1, 2010, are as follows:
| Name |
Age | Position | ||
| Mark J. Barrenechea |
45 | Chief Executive Officer, President and Director | ||
| James Wheat |
52 | Senior Vice President and Chief Financial Officer | ||
| Anthony Carrozza |
55 | Senior Vice President of Worldwide Sales | ||
| Maurice Leibenstern |
49 | General Counsel, SVP and Corporate Secretary | ||
| Timothy Pebworth |
44 | Vice President and Chief Accounting Officer | ||
| Jennifer Pratt |
49 | Senior Vice President of Human Resources | ||
| Rick Rinehart |
51 | Senior Vice President of Services |
Mark Barrenechea joined SGI in November 2006 as a member of our board of directors, and in April 2007 became our President and Chief Executive Officer. Previously, Mr. Barrenechea served as Executive Vice President and CTO for CA, Inc. (“CA”), (formerly Computer Associates International, Inc.), a software company, from 2003 to 2006 and was a member of the executive management team. Prior to CA, Mr. Barrenechea served as Senior Vice President of Applications Development at Oracle Corporation, an enterprise software company, from 1997 to 2003, managing a multi-thousand person global team while serving as a member of the executive management team. From 1994 to 1997, Mr. Barrenechea served as Vice President of Development at Scopus, an applications company. Prior to Scopus, Mr. Barrenechea was with Tesseract, an applications company, where he was responsible for reshaping the company’s line of human capital management software as Vice President of Development. Mr. Barrenechea holds a Bachelor of Science degree in computer science from Saint Michael’s College.
James Wheat joined SGI in April 2008 and in May 2008 was named as our Senior Vice President and Chief Financial Officer. From 2006 to 2008, Mr. Wheat served as the Vice President and Corporate Controller at Lam Research, a publicly traded company engaged in designing, manufacturing, marketing and servicing semiconductor processing equipment. Mr. Wheat served as Corporate Controller at Asyst Technologies, Inc. from 2005 to 2006, a publicly traded company that develops, manufactures, sells and supports integrated hardware and software automation systems and he also served as acting principal financial officer in 2006. From 2003 to 2004, Mr. Wheat served as Senior Director of Finance for Sybase, Inc., an enterprise software company. Prior to 2003, Mr. Wheat held senior financial management positions at various public and private companies
15
Table of Contents
including Tele-Video, Sunterra Corporation, Raychem, Core-Mark International, Spectra Physics and Honeywell. Mr. Wheat holds a B.B.A. in Accounting and Business from the University of Michigan and a Masters of Business Administration from the Wharton School of the University of Pennsylvania and is a Certified Public Accountant in California.
Anthony Carrozza joined SGI in March 2008. In his role as Senior Vice President of Worldwide Sales, Mr. Carrozza is responsible for SGI’s product sales for both direct and indirect customers on a worldwide basis. Mr. Carrozza brings more than twenty five years of worldwide sales experience in the technology sector. Prior to joining SGI, Mr. Carrozza was with Neterion, Inc. from 2006 to 2008, a company that designed and manufactured 10 gigabyte Ethernet ASICs, where he was vice president, sales. Mr. Carrozza was with Quantum Corporation, a manufacturer of storage systems, from 1987 to 2006. When Mr. Carrozza left Quantum, he held the title of senior vice president, worldwide sales and was a member of the executive management team. Mr. Carrozza holds a Bachelor of Arts degree in political science from Iona College.
Maurice Leibenstern joined SGI in September 2007 as General Counsel and Senior Vice President and Corporate Secretary. Mr. Leibenstern brings more than 20 years of high tech legal experience to SGI. Most recently, he was at CA, Inc. from 1998 to 2007, as the Chief Legal Counsel for Worldwide Sales, while serving as a Senior Vice President and member of the company’s Senior Leadership Team. Prior to CA, Mr. Leibenstern worked at IBM, a computer hardware and software company, from 1992 to 1997. He holds a Bachelor of Arts in History from Brooklyn College of the City University of New York and a J.D. from New York University School of Law.
Timothy Pebworth became the Vice President, Corporate Controller and Chief Accounting Officer of SGI in May 2008. Prior to joining the Company, Mr. Pebworth served as the Chief Financial Officer of 24/7 Customer, Inc. from April 2007 to April 2008 and as the Corporate Controller from April 2005 to March 2007. From December 2002 to March 2005, Mr. Pebworth was a Senior Finance Manager at Intel Corporation serving in the Technology Manufacturing Group overseeing microprocessor, chipset and flash costing and inventory. Prior to leaving Intel in April 2005, and while still serving in his capacity in the Technology Manufacturing Group, Mr. Pebworth was promoted to a Controller position. Mr. Pebworth holds a M.B.A. from the Peter F. Drucker Graduate School of Management and a B.A. from Ambassador College in Pasadena, California. He is a Certified Public Accountant and Certified Management Accountant.
Jennifer Pratt joined SGI in March 2005 and moved into her current role as Senior Vice President of Human Resources in May 2009. Ms Pratt brings more than twenty five years of human resources experience. Prior to joining SGI, Ms. Pratt was the senior director of human resources at New Wave Research, a manufacturer of laser based systems, from 2003 to 2005. Ms. Pratt served as the vice president of human resources of Appiant Technologies, Inc., a unified communications, software applications company, from 2000 to 2003. Prior to 2000, Ms Pratt held senior human resource positions in a variety of industries including technology, manufacturing and healthcare. Ms. Pratt holds a Bachelor of Science degree in Business Administration from Morningside College, Sioux City, Iowa.
Rick Rinehart joined SGI in May 2010 as the Senior Vice President of Services and is responsible for SGI’s services on a worldwide basis. Mr. Rinehart has over 20 years of experience in the service business, and most recently came from Oracle (Sun Microsystems), where he held the position of Vice President, Global Customer Services for North America. Prior to that he held positions as Senior Director, Sun Federal Services with Sun Microsystems from 2006 to 2007, and from 2005 to 2006, he served as Director of Services for Storagetek for the federal business, which was acquired by Sun Microsystems. Prior to that, Mr. Rinehart worked as General Manager for NCR Corporation from 2001 to 2005. He holds a BS in Information Systems Management from the University of Maryland, and Master of Science degree in Business Administration through Central Michigan University.
16
Table of Contents
Risks Related To Our Business and Industry
Our periodic operating results have fluctuated significantly in the past and will continue to fluctuate in the future, which could cause our stock price to decline.
Our quarterly and annual periodic operating results have fluctuated significantly in the past, and we believe that they will continue to fluctuate in the future, due to a number of factors, many of which are beyond our control. We expect that our revenue, gross margin, and earnings per share will fluctuate on a periodic basis in future periods. If in future periods our operating results do not meet the expectations of investors or analysts who choose to follow our company, our stock price may fall. Factors that may affect our periodic operating results include the following:
| • | fluctuations in the buying patterns and sizes of customer orders from one quarter to the next; |
| • | increased competition causing us to sell our products or services at decreasing margins; |
| • | location and timing requirements for the delivery of our products and services; |
| • | longer acceptance cycles of our products by certain customers; |
| • | addition of new customers or loss of existing customers, especially involving our largest customers; |
| • | gross margin obtained on the sales of products and services, especially to our largest customers; |
| • | write-off of excess and obsolete inventory; |
| • | impairment and shortening of the useful life of components from our suppliers; |
| • | unexpected changes in the price for, and the availability of, components from our suppliers; |
| • | our ability to enhance our products with new and better designs and functionality; |
| • | costs associated with obtaining components to satisfy customer demand; |
| • | productivity and growth of our sales force; |
| • | actions taken by our competitors, such as new product announcements or introductions or changes in pricing; |
| • | revenue and gross margin disparity among our lines of server product and storage product lines; |
| • | market acceptance of our newer products, such as ICE Cube and CloudRack, or our future products, such as Altix UV; |
| • | technology regulatory compliance, certification and intellectual property issues associated with our products; |
| • | the payment of unexpected legal fees and potential damages or settlements resulting from protecting or defending our intellectual property or other matters; |
| • | the payment of significant damages or settlements resulting from faulty or malfunctioning products or the provision of services unsatisfactory to our customers; |
| • | the market downturn and delay in orders of our products; |
| • | the departure and acquisition of key management and other personnel; and |
| • | general economic trends, including changes in information technology spending or geopolitical events such as war or incidents of terrorism. |
17
Table of Contents
We face intense competition from the leading enterprise computing companies in the world as well as from emerging companies. If we are unable to compete effectively, we might not be able to achieve sufficient market penetration, revenue growth or profitability.
The markets for compute server products and storage products are highly competitive. In addition to intensely competitive smaller companies, we face challenges from some of the most established companies in the computer industry, such as Dell Inc., Hewlett-Packard Company (“HP”), International Business Machines Corporation and Oracle Corporation in the computer server market. In the storage market, we compete primarily with EMC Corporation, HP, Hitachi Data Systems, Inc, and NetApp, Inc. These larger competitors have at least the following advantages over us:
| • | substantially greater market presence and greater name recognition; |
| • | substantially greater financial, technical, research and development, sales and marketing, manufacturing, distribution and other resources; |
| • | longer operating histories; |
| • | a broader offering of products and services; |
| • | more established relationships with customers, suppliers and other technology companies; and |
| • | the ability to acquire technologies or consolidate with other companies in the industry to compete more effectively. |
Because these competitors may have greater financial strength than we do and are able to offer a more diversified bundle of products and services, they may have the ability to severely undercut the pricing of our products or provide additional products or servicing at little or no cost, which would make us less competitive or force us to reduce our average selling prices, negatively impacting our margins. In the past, we have had transactions where one or more competitors undercut our prices causing us to reduce our price, which negatively impacted our gross margin on that transaction and our overall gross margin. In addition, we have on occasion lost sales opportunities due to a competitor undercutting the pricing of our products or maintaining superior brand recognition. These competitors may be able to develop products that are superior to the commercially available components that we incorporate into our products, or may be able to offer products that provide significant price advantages over those we offer. For instance, a competitor could use its resources to develop proprietary motherboards with specifications and performance that are superior in comparison with the platforms that are currently available to the marketplace, which could give that competitor a distinct technological advantage. In addition, if our competitors’ products become more accepted than our products, our competitive position will be impaired.
The intense competition we face in the sales of our products and services and general economic and business conditions can put pressure on us to change our prices. If our competitors offer deep discounts on certain products or services or develop products that the marketplace considers more valuable, we may need to lower prices or offer other favorable terms in order to compete successfully. Any such changes may reduce margins and could adversely affect operating results.
As the enterprise computing industry evolves, we expect to encounter additional competitors, including companies in adjacent technology businesses such as storage and networking infrastructure and management, companies providing technology that is complementary to ours in functionality, such as data center management software, contract manufacturers, and other emerging companies that may announce server product offerings. Moreover, our current and potential competitors, including companies with whom we currently have strategic alliances, may establish cooperative relationships among themselves or with other third parties. If this occurs, new competitors or alliances may emerge that could negatively impact our competitive position.
18
Table of Contents
We intend to expand our operations and increase our expenditures in an effort to grow our business. If we are not able to manage this growth and expansion, or if our business does not grow as we expect, our operating results may suffer.
We intend to continue to grow our business by entering new markets, acquisitions, developing new product and service offerings and pursuing new customers. In connection with this growth, we expect that our annual operating expenses may increase over the next several years to the extent we expand our sales and marketing, research and development, manufacturing and production infrastructure, and our customer service and support efforts. Our failure to timely or efficiently expand operational and financial systems and to implement or maintain effective internal controls and procedures could result in additional operating inefficiencies that could increase our costs and expenses more than we had planned and might cause us to lose the ability to take advantage of market opportunities, enhance existing products, develop new products, satisfy customer requirements, respond to competitive pressures or otherwise execute our business plan. Additionally, if we do increase our operating expenses in anticipation of the growth of our business and this growth does not meet our expectations, our financial results could be negatively impacted.
If we acquire or invest in other companies, assets or technologies and we are not able to integrate them with our business, or we do not realize the anticipated financial and strategic goals for any of these existing or future transactions, our financial performance may be impaired.
If appropriate opportunities present themselves, as they have in the past, we may consider acquiring or making investments in companies, assets or technologies that we believe are strategic. We only have limited experience in doing so, and for any such company, asset or technology which we successfully acquire or invest in, we will be exposed to a number of risks, including:
| • | we may find that the acquired company, asset or technology does not further our business strategy, that we overpaid for the company, asset or technology or that the economic conditions underlying our acquisition decision have changed; |
| • | we may have difficulty integrating the assets, technologies, operations or personnel of an acquired company, or retaining the key personnel of the acquired company; |
| • | our ongoing business and management’s attention may be disrupted or diverted by transition or integration issues and the complexity of managing geographically or culturally diverse enterprises; |
| • | we may encounter difficulty entering and competing in new product or geographic markets or increased competition, including price competition or intellectual property litigation; and |
| • | we may experience significant problems or liabilities associated with product quality, technology and legal contingencies relating to the acquired business or technology, such as intellectual property or employment matters. |
For example, in connection with our acquisition of Terrascale Technologies, Inc., we expended a great deal of effort and resources, but were unable to generate revenue, increase gross profit or contribute positive cash flow into our business, sufficient to realize our investment, causing us to exit this product line. This resulted in an impairment charge of $17.5 million during the year ended January 3, 2009. We have presented the results of this product line as discontinued operations in our consolidated financial statements.
If we were to proceed with one or more significant acquisitions or investments in which the consideration included cash, we could be required to use a substantial portion of our available cash. To the extent we issue shares of capital stock or other rights to purchase capital stock, including options and warrants, existing stockholders might be diluted and earnings per share might decrease. In addition, acquisitions and investments may result in the incurrence of debt, large one-time write-offs, such as acquired in-process research and development costs and restructuring charges.
19
Table of Contents
We rely on sales to U.S. government entities. A loss of contracts, a failure to obtain new contracts or a reduction of sales under existing contracts with the U.S. government could adversely affect our operating performance.
We expect to derive a significant portion of our revenue directly from U.S. government entities, research institutions funded by the U.S. government and third-parties that sell directly to the U.S. government. In addition, many of our scientific and research customers depend on U.S. government funding for their information technology budgets. As a result, a significant portion of our revenue depends on sales to or funded by the U.S. government such that a loss of a U.S. government contract or the failure to obtain new contracts could adversely affect our operating performance. Sales to or funded by the government present risks in addition to those involved in sales to commercial customers, including potential disruptions and delays due to changes in appropriation and spending patterns. Our government business is also highly sensitive to changes in the U.S. government’s national and international priorities and budgeting. Changes in the continuing war on terrorism may affect funding for our programs or result in changes in government programs or spending priorities that may harm our business. In addition, the U.S. government can typically terminate or modify its contracts with us at any time for its convenience. Our U.S. government business is also subject to specific procurement regulations and a variety of other requirements. Failure to comply with these or other applicable regulations and requirements could lead to suspension or debarment from government contracting or subcontracting for a period of time. Any disruption or limitation in our ability to do business with the U.S. government or entities funded by the U.S. government would materially and adversely affect our revenue and operating results.
Prior to our acquisition of the Legacy SGI assets, sales to U.S. Government entities were not a significant part of our business, and we have limited experience in dealing with the U.S. government as a customer. In addition, we have not historically required government security clearances which are necessary in some cases to do business with the U.S. government, and have limited experience in obtaining or maintaining these security clearances for us or our employees. Failure to retain necessary security clearances could negatively impact our business with the U.S. Government.
We have extensive international operations, which subject us to additional business risks.
A significant portion of our sales occur and are expected to occur in international jurisdictions, including countries outside of Europe, Middle East, and Africa where we have limited operating experience. International operations involve inherent risks that we may not be able to control, and risks of which we may not be aware, including:
| • | supporting multiple languages; |
| • | recruiting sales and technical support personnel internationally with the skills to design, manufacture, sell and support our products; |
| • | complying with governmental regulation of encryption technology and regulation of imports and exports, including obtaining required import or export approval for our products; |
| • | increased complexity and costs of managing international operations; |
| • | increased exposure to foreign currency exchange rate fluctuations; |
| • | commercial laws and business practices that favor local competition; |
| • | multiple, potentially conflicting, and changing governmental laws, regulations and practices, including differing export, import, tax, labor, anti-bribery and employment laws; |
| • | longer sales cycles and manufacturing lead times; |
| • | difficulties in collecting accounts receivable; |
| • | reduced or limited protection of intellectual property rights; |
| • | more complicated logistics and distribution arrangements; and |
| • | political and economic instability. |
20
Table of Contents
International political instability may halt or hinder our ability to do business and may increase our costs. Various events, including the occurrence or threat of terrorist attacks, increased national security measures in the United States and other countries, and military action and armed conflicts, may suddenly increase international tensions. In addition, concerns about other international crises, such as potential pandemics, may have an adverse effect on the world economy and could adversely affect our business operations or the operations of our contract manufacturers and suppliers.
We maintain a program of insurance coverage for various types of property, casualty, and other risks. We place our insurance coverage with various carriers in numerous jurisdictions. However, there is a risk that one or more of our insurance providers may be unable to pay a claim. The types and amounts of insurance that we obtain vary from time to time and from location to location, depending on availability, cost, and our decisions with respect to risk retention. The policies are subject to deductibles and exclusions that result in our retention of a level of risk on a self-insurance basis. Losses not covered by insurance may be substantial and may increase our expenses, which could harm our results of operations and financial condition.
We may experience foreign currency gains and losses.
We conduct a significant number of transactions in currencies other than the U.S. Dollar. Changes in the value of major foreign currencies, particularly the Euro and British Pound relative to the U.S. Dollar can significantly affect revenues and our operating results. Our revenues and operating results are adversely affected when the dollar strengthens relative to other currencies and are positively affected when the dollar weakens. Our revenues and operating results in fiscal 2010 have been unfavorably affected by the recent strengthening U.S. Dollar relative to other major foreign currencies.
For the year ended June 25, 2010, our international revenue was $101.9 million and as of June 25, 2010, the balance in our foreign currency cash accounts is $28.6 million. At June 25, 2010, we had no foreign currency forward contracts or option contracts. As a result, an increase in the value of the United States dollar relative to foreign currencies could make our products more expensive and, thus, not competitively priced in foreign markets. Additionally, a decrease in the value of the United States dollar relative to foreign currencies could increase our operating costs in foreign locations. In the future, a larger portion of our international revenue may be denominated in foreign currencies, which will subject us to additional risks associated with fluctuations in those foreign currencies. In addition, we may be unable to successfully hedge against any such fluctuations.
Our international sales may require export licenses and expose us to additional risks.
Our sales to customers outside the United States are subject to U.S. export regulations. Under these regulations, sales of many of our high-end products require clearance and export licenses from the U.S. Department of Commerce. Our international sales would be adversely affected if these regulations were tightened, or if they are not modified over time to reflect the increasing performance of our products. Delay or denial in the granting of any required licenses could make it more difficult to make sales to non-U.S. customers. In addition, we could be subject to regulations, fines and penalties for violations of import and export regulations if we were found in violation of these regulations. End users could circumvent end-user documentation requirements that are intended to aid in our compliance with export regulations, potentially causing us to violate these regulations. These violations could result in penalties, including prohibitions on us from exporting our products to one or more countries, and could materially harm our business, including our sales to the U.S. government.
21
Table of Contents
Our sales cycle requires us to expend a significant amount of resources, and could have an adverse effect on the amount, timing and predictability of future revenue.
The sales cycle of our products, beginning from our first customer contact to closing of the sale, often ranges from three to six months. We may expend significant resources during the sales cycle and ultimately fail to close the sale. The success of our product sales process is subject to factors, over which we have little or no control, including:
| • | the timing of our customers’ budget cycles and approval processes; |
| • | our customers’ existing use of, or willingness to adopt, open standard server products, or to replace their existing servers or expand their processing capacity with our products; |
| • | the announcement or introduction of competing products; and |
| • | established relationships between our competitors and our potential customers. |
We expend substantial time, effort and money educating our current and prospective customers as to the value of our products. Even if we are successful in persuading lower-level decision makers within our customers’ organizations of the benefits of our products, senior management might nonetheless elect not to buy our products after months of sales efforts by our employees or resellers. If we were unsuccessful in closing sales, after expending significant resources, our revenue and operating expenses will be adversely affected.
We rely primarily on our direct sales force to generate revenue, and may be unable to hire additional qualified sales personnel in a timely manner or retain our existing sales representatives.
To date, we have relied primarily on our direct sales force to sell our products in the United States. Because we are looking to expand our customer base and grow our sales to existing customers, we will need to continue to hire qualified sales personnel, both in the United States and abroad, if we are to achieve our business objectives. The competition for qualified sales personnel in our industry is very intense. If we are unable to hire, train, deploy and manage qualified sales personnel in a timely manner, our ability to grow our business will be impaired. For example, in the past it has taken us up to six months to hire a qualified sales executive and it may take a newly-hired sales executive up to nine months after hiring to become productive, resulting in aggregate lag time between the commencements of the search to productivity, in excess of one year. In addition, if we are unable to retain our existing sales personnel, or if our sales personal are ineffective, our ability to maintain or grow our current level of revenue will be adversely affected. In addition, a large percentage of our revenue has been historically generated from a small number of customers. If we are unable to retain the sales personnel who are responsible for those customer accounts, our business could be negatively impacted.
We are continuing to develop and execute upon a channel strategy to generate additional sales and revenue, and the failure to successfully expand channel sales might affect our ability to sustain revenue growth and may harm our business and operations.
An increasing portion of our sales strategy is to develop our sales efforts through the use of resellers and other third parties to sell our systems. We may not be successful in building or expanding relationships with these third parties. Further, even if we do develop and expand these relationships, they may conflict with our direct sales efforts in some territories. Ineffective marketing of our products by our resellers or disruptions in our distribution channels could lead to decreased sales or slower than expected growth in revenue and might harm our business and operations.
22
Table of Contents
We have been substantially dependent on a concentrated number of customers that purchase in large quantities. If we are unable to maintain or replace our relationships with concentrated customers and/or diversify our customer base, our revenue may fluctuate and our growth may be limited.
Historically, a significant portion of our revenue has come from a limited number of customers. There can be no guarantee that we will be able to sustain our revenue levels from this type of customer. For the year ended June 25, 2010, our top five customers accounted for approximately 32% of our total revenues, with Amazon accounting for 20% of our total revenues. We expect a limited number of customers to continue to account for a significant portion of our revenues for the foreseeable future. This customer concentration increases the risk of quarterly fluctuations in our revenues and operating results. The loss or reduction of business from one or a combination of our significant customers could materially adversely affect our revenues, financial condition and results of operations.
Our customers require a high degree of reliability in our products and services, and if we cannot meet their expectations our relationships with our customers could be damaged and demand for our products and services will decline.
Because our customers rely on our products and services for their enterprise or mission critical applications, any failure to provide high quality products and reliable services, whether caused by our own failure or failures by our suppliers or contract manufacturers, could damage our reputation and reduce demand for our products and services. Some of our products, such as our ICE cube line, are particularly complex and carry a higher per unit price. A failure of products in our ICE cube line would therefore potentially be more costly to us, with the risk and potential cost to us increasing proportionately with the number of products we sell in this line. Most of our customers use our systems for applications that are critical to their organization; as a result system reliability is critical to the success of our products. In addition, delays in our ability to fill product orders as a result of quality control issues, such as an increase in failure rates or the rate of product returns, may negatively impact our relationships with our customers and harm our revenue and growth.
Our business depends on decisions by potential customers to adopt our modular, open standard-based products and to replace their legacy server systems with our products, and they may be reluctant to do so, which would limit our growth.
Our business depends on companies moving away from large proprietary RISC/UNIX servers to standardized servers that utilize commercially available x86 processor architectures and can deploy a variety of operating systems, including Linux and Microsoft Windows. Excluding sales to Microsoft Corporation, we believe that a majority of the server systems that we sold in 2009, 2008, and 2007 ran on the Linux® operating system. Products based on the Linux operating system and sold by other software vendors have been the subject of intellectual property infringement litigation.
Legal actions taken by The SCO Group, Inc. (“SCO”) against IBM in 2003 and Novell, Inc. (“Novell”) in 2004 alleging intellectual property infringement and disputing the ownership of core UNIX® copyrights in code that allegedly is used in Linux are ongoing. The litigation involving SCO’s claim against IBM that Linux is an unauthorized derivative work of the UNIX operating system has been stayed due to SCO’s bankruptcy filing. On March 30, 2010 in the Novell litigation, a jury returned a verdict in favor of Novell finding that Novell owns the UNIX copyrights. SCO has appealed the verdict to the U.S. Court of Appeals for the Tenth Circuit. If SCO’s appeal is ultimately successful, SCO could obtain a ruling that users or distributors of Linux must pay royalties to SCO or others, which could impede broader Linux adoption and could materially harm our ability to sell our products based on the Linux operating system.
In addition, Microsoft has publicly claimed that Linux infringes 235 or more of Microsoft’s patents and has entered into transactions with Novell, Inc. and other Linux distributors under which the parties reportedly agree, among other things, not to sue each other’s customers for potential patent infringements related to Linux. It is
23
Table of Contents
possible that a party (including Microsoft) could prove a claim for proprietary rights in the Linux operating system or other programs developed and distributed under the GNU General Public License or other open source software licenses. In addition, the GNU General Public License has been, and may be in the future, a subject of litigation, and it is possible that a court could hold these licenses to be unenforceable in that litigation. Any ruling by a court that the Linux operating system or significant portions of it may not be copied, modified or distributed subject only to the minimal restrictions contained in these licenses, that users or distributors of Linux must pay royalties to Microsoft or others or that these licenses are not enforceable could also impede broader Linux adoption and materially harm our ability to sell our products based on the Linux operating system. Further, because potential customers have often invested significant capital and other resources in existing systems, many of which run mission-critical applications, customers may be hesitant to make dramatic changes to their data center systems. The failure of our customers and potential customers to replace their legacy server systems and adopt open standard-based modular technologies could have a material adverse impact on our ability to maintain or generate additional revenue.
Our products have incorporated or have been dependent upon, open standards, commoditized components and materials that we obtain in spot markets, and, as a result, our cost structure and our ability to respond in a timely manner to customer demand are sensitive to volatility of the market prices for these components and materials.
A significant portion of our cost of revenue is directly related to the pricing of commoditized materials and components utilized in the manufacture of our products, such as memory, hard drives, central processing units (“CPUs”), or power supplies. As part of our procurement model, we generally do not enter into long-term supply contracts for these materials and components, but instead, purchase these materials and components in a competitive bid purchase order environment with suppliers or on the open market at spot prices. As a result, our cost structure is affected by the availability and price volatility in the marketplace for these components and materials, including new versions of hard drives and CPUs that are introduced by our suppliers. This volatility makes it difficult to predict expense levels and operating results and may cause them to fluctuate significantly. In addition, if we are successful in growing our business, we may not be able to continue to procure components solely on the spot market, which would require us to enter into contracts with component suppliers to obtain these components.
In addition, because our procurement model involves our ability to maintain low inventory and to acquire materials and components as needed, and because we do not enter into long-term supply contracts for these materials and components, our ability to effectively and efficiently respond to customer orders may be constrained by the then-current availability or the terms and pricing of these materials and components. Our industry has experienced component shortages and delivery delays in the past, and in the future we may experience shortages or delays of critical components as a result of strong demand in the industry or other factors. For example, occasionally we may experience a shortage of, or a delay in receiving, certain components as a result of strong demand, capacity constraints, supplier financial weaknesses, inability of suppliers to borrow funds in the credit markets, disputes with suppliers (some of whom are also customers), disruptions in the operations of component suppliers, other problems experienced by suppliers or problems faced during the transition to new suppliers.
If shortages or delays occur, the price of these components may increase, we may be exposed to quality issues or the components may not be available at all. We may therefore not be able to secure enough components at reasonable prices or of acceptable quality to build products or provide services in a timely manner in the quantities or according to the specifications needed. Accordingly, our revenue and gross margin could suffer as we could lose time-sensitive sales, incur additional freight costs or be unable to pass on price increases to our customers. If we cannot adequately address supply issues, we might have to reengineer some products or service offerings, resulting in further costs and delays.
In order to secure components for the provision of products or services, at times we may enter into non-cancelable commitments with vendors. In addition, we may purchase components strategically in advance of
24
Table of Contents
demand to take advantage of favorable pricing or to address concerns about the availability of future components. If we fail to anticipate customer demand properly, a temporary oversupply could result in excess or obsolete components, which could adversely affect our gross margin. This could increase our costs and decrease our gross margin. In addition, we compete in an industry that is characterized by rapid technological advances in hardware with frequent introduction of new products. New product introductions provide risks in predicting customer demand for the future products as well as the transition from existing products. If we do not make an effective transition from existing products to future products, an oversupply could result in excess components. For example, we recorded a $10.6 million expense related to the write down of excess and obsolete inventory during fiscal year 2010, due in large part to shifts in customer demand driven by transitions to new product offerings. As another example, DRAM can also represent a significant portion of our cost of revenue, and both the price and availability of various kinds of DRAM are subject to substantial volatility in the spot market. In addition, if any of our suppliers of CPUs, such as Intel or AMD, were to increase the costs to us for components we use, we would either pass these price increases on to our customers, which could cause us to lose business from these customers, or we would need to absorb these price increases, which would cause our margins to decrease, either of which could adversely affect our business and financial results.
If we fail to maintain or expand our relationships with our suppliers, in some cases single-source suppliers, we may not have adequate access to new or key technology necessary for our products, and, as a result, our ability to deliver leading-edge products may be impaired.
In addition to the technologies we develop, our suppliers develop product innovations at our direction that are requested by our customers. In many cases, we retain the ownership of the intellectual property developed by these suppliers. In addition, we rely heavily on our component suppliers, such as Intel and AMD, to provide us with leading-edge components. If we are not able to maintain or expand our relationships with our suppliers or continue to leverage their research and development capabilities to develop new technologies desired by our customers, our ability to deliver leading-edge products may be impaired and we could be required to incur additional research and development expenses.
We have historically relied on contract manufacturers to manufacture our products, and our failure to successfully manage our relationships with these contract manufacturers could impair our ability to deliver our systems in a manner consistent with required volumes or delivery schedules, which could damage our relationships with our customers and decrease our revenue.
We have historically relied on a very small number of contract manufacturers to assemble and test our products. None of these third-party contract manufacturers are obligated to perform services or supply products to us for any specific period, or in any specific quantities, except as may be provided in a particular purchase order. For example, we design custom silicon chips for application specific integrated circuits (ASIC), but rely on a third party to manufacture the ASICs for us. None of our contract manufacturers has provided contractual assurances to us that adequate capacity will be available to us to meet future demand for our products. If our contract manufacturers are not able to maintain our high standards of quality, are not able to increase capacity as needed, or are forced to shut down a factory, our ability to deliver quality products to our customers on a timely basis may decline, which would damage our relationships with customers, decrease our revenue and negatively impact our growth.
If our cost cutting measures are not successful, we may become less competitive.
A variety of factors could prevent us from achieving our goal of better aligning our product and service offerings and cost structure with customer needs in the current business environment. We are currently focused on reducing our operating expenses, reducing total costs in procurement, product design, transformation, and simplifying our structure. For example, we may experience delays in the anticipated timing of activities related to our cost savings plans and higher than expected or unanticipated costs to implement the plans. As a result, we
25
Table of Contents
may not achieve our expected cost savings in the time anticipated, or at all. In such case, our results of operations and profitability may be negatively impacted, making us less competitive and potentially causing us to lose industry unit share.
We may fail to achieve our financial forecasts.
Our revenues are difficult to forecast and our quarterly and annual operating results can fluctuate substantially. We use a “pipeline” system, a common industry practice, to forecast sales and trends in our business. Our sales personnel monitor the status of all proposals and estimate when a customer will make a purchase decision and the dollar amount of the sale. These estimates are aggregated periodically to generate a sales pipeline. Our pipeline estimates can prove to be unreliable both in a particular quarter and over a longer period of time, in part because the “conversion rate” or “closure rate” of the pipeline into contracts can be very difficult to estimate. A contraction in the conversion rate, or in the pipeline itself, could cause us to plan or budget incorrectly and adversely affect our business or results of operations.
In particular, a slowdown in IT spending or economic conditions generally can unexpectedly reduce the conversion rate in particular periods as purchasing decisions are delayed, reduced in amount or cancelled. The conversion rate can also be affected by the tendency of some of our customers to wait until the end of a fiscal period in the hope of obtaining more favorable terms, which can also impede our ability to negotiate and execute these contracts in a timely manner. In addition, for newly acquired companies, we have limited ability to predict how their pipelines will convert into sales or revenues for one or two quarters following the acquisition and their conversion rate post-acquisition may be quite different from their historical conversion rate.
If we are not able to retain and attract adequate qualified personnel, including key executive, managerial, technical, finance, marketing and sales personnel, we may not be able to execute on our business strategy.
Our future success depends in large part upon the continued service and enhancement of our executive, managerial, technical, finance, marketing and sales employees. Changes in management can be disruptive within a company, which could negatively affect our operations, our culture and our strategic direction. Our employees may terminate their employment with us at any time. Our U.S. employees are “at will,” while outside of the U.S., notice or severance may be required if we wish to terminate an employee. The failure of our management team to seamlessly manage employee transitions, or the loss of services of any of these executives or of one or more other members of our executive management or sales team or other key employees could seriously harm our business. Competition for qualified executives is intense and if we are unable to continue expanding our management team, or successfully integrate new additions to our management team in a manner that enables us to scale our business and operations effectively, our ability to operate effectively and efficiently could be limited or negatively impacted.
Additionally, to help attract, retain, and motivate qualified employees, we use share-based incentive awards such as employee stock options and non-vested share units (restricted stock units). If the value of such stock awards does not appreciate as measured by the performance of the price of our common stock, or if our share-based compensation otherwise ceases to be viewed as a valuable benefit, our ability to attract, retain, and motivate employees could be weakened, which could harm our results of operations.
We make estimates and assumptions in connection with the preparation of our consolidated financial statements, and any changes to those estimates and assumptions could have a material adverse effect on our results of operations.
In connection with the preparation of our consolidated financial statements, we use certain estimates and assumptions based on historical experience and other factors. Our most critical accounting estimates are described in “Management’s Discussion and Analysis of Financial Condition and Results of Operations” in this report. In addition, as discussed in Note 23 to the consolidated financial statements, we make certain estimates,
26
Table of Contents
including decisions related to provisions for legal proceedings and other contingencies. While we believe that these estimates and assumptions are reasonable under the circumstances, they are subject to significant uncertainties, some of which are beyond our control. Should any of these estimates and assumptions change or prove to have been incorrect, it could have a material adverse effect on our results of operations, and we may be required to restate our financial results for prior periods which could cause our stock price to decline.
Maintaining and improving our financial controls, particularly in light of the requirements of being a public company, may strain our resources and divert management’s attention.
We are subject to the reporting requirements of the Securities Exchange Act of 1934 and the rules and regulations promulgated thereunder (the “Exchange Act”) and The NASDAQ Stock Market Rules. The requirements of these rules and regulations have increased our legal and financial compliance costs, make some activities more difficult, time-consuming or costly and may also place undue strain on our personnel, systems and resources.
The Sarbanes-Oxley Act of 2002 requires, among other things, that we maintain effective disclosure controls and procedures and internal control over financial reporting. This can be difficult to do. In particular, we acquired substantially all the assets of Legacy SGI and went through the process of integrating and harmonizing Legacy SGI financial reporting and information technology systems, including internal control over financial reporting, with our own. As a result of this and similar activities, management’s attention may be diverted from other business concerns, which could have a material adverse effect on our business, financial condition and results of operations. We may not be able to meet the requirements needed to prevent additional material weaknesses. In addition, if we are unable to continue to meet these requirements, we may not be able to remain listed on the NASDAQ Global Select Market.
If we fail to remediate deficiencies in our control environment or are unable to implement and maintain effective internal control over financial reporting in the future, the accuracy and timeliness of our financial reporting may be adversely affected.
Effective internal controls over financial reporting are necessary for us to provide reliable financial reports and effectively prevent fraud. As a publicly traded company we must maintain effective disclosure controls and procedures and internal control over financial reporting. This can be difficult to do. A company’s internal control over financial reporting is a process designed to provide reasonable assurance regarding the reliability of financial reporting and the preparation of financial statements for external purposes in accordance with generally accepted accounting principles. A company’s internal control over financial reporting includes those policies and procedures that:
| • | pertain to the maintenance of records that, in reasonable detail, accurately and fairly reflect the transactions and dispositions of the assets of the company; |
| • | provide reasonable assurance that transactions are recorded as necessary to permit preparation of financial statements in accordance with generally accepted accounting principles, and that receipts and expenditures of the company are being made only in accordance with authorizations of management and directors of the company; and |
| • | provide reasonable assurance regarding prevention or timely detection of unauthorized acquisition, use, or disposition of the company’s assets that could have a material effect on the financial statements. |
A material weakness is a deficiency, or a combination of deficiencies, in internal control over financial reporting such that there is a reasonable possibility that a material misstatement of the Company’s annual or interim financial statements will not be prevented or detected on a timely basis.
27
Table of Contents
Even after corrective actions are implemented, the effectiveness of our controls and procedures may be limited by a variety of risks including:
| • | faulty human judgment and simple errors, omissions or mistakes; |
| • | collusion of two or more people; |
| • | inappropriate management override of procedures; and |
| • | the risk that enhanced controls and procedures may still not be adequate to assure timely and reliable financial information |
A failure to have effective internal controls and procedures for financial reporting in place could result in a restatement of our financial statements, as it did in our Form 10-Q for the quarterly period ended March 29, 2008, or impact our ability to accurately report financial information on a timely basis, which could adversely affect our stock price.
Unanticipated changes in our tax provisions or exposure to additional income tax liabilities could affect our profitability.
We are subject to income taxes in the United States and numerous foreign jurisdictions. Our tax liabilities are affected by the amounts we charge for inventory, services, funding and other items in intercompany transactions. We are subject to ongoing tax audits in various jurisdictions. Tax authorities may disagree with our intercompany charges, cross-jurisdictional transfer pricing or other matters and assess additional taxes. For example, we have been assessed tax and interest by the Canada Revenue Agency (CRA) in connection with excess research credits claimed by our Canadian subsidiaries in prior periods. The assessment has not been paid because the CRA has not yet accepted our claim that the assessment should be reduced due to overstatement of taxable income of our Canadian subsidiaries during these periods. We regularly assess the likely outcomes of these audits in order to determine the appropriateness of our tax provision. However, there can be no assurance that we will accurately predict the outcomes of these audits, and the amounts ultimately paid upon resolution of audits could be materially different from the amounts previously included in our income tax expense and therefore could have a material impact on our tax provision, net income and cash flows.
In addition, our effective tax rate in the future could be adversely affected by changes to our operating structure, changes in the mix of earnings in countries with differing statutory tax rates, changes in the valuation of deferred tax assets and liabilities, changes in tax laws and the discovery of new information in the course of our tax return preparation process.
Unsuccessful deployment of new transaction processing applications and other systems integration issues could disrupt our internal operations and any such disruption could reduce our expected revenue, increase our expenses, and damage our reputation.
Portions of our IT infrastructure may experience interruptions, delays or cessations of service or produce errors in connection with systems integration and implementation of new transaction processing applications, including accounting, manufacturing and sales system. We may not be successful in implementing new systems and transitioning data, which could cause business disruptions and be more expensive, time consuming, disruptive and resource-intensive to remediate. Such disruptions could adversely impact our ability to fulfill orders and negatively impact our business or interrupt other processes. Delayed sales, lower margins or lost customers resulting from these disruptions have adversely affected us in the past, and in the future could adversely affect our financial results, public disclosures and reputation.
Business disruptions could affect our operating results.
A significant portion of our research and development activities and certain other critical business operations is concentrated in a few geographic areas. We are a highly automated business and a disruption or failure of our systems could cause delays in completing sales and providing services. A major earthquake, fire or
28
Table of Contents
other catastrophic event that results in the destruction or disruption of any of our critical business or information technology systems could severely affect our ability to conduct normal business operations and, as a result, our future operating results could be materially and adversely affected.
Unstable market and economic conditions may have serious adverse consequences on our business.
Our general business strategy may be adversely affected by the current economic downturn and volatile business environment and continued unpredictable and unstable market conditions. If the current equity and credit markets deteriorate further, or do not continue to improve, it may make any necessary debt or equity financing more difficult, more costly, and more dilutive. We believe we are well positioned with significant capital resources to meet our current working capital and capital expenditure requirements. However, a further prolonged or profound economic downturn may result in adverse changes to demand for our products, or our customers’ ability to pay for our products, which would harm our operating results. There is also a risk that one or more of our current service providers, manufacturers and other partners may not survive these difficult economic times, which would directly affect our ability to attain our operating goals on schedule and on budget. Failure to secure any necessary financing in a timely manner and on favorable terms could have a material adverse effect on our financial performance and stock price and could require us to change our business plans.
Uncertainty in the credit market may negatively affect the value of auction rate securities owned by us and our ability to liquidate these securities.
Our long-term investments as of June 25, 2010 are comprised of various auction rate securities (“ARS”). ARS are variable-rate debt securities that have a long-term maturity. The interest rate on ARS resets through Dutch auctions that are held at pre-determined intervals, usually every 28 days, providing liquidity by allowing investors to roll over their holdings or obtain immediate liquidity by selling. Uncertainty in the credit market has negatively affected these auctions as they have not had sufficient bidders to allow investors to complete a sale. In February 2008, auctions of ARS that we continue to hold failed. Due to the uncertainty of liquidity, we have classified these investments as long-term and have included them in long-term investments. As of June 25, 2010 we have recorded an unrealized loss of $1.3 million on these investments in other comprehensive loss, reducing their value to $7.5 million. In the future, failed auctions may affect our ability to liquidate these ARS until a future auction is successful, a buyer is found outside of the auction process, the underlying securities have matured or the securities are recalled by the issuer. In addition, failed auctions may affect the fair value of our ARS and may result in an impairment charge.
If we are unable to protect our intellectual property adequately, we may not be able to compete effectively.
Our intellectual property is critical to our success and our ability to compete. If we fail to protect our intellectual property rights adequately, our competitors might gain access to our technology. Unauthorized parties may attempt to copy or otherwise obtain and use our proprietary technology despite our efforts to protect our intellectual property. In addition, we license our technology and intellectual property to third parties, including in some cases, our competitors, which could under some circumstances make our patent rights more difficult enforce. Third parties could also obtain licenses to some of our intellectual property as a consequence of a merger or acquisition. Also, our participation in standard setting organizations or industry initiatives may require us to license our patents to other companies that adopt certain standards or specifications. As a result of such licensing, our patents might not be enforceable against others who might otherwise be infringing those patents and the value of our intellectual property may be impaired.
However, litigation is inherently uncertain, and there is no assurance that any litigation we initiate will have a successful outcome. Monitoring unauthorized use of our technology is difficult, and we cannot be certain that the steps we have taken will prevent unauthorized use of our technology, particularly in foreign countries where the laws may not protect our proprietary rights as fully as the laws of the United States. Any claims or litigation that we have initiated or that we may initiate in the future to protect our proprietary technology could be time
29
Table of Contents
consuming and expensive and divert the attention of our technical and management resources whether or not the claims or litigation are decided in our favor. Enforcing our rights could subject us to claims that the intellectual property right is invalid, is otherwise not enforceable, or is licensed to the party against whom we are asserting a claim. Also, assertion of our intellectual property rights could result in the other party seeking to assert alleged intellectual property rights of its own or assert other claims against us, which could harm our business.
We currently have numerous patents issued and a number of patent applications pending in the United States and other countries. These patents may be limited in value in asserting our intellectual property rights against more established companies in the computer technology sector that have sizeable patent portfolios and greater capital resources. In addition, patents may not be issued from these patent applications, and even if patents are issued, they may not benefit us or give us adequate protection from competing products. For example, issued patents might be circumvented or challenged, and could be declared invalid or unenforceable. Moreover, if other companies develop unpatented proprietary technology similar to ours or competing technologies, our competitive position will be weakened.
If we are found to have violated the intellectual property rights of others, we could be required to indemnify our customers, resellers or suppliers, redesign our products, pay significant royalties and enter into license agreements with third parties.
Our industry is characterized by a large number of patents, copyrights, trade secrets and trademarks and by frequent litigation based on allegations of infringement or other violation of intellectual property rights. As we continue our business, expand our product lines and our product functionality, and expand into new jurisdictions around the world, third parties may assert that our technology or products violate their intellectual property rights. Because of technological changes and the extent of issued patents in our industry, it is possible certain components of our products and business methods may unknowingly infringe existing patents of others. Any claim, regardless of its merits, could be expensive and time consuming to defend against. It would also divert the attention of our technical and management resources. Successful intellectual property claims against us could result in significant financial liability, impair our ability to compete effectively, or prevent us from operating our business or portions of our business. In addition, resolution of claims may require us to redesign our technology, to obtain licenses to use intellectual property belonging to third parties, which we may not be able to obtain on reasonable terms, to cease using the technology covered by those rights, and to indemnify our customers, resellers or suppliers. Any of these events could result in unexpected expenses, negatively affect our competitive position and materially harm our business, financial condition and results of operations.
Our use of open source and third-party software could impose unanticipated conditions or restrictions on our ability to commercialize our products.
We incorporate open source software into our products. Open source software is made available to us and to the public by its authors or other third parties under licenses that impose certain obligations on licensees in the event those licensees re-distribute or make derivative works of the open source software. The terms of many open source licenses have not been interpreted by United States or other courts, and these licenses could be construed in a manner that imposes unanticipated conditions or restrictions on our ability to commercialize our products. In this event, we could be required to seek licenses from third parties in order to continue offering our products, to make generally available, in source code form, proprietary code that links to certain open source modules, to re-engineer our products, or to discontinue the sale of our products if re-engineering could not be accomplished on a timely basis, any of which might harm our business, operating results and financial condition.
Adverse litigation results could affect our business.
We are subject to various legal proceedings. Litigation can be lengthy, expensive and disruptive to our operations, and results cannot be predicted with certainty. An adverse decision could result in monetary damages or injunctive relief that could affect our business, operating results or financial condition. Additional information regarding certain of the lawsuits we are involved in is discussed under Part 1—Item 3.
30
Table of Contents
Risks Related to Owning Our Stock
Our stock price in the past has been volatile, and may continue to be volatile or may decline regardless of our operating performance, and investors may not be able to resell shares at or above the price at which they purchased the shares.
Our stock has been publicly traded for a relatively short period of time, having first begun trading in June 2005. During that time our stock price has fluctuated significantly, from a high of approximately $56.00 per share to a low of approximately $3.42 per share. At times the stock price has changed very quickly. During the year ended June 25, 2010, our stock price has fluctuated from a high of approximately $12.74 to a low of approximately $4.16. If investors purchase shares of our common stock, they may not be able to resell those shares at or above the price at which they purchase them. The market price of our common stock may fluctuate significantly in response to numerous factors, many of which are beyond our control including:
| • | price and volume fluctuations in the overall stock market; |
| • | purchases of shares of our common stock pursuant to our share repurchase program; |
| • | the financial projections we may provide to the public, any changes in these projections or our failure to meet these projections; |
| • | actual or anticipated fluctuations in our operating results; |
| • | changes in operating performance and stock market valuations of other technology companies generally, or those that sell enterprise computing products in particular; |
| • | changes in financial estimates by any securities analysts who follow our company, our failure to meet these estimates or failure of those analysts to initiate or maintain coverage of our stock; |
| • | ratings downgrades by any securities analysts who follow our company; |
| • | the public’s response to our press releases or other public announcements, including our filings with the SEC; |
| • | announcements by us or our competitors of significant technical innovations, customer wins or losses, acquisitions, strategic partnerships, joint ventures or capital commitments; |
| • | introduction of technologies or product enhancements that reduce the need for our products; |
| • | market conditions or trends in our industry or the economy as a whole; |
| • | the loss of one or more key customers; |
| • | the loss of key personnel; |
| • | the development and sustainability of an active trading market for our common stock; |
| • | lawsuits threatened or filed against us; |
| • | future sales of our common stock by our officers, directors and significant stockholders; and |
| • | other events or factors, including those resulting from war, incidents of terrorism or responses to these events. |
In addition, the stock markets, and in particular the NASDAQ Stock Market, have experienced extreme price and volume fluctuations that have affected and continue to affect the market prices of equity securities of many technology companies. Stock prices of many technology companies have fluctuated in a manner unrelated or disproportionate to the operating performance of those companies. In the past, stockholders have instituted securities class action litigation following periods of market volatility. We are currently involved in securities litigation, and could become involved in additional securities litigation in the future, either of which could have substantial costs and divert resources and the attention of management from our business. For additional information regarding our securities litigation, please see the section of this report titled “Legal Proceedings.”
31
Table of Contents
Due to these factors, sales of a substantial number of shares of our common stock in the public market could occur at any time. These sales, or the perception in the market that the holders of a large number of shares intend to sell shares, could reduce the market price of our common stock.
Some provisions in our certificate of incorporation and bylaws may deter third parties from acquiring us.
Our certificate of incorporation and bylaws contain provisions that may make the acquisition of our company more difficult without the approval of our board of directors, including the following:
| • | limitations on persons authorized to call a special meeting of stockholders; |
| • | our stockholders may take action only at a meeting of stockholders and not by written consent; |
| • | our certificate of incorporation authorizes undesignated preferred stock, the terms of which may be established and shares of which may be issued without stockholder approval; and |
| • | advance notice procedures required for stockholders to nominate candidates for election as directors or to bring matters before an annual meeting of stockholders. |
These anti-takeover defenses could discourage, delay or prevent a transaction involving a change in control of our company. These provisions could also discourage proxy contests and make it more difficult for stockholders to elect directors of their choosing and cause us to take other corporate actions they desire.
We do not expect to pay any cash dividends for the foreseeable future.
We do not anticipate that we will pay any cash dividends to holders of our common stock in the foreseeable future. Accordingly, investors must rely on sales of their common stock after price appreciation, which may never occur, as the only way to realize any future gains on their investment. Investors seeking cash dividends in the foreseeable future should not purchase our common stock.
Item 1B. Unresolved Staff Comments
Not applicable.
Our properties consist of leased and owned facilities used for manufacturing, warehouse, sales and marketing, research and development, services and support and administrative purposes.
We own and lease sales, service, manufacturing, research and development and administrative offices worldwide and have our principal facilities in California, Wisconsin, and Minnesota in the United States and abroad in Shanghai, China and in Reading, United Kingdom. At June 25, 2010, our worldwide facilities represented aggregate floor space of approximately 704,000 square feet, of which 700,000 square feet is used in our operations. Approximately 4,000 square feet is currently vacant. Because of the relationship between our segments, products and service, substantially all of our properties are used at least in part by both of these segments and we have the flexibility to use each of the properties in whole or in part for each of the segments. We currently anticipate our existing facilities are adequate for our needs through fiscal year 2011.
32
Table of Contents
Information about our leased and owned facilities at June 25, 2010 is approximately as follows:
| Square Feet | Lease Terms End |
Square Feet Not Used in Operations |
Primary Uses | |||||||
| Leased | Owned | |||||||||
| Fremont, California |
158,000 | — | 2013 | — | Research and development, sales, administration | |||||
| Chippewa Falls, Wisconsin |
88,000 | 268,000 | 2013 | — | Manufacturing, service, research and development | |||||
| Eagan, Minnesota |
42,000 | — | 2014 | — | Research and development, sales, administration | |||||
| Shanghai, China |
13,000 | — | 2011 | — | Research and Development | |||||
| Reading, United Kingdom |
7,000 | — | 2010 | — | Research and development, sales, administration | |||||
| Other international |
88,000 | — | various | Sales and Service | ||||||
| Other domestic |
40,000 | — | various | 4,000 | Sales and Service | |||||
| 436,000 | 268,000 | 4,000 | ||||||||
Our leased facilities in Fremont, California include our corporate headquarters.
We are involved in various legal proceedings and disputes that arise in the normal course of business. These matters include product liability actions, patent infringement actions, contract disputes, and other matters. We do not know whether we will prevail in these matters nor can we assure that any remedy could be reached on commercially viable terms, if at all. Based on currently available information, we believe that we have meritorious defenses to these actions and that the resolution of these cases is not likely to have a material adverse effect on our business, financial position or future results of operations. We record a liability when it is both probable that a liability has been incurred and the amount of the loss can be reasonably estimated. These provisions are reviewed at least quarterly and adjusted to reflect the impacts of negotiations, settlements, rulings, advice of legal counsel, and other information and events pertaining to a particular case.
On May 1, 2007, Legacy SGI received a legal notice from counsel to Bharat Heavy Electricals Ltd. (“BHEL”), located in India, alleging delay in and failure to deliver products and technical problems with its hardware and software in relation to the establishment of a facility in Hyderabad. We assumed this claim in connection with our acquisition of Legacy SGI assets, and are currently engaged in arbitration. On January 21, 2008, BHEL filed its statement of claim against Silicon Graphics Systems (India) Pvt. Ltd. for a sum of Indian Rupee (“INR”) 78,478,200 ($1.7 million based on the conversion rate on June 25, 2010) plus interest and costs. On February 29, 2008, we filed our reply as well as a counter claim for a sum of INR 27,453,007 ($0.6 million based on the conversion rate on June 25, 2010) plus interest and costs. The proceeding has commenced but the hearing, scheduled for June 2010 could not take place and the next rescheduled hearing date is awaited from the Arbitor. We cannot currently predict the outcome of this dispute nor determine the amount or a reasonable range of potential loss, if any.
On October 28, 2008, we were sued in a matter captioned Acceleron, LLC v. Egenera, Inc. et al., Case No. 10-128 (Del.) (formerly 6:08-CV-00417 (E.D. Texas)). Acceleron brought the above captioned action against us, seeking monetary and injunctive relief for our alleged infringement of U.S. Patent No. 6,948,021 (“the ‘021 Patent”). We answered the Complaint on January 23, 2009, asserting that the ‘021 Patent was not infringed and invalid. The lawsuit was transferred to the U.S. District Court, Delaware on January 26, 2010. A settlement agreement, effective June 18, 2010, was executed by the parties pursuant to which a Stipulated Order dismissing us from the lawsuit was entered on June 29, 2010.
33
Table of Contents
On January 16, 2009, we and certain of our former officers were sued in the United States District Court for the Northern District of California, in a matter captioned In Re Rackable Systems, Inc. Securities Litigation, Case No. C-09-0222-CW. On April 16, 2009, the Court appointed Elroy Whittaker as Lead Plaintiff and the Law Firm of Glancy Binkow & Goldberg LLP as Lead Plaintiff’s Counsel. Lead Plaintiff filed a consolidated amended complaint (the “Amended Complaint”) on June 15, 2009. The Amended Complaint asserts claims for violations of (i) Section 10(b) of the Exchange Act and Rule 10b-5 promulgated thereunder, and (ii) Section 20(a) of the Exchange Act. The allegations relate to the drops in the Company’s share price in early 2007 relating to its earnings reports for 2006 and Q4 2006. On August 13, 2009, we and our former officers filed a Motion to Dismiss the Amended Complaint (the “Motion to Dismiss”), which Lead Plaintiff opposed. On January 13, 2010, the Court entered an order granting the Motion to Dismiss, which dismissed the Amended Complaint with leave to amend. On February 3, 2010, Lead Plaintiff filed a second amended complaint asserting the same claims as the amended complaint. On April 2, 2010, Lead Plaintiff filed a stipulated proposed order requesting leave to file a supplemental second amended complaint, which substituted new Lead Plaintiffs into the action but otherwise did not change the allegations of the second amended complaint. On April 5, 2010, the Court granted the stipulated order and entered the supplemental second amended complaint. On April 9, 2010, we and our former officers filed a Motion to Dismiss the Supplemental Second Amended Complaint. The Court granted the Motion to Dismiss with prejudice on August 27, 2010, and judgment was entered pursuant to the Court’s order on August 31, 2010. Plaintiffs have the right to appeal the order dismissing the action with prejudice until 30 days after the entry of judgment. We cannot currently predict the outcome of this dispute nor determine the amount or a reasonable range of potential loss, if any.
In March 2009, we and certain of our present and former directors and officers were sued in the Superior Court of the State of California for Alameda County, in a shareholder derivative lawsuit captioned Milo v. Barton, et al, Case No. R30944-0474. The complaint alleges that the defendants engaged in various acts and omissions that resulted in the drops of our share price in early 2007, and asserts claims for alleged breaches of defendants’ fiduciary duties, waste of corporate assets, and unjust enrichment. The complaint seeks compensatory damages in an unspecified amount, unspecified equitable or injunctive relief, disgorgement of unspecified compensation earned by the defendants, and an award of an unspecified amount for plaintiff’s costs and attorneys fees. By stipulated order dated April 13, 2009, this action was stayed pending resolution of the pleadings in the federal class action. Because the federal class action was dismissed with prejudice, Plaintiff now has 60 days from the date of the dismissal to file an amended complaint or notify defendants that Plaintiff will not file an amended complaint. Defendants will then be required to move to dismiss or otherwise respond to the complaint or amended complaint, as applicable, within 40 days after an amended complaint is filed or notice is given that Plaintiff will not amend. We cannot currently predict the outcome of this dispute nor determine the amount or a reasonable range of potential loss, if any.
On December 3, 2009, we initiated an arbitration proceeding captioned Silicon Graphics Intl. Corp., f/k/a Rackable Systems, Inc. v. Thomas Weisel Partners Group, Inc., et al., FINRA Arb. No. 09-06849, against its former investment advisor Thomas Weisel Partners LLC (“TWP”), as well as TWP’s parent company Thomas Wiesel Partners Group, Inc., to remedy TWP’s alleged mismanagement and wrongful advice pertaining to our investments in allegedly unsuitable and illiquid investments called “auction rate securities” (“ARS”). Due to market conditions, the ARS at issue are still held by us, as described elsewhere herein. We filed our arbitration claim with the Financial Industry Regulatory Authority (“FINRA”), and assert various causes of action including breach of fiduciary duty, unsuitability, and breach of contract. We seek remedies including rescission; restitution; disgorgement; and compensatory, consequential, and punitive damages, and requests a damages award in excess of $9.0 million, exclusive of punitive damages and other potential relief. TWP filed its Answer on February 4, 2010. The parties have commenced discovery and the arbitration is currently scheduled to commence in February 2011. We cannot currently predict the outcome of this dispute nor determine the amount or a reasonable range of potential loss, if any.
34
Table of Contents
Item 5. Market for Registrant’s Common Equity, Related Stockholder Matters and Issuer Purchase of Equity Securities
Market Information
Our common stock started trading on the NASDAQ National Market under the symbol “RACK” on June 10, 2005 and, commencing in 2006, on the NASDAQ Global Select Market. On May 18, 2009, we changed our name to Silicon Graphics International Corp. (“SGI”) and changed our NASDAQ stock ticker symbol to “SGI”. Prior to June 10, 2005, there was no public market for our common stock. The following table sets forth for the periods indicated the high and low sale prices of our common stock, as reported by the NASDAQ Markets.
| Year Ending June 25, 2010 |
High | Low | ||||
| Fourth Quarter |
$ | 11.34 | $ | 6.82 | ||
| Third Quarter |
12.74 | 6.80 | ||||
| Second Quarter |
7.28 | 5.77 | ||||
| First Quarter |
7.16 | 4.16 | ||||
| Six-month transition period ending June 26, 2009 (1) |
High | Low | ||||
| Second Quarter |
$ | 5.85 | $ | 3.88 | ||
| First Quarter |
5.24 | 3.42 | ||||
| Year Ending January 3, 2009 |
High | Low | ||||
| Fourth Quarter |
$ | 10.33 | $ | 3.61 | ||
| Third Quarter |
13.80 | 9.81 | ||||
| Second Quarter |
14.48 | 8.88 | ||||
| First Quarter |
10.17 | 7.76 | ||||
| (1) | There is no third or fourth quarter for the six-month transition period ending June 26, 2009 due to the change in our fiscal year end. |
Holders
As of September 1, 2010, there were 30,696,726 shares of our common stock outstanding held by 15 registered holders of record. A substantially greater number of holders of our outstanding common stock are “street name” or beneficial holders, whose shares are held of record by banks, brokers, and other financial institutions.
Dividends
We have never declared or paid any dividends on our capital stock. We currently intend to retain any future earnings to fund the development and expansion of our business, and therefore we do not anticipate paying cash dividends on our common stock in the foreseeable future. Any future determination to pay dividends will be at the discretion of our board of directors.
Recent Sale of Unregistered Securities
None
Issuer Purchases of Equity Securities
None
35
Table of Contents
Performance Graph (2)
The following graph shows the cumulative total stockholder return of an investment of $100 in cash on June 10, 2005, the date our common stock first started trading on the NASDAQ National Market through June 25, 2010, for (i) our common stock, (ii) the NASDAQ Composite Index and (iii) the RDG Technology Composite Index. Pursuant to applicable SEC rules, all values assume reinvestment of the full amount of all dividends, however no dividends have been declared on our common stock to date. The stockholder return shown on the graph below is not necessarily indicative of future performance, and we do not make or endorse any predictions as to future stockholder returns.
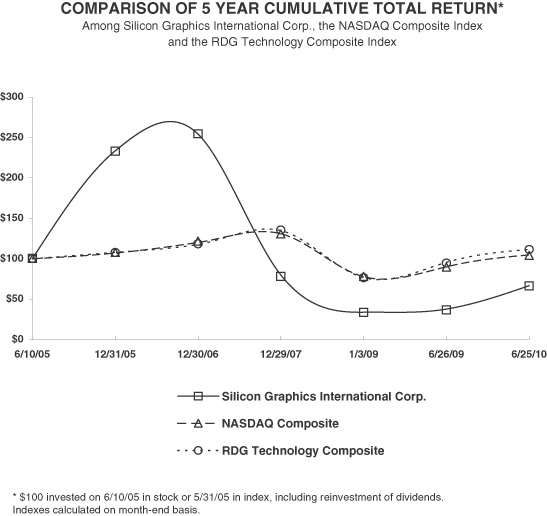
| 6/10/05 | 12/31/05 | 12/30/06 | 12/29/07 | 1/3/09 | 6/26/09 | 6/25/10 | ||||||||
| Silicon Graphics International Corp. |
100.00 | 233.44 | 253.85 | 79.67 | 33.69 | 37.54 | 66.48 | |||||||
| NASDAQ Composite |
100.00 | 106.77 | 119.92 | 130.77 | 77.57 | 90.10 | 104.74 | |||||||
| RDG Technology Composite |
100.00 | 107.69 | 117.45 | 134.56 | 76.53 | 95.44 | 111.22 |
| (2) | This Section is not “soliciting material,” is not deemed “filed” with the SEC and is not to be incorporated by reference in any filing of Silicon Graphics International Corp. under the 1933 Act or the 1934 Act whether made before or after the date hereof and irrespective of any general incorporation language in any such filing. |
36
Table of Contents
Item 6. Selected Financial Data
The following selected summary consolidated financial data should be read in conjunction with Part II, Item 8. “Financial Statements and Supplementary Data,” and with Part II, Item 7. “Management’s Discussion and Analysis of Financial Condition and Results of Operations” in this Annual Report on Form 10-K.
On June 19, 2009, our Board of Directors approved a change in our fiscal year end from the Saturday closest to December 31st of each year to the last Friday in June of each year. As a result of this change, we had a six month transition period, which began on January 4, 2009 and ended on June 26, 2009. Accordingly, our fiscal year 2010 began on June 27, 2009 following a transition period that ended June 26, 2009. Additionally, this change in year end resulted in the quarter ended June 26, 2009 containing 83 days versus a standard 91 day quarter. The change in fiscal year end was made to facilitate the integration and consolidated reporting of the businesses and other related assets acquired and liabilities assumed from the acquisition of Legacy SGI.
| Year Ended June 25, 2010 (1) (3) (4) |
Six Months Ended June 26, 2009 (1) (3) (4) |
Year Ended | |||||||||||||||||||||
| January 3, 2009 (1) (2) (3) |
December 29, 2007 (1) (2) |
December 30, 2006 (1) (2) |
December 31, 2005 (1) | ||||||||||||||||||||
| (in thousands, except per share amounts) | |||||||||||||||||||||||
| Consolidated Statement of Operations Data: |
|||||||||||||||||||||||
| Revenue |
$ | 403,717 | $ | 102,777 | $ | 247,430 | $ | 350,684 | $ | 359,569 | $ | 214,985 | |||||||||||
| Gross profit |
89,589 | 7,777 | 29,438 | 47,244 | 76,446 | 49,656 | |||||||||||||||||
| Income (loss) from continuing operations before income taxes |
(93,302 | ) | (16,433 | ) | (30,911 | ) | (29,049 | ) | 24,506 | 18,420 | |||||||||||||
| Income tax provision (benefit) from continuing operations |
(4,441 | ) | (2,242 | ) | 376 | 12,531 | 10,589 | 9,908 | |||||||||||||||
| Net income (loss) from continuing operations |
(88,861 | ) | (14,191 | ) | (31,287 | ) | (41,580 | ) | 13,917 | 8,512 | |||||||||||||
| Income (loss) from discontinued operations |
409 | (20 | ) | (25,896 | ) | (33,941 | ) | (4,662 | ) | — | |||||||||||||
| Income tax benefit from discontinued operations |
— | — | (2,955 | ) | (5,964 | ) | (2,217 | ) | — | ||||||||||||||
| Income (loss) from discontinued operations, net of tax |
409 | (20 | ) | (22,941 | ) | (27,977 | ) | (2,445 | ) | — | |||||||||||||
| Net income (loss) |
$ | (88,452 | ) | $ | (14,211 | ) | $ | (54,228 | ) | $ | (69,557 | ) | $ | 11,472 | $ | 8,512 | |||||||
| Net income (loss) per share: |
|||||||||||||||||||||||
| Net income (loss) per share, basic |
|||||||||||||||||||||||
| Continuing operations |
$ | (2.95 | ) | $ | (0.48 | ) | $ | (1.06 | ) | $ | (1.45 | ) | $ | 0.52 | $ | 0.86 | |||||||
| Discontinued operations |
0.01 | — | (0.77 | ) | (0.97 | ) | (0.09 | ) | — | ||||||||||||||
| Net income (loss) per share, basic |
$ | (2.94 | ) | $ | (0.48 | ) | $ | (1.83 | ) | $ | (2.42 | ) | $ | 0.43 | $ | 0.86 | |||||||
| Net income (loss) per share, diluted |
|||||||||||||||||||||||
| Continuing operations |
$ | (2.95 | ) | $ | (0.48 | ) | $ | (1.06 | ) | $ | (1.45 | ) | $ | 0.49 | $ | 0.47 | |||||||
| Discontinued operations |
0.01 | — | (0.77 | ) | (0.97 | ) | (0.09 | ) | — | ||||||||||||||
| Net income (loss) per share, diluted |
$ | (2.94 | ) | $ | (0.48 | ) | $ | (1.83 | ) | $ | (2.42 | ) | $ | 0.40 | $ | 0.47 | |||||||
| Shares used in computing net income (loss) per share: |
|||||||||||||||||||||||
| Basic |
30,130 | 29,798 | 29,583 | 28,786 | 26,948 | 9,947 | |||||||||||||||||
| Diluted |
30,130 | 29,798 | 29,583 | 28,786 | 28,618 | 18,040 | |||||||||||||||||
37
Table of Contents
| (1) | Includes non-cash share-based compensation as follows: |
| Year Ended June 25, 2010 |
Six Months Ended June 26, 2009 |
Year Ended | ||||||||||||||||||
| January 3, 2009 |
December 29, 2007 |
December 30, 2006 |
December 31, 2005 | |||||||||||||||||
| (in thousands) | ||||||||||||||||||||
| Cost of revenue |
$ | 691 | $ | 423 | $ | 1,120 | $ | 2,152 | $ | 3,583 | $ | 91 | ||||||||
| Research and development |
767 | 524 | 1,811 | 3,160 | 4,480 | 70 | ||||||||||||||
| Selling and marketing |
445 | 579 | 1,568 | 5,040 | 6,087 | 261 | ||||||||||||||
| General and administrative |
2,924 | 1,689 | 4,653 | 10,731 | 5,858 | 131 | ||||||||||||||
| Total continuing operations |
4,827 | 3,215 | 9,152 | 21,083 | 20,008 | 553 | ||||||||||||||
| Discontinued operations |
(106 | ) | (111 | ) | 435 | 2,152 | 747 | — | ||||||||||||
| Total |
$ | 4,721 | $ | 3,104 | $ | 9,587 | $ | 23,235 | $ | 20,755 | $ | 553 | ||||||||
| (2) | Information has been restated to present the results of our Rapidscale product line as discontinued operations. See Note 19 to our financial statements for the fiscal year ended June 25, 2010 contained in this Annual Report on Form 10-K. The Rapidscale product line was purchased in 2006. |
| (3) | Includes restructuring charges of $5.2 million, $1.3 million, and $0.7 million for the year ended June 25, 2010, six months ended June 26, 2009, and year ended January 3, 2009, respectively. See Note 13 to our financial statements for the fiscal year ended June 25, 2010 contained in this Annual Report on Form 10-K. |
| (4) | On May 8, 2009, we completed the acquisition of substantially all of the assets of Legacy SGI, excluding certain assets unrelated to the ongoing business, including certain of Legacy SGI’s non-U.S. subsidiaries and operations and assumed certain liabilities. In the six months ended June 26, 2009, we recorded a gain from acquisition of $19.8 million. In addition, this transaction resulted to acqusition related gains of $3.3 million in year ended June 25, 2010 and acquisition related charges of $6.1 million in six months ended June 26, 2009. See Note 3 to our financial statements for the fiscal year ended June 25, 2010 contained in this Annual Report on Form 10-K. |
| June 25, 2010 |
June 26, 2009 |
January 3, 2009 |
December 29, 2007 |
December 30, 2006 |
December 31, 2005 | |||||||||||||
| (in thousands) | ||||||||||||||||||
| Consolidated Balance Sheet Data: |
||||||||||||||||||
| Cash and cash equivalents |
$ | 129,343 | $ | 128,714 | $ | 171,954 | $ | 49,897 | $ | 30,446 | $ | 29,099 | ||||||
| Working capital |
124,495 | 168,687 | 216,315 | 249,929 | 268,180 | 112,326 | ||||||||||||
| Total assets |
497,212 | 441,636 | 285,493 | 352,458 | 406,770 | 176,042 | ||||||||||||
| Total liabilities |
362,283 | 223,537 | 54,004 | 76,340 | 91,081 | 52,777 | ||||||||||||
| Total stockholders’ equity |
134,929 | 218,099 | 231,489 | 276,118 | 315,689 | 123,265 | ||||||||||||
38
Table of Contents
ITEM 7. Management’s Discussion and Analysis of Financial Condition and Results of Operations
The following discussion should be read in conjunction with, and is qualified in its entirety by reference to, our consolidated financial statements and the related notes included elsewhere in this Annual Report on Form 10-K. The discussions in this section contain forward-looking statements that involve risks and uncertainties, and actual results could differ materially from those discussed below. See “Item 1A—Risk Factors” and “Cautionary Statement Regarding Forward-Looking Information” at the beginning of this Annual Report on Form 10-K for a discussion of these risks and uncertainties.
Overview
We are a global leader in large-scale clustered computing and storage, high-performance compute and storage, and data center technologies integrated with a choice of software, customer support services and professional services. We are dedicated to solving the IT industry’s most demanding business and technology challenges by delivering clustered computing and storage solutions, high performance computing and storage solutions, Eco-Logical™ data center solutions, software and services. We develop, market, and sell a broad line of low cost, mid-range and high-end computing servers and data storage as well as differentiating software. We sell data center infrastructure products purpose-built for large-scale data center deployments. In addition, we provide global customer support and professional services related to our products. We enable enterprises to meet their computing and storage requirements at a lower total cost of ownership and provide them greater flexibility and scalability. We are also a leading developer of enterprise class, high-performance features for the Linux operating system that provide our customers with a standard Linux operating environment combined with our differentiated yet un-intrusive Linux capabilities that are designed to improve performance, simplify system management, and provide a more robust development environment.
We pioneered Eco-Logical data center design with innovative technologies in the areas of chassis and cabinet design, power distribution techniques, cooling techniques, and hardware-based remote management capabilities. We refer to these advantages as “Eco-Logical,” a term we trademarked to best describe our environmentally-friendly, efficient products. The term “eco” refers to the fact that our products are environmentally-friendly and efficient, while the term “logical” describes the ability of these products to enable smart, practical solutions for our end users. We offer compute servers using our Rackable™ half-depth rackmount design, enabling back-to-back mounting for higher server density and improved thermal management. We also offer compute servers using our CloudRack tray-based design that deliver similar advantages in a front-to-back cooling model. Data center products include ICE Cube, a modular data center which augments or replaces traditional brick-and-mortar facilities and MobiRack for mobile, all-in-one data center capabilities for field deployments.
Our products and services are used by the scientific, technical, and business communities to solve challenging data-intensive computing, data storage and management problems. These problems typically require large amounts of computing power and fast and efficient data movement both within the computing system and to and from large-scale data storage installations. Enterprises have also begun to deploy large-scale computing and storage installations by aggregating large numbers of relatively inexpensive, open-standard modular computing and storage systems. Our end-users employ our systems to access, analyze, transform, manage, visualize and store very large amounts of data in real time or near real time by running low-cost operating systems such as Linux® and Microsoft® Windows® and, we believe, enable enterprises to meet their computing and storage requirements at a lower total cost of ownership and provide enterprises with greater flexibility and scalability. The vertical markets we serve include defense and strategic systems, weather and climate, physical sciences, life sciences, energy (including oil and gas), aerospace and automotive, media and entertainment, semiconductor design, manufacturing, financial services, data centers, and business intelligence and data analytics.
Applications for our systems within these vertical markets include simulating global climate changes, accelerating engineering of new automotive designs, supporting homeland security initiatives, providing real -
39
Table of Contents
time fraud detection, streaming media from Internet-video to film and gaining business intelligence through data-mining. Our global services organization facilitates rapid installation and implementation of our products, assists in optimizing the use of our products, maintains their availability to serve our customers and educates customers to increase productivity.
From developing custom semi-conductors to data center solutions, we differentiate by scaling for compute and data intensive workloads of our customers’ most demanding applications. We have 1,325 employees worldwide and we sell and market our systems, technologies, software, and services, to enterprises in 26 countries through our direct and indirect sales force including original equipment manufacturers, system integrators and value added resellers. In the year ended June 25, 2010, six-months ended June 26, 2009, and the year ended January 3, 2009, international sales were approximately 25%, 25% and 8%, respectively, of our total revenue.
Significant events
Our financial results during the year ended June 25, 2010 were affected by certain significant events that should be considered in comparing the periods presented.
Acquisition of Silicon Graphics, Inc.
On May 8, 2009, we acquired substantially all of the assets, excluding certain assets unrelated to the ongoing business and assumed certain liabilities of Silicon Graphics, Inc. (an entity in Chapter 11 of the U.S. Bankruptcy code) (“Legacy SGI”) for approximately $42.5 million in cash.
Change in Corporate Name and Trading Symbol
On May 18, 2009, we changed our name to Silicon Graphics International Corp. (“SGI”) and changed our NASDAQ stock ticker symbol from “RACK” to “SGI.”
Change in fiscal year
On June 19, 2009, our Board of Directors approved a change in our fiscal year-end from the Saturday closest to December 31st of each year to the last Friday in June of each year. As a result of this change, we had a six month transition period, which began on January 4, 2009, ended on June 26, 2009. Accordingly, our fiscal year 2010 began on June 27, 2009 following a transition period that ended June 26, 2009. The change in fiscal year-end was made to facilitate the integration and consolidated reporting of the businesses and other related assets acquired and liabilities assumed from Legacy SGI.
The financial periods presented and discussed will be as follows: (i) the year ended June 25, 2010 represents the 52-week fiscal year ended June 25, 2010; (ii) the six-month transition period ended June 26, 2009 represents 25-week, six months ended June 26, 2009; (iii) the year ended January 3, 2009 represents the 53-week fiscal year ended January 3, 2009; and (iv) the year ended December 29, 2007 represents 52-week fiscal year ended December 29, 2007. In addition, the six months ended June 28, 2008 (unaudited) is presented to compare to the six months ended June 26, 2009.
Results of Operations
We have included the operating results associated with the acquisition of Legacy SGI assets in our consolidated financial statements only for the periods since the date of the acquisition in May 2009, which has significantly affected our revenues, results of operations and financial position. Accordingly, the results of operations for the year ending June 25, 2010 presented below are not comparable to the results for the year ending January 3, 2009.
40
Table of Contents
The following table sets forth our financial results for the years ended June 25, 2010, January 3, 2009, and December 29, 2007, and for the six months ended June 26, 2009 as a percentage of revenue:
| Year Ended | Six Months Ended | ||||||||||||||
| June 25, 2010 |
January 3, 2009 |
December 29, 2007 |
June 26, 2009 |
June 28, 2008 |
|||||||||||
| Revenue |
100.0 | % | 100.0 | % | 100.0 | % | 100.0 | % | 100.0 | % | |||||
| Cost of revenue |
77.8 | 88.1 | 86.5 | 92.4 | 83.0 | ||||||||||
| Gross profit |
22.2 | 11.9 | 13.5 | 7.6 | 17.0 | ||||||||||
| Operating expenses: |
|||||||||||||||
| Research and development |
14.1 | 6.0 | 3.9 | 10.5 | 5.0 | ||||||||||
| Sales and marketing |
16.1 | 9.5 | 9.3 | 17.7 | 8.5 | ||||||||||
| General and administrative |
13.0 | 9.9 | 10.2 | 13.6 | 9.6 | ||||||||||
| Restructuring |
1.3 | 0.3 | — | 1.2 | 0.5 | ||||||||||
| Acquisition-related |
(0.8 | ) | — | — | 5.9 | — | |||||||||
| Impairment of long-lived assets |
— | — | 0.8 | — | — | ||||||||||
| Gain from settlement agreement |
— | — | — | (4.8 | ) | — | |||||||||
| Gain from acquisition |
— | — | — | (19.3 | ) | — | |||||||||
| Total operating expenses |
43.7 | 25.7 | 24.2 | 24.8 | 23.6 | ||||||||||
| Loss from operations |
(21.5 | ) | (13.8 | ) | (10.7 | ) | (17.2 | ) | (6.6 | ) | |||||
| Interest and other income (expense) |
|||||||||||||||
| Interest income, net |
0.1 | 1.7 | 2.3 | 0.1 | 2.0 | ||||||||||
| Other income (expense), net |
(1.7 | ) | (0.4 | ) | 0.1 | 1.1 | — | ||||||||
| Total other income (expense) |
(1.6 | ) | 1.3 | 2.4 | 1.2 | 2.0 | |||||||||
| Loss from continuing operations before income taxes |
(23.1 | ) | (12.5 | ) | (8.3 | ) | (16.0 | ) | (4.6 | ) | |||||
| Income tax provision (benefit) from continuing operations |
(1.1 | ) | 0.1 | 3.5 | (2.2 | ) | 1.1 | ||||||||
| Net loss from continuing operations |
(22.0 | ) | (12.6 | ) | (11.8 | ) | (13.8 | ) | (5.7 | ) | |||||
| Discontinued operations: |
|||||||||||||||
| Income (loss) from discontinued operations |
0.1 | (10.5 | ) | (9.7 | ) | — | (16.4 | ) | |||||||
| Income tax benefit |
— | (1.2 | ) | (1.7 | ) | — | (2.0 | ) | |||||||
| Income (loss) from discontinued operations, net of tax |
0.1 | (9.3 | ) | (8.0 | ) | — | (14.4 | ) | |||||||
| Net loss |
(21.9 | )% | (21.9 | )% | (19.8 | )% | (13.8 | )% | (20.1 | )% | |||||
Comparison of the years ended June 25, 2010 and January 3, 2009
Financial Highlights
| • | Our higher revenue and gross margin in the year ended June 25, 2010 was a result of including higher margin high performance compute server and storage products and the related service revenue associated with our acquisition of Legacy SGI. |
| • | We experienced a significant increase in our operating expenses due to including the results of operations of the Legacy SGI acquisition in the year ended June 25, 2010. |
| • | As a result of the acquisition, our headcount significantly increased from 318 employees as of January 3, 2009 to 1,325 employees as of June 25, 2010. Our properties also increased significantly from approximately 177,000 square feet of floor space as of January 3, 2009 to approximately 436,000 square feet of leased floor space as of June 25, 2010. As of June 25, 2010, we also own land and buildings with aggregate floor space of approximately 268,000 square feet. |
41
Table of Contents
| • | During the year ended June 25, 2010, we experienced a significant decrease in total share-based compensation expense due to a declining stock price and employee turnover compared to the year ended January 3, 2009. |
Revenue, cost of revenue, gross profit and gross margin
The following table presents revenue, cost of revenue, gross profit, and gross margin for the years ended June 25, 2010 and January 3, 2009:
| Year ended | Change | ||||||||||||||
| June 25, 2010 |
January 3, 2009 |
$ | % | ||||||||||||
| (in thousands, except percentages) |
|||||||||||||||
| Product revenue |
$ | 256,007 | $ | 247,430 | $ | 8,577 | 3 | % | |||||||
| Service revenue |
147,710 | — | 147,710 | n/a | |||||||||||
| Total revenue |
$ | 403,717 | $ | 247,430 | $ | 156,287 | 63 | % | |||||||
| Cost of product revenue |
$ | 229,913 | $ | 217,992 | $ | 11,921 | 5 | % | |||||||
| Cost of service revenue |
84,215 | — | 84,215 | n/a | |||||||||||
| Total cost of revenue |
$ | 314,128 | $ | 217,992 | $ | 96,136 | 44 | % | |||||||
| Product gross profit |
$ | 26,094 | $ | 29,438 | $ | (3,344 | ) | (11 | )% | ||||||
| Service gross profit |
63,495 | — | 63,495 | n/a | |||||||||||
| Total gross profit |
$ | 89,589 | $ | 29,438 | $ | 60,151 | 204 | % | |||||||
| Product gross margin |
10.2 | % | 11.9 | % | |||||||||||
| Service gross margin |
43.0 | % | — | % | |||||||||||
| Overall gross margin |
22.2 | % | 11.9 | % | |||||||||||
Revenue. We derive revenue from the sale of products and services directly to end-users as well as through resellers and system integrators. Product revenue is derived from the sale of mid-range to high-end computing servers and data storage systems as well as software. We enter into sales contracts which obligate the delivery of multiple products and/or services. In accordance with our revenue recognition policy, certain sales contracts are deferred and recognized over the service period. Service revenue is generated from the sale of standard maintenance contracts as well as custom maintenance contracts that are tailored to individual customer’s needs. We recognize service revenue ratably over the service periods when the service contracts are expressly priced separately from products. Maintenance contracts are typically between one to three years in length and we actively pursue renewals of these contracts. We also generate professional services revenue related to implementation of and training on our products.
Revenue increased $156.3 million or 63% to $403.7 million in the year ended June 25, 2010 from $247.4 million in the year ended January 3, 2009. The increase in revenue was primarily due to the addition of revenue from high performance compute server and storage products and related service revenue associated with our acquisition of Legacy SGI. The acquisition of Legacy SGI contributed $235.0 million of revenue in the year ended June 25, 2010. Revenue from the sale of data center products and services of $168.7 million decreased $78.7 million or 32% in the year ended June 25, 2010 as compared with $247.4 million in the year ended January 3, 2009. The decline was primarily due to a 31% decrease in the number of units shipped, reflecting the economic downturn which we believe has impacted the timing of our customer’s buying decisions, and slight decrease in average selling price compared to prior year.
Cost of revenue and gross profit. Cost of revenue consists of costs associated with direct material, labor, manufacturing overhead, shipment of products, inventory write downs and share-based compensation. Cost of revenue also includes personnel costs for providing maintenance and professional services. Our manufacturing overhead and professional services personnel costs are fixed or semi-variable and we are not able to reduce them
42
Table of Contents
in proportion to the reduction in revenue. Additionally, changes in customer and product mix, pricing actions by our competitors and commodity prices that comprise a significant portion of cost of revenue, significantly impact gross margin from period to period. Further when certain sales contracts are deferred in accordance with our revenue recognition policy, the related cost of revenue is deferred and recognized over the service period.
With the acquisition of Legacy SGI, we added facilities and personnel that contribute to an increase in our cost of revenue. Our headcount increased by 448 employees from 128 employees at January 3, 2009 to 576 employees at June 25, 2010. Cost of revenue increased by a lower percentage than revenue due to a shift in mix towards a greater percentage of higher margin service offerings and high performance compute server and storage products.
Gross profit increased $60.2 million to $89.6 million in the year ended June 25, 2010 from $29.4 million in the year ended January 3, 2009. Gross margin percentage increased to 22.2% in the year ended June 25, 2010 from 11.9% in the year ended January 3, 2009. Our increase in gross profit and gross margin was primarily attributable to higher margin high performance compute server and storage product revenue and related service revenue associated with our acquisition of Legacy SGI, which had gross margin of 31.7% and contributed $74.5 million in gross profit in the year ended June 25, 2010. Gross profit from the sale of data center products and services decreased $14.4 million or 48.8% to $15.1 million in the year ended June 25, 2010 from $29.4 million in the year ended January 3, 2009.
Operating Expenses
Operating expenses for the years ending June 25, 2010 and January 3, 2009 were as follows:
| Year ended | Change | |||||||||||||
| June 25, 2010 |
January 3, 2009 |
$ | % | |||||||||||
| (in thousands, except percentages) | ||||||||||||||
| Research and development |
$ | 56,865 | $ | 14,864 | $ | 42,001 | 283 | % | ||||||
| Sales and marketing |
$ | 64,831 | $ | 23,412 | $ | 41,419 | 177 | % | ||||||
| General and administrative |
$ | 52,594 | $ | 24,526 | $ | 28,068 | 114 | % | ||||||
| Restructuring |
$ | 5,213 | $ | 685 | $ | 4,528 | 661 | % | ||||||
| Acquisition-related |
$ | (3,264 | ) | $ | — | $ | (3,264 | ) | n/a | |||||
Research and development. Research and development expense consists primarily of personnel and related costs, contractor fees, new component testing and evaluation, test equipment, new product design and testing, other product development activities, share-based compensation, and facilities and information technology costs.
Research and development expense increased $42.0 million or 283% to $56.9 million in the year ended June 25, 2010 from $14.9 million in the year ended January 3, 2009. The overall increase in research and development expenses was primarily due to the expansion of our business and research and development activities which resulted from our acquisition of Legacy SGI. In the year ended June 25, 2010, our compensation and related expenses increased by $26.6 million due to an increase in research and development headcount from 60 employees at January 3, 2009 to 270 employees at June 25, 2010. Additionally, materials and supplies increased $2.8 million and third-party research and development services increased $5.5 million, primarily driven by expenses incurred for development of our UV system and other new products. Further, facilities costs increased $3.0 million and depreciation expense increased $4.2 million. These increases were partially offset by lower share-based compensation related expenses of $1.1 million due to declining stock price and employee turnover.
We believe that focused investments in research and development are critical to our future performance and competitiveness in the marketplace. Our investments in this area will directly relate to enhancement of our current product line, development of new products that achieve market acceptance, and our ability to meet an expanding range of customer requirements. As such, we expect to continue to spend on current and future product development efforts.
43
Table of Contents
Sales and marketing. Sales and marketing expense consists primarily of salaries, bonuses and commissions paid to our sales and marketing employees, amortization of intangible assets, share-based compensation, and facilities and information technology costs. We also incur marketing expenses for activities such as trade shows, direct mail and print advertising. Sales and marketing expense and period-over-period changes are as follows:
Sales and marketing expense increased $41.4 million or 177% to $64.8 million in the year ended June 25, 2010 from $23.4 million in the year ended January 3, 2009. The overall increase in sales and marketing expense was primarily due to the expansion of our business which resulted from our acquisition of Legacy SGI. In the year ended June 25, 2010, our compensation and related expenses increased by $29.5 million due to an increase in sales and marketing headcount from 70 employees at January 3, 2009 to 291 employees at June 25, 2010. Our facilities costs, rent expenses, and depreciation expenses are higher in the year ended June 25, 2010 by $6.3 million compared to the year ended January 3, 2009. We also experienced an increase in marketing costs of $1.4 million and higher travel and entertainment expenses of $1.4 million. In addition, we recorded intangible asset amortization expense of $5.0 million during the year ended June 25, 2010 related to the amortization of customer backlog intangible asset acquired as part of our acquisition of Legacy SGI. There was no intangible asset amortization for the year ended January 3, 2009. This increase in sales and marketing expense was reduced by lower share-based compensation costs of $1.1 million due to declining stock price and employee turnover, and write-off of loaner and demo equipments of $2.2 million recorded in the year ended January 3, 2009.
We will continue to deploy our sales and support organizations to focus on key vertical markets such as defense and strategic systems, weather and climate, physical sciences, life sciences, energy (including oil and gas), aerospace and automotive, media and entertainment, semiconductor design, manufacturing, financial services, data centers, and business intelligence and data analytics.
General and administrative. General and administrative expense consists primarily of personnel costs, directors and officers insurance, legal and professional service costs, depreciation, share-based compensation, and facilities and information technology costs. General and administrative expense and period-over-period changes are as follows:
General and administrative expense increased $28.1 million or 114% to $52.6 million in the year ended June 25, 2010 from $24.5 million in the year ended January 3, 2009. The overall increase in general and administrative expense was primarily due to the expansion of our business which resulted from our acquisition of Legacy SGI. In the year ended June 25, 2010, our compensation and related expenses increased by $16.0 million due to increase in general and administrative headcount from 60 employees at January 3, 2009 to 188 employees at June 25, 2010. Due to the increased complexity of our business post-acquisition, our financial audit and SOX compliance fees increased by $1.3 million. Our outside tax consulting fees also increased by $2.1 million primarily due to an increase in consulting services regarding foreign tax issues, as we are now currently operating in 26 countries. Our legal expenses also increased by $1.6 million. Our third-party contractors and temporary employees increased by $3.0 million primarily driven by outsourcing of finance and IT related functions in the year ended June 25, 2010 as we integrated Legacy SGI. Facilities related expenses increased by $2.2 million. Our property taxes also increased by $0.9 million, insurance by $1.0 million, and bad debt expense by $0.8 million. This increase in expenses was offset by lower share based compensation cost of $1.7 million due to a decline in stock price and employee turnover.
Restructuring. On July 27, 2009, management approved restructuring actions to reduce the Company’s European workforce and vacate certain facilities. The expense for the year ended June 25, 2010 related to these actions was $4.6 million for severance and $0.6 million for vacating facilities. As a result of the restructuring actions undertaken, the Company anticipates cash outflows of $1.3 million, primarily during fiscal year 2011.
Acquisition-related. In the year ended June 25, 2010, we recorded a net gain of $3.3 million, related to our acquisition of Legacy SGI. During the year ended June 25, 2010, we received a $1.0 million payment from Legacy SGI related to potential liabilities of Legacy SGI, which pursuant to the Agreement were to be remitted to the Company if not paid to a third party. In addition, we received $2.3 million from a Legacy SGI customer,
44
Table of Contents
resulting from a settlement of dispute with this customer which existed prior to the acquisition of Legacy SGI. At the Closing Date, we assessed whether it was more likely than not that contingent assets existed and based on all available information concluded that no contingent assets existed. Accordingly, we have recorded the $3.3 million payments received as a gain in our statement of operations in the year ended June 25, 2010.
Total other income (expense)
Total other income (expense) for the years ended June 25, 2010 and January 3, 2009 was as follows:
| Year ended | Change | ||||||||||||||
| June 25, 2010 |
January 3, 2009 |
||||||||||||||
| $ | % | ||||||||||||||
| (in thousands, except percentages) | |||||||||||||||
| Interest income, net |
$ | 436 | $ | 4,106 | $ | (3,670 | ) | (89 | )% | ||||||
| Other income (expense), net |
$ | (7,088 | ) | $ | (968 | ) | $ | (6,120 | ) | 632 | % | ||||
Interest income, net. Interest income, net primarily consists of interest earned on our investment portfolio. Interest income, net decreased $3.7 million or 89% primarily due to lower interest rates earned on our investment portfolio in the year ended June 25, 2010 as compared to the year ended January 3, 2009. Our cash and cash equivalents, including restricted cash and cash equivalents, and long-term investments in ARS was $140.8 million as of June 25, 2010 and $180.6 million as of January 3, 2009.
Other income (expense), net. Other income (expense), net primarily consists of foreign exchange loss. The foreign exchange loss was $7.2 million in year ended June 25, 2010 and $0.7 million in year ended January 3, 2009. In the year ended June 25, 2010, we experienced an unfavorable exchange rate effect resulting from the weakening of the U.S dollar against the Euro.
Income tax provision (benefit) from continuing operations
Income tax provision (benefit) from continuing operations for the years ended June 25, 2010 and January 3, 2009 was as follows:
| Year ended | Change | |||||||||||||
| June 25, 2010 |
January 3, 2009 |
|||||||||||||
| $ | % | |||||||||||||
| (in thousands, except percentages) | ||||||||||||||
| Income tax provision (benefit) from continuing operations |
$ | (4,441 | ) | $ | 376 | $ | (4,817 | ) | (1,281 | )% | ||||
We recorded a net tax benefit of $4.4 million for the year ended June 25, 2010. The net income tax benefit includes a discrete tax benefit of $4.9 million resulting from the November 6, 2009 enactment of the Worker, Homeownership, and Business Assistance Act of 2009 (the Act). The Act provides an election for federal taxpayers to increase the carry back period for an applicable net operating loss to three to five years from two years. Additional amounts recorded include a discrete tax benefit of $1.0 million attributable to release of valuation allowance and tax expense of $1.1 million for unrecognized tax benefits and related interest. The effective tax rate used to record the tax expense differed from the combined federal and net state statutory income tax rate for the year ended June 25, 2010 primarily due to the discrete items noted above and the fact that we do not record a benefit for operating losses generated during the period due to uncertainties regarding the realizability of the resulting loss carryforwards.
Our income tax provision recorded for the year ended January 3, 2009 consisted primarily of current year refunds of prior taxes paid offset by the recording of a valuation allowance for deferred tax asset balances due to the Company’s current loss position. Our effective tax rate for the year ended January 3, 2009 differed from the combined federal and state statutory rate primarily due to the recording of the valuation allowance.
45
Table of Contents
As of June 25, 2010, we have provided a full valuation allowance against the majority of our net deferred tax assets. Based on all available evidence, on a jurisdictional basis, including our historical operating results, and the uncertainty of predicting our future income, the valuation allowance reduces the majority of our deferred tax assets to an amount that is more likely than not to be realized. The amount of the valuation allowance is attributable to U.S. federal, state and certain foreign deferred tax assets primarily consisting of net operating loss carryovers, tax credit carryovers, accrued expenses, and other temporary differences. As of June 25, 2010, we have determined that it is more likely than not that certain foreign deferred tax assets will be realized and as a result, we released the valuation allowance related to the deferred tax assets of certain foreign subsidiaries. We continue to evaluate the realizability of deferred tax assets and related valuation allowance. If our assessment of the deferred tax assets or the corresponding valuation allowance were to change, we would record the related adjustment to income during the period in which management makes the determination.
As of January 3, 2009, we had provided a full valuation allowance against net deferred tax assets.
Income (loss) from discontinued operations, net of tax
Income (loss) from discontinued operations, net of tax, for the years ended June 25, 2010 and January 3, 2009 was as follows:
| Year ended | Change | ||||||||||||
| June 25, 2010 |
January 3, 2009 |
$ | % | ||||||||||
| (in thousands, except percentages) | |||||||||||||
| Income (loss) from discontinued operations, net of tax |
$ | 409 | $ | (22,941 | ) | $ | 23,350 | (102 | )% | ||||
During the year ended January 3, 2009, we classified our Rapidscale product line as a discontinued operation as a result of discontinuing this product line. Our decision was a result of a change in strategic direction, as well as an inability to license certain third party software on reasonable commercial terms.
We do not believe this discontinued operation will have a significant negative impact on our future results of operations. The revenue contribution from this product line was $0.4 million and $0.7 million for the years ended June 25, 2010 and January 3, 2009, respectively.
Comparison of the six month transition period ended June 26, 2009 and the six months ended June 28, 2008 (unaudited)
Financial Highlights
| • | Our lower revenue and gross margin was primarily attributed to a decrease in the number of units shipped as well as a decrease in the average selling price partially offset by six weeks of revenue from our acquisition of Legacy SGI. |
| • | We experienced a significant increase in our operating expenses due to the acquisition of Legacy SGI in May 2009 during the six month transition period ended June 26, 2009. |
| • | We experienced a significant decrease in total share-based compensation expense due to a declining stock price and employee turnover. Total share-based compensation expense decreased by approximately $4.1 million from $7.2 million in the six month ended June 28, 2008 to $3.1 million for the six months ended June 26, 2009. |
46
Table of Contents
Revenue, cost of revenue, gross profit and gross margin
The following table presents revenue, cost of revenue, gross profit, and gross margin for the six months ended June 26, 2009 and June 28, 2008:
| Six months ended | Change | ||||||||||||||
| June 26, 2009 |
June 28, 2008 |
$ | % | ||||||||||||
| (unaudited) | |||||||||||||||
| (in thousands, except percentages) | |||||||||||||||
| Product revenue |
$ | 77,987 | $ | 143,569 | $ | (65,582 | ) | (46 | )% | ||||||
| Service revenue |
24,790 | — | 24,790 | n/a | |||||||||||
| Total revenue |
$ | 102,777 | $ | 143,569 | $ | (40,792 | ) | (28 | )% | ||||||
| Cost of product revenue |
$ | 78,132 | $ | 119,159 | $ | (41,027 | ) | (34 | )% | ||||||
| Cost of service revenue |
16,868 | — | 16,868 | n/a | |||||||||||
| Total cost of revenue |
$ | 95,000 | $ | 119,159 | $ | (24,159 | ) | (20 | )% | ||||||
| Product gross profit |
$ | (145 | ) | $ | 24,410 | $ | (24,555 | ) | (101 | )% | |||||
| Service gross profit |
7,922 | — | 7,922 | n/a | |||||||||||
| Total gross profit |
$ | 7,777 | $ | 24,410 | $ | (16,633 | ) | (68 | )% | ||||||
| Product gross margin |
(0.2 | )% | 17.0 | % | |||||||||||
| Service gross margin |
32.0 | % | — | ||||||||||||
| Overall gross margin |
7.6 | % | 17.0 | % | |||||||||||
Revenue. Revenue decreased $40.8 million or 28% in the six months ended June 26, 2009 from $143.6 million in the six months ended June 28, 2008. The decline was primarily due to a 53% decrease in the number of units shipped over the prior year period. The decline was offset by a 6% increase in average selling price reflecting customer and product configuration mix changes. The decline was partially offset by six weeks of revenue from our acquisition of Legacy SGI assets during the six months ended June 26, 2009 which contributed $30.7 million of revenue to our results for the period.
Cost of revenue and gross profit. The decline in cost of revenue is less than the decline in revenue due to the fixed nature of our manufacturing overhead and personnel costs. Additionally, with the acquisition of Legacy SGI, we added facilities and personnel that contributed to our cost of revenue.
The lower gross margin for the six months ended June 26, 2009 compared to the six months ended June 28, 2008 is primarily attributed to a decrease in average selling price and number of units shipped. In the current year, we experienced a 53% decrease in the number of units shipped which was offset by a 6% increase in average selling price. The decrease in units shipped resulted in $13.0 million decrease in gross margin and an $11.6 million decrease related to lower gross margin on those shipments. Lower gross margin was also a result of excess and obsolete charges being a higher percentage of revenue in the six months ended June 26, 2009 compared to the six months ended June 28, 2008. This was offset by higher margin revenue earned from the Legacy SGI business. Legacy SGI contributed $7.6 million in gross profit in the six months ended June 26, 2009.
47
Table of Contents
Operating Expenses
Operating expenses for the six months ended June 26, 2009 and June 28, 2008 were as follows:
| Six months ended | Change | |||||||||||||
| June 26, 2009 |
June 28, 2008 |
$ | % | |||||||||||
| (unaudited) | ||||||||||||||
| (in thousands, except percentages) | ||||||||||||||
| Research and development |
$ | 10,729 | $ | 7,239 | $ | 3,490 | 48 | % | ||||||
| Sales and marketing |
$ | 18,236 | $ | 12,196 | $ | 6,040 | 50 | % | ||||||
| General and administrative |
$ | 14,013 | $ | 13,790 | $ | 223 | 2 | % | ||||||
| Restructuring |
$ | 1,270 | $ | 685 | $ | 585 | 85 | % | ||||||
| Acquisition-related |
$ | 6,070 | $ | — | $ | 6,070 | n/a | |||||||
| Gain from settlement agreement |
$ | (5,000 | ) | $ | — | $ | (5,000 | ) | n/a | |||||
| Gain from acquisition |
$ | (19,831 | ) | $ | — | $ | (19,831 | ) | n/a | |||||
Research and development. Research and development expenses increased $3.5 million or 48% in the six months ended June 26, 2009 from $7.2 million in the six months ended June 28, 2008. The increase was primarily due to a $3.4 million increase in compensation and related expenses resulting from an increase in headcount primarily from our acquisition of Legacy SGI. Headcount in research and development increased from 63 employees to 275 employees due to the addition of 212 employees as a result of the Legacy SGI acquisition. The increase is also attributed to an increase in our facilities costs of $0.5 million as we now have facilities in more locations and an increase in depreciation expense of $0.6 million. Materials and supplies usage increased by $0.4 million due to our acquisition of Legacy SGI. These increases were offset by a decrease in our share-based compensation expense of $0.8 million and Legacy SGI research and development reimbursement arrangements with business partners of $0.9 million.
Sales and marketing. Sales and marketing expense increased $6.0 million or 50% in the six months ended June 26, 2009 from $12.2 million in the six months ended June 28, 2008. The increase was primarily due to $3.8 million increase in compensation and related expenses due to an increase in headcount from our acquisition of Legacy SGI. Headcount in sales and marketing increased from 52 employees to 308 employees due to the addition of 256 employees as a result of the Legacy SGI acquisition. We also recorded an impairment charge of $2.5 million related to the write down of the Rackable trade name. In addition, we experienced an increase in facilities expense of $0.6 million, information technology costs of $0.5 million, depreciation expense of $0.3 million and amortization of intangibles of $0.3 million as a result of our acquisition of Legacy SGI. The increase was offset by a decrease in share-based compensation of $0.7 million, decrease of $0.5 million in commissions and bonuses due to a decline in sales, decrease in use of evaluation systems of $0.3 million, and decrease in our recruiting costs of $0.3 million.
General and administrative. General and administrative expense increased $0.2 million or 2% in the six months ended June 26, 2009 from $13.8 million in the six months ended June 28, 2008. The increase was primarily due to $2.0 million increase in compensation and related expenses due to an increase in headcount from our acquisition of Legacy SGI. Headcount in general and administrative increased from 47 employees to 197 employees due to the addition of 150 employees as a result of the Legacy SGI acquisition. The increase is also due to an increase in tax settlement expense of $0.4 million. The increase was offset by a decrease in share-based compensation expense of $1.8 million.
Restructuring. Restructuring expense consist primarily of severance costs and costs to exit facilities. Restructuring expenses increased $0.6 million or 85% for the six months ended June 26, 2009 from $0.7 million in the six months ended June 28, 2008. Restructuring expenses in the current quarter consist of severance costs for employees that were terminated as a result of the Legacy SGI acquisition. We incurred restructuring charges of $0.7 million related to future lease commitments for excess facilities vacated during the six months ended June 28, 2008.
48
Table of Contents
Acquisition-related. Acquisition-related cost for the six months ended June 26, 2009, were $6.1 million related to the acquisition of Legacy SGI consisting primarily of costs related to due diligence, legal and other professional fees.
Gain from settlement agreement. During the six months ended June 26, 2009, we reached a settlement with a customer over a dispute on the terms of a statement of work under which this customer agreed to pay us $5.0 million. No such benefit was recorded in any other period presented.
Gain from acquisition. During the six months ended June 26, 2009, we acquired substantially all of the assets of Legacy SGI. The estimated fair value of the acquired net assets of $62.3 million exceeds the $42.5 million cash consideration paid resulting in a bargain purchase gain of $19.8 million. No such gain was recorded in the six months ended June 28, 2008.
Total other income (expense)
Total other income (expense) for the six months ended June 26, 2009 and June 28, 2008 was as follows:
| Six months ended | Change | |||||||||||||
| June 26, 2009 |
June 28, 2008 |
$ | % | |||||||||||
| (unaudited) | ||||||||||||||
| (in thousands, except percentages) | ||||||||||||||
| Interest income, net |
$ | 176 | $ | 2,879 | $ | (2,703 | ) | (94 | )% | |||||
| Other income (expense), net |
$ | 1,101 | $ | (3 | ) | $ | 1,104 | * | ||||||
| * | not meaningful |
Total other income decreased for the six months ended June 26, 2009 by $1.6 million from $2.9 million in the six months ended June 28, 2008 to $1.3 million due to a decline in interest income, net of $2.7 million. Interest income, net decreased primarily due to lower interest rates earned on our investment portfolio in the six-months ended June 26, 2009 as compared to the six months ended June 28, 2008. This decline was partially offset by an increase in other income by $1.1 million, primarily due to an increase in foreign currency gains.
Income tax provision (benefit) from continuing operations
Income tax provision (benefit) from continuing operations for the six months ended June 26, 2009 and June 28, 2008 was as follows:
| Six months ended | Change | |||||||||||||
| June 26, 2009 |
June 28, 2008 |
$ | % | |||||||||||
| (unaudited) | ||||||||||||||
| (in thousands, except percentages) | ||||||||||||||
| Income tax provision (benefit) from continuing operations |
$ | (2,242 | ) | $ | 1,526 | $ | (3,768 | ) | (247 | )% | ||||
We recorded a tax benefit of $2.2 million and a tax provision of $1.5 million for the six months ended June 26, 2009 and June 28, 2008, respectively. The tax benefit was computed based on the year to date financial statements reflecting our new fiscal year end of June 26, 2009. The income tax benefit for the six months ended June 26, 2009 includes a tax benefit of $1.8 million resulting from the release of Legacy Rackable’s valuation allowance to offset the deferred tax liabilities recorded through the business combination of Legacy SGI. In addition, Legacy Rackable released valuation allowance in the amount of $0.8 million resulting from changing the classification of indefinite to definite lived intangible assets. The effective tax rate used to record the tax benefit differed from the combined federal and net state statutory income tax rate for the six months ended
49
Table of Contents
June 26, 2009 was primarily due to the release of Legacy Rackable’s valuation allowance and operating losses generated during the six months ended June 26, 2009 from which we do not benefit.
As of June 26, 2009, we have provided a full valuation allowance against net deferred tax assets. Management continues to evaluate the realizability of deferred tax assets and related valuation allowance. If management’s assessment of the deferred tax assets or the corresponding valuation allowance were to change, we would record the related adjustment to income during the period in which management makes the determination.
Loss from discontinued operations, net of tax
Loss from continuing operations, net of tax, for the six months ended June 26, 2009 and June 28, 2008 was as follows:
| Six months ended | Change | |||||||||||||
| June 26, 2009 |
June 28, 2008 |
$ | % | |||||||||||
| (unaudited) | ||||||||||||||
| (in thousands, except percentages) | ||||||||||||||
| Loss from discontinued operations, net of tax |
$ | (20 | ) | $ | (20,546 | ) | $ | 20,526 | (100 | )% | ||||
During the six months ended June 28, 2008, we classified our Rapidscale product line as a discontinued operation as a result of discontinuing this product line. Our decision was a result of a change in strategic direction, as well as an inability to license certain third party software on reasonable commercial terms.
The revenue contribution from this product line was not significant at $0.1 million and $0.3 million for the six months ended June 26, 2009 and June 28, 2008, respectively.
Comparison of the Years Ended January 3, 2009 and December 29, 2007
Financial Highlights
| • | Our revenue declined in fiscal year 2008 compared to fiscal year 2007 due to a decrease of 34% in units shipped. |
| • | We experienced a decrease in operating expenses due to a decrease in overall headcount to 318 employees at year end 2008 from 374 employees at year end 2007. |
| • | We ceased operations in Canada and discontinued our Rapidscale product line during fiscal year 2008. The results of this product line were reflected as discontinued operations in our financial statements. The Rapidscale product line incurred a net loss comprised primarily of impairment of long lived assets, costs related to the employment agreements in connection with our acquisition of Rapidscale, severance to former employees and occupancy-related expenses. |
| • | We experienced a significant decrease in total share-based compensation expense due to a declining stock price and employee turnover. |
Revenue, cost of revenue, gross profit and gross margin
The following table presents revenue, cost of revenue, gross profit, and gross margin for the years ended January 3, 2009 and December 29, 2007:
| Year ended | Change | ||||||||||||
| January 3, 2009 |
December 29, 2007 |
$ | % | ||||||||||
| (in thousands, except percentages) | |||||||||||||
| Revenue |
$ | 247,430 | $ | 350,684 | $ | (103,254 | ) | (29 | )% | ||||
| Cost of revenue |
$ | 217,992 | $ | 303,440 | $ | (85,448 | ) | (28 | )% | ||||
| Gross profit |
$ | 29,438 | $ | 47,244 | $ | (17,806 | ) | (38 | )% | ||||
| Gross margin |
11.9% | 13.5% | |||||||||||
50
Table of Contents
Revenue. The decline in revenue for the year ended January 3, 2009, compared to the year ended December 29, 2007, reflects the economic downturn which we believe has impacted the timing of our customers’ buying decisions. For the year ended January 3, 2009, revenue from our top three historical customers fell by 38% to $138.5 million or 56% of total revenue as compared with $223.2 million or 64% of total revenue in the year ended December 29, 2007. While the number of units shipped decreased 34% from the number shipped in fiscal year 2007, the average selling price increased 6% reflecting customer and product configuration mix changes.
Cost of revenue and gross profit. The decrease in gross profit for the year ended January 3, 2009 as compared to the prior year was primarily due to the lower revenue mentioned above due to fewer systems shipped and due to lower gross margin earned on these shipments. The primary cause for the decrease in gross margin for the year ended January 3, 2009 as compared to in the year ended December 29, 2007 was due to increased excess and obsolete inventory charges as a percentage of revenue in the year ended January 3, 2009 which was partially offset by an increase in the mix of higher margin customers.
Operating expenses.
Operating expenses for the years ended January 3, 2009 and December 29, 2007 were as follows:
| Year ended | Change | ||||||||||||
| January 3, 2009 |
December 29, 2007 |
$ | % | ||||||||||
| (in thousands, except percentages) | |||||||||||||
| Research and development |
$ | 14,864 | $ | 13,802 | $ | 1,062 | 8 | % | |||||
| Sales and marketing |
$ | 23,412 | $ | 32,461 | $ | (9,049 | ) | (28 | )% | ||||
| General and administrative |
$ | 24,526 | $ | 35,801 | $ | (11,275 | ) | (31 | )% | ||||
| Restructuring |
$ | 685 | $ | — | $ | 685 | n/a | ||||||
| Impairment of long-lived assets |
$ | — | $ | 2,820 | $ | (2,820 | ) | (100 | )% | ||||
Research and development. The increase in research and development expense for the year ended January 3, 2009 compared to the prior year was primarily due to increased employee and related expenses due to overall higher headcount throughout the year as compared to prior year, higher material usage related to the development of future product lines, and higher depreciation expense as a result of the addition of test systems to support engineering activities. These increases were partially offset by a decrease in share-based compensation during the period primarily due to the decline in our stock price and employee turnover.
Sales and marketing. The decrease in sales and marketing expense for the year ended January 3, 2009 compared to the year ended December 29, 2007, was primarily due to reduced share-based compensation expense due to the decline in our stock price and employee turnover, lower commission and sales expense due to lower revenue, and lower expense related to fewer evaluation units used to present and market our products to new customers.
General and administrative. The reduction of general and administrative expense for the year ended January 3, 2009 compared to the prior year was primarily due to reduced share-based compensation due to the decline in our stock price and employee turnover, a sales and use tax filing settlement resolved in fiscal 2007 which was not present in fiscal 2008, and reduced expense related to the amortization of intangibles related to the “Old Rackable” acquisition that became fully amortized by the end of fiscal 2007.
Restructuring. In the six months ended June 28, 2008, we relocated certain engineering activities that were being performed at our Milpitas, California facility, which was under lease through June 30, 2009. We negotiated and completed a lease termination agreement with the lessor, releasing us from any further responsibilities in exchange for a payment of $0.7 million. There were no such charges in the year ended December 29, 2007.
51
Table of Contents
Impairment of long-lived assets. In the year ended December 29, 2007, we had a $2.8 million charge related to impairment of goodwill. This charge was a result of our market capitalization at December 29, 2007, which was less than our net assets, including goodwill, at that time. We determined the current fair value of our assets and liabilities and concluded that the entire amount of the goodwill has been impaired.
Total other income (expense)
Total other income (expense) for the years ended January 3, 2009 and December 29, 2007 was as follows:
| Year ended | Change | |||||||||||||
| January 3, 2009 |
December 29, 2007 |
$ | % | |||||||||||
| (in thousands, except percentages) | ||||||||||||||
| Interest income, net |
$ | 4,106 | $ | 8,227 | $ | (4,121 | ) | (50 | )% | |||||
| Other income (expenses), net |
$ | (968 | ) | $ | 364 | $ | (1,332 | ) | (366 | )% | ||||
The decrease in other income (expense), net was primarily due to lower interest income earned on our investment portfolio due to declining interest rates and the economic downturn in the year ended January 3, 2009 as well as an increase in foreign exchange losses during the year.
Income tax provision from continuing operations
Income tax provision from continuing operations for the years ended January 3, 2009 and December 29, 2007 was as follows:
| Year ended | Change | ||||||||||||
| January 3, 2009 |
December 29, 2007 |
$ | % | ||||||||||
| (in thousands, except percentages) | |||||||||||||
| Income tax provision from continuing operations |
$ | 376 | $ | 12,531 | $ | (12,155 | ) | (97 | )% | ||||
Our income tax provision recorded for the year ended January 3, 2009 consists primarily of current year refunds of prior taxes paid offset by the recording of a valuation allowance for deferred tax asset balances due to our loss position. Our effective tax rate for the year ended January 3, 2009 differs from the combined federal and state statutory rate primarily due to the recording of the valuation allowance.
Our effective tax rate for the year ended December 29, 2007 differs from the combined federal and state statutory rate primarily due to increases in our valuation allowance for deferred tax assets and the write-off of goodwill, a majority of which is not deductible or amortizable for U.S. tax purposes.
Loss from discontinued operations, net of tax
Loss from discontinued operations, net of tax, for the years ended January 3, 2009 and December 29, 2007 was as follows:
| Year ended | Change | |||||||||||||
| January 3, 2009 |
December 29, 2007 |
$ | % | |||||||||||
| (in thousands, except percentages) | ||||||||||||||
| Loss from discontinued operations, net of tax |
$ | (22,941 | ) | $ | (27,977 | ) | $ | 5,036 | (18 | )% | ||||
During the year ended January 3, 2009, we classified our Rapidscale product line as a discontinued operation as a result of discontinuing this product line. Our decision was a result of a change in strategic direction, as well as an inability to license certain third party software on reasonable commercial terms. We
52
Table of Contents
recorded an impairment charge of $17.5 million of long lived assets due to significantly lowered projected revenue and cash flow from the Rapidscale product line. In October 2008, a formal plan to abandon the Rapidscale product line was reviewed and approved by management with appropriate authority and was communicated to the affected employees. Costs associated with closing down these operations in the year ended January 3, 2009 were not significant
The revenue contribution from this product line was not significant at $0.7 million and $2.5 million for the years ended January 3, 2009 and December 29, 2007, respectively.
Liquidity and Capital Resources
We had $129.3 million of cash and cash equivalents at June 25, 2010, $128.7 million at June 26, 2009, $172.0 million at January 3, 2009 and $49.9 million at December 29, 2007. Historically, we have required capital principally to fund our working capital needs and, during the six months ended June 26, 2009, we used $42.5 million of cash to acquire substantially all of the assets and certain liabilities of Legacy SGI.
At June 25, 2010, we had short-term and long-term restricted cash and cash equivalents of $3.9 million that are pledged as collateral for various guarantees issued to cover rent on leased facilities and equipment, to government authorities for value-added tax (“VAT”) and other taxes, and certain vendors to support payments in advance of delivery of goods and services. At June 25, 2010, we held $7.5 million of long-term investments consisting of various auction rate securities (“ARS”). Substantially all of the ARS are collateralized by guaranteed student loans, and insured or reinsured by the federal government. The credit markets are currently experiencing significant uncertainty, and some of this uncertainty has impacted the markets where our ARS would be offered. Given the recent disruptions in the credit markets and the fact that the liquidity for these types of securities remains uncertain, our investments in ARS are not currently available to meet liquidity needs. For additional information related to our investments in ARS investments see Note 4 in our Consolidated Financial Statements in this Form 10-K.
The adequacy of these resources to meet our liquidity needs beyond the next twelve months will depend on our growth, operating results and capital expenditures required to meet our business needs. If we fail to generate cash from operations, or generate additional cash from our operations on a timely basis, we may not have the cash resources required to run our business and we may need to seek additional sources of funds to meet our needs. Cash flows from our discontinued operations have been included in our consolidated statement of cash flows with continuing operations within each cash flow category. The absence of cash flows from discontinued operations is not expected to affect our future liquidity or capital resources.
At June 25, 2010, we believe our current cash and cash equivalents will be sufficient to fund working capital requirements, capital expenditures, and operations for at least the next twelve months. We intend to retain any future earnings to support operations and to finance the growth and development of our business, and we do not anticipate paying any dividends in the foreseeable future. At the present time, we have no material commitments for capital expenditures.
If we require additional capital resources to expand our business internally or to acquire complementary technologies and businesses at any time in the future, we may seek to sell additional equity or debt securities or obtain other debt financing. The sale of additional equity or debt securities could result in more dilution to our stockholders. Financing arrangements may not be available to us, or may not be available in amounts or on terms acceptable to us.
53
Table of Contents
The following is a summary of cash activity (in thousands):
| Year Ended | Six
Months Ended June 26, 2009 |
|||||||||||||||
| June 25, 2010 |
January 3, 2009 |
December 29, 2007 |
||||||||||||||
| Consolidated statements of cash flows data: |
||||||||||||||||
| Net cash provided by (used in) operating activities |
$ | 8,197 | $ | (15,699 | ) | $ | 46,075 | $ | (27,014 | ) | ||||||
| Net cash provided by (used in) investing activities |
(8,500 | ) | 137,433 | (32,145 | ) | (15,097 | ) | |||||||||
| Net cash provided by (used in) financing activities |
932 | 148 | 5,547 | (1,014 | ) | |||||||||||
Operating Activities
Cash provided by operating activities of $8.2 million for the year ended June 25, 2010 reflected cash provided by changes in working capital of $44.2 million, offset by our net loss of $64.6 million, net of adjustments for non-cash items. The primary working capital sources of cash were an increase in deferred revenue and decreases in inventories and prepaid and other current assets. The primary working capital uses of cash were increases in deferred cost of revenue and accounts receivable and a decrease in accounts payable and other liabilities. Non-cash items consisted primarily of depreciation and amortization of $18.4 million and share-based compensation of $4.7 million.
For the year ended June 25, 2010, deferred revenue increased $145.3 million, primarily due to the timing of revenue recognition on sales transactions which were required to be deferred in accordance with our revenue recognition policy. Inventory decreased $28.3 million due to timing of inventory purchases and shipments to customers. Further, prepaids and other current assets decreased $7.7 million, primarily due to a tax refund received and collection of other receivables. These sources of cash were offset by an increase in deferred cost of revenue of $88.5 million related to the increase in deferred revenue. Additionally, accounts receivable increased $15.5 million, reflecting an increase in shipments and the timing of sales. Accounts payable decreased $4.2 million, primarily due to the timing of payments. Other current liabilities decreased $3.6 million, primarily due to decrease in warranty reserve. Other liabilities increased $2.2 million, primarily due to increase in interest and penalties related to unrecognized tax benefits, which are classified as components of income tax expense.
During the six months ended June 26, 2009, cash used in operating activities was $27.0 million. Our net loss included non-cash items for a gain on acquisition of $19.8 million, gain on settlement of $5.0 million, depreciation and amortization of $3.3 million, share-based compensation of $3.1 million, and impairment charge of $2.5 million due to the write down of the Legacy Rackable trade name. Cash used for working capital was approximately $3.2 million, primarily due to increases in accounts receivable, prepaid expenses and other current assets, and a decrease in deferred revenue, offset by an increase in accounts payable.
For the six months ended June 26, 2009, accounts receivable increased by $10.0 million, net of acquired receivables of $22.5 million, reflecting timing of sales and weaker collection results. Prepaid expenses and other current assets increased $6.9 million due primarily to an increase in other receivables consisting primarily of rebates receivable from vendors. Deferred revenue decreased by $11.4 million, net of acquired deferred revenue of $76.3 million. These uses of cash were offset by an increase in accounts payable of $15.6 million due to an increase in expenses related to the acquisition and integration of Legacy SGI that remained unpaid at June 26, 2009. In addition, there was a decrease in inventories and deferred cost of revenue, net of assets acquired, of $10.2 million. The increase in other current liabilities is primarily due to an increase in sales, use and income tax payable.
During the year ended January 3, 2009, cash used in operating activities totaled $15.7 million due to our net loss exceeding both our non-cash items and changes in operating assets and liabilities. Our net loss included substantial non-cash items in the form of stock compensation of $9.6 million, impairment of long-lived assets of
54
Table of Contents
$17.5 million and depreciation and amortization of long-lived assets of $5.6 million, partially offset by the decrease in deferred tax liabilities of $1.5 million. These non-cash items totaled $31.9 million. Changes in operating assets and liabilities offset our net loss by approximately $6.6 million, primarily in accounts receivable, prepaid and other assets, accounts payable, deferred revenue and deferred cost of revenue.
For the year ended January 3, 2009, accounts receivable decreased $22.1 million, reflecting decreased revenue and the timing of sales in the year ended January 3, 2009 over the year ended December 29, 2007. Revenue in the fourth quarter ended December 29, 2007 was $111.3 million versus $38.7 million in the fourth quarter ended January 3, 2009. Prepaid and other assets decreased $14.1 million, primarily due to a substantial decrease in prepaid taxes as well as a reduction in supplier rebates over the prior year. Accounts payable decreased $26.2 million primarily due to our timing of inventory purchases. We reduced our inventory purchase activity in the fourth quarter ended January 3, 2009 versus the same period in prior year. Deferred revenue and deferred cost of revenue increased $11.1 million and $10.5 million, respectively, reflecting a large customer order that did not meet revenue recognition criteria.
Despite a net loss of $69.6 million in the year ended December 29, 2007, net cash provided by operating activities was $46.1 million. This increase was due primarily to non-cash items of $67.7 million. Non-cash items included an impairment of goodwill of $23.9 million, share-based compensation of $23.2 million, deferred income taxes of $14.5 million and depreciation and amortization of $7.4 million. Changes in operating assets and liabilities offset our net loss by $47.9 million, primarily in accounts receivable, inventories, and accounts payable.
For the year ended December 29, 2007, accounts receivable decreased by $54.0 million primarily due to very linear sales in the fourth quarter ended December 29, 2007 compared to the back-end loaded fourth quarter ended December 20, 2006. Through improved supply chain management we decreased our inventory levels and purchases to respond to the sales trends in the year ended December 29, 2007, resulting in lower inventory and accounts payable balances. Improvements in our supply chain management are intended to ensure sufficient supply on hand to meet expected demand for our products. The decrease was predominantly in raw materials, where we took a net charge against of excess and obsolete inventory of $16.6 million. The improved supply chain management and more linear inventory purchases in the fourth quarter ended December 29, 2007 as compared to the fourth quarter ended December 30, 2006, allowed us to decrease inventory by approximately $13.8 million and accounts payable by $13.9 million.
Investing Activities
Cash used in investing activities was $8.5 million in the year ended June 25, 2010, primarily due to the purchases of property and equipment of $6.3 million and the acquisition of Copan Systems, Inc. for $2.0 million.
During the six months ended June 26, 2009, net cash used in investing activities was $15.1 million, primarily used in the acquisition of substantially all of the assets and certain liabilities of Legacy SGI for which we paid $42.5 million and acquired cash of $29.0 million for a net cash use of $13.5 million. During the period we also purchased property and equipment of $2.4 million. The cash outflows were offset by $0.7 million of proceeds from the sale and maturities of restricted cash and cash equivalents.
During the year ended January 3, 2009, net cash provided by investing activities was $137.4 million and consisted primarily of proceeds from sales and maturities of marketable securities of $165.4 million, offset by purchases of marketable securities of $26.3 million and purchases of property and equipment of $1.6 million. Our purchases of property and equipment in 2008 related mainly to tenant improvements and asset additions to our new Shanghai office. We reduced our investment in ARS from $64.6 million at December 29, 2007 to $8.7 million at January 3, 2009.
During the year ended December 29, 2007, net cash used in investing activities was $32.1 million. We purchased $584.0 million of securities and received proceeds from sales and maturities of securities of approximately $565.8 million. We also paid $9.1 million to the former Terrascale shareholders for additional
55
Table of Contents
intangible property not acquired as part of the initial acquisition of Terrascale. We purchased approximately $4.5 million for property and equipment primarily related to research and development projects, as well as our corporate office relocation.
Financing Activities
Cash provided by financing activities was $0.9 million in the year ended June 25, 2010, primarily due to proceeds from the issuance of stock under the employee stock purchase plan and stock options of $1.8 million, partially offset by restricted stock retired to cover taxes of $0.9 million.
Cash used in financing activities during the six months ended June 26, 2009 was $1.0 million, primarily for the purchase of the Company’s stock under its share repurchase program. The purchase of restricted stock of $0.4 million was offset by $0.4 million of cash generated from issuance of stock under the employee stock purchase plan.
Cash provided by financing activities during the year ended January 3, 2009 was $0.1 million. Cash generated from financing activities included $1.8 million from stock option exercises and employee stock purchases, largely offset by $1.7 million of restricted stock repurchases.
Cash provided by financing activities during the year ended December 29, 2007 was $5.5 million. Cash generated from financing activities included $4.5 million in proceeds from stock option exercises and employee stock purchases, and $1.6 million of excess tax benefits related to stock option exercises, partially offset by $0.6 million of restricted stock repurchases.
In February 2009, our Board of Directors authorized a share repurchase program of up to $40 million of our common stock. Under the program, we were able to purchase shares of common stock through open market transactions and privately negotiated purchases at prices deemed appropriate by management. The program was suspended in April 2009. Prior to the suspension of the share repurchase program, we repurchased and held in treasury 243,695 shares of outstanding common stock for a total of $1.0 million including expenses. The shares we repurchased are held in treasury for general corporate purposes, including issuances under employee equity incentive plans. As discussed in Note 25 to our Consolidated Financial Statements in Part II, Item 8, our Board of Directors authorized us to resume the share repurchase program on August 31, 2010.
We expect to continue to invest in the business including working capital, capital expenditures and operating expenses. We intend to fund these activities with our cash reserves and cash generated from operations, if any. Increases in operating expenses may not result in an increase in our revenue and our anticipated revenue may not be sufficient to support these increased expenditures. We anticipate that operating expenses and working capital will constitute a material use of our cash resources.
Contractual Obligations and Commitments
The following are contractual obligations and commitments at June 25, 2010, associated with lease obligations and contractual commitments (in thousands):
| Payments due by period | |||||||||||||||
| Total | Less than 1 year |
1 - 3 years |
3 - 5 years |
More than 5 years | |||||||||||
| Operating leases |
$ | 18,154 | $ | 6,201 | $ | 11,483 | $ | 470 | $ | — | |||||
| Purchase obligations |
16,865 | 14,994 | 1,871 | — | — | ||||||||||
| Total |
$ | 35,019 | $ | 21,195 | $ | 13,354 | $ | 470 | $ | — | |||||
56
Table of Contents
As of June 25, 2010, the liability for uncertain tax positions, net of offsetting tax benefits associated with the correlative effects of state income taxes and interest deductions, was $8.7 million. As of June 25, 2010, the Company has accrued $13.0 million of interest and penalty associated with its uncertain tax positions. The Company cannot conclude on the range of cash payments that will be made within the next twelve months associated with its uncertain tax positions.
Operating Leases—As of June 25, 2010, we had total outstanding commitments on non-cancelable operating leases of $18.2 million, $14.0 million of which relate to our domestic leases. These leases are generally for terms of five to seven years and generally provide renewal options for terms of three to five additional years. A significant portion of our domestic leases will expire on 2013. Our domestic leases include our headquarters in Fremont, CA and our manufacturing facility in Chippewa Falls, WI.
We have total outstanding commitments of $4.2 million in our non-cancelable international operating leases. Of this total amount, $2.8 million relate to our operating lease in the Europe, Middle East, and Africa (“EMEA”) region and $1.4 million relates to our facilities in the Asia Pacific (“APAC”) region. Our major facility leases in the EMEA region are generally for terms of four to nine years, and generally do not provide renewal options. Our major facility leases in the APAC region, except for Melbourne, Australia, are generally for terms of three to five years, and generally do not provide renewal options. We can renew our Melbourne, Australia lease for one additional period of five years.
Purchase Obligations—From time to time, we issue blanket purchase orders to our contract manufacturers for the procurement of materials to be used for upcoming orders, particularly for those components that have long lead times. Blanket purchase orders vary in size depending on our projected requirements. If we do not consume these materials on a timely basis or if our relationship with one of our contract manufacturers was to terminate, we could experience an abnormal increase to our inventory carrying amount and related accounts payable.
In connection with supplier agreements, we agreed to purchase certain units of inventory and non-inventory through 2011. As of June 25, 2010, there was a remaining commitment of approximately $16.9 million, of which $15.0 million will be paid in the next 12 months.
Other than the contractual obligations and commitments described above, we have no significant unconditional purchase obligations or similar instruments. We are not a guarantor of any other entities’ debt or other financial obligations.
Off Balance Sheet Arrangements—We have issued financial guarantees to cover rent on leased facilities and equipment, to government authorities for VAT and other taxes, and to various other parties to support payments in advance of future delivery on goods and services. The majority of our financial guarantees have terms of one year or more. The maximum potential obligation under financial guarantees at June 25, 2010 was $4.4 million for which we have $3.9 million of assets held as collateral. The full amount of the assets held as collateral are included in short-term and long-term restricted cash and cash equivalents in the consolidated balance sheets.
Additionally, we enter into standard indemnification agreements with our customers and certain other business partners in the ordinary course of business. These agreements include provisions for indemnifying the customer against any claim brought by a third-party to the extent any such claim alleges that our product infringes a patent, copyright or trademark, or misappropriates a trade secret, of that third-party. The agreements generally limit the scope of the available remedies in a variety of industry-standard methods, including, but not limited to, product usage and geography-based limitations, a right to control the defense or settlement of any claim, and a right to replace or modify the infringing products to make them non-infringing. We have not incurred significant expenses related to these indemnification agreements and no material claims for such indemnifications were outstanding as of June 25, 2010. As a result, we believe the estimated fair value of these indemnification agreements, if any, to be immaterial; accordingly, no liability has been recorded with respect to such indemnifications as of June 25, 2010.
57
Table of Contents
Critical Accounting Policies and Estimates
Our discussion and analysis of our financial condition and results of operations are based upon our consolidated financial statements, which have been prepared in accordance with accounting principles generally accepted in the United States of America. The preparation of these financial statements requires us to make estimates and judgments that affect the reported amounts of revenues and expenses during the reporting period and the reported amounts of assets and liabilities and the disclosure of contingent assets and liabilities as of the date of the financial statements. We periodically evaluate our material estimates and judgments based on the terms of underlying agreements, the expected course of development, historical experience and other factors that we believe are reasonable under the circumstances. However, actual future results may vary from our estimates.
We believe that the following accounting policies are significantly affected by critical accounting estimates and that they are both highly important to the portrayal of our financial condition and results and require difficult management judgments and assumptions about matters that are inherently uncertain. Note 2 of the accompanying consolidated financial statements describes the significant accounting policies used in the preparation of the consolidated financial statements. Certain of these significant accounting policies are considered to be critical accounting policies.
Our critical accounting policies and estimates are as follows:
| • | Revenue recognition; |
| • | Share-based compensation; |
| • | Restructuring expense; |
| • | Allowance for doubtful accounts; |
| • | Inventory valuation; |
| • | Impairment of long-lived assets; |
| • | Fair value measurements and impairments; |
| • | Warranty reserve; and |
| • | Accounting for income taxes; |
Revenue Recognition.
We enter into sales contracts which obligate the delivery of multiple products and/or services. A typical multiple-element arrangement includes product, third-party product, customer support services and professional services. We also sell software products as part of certain multiple-element arrangements. In addition, We sell certain products and services separately.
Product revenue. We recognize revenue from sales of products, primarily hardware, when persuasive evidence of an arrangement exists, shipment has occurred and title has transferred, the sales price is fixed or determinable, and collection of the resulting receivable is reasonably assured. In customer arrangements with substantive performance obligations, revenue is recognized when formal customer acceptance is received, unless acceptance is deemed to be perfunctory.
Multiple-element arrangements. Our multiple-element arrangements include products, customer support services and/or professional services. For arrangements which include only products and maintenance and installation services, we recognize revenue from the sale of products prior to the completion of services as product sales are not dependent on services to be functional. Certain multiple-element arrangements include software products integrated with the hardware (“hardware appliance”) and the Company provides unspecified software updates and enhancements to the software through its service contracts. For arrangements which include hardware appliances or arrangements where the undelivered element is post contract customer support (“PCS”), we have not established vendor-specific objective evidence (“VSOE”) of the fair value of the element. Therefore, revenue and related cost of revenue from these arrangements is deferred and recognized ratably over the PCS period.
58
Table of Contents
Service revenue. Service revenue includes customer support services, primarily hardware maintenance services, and professional services, which include consulting services and integration services of third-party products. Revenue from extended service contracts, that is not subject to deferral under our revenue recognition policy discussed above and are expressly priced separately from the hardware, is recognized ratably over the contract term, generally one to three years. Professional services are offered under hourly or fixed fee-based contracts or as part of multiple-element arrangements. Professional services revenue is recognized as services are performed.
Share-Based Compensation. We use the fair value method of accounting for stock-based compensation arrangements, including grants of employee stock awards and purchases under an employee stock purchase plan. The fair values of our unvested stock awards are calculated based on the fair value of our common stock at the dates of grant, using the Black-Scholes option-pricing model, which requires the input of subjective assumptions. These assumptions include estimating the length of time employees will retain their vested stock awards before exercising them, the estimated volatility of our common stock over the expected term and the number of awards that will ultimately not vest (i.e. forfeitures). The estimated fair value of stock awards is expensed on a straight-line basis over the expected term of the grant. Compensation expense for purchases under the employee stock purchase plan is recognized based on the estimated fair value of the common stock during each offering period and the percentage of the purchase discount. Changes to any of these assumptions can have a significant effect on our reported share-based compensation expense.
Restructuring Reserve. In recent years, we have recorded accruals in connection with our restructuring programs. These accruals include estimates of employee separation costs, fixed assets write-offs and the settlements of contractual obligations, including lease terminations resulting from our actions. Accruals associated with employee termination costs are accrued when it is determined that a liability has been incurred, which is generally when individuals have been notified of their termination dates and expected severance payments. Fixed asset write-offs primarily consist of equipment and furniture associated with lease terminations, and are based on an estimate of the amounts and timing of future cash flows related to the expected future remaining use and ultimate sale or disposal of the equipment and furniture. Accruals associated with vacated facilities are accrued when we have vacated the premises. Our estimates may need to be adjusted upon the occurrence of future events, which include, but are not limited to, changes in the estimated time to enter into a sublease, the sublease terms and the sublease rates. Due to the extended contractual obligations of certain of these leases and the inherent volatility of the commercial real estate markets, future adjustments to these vacated facilities accruals could have a material impact on our results of operations and financial position.
Allowance for Doubtful Accounts. We provide an allowance for uncollectible accounts receivable based on our assessment of the collectability of specific customer accounts and an analysis of the remaining accounts receivable. We also analyze historical bad debts, customer concentrations, customer credit worthiness, current economic trends and changes in customer payment terms, when evaluating the adequacy of the allowance for doubtful accounts. Credit evaluations are undertaken for all major sale transactions before shipment is authorized. Provisions are made based upon a specific review of all significant outstanding invoices. For those invoices not specifically reviewed, provisions are provided at differing rates, based upon the factors discussed above. In the future, if our actual collections differ significantly from our estimates it may result in additional provisions for doubtful accounts and our future results of operations and financial position could be materially affected.
Inventory Valuation. We value our inventories at the lower of cost or market with cost determined on a first-in, first-out basis. We write down obsolete inventory or inventory in excess of our estimated usage to its estimated market value less cost to sell, if less than its cost. Inherent in our estimates of market value in determining inventory valuation are estimates related to future demand and technological obsolescence of our products. Any significant unanticipated changes in demand or technological developments could have a significant impact on the value of our inventories and our future results of operations and financial position could be materially affected.
59
Table of Contents
Fair Value Measurements and Impairments. Our available-for-sale investments, consisting of ARS, are subject to periodic impairment review. Investments are considered to be impaired when a decline in fair value is judged to be other-than-temporary. The valuation model used to estimate the fair value of our ARS include various assumptions, including assessment of the underlying structure of each security, credit rating, expected cash flows, discount rates and overall capital market liquidity. These assumptions, assessments and the interpretations of relevant market data are subject to uncertainties and are difficult to predict and require significant judgment. There is no assurance as to when the market for ARS will stabilize and the fair value of our ARS could change significantly based on market conditions and continued uncertainties in the credit markets. If these uncertainties continue or our ARS experience credit rating downgrades, we may incur additional temporary impairments or other-than-temporary impairments and our future results of operations and financial position could be materially affected.
Impairment of Long-Lived Assets. We assess the carrying values of long-lived assets, including our intangible assets, for possible impairment when we identify events or when we believe that circumstances may have changed to indicate that the carrying amount of a long-lived asset may not be recoverable. Such events or changes in circumstances may include the significant under-performance relative to historical or projected future operating results, significant changes in the strategy for our overall business, discontinuation of a product or product line, a sudden or consistent decline in the forecast for a product, changes in technology or in the way an asset is being used, or an adverse change in legal factors or in the business climate. An impairment loss would be recognized when the sum of the estimated future cash flows expected to result from the use of the asset and its eventual disposition is less than its carrying amount. Such impairment loss would be measured as the difference between the carrying amount of the asset and its fair value. Cash flow assumptions used in calculating the fair value are based on historical and forecasted revenue, operating costs, and other relevant factors. This analysis requires judgment with respect to many factors, including future cash flows, changes in technology, the continued success of product lines and future volume and revenue and expense growth rates. If our estimate of future operating results changes, or if there are changes to other assumptions, the estimate of the fair value of our long-lived assets could change significantly. Such change could result in impairment charges in future periods, which could have a significant negative impact to our future results of operations and financial position.
Warranty Reserve. We provide for estimated cost to warrant our products against defects in materials and workmanship at the time revenue is recognized. We net any cost recoveries from warranties offered to us by our suppliers against the warranty expense. Warranty costs include labor to repair faulty systems and replacement parts for defective items, as well as other costs incidental to warranty repairs. We estimate our warranty obligation based on factors such as product life cycle analysis and historical experience, and our estimate is affected by data such as product failure rates, material usage and service delivery costs incurred in correcting a product failure. Our standard warranty ranges from one to three years. Should actual product failure rates, material usage or service delivery costs differ from our estimates, revisions to the estimated warranty liability would be required which could have a material impact on our results of operations and financial position.
Accounting for Income Taxes. The determination of our tax provision is subject to judgments and estimates. The carrying value of our net deferred tax assets, which is comprised primarily of future tax deductions, net operating loss carryovers and tax credit carryovers, is subject to significant judgment as to whether it is more likely than not our deferred tax assets will be realized. In determining whether the realization of these deferred tax assets may be impaired, we evaluate both positive and negative evidence. As of June 25, 2010, we have recorded a valuation allowance against the majority of our net deferred tax assets. Based on all available evidence, on a jurisdictional basis, including our historical operating results, and the uncertainty of predicting our future income, the valuation allowance reduces our deferred tax assets to an amount that is more likely than not to be realized. The valuation allowance is attributable to U.S. federal, state and certain foreign deferred tax assets primarily consisting of net operating loss carryovers, tax credit carryovers, accrued expenses, and other temporary differences. We have determined that it is more likely than not that certain foreign deferred tax assets will more likely than not be realized, and as a result, released valuation allowance on the deferred tax assets of certain foreign subsidiaries.
60
Table of Contents
We recognize liabilities for uncertain tax positions based on a two-step process. The first step is to evaluate the tax position for recognition by determining if the weight of available evidence indicates that it is more likely than not that the position will be sustained on audit, including resolution of related appeals or litigation processes, if any. The second step requires us to estimate and measure the tax benefit as the largest amount that is more than 50% likely to be realized upon ultimate settlement with the taxing authorities. We reevaluate these uncertain tax positions on a quarterly basis, based on factors including, but not limited to, changes in facts or circumstances, changes in tax law, effectively settled issues under audit, new audit activity and lapses in the statutes of limitations on assessment. Such a change in recognition or measurement would result in the recognition of a tax benefit or an additional charge to the tax provision in the period that such event occurs and can have a significant effect on our results of operations and financial position.
Recent Accounting Pronouncements
See Note 2 to our Consolidated Financial Statements in Part II, Item 8 of this Report for a description of recent accounting pronouncements, including our expected adoption dates and estimated effects on our results of operations, financial condition, and cash flows.
61
Table of Contents
ITEM 7A. Quantitative and Qualitative Disclosures About Market Risk
In the normal course of business, our financial position is routinely subject to a variety of risks, including market risk for investments associated with interest rate movements, liquidity risks, credit risks, and foreign exchange market risk associated with currency rate movements on non-U.S. dollar denominated assets and liabilities. We regularly assess these risks and have established policies and business practices to protect against the adverse effects of these and other potential exposures. As a result, we do not anticipate material losses in these areas.
Investment Risk
The primary objective of our investment activities is to preserve principal while maximizing the income we receive from our investments without significantly increasing risk. To achieve this objective, we maintain our portfolio of cash, cash equivalents, and investments in high credit quality, readily liquid securities, primarily U.S. treasuries and money market funds. Our exposure to market risks for changes in interest rates relates primarily to our investment portfolio. As of June 25, 2010, our cash and cash equivalents of $129.3 million consisted primarily of cash, money market funds, and U.S. Treasury notes. Due to the short term nature of our investment portfolio, we believe that the exposure of our principal to interest rate risk is minimal, although our future interest income is subject to reinvestment risk.
There has been significant deterioration and instability in the financial markets since 2008. The extraordinary disruption and readjustment in the financial markets exposes us to additional investment risk. The value and liquidity of the securities in which we invest could deteriorate rapidly and the issuers of such securities could be subject to credit rating downgrades. In light of the current market conditions and these additional risks, we actively monitor market conditions and developments specific to the securities and security classes in which we invest. We believe that we take a conservative approach to investing our funds in that we invest only in highly-rated securities with relatively short maturities and do not invest in securities we believe involve a higher degree of risk. While we believe we take prudent measures to mitigate investment related risks, such risks cannot be fully eliminated as there are circumstances outside of our control. We currently believe that the current credit market difficulties do not have a material impact on our investment portfolio. However, future degradation in credit market conditions could have a material adverse affect on our financial position.
At June 25, 2010, we held ARS with a fair value of $7.5 million and amortized cost of $8.8 million as compared to a fair value of $7.4 million and amortized cost of $9.1 million at June 26, 2009. ARS are securities that are structured with short-term interest rate reset dates of generally less than 90 days but with contractual maturities that can be well in excess of ten years. At the end of each reset period, which occurs every seven to 35 days, investors can sell or continue to hold the securities at par subject to a successful interest rate reset. In the first and second quarters of fiscal year 2008, certain ARS failed auction due to sell orders exceeding buy orders. Our ARS consist of investments that are backed by pools of student loans, the majority of which are ultimately guaranteed by the Department of Education. Based on our discounted cash flow model, we have recorded a temporary impairment within accumulated other comprehensive loss of approximately $1.3 million at June 25, 2010 related to the $8.8 million cost of these ARS. We currently have the intent and ability to hold these securities until the value of such securities recovers. The funds associated with failed auctions will not be accessible until a successful auction occurs, a buyer is found outside of the auction process, the underlying securities have matured or the securities are recalled by the issuer. Given the recent disruptions in the credit markets and the fact that the liquidity for these types of securities remains uncertain, we have classified all of these ARS as long-term investments in our consolidated balance sheets, as our ability to liquidate such securities in the next twelve months is uncertain.
62
Table of Contents
Foreign Exchange Risk
Prior to the May 8, 2009 acquisition of Legacy SGI, we did not make material sales or have material purchase obligations outside of the United States. As of June 25, 2010 and June 26, 2009, foreign currency cash accounts totaled $28.6 million and $18.0 million, respectively (primarily in Euros, Canadian dollars, Australian dollars and British pounds).
With the acquisition of Legacy SGI and its multinational operations, we have increased foreign currency risks associated with cash and cash equivalents, investments, receivables, and payables denominated in foreign currencies. Fluctuations in exchange rates will result in foreign exchange gains and losses on these foreign currency assets and liabilities, which are included in other income, net in our consolidated statements of operations. Our exposure to foreign currency exchange rate risk relates to sales commitments, anticipated sales, purchases and other expenses, and assets and liabilities denominated in foreign currencies. For most currencies, we are a net receiver of the foreign currency and are adversely affected by a stronger U.S. dollar relative to the foreign currency.
At June 25, 2010, we had no foreign currency forward contracts or option contracts.
Sensitivity Analysis
For purposes of specific risk analysis, we use a sensitivity analysis to determine the impact that market risk exposures may have on the fair values of financial instruments. The financial instruments included in the sensitivity analysis consist of all of our cash, cash equivalents, and long-term investments.
To perform the sensitivity analysis, we assess the risk of loss in fair values from the impact of hypothetical changes in interest rates and foreign currency exchange rates on market sensitive instruments. Given the short term nature of our cash and cash equivalents, a sensitivity analysis was not performed as the risk of loss in fair value was deemed immaterial.
For the long-term investment in ARS, the sensitivity of fair value was tested assuming either a 100 basis point increase or a 100 basis point decrease in the market-required return, holding the interest income from the ARS constant. A full 1% increase in required return would reduce the long term investments by $0.2 million, or 2.9%. A full 1% decrease in required return would increase the long term investments by $0.2 million, or 3.0%.
For foreign currency exchange rate risk, a 10% increase or decrease of foreign currency exchange rates against the U.S. dollar with all other variables held constant would have resulted in a $2.9 million change in the value of our financial instruments.
63
Table of Contents
Item 8. Financial Statements and Supplementary Data
Index to Consolidated Financial Statements
| Page | ||
| Financial Statements: |
||
| 65 | ||
| 66 | ||
| 67 | ||
| 68 | ||
| 69 | ||
| 70 | ||
| Financial Statement Schedule: |
||
| 110 | ||
64
Table of Contents
REPORT OF INDEPENDENT REGISTERED PUBLIC ACCOUNTING FIRM
To the Board of Directors and Stockholders of
Silicon Graphics International Corp.
Fremont, California
We have audited the accompanying consolidated balance sheets of Silicon Graphics International Corp. and subsidiaries (the “Company”) as of June 25, 2010 and June 26, 2009, and the related consolidated statements of income, stockholders’ equity, and cash flows for the years ended June 25, 2010, January 3, 2009, and December 29, 2007 and the six-month period ended June 26, 2009. Our audits also included the financial statement schedule listed in the Index at Item 15. These financial statements and financial statement schedule are the responsibility of the Company’s management. Our responsibility is to express an opinion on the financial statements and financial statement schedule based on our audits.
We conducted our audits in accordance with the standards of the Public Company Accounting Oversight Board (United States). Those standards require that we plan and perform the audit to obtain reasonable assurance about whether the financial statements are free of material misstatement. An audit includes examining, on a test basis, evidence supporting the amounts and disclosures in the financial statements. An audit also includes assessing the accounting principles used and significant estimates made by management, as well as evaluating the overall financial statement presentation. We believe that our audits provide a reasonable basis for our opinion.
In our opinion, such consolidated financial statements present fairly, in all material respects, the financial position of Silicon Graphics International Corp. and subsidiaries at June 25, 2010 and June 26, 2009, and the results of their operations and their cash flows for the years ended June 25, 2010, January 3, 2009, and December 29, 2007 and the six-month period ended June 26, 2009, in conformity with accounting principles generally accepted in the United States of America. Also, in our opinion, such financial statement schedule, when considered in relation to the basic consolidated financial statements taken as a whole, presents fairly, in all material respects, the information set forth therein.
We have also audited, in accordance with the standards of the Public Company Accounting Oversight Board (United States), the Company’s internal control over financial reporting as of June 25, 2010, based on the criteria established in Internal Control—Integrated Framework issued by the Committee of Sponsoring Organizations of the Treadway Commission and our report dated September 8, 2010 expressed an unqualified opinion on the Company’s internal control over financial reporting.
/s/ DELOITTE & TOUCHE LLP
San Jose, California
September 8, 2010
65
Table of Contents
SILICON GRAPHICS INTERNATIONAL CORP.
CONSOLIDATED STATEMENTS OF OPERATIONS
(In thousands, except per share amounts)
| Year Ended | Six
Months Ended June 26, 2009 |
|||||||||||||||
| June 25, 2010 |
January 3, 2009 |
December 29, 2007 |
||||||||||||||
| Revenue |
$ | 403,717 | $ | 247,430 | $ | 350,684 | $ | 102,777 | ||||||||
| Cost of revenue |
314,128 | 217,992 | 303,440 | 95,000 | ||||||||||||
| Gross profit |
89,589 | 29,438 | 47,244 | 7,777 | ||||||||||||
| Operating expenses: |
||||||||||||||||
| Research and development |
56,865 | 14,864 | 13,802 | 10,729 | ||||||||||||
| Sales and marketing |
64,831 | 23,412 | 32,461 | 18,236 | ||||||||||||
| General and administrative |
52,594 | 24,526 | 35,801 | 14,013 | ||||||||||||
| Restructuring |
5,213 | 685 | — | 1,270 | ||||||||||||
| Acquisition-related |
(3,264 | ) | — | — | 6,070 | |||||||||||
| Impairment of long-lived assets |
— | — | 2,820 | — | ||||||||||||
| Gain from settlement agreement |
— | — | — | (5,000 | ) | |||||||||||
| Gain from acquisition |
— | — | — | (19,831 | ) | |||||||||||
| Total operating expenses |
176,239 | 63,487 | 84,884 | 25,487 | ||||||||||||
| Loss from operations |
(86,650 | ) | (34,049 | ) | (37,640 | ) | (17,710 | ) | ||||||||
| Total other income (expense): |
||||||||||||||||
| Interest income, net |
436 | 4,106 | 8,227 | 176 | ||||||||||||
| Other income (expense), net |
(7,088 | ) | (968 | ) | 364 | 1,101 | ||||||||||
| Total other income (expense) |
(6,652 | ) | 3,138 | 8,591 | 1,277 | |||||||||||
| Loss from continuing operations before income taxes |
(93,302 | ) | (30,911 | ) | (29,049 | ) | (16,433 | ) | ||||||||
| Income tax provision (benefit) from continuing operations |
(4,441 | ) | 376 | 12,531 | (2,242 | ) | ||||||||||
| Net loss from continuing operations |
(88,861 | ) | (31,287 | ) | (41,580 | ) | (14,191 | ) | ||||||||
| Discontinued operations (Note 19): |
||||||||||||||||
| Income (loss) from discontinued operations |
409 | (25,896 | ) | (33,941 | ) | (20 | ) | |||||||||
| Income tax benefit |
— | (2,955 | ) | (5,964 | ) | — | ||||||||||
| Income (loss) from discontinued operations, net of tax |
409 | (22,941 | ) | (27,977 | ) | (20 | ) | |||||||||
| Net loss |
$ | (88,452 | ) | $ | (54,228 | ) | $ | (69,557 | ) | $ | (14,211 | ) | ||||
| Net income (loss) per share, basic and diluted: |
||||||||||||||||
| Continuing operations |
$ | (2.95 | ) | $ | (1.06 | ) | $ | (1.45 | ) | $ | (0.48 | ) | ||||
| Discontinued operations |
0.01 | (0.77 | ) | (0.97 | ) | — | ||||||||||
| Basic and diluted net loss per share |
$ | (2.94 | ) | $ | (1.83 | ) | $ | (2.42 | ) | $ | (0.48 | ) | ||||
| Shares used in computing basic and diluted net loss per share |
30,130 | 29,583 | 28,786 | 29,798 | ||||||||||||
See accompanying notes.
66
Table of Contents
SILICON GRAPHICS INTERNATIONAL CORP.
CONSOLIDATED BALANCE SHEETS
(In thousands, except per share amounts)
| June 25, 2010 |
June 26, 2009 |
|||||||
| ASSETS | ||||||||
| Current assets: |
||||||||
| Cash and cash equivalents |
$ | 129,343 | $ | 128,714 | ||||
| Current portion of restricted cash and cash equivalents |
830 | 1,119 | ||||||
| Accounts receivable, net of allowance for doubtful accounts of $1,646 and $859 as of June 25, 2010 and June 26, 2009, respectively |
79,464 | 64,810 | ||||||
| Inventories |
89,929 | 117,790 | ||||||
| Deferred cost of revenue |
45,255 | 5,505 | ||||||
| Prepaid expenses and other current assets |
15,967 | 25,757 | ||||||
| Total current assets |
360,788 | 343,695 | ||||||
| Non-current portion of restricted cash and cash equivalents |
3,102 | 2,294 | ||||||
| Long-term investments |
7,475 | 7,416 | ||||||
| Property and equipment, net |
28,172 | 33,124 | ||||||
| Intangible assets, net |
16,223 | 21,521 | ||||||
| Non-current portion of deferred cost of revenue |
49,109 | 339 | ||||||
| Other assets |
32,343 | 33,247 | ||||||
| Total assets |
$ | 497,212 | $ | 441,636 | ||||
| LIABILITIES AND STOCKHOLDERS’ EQUITY | ||||||||
| Current liabilities: |
||||||||
| Accounts payable |
$ | 49,204 | $ | 52,618 | ||||
| Accrued compensation |
21,885 | 20,855 | ||||||
| Other current liabilities |
27,608 | 31,880 | ||||||
| Current portion of deferred revenue |
137,596 | 69,655 | ||||||
| Total current liabilities |
236,293 | 175,008 | ||||||
| Non-current portion of deferred revenue |
91,989 | 14,635 | ||||||
| Long-term income taxes payable |
21,715 | 18,948 | ||||||
| Other non-current liabilities |
12,286 | 14,946 | ||||||
| Total liabilities |
362,283 | 223,537 | ||||||
| Commitments and contingencies (Note 23) |
||||||||
| Stockholders’ equity: |
||||||||
| Preferred stock, par value $0.001 per share; 12,000 shares authorized; none outstanding |
— | — | ||||||
| Common stock, par value $0.001 per share; 120,000 shares authorized; 30,709 shares issued at June 25, 2010; 30,171 shares issued at June 26, 2009 |
31 | 30 | ||||||
| Additional paid-in capital |
459,339 | 453,730 | ||||||
| Treasury stock, at cost (244 shares at June 25, 2010 and June 26, 2009) |
(1,022 | ) | (1,022 | ) | ||||
| Accumulated other comprehensive loss |
(1,903 | ) | (1,575 | ) | ||||
| Accumulated deficit |
(321,516 | ) | (233,064 | ) | ||||
| Total stockholders’ equity |
134,929 | 218,099 | ||||||
| Total liabilities and stockholders’ equity |
$ | 497,212 | $ | 441,636 | ||||
See accompanying notes.
67
Table of Contents
SILICON GRAPHICS INTERNATIONAL CORP.
CONSOLIDATED STATEMENTS OF STOCKHOLDERS’ EQUITY
(In thousands, except share amounts)
| Common Stock | Treasury Stock | Additional Paid-in Capital |
Accumulated Other Comprehensive Income (Loss) |
Accumulated Deficit |
Total Stockholders’ Equity |
||||||||||||||||||||||
| Shares | Amount | Shares | Amount | ||||||||||||||||||||||||
| Balance at December 30, 2006 |
28,230,785 | $ | 28 | — | $ | — | $ | 411,118 | $ | (3 | ) | $ | (95,068 | ) | $ | 316,075 | |||||||||||
| Net loss |
— | — | — | — | — | — | (69,557 | ) | (69,557 | ) | |||||||||||||||||
| Unrealized gain on short-term investments |
— | — | — | — | — | 16 | — | 16 | |||||||||||||||||||
| Cumulative translation adjustment |
— | — | — | — | — | (24 | ) | — | (24 | ) | |||||||||||||||||
| Total comprehensive loss |
(69,565 | ) | |||||||||||||||||||||||||
| Issuance of common stock under employee stock options and employee stock purchase plan, net of taxes |
1,062,012 | 1 | — | — | 3,907 | — | — | 3,908 | |||||||||||||||||||
| Restricted common stock grants |
232,764 | — | — | — | — | — | — | — | |||||||||||||||||||
| Income tax benefit relating to stock option exercises |
— | — | — | — | 1,839 | — | — | 1,839 | |||||||||||||||||||
| Stock-based compensation in connection with employee stock option plans and other |
— | — | — | — | 23,861 | — | — | 23,861 | |||||||||||||||||||
| Balance at December 29, 2007 |
29,525,561 | $ | 29 | — | $ | — | $ | 440,725 | $ | (11 | ) | $ | (164,625 | ) | $ | 276,118 | |||||||||||
| Net loss |
— | — | — | — | — | — | (54,228 | ) | (54,228 | ) | |||||||||||||||||
| Unrealized loss on short-term investments |
— | — | — | — | — | (442 | ) | — | (442 | ) | |||||||||||||||||
| Cumulative translation adjustment |
— | — | — | — | — | 176 | — | 176 | |||||||||||||||||||
| Total comprehensive loss |
(54,494 | ) | |||||||||||||||||||||||||
| Issuance of common stock under employee stock options and employee stock purchase plan, net of taxes |
225,100 | 1 | — | — | 146 | — | — | 147 | |||||||||||||||||||
| Restricted common stock grants |
204,683 | — | — | — | — | — | — | — | |||||||||||||||||||
| Stock-based compensation in connection with employee stock option plans and other |
— | — | — | — | 9,718 | — | — | 9,718 | |||||||||||||||||||
| Balance at January 03, 2009 |
29,955,344 | $ | 30 | — | $ | — | $ | 450,589 | $ | (277 | ) | $ | (218,853 | ) | $ | 231,489 | |||||||||||
| Net loss |
— | — | — | — | — | — | (14,211 | ) | (14,211 | ) | |||||||||||||||||
| Unrealized loss on short-term investments |
— | — | — | — | — | (1,193 | ) | — | (1,193 | ) | |||||||||||||||||
| Unrecognized gain on pension assets |
— | — | — | — | — | 10 | — | 10 | |||||||||||||||||||
| Cumulative translation adjustment |
— | — | — | — | — | (115 | ) | — | (115 | ) | |||||||||||||||||
| Total comprehensive loss |
(15,509 | ) | |||||||||||||||||||||||||
| Issuance of common stock under employee stock options and employee stock purchase plan, net of taxes |
5,049 | — | — | — | 37 | — | — | 37 | |||||||||||||||||||
| Repurchase of treasury stock |
— | — | (243,695 | ) | (1,022 | ) | — | — | — | (1,022 | ) | ||||||||||||||||
| Restricted common stock grants |
210,164 | — | — | — | — | — | |||||||||||||||||||||
| Stock-based compensation in connection with employee stock option plans and other |
— | — | — | — | 3,104 | — | — | 3,104 | |||||||||||||||||||
| Balance at June 26, 2009 |
30,170,557 | $ | 30 | (243,695 | ) | $ | (1,022 | ) | $ | 453,730 | $ | (1,575 | ) | $ | (233,064 | ) | $ | 218,099 | |||||||||
| Net loss |
— | — | — | — | — | — | (88,452 | ) | (88,452 | ) | |||||||||||||||||
| Unrealized gain on short-term investments |
— | — | — | — | — | 230 | — | 230 | |||||||||||||||||||
| Unrecognized loss on pension assets |
— | — | — | — | — | (558 | ) | — | (558 | ) | |||||||||||||||||
| Total comprehensive loss |
— | — | — | — | — | — | — | (88,780 | ) | ||||||||||||||||||
| Issuance of common stock under employee stock options and employee stock purchase plan, net of taxes |
391,676 | 1 | — | — | 931 | — | — | 932 | |||||||||||||||||||
| Restricted common stock grants |
146,835 | — | — | — | — | — | — | — | |||||||||||||||||||
| Stock-based compensation in connection with employee stock option plans and other |
— | — | — | — | 4,678 | — | — | 4,678 | |||||||||||||||||||
| Balance at June 25, 2010 |
30,709,068 | $ | 31 | (243,695 | ) | $ | (1,022 | ) | $ | 459,339 | $ | (1,903 | ) | $ | (321,516 | ) | $ | 134,929 | |||||||||
See accompanying notes.
68
Table of Contents
SILICON GRAPHICS INTERNATIONAL CORP.
CONSOLIDATED STATEMENTS OF CASH FLOWS
(In thousands)
| Year Ended | Six Months Ended June 26, 2009 |
|||||||||||||||
| June 25, 2010 |
January 3, 2009 |
December 29, 2007 |
||||||||||||||
| CASH FLOWS FROM OPERATING ACTIVITIES: |
||||||||||||||||
| Net loss |
$ | (88,452 | ) | $ | (54,228 | ) | $ | (69,557 | ) | $ | (14,211 | ) | ||||
| Adjustments to reconcile net loss to net cash provided by (used in) operating activities: |
||||||||||||||||
| Depreciation and amortization |
18,358 | 5,647 | 7,473 | 3,251 | ||||||||||||
| Gain on acquisition |
— | — | — | (19,831 | ) | |||||||||||
| Share-based compensation |
4,721 | 9,587 | 23,235 | 3,104 | ||||||||||||
| Impairment of long-lived assets |
— | 17,519 | 23,872 | 2,520 | ||||||||||||
| Non-cash restructuring expense |
— | — | — | 1,695 | ||||||||||||
| Provision for doubtful accounts |
852 | 36 | 105 | 389 | ||||||||||||
| Deferred income taxes |
(1,039 | ) | (1,503 | ) | 14,495 | (2,175 | ) | |||||||||
| Gain from settlement agreement |
— | — | — | (5,000 | ) | |||||||||||
| Loss on disposal of property and equipment |
915 | 280 | 73 | — | ||||||||||||
| Impairment of property and equipment |
— | — | 107 | — | ||||||||||||
| Excess tax benefit of stock options exercised |
— | — | (1,639 | ) | — | |||||||||||
| Impairment of cost method investment |
— | 350 | — | — | ||||||||||||
| Changes in operating assets and liabilities: |
||||||||||||||||
| Accounts receivable |
(15,506 | ) | 22,139 | 54,008 | (9,935 | ) | ||||||||||
| Inventories |
28,268 | 168 | 15,042 | 2,778 | ||||||||||||
| Deferred cost of revenue |
(88,520 | ) | (10,529 | ) | 1,910 | 7,268 | ||||||||||
| Prepaid expenses and other assets |
7,742 | 14,128 | (5,919 | ) | (6,896 | ) | ||||||||||
| Other assets |
1,176 | 837 | — | (74 | ) | |||||||||||
| Accounts payable |
(4,202 | ) | (26,153 | ) | (13,853 | ) | 15,554 | |||||||||
| Accrued compensation |
1,030 | — | — | 773 | ||||||||||||
| Sales tax payable |
— | (2,136 | ) | — | — | |||||||||||
| Other current liabilities |
(3,575 | ) | (3,104 | ) | (2,563 | ) | 4,716 | |||||||||
| Deferred revenue |
145,295 | 11,149 | (1,106 | ) | (11,402 | ) | ||||||||||
| Income taxes payable |
(1,039 | ) | 114 | 392 | 313 | |||||||||||
| Other liabilities |
2,173 | — | — | 149 | ||||||||||||
| Net cash provided by (used in) operating activities |
8,197 | (15,699 | ) | 46,075 | (27,014 | ) | ||||||||||
| CASH FLOWS FROM INVESTING ACTIVITIES: |
||||||||||||||||
| Purchases of property and equipment |
(6,273 | ) | (1,593 | ) | (4,500 | ) | (2,364 | ) | ||||||||
| Proceeds from sales and maturities of restricted cash and cash equivalents |
(519 | ) | — | — | 674 | |||||||||||
| Purchases of marketable securities |
— | (26,278 | ) | (584,009 | ) | — | ||||||||||
| Proceeds from sales and maturities of investments |
275 | 165,387 | 565,836 | 55 | ||||||||||||
| Cash used in acquisition, net of cash acquired |
(1,983 | ) | — | (350 | ) | (13,462 | ) | |||||||||
| Expenditures for intangibles |
— | (83 | ) | (9,122 | ) | — | ||||||||||
| Net cash provided by (used in) investing activities |
(8,500 | ) | 137,433 | (32,145 | ) | (15,097 | ) | |||||||||
| CASH FLOWS FROM FINANCING ACTIVITIES: |
||||||||||||||||
| Repurchase of restricted stock |
(857 | ) | (1,681 | ) | (617 | ) | (376 | ) | ||||||||
| Purchase of treasury stock |
— | — | — | (1,022 | ) | |||||||||||
| Proceeds from issuance of common stock upon exercise of stock options |
887 | 536 | 2,682 | 8 | ||||||||||||
| Proceeds from issuance of common stock under employee stock purchase plan |
902 | 1,293 | 1,843 | 376 | ||||||||||||
| Excess tax benefit of stock options exercised |
— | — | 1,639 | — | ||||||||||||
| Net cash provided by (used in) financing activities |
932 | 148 | 5,547 | (1,014 | ) | |||||||||||
| Effect of exchange rate changes on cash and cash equivalents |
— | 175 | (26 | ) | (115 | ) | ||||||||||
| Net increase (decrease) in cash and cash equivalents |
629 | 122,057 | 19,451 | (43,240 | ) | |||||||||||
| Cash and cash equivalents—beginning of period |
128,714 | 49,897 | 30,446 | 171,954 | ||||||||||||
| Cash and cash equivalents—end of period |
$ | 129,343 | $ | 171,954 | $ | 49,897 | $ | 128,714 | ||||||||
| SUPPLEMENTAL DISCLOSURE OF OTHER CASH FLOW INFORMATION |
||||||||||||||||
| Income taxes paid (refunded) |
$ | (4,206 | ) | $ | 178 | $ | (68 | ) | $ | (386 | ) | |||||
| NON-CASH INVESTING AND FINANCING ACTIVITIES |
||||||||||||||||
| Property and equipment purchases in accounts payable |
$ | 788 | $ | — | $ | — | $ | (41 | ) | |||||||
| Unrealized gain (loss) on investments |
$ | 230 | $ | (442 | ) | $ | 16 | $ | (1,193 | ) | ||||||
See accompanying notes.
69
Table of Contents
SILICON GRAPHICS INTERNATIONAL CORP.
NOTES TO FINANCIAL STATEMENTS
1. DESCRIPTION OF BUSINESS
Silicon Graphics International Corp. (“SGI” or the “Company”) was originally incorporated as Rackable Corporation which later changed its name to Rackable Systems, Inc. (“Rackable Systems” or “Legacy Rackable”) prior to changing its name to SGI. Rackable Systems was incorporated in the state of Delaware in December 2002. On May 8, 2009, Rackable Systems completed the acquisition of substantially all of the assets, excluding certain assets unrelated to the ongoing business, and assumed certain liabilities of Silicon Graphics, Inc. (“Legacy SGI”) (see Note 3). This acquisition was consummated pursuant to the terms of an Asset Purchase Agreement dated March 31, 2009, as amended on April 30, 2009, which was approved by the United States Bankruptcy Court for the Southern District of New York for Silicon Graphics, Inc. Effective May 18, 2009, Rackable Systems changed its name to Silicon Graphics International Corp.
The Company’s headquarters is located in Fremont, California. Following the acquisition of Legacy SGI assets, the Company now operates in 26 countries, with its primary manufacturing facilities located in Chippewa Falls, Wisconsin. The principal business of the Company has been and continues to be the design, manufacture and implementation of highly scalable compute servers and high-capacity storage systems. Following the acquisition of Legacy SGI, the Company is also a leader in high-performance computing and data management. The Legacy SGI acquisition adds a broad line of mid-range to high-end computing servers, data storage and data center technologies, and provides customer support and professional services related to these products. The Company’s products are used by the scientific, technical and business communities to solve challenging data intensive computing, data management and visualization problems. The vertical markets we serve include defense and strategic systems, weather and climate, physical sciences, life sciences, energy (including oil and gas), aerospace and automotive, media and entertainment, semiconductor design, manufacturing, financial services, data centers, and business intelligence and data analytics.
2. SUMMARY OF SIGNIFICANT ACCOUNTING POLICIES
Fiscal Year-End. On June 19, 2009, the Company’s Board of Directors approved a change in the Company’s fiscal year end from the Saturday closest to December 31st of each year to the last Friday in June of each year. As a result of this change, the Company had a six month transition period beginning on January 4, 2009 and ending on June 26, 2009, consisting of 25 weeks. Accordingly, the Company’s fiscal year 2010 began on June 27, 2009 and ended on June 25, 2010.
Included in this report are the Company’s consolidated balance sheets as of June 25, 2010 and June 26, 2009, the consolidated statements of operations, statements of stockholders’ equity, and cash flows for the 52-week fiscal year ended June 25, 2010 (“2010”), 53-week fiscal year ended January 3, 2009 (“2008”), and 52-week fiscal year ended December 29, 2007 (“2007”), and the 25-week six month transition period ended June 26, 2009.
Principles of Consolidation. The consolidated financial statements include the accounts of the Company and its wholly owned subsidiaries. All inter-company balances and transactions have been eliminated.
Estimates and Assumptions. The preparation of consolidated financial statements in accordance with generally accepted accounting principles in the United States of America (“US GAAP”) requires management to make estimates and assumptions that affect the reported amounts of assets, liabilities, revenue, and expenses as presented in the consolidated financial statements and accompanying notes. Management bases its estimates on historical experience and various other assumptions believed to be reasonable. Although these estimates are based on management’s best knowledge of current events and actions that may impact the Company in the future, actual results may be different from the estimates. The Company’s critical accounting policies are those
70
Table of Contents
SILICON GRAPHICS INTERNATIONAL CORP.
NOTES TO FINANCIAL STATEMENTS—(Continued)
that affect the Company’s financial statements materially and involve difficult, subjective or complex judgments by management and include revenue recognition, share-based compensation, restructuring reserve, allowance for doubtful accounts, inventory valuation, impairment of long-lived assets, fair value measurements and impairments, warranty reserve, and accounting for income taxes.
Discontinued Operations. In October 2008, the Company committed to a formal plan to abandon the Rapidscale product line (“Rapidscale”). The Company has accounted for the Rapidscale product line as a discontinued operation. The results of operations of the Rapidscale product line have been reclassified and presented as discontinued operations, net of tax, for all periods presented. The cash flows of the Rapidscale product line have not been reported separately within the condensed consolidated statement of cash flows based upon materiality (see Note 19).
Rapidscale was accounted for as discontinued operations and therefore, the results of operations and cash flows have been removed from the company’s results of continuing operations for the year ended December 29, 2007.
Revenue Recognition. The Company enters into sales contracts which obligate the delivery of multiple products and/or services. A typical multiple-element arrangement includes product, third-party product, customer support services and professional services. The Company also sells software products as part of certain multiple-element arrangements. In addition, the Company sells certain products and services separately.
Product revenue. The Company recognizes revenue from sales of products, primarily hardware, when persuasive evidence of an arrangement exists, shipment has occurred and title has transferred, the sales price is fixed or determinable, and collection of the resulting receivable is reasonably assured. In customer arrangements with substantive performance obligations, revenue is recognized when formal customer acceptance is received, unless acceptance is deemed to be perfunctory.
Multiple-element arrangements. The Company’s multiple-element arrangements include products, customer support services and/or professional services. For arrangements which do not include hardware appliances and where services are included, the Company recognizes revenue from the sale of products prior to the completion of services as product sales are not dependent on services to be functional. Certain multiple-element arrangements include software products integrated with the hardware (“hardware appliance”) and the Company provides unspecified software updates and enhancements to the software though its service contracts. For arrangements which include hardware appliances or arrangements where the undelivered element is post contract customer support (“PCS”), the Company has not established vendor-specific objective evidence (“VSOE”) of the fair value of the element. Therefore, revenue and related cost of revenue from these arrangements is deferred and recognized ratably over the PCS period.
Service revenue. Service revenue includes customer support services, primarily hardware maintenance services, and professional services, which include consulting services and integration services of third-party products. Revenue from extended service contracts, that is not subject to deferral under the Company’s revenue recognition policy above and are expressly priced separately from the hardware, is recognized ratably over the contract term, generally one to three years. Professional services are offered under hourly or fixed fee-based contracts or as part of multiple-element arrangements. Professional services revenue is recognized as services are performed.
Shipping and Handling Costs. Shipping and handling costs are classified as a component of cost of revenue. Customer payments of shipping and handling costs are recorded as revenue.
71
Table of Contents
SILICON GRAPHICS INTERNATIONAL CORP.
NOTES TO FINANCIAL STATEMENTS—(Continued)
Research and Development. Costs related to research, design and development of Company products are charged to research and development expense as incurred. Software development costs are required to be capitalized when a product’s technological feasibility has been established through the date the product is available for general release to customers. The Company has not capitalized any software development costs, as technological feasibility is generally not established until a working model is completed, at which time substantially all development is complete.
Stock-Based Compensation. The Company uses the fair value method of accounting for stock-based compensation arrangements. Stock-based compensation arrangements currently include stock options granted, restricted shares issued (“RSAs”), restricted stock unit awards granted (“RSUs”) and purchases of common stock by the Company’s employees under the employee stock purchase plan. The fair values of stock options, RSAs, RSUs and employee stock purchase plan awards are estimated using the Black-Scholes option-pricing model. The estimated fair value of stock options, RSAs and RSUs is expensed on a straight-line basis over the expected term of the grant. Compensation expense for purchases under the employee stock purchase plan is recognized based on the estimated fair value of the common stock during each offering period and the percentage of the purchase discount.
Stock-based compensation expense for stock options and RSUs has been reduced for estimated forfeitures so that compensation expense is based on options and RSUs ultimately expected to vest. The Company’s estimated annual forfeiture rates for stock options and RSUs are based on its historical forfeiture experience.
Restructuring Expense. The Company recognizes restructuring expense resulting from reduction in headcount, excess manufacturing or administrative facilities that the Company chooses to close, or consolidate, and from other exit activities. In connection with exit activities, the Company records restructuring charges for employee termination costs, long-lived asset impairments, costs related to leased facilities to be abandoned or subleased, and other exit-related costs. These charges are incurred pursuant to formal plans developed and approved by management. The recognition of restructuring expense requires management to make judgments and estimates regarding the nature, timing, and amount of costs associated with the planned exit activity, including estimating sublease income and the fair value, less selling costs, of property and equipment to be disposed of. Estimates of future liabilities may change, requiring the Company to record additional restructuring expense or to reduce the amount of liabilities previously recorded. At the end of each reporting period, the Company evaluates the remaining accrued balances to ensure their adequacy, that no excess accruals are retained and that the utilization of the provisions is for the intended purpose in accordance with developed exit plans. In the event circumstances change and the provision is no longer required, the provision is reversed.
Foreign Currency Transactions. The functional currency of the Company’s foreign subsidiaries is the U.S. dollar. Accordingly, all monetary assets and liabilities of the foreign subsidiaries are re-measured into U.S. dollars at the exchange rates in effect at the reporting date, nonmonetary assets and liabilities are translated at historical rates, and revenue and expenses are translated at average exchange rates in effect during each reporting period. Accordingly, transaction gains and losses are included as a component of other income (expense), net in the accompanying consolidated statements of operations.
Comprehensive Loss. Comprehensive loss consists of two components, net loss and other comprehensive loss. Other comprehensive loss refers to revenue, expenses, gains and losses that under generally accepted accounting principles are recorded as an element of shareholders’ equity but are excluded from net income. The Company’s other comprehensive loss consists of unrealized gains and losses on investments categorized as available-for-sale, and unrecognized loss related to defined benefit pension plans. Prior to the acquisition of Legacy SGI, foreign currency translation adjustments from those subsidiaries not using the U.S. dollar as the functional currency was also included in other comprehensive loss.
72
Table of Contents
SILICON GRAPHICS INTERNATIONAL CORP.
NOTES TO FINANCIAL STATEMENTS—(Continued)
Fair Value of Financial Instruments. The Company measures its financial instruments in its financial statements at fair value or amounts that approximate fair value. The Company maximizes the use of observable inputs and minimizes the use of unobservable inputs when developing fair value measurements. When available, the Company uses quoted market prices to measure fair value. If market prices are not available, fair value measurement is based upon models that use primarily market-based or independently-sourced market parameters. If market observable inputs for model-based valuation techniques are not available, the Company makes judgments about assumptions market participants would use in estimating the fair value of the financial instrument. Carrying values of cash and cash equivalents, accounts receivable, accounts payable, and accrued liabilities approximate their fair values due to the short-term nature and liquidity of these financial instruments.
Cash and Cash Equivalents. The Company classifies highly liquid investments with remaining contractual maturity at date of purchase of three months or less as cash equivalents. Cash equivalents consist primarily of money market funds and U.S. treasuries. Due to the short-term nature and liquidity of these financial instruments, the carrying values of these assets approximate fair value.
Restricted Cash and Cash Equivalents. Short-term and long-term restricted cash and cash equivalents consist primarily of cash deposits with banks. The cash deposits are pledged as collateral for various guarantees issued to cover rent on leased facilities and equipment, to government authorities for value-added tax (“VAT”) and other taxes, and certain vendors to support payments in advance of delivery of goods and services. The deposits are classified as short-term or long-term depending on the nature of the period of guarantee.
Accounts Receivable. Accounts receivable are recorded at the invoiced amount and do not bear interest. Accounts receivable have been reduced by an estimated allowance for doubtful accounts, which is management’s best estimate of the amount of probable credit losses in existing accounts receivable. Among other factors, management determines the allowance based on customer specific experience and the aging of the receivables.
Concentration of Credit Risk. Financial instruments that potentially expose the Company to concentrations of credit risk consist primarily of cash and cash equivalents, restricted cash and cash equivalents, long-term investments, and accounts receivable. The Company maintains cash and cash equivalents with high credit quality financial institutions. The Company derives a significant portion of its revenue from a large number of individual customers spread globally. The Company also derives revenue from several large customers. If the financial condition or results of operations of any one of the large customers deteriorates substantially, the Company’s operating results could be adversely affected. To reduce credit risk, management performs ongoing credit evaluations of the financial condition of significant customers. The Company generally does not require collateral and maintains reserves for probable credit losses on customer accounts when considered necessary.
Inventories. Inventories are stated at the lower of cost or market, which approximates actual cost on a first-in, first-out basis. The Company assesses the value of inventory on a quarterly basis based upon estimates about future demand and actual usage. To the extent that the Company determines that it is holding excess or obsolete inventory, it writes down the value of its inventory to its net realizable value. Such write-downs are reflected in cost of revenue. If the inventory value is written down to its net realizable value and subsequently there is an increased demand for the inventory at a higher value, the increased value of the inventory is not realized until the inventory is sold either as a component of a system or as separate inventory.
In addition, the Company records a liability for firm, noncancelable, and unconditional purchase commitments with contract manufacturers and suppliers for quantities in excess of future demand forecasts consistent with our valuation of excess and obsolete inventory.
73
Table of Contents
SILICON GRAPHICS INTERNATIONAL CORP.
NOTES TO FINANCIAL STATEMENTS—(Continued)
The Company maintains a long-term service inventory of parts to support maintenance arrangements. The long-term service inventory is valued based on assumptions about product life cycles, historical usage, current production status and installed base, and is periodically tested for impairment. The long-term service inventory is included in other assets in the accompanying consolidated balance sheets.
Sales and Value Added Taxes. The Company collects various types of taxes from its customers that are assessed by governmental authorities, which are imposed on and concurrent with revenue-producing transactions. Such taxes are recorded on a net basis and are not included in revenue on the accompanying consolidated statements of operations.
Investments. The Company classifies its investments as available-for-sale at the time of purchase. The Company’s investments include auction rate securities (“ARS”). ARS are structured with short-term interest rate reset dates, generally less than ninety days, but with contractual maturities that can be well in excess of ten years.
Investments are reported at fair value with the related unrealized gains and losses included in accumulated other comprehensive income (loss) on the accompanying consolidated balance sheets. Realized gains or losses on the sale of investments are determined using the specific-identification method. The Company evaluates its investments periodically for other-than-temporary impairments by reviewing factors such as the length of time and extent to which fair value has been below amortized cost, the financial condition of the issuer and the Company’s intent and ability to hold the investment for a period of time sufficient for anticipated recovery in fair value. The Company records an impairment charge in its consolidated statement of operations to the extent the carrying value of available-for-sale securities exceeds the estimated fair market value of the securities and the decline in value is determined to be other-than-temporary.
Property and Equipment. Property and equipment is stated at cost, net of accumulated depreciation and amortization. Equipment and capitalized software are depreciated on a straight-line basis over their estimated useful lives, generally two to seven years. Buildings are depreciated on a straight-line basis over their estimated useful life, generally 30 to 32 years. Leasehold improvements are amortized using the straight-line method over the shorter of the estimated useful lives of the respective assets, or the original lease term. When assets are retired or disposed of, the cost and related accumulated depreciation and amortization are removed from the Company’s accounts and the resulting gain or loss is reflected in the accompanying consolidated statements of operations.
Repairs and maintenance are charged to expense as incurred and significant improvements and betterments that substantially enhance the life of an asset are capitalized.
Intangible Assets. Intangible assets consist of customer relationships and backlog, purchased technology, trademarks and trade names, and in-process research and development costs, acquired in business combinations. Intangible assets are carried at cost, less accumulated amortization. Amortization is computed using the straight-line method over the estimated useful lives of the respective assets, generally one to five years, except for the customer backlog intangible asset, which is amortized as acceptance is received for a particular customer order, reflecting the use of the asset.
Impairment of Long-Lived Assets. The Company reviews the carrying values of long-lived assets for indicators of impairment whenever events or changes in circumstances indicate that the carrying amount of an asset may not be recoverable. Recoverability of long-lived assets is measured by a comparison of the carrying amount of the assets to the estimated undiscounted future cash flows expected to be generated by the assets. If such assets are considered to be impaired, the impairment to be recognized is measured by the amount by which the carrying amount of the assets exceeds their fair value, which is typically calculated using discounted expected future cash flows utilizing a discount rate.
74
Table of Contents
SILICON GRAPHICS INTERNATIONAL CORP.
NOTES TO FINANCIAL STATEMENTS—(Continued)
Equity Investments. The cost-method is used to account for equity investments in companies in which the Company holds less than a 20 percent voting interest, does not exercise significant influence, and the related securities do not have a quoted market price. The Company tests for impairment whenever events or changes in circumstances indicate that the carrying amount of an investment may not be recoverable.
Warranty Reserve. The warranty period for the Company’s products is generally one to three years. Estimated future warranty costs are expensed as a cost of revenues when revenue is recognized. The warranty accrual is based upon historical experience and product life and is affected by actual product failure rates, material usage, and service delivery costs incurred in correcting the product failure. The Company periodically assesses the adequacy of the warranty reserve and adjusts the amount as considered necessary. The short-term portion of the warranty reserve is included in other current liabilities and the long-term portion of the warranty reserve is recorded in non-current liabilities on the accompanying consolidated balance sheets.
Deferred Revenue and Deferred Cost of Revenue. Deferred revenue is primarily comprised of revenue deferred for arrangements which include hardware appliances or arrangements where the undelivered element is PCS. Deferred revenue is recorded when products or services provided are invoiced prior to completion of the related performance obligations and is recognized as revenue ratably over the PCS period. Deferred cost of revenue primarily consists of product costs related to revenue deferred in accordance with the Company’s revenue recognition policy. Deferred revenue and associated deferred cost of revenue, expected to be realized within one year are classified as current liabilities and current assets, respectively, on the accompanying consolidated balance sheets.
Employee Benefit Plan. The Company recognizes the underfunded or overfunded status of a defined benefit pension or postretirement plan as an asset or liability in the accompanying consolidated balance sheets. Changes in the funded status are recognized through accumulated other comprehensive income, a component of stockholder’s equity, in the year in which the changes occur.
Income Taxes. The Company computes income taxes using the asset and liability method, under which deferred income taxes are provided for temporary differences between financial reporting basis and tax basis of assets and liabilities and operating loss and tax credit carry forwards. A valuation allowance is established when necessary to reduce deferred tax assets to the amount expected to be realized. Deferred tax assets and liabilities and operating loss and tax credit carryforwards are measured using enacted tax rates expected to apply to taxable income in the years in which those temporary differences and operating loss and tax credit carryforwards are expected to be recovered or settled.
The Company is subject to audits and examinations of tax returns by tax authorities in various jurisdictions, including the Internal Revenue Service. The Company regularly assesses the likelihood of adverse outcomes resulting from these examinations to determine the adequacy of the provision for income taxes.
Recently Issued Accounting Standards.
In September 2009, the Financial Accounting Standards Boards (“FASB”) amended the Accounting Standards Codification (“ASC”) as summarized in Accounting Standards Update (“ASU”) 2009-14, Software (Topic 985): Certain Revenue Arrangements That Include Software Elements, and ASU 2009-13, Revenue Recognition (Topic 605): Multiple-Deliverable Revenue Arrangements. Under ASU 2009-14, ASC Topic 985 has been amended to remove from the scope of industry specific revenue accounting guidance for software and
75
Table of Contents
SILICON GRAPHICS INTERNATIONAL CORP.
NOTES TO FINANCIAL STATEMENTS—(Continued)
software related transactions, tangible products containing software components and non-software components that function together to deliver the product’s essential functionality. Under ASU 2009-13, ASC Topic 605 has been amended (1) to provide updated guidance on whether multiple deliverables exist, how the deliverables in an arrangement should be separated, and the consideration allocated; (2) to require an entity to allocate revenue in an arrangement using estimated selling prices of deliverables if a vendor does not have vendor-specific objective evidence or third-party evidence of selling price; and (3) to eliminate the use of the residual method and require an entity to allocate revenue using the relative selling price method. The accounting changes summarized in ASU 2009-14 and ASU 2009-13 are both effective for fiscal years beginning on or after June 15, 2010, with early adoption permitted. Adoption may either be on a prospective basis or by retrospective application. The Company is currently assessing the impact of these amendments to the ASC on its accounting and reporting systems and processes. The Company is currently evaluating the impact that the adoption of the ASC as of June 26, 2010 will have on its consolidated financial statements. The Company believes that application of these amendments will result in a substantial portion of the Company’s revenue and all related cost of sales being recognized at the time of sale. Currently certain revenue and associated cost of sales are deferred at the time of sale and recognized ratably over the PCS period. As of June 25, 2010, deferred costs of revenue and deferred revenue were $94.4 million and $229.6 million, respectively.
In January 2010, the FASB issued ASU No. 2010-06, Fair Value Measurements and Disclosures (Topic 820): Improving Disclosures about Fair Value Measurements (“ASU 2010-06”), which requires new disclosures about significant transfers in and out of Level 1 and Level 2 and separate disclosures about purchases, sales, issuances, and settlements with respect to Level 3 measurements. ASU 2010-16 also clarifies existing fair value disclosures about valuation techniques and inputs used to measure fair value. The new disclosures and clarifications of existing disclosures are effective for the Company beginning June 26, 2010, except for the disclosures about purchases, sales, issuances, and settlements relating to Level 3 measurements, which will be effective for the Company beginning June 30, 2011. The Company does not expect the adoption to have a material impact on the consolidated financial statements.
3. ACQUISITION
Acquisition of Silicon Graphics, Inc.
On May 8, 2009 (the “Closing Date”), the Company completed the acquisition of substantially all of the assets of Legacy SGI, excluding certain assets unrelated to the ongoing business, including certain of Legacy SGI’s non-U.S. subsidiaries and operations and assumed certain liabilities. The acquisition was consummated pursuant to the terms of an Asset Purchase Agreement dated as of March 31, 2009 and as amended on April 30, 2009 (as amended, the “Agreement”). As Legacy SGI and certain of its affiliates had filed bankruptcy petitions and motions for voluntary Chapter 11 reorganization, the Purchase Agreement was subject to the approval of the United States Bankruptcy Court for the Southern District of New York (the “Bankruptcy Court”). On April 30, 2009, the Agreement and the transactions contemplated thereby were approved by the Bankruptcy Court, allowing the Company to complete the Acquisition under Section 363 of the U.S. Bankruptcy Code. Under the terms of the Agreement, the Company acquired the net assets for a purchase price of approximately $42.5 million in cash.
The Company retained independent appraisers to assist management in the determination of the fair value of the various assets acquired and liabilities assumed. The fair value of the acquired net assets of $62.3 million, including assumed liabilities, exceeded the $42.5 million cash consideration paid by the Company, resulting in a gain of $19.8 million for the six months ended June 26, 2009.
The Company conducted a review to reassess whether it identified all the assets acquired and all the liabilities assumed, and followed the required measurement procedures for Closing Date recognition of the fair
76
Table of Contents
SILICON GRAPHICS INTERNATIONAL CORP.
NOTES TO FINANCIAL STATEMENTS—(Continued)
value of net assets acquired. The review confirmed the calculation of the gain on acquisition, which is consistent with a distressed sale of assets in bankruptcy, as well as the depressed market capitalization of Legacy SGI.
The following are the estimated fair value of assets acquired and liabilities assumed as of the Closing Date (in thousands):
| Cash and short-term investments |
$ | 33,018 | ||
| Deferred cost of revenue |
1,821 | |||
| Other tangible assets |
163,150 | |||
| Deferred revenue |
(76,265 | ) | ||
| Deferred income tax liabilities |
(1,818 | ) | ||
| Other liabilities assumed |
(79,275 | ) | ||
| Net tangible assets |
40,631 | |||
| Intangible assets |
21,700 | |||
| Net assets acquired |
62,331 | |||
| Gain on acquisition |
19,831 | |||
| Cash paid |
$ | 42,500 | ||
The fair value of the major components of the intangibles assets acquired and their estimated useful lives is as follows (dollars in thousands):
| Fair Value | Weighted Average Useful Life (in Years) |
|||||
| Customer relationships |
$ | 6,900 | 5 | |||
| Customer backlog |
5,100 | (a | ) | |||
| Purchased technology |
5,000 | 4 | ||||
| Trademark/ trade name portfolio |
2,600 | 5 | ||||
| In-process research and development costs |
2,100 | (b | ) | |||
| Total |
$ | 21,700 | ||||
| (a) | The customer backlog intangible asset is amortized as all revenue recognition criteria is accomplished for a particular customer order, reflecting the use of the asset. |
| (b) | In-process research and development is accounted for as an indefinite-lived intangible asset until completion or abandonment of the associated research and development efforts. |
77
Table of Contents
SILICON GRAPHICS INTERNATIONAL CORP.
NOTES TO FINANCIAL STATEMENTS—(Continued)
The following unaudited pro forma condensed financial information presents the combined results of operations of the Company and Legacy SGI as if the acquisition had occurred in six months ended June 26, 2009 and in the year ended January 3, 2009 (in thousands except per share amounts):
| Pro forma
combined Six Months Ended June 26, 2009 |
Pro forma
combined Year Ended January 3, 2009 |
|||||||
| Revenue |
$ | 232,909 | $ | 595,912 | ||||
| Loss from continuing operations before income taxes |
(73,462 | ) | (187,013 | ) | ||||
| Net loss from discontinued operations, net of tax |
(20 | ) | — | |||||
| Net loss |
$ | (73,482 | ) | $ | (192,719 | ) | ||
| Net loss per share, basic and diluted |
||||||||
| Continuing operations |
$ | (2.47 | ) | $ | (6.51 | ) | ||
| Discontinued operations |
— | — | ||||||
| Basic and diluted net loss per share |
$ | (2.47 | ) | $ | (6.51 | ) | ||
| Shares used in computing basic and diluted net loss per share |
29,798 | 29,853 | ||||||
The unaudited pro forma condensed financial information is not intended to represent or be indicative of the condensed results of operations of the Company that would have been reported had the acquisition been completed as of the beginning of the periods presented, and should not be taken as representative of the future consolidated results of operations of the Company.
During the year ended June 25, 2010, the Company received a $1.0 million payment from Legacy SGI related to potential liabilities of Legacy SGI, which pursuant to the Agreement were to be remitted to the Company if not paid to a third party. In addition, the Company settled a lawsuit filed by Legacy SGI with its customer and received a $2.3 million settlement payment during the year ended June 25, 2010. At the Closing Date, the Company assessed whether it was more likely than not that contingent assets existed and based on all available information concluded that no assets existed. Accordingly, the Company has recorded the total $3.3 million payment as an acquisition-related gain in the accompanying consolidated statement of operations in the year ended June 25, 2010.
During the six months ended June 26, 2009, the Company incurred acquisition-related costs (i.e., advisory, legal, valuation and other professional fees) of $6.1 million which was expensed in the periods in which the costs were incurred.
Acquisition of Copan Systems, Inc.
On February 23, 2010, the Company completed the acquisition of substantially all the assets of Copan Systems, Inc. (“Copan”) and assumed certain liabilities. The purchase price of $2.0 million was allocated to Copan’s tangible and identifiable intangible assets acquired and liabilities assumed based on their fair market values as of the acquisition date. The purchase price allocation resulted in purchased net tangible assets of $1.0 million, consisting primarily of inventories and fixed assets, and purchased identifiable intangible assets of $1.0 million.
The Company retained independent appraisers to assist management in the determination of the fair value of the various assets acquired and liabilities assumed.
78
Table of Contents
SILICON GRAPHICS INTERNATIONAL CORP.
NOTES TO FINANCIAL STATEMENTS—(Continued)
The fair value of the intangible assets acquired and their estimated useful lives are as follows (dollars in thousands):
| Fair Value |
Useful Life (in Years) |
|||||
| Purchased technology |
$ | 300 | 2 | |||
| Patents and core technology |
200 | 2 | ||||
| Trademark / trade name portfolio |
100 | 2 | ||||
| In-process research and development costs |
400 | (a | ) | |||
| Total |
$ | 1,000 | ||||
| (a) | In-process research and development is accounted for as an indefinite-lived intangible asset until completion or abandonment of the associated research and development efforts. |
The financial results of this acquisition are not considered significant for purposes of pro forma financial disclosures.
4. FINANCIAL INSTRUMENTS AND FAIR VALUE
The Company measures its assets and liabilities at fair value based upon the expected exit price, representing the amount that would be received on the sale of an asset or paid to transfer a liability in an orderly transaction between market participants. As such, fair value reflects the assumptions market participants would use in pricing an asset or liability based on the best information available. Assumptions include the risks inherent in a particular valuation technique (such as a pricing model) and/or the risks inherent in the inputs to the model.
The Company uses a three-level fair value hierarchy that prioritizes the inputs to valuation techniques used to measure fair value. The hierarchy gives the highest priority to unadjusted quoted prices in active markets for identical assets or liabilities (Level 1 measurements) and the lowest priority to unobservable inputs (Level 3 measurements). The three levels of the fair value hierarchy are described below:
| • | Level 1 - Unadjusted quoted prices in active markets that are accessible at the measurement date for identical, unrestricted assets or liabilities; |
| • | Level 2 - Quoted prices in markets that are not active or financial instruments for which all significant inputs are observable, either directly or indirectly; and |
| • | Level 3 - Prices or valuations that require inputs that are both significant to the fair value measurement and unobservable. |
The Company’s assessment of the hierarchy level of the assets or liabilities measured at fair value is determined based on the lowest level input that is significant to the fair value measurement in its entirety. The Company consider an active market to be one in which transactions for the asset or liability occur with sufficient frequency and volume to provide pricing information on an ongoing basis, and view an inactive market as one in which there are a few transactions for the asset or liability, the prices are not current, or price quotations vary substantially either over time or among market makers. Where appropriate, the Company or the counterparty’s non-performance risk is considered in determining the fair values of liabilities and assets, respectively.
Long-term Investments
Long-term investments consist of ARS, which are investments with contractual maturities generally between zero and 50 years. The Company’s ARS consist of investments that are backed by pools of student
79
Table of Contents
SILICON GRAPHICS INTERNATIONAL CORP.
NOTES TO FINANCIAL STATEMENTS—(Continued)
loans, the majority of which are ultimately guaranteed by the U.S. Department of Education. Beginning in February 2008, certain ARS failed auction due to sell orders exceeding buy orders. Given the recent disruptions in the credit markets and the fact that the liquidity for these types of securities remains uncertain, the Company has classified all of the ARS ($7.5 million, net of unrealized losses) as long-term investments in the accompanying consolidated balance sheets as the Company’s ability to liquidate such securities in the next 12 months is uncertain.
Long-term investments consist of the following (in thousands):
| Amortized Cost |
Gross Unrealized Gain |
Gross Unrealized Loss |
Estimated Fair Value | ||||||||||
| June 25, 2010 |
|||||||||||||
| Auction rate securities |
$ | 8,775 | $ | — | $ | (1,300 | ) | $ | 7,475 | ||||
| June 26, 2009 |
|||||||||||||
| Auction rate securities |
$ | 9,056 | $ | — | $ | (1,640 | ) | $ | 7,416 | ||||
As of June 25, 2010 and June 26, 2009, the Company has recorded a temporary impairment loss within accumulated other comprehensive loss of $1.3 million and $1.6 million, respectively. The unrealized losses on the investments in ARS were caused by market declines as a result of the recent disruption in the credit markets. Because the decline in market value is attributable to changes in market conditions and not credit quality, and the Company does not intend to sell nor likely be required to sell these investments prior to the recovery of the entire amortized cost basis, the Company does not consider the investments in ARS to be other-than temporarily impaired at June 25, 2010. The Company will continue to monitor the ARS investments in light of the current debt market environment and evaluate the accounting for these investments. As of June 25, 2010 and June 26, 2009, the ARS has been in a continuous unrealized loss position for greater than twelve months.
Realized gains or losses on sales of long-term investments were insignificant in all periods presented.
Fair Value of Financial Instruments
The following table sets forth the financial instruments measured at fair value on a recurring basis as of June 25, 2010 (in thousands):
| Level 1 | Level 2 | Level 3 | Assets at
fair value | |||||||||
| June 25, 2010 |
||||||||||||
| Cash equivalents |
||||||||||||
| Money market funds |
$ | 1,493 | $ | — | $ | — | $ | 1,493 | ||||
| Treasury bills |
50,592 | — | — | 50,592 | ||||||||
| Long-term investments |
||||||||||||
| Auction Rate Securities |
— | — | 7,475 | 7,475 | ||||||||
| Total |
$ | 52,085 | $ | — | $ | 7,475 | $ | 59,560 | ||||
The Company’s cash equivalents are classified within Level 1 of the fair value hierarchy as they are valued using quoted market prices, broker or dealer quotations, or alternative pricing sources with reasonable levels of price transparency. Cash equivalents consist of money market funds and U.S. Treasuries.
80
Table of Contents
SILICON GRAPHICS INTERNATIONAL CORP.
NOTES TO FINANCIAL STATEMENTS—(Continued)
The Company’s ARS are classified within Level 3 of the fair value hierarchy as the fair value of ARS is estimated using an income (discounted cash flow) approach that incorporates both observable and unobservable inputs to discount the expected future cash flows.
The changes in Level 3 assets measured at fair value on a recurring basis for the year ended June 25, 2010 were as follows (in thousands):
| ARS | ||||
| Balance at December 29, 2007 |
$ | — | ||
| Transfers into Level 3 |
9,125 | |||
| Total unrealized losses included in other comprehensive income |
(392 | ) | ||
| Redemption at par value |
(69 | ) | ||
| Balance at January 3, 2009 |
8,664 | |||
| Total unrealized loss included in other comprehensive income |
(1,248 | ) | ||
| Balance at June 26, 2009 |
7,416 | |||
| Total unrealized gains included in other comprehensive income |
334 | |||
| Redemption at par value |
(275 | ) | ||
| Balance at June 25, 2010 |
$ | 7,475 | ||
The Company may also be required to measure certain assets or liabilities at fair value on a nonrecurring basis. The fair values of accounts receivable, accounts payable, and accrued liabilities approximates their carrying values because of the short-term nature of these instruments. The fair value of investment in SGI Japan accounted for under the cost method is valued based on a combination of discounted cash flows and market transactions. As of June 25, 2010 and June 26, 2010, the fair value of the investment in SGI Japan was $5.0 million.
5. INVENTORIES
Inventories consist of the following (in thousands):
| June 25, 2010 |
June 26, 2009 | |||||
| Finished goods |
$ | 37,525 | $ | 56,343 | ||
| Work in process |
13,875 | 21,347 | ||||
| Raw materials |
38,529 | 40,100 | ||||
| Total inventories |
$ | 89,929 | $ | 117,790 | ||
6. PREPAID EXPENSES AND OTHER CURRENT ASSETS
Prepaid expenses and other current assets consist of the following (in thousands):
| June 25, 2010 |
June 26, 2009 | |||||
| Non-trade accounts receivable |
$ | 4,794 | $ | 7,935 | ||
| Prepaid income taxes |
2,128 | 4,099 | ||||
| Value-added tax receivable |
5,272 | 2,659 | ||||
| Deferred income taxes |
463 | 2,511 | ||||
| Other prepaid and current assets |
3,310 | 8,553 | ||||
| Total prepaid expenses and other current assets |
$ | 15,967 | $ | 25,757 | ||
81
Table of Contents
SILICON GRAPHICS INTERNATIONAL CORP.
NOTES TO FINANCIAL STATEMENTS—(Continued)
7. PROPERTY AND EQUIPMENT, NET
Property and equipment, net consist of the following (dollars in thousands):
| Estimated Useful Life |
June 25, 2010 |
June 26, 2009 |
||||||||
| Land |
N/A | $ | 799 | $ | 799 | |||||
| Building |
30-32 | 11,062 | 10,704 | |||||||
| Computer equipment and software |
2-6 | 17,830 | 16,855 | |||||||
| Manufacturing equipment |
2-7 | 5,451 | 6,741 | |||||||
| Leasehold improvements |
2-7 | 7,501 | 5,564 | |||||||
| Furniture and fixtures |
2-7 | 1,532 | 1,648 | |||||||
| Vehicles |
5 | 104 | 104 | |||||||
| Construction in progress |
N/A | 428 | 1,216 | |||||||
| 44,707 | 43,631 | |||||||||
| Less accumulated depreciation and amortization |
(16,535 | ) | (10,507 | ) | ||||||
| Total property and equipment, net |
$ | 28,172 | $ | 33,124 | ||||||
Depreciation and amortization expense for the years ended June 25, 2010, January 3, 2009, December 29, 2007, and for the six months ended June 26, 2009 was $12.1 million, $3.2 million, $3.0 million, and $2.1 million, respectively.
8. INTANGIBLE ASSETS, NET
The following table details the Company’s intangible asset balance by major asset class (dollars in thousands).
| Intangible Asset Class |
Weighted Average Useful Life (in Years) |
At June 25, 2010 | |||||||||||
| Gross Carrying Amount |
Accumulated Amortization |
Net | |||||||||||
| Customer relationships |
5 | $ | 6,900 | $ | (1,610 | ) | $ | 5,290 | |||||
| Purchased technology |
4 | 5,300 | (1,434 | ) | 3,866 | ||||||||
| Customer backlog |
(a | ) | 5,100 | (3,517 | ) | 1,583 | |||||||
| Trademark/ trade name portfolio |
5 | 3,667 | (849 | ) | 2,818 | ||||||||
| Patents & Other |
2 | 200 | (34 | ) | 166 | ||||||||
| Subtotal |
21,167 | (7,444 | ) | 13,723 | |||||||||
| In-process research & development costs not subject to amortization |
(b | ) | 2,500 | — | 2,500 | ||||||||
| Total |
$ | 23,667 | $ | (7,444 | ) | $ | 16,223 | ||||||
82
Table of Contents
SILICON GRAPHICS INTERNATIONAL CORP.
NOTES TO FINANCIAL STATEMENTS—(Continued)
| Intangible Asset Class |
Weighted Average Useful Life (in Years) |
||||||||||||
| At June 26, 2009 | |||||||||||||
| Gross Carrying Amount |
Accumulated Amortization |
Net | |||||||||||
| Customer relationships |
5 | $ | 6,900 | $ | (167 | ) | $ | 6,733 | |||||
| Purchased technology |
4 | 5,000 | (135 | ) | 4,865 | ||||||||
| Customer backlog |
(a | ) | 5,100 | (740 | ) | 4,360 | |||||||
| Trademark/ trade name portfolio |
5 | 3,567 | (104 | ) | 3,463 | ||||||||
| Subtotal |
20,567 | (1,146 | ) | 19,421 | |||||||||
| In-process research & development costs not subject to amortization |
(b | ) | 2,100 | — | 2,100 | ||||||||
| Total |
$ | 22,667 | $ | (1,146 | ) | $ | 21,521 | ||||||
| (a) | The customer backlog intangible asset is amortized as all revenue recognition criteria is accomplished for a particular customer order, reflecting the use of the asset. |
| (b) | In-process research and development is accounted for as an indefinite-lived intangible asset until completion or abandonment of the associated research and development efforts. |
Intangible assets amortization expense was $6.3 million, $2.4 million, $4.4 million, and $1.2 million in the years ended June 25, 2010, January 3, 2009, and December 29, 2007 and in the six months ended June 26, 2009, respectively.
In the year ended January 3, 2009, the Company performed an impairment analysis of its intangible assets as events and circumstances indicated that their carrying amounts may not be recoverable. As a result of the analysis, the Company recognized and charged to discontinued operations an impairment charge of $17.5 million as described in Note 19.
In the six months ended June 26, 2009, the Company recognized an impairment charge of $2.5 million related to its tradename intangible asset. Upon the acquisition of Legacy SGI and the change in the Company’s name to Silicon Graphics International Corp., the Company determined that the tradename intangible asset of $3.5 million was impaired, primarily as it will be used for a product line only. The impairment charge was recorded as sales and marketing expense in the accompanying consolidated statement of operations. Additionally, the Company determined that the remaining capitalized tradename intangible asset of $1.0 million, which was historically classified as an indefinite life asset, has a finite life of five years.
No impairment of intangible assets was recorded in the year ended June 25, 2010 and December 29, 2007.
As of June 25, 2010, expected amortization expense for all intangible assets is as follows (in thousands):
| Fiscal Year |
Amortization Expense | ||
| 2011 |
$ | 5,163 | |
| 2012 |
3,402 | ||
| 2013 |
2,813 | ||
| 2014 |
2,345 | ||
| 2015 and thereafter |
— | ||
| Total amortization |
$ | 13,723 | |
83
Table of Contents
SILICON GRAPHICS INTERNATIONAL CORP.
NOTES TO FINANCIAL STATEMENTS—(Continued)
9. OTHER ASSETS
Other assets consist of the following (in thousands):
| June 25, 2010 |
June 26, 2009 | |||||
| Long-term service inventory |
$ | 16,135 | $ | 14,332 | ||
| Restricted pension plan assets |
6,945 | 8,152 | ||||
| Investment in SGI Japan |
5,000 | 5,000 | ||||
| Residual value of leased equipment |
763 | 1,476 | ||||
| Long-term refundable deposits |
1,154 | 1,416 | ||||
| Other assets |
2,346 | 2,871 | ||||
| Total other assets |
$ | 32,343 | $ | 33,247 | ||
10. OTHER CURRENT LIABILITIES
Other current liabilities consist of the following (in thousands):
| June 25, 2010 |
June 26, 2009 | |||||
| Accrued warranty, current portion |
$ | 2,859 | $ | 5,920 | ||
| Accrued sales and use tax payable |
8,083 | 3,562 | ||||
| Income taxes payable |
1,214 | 1,256 | ||||
| Accrued restructuring |
1,311 | 1,638 | ||||
| Accrued professional services fees |
1,874 | 1,694 | ||||
| Royalty reserve |
927 | 1,384 | ||||
| Other |
11,340 | 16,426 | ||||
| Total other current liabilities |
$ | 27,608 | $ | 31,880 | ||
11. OTHER NON-CURRENT LIABILITIES
Other non-current liabilities consist of the following (in thousands):
| June 25, 2010 |
June 26, 2009 | |||||
| Pension liability |
$ | 7,012 | $ | 7,156 | ||
| Deferred income taxes |
342 | 2,966 | ||||
| Accrued warranty, non-current portion |
1,527 | 2,652 | ||||
| Deferred rent, non-current portion |
981 | 1,082 | ||||
| Other |
2,424 | 1,090 | ||||
| Total other non-current liabilities |
$ | 12,286 | $ | 14,946 | ||
84
Table of Contents
SILICON GRAPHICS INTERNATIONAL CORP.
NOTES TO FINANCIAL STATEMENTS—(Continued)
12. WARRANTY RESERVE
Activity in the warranty reserve, which is included in other current and non-current liabilities, is as follows (in thousands):
| June 25, 2010 |
June 26, 2009 |
|||||||
| Balance at beginning of period |
$ | 8,572 | $ | 2,789 | ||||
| Warranty accrual assumed in acquisition of Legacy SGI |
— | 6,367 | ||||||
| Current period accrual |
1,548 | 970 | ||||||
| Warranty expenditures charged to accrual |
(4,021 | ) | (1,554 | ) | ||||
| Changes in accrual for pre-existing warranties |
(1,713 | ) | — | |||||
| Balance at end of period |
$ | 4,386 | $ | 8,572 | ||||
13. RESTRUCTURING ACTIVITY
On July 27, 2009, management approved restructuring actions to reduce the Company’s European workforce and vacate certain facilities in Europe. The total amount expected to be incurred in connection with the restructuring activity is $8.0 million. The expense related to these actions for the year ended June 25, 2010 was $4.6 million for employee severance and $0.6 million for vacating facilities. The Company expects employee severance to be substantially paid during fiscal year 2011 and the Company expects to substantially fulfill the remaining contractual obligations related to the facilities exit costs by fiscal year 2012. As of June 25, 2010, the total cost incurred in connection with the restructuring was $7.7 million.
| Employee Terminations |
Facilities Exit Costs |
Total | ||||||||||
| Balance at January 3, 2009 |
$ | — | $ | — | $ | — | ||||||
| Costs incurred |
2,122 | 362 | 2,484 | |||||||||
| Cash payments |
(626 | ) | (163 | ) | (789 | ) | ||||||
| Balance at June 26, 2009 |
1,496 | 199 | 1,695 | |||||||||
| Costs incurred |
4,590 | 630 | 5,220 | |||||||||
| Cash payments |
(4,818 | ) | (492 | ) | (5,310 | ) | ||||||
| Balance at June 25, 2010 |
$ | 1,268 | $ | 337 | $ | 1,605 | ||||||
The restructuring liability balance of $1.6 million as of June 25, 2010 includes $1.3 million recorded in other current liabilities and $0.3 million recorded in other non-current liabilities in the accompanying consolidated balance sheets. All costs accrued as of June 26, 2009 were substantially paid during the year ended June 25, 2010.
14. SHARE-BASED COMPENSATION
Share-Based Benefit Plans
In 2005, the Company’s Board of Directors adopted and its stockholders approved the Company’s 2005 Equity Incentive Plan (“2005 Plan”), 2005 Non-Employee Directors’ Stock Option Plan and 2005 Employee Stock Purchase Plan (“2005 ESPP Plan”). As of June 25, 2010, the aggregate number of shares of common stock available for grant under each plan is 2,976,187, 70,333 and 748,995 shares, respectively. Each plan contains a provision that automatically increases the number of shares of common stock reserved for issuance on January 1 of each year. During the year ended January 3, 2009 the number of stock options authorized for issuance under
85
Table of Contents
SILICON GRAPHICS INTERNATIONAL CORP.
NOTES TO FINANCIAL STATEMENTS—(Continued)
each Plan was increased by 1,180,516, 16,581 and 282,796, respectively. During the year ended June 25, 2010, the number of stock options authorized for issuance under each Plan was increased by 1,583,135, 68,703 and 364,923 shares, respectively. The Company’s Board of Directors adopted the 2006 New Recruit Equity Incentive Plan (“New Recruit Plan”) in January 2006 which allows the Company to grant non-statutory stock awards for up to 1,000,000 shares of common stock to newly hired employees as an inducement to join the Company. No grants may be made under the New Recruit Plan to persons who are continuing employees or directors. The New Recruit Plan provides for the grant of the following stock awards: (i) non-statutory stock options, (ii) stock purchase awards, (iii) stock bonus awards, (iv) stock appreciation rights, (v) stock unit awards, and (vi) other stock awards. As of June 25, 2010, the number of shares of common stock available for grant under the 2006 Plan is 806,438. The total shares of common stock reserved for the New Recruit Plan was increased by 500,000 shares in August 2006 and by another 500,000 shares in January 2007. The exercise price of each non-statutory stock option shall be not less than one hundred percent (100%) of the fair market value of the common stock subject to the option on the date the option is granted.
Stock awards expire ten years from the date of grant, or such shorter period specified in the option agreement. The options generally vest at a rate of 25% per year over four years from the date the option is granted. The Company issues new shares of its common stock upon exercise of stock options, issuance of restricted stock awards (“RSA”), restricted stock units (“RSU”) and issuance of shares purchased under its 2005 ESPP. RSAs differ from RSUs in that RSAs result in issuance of common stock with all rights, including rights to vote and to receive dividends, upon grant, with the exception of the ability to sell the common stock. Common stock to be issued for grants of RSUs are not issued until the RSU vests and do not have rights of voting or to receive dividends.
Tender Offer
On June 11, 2007, the Company filed a tender offer on Schedule TO (“Tender Offer”) with the SEC under which holders of options with exercise prices greater than $16.00 per share could tender their options in exchange for restricted stock unit awards granted under the 2005 Plan based upon the following exchange ratios:
| Exercise Price Range |
Stock Options Shares per Restricted Stock Unit | |
| $16.00 - $24.99 |
2 to 1 | |
| $25.00 - $34.99 |
3 to 1 | |
| $35.00 and above |
3.5 to 1 |
The restricted stock unit awards are subject to vesting in equal quarterly installments through August 15, 2009 (if the grant date of the option being tendered was prior to October 1, 2006) or August 15, 2010 (if the grant date of the option being tendered was after October 1, 2006). The tender offer provided that the option holder could and must submit their election to participate in the tender offer no later than July 10, 2007, and could amend their election up to that date. Furthermore, this tender offer was not available to the Company’s then current directors or named executive officers and the Company could at its sole discretion amend, extend or withdraw the tender offer at any time prior to closing.
The Company completed the Tender Offer on July 10, 2007. As a result, the Company accepted for exchange options to purchase an aggregate of 2,238,883 shares of the Company’s common stock from 187 eligible participants, representing 87% of the shares subject to options that were eligible to be exchanged in the Offer to Exchange as of May 31, 2007. Upon the terms and subject to the conditions set forth in the Tender Offer to Exchange, the Company issued restricted stock unit awards covering an aggregate of 893,828 shares of the Company’s common stock in exchange for the options surrendered pursuant to the Tender Offer to Exchange.
86
Table of Contents
SILICON GRAPHICS INTERNATIONAL CORP.
NOTES TO FINANCIAL STATEMENTS—(Continued)
The fair value of the restricted stock unit awards was measured as the total of the unrecognized compensation cost of the original options tendered and the incremental compensation cost of the restricted stock unit awards on July 10, 2007, the date of cancellation. The incremental compensation cost was measured as the excess of the fair value of the restricted stock unit awards over the fair value of the options immediately before cancellation based on the share price and other pertinent factors at that date. The incremental cost of the 893,828 restricted stock unit awards was approximately $145,000. The unrecognized compensation costs of the 2,238,883 options cancelled were $17.1 million. The total fair value of the restricted stock unit awards on July 10, 2007 was $17.2 million and these costs will be amortized over the service period of the restricted stock unit awards. The service period of the restricted stock unit awards is longer than the service period of the options tendered.
Determining Fair Value
The fair value of share-based awards was estimated using the Black-Scholes option-pricing model with the following weighted-average assumptions for the following periods:
| Year Ended | Six
months ended June 26, 2009 | |||||||||||
| June 25, 2010 |
January 3, 2009 |
December 29, 2007 |
||||||||||
| Option Plans Shares |
||||||||||||
| Risk-free interest rate |
2.6% | 2.9% | 4.6% | 1.9% | ||||||||
| Volatility |
61.6% | 59.0% | 60.0% | 63.7% | ||||||||
| Weighted average expected life (in years) |
4.98 | 5.20 | 5.41 | 5.00 | ||||||||
| Weighted average fair value |
$ | 3.09 | $ | 5.30 | $ | 9.04 | $ | 2.20 | ||||
| ESPP Plan shares |
||||||||||||
| Risk-free interest rate |
0.6% | 2.2% | 4.5% | 0.7% | ||||||||
| Volatility |
58.0% | 50.0% | 50.0% | 68.0% | ||||||||
| Weighted average expected life (in years) |
1.25 | 1.25 | 1.25 | 1.25 | ||||||||
| Weighted average fair value |
$ | 2.55 | $ | 3.82 | $ | 4.97 | $ | 1.66 | ||||
The computation of expected life is based on an analysis of the relevant industry sector post-vest termination rates and exercise factors. In the year ended June 25, 2010, expected volatility is based on the implied and historical volatility for the Company. The interest rate is based on the implied yield currently available on U.S. Treasury zero-coupon issues with an equivalent remaining term. Where the expected term of the Company’s share-based awards do not correspond with the terms for which interest rates are quoted, the Company performs a straight-line interpolation to determine the rate from the available term maturities. As share-based compensation expense recognized in the accompanying consolidated statements of operations is based on awards ultimately expected to vest, it has been reduced for estimated forfeitures. Forfeitures are estimated at the time of grant and revised, if necessary, in subsequent periods if actual forfeitures differ from those estimated.
87
Table of Contents
SILICON GRAPHICS INTERNATIONAL CORP.
NOTES TO FINANCIAL STATEMENTS—(Continued)
Share-Based Compensation Expense
Total share-based compensation expense is as follows (in thousands):
| Year Ended | Six
months ended June 26, 2009 |
|||||||||||||
| June 25, 2010 |
January 3, 2009 |
December 29, 2007 |
||||||||||||
| Cost of revenue |
$ | 691 | $ | 1,120 | $ | 2,152 | $ | 423 | ||||||
| Research and development |
767 | 1,811 | 3,160 | 524 | ||||||||||
| Sales and marketing |
445 | 1,568 | 5,040 | 579 | ||||||||||
| General and administrative |
2,924 | 4,653 | 10,731 | 1,689 | ||||||||||
| Continuing operations |
4,827 | 9,152 | 21,083 | 3,215 | ||||||||||
| Discontinued operations |
(106 | ) | 435 | 2,152 | (111 | ) | ||||||||
| Total share-based compensation expense |
$ | 4,721 | $ | 9,587 | $ | 23,235 | $ | 3.104 | ||||||
Stock Options and Restricted Stock Awards Activity
Summary of stock option activity is as follows:
| Shares | Weighted Average Exercise Price |
Weighted Average Remaining Contractual term in years |
Aggregate Intrinsic Value | ||||||||
| Balance at December 30, 2006 |
4,771,471 | ||||||||||
| Options granted (weighted average fair value of $9.04 per share) |
3,410,081 | $ | 15.87 | ||||||||
| Options exercised |
(895,178 | ) | 3.00 | ||||||||
| Options cancelled |
(4,393,894 | ) | 25.63 | ||||||||
| Balance at December 29, 2007 |
2,892,480 | 13.13 | |||||||||
| Options granted (weighted average fair value of $5.30 per share) |
1,158,873 | 9.83 | |||||||||
| Options exercised |
(75,884 | ) | 7.06 | ||||||||
| Options cancelled |
(770,096 | ) | 12.45 | ||||||||
| Balance at January 3, 2009 |
3,205,373 | 12.24 | |||||||||
| Options granted (weighted average fair value of $3.09 per share) |
210,164 | 4.03 | |||||||||
| Options exercised |
(5,890 | ) | 1.36 | ||||||||
| Options cancelled |
(523,487 | ) | 10.51 | ||||||||
| Balance at June 26, 2009 |
2,886,160 | 11.98 | |||||||||
| Options granted (weighted average fair value of $ 3.09 per share) |
1,656,500 | 5.80 | |||||||||
| Options exercised |
(152,787 | ) | 5.81 | ||||||||
| Options cancelled |
(636,953 | ) | 9.96 | ||||||||
| Balance at June 25, 2010 |
3,752,920 | $ | 9.85 | 7.5 | $ | 4,135,773 | |||||
| Vested and expected to vest at June 25, 2010 |
3,301,877 | $ | 10.25 | 7.4 | $ | 3,272,534 | |||||
| Exercisable at June 25, 2010 |
1,824,264 | $ | 12.12 | 6.8 | $ | 916,593 | |||||
88
Table of Contents
SILICON GRAPHICS INTERNATIONAL CORP.
NOTES TO FINANCIAL STATEMENTS—(Continued)
Performance-based option grant
On August 11, 2009, the Company’s CEO was granted a non-qualified stock option, with performance-based metrics, to purchase 40,000 shares of the Company’s common stock. The stock option, which has a grant date fair value of approximately $0.1 million, was valued using the Black-Scholes option-pricing model. The stock option has an exercise price of $5.34 per share, a contractual term of ten years and a maximum of 10,000 shares vesting per annum depending on the attainment of performance-based metrics. Compensation expense for this award is recognized when it is determined that it is probable that the performance metrics will be achieved. Compensation expense related to this award was immaterial in the year ended June 25, 2010.
The total intrinsic value of options exercised in the year ending June 25, 2010 was $0.5 million.
As of June 25, 2010, there was $2.8 million of total unrecognized compensation cost related to non-vested stock options, which is expected to be recognized over a weighted average period of 1.5 years.
| Options Outstanding | Options Exercisable | |||||||||||
| Exercise Price |
Number of Outstanding Options |
Weighted Average Remaining Contractual Life (In Years) |
Weighted Average Exercise Price |
Number of Options Exercisable |
Weighted Average Exercise Price | |||||||
| $ 0.71-$ 5.07 | 119,426 | $ | 4.00 | 37,508 | $ | 3.60 | ||||||
| $ 5.34-$ 5.34 | 1,225,618 | $ | 5.34 | 224,505 | $ | 5.34 | ||||||
| $ 6.00-$ 8.98 | 382,316 | $ | 7.53 | 118,769 | $ | 7.13 | ||||||
| $ 9.00-$11.33 | 380,153 | $ | 9.95 | 197,292 | $ | 9.84 | ||||||
| $11.40-$12.82 | 487,348 | $ | 12.14 | 364,840 | $ | 12.26 | ||||||
| $13.15-$13.15 | 19,000 | $ | 13.15 | 12,665 | $ | 13.15 | ||||||
| $13.23-$13.23 | 700,000 | $ | 13.23 | 539,583 | $ | 13.23 | ||||||
| $13.44-$26.68 | 389,332 | $ | 15.63 | 283,024 | $ | 16.19 | ||||||
| $27.36-$35.94 | 37,895 | $ | 34.54 | 34,246 | $ | 34.50 | ||||||
| $37.91-$37.91 | 11,832 | $ | 37.91 | 11,832 | $ | 37.91 | ||||||
| $ 0.71-$37.91 | 3,752,920 | 7.5 | $ | 9.85 | 1,824,264 | $ | 12.12 | |||||
89
Table of Contents
SILICON GRAPHICS INTERNATIONAL CORP.
NOTES TO FINANCIAL STATEMENTS—(Continued)
The following table summarizes the Company’s restricted stock award (“RSA”) activity for the year ended June 25, 2010, the six month period ended June 26, 2009, the year ended January 3, 2009 and the year ended December 29, 2007.
| Number of Shares |
Weighted Average Grant Date Fair Value | |||||
| Balance at December 30, 2006 |
120,000 | $ | 27.36 | |||
| Awarded |
343,040 | 17.03 | ||||
| Released |
(69,128 | ) | 18.82 | |||
| Forfeited |
(154,378 | ) | 25.82 | |||
| Balance at December 29, 2007 |
239,534 | 16.03 | ||||
| Released |
(59,531 | ) | 15.28 | |||
| Forfeited |
(51,877 | ) | 20.03 | |||
| Balance at January 3, 2009 |
128,126 | 14.75 | ||||
| Released |
(27,186 | ) | 14.95 | |||
| Balance at June 26, 2009 |
100,940 | 14.69 | ||||
| Released |
(54,375 | ) | 14.95 | |||
| Forfeited |
(5,313 | ) | 18.07 | |||
| Balance at June 25, 2010 |
41,252 | $ | 13.91 | |||
As of June 25, 2010, there was $0.6 million of total unrecognized compensation cost related to RSA, which is expected to be recognized over a weighted average period of approximately 10 months.
The following table summarizes the Company’s restricted stock units (“RSU”) activity for the year ended June 25, 2010.
| Number of Shares |
Weighted Average Remaining Contractual Life |
Aggregate Intrinsic Value | ||||||
| Balance at December 30, 2006 |
— | |||||||
| Awarded |
996,953 | |||||||
| Released |
(84,242 | ) | ||||||
| Forfeited |
(111,547 | ) | ||||||
| Balance at December 29, 2007 |
801,164 | |||||||
| Awarded |
1,137,600 | |||||||
| Released |
(430,953 | ) | ||||||
| Forfeited |
(464,026 | ) | ||||||
| Balance at January 3, 2009 |
1,043,785 | |||||||
| Released |
(195,066 | ) | ||||||
| Forfeited |
(146,069 | ) | ||||||
| Balance at June 26, 2009 |
702,650 | |||||||
| Awarded |
10,000 | |||||||
| Released |
(270,550 | ) | ||||||
| Forfeited |
(127,752 | ) | ||||||
| Balance at June 25, 2010 |
314,348 | 0.9 | $ | 2,549,362 | ||||
| Vested and expected to vest at June 25, 2010 |
264,942 | 0.8 | $ | 2,148,678 | ||||
90
Table of Contents
SILICON GRAPHICS INTERNATIONAL CORP.
NOTES TO FINANCIAL STATEMENTS—(Continued)
As of June 25, 2010, there was $2.6 million of total unrecognized compensation cost related to RSU, which is expected to be recognized over a weighted average period of 1.7 years.
During the year ending June 25, 2010, 118,486 shares of common stock were delivered to the Company in payment of $0.86 million of withholding tax obligations arising from the release of RSA and RSU. The withholding tax obligations were based upon the fair market value of the Company’s common stock on the vesting date.
At June 25, 2010, the total compensation cost related to options to purchase the Company’s common stock under the 2005 ESPP Plan not yet recognized was approximately $0.5 million. This cost will be amortized on a straight-line basis over approximately 1.6 years. The following table shows the shares issued, and their respective weighted-average purchase price per share, pursuant to the 2005 ESPP Plan during the years ended June 25, 2010, January 3, 2009, December 29, 2007 and the six months ended June 26, 2009.
| Year Ended | Six
months ended June 26, 2009 | |||||||||||
| June 25, 2010 |
January 3, 2009 |
December 29, 2007 |
||||||||||
| Shares issued |
238,889 | 162,823 | 166,834 | 99,603 | ||||||||
| Weighted-average purchase price per share |
$ | 3.78 | $ | 7.94 | $ | 11.04 | $ | 3.77 | ||||
15. STOCKHOLDERS’ EQUITY
Stock Repurchase
In February 2009, the Company’s Board of Directors authorized a share repurchase program of up to $40.0 million of its common stock. Under the program, the Company was able to purchase shares of common stock through open market transactions and privately negotiated purchases at prices deemed appropriate by management. The program was suspended in April 2009, and no shares of outstanding common stock were repurchased during the year ended June 25, 2010. During the six months ended June 26, 2009, the Company repurchased 243,695 shares of outstanding common stock which are being held in treasury at an average price of $4.19 per share, for a total of $1.0 million, including expenses. Such repurchases were accounted for at cost and reflected as treasury stock in the accompanying consolidated balance sheets.
Accumulated Other Comprehensive Loss
The following table summarized the components of accumulated other comprehensive loss as of June 25, 2010, January 3, 2009, and December 29, 2007 and as of June 26, 2009 (in thousands):
| June 25, 2010 |
January 3, 2009 |
December 29, 2007 |
June 26, 2009 |
|||||||||||||
| Net unrealized gains/(losses) on investments |
$ | (1,357 | ) | $ | (394 | ) | $ | 48 | $ | (1,587 | ) | |||||
| Cumulative translation adjustment |
2 | 117 | (59 | ) | 2 | |||||||||||
| Gain/(loss) on pension assets |
(548 | ) | — | — | 10 | |||||||||||
| Accumulated other comprehensive loss |
$ | (1,903 | ) | $ | (277 | ) | $ | (11 | ) | $ | (1,575 | ) | ||||
16. EARNINGS PER SHARE
Basic and diluted net loss per common share is computed by dividing consolidated net loss by the weighted average number of common shares outstanding during the period. Diluted net income per share is computed by dividing consolidated net income by the weighted average number of common shares outstanding and dilutive
91
Table of Contents
SILICON GRAPHICS INTERNATIONAL CORP.
NOTES TO FINANCIAL STATEMENTS—(Continued)
common stock equivalent shares outstanding during the period. For the years ended June 25, 2010, January 3, 2009, and December 29, 2007, and the six months ended June 26, 2009, potentially dilutive shares, which include outstanding common stock options and restricted stock units, were not included in the computation of diluted net loss per common share as the result would be anti-dilutive. Such potentially dilutive shares are excluded when the effect would be to reduce a net loss per share. As the Company had a net loss in each of the periods presented, basic and diluted net loss per share are the same for each period presented.
The following table sets forth the computation of basic and diluted net loss per share for the years ended June 25, 2010, January 3, 2009, and December 29, 2007, and the six months ended June 26, 2009 (in thousands, except per share amount):
| Year ended | Six
months ended June 26, 2009 |
|||||||||||||||
| June 25, 2010 |
January 3, 2009 |
December 29, 2007 |
||||||||||||||
| Numerators: |
||||||||||||||||
| Loss from continuing operations, net of tax |
$ | (88,861 | ) | $ | (31,287 | ) | $ | (41,580 | ) | $ | (14,191 | ) | ||||
| Income (loss) from discontinued operations, net of tax |
409 | (22,941 | ) | (27,977 | ) | (20 | ) | |||||||||
| Net loss |
$ | (88,452 | ) | $ | (54,228 | ) | $ | (69,557 | ) | $ | (14,211 | ) | ||||
| Denominator: |
||||||||||||||||
| Weighted-average common shares used in computing basic and diluted net loss per share |
30,130 | 29,583 | 28,786 | 29,798 | ||||||||||||
| Net loss per share, basic and diluted: |
||||||||||||||||
| Continuing operations |
$ | (2.95 | ) | $ | (1.06 | ) | $ | (1.45 | ) | $ | (0.48 | ) | ||||
| Discontinued operations |
0.01 | (0.77 | ) | (0.97 | ) | — | ||||||||||
| Basic and diluted net loss per share |
$ | (2.94 | ) | $ | (1.83 | ) | $ | (2.42 | ) | $ | (0.48 | ) | ||||
The following table sets forth potential shares of common stock, which are excluded from the calculation of diluted net loss per share, as the result would be anti-dilutive (in thousands):
| Year ended | Six months ended June 26, 2009 | |||||||
| June 25, 2010 |
January 3, 2009 |
December 29, 2007 |
||||||
| Potentially dilutive securities |
4,067 | 3,205 | 2,892 | 2,886 | ||||
17. EMPLOYEE BENEFIT PLAN
Defined Benefit Plans
The Company sponsors defined benefit plans covering certain of our international employees in the United Kingdom and Germany. These defined benefit plans were acquired as part of the acquisition of Legacy SGI in May 2009. No new employees are eligible to join these plans. Pension benefits associated with these plans generally are based on each participant’s years of service, compensation, and age at retirement or termination. The Company funds the pension plans in amounts sufficient to meet the minimum requirements of the local laws and regulations. Additional funding may be provided as deemed appropriate.
92
Table of Contents
SILICON GRAPHICS INTERNATIONAL CORP.
NOTES TO FINANCIAL STATEMENTS—(Continued)
The projected benefit obligation (PBO) and the assets of the United Kingdom plan have been transferred to an insurance company and the Company is not responsible for any additional contributions to the plan to fund the benefit payments to the employees. However, the Company continues to pay the annual administrative costs of the plan.
German Plan
The German plan is managed by an insurance company and the insurance company makes investment decisions with the guidelines set by the German regulation. The plan assets are invested as part of the insurance company’s general fund and the Company does not have control over the target allocation or visibility of the investment strategies of these investments.
Following is a reconciliation of the beginning and ending balances of the projected benefit obligation and the fair value of plan assets as of June 25, 2010 and June 26, 2009 (in thousands):
| June 25, 2010 |
June 26, 2009 |
|||||||
| Projected Benefit Obligation |
||||||||
| Benefit obligation, beginning |
$ | 10,023 | $ | — | ||||
| Business combinations |
— | 9,695 | ||||||
| Service Cost |
126 | 20 | ||||||
| Interest Cost |
589 | 84 | ||||||
| Actuarial gains and losses |
436 | (19 | ) | |||||
| Benefits paid |
(316 | ) | (22 | ) | ||||
| Foreign exchange rate changes |
(1,311 | ) | 265 | |||||
| Benefit Obligation, ending |
$ | 9,547 | $ | 10,023 | ||||
| June 25, 2010 |
June 26, 2009 |
|||||||
| Fair Value of Plan Assets |
||||||||
| Fair value of plan assets, beginning |
$ | 2,614 | $ | — | ||||
| Business combinations |
— | 2,542 | ||||||
| Expected return on plan assets |
105 | 15 | ||||||
| Participant Contributions |
37 | — | ||||||
| Actuarial gains and losses |
(123 | ) | (10 | ) | ||||
| Benefit payments |
(31 | ) | (2 | ) | ||||
| Foreign exchange rate changes |
(343 | ) | 69 | |||||
| Fair value of plan assets, ending |
$ | 2,259 | $ | 2,614 | ||||
| June 25, 2010 |
June 26, 2009 | |||||
| Underfunded Status |
||||||
| Projected benefit obligation |
$ | 9,547 | $ | 10,023 | ||
| Fair value of plan assets |
2,259 | 2,614 | ||||
| Underfunded status of plan |
$ | 7,288 | $ | 7,409 | ||
93
Table of Contents
SILICON GRAPHICS INTERNATIONAL CORP.
NOTES TO FINANCIAL STATEMENTS—(Continued)
The Company has life insurance policies with cash surrender values that have been earmarked by the Company to partly cover the underfunded status of the plan of $7.2 million and $8.2 million as of June 25, 2010 and June 26, 2009, respectively. The cash surrender value of the life insurance plans is included in other assets in the accompanying consolidated balance sheets.
The following table summarizes the amounts recognized on the consolidated balance sheets as of June 25, 2010 and June 26, 2009 (in thousands):
| June 25, 2010 |
June 26, 2009 |
||||||
| Amounts recognized in the Consolidated Balance Sheets |
|||||||
| Non-current assets |
|||||||
| Accrued benefit cost |
|||||||
| Current liabilities |
$ | 276 | $ | 253 | |||
| Non-current liabilities |
$ | 7,012 | $ | 7,156 | |||
| Amounts recognized in the accumulated other comprehensive loss (income) |
|||||||
| Net actuarial loss (gain) |
$ | 548 | $ | (10 | ) | ||
The following table summarizes the amounts recorded to other comprehensive income loss (income) before taxes during the year ended June 25, 2010 and six months ended June 26, 2009 (in thousands):
| June 25, 2010 |
June 26, 2009 |
||||||
| Amounts recognized in other comprehensive loss (income) |
|||||||
| Net actuarial loss (gain) |
$ | 558 | $ | (10 | ) | ||
| Total recognized in other comprehensive loss (income) |
$ | 558 | $ | (10 | ) | ||
The Company does not expect any amortization from accumulated other comprehensive loss (income) into net periodic benefit cost during fiscal year 2011.
The following table summarizes the amounts related to the pension plan with accumulated benefit obligation in excess of plan assets at June 25, 2010 and June 26, 2009:
| (in thousands) | June 25, 2010 |
June 26, 2009 | ||||
| Projected benefit obligation |
$ | 9,547 | $ | 10,023 | ||
| Accumulated benefit obligation |
$ | 8,479 | $ | 10,495 | ||
| Fair value of plan assets |
$ | 2,259 | $ | 2,614 | ||
The Company carries the interest and service cost of the plan. Actuarial gains and losses are amortized over the life of the plan.
Weighted average assumptions used to determine benefit obligations for the German plan were as follows:
| June 25, 2010 |
June 26, 2009 |
|||||
| Discount rate |
5.4 | % | 6.0 | % | ||
| Rate of compensation increase |
2.0 | % | 2.0 | % |
94
Table of Contents
SILICON GRAPHICS INTERNATIONAL CORP.
NOTES TO FINANCIAL STATEMENTS—(Continued)
Weighted average assumptions used to determine net periodic benefit cost for the German plan were as follows:
| June 25, 2010 |
June 26, 2009 |
|||||
| Discount rate |
5.4 | % | 6.0 | % | ||
| Expected long-term rate of return on plan assets |
4.1 | % | 4.1 | % | ||
| Rate of compensation increase |
2.0 | % | 2.0 | % |
The discount rate reflects the current rate at which the associated liabilities could be effectively settled at the end of the year. The Company sets its rate to reflect the yield of a portfolio of high quality, fixed-income debt instruments that would produce cash flows sufficient in timing and amount to settle projected future benefits. Using this methodology, the Company determined a discount rate of 5.4% for the German plan as of June 25, 2010, which is a decrease of 0.6% from the rate used as of June 26, 2009
Expected long-term rate of return on assets assumptions for the German plan is determined using the projected long-term rate of return estimated by the insurance company for its general fund.
The net periodic benefit cost of the German plan was comprised of the following components (in thousands):
| Year ended June 25, 2010 |
Six months ended June 26, 2009 |
|||||||
| Net periodic benefit cost |
||||||||
| Service cost |
$ | 126 | $ | 20 | ||||
| Interest expense |
589 | 84 | ||||||
| Expected return on plan assets |
(105 | ) | (15 | ) | ||||
| Net periodic benefit cost |
$ | 610 | $ | 89 | ||||
The Company does not expect to make any contributions to the German plan during the next fiscal year as contributions are not required by funding regulations or laws and the cash surrender value of the life insurance plan earmarked by the Company substantially covers the under-funded status of the German plan.
Fair Value of Plan Assets
The plan assets measured at fair value consisted of the following as of June 25, 2010 (in thousands):
| Level 1 | Level 2 | Level 3 | Total | |||||||||
| Investments held by an insurance company |
$ | — | $ | 2,259 | $ | — | $ | 2,259 | ||||
| Total assets measured at fair value |
$ | — | $ | 2,259 | $ | — | $ | 2,259 | ||||
Level 2 assets include investments that are pooled with other investments held by the insurance company within its general fund. The investments held by the insurance company are valued by taking the percentage owned by the plan in the underlying net asset value of the insurance company’s general fund.
95
Table of Contents
SILICON GRAPHICS INTERNATIONAL CORP.
NOTES TO FINANCIAL STATEMENTS—(Continued)
Future Employee Benefit Payments
The following table provides the estimated pension payments that are payable from the German plan to participants (in thousands):
| Fiscal Year |
Future Payments | ||
| 2011 |
$ | 364 | |
| 2012 |
525 | ||
| 2013 |
402 | ||
| 2014 |
414 | ||
| 2015 |
465 | ||
| Following five years |
3,208 | ||
Defined Contribution Plan
Effective September 1, 2003, the Company established a 401(k) retirement plan covering substantially all employees. The plan provides for voluntary salary reduction contributions up to the maximum allowed under Internal Revenue Service rules. The Company can make annual contributions to the plan at the discretion of the Board of Directors. There were no contributions for the year ended June 25, 2010. The Company contributed $0.1 million, $0.2 million and $0.1 million during the six months ended June 26, 2009, the year ended January 3, 2009, and the year ended December 29, 2007, respectively.
18. INCOME TAXES
The provision (benefit) for income taxes for the years ended June 25, 2010, January 3, 2009 and December 29, 2007 and the six months ended June 26, 2009 consisted of the following (in thousands):
| Year ended | Six months ended June 26, 2009 |
|||||||||||||||
| June 25, 2010 |
January 3, 2009 |
December 29, 2007 |
||||||||||||||
| Federal: |
||||||||||||||||
| Current |
$ | (4,923 | ) | $ | (1,222 | ) | $ | (2,446 | ) | $ | 27 | |||||
| Deferred |
(482 | ) | 1,539 | 13,167 | (2,289 | ) | ||||||||||
| (5,405 | ) | 317 | 10,721 | (2,262 | ) | |||||||||||
| State: |
||||||||||||||||
| Current |
(395 | ) | (4 | ) | (32 | ) | 75 | |||||||||
| Deferred |
(59 | ) | (11 | ) | 1,834 | (279 | ) | |||||||||
| (454 | ) | (15 | ) | 1,802 | (204 | ) | ||||||||||
| Foreign: |
||||||||||||||||
| Current |
1,915 | 74 | 8 | 224 | ||||||||||||
| Deferred |
(497 | ) | — | — | — | |||||||||||
| 1,418 | 74 | 8 | 224 | |||||||||||||
| Provision (benefit) for income taxes |
$ | (4,441 | ) | $ | 376 | $ | 12,531 | $ | (2,242 | ) | ||||||
96
Table of Contents
SILICON GRAPHICS INTERNATIONAL CORP.
NOTES TO FINANCIAL STATEMENTS—(Continued)
The components of income (loss) before income taxes consisted of the following (in thousands):
| Year ended | Six
months ended June 26, 2009 |
|||||||||||||||
| June 25, 2010 |
January 3, 2009 |
December 29, 2007 |
||||||||||||||
| Domestic sources |
$ | (50,733 | ) | $ | (30,522 | ) | $ | (29,096 | ) | (31,210 | ) | |||||
| Foreign sources |
(42,569 | ) | (389 | ) | 47 | 14,777 | ||||||||||
| Total |
$ | (93,302 | ) | $ | (30,911 | ) | $ | (29,049 | ) | $ | (16,433 | ) | ||||
Deferred tax assets and liabilities reflect the effects of tax losses, credits, and the future income tax effects of temporary differences between the consolidated financial statement carrying amounts of existing assets and liabilities and their respective tax bases and are measured using enacted tax rates that apply to taxable income in the years in which those temporary differences are expected to be recovered or settled.
As of June 25, 2010 and June 26, 2009, the significant components of the Company’s deferred tax assets and liabilities were (in thousands):
| June 25, 2010 |
June 26, 2009 |
||||||
| Deferred tax assets: |
|||||||
| Net operating losses and tax credit carry forwards |
$ | 78,887 | $ | 51,537 | |||
| Accrued liabilities and other reserves |
458 | 5,549 | |||||
| Stock based compensation |
13,170 | 12,752 | |||||
| Intangible and fixed assets |
13,170 | 7,429 | |||||
| Accounts receivable and inventory reserves |
19,017 | 18,884 | |||||
| Other |
2,354 | 1,811 | |||||
| Total deferred tax assets |
127,056 | 97,962 | |||||
| Less valuation allowance |
126,559 | 98,417 | |||||
| Deferred tax assets (liability), net of valuation allowance |
$ | 497 | $ | (455 | ) | ||
| Net deferred tax assets (liability) |
$ | 497 | $ | (455 | ) | ||
The valuation allowance against our deferred tax assets increased from $98.4 million as of June 26, 2009 to $126.6 million as of June 25, 2010 and increased from $50.9 million as of January 3, 2009 to $98.4 million as of June 26, 2009. The net deferred tax asset as of June 25, 2010 is attributable to deferred tax assets of certain foreign subsidiaries which we believe are more likely than not of being realized.
As of June 25, 2010, the Company has federal, state, and foreign tax net operating loss carry forwards of $103.5 million, $100.2 million, and $131.5 million, respectively. If not utilized, the net operating loss carry forwards will begin to expire in 2028, 2012, and 2011, respectively.
As of June 25, 2010, the Company has federal and state Research and Development tax credits of $1.5 million and $1.9 million, respectively, and $5.3 million of foreign Investment Tax Credits. If not utilized, the federal and foreign tax credits will begin to expire in 2027 and 2019, respectively. The state tax credits do not expire.
97
Table of Contents
SILICON GRAPHICS INTERNATIONAL CORP.
NOTES TO FINANCIAL STATEMENTS—(Continued)
Amounts earned by foreign subsidiaries are generally subject to U.S. income taxation on repatriation to the U.S. The Company’s consolidated financial statements do not reflect any related deferred tax liability on undistributed earnings that may be repatriated from the Company’s foreign subsidiaries intended to be indefinitely reinvested in operations outside the U.S. U.S. income taxes have not been provided on net foreign cumulative loss of $41.4 million. It is not practicable to determine the income tax liability that might be incurred if these earnings were to be distributed.
Tax attributes related to stock option windfall deductions should not be recorded until they result in a reduction of cash taxes payable. The amount of the Company’s unrealized federal net operating losses relating to stock options deductions as of June 25, 2010 was $1.6 million. The benefit of these net operating losses would be recorded to additional paid-in capital when they reduce cash taxes payable.
A reconciliation of the statutory federal income tax rate for the years ended June 25, 2010, January 3, 2009, and December 29, 2007 and for the six months ended June 26, 2009 is as follows:
| Year ended | Six months ended |
|||||||||||
| June 25, 2010 |
January 3, 2009 |
December 29, 2007 |
June 26, 2009 |
|||||||||
| Federal statutory rate provision |
35.0 | % | 35.0 | % | 35.0 | % | 35.0 | % | ||||
| State taxes, net of federal tax benefit |
0.8 | 2.0 | 3.0 | (0.2 | ) | |||||||
| Foreign taxes |
(2.0 | ) | — | — | (8.4 | ) | ||||||
| Stock based compensation |
0.1 | — | (4.0 | ) | (0.3 | ) | ||||||
| Intangible asset impairment |
— | — | — | — | ||||||||
| Goodwill impairment |
— | — | (3.0 | ) | — | |||||||
| Valuation allowance |
(30.6 | ) | (35.0 | ) | (77.0 | ) | (21.0 | ) | ||||
| Losses carried back |
5.3 | — | — | — | ||||||||
| Other |
(3.8 | ) | (3.0 | ) | 3.0 | 1.1 | ||||||
| — | — | — | — | |||||||||
| 4.8 | % | (1.0 | )% | (43.0 | )% | 6.2 | % | |||||
A reconciliation of the unrecognized tax benefits (excluding interest and penalties) from January 3, 2009 through June 25, 2010 are as follows (in thousands):
| Balance at January 3, 2009 |
$ | 95 | ||
| Increase (decrease) to current year position |
8,162 | |||
| Increase (decrease) to prior year positions |
0 | |||
| Decrease due to lapse of statute of limitations |
0 | |||
| Increase (decrease) due to settlements |
0 | |||
| Balance at June 26, 2009 |
$ | 8,257 | ||
| Increase (decrease) to current year positions |
310 | |||
| Increase (decrease) to prior year positions |
982 | |||
| Decrease due to lapse of statute of limitations |
(17 | ) | ||
| Increase (decrease) due to settlements |
(197 | ) | ||
| Balance at June 25, 2010 |
$ | 9,335 | ||
98
Table of Contents
SILICON GRAPHICS INTERNATIONAL CORP.
NOTES TO FINANCIAL STATEMENTS—(Continued)
At June 25, 2010, the Company had approximately $9.3 million of gross unrecognized tax benefit of which $8.7 million, if recognized, will impact the effective tax rate. We do not expect that the total unrecognized tax benefits will significantly increase or decrease in the next 12 months.
The Company classifies interest expense and penalties related to unrecognized tax benefits as components of income tax expense. As of June 25, 2010, the Company has accrued interest and penalties of approximately $12.6 million and $0.5 million, respectively, on the Company’s consolidated balance sheet.
The Company’s U.S. federal tax returns for 2005 and prior years are no longer subject to examination. The Company’s state tax returns for years prior to 2004 are not subject to examination.
The Company’s foreign subsidiaries file income tax returns in the countries in which they have operations. Generally, these countries have statutes of limitations ranging from 4 to 6 years. Tax years still open to examination by foreign tax authorities in the Company’s larger subsidiaries located in Canada, France, Germany, and the United Kingdom are tax years ending June 2005 through June 2010.
19. DISCONTINUED OPERATIONS
In October 2008, the Company committed to a formal plan to abandon the Rapidscale product line, which was reviewed and approved by management with appropriate authority, and was communicated to the affected employees. The Company continues to honor service contracts with existing Rapidscale customers, but had no other significant continuing involvement in the operations of the Rapidscale product line subsequent to the abandonment.
The results of operations of the Rapidscale product line were reclassified and included in “discontinued operations, net of tax”, within the accompanying consolidated statements of operations for the years ended June 25, 2010, January 3, 2009, and December 29, 2007, and for the six months ended June 26, 2009.
The following summarizes the results of discontinued operations (in thousands):
| Year ended | Six
months ended June 26, 2009 |
|||||||||||||||
| June 25, 2010 |
January 3, 2009 |
December 29, 2007 |
||||||||||||||
| Revenue |
$ | 366 | $ | 730 | $ | 2,471 | $ | 307 | ||||||||
| Cost of revenue |
72 | 133 | 743 | 132 | ||||||||||||
| Gross profit |
294 | 597 | 1,728 | 175 | ||||||||||||
| Operating expenses: |
||||||||||||||||
| Research and development |
(106 | ) | 8,436 | 12,480 | (48 | ) | ||||||||||
| Sales and marketing |
(14 | ) | 60 | 1,784 | — | |||||||||||
| General and administrative |
10 | 251 | 351 | 32 | ||||||||||||
| Impairment of long-lived assets |
— | 17,519 | 21,051 | — | ||||||||||||
| Total operating expenses |
(110 | ) | 26,266 | 35,666 | (16 | ) | ||||||||||
| Income (loss) from discontinued operations |
404 | (25,669 | ) | (33,938 | ) | 191 | ||||||||||
| Total other income (expense) |
5 | (227 | ) | (3 | ) | (211 | ) | |||||||||
| Income (loss) from discontinued operations before income tax benefit |
409 | (25,896 | ) | (33,941 | ) | (20 | ) | |||||||||
| Income tax benefit |
— | (2,955 | ) | (5,964 | ) | — | ||||||||||
| Income (loss) from discontinued operations |
$ | 409 | $ | (22,941 | ) | $ | (27,977 | ) | $ | (20 | ) | |||||
99
Table of Contents
SILICON GRAPHICS INTERNATIONAL CORP.
NOTES TO FINANCIAL STATEMENTS—(Continued)
In the year ended December 29, 2007, the Company recorded an increase to goodwill related to the Terrascale acquisition totaling $1.0 million. In the fourth quarter of 2007, pursuant to the Company’s accounting policy, the Company performed the annual goodwill impairment analysis. The goodwill impairment test is a two-step process. The first step of the impairment analysis compares the Company’s fair value to the Company’s net book value. In determining fair value, the accounting guidance allows for the use of several valuation methodologies, although it states quoted market prices are the best evidence of fair value. Due to the decline of the Company’s market capitalization in December 2007, the fair value was less than the net book value. If this occurs, the second step of the goodwill impairment analysis is conducted. The second step of the analysis compares the implied fair value of our goodwill to its carrying amount. If the carrying amount of goodwill exceeds its implied fair value, the Company recognizes an impairment loss equal to that excess amount. The determination of the fair value of the goodwill is determined by valuing all of the Company’s other tangible and intangible assets and using a residual approach to determine the fair value of goodwill. As a result of this analysis, the Company concluded that the carrying amounts of goodwill exceeded their implied fair values and recorded an impairment loss of approximately $23.9 million. Of the $23.9 million impairment charge recorded in 2007, $21.1 million relates to the Rapidscale product line and has been presented in the consolidated statement of operations as part of discontinued operations.
In the year ended January 3, 2009, the Company performed an impairment analysis of its intangible assets as events and circumstances indicated that their carrying amounts may not be recoverable. As a result of the analysis, the Company recognized and charged to discontinued operations an impairment charge of $17.5 million.
20. SEGMENT INFORMATION
As a result of the acquisition of the Legacy SGI assets, the Company reassessed its segment reporting based on the operating and reporting structure of the combined company. Historically, the Company concluded that it operated in a single operating segment. In connection with the acquisition of Legacy SGI, the Company changed its operating and reporting structure to operate in two operating segments, products and services. The years ended January 3, 2009 and December 29, 2007 have not been presented to reflect the new operating segments as service revenue was immaterial in these periods.
The Company’s operating segments are determined based upon several criteria including: the Company’s internal organizational structure; the manner in which the Company’s operations are managed; the criteria used by the Company’s Chief Executive Officer, the Chief Operating Decision Maker (“CODM”), to evaluate segment performance; and the availability of separate financial information. The Company’s business is organized as two operating segments, products and services. Due to their similar economic characteristics, production processes, and distribution methods, the Company groups the product lines as the product operating segment and service offerings as the service operating segment. The Company’s CODM reviews financial information presented on a consolidated basis, accompanied by disaggregated information about revenue by product and service for purposes of allocating resources and evaluating financial performance. The products and services metrics are derived on a contractual basis.
100
Table of Contents
SILICON GRAPHICS INTERNATIONAL CORP.
NOTES TO FINANCIAL STATEMENTS—(Continued)
Segment Results
The following table presents revenues and gross margin for the Company’s products and services segments for the years ended June 25, 2010, January 3, 2009, and December 29, 2007 and the six months ended June 26, 2009 (dollars in thousands):
| Year ended | Six
months ended June 26, 2009 |
|||||||||||||||
| June 25, 2010 |
January 3, 2009 |
December 29, 2007 |
||||||||||||||
| Revenue |
||||||||||||||||
| Products |
$ | 256,007 | $ | 247,430 | $ | 350,684 | $ | 77,987 | ||||||||
| Services |
147,710 | — | — | 24,790 | ||||||||||||
| Total |
$ | 403,717 | $ | 247,430 | $ | 350,684 | $ | 102,777 | ||||||||
| Cost of revenue |
||||||||||||||||
| Products |
$ | 229,913 | $ | 217,992 | $ | 303,440 | $ | 78,132 | ||||||||
| Services |
84,215 | — | — | 16,868 | ||||||||||||
| Total |
$ | 314,128 | $ | 217,992 | $ | 303,440 | $ | 95,000 | ||||||||
| Gross profit: |
||||||||||||||||
| Products |
$ | 26,094 | $ | 29,438 | $ | 47,244 | $ | (145 | ) | |||||||
| Services |
63,495 | — | — | 7,922 | ||||||||||||
| Total |
$ | 89,589 | $ | 29,438 | $ | 47,244 | $ | 7,777 | ||||||||
| Gross margin: |
||||||||||||||||
| Products |
10.2 | % | 11.9 | % | 13.5 | % | (0.2 | )% | ||||||||
| Services |
43.0 | % | — | — | 32.0 | % | ||||||||||
| Total |
22.2 | % | 11.9 | % | 13.5 | % | 7.6 | % | ||||||||
Revenue and cost of revenue is the only discrete financial information we have available for our segments. For this reason, we are not able to provide other financial results or assets by segment.
Operating segments do not sell products to each other, and accordingly, there is no inter-segment revenue to be reported.
The Company does not assess the performance of its geographic regions on other measures of income or expense, such as depreciation and amortization, operating income or net income. In addition, the Company’s assets are located primarily in the United States and are not allocated to any specific region. The Company does not produce reports for, or measure the performance of, its geographic regions on any asset-based metrics. Therefore, geographic information is presented only for revenues.
Customer information
For the year ended June 25, 2010, Amazon accounted for approximately 20% of our product revenues. For the year ended January 3, 2009, Amazon and Microsoft accounted for approximately 35% and 14% of our product revenues, respectively. For the year ended December 29, 2007, Amazon, Microsoft and Yahoo! accounted for 16%, 36% and 12% of our product revenues, respectively. For the six months ended June 26, 2009, Amazon and Microsoft accounted for 30% and 13% of our product revenues, respectively. No other customers accounted for more than 10% of our revenue for years ended June 25, 2010, January 3, 2009, and December 29, 2008 and the six months ended June 26, 2009
101
Table of Contents
SILICON GRAPHICS INTERNATIONAL CORP.
NOTES TO FINANCIAL STATEMENTS—(Continued)
Geographic Information
Revenue from both domestic and international customers (based on the address of the customer on the invoice) was as follows (in thousands):
| Year ended | Six months ended June 26, 2009 | |||||||||||
| June 25, 2010 |
January 3, 2009 |
December 29, 2007 |
||||||||||
| Domestic revenue |
$ | 301,837 | $ | 227,141 | $ | 330,958 | $ | 76,880 | ||||
| International revenue |
101,880 | 20,289 | 19,726 | 25,897 | ||||||||
| Total revenue |
$ | 403,717 | $ | 247,430 | $ | 350,684 | $ | 102,777 | ||||
No individual foreign country’s revenue was material for disclosure purposes.
Approximately 91% and 88% of the Company’s property and equipment was located in the United States as of June 25, 2010 and June 26, 2009, respectively.
21. RELATED PARTY TRANSACTIONS
The Company owns approximately 10% of the outstanding stock of SGI Japan, which was acquired in the acquisition of Legacy SGI, and the Company’s Chief Executive Officer is a member of SGI Japan’s Board of Directors. The investment in SGI Japan of $5.0 million is accounted for under the cost method and is included in other assets in the accompanying consolidated balance sheets. Product revenues and cost of product revenues from sales to SGI Japan are as follows (in thousands):
| Year ended June 25, 2010 |
Six months ended June 26, 2009 | |||||
| Product revenue |
$ | 18,890 | $ | 145 | ||
| Cost of product revenue |
$ | 13,829 | $ | 95 | ||
Amounts receivable from and due to SGI Japan are as follows (in thousands):
| June 25, 2010 |
June 26, 2009 | |||||
| Amounts receivable from SGI Japan |
$ | 8,845 | $ | 349 | ||
| Amounts due to SGI Japan |
$ | 127 | $ | 109 | ||
There were no transactions with SGI Japan during the years ended January 3, 2009 and December 29, 2007 as the acquisition of Legacy SGI was finalized on May 8, 2009 (Note 3).
22. FINANCIAL GUARANTEES
The Company has issued financial guarantees to cover rent on leased facilities and equipment, to government authorities for VAT and other taxes, and to various other parties to support payments in advance of future delivery on goods and services. The majority of the Company’s financial guarantees have terms of one year or more. The maximum potential obligation under financial guarantees at June 25, 2010 was $4.4 million for
102
Table of Contents
SILICON GRAPHICS INTERNATIONAL CORP.
NOTES TO FINANCIAL STATEMENTS—(Continued)
which the Company has $3.9 million of assets held as collateral. The full amount of the assets held as collateral are included in short-term and long-term restricted cash and cash equivalents in the consolidated balance sheets.
23. COMMITMENTS AND CONTINGENCIES
Leases
The Company leases its facilities and office buildings under operating leases that expire at various dates through March 2017. Certain leases also contain escalation and renewal option clauses calling for increased rents. Where a lease contains an escalation clause or a concession such as a rent holiday, rent expense is recognized using the straight line method over the term of the lease. In addition to the minimum future lease commitments presented below, the leases generally require that the Company pay property taxes, insurance, maintenance and repair costs. Also, under certain leases, the Company is granted an option to early terminate the lease by providing an advance notice and paying an early termination fee. The Company does not intend early termination of the leases and hence the future minimum operating lease commitments disclosed herein consist of the total lease payments through the end of the initial lease terms.
Future minimum lease payments under operating leases are as follows (in thousands):
| Fiscal Year |
|||
| 2011 |
$ | 6,201 | |
| 2012 |
5,093 | ||
| 2013 |
4,168 | ||
| 2014 |
2,222 | ||
| 2015 |
424 | ||
| 2016 and thereafter |
46 | ||
| Total |
$ | 18,154 | |
Rent expense for the years ended June 25, 2010, January 3, 2009, and December 29, 2007, and the six months ended June 26, 2009 was approximately $6.8 million, $2.5 million, $2.2 million, and $2.0 million, respectively.
Purchase Commitments
In connection with supplier agreements, the Company has agreements to purchase certain units of inventory and non-inventory items through 2010. As of June 25, 2010, these remaining non-cancelable commitments were approximately $16.9 million of which $15.0 million will be paid in the next 12 months.
Future purchase commitments are as follows (in thousands):
| Fiscal Year |
|||
| 2011 |
$ | 14,994 | |
| 2012 |
1,871 | ||
| Total |
$ | 16,865 | |
103
Table of Contents
SILICON GRAPHICS INTERNATIONAL CORP.
NOTES TO FINANCIAL STATEMENTS—(Continued)
Indemnification Agreements
The Company enters into standard indemnification agreements with its customers and certain other business partners in the ordinary course of business. These agreements include provisions for indemnifying the customer against any claim brought by a third party to the extent any such claim alleges that the Company’s product infringes a patent, copyright or trademark, or misappropriates a trade secret, of that third-party. The agreements generally limit the scope of the available remedies in a variety of industry-standard methods, including, but not limited to, product usage and geography-based limitations, a right to control the defense or settlement of any claim, and a right to replace or modify the infringing products to make them non-infringing. The Company has not incurred significant expenses related to these indemnification agreements and no material claims for such indemnifications were outstanding as of June 25, 2010. As a result, the Company believes the estimated fair value of these indemnification agreements, if any, to be immaterial; accordingly, no liability has been recorded with respect to such indemnifications as of June 25, 2010.
Contingencies
The Company may, from time to time, be involved in lawsuits, claims, investigations and proceedings that arise in the ordinary course of business. The Company records a provision for a liability when management believes that it is both probable that a liability has been incurred and it can reasonably estimate the amount of the loss. The Company believes it has adequate provisions for any such matters. The Company reviews these provisions at least quarterly and adjusts these provisions to reflect the impact of negotiations, settlements, rulings, advice of legal counsel and other information and events pertaining to a particular case.
On August 10, 2005, the Legacy SGI German subsidiary, Silicon Graphics GmbH, filed a lawsuit with the LG Munich, a Higher Regional Court in Germany, against T-Systems International GmbH (“TSI”), a systems integrator, relating to a dispute regarding whether acceptance criteria were met with regard to a Legacy SGI system delivered in the spring of 2003. The Company is seeking full payment for the system of €4.6 million ($5.6 million based on the conversion rate on June 25, 2010). On September 21, 2005, TSI filed a counterclaim contesting Legacy SGI’s claim and alleging damages of €9.0 million ($11.0 million based on the conversion rate on June 25, 2010), plus interest since April 2004, which exceeds the Company’s contractual limit of liability of €2.0 million ($2.5 million based on the conversion rate on June 25, 2010). On December 7, 2005, Legacy SGI responded to TSI’s counterclaim and filed a motion seeking an additional €3.8 million ($4.7 million based on the conversion rate on June 25, 2010) for lost profit relating to maintenance services. On August 9, 2005, the Legacy SGI German subsidiary, Silicon Graphics GmbH, filed a lawsuit with the District Court of Munich I (Landericht München I), a Regional Court in Germany, against Media Broadcast GmbH (formerly T-Systems International GmbH), a systems integrator, relating to a dispute regarding whether acceptance criteria were met with regard to a Legacy SGI system delivered in the spring of 2003. On April 16, 2010, the Company settled its dispute with Media Broadcast GmbH. Under the settlement agreement, Media Broadcast GmbH paid the Company €1.9 million (approximately $2.3 million) plus value-added tax on May 7, 2010. The Company recorded a benefit from this transaction in the year ending June 25, 2010 as acquisition-related gain on the Company’s consolidated statements of operations.
In fiscal 2005, as a result of anonymous allegations and allegations by an ex-employee, Legacy SGI conducted an internal investigation into whether certain systems were delivered to an entity in China in possible violation of U.S. export laws. Legacy SGI voluntarily shared information with respect to the investigation with the U.S. Department of Commerce. The Company cannot be assured that the Department or other agencies of the U.S. government will not institute any proceedings against it in the future. In addition, from time to time, the Company receives inquiries from regulatory agencies informally requesting information or documentation. There can be no assurance in any given case that such informal review will not lead to further proceedings involving the Company in the future.
104
Table of Contents
SILICON GRAPHICS INTERNATIONAL CORP.
NOTES TO FINANCIAL STATEMENTS—(Continued)
On May 1, 2007, Legacy SGI received a legal notice from counsel to Bharat Heavy Electricals Ltd. (“BHEL”), located in India, alleging delay in and failure to deliver products and technical problems with its hardware and software in relation to the establishment of a facility in Hyderabad. The Company assumed this claim in connection with its acquisition of Legacy SGI assets, and is currently engaged in arbitration. On January 21, 2008, BHEL filed its statement of claim against Silicon Graphics Systems (India) Pvt. Ltd. for a sum of Indian Rupee (“INR”) 78,478,200 ($1.7 million based on the conversion rate on June 25, 2010) plus interest and costs. On February 29, 2008, the Company filed its reply as well as a counter claim for a sum of INR 27,453,007 ($0.6 million based on the conversion rate on June 25, 2010) plus interest and costs. The proceeding has commenced but the hearing, scheduled for June 2010 could not take place and the next rescheduled hearing date is awaited from the Arbitor. The Company cannot currently predict the outcome of this dispute nor determine the amount or a reasonable range of potential loss, if any.
On January 16, 2009, the Company and certain of its former officers were sued in the United States District Court for the Northern District of California, in a matter captioned In Re Rackable Systems, Inc. Securities Litigation, Case No. C-09-0222-CW. On April 16, 2009, the Court appointed Elroy Whittaker as Lead Plaintiff and the Law Firm of Glancy Binkow & Goldberg LLP as Lead Plaintiff’s Counsel. Lead Plaintiff filed a consolidated amended complaint (the “Amended Complaint”) on June 15, 2009. The Amended Complaint asserts claims for violations of (i) Section 10(b) of the Exchange Act and Rule 10b-5 promulgated thereunder, and (ii) Section 20(a) of the Exchange Act. The allegations relate to the drops in the Company’s share price in early 2007 relating to its earnings reports for 2006 and Q4 2006. On August 13, 2009, the Company and its former officers filed a Motion to Dismiss the Amended Complaint (the “Motion to Dismiss”), which Lead Plaintiff opposed. On January 13, 2010, the Court entered an order granting the Motion to Dismiss, which dismissed the Amended Complaint with leave to amend. On February 3, 2010, Lead Plaintiff filed a second amended complaint asserting the same claims as the amended complaint. On April 2, 2010, Lead Plaintiff filed a stipulated proposed order requesting leave to file a supplemental second amended complaint, which substituted new Lead Plaintiffs into the action but otherwise did not change the allegations of the second amended complaint. On April 5, 2010, the Court granted the stipulated order and entered the supplemental second amended complaint. On April 9, 2010, the Company and its former officers filed a Motion to Dismiss the Supplemental Second Amended Complaint. The Court granted the Motion to Dismiss with prejudice on August 27, 2010, and judgment was entered pursuant to the Court’s order on August 31, 2010. Plaintiffs have the right to appeal the order dismissing the action with prejudice until 30 days after the entry of judgment. The Company cannot currently predict the outcome of this dispute nor determine the amount or a reasonable range of potential loss, if any.
On March 10, 2009, the Company and certain of its present and former directors and officers were sued in the Superior Court of the State of California for Alameda County, in a shareholder derivative lawsuit captioned Milo v. Barton, et al, Case No. R30944-0474. The complaint alleges that the defendants engaged in various acts and omissions that resulted in the drops of our share price in early 2007, and asserts claims for alleged breaches of defendants’ fiduciary duties, waste of corporate assets, and unjust enrichment. The complaint seeks compensatory damages in an unspecified amount, unspecified equitable or injunctive relief, disgorgement of unspecified compensation earned by the defendants, and an award of an unspecified amount for plaintiff’s costs and attorneys fees. By stipulated order dated April 13, 2009, this action was stayed pending resolution of the pleadings in the federal class action. Because the federal class action was dismissed with prejudice, Plaintiff now has 60 days from the date of the dismissal to file an amended complaint or notify defendants that Plaintiff will not file an amended complaint. Defendants will then be required to move to dismiss or otherwise respond to the complaint or amended complaint, as applicable, within 40 days after an amended complaint is filed or notice is given that Plaintiff will not amend. The Company cannot currently predict the outcome of this dispute nor determine the amount or a reasonable range of potential loss, if any.
105
Table of Contents
SILICON GRAPHICS INTERNATIONAL CORP.
NOTES TO FINANCIAL STATEMENTS—(Continued)
On December 3, 2009, the Company initiated an arbitration proceeding captioned Silicon Graphics Intl. Corp., f/k/a Rackable Systems, Inc. v. Thomas Weisel Partners Group, Inc., et al., FINRA Arb. No. 09-06849, against its former investment advisor Thomas Weisel Partners LLC (“TWP”), as well as TWP’s parent company Thomas Wiesel Partners Group, Inc., to remedy TWP’s alleged mismanagement and wrongful advice pertaining to the Company’s investments in allegedly unsuitable and illiquid investments called “auction rate securities” (“ARS”). Due to market conditions, the ARS at issue are still held by the Company, as described elsewhere herein. The Company filed its arbitration claim with the Financial Industry Regulatory Authority (“FINRA”), and asserts various causes of action including breach of fiduciary duty, unsuitability, and breach of contract. The Company is seeking remedies including rescission; restitution; disgorgement; and compensatory, consequential, and punitive damages, and requests a damages award in excess of $9.0 million, exclusive of punitive damages and other potential relief. TWP filed its Answer on February 4, 2010. The parties have commenced discovery and the arbitration is currently scheduled to commence in February 2011. The Company cannot currently predict the outcome of this dispute nor determine the amount or a reasonable range of potential loss, if any.
Third parties in the past have asserted, and may in the future assert, intellectual property infringement claims against the Company, and such future claims, if proved, could require the Company to pay substantial damages or to redesign its existing products or pay fees to obtain cross-license agreements. Litigation may be necessary in the future to enforce or defend the Company’s intellectual property rights, to protect the Company’s trade secrets or to determine the validity and scope of its proprietary rights or the proprietary rights of others. Any such litigation could result in substantial costs and diversion of management resources, either of which could harm the Company’s business, operating results and financial condition. Further, many of the Company’s current and potential competitors have the ability to dedicate substantially greater resources to enforcing and defending their intellectual property rights than the Company.
The Company is not aware of any pending disputes, including those disputes and settlements described above, that would be likely to have a material adverse effect on its consolidated financial condition, results of operations or liquidity. However, litigation is subject to inherent uncertainties and costs and unfavorable outcomes could occur. An unfavorable outcome could include the payment of monetary damages, cash or other settlement, or an injunction prohibiting it from selling one or more products. If an unfavorable resolution were to occur, there exists the possibility of a material adverse impact on the Company’s consolidated financial condition, results of operations or cash flows of the period in which the resolution occurs or on future periods.
Other
During the six months ended June 26, 2009, the Company reached a settlement with a customer over a dispute on the terms of a statement of work under which this customer agreed to pay the Company $5.0 million.
106
Table of Contents
SILICON GRAPHICS INTERNATIONAL CORP.
NOTES TO FINANCIAL STATEMENTS—(Continued)
24. TRANSITION PERIOD FINANCIAL INFORMATION
The following table presents certain Consolidated Statement of Operations data for the six months ended June 26, 2009 and for the six months ended June 28, 2008 (unaudited) (in thousands except per share data):
| For the six months ended | ||||||||
| June 26, 2009 |
June
28, 2008 (unaudited) |
|||||||
| Revenue |
$ | 102,777 | $ | 143,569 | ||||
| Gross profit |
7,777 | 24,410 | ||||||
| Loss from operations |
(17,710 | ) | (9,500 | ) | ||||
| Loss from continuing operations before income taxes |
(16,433 | ) | (6,624 | ) | ||||
| Income tax provision (benefit) from continuing operations |
(2,242 | ) | 1,526 | |||||
| Net loss from continuing operations |
(14,191 | ) | (8,150 | ) | ||||
| Loss from discontinued operations |
(20 | ) | (23,487 | ) | ||||
| Income tax benefit |
— | (2,941 | ) | |||||
| Loss from discontinued operations, net of tax |
(20 | ) | (20,546 | ) | ||||
| Net loss |
$ | (14,211 | ) | $ | (28,696 | ) | ||
| Net loss per share, basic and diluted: |
||||||||
| Continuing operations |
$ | (0.48 | ) | $ | (0.28 | ) | ||
| Discontinued operations |
— | (0.70 | ) | |||||
| Basic and diluted net loss per share |
$ | (0.48 | ) | $ | (0.98 | ) | ||
| Shares used in computing basic and diluted net loss per share |
29,798 | 29,429 | ||||||
25. SUBSEQUENT EVENT
On August 31, 2010, the Company’s Board of Directors authorized the Company to resume its stock repurchase program previously authorized by the Board of Directors in February 2009. Under the program, the Company is authorized to repurchase up to $40.0 million of its common stock and the duration of the program is open ended. The program may be discontinued at any time by the Board of Directors. As of August 31, 2010, we have $39.0 million in remaining authorization for the stock repurchase program.
107
Table of Contents
SILICON GRAPHICS INTERNATIONAL CORP.
NOTES TO FINANCIAL STATEMENTS—(Continued)
26. SELECTED QUARTERLY FINANCIAL INFORMATION (UNAUDITED)
On June 19, 2009, the Company’s Board of Directors approved a change in the Company’s fiscal year end from the Saturday closest to December 31st of each year to the last Friday in June of each year. Accordingly, the financial periods presented are defined as follows: (i) the year ended June 25, 2010; (ii) the six months ended June 26, 2009; and (iii) the year ended January 3, 2009 (in thousands, except per share amounts).
| Fiscal Quarter Ended | ||||||||||||||||
| June 25, 2010 (1) |
March 26, 2010 (1) |
December 25, 2009 (1) |
September 25, 2009 (1) |
|||||||||||||
| Revenue |
$ | 101,637 | $ | 107,820 | $ | 94,137 | $ | 100,123 | ||||||||
| Gross profit |
19,615 | 28,920 | 18,686 | 22,368 | ||||||||||||
| Net loss from continuing operations |
(27,670 | ) | (20,262 | ) | (23,127 | ) | (17,802 | ) | ||||||||
| Income from discontinued operations, net of tax |
63 | 82 | 84 | 180 | ||||||||||||
| Net loss |
$ | (27,607 | ) | $ | (20,180 | ) | $ | (23,043 | ) | $ | (17,622 | ) | ||||
| Basic and diluted net income (loss) per share: |
||||||||||||||||
| Continued operations |
$ | (0.91 | ) | $ | (0.67 | ) | $ | (0.77 | ) | $ | (0.60 | ) | ||||
| Discontinued operations |
— | — | — | 0.01 | ||||||||||||
| Net loss per share—basic and diluted |
$ | (0.91 | ) | $ | (0.67 | ) | $ | (0.77 | ) | $ | (0.59 | ) | ||||
| Shares used in the calculation of net loss per share: |
||||||||||||||||
| Basic and diluted |
30,121 | 30,097 | 29,952 | 29,893 | ||||||||||||
| Fiscal Quarter Ended | ||||||||
| June 26, 2009 (1) |
April 4, 2009 |
|||||||
| Revenue |
$ | 58,419 | $ | 44,358 | ||||
| Gross profit |
5,078 | 2,699 | ||||||
| Net loss from continuing operations |
(597 | ) | (13,594 | ) | ||||
| Income (loss) from discontinued operations, net of tax |
(217 | ) | 197 | |||||
| Net loss |
$ | (814 | ) | $ | (13,397 | ) | ||
| Basic and diluted net income (loss) per share: |
||||||||
| Continued operations |
$ | (0.02 | ) | $ | (0.46 | ) | ||
| Discontinued operations |
(0.01 | ) | 0.01 | |||||
| Net loss per share—basic and diluted |
$ | (0.03 | ) | $ | (0.45 | ) | ||
| Shares used in the calculation of net loss per share: |
||||||||
| Basic and diluted |
29,794 | 29,787 | ||||||
108
Table of Contents
SILICON GRAPHICS INTERNATIONAL CORP.
NOTES TO FINANCIAL STATEMENTS—(Continued)
| Fiscal Quarter Ended | ||||||||||||||||
| January 3, 2009 |
September 27, 2008 |
June 28, 2008 |
March 29, 2008 |
|||||||||||||
| Revenue |
$ | 38,764 | $ | 65,097 | $ | 75,768 | $ | 67,801 | ||||||||
| Gross profit (loss) |
(6,010 | ) | 11,038 | 6,829 | 17,581 | |||||||||||
| Net loss from continuing operations |
(18,172 | ) | (4,965 | ) | (10,759 | ) | 2,609 | |||||||||
| Loss from discontinued operations, net of tax |
(1,371 | ) | (1,024 | ) | (17,171 | ) | (3,375 | ) | ||||||||
| Net loss |
$ | (19,543 | ) | $ | (5,989 | ) | $ | (27,930 | ) | $ | (766 | ) | ||||
| Basic and diluted net income (loss) per share: |
||||||||||||||||
| Continued operations |
$ | (0.61 | ) | $ | (0.17 | ) | $ | (0.37 | ) | $ | 0.09 | |||||
| Discontinued operations |
(0.05 | ) | (0.03 | ) | (0.58 | ) | (0.12 | ) | ||||||||
| Net loss per share—basic and diluted |
$ | (0.66 | ) | $ | (0.20 | ) | $ | (0.95 | ) | $ | (0.03 | ) | ||||
| Shares used in the calculation of net loss per share: |
||||||||||||||||
| Basic |
29,790 | 29,502 | 29,419 | 29,352 | ||||||||||||
| Diluted |
29,790 | 29,502 | 29,419 | 29,453 | ||||||||||||
| (1) | On May 8, 2009, the Company completed the acquisition of substantially all of the assets of Legacy SGI, excluding certain assets unrelated to the ongoing business, including certain of Legacy SGI’s non-U.S. subsidiaries and operations and assumed certain liabilities. |
109
Table of Contents
SILICON GRAPHICS INTERNATIONAL CORP.
VALUATION AND QUALIFYING ACCOUNTS
(In thousands)
| Year ended | Six months ended June 26, 2009 | ||||||||||||||
| June 25, 2010 |
January 3, 2009 |
December 29, 2007 |
|||||||||||||
| Allowance for doubtful accounts: |
|||||||||||||||
| Beginning Balance |
$ | 859 | $ | 434 | $ | 328 | $ | 470 | |||||||
| Charges |
844 | 66 | 299 | 389 | |||||||||||
| Reduction and Write-offs |
(57 | ) | (30 | ) | (193 | ) | — | ||||||||
| Ending Balance |
$ | 1,646 | $ | 470 | $ | 434 | $ | 859 | |||||||
110
Table of Contents
Item 9. Changes in and Disagreements with Accountants on Accounting and Financial Disclosure
None.
Item 9A. Controls and Procedures
Disclosure Controls and Procedures
As required by Exchange Act Rule 13a-15(b), as of the close of the year ended June 25, 2010, we carried out an evaluation, under the supervision and with the participation of our management, including our Chief Executive Officer and our Chief Financial Officer, of the effectiveness of the design and operation of our disclosure controls and procedures as defined in Rule 13a-15(e). Disclosure controls and procedures are controls and procedures designed to ensure that the information required to be disclosed by us in reports that we file or submit under the Securities Exchange Act of 1934 is recorded, processed, summarized and reported within the time periods specified in Securities and Exchange Commission rules and forms, including, without limitation, controls and procedures designed to ensure that information required to be disclosed by us in the reports that we file or submit under the Securities Exchange Act of 1934 is accumulated and communicated to our management, including our principal executive and principal financial officers, or persons performing similar functions, as appropriate to allow timely decisions regarding required disclosure. As discussed in more detail below, our Chief Executive Officer and our Chief Financial Officer concluded that our disclosure controls and procedures are effective as of June 25, 2010.
Management’s Report on Internal Control Over Financial Reporting
Management is responsible for establishing and maintaining adequate internal control over financial reporting, as such term is defined in Exchange Act Rules 13a-15(f) and 15d-15(f). The Company’s internal control over financial reporting is a process designed to provide reasonable assurance regarding the reliability of financial reporting and the preparation of financial statements for external purposes in accordance with generally accepted accounting principles. Because of its inherent limitations, internal control over financial reporting may not prevent or detect misstatements. Also, projections of any evaluation of effectiveness to future periods are subject to the risks that controls may become inadequate because of changes in conditions, or that the degree of compliance with the policies or procedures may deteriorate.
Under the supervision and with the participation of our management, including our principal executive officer and principal financial officer, we conducted an evaluation of our internal control over financial reporting based on the criteria established in Internal Control—Integrated Framework issued by the Committee of Sponsoring Organizations of the Treadway Commission. In performing the assessment, our management has concluded that the Company’s internal control over financial reporting was effective as of June 25, 2010.
The Company’s financial statements included in this Annual Report on Form 10-K have been audited by Deloitte & Touche LLP, independent registered public accounting firm, as indicated in their report on page 65. Deloitte & Touche LLP has also provided an attestation report on the Company’s internal control over financial reporting.
Changes in Internal Control over Financial Reporting
There have been changes in our internal control over financial reporting in the fourth quarter of fiscal 2010 that have materially affected, or are reasonably likely to materially affect, our internal control over financial reporting.
111
Table of Contents
Remediation of Material Weaknesses in Inventory Valuation
During the year ended June 25, 2010, our management completed the corrective actions to remediate the material weakness in inventory valuation discussed in our Annual Report on Form 10-K for the year ended January 3, 2009. During the fourth quarter of fiscal 2010, our management’s testing of controls over inventory valuation indicated that the corrective actions put in place to remediate this material weakness have been implemented and are operating effectively. Therefore, we believe the previously reported material weakness related inventory valuation has been remediated as of June 25, 2010. In fiscal 2010, we completed the following remedial actions:
| • | We automated the key components of our calculation for the provision for excess and obsolete inventory and purchase price variances; |
| • | We improved our review processes for various calculations relating to inventory valuation; and |
| • | We improved the quality and timing of our accounting close process and financial reporting to allow for increased preparation and review time. |
112
Table of Contents
REPORT OF INDEPENDENT REGISTERED PUBLIC ACCOUNTING FIRM
To the Board of Directors and Stockholders of
Silicon Graphics International Corp.
Fremont, California
We have audited the internal control over financial reporting of Silicon Graphics International Corp. and subsidiaries (the “Company”) as of June 25, 2010, based on criteria established in Internal Control—Integrated Framework issued by the Committee of Sponsoring Organizations of the Treadway Commission. The Company’s management is responsible for maintaining effective internal control over financial reporting and for its assessment of the effectiveness of internal control over financial reporting, included in the accompanying Management’s Report on Internal Control Over Financial Reporting. Our responsibility is to express an opinion on the Company’s internal control over financial reporting based on our audit.
We conducted our audit in accordance with the standards of the Public Company Accounting Oversight Board (United States). Those standards require that we plan and perform the audit to obtain reasonable assurance about whether effective internal control over financial reporting was maintained in all material respects. Our audit included obtaining an understanding of internal control over financial reporting, assessing the risk that a material weakness exists, testing and evaluating the design and operating effectiveness of internal control based on the assessed risk, and performing such other procedures as we considered necessary in the circumstances. We believe that our audit provides a reasonable basis for our opinion.
A company’s internal control over financial reporting is a process designed by, or under the supervision of, the company’s principal executive and principal financial officers, or persons performing similar functions, and effected by the company’s board of directors, management, and other personnel to provide reasonable assurance regarding the reliability of financial reporting and the preparation of financial statements for external purposes in accordance with generally accepted accounting principles. A company’s internal control over financial reporting includes those policies and procedures that (1) pertain to the maintenance of records that, in reasonable detail, accurately and fairly reflect the transactions and dispositions of the assets of the company; (2) provide reasonable assurance that transactions are recorded as necessary to permit preparation of financial statements in accordance with generally accepted accounting principles, and that receipts and expenditures of the company are being made only in accordance with authorizations of management and directors of the company; and (3) provide reasonable assurance regarding prevention or timely detection of unauthorized acquisition, use, or disposition of the company’s assets that could have a material effect on the financial statements.
Because of the inherent limitations of internal control over financial reporting, including the possibility of collusion or improper management override of controls, material misstatements due to error or fraud may not be prevented or detected on a timely basis. Also, projections of any evaluation of the effectiveness of the internal control over financial reporting to future periods are subject to the risk that the controls may become inadequate because of changes in conditions, or that the degree of compliance with the policies or procedures may deteriorate.
In our opinion, the Company maintained, in all material respects, effective internal control over financial reporting as of June 25, 2010, based on the criteria established in Internal Control—Integrated Framework issued by the Committee of Sponsoring Organizations of the Treadway Commission.
We have also audited, in accordance with the standards of the Public Company Accounting Oversight Board (United States), the consolidated financial statements and consolidated financial statement schedule as of and for the year ended June 25, 2010 of the Company and our report dated September 8, 2010 expressed an unqualified opinion on those consolidated financial statements and consolidated financial statement schedule.
/s/ DELOITTE & TOUCHE LLP
San Jose, California
September 8, 2010
113
Table of Contents
On July 27, 2010 the Compensation Committee of our Board of Directors approved a short term incentive plan (the “2011 Plan”) for our 2011 fiscal year, to succeed the 2010 corporate bonus plan previously disclosed in a Current Report on Form 8-K filed by the Company on August 10, 2009.
The 2011 Plan is an integral part of compensation for our employees that are at the level of director or above, which includes our executive officers. The 2011 Plan provides that quarterly bonuses are payable, subject to the Compensation Committee’s discretion, based upon (1) achievement of certain non-GAAP revenue and non-GAAP gross margin performance targets established by the Compensation Committee, and (2) target bonus amounts for each eligible individual established by the Compensation Committee. The Compensation Committee established annual target bonus amounts, to be determined and paid on a quarterly basis, for the 2011 Plan, which include bonus amounts payable to the Company’s named executive officers (as defined in Item 402(a)(3) of Regulation S-K promulgated by the Securities and Exchange Commission). The Committee established $450,000 as the annual target bonus amount for Mark Barrenechea, our Chief Executive Officer; $175,000 for James Wheat, our Chief Financial Officer; and $124,000 for Maurice Leibenstern, our Senior Vice President, General Counsel and Corporate Secretary.
Quarterly bonus amounts under the 2011 Plan will be subject to the Compensation Committee’s discretion, and will depend on the specific levels of actual non-GAAP revenue and non-GAAP gross margin attained. Such quarterly bonuses would be “earned” and payable within a range of respective percentages that includes a threshold requirement of 50% and a maximum payout cap of 150%. Failure to meet the threshold requirement would result in no quarterly bonus amount being paid.
Further, at the end of fiscal year 2011, the Compensation Committee will compare the aggregate percentage of all quarterly bonus amounts paid during the fiscal year, with the actual non-GAAP revenue and non-GAAP gross margin attained for the entire 2011 fiscal year, and determine whether a “true-up” payment is necessary to prevent the actual quarterly payouts from negatively impacting the annual payout had the plan been measured for the full year.
114
Table of Contents
Item 10. Directors, Executive Officers and Corporate Governance
The information required by this Item is incorporated herein by reference from the sections tentatively entitled “Proposal 1—Election of Directors,” “Section 16(a) Beneficial Ownership Reporting Compliance” and “Code of Conduct and Ethics” and “Information Regarding the Board of Directors and Corporate Governance” contained in our proxy statement for our 2010 Annual Meeting of Stockholders (the “Proxy Statement”) provided however, that the information required by this Item with respect to our executive officers is contained in Item 1 of Part I of this Annual Report under the heading “Executive Officers.”
Item 11. Executive Compensation
The information required by this Item is incorporated herein by reference from the sections tentatively entitled “Compensation Committee” in “Proposal 1—Election of Directors,” and “Executive Compensation and Related Information,” of in the Proxy Statement.
Item 12. Security Ownership of Certain Beneficial Owners and Management and Related Stockholder Matters
The information required by this Item is incorporated herein by reference from the section tentatively entitled “Security Ownership of Certain Beneficial Owners and Management” and “Equity Compensation Plan Information” of the Proxy Statement.
Item 13. Certain Relationships and Related Transactions, and Director Independence
The information required by this Item is incorporated herein by reference from the section tentatively entitled “Certain Relationships and Related Transactions” and “Proposal 1—Election of Directors” in the Proxy Statement.
Item 14. Principal Accounting Fees and Services
The information required by this Item is incorporated herein by reference from the section tentatively entitled “Principal Accountant Fees and Services” in the Proxy Statement.
115
Table of Contents
Item 15. Exhibits and Financial Statement Schedules
(a) 1. Financial Statements
See Index to Consolidated Financial Statements in Item 8 of this Annual Report on Form 10-K, which is incorporated herein by reference.
2. Financial Statement Schedules
All other financial statement schedules have been omitted because they are either not applicable or the required information is shown in the consolidated financial statements or notes thereto.
3. Exhibits
See the Exhibit Index which follows the signature page of this Annual Report on Form 10-K, which is incorporated herein by reference.
116
Table of Contents
Pursuant to the requirements of Section 13 or 15(d) of the Securities Exchange Act of 1934, the registrant has duly caused this report to be signed on its behalf by the undersigned, thereunto duly authorized.
| SILICON GRAPHICS INTERNATIONAL CORP. | ||
| By: | /s/ JAMES D. WHEAT | |
| James D. Wheat Chief Financial Officer | ||
Dated: September 8, 2010
POWER OF ATTORNEY
KNOW ALL PERSONS BY THESE PRESENT, that each person whose signature appears below constitutes and appoints Mark J. Barrenechea, James D. Wheat and Maurice Leibenstern, and each of them, acting individually, as his or her attorney-in-fact, each with full power of substitution and resubstitution, for him or her and in his or her name, place and stead, in any and all capacities, to sign any and all amendments to this Annual Report on Form 10-K, and to file the same, with all exhibits thereto, and other documents in connection therewith, with the Securities and Exchange Commission, granting unto said attorneys-in-fact and agents, and each of them, full power and authority to do and perform each and every act and thing requisite and necessary to be done in connection therewith and about the premises, as fully to all intents and purposes as he or she might or could do in person, hereby ratifying and confirming all that said attorneys-in-fact and agents, or any of them, or their or his substitute or substitutes, may lawfully do or cause to be done by virtue hereof.
Pursuant to the requirements of the Securities Exchange Act of 1934, this report has been signed below by the following persons on behalf of the registrant and in the capacities and on the dates indicated.
| Signature |
Title |
Date | ||
| /s/ MARK J. BARRENECHEA Mark J. Barrenechea |
Chief Executive Officer and Director (Principal Executive Officer) |
September 8, 2010 | ||
| /s/ JAMES D WHEAT James D. Wheat |
Chief Financial Officer (Principal Financial Officer) |
September 8, 2010 | ||
| /s/ TIMOTHY L. PEBWORTH Timothy L. Pebworth |
Vice President and Principal Accounting Officer (Principal Accounting Officer) |
September 8, 2010 | ||
| /s/ CHARLES M. BOESENBERG Charles M. Boesenberg |
Director | September 8, 2010 | ||
| /s/ GARY A. GRIFFITHS Gary A. Griffiths |
Director | September 8, 2010 | ||
| /s/ MICHAEL W. HAGEE Michael W. Hagee |
Director | September 8, 2010 | ||
| /s/ DOUGLAS R. KING Douglas R. King |
Director | September 8, 2010 | ||
| /s/ HAGI SCHWARTZ Hagi Schwartz |
Director | September 8, 2010 | ||
| /s/ RONALD D. VERDOORN Ronald D. Verdoorn |
Director | September 8, 2010 | ||
117
Table of Contents
EXHIBIT INDEX
| Exhibit |
Exhibit Description |
Incorporated by Reference | Filing Date | Filed Herewith | |||||||||
| Form | Ex. No. | File No. | |||||||||||
| 2.1 | Asset Acquisition Agreement, dated December 23, 2002, by and between GNJ, Inc. (f.k.a. Rackable Systems, Inc.) and Registrant | S-1 | 2.1 | 333-122576 | 2/4/2005 | ||||||||
| 2.2 | Share Purchase Agreement dated as of August 29, 2006, by and among Rackable Systems, Inc., Rackable Systems Canada Acquisition ULC, Terrascale Technologies Inc. and the other parties identified on Schedule A thereto | 8-K | 2.1 | 000-51333 | 8/30/2006 | ||||||||
| 2.3 | Asset Purchase Agreement dated as of March 31, 2009, by and among Silicon Graphics, Inc., the subsidiaries of Silicon Graphics, Inc. listed on Schedule I thereto, and Rackable Systems, Inc. | 8-K | 2.1 | 000-51333 | 4/1/2009 | ||||||||
| 2.4 | Amendment to Asset Purchase Agreement dated as of March 31, 2009, by and among Silicon Graphics, Inc., the subsidiaries of Silicon Graphics, Inc. listed on Schedule I thereto, and Rackable Systems, Inc., dated as of April 30, 2009. | 8-K | 2.1 | 000-51333 | 5/5/2009 | ||||||||
| 2.5 | Secured Creditor Asset Purchase Agreement dated as of February 23, 2010, by and between Silicon Valley Bank and Silicon Graphics International Corp. | 8-K | 2.5 | 000-51333 | 3/1/2010 | ||||||||
| 3.1 | Amended and Restated Certificate of Incorporation | 10-Q | 3.1 | 000-51333 | 8/12/2005 | ||||||||
| 3.2 | Amended and Restated Bylaws | 8-K | 3.2 | 000-51333 | 3/7/2008 | ||||||||
| 3.3 | Certificate of Ownership and Merger | 8-K | 3.3 | 000-51333 | 5/21/2009 | ||||||||
| 4.1 | Reference is made to Exhibits 3.1, 3.2 and 3.3 | ||||||||||||
| 4.2 | Form of Specimen Stock Certificate | 8-K | 4.2 | 000-51333 | 5/21/2009 | ||||||||
| 10.1 | Amendment to Registration Agreement and Founder Repurchase and Rights Agreement, dated November 16, 2005, by and among Registrant, Rackable Investment LLC, Parthenon Investors II, L.P. and the founders named therein. | S-1A/1 | 10.7 | 333-129573 | 11/17/2005 | ||||||||
| 10.2 | * | Form of Indemnity Agreement entered into by Registrant with each of its directors and certain executive officers. | S-1 | 10.7 | 333-122576 | 2/4/2005 | |||||||
| 10.3 | * | 2002 Stock Option Plan and form of related agreements. | S-1 | 10.8 | 333-122576 | 3/30/2005 | |||||||
118
Table of Contents
| Exhibit |
Exhibit Description |
Incorporated by Reference | Filing Date | Filed Herewith | |||||||||
| Form | Ex. No. | File No. | |||||||||||
| 10.4* | 2005 Equity Incentive Plan. | S-1 | 10.9 | 333-122576 | 2/4/2005 | ||||||||
| 10.5* | 2005 Non-Employee Directors’ Stock Option Plan. | S-1 | 10.10 | 333-122576 | 2/4/2005 | ||||||||
| 10.6* | 2005 Employee Stock Purchase Plan. | S-1 | 10.11 | 333-122576 | 2/4/2005 | ||||||||
| 10.7 | Lease Agreement, dated as of November 27, 2001, by and between the Registrant and EOP-Industrial Portfolio, L.L.C. | S-1 | 10.12 | 333-122576 | 2/4/2005 | ||||||||
| 10.8 | First Amendment to Lease Agreement, dated as of April 22, 2004, by and between the Registrant and EOP-Industrial Portfolio, L.L.C. | S-1 | 10.13 | 333-122576 | 2/4/2005 | ||||||||
| 10.9 | Second Amendment to Lease Agreement dated October 26, 2005, by and between Registrant and RREEF America Reit II Corp. (as successor in interest to EOP-Industrial Portfolio, L.L.C.). | S-1 | 10.16 | 333-129573 | 11/9/2005 | ||||||||
| 10.10 | * | Employment Agreement, dated as of December 23, 2002, by and between the Registrant and Giovanni Coglitore. | S-1 | 10.17 | 333-122576 | 2/4/2005 | |||||||
| 10.11 | * | First Amendment to the Employment Agreement, dated November 16, 2005, by and between Registrant and Giovanni Coglitore. | S-1A/1 | 10.27 | 333-129573 | 11/9/2005 | |||||||
| 10.12 | * | Executive Compensation Summary. | 10-K | 10.18 | 000-51333 | 3/19/2009 | |||||||
| 10.13 | Director Compensation Arrangements. | 10-K | 10.31 | 000-51333 | 2/28/2007 | ||||||||
| 10.14 | Promissory Note dated December 31, 2004, issued by the Registrant to Giovanni Coglitore. | S-1 | 10.29 | 333-122576 | 2/4/2005 | ||||||||
| 10.15 | Stock Repurchase Agreement, dated February 2, 2005, between the Registrant and Giovanni Coglitore. | S-1 | 10.32 | 333-122576 | 2/4/2005 | ||||||||
| 10.16 | * | Offer letter, dated August 18, 2004, from the Registrant to Hagi Schwartz. | S-1 | 10.35 | 333-122576 | 2/4/2005 | |||||||
| 10.17 | * | Offer letter, dated November 4, 2004, from the Registrant to Gary Griffiths. | S-1 | 10.37 | 333-122576 | 2/4/2005 | |||||||
| 10.18 | * | Offer letter dated March 18, 2005, from the Registrant to Ronald D. Verdoorn. | S-1A/2 | 10.42 | 333-122576 | 5/2/2005 | |||||||
| 10.19 | Stockholders’ Voting Agreement by and among the Registrant, Rackable Investment LLC, GNJ, Inc., and the founders named therein dated December 23, 2002. | S-1 | 10.40 | 333-122576 | 2/4/2005 | ||||||||
| 10.20 | * | Form of Stock Option Agreement under the 2006 New Recruit Equity Incentive Plan. | 8-K | 10.2 | 000-51333 | 1/30/2006 | |||||||
119
Table of Contents
| Exhibit |
Exhibit Description |
Incorporated by Reference | Filing Date | Filed Herewith | |||||||||
| Form | Ex. No. | File No. | |||||||||||
| 10.21 | Amendment to Registration Agreement, dated February 28, 2006, by and between Rackable Systems, Inc., Rackable Investment LLC, Parthenon Investors II, L.P. and the founders named therein. | S-1/A1 | 10.8 | 333-131977 | 3/1/2006 | ||||||||
| 10.22 | Net Lease Agreement dated June 26, 2006 by and among Rackable Systems, Inc. and Fremont Landing Investors, LLC. | 8-K | 10.62 | 000-51333 | 8/25/2006 | ||||||||
| 10.23 | * | Amended and Restated 2006 New Recruit Equity Inventive Plan. | 10-K | 10.48 | 000-51333 | 2/28/2007 | |||||||
| 10.24 | * | Executive Change in Control Benefit Plan and Form of Participation Notices. | 8-K | 10.1 | 000-51333 | 9/5/2006 | |||||||
| 10.25 | * | Form of Option Agreement and Grant Notices under the 2005 Equity Incentive Plan. | 8-K | 10.2 | 000-51333 | 9/5/2006 | |||||||
| 10.26 | * | Form of Stock Bonus Award Agreement and Grant Notice under the 2005 Equity Incentive Plan. | 8-K | 10.3 | 000-51333 | 9/5/2006 | |||||||
| 10.27 | * | Form of Stock Option Agreement and Grant Notice with Outside Directors under the 2002 Stock Option Plan. | 10-Q | 10.10 | 000-51333 | 11/14/2006 | |||||||
| 10.28 | * | Form of Non-statutory Stock Option Agreement under the 2005 Non-Employee Directors’ Stock Option Plan. | 10-Q | 10.11 | 000-51333 | 11/14/2006 | |||||||
| 10.29 | * | Retention Agreement, dated January 9, 2007, by and between Rackable Systems, Inc. and Giovanni Coglitore. | 8-K | 10.1 | 000-51333 | 1/11/2007 | |||||||
| 10.30 | * | Retention Bonus Agreement, dated September 12, 2006, by and between Rackable Systems, Inc. and Giovanni Coglitore. | 8-K | 10.2 | 000-51333 | 1/11/2007 | |||||||
| 10.31 | * | First Amendment to Retention Bonus Agreement, dated January 9, 2007, by and between Rackable Systems, Inc. and Giovanni Coglitore. | 8-K | 10.3 | 000-51333 | 1/11/2007 | |||||||
| 10.32 | * | Offer Letter, dated August 21, 2006, by and between the Registrant and Charles Boesenberg. | 10-K | 10.6 | 000-51333 | 2/28/2007 | |||||||
| 10.33 | * | Offer Letter, dated November 17, 2006, by and between the Registrant and Mark Barrenechea. | 10-K | 10.61 | 000-51333 | 2/28/2007 | |||||||
| 10.34 | * | Change in Control Severance Benefit Plan. | 8-K | 10.1 | 000-51333 | 10/6/2006 | |||||||
| 10.35 | * | Management Bonus Plan for the Second Half of 2007. | 8-K | — | 000-51333 | 9/8/2007 | |||||||
120
Table of Contents
| Exhibit |
Exhibit Description |
Incorporated by Reference | Filing Date | Filed Herewith | |||||||||
| Form | Ex. No. | File No. | |||||||||||
| 10.36 | Second Amendment to Employment Agreement, dated June 28, 2007, by and between Rackable Systems, Inc. and Giovanni Coglitore. | 10-Q | 10.7 | 000-51333 | 8/9/2007 | ||||||||
| 10.37 | Employment Agreement, dated August 22, 2007, by and between Rackable Systems, Inc. and Maurice Leibenstern | 10-Q | 10.5 | 000-51333 | 11/8/2007 | ||||||||
| 10.38 | First Amendment to Employment Agreement, dated September 19, 2007, by and between Rackable Systems, Inc. and Maurice Leibenstern | 10-Q | 10.6 | 000-51333 | 11/8/2007 | ||||||||
| 10.39 | Employment Agreement, dated May 24, 2007, between Rackable Systems Inc and Mark J. Barrenechea | 8-K | 10.1 | 000-51333 | 5/30/2007 | ||||||||
| 10.40 | * | Officer Compensation Changes in First Quarter 2007 | 8-K | — | 000-51333 | 1/31/2007 | |||||||
| 10.41 | * | Compensation arrangements in connection with April 29, 2007 management changes | 8-K | — | 000-51333 | 5/1/2007 | |||||||
| 10.42 | Separation Agreement dated May 23, 2007, between Rackable Systems, Inc. and Todd Ford | 8-K | 10.1 | 000-51333 | 5/28/2007 | ||||||||
| 10.43 | * | Form of 2005 Equity Incentive Plan Restricted Stock Unit Grant Notice and Restricted Stock Unit Award Agreement | 8-K | 10.1 | 000-51333 | 6/8/2007 | |||||||
| 10.44 | * | Cash compensation arrangements with the non-employee Directors | 10-Q | 10.6 | 000-51333 | 8/9/2007 | |||||||
| 10.45 | * | Offer Letter, dated January 29, 2008, by and between the Registrant and Douglas R. King. | X | ||||||||||
| 10.46 | * | Offer Letter, dated January 29, 2008, by and between the Registrant and Michael W. Hagee. | X | ||||||||||
| 10.47 | * | Offer Letter made by Rackable Systems, Inc. to Jonathan J. Skoglund, dated October 14, 2008 | 8-K | 10.1 | 000-51333 | 11/28/08 | |||||||
| 10.48 | * | Amendment to Employment Agreement, dated December 31, 2008, between Rackable Systems, Inc. and Mark J. Barrenechea | 8-K | 10.3 | 000-51333 | 1/6/09 | |||||||
| 10.49 | * | Second Amendment to Employment Agreement, dated November 17, 2008, between Rackable Systems, Inc. and Maurice Leibenstern | 10-K | 10.67 | 000-51333 | 3/19/09 | |||||||
| 10.50 | * | First Amendment to Retention Agreement, dated December 31, 2008, between Rackable Systems, Inc. and Giovanni Coglitore | 8-K | 10.4 | 000-51333 | 1/6/09 | |||||||
| 10.51 | * | Employment Agreement, dated March 31, 2008, between Rackable Systems, Inc. and James Wheat | 10-K | 10.69 | 000-51333 | 3/19/09 | |||||||
121
Table of Contents
| Exhibit |
Exhibit Description |
Incorporated by Reference | Filing Date |
Filed Herewith | |||||||||
| Form | Ex. No. | File No. | |||||||||||
| 10.52 | * | Amendment #1 to Employment Agreement, dated December 31, 2008, between Rackable Systems, Inc. and James Wheat | 10-K | 10.70 | 000-51333 | 3/19/09 | |||||||
| 10.53 | * | First Amendment to Employment Agreement, dated December 31, 2008, between Rackable Systems, Inc. and James Wheat | 8-K | 10.2 | 000-51333 | 1/6/09 | |||||||
| 10.54 | * | Amended and Restated Employment Agreement, dated December 30, 2008, between Rackable Systems, Inc. and Giovanni Coglitore | 8-K | 10.1 | 000-51333 | 1/6/09 | |||||||
| 10.55 | * | Offer Letter made by Rackable Systems, Inc. to Anthony Carrozza, dated January 24, 2008. | 10-K | 10.73 | 000-51333 | 3/19/09 | |||||||
| 10.56 | * | First Amendment to Employment Agreement, dated December 23, 2008 between, between Rackable Systems, Inc. and Anthony Carrozza | 10-K | 10.74 | 000-51333 | 3/19/09 | |||||||
| 10.57 | * | Third Amendment to Employment Agreement, dated December 23, 2008, between Rackable Systems, Inc. and Maurice Leibenstern | 10-K | 10.75 | 000-51333 | 3/19/09 | |||||||
| 10.58 | * | Corporate Bonus Plan. | 8-K | 5.02 | 000-51333 | 2/12/09 | |||||||
| 10.59 | * | Offer Letter made by Rackable Systems, Inc. to Tim Pebworth, dated May 1, 2009. | 8-K | 10.2 | 000-51333 | 5/14/09 | |||||||
| 10.60 | * | 2010 Corporate Bonus Plan. | 8-K | — | 000-51333 | 8/14/09 | |||||||
| 10.61 | * | Director Compensation Arrangement. | 10-Q | 10.86 | 000-51333 | 11/4/09 | |||||||
| 10.62 | * | Separation Agreement dated June 23, 2010, between Silicon Graphics International Corp. and Giovanni Coglitore. | X | ||||||||||
| 10.63 | * | 2011 Short Term Incentive Plan | X | ||||||||||
| 10.64 | * | Compensation arrangement with named executive officers | 8-K | — | 000-51333 | 2/4/10 | |||||||
| 21.1 | Subsidiaries of the Company. | X | |||||||||||
| 23.1 | Consent of Independent Registered Public Accounting Firm. | X | |||||||||||
| 24.1 | Power of Attorney. (Included on the signature page hereto). | ||||||||||||
| 31.1 | Certification required by Rule 13a-14(a) or Rule 15d-14(a). | X | |||||||||||
| 31.2 | Certification required by Rule 13a-14(a) or Rule 15d-14(a). | X | |||||||||||
| 32.1 | ** | Certifications required by Rule 13a-14(b) or Rule 15d-14(b) and Section 1350 of Chapter 63 of Title 18 of the United States Code (18 U.S.C. §1350) | X | ||||||||||
122
Table of Contents
| * | Indicates a management contract or compensatory plan or arrangement. |
| ** | The certification attached as Exhibit 32.1 accompanies the Annual Report on Form 10-K pursuant to Section 906 of the Sarbanes-Oxley Act of 2002 and shall not be deemed “filed” by Silicon Graphics International Corp. for purposes of Section 18 of the Securities Exchange |
123