Attached files
| file | filename |
|---|---|
| EX-3.2 - EXHIBIT 3.2 - Silicon Graphics International Corp | fy1410kexhibit32sgibylaws.htm |
| EX-23.1 - EXHIBIT 23.1 - Silicon Graphics International Corp | fy1410-kexhibit231consento.htm |
| EX-31.1 - EXHIBIT 31.1 - Silicon Graphics International Corp | fy1410-kexhibit311certific.htm |
| EX-21.1 - EXHIBIT 21.1 - Silicon Graphics International Corp | fy1410-kexhibit211subsidia.htm |
| EX-31.2 - EXHIBIT 31.2 - Silicon Graphics International Corp | fy1410-kexhibit312certific.htm |
| EXCEL - IDEA: XBRL DOCUMENT - Silicon Graphics International Corp | Financial_Report.xls |
| EX-32.1 - EXHIBIT 32.1 - Silicon Graphics International Corp | fy1410-kexhibit321certific.htm |
UNITED STATES
SECURITIES AND EXCHANGE COMMISSION
Washington, D.C. 20549
FORM 10-K
(Mark One)
x ANNUAL REPORT PURSUANT TO SECTION 13 OR 15(d) OF THE SECURITIES EXCHANGE ACT OF 1934
For the fiscal year ended June 27, 2014
or
o TRANSITION REPORT PURSUANT TO SECTION 13 OR 15(d) OF THE SECURITIES EXCHANGE ACT OF 1934
For the transition period to
Commission File Number 000-51333
SILICON GRAPHICS INTERNATIONAL CORP.
(Exact name of registrant as specified in its charter)
Delaware | 32-0047154 | |
(State or Other Jurisdiction of Incorporation or Organization) | (I.R.S. Employer Identification No.) | |
900 North McCarthy Blvd.
Milpitas, California 95035
(Address of principal executive offices, including zip code)
(669) 900-8000
(Registrant’s telephone number, including area code)
Securities registered pursuant to Section 12(b) of the Act:
Title of each class | Name of each exchange on which registered | |
Common Stock, $0.001 par value per share | NASDAQ Global Select Market | |
Securities registered pursuant to Section 12(g) of the Act:
None
Indicate by check mark whether the registrant is a well-known seasoned issuer, as defined in Rule 405 of the Securities Act. Yes o No x
Indicate by check mark if the registrant is not required to file reports pursuant to Section 13 or Section 15(d) of the Act. Yes o No x
Indicate by check mark whether the registrant (1) has filed all reports required to be filed by Section 13 or 15(d) of the Securities Exchange Act of 1934 during the preceding 12 months (or for such shorter period that the registrant was required to file such reports) and (2) has been subject to such filing requirements for the past 90 days. Yes x No o
Indicate by check mark whether the registrant has submitted electronically and posted on its corporate Web site, if any, every Interactive Data File required to be submitted and posted pursuant to Rule 405 of Regulation S-T (§ 232.405 of this chapter) during the preceding 12 months (or for such shorter period that the registrant was required to submit and post such files). Yes x No o
Indicate by check mark if disclosure of delinquent filers pursuant to Item 405 of Regulation S-K is not contained herein, and will not be contained, to the best of registrant’s knowledge, in definitive proxy or information statements incorporated by reference in Part III of this Form 10-K or any amendment to this Form 10-K. o
Indicate by check mark whether the registrant is a large accelerated filer, an accelerated filer, a non-accelerated filer, or a smaller reporting company. See the definition of “large accelerated filer”, “accelerated filer” and “smaller reporting company” in Rule 12b-2 of the Exchange Act.
(Check one):
Large accelerated filer o | Accelerated filer x | Non-accelerated filer o | Smaller reporting company o |
Indicate by check mark whether the registrant is a shell company (as defined in Rule 12b-2 of the Exchange Act). Yes o No x
As of December 27, 2013, the aggregate market value of the voting stock held by non-affiliates of the registrant, computed by reference to the last sale price of such stock as of such date on the NASDAQ Global Select Market, was approximately $390,534,224. For purposes of this calculation, shares of common stock held by each officer and director of the Registrant and by each person who is known to own 10% or more of the outstanding common stock of the Registrant have been excluded since such persons may be deemed to be affiliates of the Registrant. Such determination of affiliate status is not necessarily a conclusive determination of affiliate status for other purposes.
As of August 29, 2014, there were 34,609,203 shares of the registrant's common stock outstanding.
DOCUMENTS INCORPORATED BY REFERENCE.
Portions of the registrant's definitive proxy statement for its 2014 Annual Meeting of Stockholders, scheduled to be held on December 9, 2014, are incorporated by reference into Part III of this Annual Report on Form 10-K where indicated. Except as expressly incorporated by reference, the registrant's proxy statement shall not be deemed to be part of this Annual Report on Form 10-K.
SILICON GRAPHICS INTERNATIONAL CORP.
ANNUAL REPORT ON FORM 10-K
FOR THE YEAR ENDED JUNE 27, 2014
TABLE OF CONTENTS
Page | ||
Item 1. | ||
Item 1A. | ||
Item 1B. | ||
Item 2. | ||
Item 3. | ||
Item 4. | ||
Item 5. | ||
Item 6. | ||
Item 7. | ||
Item 7A. | ||
Item 8. | ||
Item 9. | ||
Item 9A. | ||
Item 9B. | ||
Item 10. | ||
Item 11. | ||
Item 12. | ||
Item 13. | ||
Item 14. | ||
Item 15. | ||
CAUTIONARY STATEMENT REGARDING FORWARD-LOOKING INFORMATION
This Annual Report on Form 10-K contains forward-looking statements within the meaning of Section 27A of the Securities Act of 1933 and Section 21E of the Securities Exchange Act of 1934. All statements included or incorporated by reference in this Form 10-K other than statements of historical fact, are forward-looking statements. Investors can identify these and other forward-looking statements by the use of words such as “estimate,” “may,” “will,” “could,” “anticipate,” “expect,” “intend,” “believe,” “continue” or the negative of such terms, or other similar expressions. Forward-looking statements also include the assumptions underlying or relating to such statements.
Our actual results could differ materially from those projected in the forward-looking statements included herein as a result of a number of factors, risks and uncertainties, including, among others, the risk factors set forth in “Item 1A—Risk Factors,” and "Item 7—Management’s Discussion and Analysis of Financial Condition and Results of Operations” in this Form 10-K and elsewhere in this Form 10-K and the risks detailed from time to time in Silicon Graphics International Corp.’s future U.S. Securities and Exchange Commission reports. The information included in this Form 10-K is as of the filing date with the Securities and Exchange Commission and future events or circumstances could differ materially from the forward-looking statements included herein. We disclaim any intent to update any of the forward-looking statements after the date of this report or to conform these statements to actual results except as required by law. Accordingly, we caution readers not to place undue reliance on such statements.
“Silicon Graphics,” “SGI,” “Accelerate,” “Altix,” “ArcFiniti,” “CloudRack,” “CXFS,” “Cyclone,” “DataRapter,” “DMF,” “FullCare,” “FullExpress,” “Global Developer Program,” “ICE,” “ICE Cube,” “InfiniteData,”“InfiniteStorage,” “LiveARC," “MineSet,” “NUMAflex,” “NUMAlink,” “Octane,” "OpenGL,” “Origin,” “ProPack,” “Rackable,” “REACT,” “SHMEM,” “StorHouse,” “Supportfolio,” “Tempo,” “Trusted Edge,” “UV,” “VizServer,” “XFS,” “ZeroWatt,” and the “Silicon Graphics” logo are registered or other trademarks of Silicon Graphics International Corp. or its subsidiaries in the U.S. and/or other countries. Other trademarks or service marks appearing in this report may be trademarks or service marks of other owners.
1
PART I
Item 1. Business
Overview
SGI is a global leader in high performance computing ("HPC"). We are focused on helping customers solve their most demanding business and technology challenges by delivering high performance computing and data analytics solutions that accelerate time to discovery, innovation and profitability.
We develop, market and sell a broad line of low cost, mid-range and high-end scale-out and scale-up servers, enterprise-class storage, differentiating software and designed-to-order solutions for large-scale data center deployments, coupled with global support and highly experienced professional services. SGI solutions are designed to deliver high impact results with lower total cost of ownership at the extremes of speed, scale and efficiency.
SGI solutions are utilized by scientific, business and government communities to fulfill highly data-intensive application needs in petascale environments. Delivering industry-leading computing power and fast and efficient data movement, both within the computing system and to and from large-scale data storage installations, SGI systems enable customers to access, analyze, transform, manage and visualize information in real and near real-time.
Our goal is to accelerate time to results in key markets, including federal government, defense and strategic systems, weather and climate, physical and life sciences, energy (including oil and gas), aerospace, automotive, internet, financial services, media and entertainment and cloud services.
SGI achieves competitive differentiation through compute and storage solutions built with innovative architectural advantages utilizing industry standard components and tight integration. By designing for performance, power, density and scalability; optimizing interconnections between layers; and engineering to reduce overhead and accelerate deployment, SGI solutions deliver industry leading speed, scale and efficiency.
SGI has over 1,150 employees worldwide and has 632 granted and pending patents. SGI serves over 6,500 customers and sells products and services in 50 countries through a direct and indirect sales force, including original equipment manufacturers, system integrators and value added resellers. SGI has over 260 active partners. During fiscal 2014, 2013 and 2012, international revenue was approximately 52%, 38% and 41%, respectively, of our total revenue.
FileTek, Inc. Acquisition
On September 30, 2013, the Company acquired certain assets of FileTek, Inc. ("FileTek"), a global provider of high performance data analytics storage virtualization, large-scale data management, and active archive solutions. The total purchase price was approximately $9.2 million in cash. This acquisition expanded the Company's storage solutions by enabling customers to manage data assets efficiently and lower the cost and administration of high-volume storage. Under the terms of the agreement, SGI acquired FileTek's StorHouse and Trusted Edge software, worldwide customers, engineering team, and services and support resources.
The acquired assets and assumed liabilities were recorded by the Company at their estimated fair values. The Company determined the estimated fair values using estimates and valuations including discounted cash flow and cost approach analyses.
Fiscal Year
Included in this report are our consolidated balance sheets as of June 27, 2014 and June 28, 2013, the consolidated statements of operations, the consolidated statements of stockholders’ equity and the consolidated statements of cash flows for the fiscal years ended June 27, 2014 ("fiscal 2014"), June 28, 2013 ("fiscal 2013") and June 29, 2012 ("fiscal 2012").
The Company has a 52 or 53-week fiscal year ending on the last Friday in June. Fiscal year 2014 was comprised of 52 weeks. Fiscal year 2013 was comprised of 52 weeks and fiscal year 2012 was comprised of 53 weeks.
Segment Information
Our operating segments are determined based upon several criteria including: our internal organizational structure; the manner in which our operations are managed; the criteria used by our Chief Executive Officer, who functions as our Chief Operating Decision Maker (“CODM”), to evaluate segment performance; and the availability of separate financial information.
Commencing in the first quarter of fiscal 2014, the Company started managing its business primarily on a business unit basis versus the geographic basis previously used by management. Accordingly, the Company has determined its operating and reporting segments, which is based on the business unit structure, to be Compute, Storage and Service.
2
A description of Company's three reportable segments is as follows:
Compute-The Compute solutions segment includes our scale-out computing, scale-up computing and software solutions. Compute solutions also include integrated third-party hardware and software products that we sell to provide a single source solution for our customers. Our compute solutions are designed to minimize the number and complexity of interconnects for power and data transfer to improve reliability, speed of implementation and serviceability.
Storage-The Storage solutions segment includes both hardware and software offerings to address virtually every type of data storage and management requirement. Products range from entry-level disk arrays to complex storage systems, with innovative technology and hardware, to include the SGI Modular InfiniteStorage™ platform, SGI InfiniteStorage™ gateway and SGI CXFS™ file system. Our storage solutions are designed to provide extreme scale, broad flexibility and to minimize the cost to store data.
Service-The Service segment is comprised of customer service support and professional services. Our customer support organization provides ongoing maintenance and technical support for our products and some third-party products, as well as contracted maintenance services, hardware deployment services (install and de-install), time and materials-based services and spare parts. Our professional services organization provides value added services associated with technology consulting, project management and customer education, all of which help our customers realize the full value of their information technology investments.
The Company's CODM evaluates the performance of its operating segments based on revenue and operating profit (loss). Revenue is generally allocated based on the type of products and service provided to our customers. Operating profit (loss) for each segment includes related cost of sales and operating expenses directly attributable to the segment. A portion of the segments' expenses arise from shared services and infrastructure that the Company provides to the segments in order to realize economies of scale and to efficiently use resources. These expenses, collectively called corporate charges, include costs of centralized research and development and other corporate infrastructure expenses. The corporate charges that are directly attributable to the segments are allocated and are reassessed on a periodic basis. The allocations have been determined on a basis that the Company considers to be a reasonable reflection of the utilization of services provided to or benefits received by the segments. The profitability of each of the segments is measured after excluding share based compensation expenses, amortization of intangibles, restructuring charges, manufacturing transition costs, general and administration charges, other unallocated corporate charges and other items as management does not include this information in its measurement of the performance of the operating segments.
Further information regarding our operating segments is presented in "Management's Discussion and Analysis of Financial Condition and Results of Operations" in Part II, Item 7 of this Annual Report on Form 10-K and in Note 22 "Segment Information" to the consolidated financial statements in Part II, Item 8 of this Annual Report on Form 10-K.
Customers
Direct sales to various agencies of the United States government, excluding system integrators accounted for 16%, 19%, and less than 10% of our revenue in fiscal 2014, 2013, and 2012, respectively. For fiscal 2013 and 2012, Amazon accounted for approximately 18% and 16% of our revenue, respectively.
Information regarding revenue and gross profit by reportable segments and revenue from our customers and by business unit is presented in Note 22 "Segment Information" to the consolidated financial statements included in Part II, Item 8 of this Annual Report on Form 10-K and in “Management’s Discussion and Analysis of Financial Condition and Results of Operations” in Part II, Item 7 of this Annual Report on Form 10-K.
Solutions
SGI provides a broad line of solutions designed to address the specialized demands of market verticals, enable our customers to run data-intensive applications rapidly, and store data safely and economically. Our core computing and storage components utilize Intel, NVIDIA graphics processing units ("GPUs") and the Linux operating system. Our storage product lines range from entry-level disk arrays to complex storage systems, with innovative technology and hardware, to include the SGI Modular InfiniteStorage™ platform, SGI InfiniteStorage™ gateway and SGI CXFS™ file system.
We design our solutions for optimal performance, quick deployment, efficient operation, high system availability and broad serviceability. Our compute solutions incorporate premium quality components, selected for superior functionality and reliability, and are designed to minimize the number and complexity of interconnects for power and data transfer to improve reliability, speed of implementation and serviceability. Our storage solutions are designed to provide extreme scale, broad flexibility, and to minimize management overhead. We also integrate third-party hardware and software products into the compute and storage solutions we sell and provide a single source solution for our customers.
3
SGI data center technologies help reduce total cost of ownership. These include SGI® Power XE™ phase balanced power distribution with 99% power efficiency, maximum density at the cabinet and row levels, thermally neutral doors, self-adjusting fan arrays, cable reduction and higher temperature tolerance for operation up to 104°F (40°C).
Our products predominantly utilize a software environment based on the industry-standard Linux operating system with comprehensive data management tools that include open source software and our own execution, development and administrative tools and utilities. We have key differentiation in our storage software for managing very large data volumes efficiently and demonstrated ability to reliably store files for decades. We believe our integrated software stack and the features of our architecture and hardware differentiate our product offerings in performance and ease of use. Our products can be customized to meet end-user requirements and were developed to permit easy hardware and software installation, both to add capacity and to take advantage of future technology advances.
We group our solution offerings under these main categories: Scale-out Computing, Scale-up Computing, High Performance Data Analytics, Clustered and High Performance Storage, Software, Networking and Global Services.
Scale-out Computing:
Clusters are the workhorses of many applications in high-performance computing, running technical computing workloads as diverse as Computational Fluid Dynamics and bioinformatics, as well as high performance data analytics using Hadoop clusters. The design for SGI HPC cluster solutions begins with our Applications Engineering team of engineers and scientists, many at the Ph. D. level, who have years of experience working with customers and their applications in a variety of engineering and technical fields. This understanding of customer needs helps us to provide cluster solutions for customer workflows and data sets. SGI provides HPC cluster solutions for small design shops up to the largest corporations in the world.
SGI HPC cluster solutions for technical computing comprise:
• | SGI Rackable® standard depth server clusters provide solutions for small to medium-sized installations, typically of a few servers to a few hundred. Standard depth servers consist of several models, including I/O and memory rich models, dense models with four slim nodes in a single 2U chassis, and models specifically designed to support NVIDIA® Tesla GPU Compute Accelerators and Intel® Xeon® Phi™ Coprocessors. The clusters include a broad range of GigE and Infiniband interconnect options. |
• | SGI® ICE™ X is a distributed memory supercomputer. The fifth generation of our award-winning SGI ICE architecture for technical HPC, ICE X can deliver over 190 teraflops per rack and affordably scale from 36 to tens of thousands of nodes to solve the world's most complex problems. ICE X delivers a variety of innovative technologies including FDR Infiniband interconnect, an innovative double-density blade design, flexible power shelves, on-processor liquid cooling and “M-Cell” closed-loop cooling environment that allows warm water cooling. Its open x86 architecture makes it equally simple to deploy commercial, open source or custom applications on completely unmodified Novell® SLES® or Red Hat® Enterprise Linux® operating systems. ICE X supports the latest Intel® E5-2600 v2 processors and Intel Xeon® Phi™ Coprocessors. We have deployed numerous Petascale systems including NASA-Ames in Mountain View, California, Total in southwest France, and the US Air Force Research Lab in Ohio, AWE in the United Kingdom, and have a roadmap to Exascale computing at both the hardware and software level. |
Scale-up Computing:
• | SGI UV 2 is the world's largest coherent in-memory system. In addition to being a real time analytic solution, SGI UV 2 is designed to address the most demanding data-intensive applications and accelerate the pace of innovation across a broad range of environments. Scaling up 2,048 cores and 64 TBs of shared memory, SGI UV 2 is managed and operated as a single system. It can run many compute-intensive workloads simultaneously. Utilizing the UV 2 large node in any cluster deployment also enables customers to address programming jobs and data sizes in CAE, Life Sciences and other markets that exceed the capacity of standard two or even four socket servers. Programming tools utilized with scale-out cluster solutions such as SGI Performance Suite can be used with SGI UV 2. And with SGI Management Center, users are able to manage our scale-out and scale-up solutions with a common application, simplifying administration. For smaller environments without information technology ("IT") resources to manage a complex scale-out cluster deployment, UV 2 can be utilized as the sole compute resource, with only a single server and operating system image. Customers interested in developing new applications will also be able to prototype new algorithms with the UV 2 hardware and open software architecture. |
4
• | SGI UV for SAP HANA is a purpose-built appliance for the SAP HANA platform. This large-scale appliance uses in-memory SGI computing technology to enable real-time transactional and analytical processing for large enterprises. The appliance is a single-node, coherent shared-memory computer system that will scale seamlessly from 4 to 32 sockets. Each socket supports up to 24 dual in-line memory modules (DIMMs) to enable a variety of configurations commensurate with a customer’s specific use case. This solution is currently undergoing certification with our partner SAP. We expect to launch our first HANA appliances in the second half of fiscal 2015. |
High Performance Data Analytics Solutions:
• | SGI Solutions for Hadoop. SGI has implemented many of the largest Hadoop clusters in the world, some containing over 1,500 nodes. Our solutions start with a deep software stack including our proprietary SGI Management Center, cluster management software that provides ease of management for thousands of server nodes, complete monitoring of all key system aspects and fine-grained power management. Underneath the SGI Management Center are open components including the Linux operating system and the Apache-based Hadoop distribution. SGI Hadoop solutions are completely factory-integrated and tested, and arrive at the customer site ready to be plugged in and deliver an immediate resource. For customers who wish to first experiment with Hadoop, SGI offers Hadoop Starter Kits in cluster sizes ranging from a half-rack to multiple racks. |
• | SGI InfiniteData Cluster is a highly flexible cluster computing platform combining server and storage density with extreme, scale-out performance. Designed for HPC spanning High Performance Data Analytics and moderate technical computing environments, InfiniteData Cluster accelerates time to value in data and compute intensive environments with greater efficiency, less complexity, and at a lower cost. |
• | SGI Graph, Fraud Analysis, Social Analytics and Genomics Solutions. Utilizing SGI® UV™ 2, the second generation of our Intel® Xeon® based scale-up servers, these solutions enable knowledge discovery, deliver real-time results and instant feedback versus batch jobs that might take hours or days to complete and allow customers to create new analyses quickly with ease of use. UV 2 leverages nearly twenty years of SGI technology to deliver the fastest and most scalable shared memory computer in the world, scaling from 16 to 4,096 processing cores with architectural provisioning for up to 262,144 cores, while supporting up to 64 terabytes of global shared memory in a single system image. UV 2 can support Novell® SLES® Linux and Red Hat® Enterprise Linux®. Superior performance is built into every SGI UV 2 system, leveraging our high-speed proprietary interconnect NUMAlink® 6 and MPI Offload Engine acceleration. Based on open standards, the system's x86 architecture leverages the quad-, six- or eight-core Intel® Xeon® E5-4600 series processor family, and allows for the use of completely unmodified Novell® SLES® or Red Hat® Enterprise Linux operating systems. |
• | SGI® InfiniteStorage™ Gateway is an active archive appliance that enables enterprise IT organizations to address the volume challenges of High Performance Data Analytics. See Clustered and High Performance Storage. |
Clustered and High Performance Storage:
SGI Clustered and High Performance Storage solutions include a complete suite of hardware and software offerings to address virtually every type of data storage and management requirement. Offered under the SGI® InfiniteStorage™ ecosystem, these solution components range from power-efficient JBODs to a wide range of NAS, RAID and object storage platforms to accommodate all types of workflow requirements, as well as the industry's leading high-performance clustered file system and tiered storage virtualization software.
Our data storage solutions are designed to meet the performance, scale, and efficiency needs of high performance technical computing and data analytics, cloud computing and active archiving of persistent data and include:
• | HPC Storage Solutions comprise SGI RAID platforms with a variety of density, performance and price points in direct-attached and SAN configurations, and typically in combination with SGI file system and storage management software. Our InfiniteStorage 5000 series mid-range RAID products are focused on delivering a high price/performance ratio and flexible configurations. Our InfiniteStorage 16000 and 17000 solutions are designed to meet high performance, guaranteed I/O rate and capacity requirements found in many high-end HPC environments. Offering scalability to 1,200 disk drives in a single system, guaranteed latency and extremely high bandwidth, these offerings address the requirements of digital media, supercomputing, life sciences and remote sensor acquisition. |
• | SGI® Modular InfiniteStorage™ (MIS) platform is an integrated server and storage system designed to provide extreme flexibility with industry-leading density in an innovative, adaptable design. Offered in storage server and JBOD versions, MIS is a highly flexible platform that delivers a wide range of storage solutions with different disk size and types (including SSDs), to include cloud storage, NAS, active archive gateway, or object storage server. The unique, bi-directional design allows it to be serviced from the front or rear of the chassis. |
5
• | SGI® InfiniteStorage™ Gateway is an active archive appliance that enables enterprise IT organizations to align data throughout its lifecycle with the most appropriate storage medium while maintaining seamless user access, significantly reducing the cost of high volume storage. An extension of the SGI Modular InfiniteStorage (MIS) platform, the appliance integrates SGI® DMF™ tiered storage virtualization technology. |
• | SGI® DMF™ storage software creates and automatically manages a tiered virtual storage environment that significantly reduces customer equipment and operating costs, improves service levels and lowers customer data risks. Currently, DMF is deployed at customer sites worldwide, with individual customers managing more than 100 petabytes and nearly two billion files. DMF operates in the background with no interruption or degradation of service to end-users and applications. DMF is integrated in SGI's new InfiniteStorage Gateway active archive appliance and is often part of many HPC storage implementations. |
• | CXFS™ file system software provides no-compromise data sharing, enhanced workflow and reduced costs in data-intensive environments. It eliminates file duplication and the time it takes to move large files over networks. CXFS significantly boosts productivity where large files are shared by multiple processes in a workflow. Because it uses a SAN infrastructure, CXFS delivers much greater I/O performance and bandwidth than any network data-sharing mechanism, such as network file system or common internet file system. |
Software:
• | SGI Management Center is used to manage SGI HPC cluster solutions. Adding features such as GPU monitoring to the capabilities allows our customers to take advantage of the latest processors for accelerating the speed of their codes. |
• | SGI Foundation Software is our software suite of support tools and utilities that enable our servers to run more reliably, with improved support and new server capabilities. SGI Foundation software includes key capabilities to monitor memory component failures in our servers, which minimizes or eliminates the impact of these failures on system users. SGI Foundation Software also includes customized simple network management protocol interfaces for many of our systems, allowing them to interface easily to enterprise management systems. |
• | SGI Performance Suite software improves performance and provides key additional capabilities for developers of technical computing and high performance data applications on all of our systems that run standard Linux distributions. SGI Performance Suite software contains the following components: SGI® Accelerate™, SGI MPT, SGI REACT™ and SGI UPC. SGI Accelerate provides features that accelerate applications, enable development of parallel and real-time applications, and manage system resources for SGI's large scalable servers, clusters and storage. SGI Message Passing Interface ("MPI") contains the SGI Message Passing Toolkit ("MPT") for very high levels of scalability and performance of MPI applications on our systems. SGI REACT software provides features that enable real-time, guaranteed response time applications to run on SGI systems. SGI UPC is the SGI Unified Parallel Compiler which has optimizations for the SGI UV 2 server features. |
Networking:
• | SGI Networking solutions include node-level integration (dual/quad NICs, GigE, 10GigE, InfiniBand QDR and FDR onboard interfaces), cluster-level integration for clustered-computing (pre-tested, pre-certified high-speed switches, in-cabinet aggregation and software managed GigE, 1GigE, IB) and Fibre Channel integration for clustered-storage (high-speed data access, interconnects and stacking). The SGI UV scale-up server line features SGI's own high-performance, low-latency SGI® NUMAlink™ interconnect. |
SGI Global Services
The SGI Global Services organization is comprised of customer support services and professional services. Our customer support organization provides ongoing maintenance and technical support for our products and some third-party products, as well as contracted maintenance services, hardware deployment services (install and de-install), time and materials-based services and spare parts. Our professional services organization provides value added services associated with technology consulting, project management and customer education, all of which help our customers realize the full value of their information technology investments. SGI has developed four specific practices within professional services to address customer needs. Each practice was developed to provide differentiated solutions in the technology subject matter they address. Our focused Solution Practice Areas include: High Performance Data Analytics, Storage, High Performance Computing and Visualization. As of June 27, 2014, the organization staffed over 300 service professionals, providing services to customers in approximately 47 countries.
6
Both customer support services and professional services develop and implement services solutions for our customers, as well as provide a board range of value added and support services offerings to address the requirements and business strategies of our customers, distributors and resellers. Service is provided to our customers several ways directly or through approved distributors, resellers and third-party provider partners.
Support Services: The SGI Global Services organization offers market competitive warranties, generally from one (1) to three (3) years, and warranty upgrade options for products sold by our direct sales team and approved distributors and resellers. We are committed to meeting our customers' maintenance and support needs by providing a broad range of support programs from a cost effective self-care option to a 7x24 option for mission critical environments.
SGI customers may purchase a variety of support services plans. We offer several levels of support that vary depending on specific services, response times, coverage hours and duration. In addition to our industry leading standard support plans, our customer support services provide competitive advantages in the form of long-standing relationships with our customer base and the extensive expertise of our systems engineers. All services plans come standard with SGI Remote Services.
Remote Service: SGI Remote Services provide proactive monitoring, alerting and reporting of system events with a secure connection to SGI Customer Support-on demand.
Installation Services: SGI services may include system installation, configuration and management services, spares management, site preparation, as well as software upgrades and updates.
Customer Education: SGI Global Services also offers customer technical training to fully enable their use of SGI technology.
Professional Services: Our professional services group provides fee-based consultative services to our customers and system integrators. We architect, design, implement and manage complex and complete solutions for our customers' technical computing infrastructures and provide installation and deployment for custom consulting projects. Our engagements are designed to ensure our customers' success with our products and technologies. The SGI professional services portfolio is designed to meet a variety of consulting needs, including custom time and materials, fixed price contract consulting services, standard assessments and implementation offerings or long-term on-site staff augmentation services. In particular, our on-site staff augmentation services enable us to develop and maintain ongoing relationships with our customers whereby we gain a deeper understanding of industry-specific information technology needs.
Sales and Distribution
We sell our systems and services primarily through our direct sales force and distributors, system integrators, value-added resellers, original equipment manufacturers ("OEMs") and channel partners. Our sales teams consist of sales representatives and sales engineers, who are supported by channel, inside sales, sales support and professional services personnel. Our professional services and engineering personnel collaborate with our sales teams in all stages of the sales and integration process, including developing proposals that address the technical requirements of our customers, performing proofs of concept and benchmarking system performance.
By selling our products through our direct sales team, we are able to maintain close client contact and feedback throughout the entire sales process. Our sales process begins with leads generated through targeted marketing programs and by our inside sales team, which are then logged, qualified and assigned to an account executive. After an initial lead qualification, our sales executives and sales engineers collect information regarding the customer’s data center environment and application requirements. We then collaborate with the customer’s technical point of contact and our own internal technical resources to agree upon a particular system configuration for the customer. For larger customers, we allow evaluation of one or more hardware configurations to enable the customer to conduct their own benchmarking analyses.
We currently have direct sales personnel in various countries, including the United States, United Kingdom, France, Germany, Japan, Australia, Brazil, Canada, China, Czech Republic, Netherlands and Singapore. We augment our sales staff with indirect coverage via distributor and channel partner arrangements in countries in which we have a presence. In markets where we have no direct sales personnel, we provide our products through our distributors and channel partners. We are engaged in a multi-year program to further develop additional channel partner relationships in order to improve our indirect sales efforts, expand our customer base and enter new markets. Our direct sales personnel are responsible for managing all direct or indirect sales with specific named accounts and our channel sales personnel are responsible for managing all sales that are not with specific named accounts.
7
In our largest markets, our sales representatives have a vertical industry market focus to more effectively leverage their domain expertise. We establish direct sales groups focused on different industry markets. One group concentrates on the defense and intelligence, scientific research and higher education markets while the second focuses on the commercial business intelligence and data analytics markets. We have developed expertise in a number of vertical industry markets, including weather and climate; physical sciences; life sciences; energy, aerospace and automotive; financial services; internet; and media and entertainment. As part of our emphasis on increased sales within these vertical industry markets, we have a program to identify and develop customer workflows in each of the vertical industry markets. The customer workflows allow us to offer our customers standard solutions that include our hardware, software, storage and professional services.
We have increased our sales and marketing efforts recently in the commercial business intelligence and data analytics markets in an effort to expand our penetration of these markets. We continue to expand our targeted customer base to include all organizations with technical computing requirements, the largest firms through our direct selling force and other firms through our channel partners. Our channel program is designed to work with those partners who provide additional geographic and vertical market coverage for SGI-based solutions. We have created a channel council to increase communication between channel partners and our executive team in order to guide this program.
Marketing
Our marketing organization is active in all markets in which we sell products and services and continuously executes on programs that encompass sales tools, brand awareness and demand generation. The marketing team consists of product marketing, field marketing, corporate marketing and channel marketing. To showcase our solutions, expand our market presence, and enable our sales organization and channel partners to effectively pursue sales opportunities, we create and deliver a number of marketing vehicles including industry tradeshow and event activities, customer forums, webinars, advertisements and promotions, product demonstrations, web content, sales collateral and customer case studies. Our marketing channels include a mix of product-based activities which leverage our hardware and software expertise and industry-based activities which leverage our understanding of customer challenges and applications. Our marketing team also works with industry experts, analysts and members of the press to generate awareness about our products and services. Using our history and experience in the high performance computing community, we issue white papers on technology trends such as performance ratings, benchmark results, power, cooling and system management. We participate in worldwide business and industry events throughout the year as both exhibitors and speakers, thereby maintaining a constant presence with our customers, prospects and industry influencers.
We maintain active programs to encourage independent software development on our solution platforms. Through our Solution Partners Network program we provide software, marketing support, and access to hardware to enable third-party software developers to leverage SGI differentiation and add value. Serving the key independent software vendors (“ISVs”) addressing our target market segments, the program provides ISVs with technical information for developing, porting, tuning and differentiating their applications and opportunities for promoting their SGI-based solutions. We also engage in co-marketing activities with many of our ISVs.
We provide significant marketing support to an active and established base of worldwide channel partners though a comprehensive channel portal and marketing program. We also develop co-marketing partnerships with our major customers and suppliers.
Research and Development
Our research and development organization includes, but is not limited to, hardware design engineers, software engineers, application engineers, benchmarking engineers, and solution engineers. We focus our research and development efforts where we believe we can develop compelling and differentiated solutions to our customers’ most challenging problems, thus growing our share of the markets we participate in. Focus areas in research and development include shared memory computing system architecture; integrated system implementation optimized for space, power, performance, reliability and usability; the Linux development and operating environment; software to differentiate the performance of our computing platforms; storage software to enable better performance, scalability and ease of management of large amounts of data; and innovative solutions that help solve our customer's toughest problems. We have developed cooperative working relationships with many of the world’s most advanced technology companies, such as Intel, to leverage their research and development capabilities. Additionally, we work closely with our customers to develop product innovations and incorporate these into subsequent product design. This cooperative approach allows us to develop products that meet our customers’ needs in a cost-effective manner. We monitor new technology developments, new component availability and the impact of evolving standards through customer and supplier collaboration. From time to time, we accept third-party funding, provided the work being funded is consistent with and contributes to our strategic roadmap.
8
SGI UV System Development. We have invested significantly in the development of application-specific integrated circuits ("ASICs") and interconnect technology in order to extend our leadership in coherent shared-memory systems. The UV shared-memory system based on the latest generation of our NUMAlink interconnect and NUMAflex architecture increases substantially the performance and scalability of our single system image shared-memory products, incorporates hybrid processing elements, and provides optimized features to enhance in-memory application performance on a cluster computing system. We expect these design efforts to propel growth in adoption of the UV platform in technical computing, high performance data analytics, and as solutions to the needs of commercial customers employing in-memory databases for real time enterprise applications.
SGI ICE X System Development. We continue to invest aggressively in the SGI ICE X platform, which offers market leading system configuration flexibility and is based on the InfiniBand interconnect. The focus remains on maintaining the product’s leadership in speed, scalability, and power and thermal efficiencies, while enhancing its flexibility in terms of configurations, topologies, and interconnect technologies. We are also enhancing the product’s reliability, availability, serviceability, and interoperability in our designs.
Storage. We design, develop, and integrate hardware and software solutions for file serving, data management, and data archival for petascale environments. The focus remains to maintain our leadership in speed, scalability, and efficiency (both in power and asset utilization). We design or select “best-in-class” storage hardware such as disk arrays and controllers from OEM suppliers that meet the particular needs of our customers’ applications and environments. Our engineers design software for efficient data access and management of these storage systems and we qualify storage systems ranging from small appliances to enterprise-class storage systems. We tightly integrate the storage software and hardware systems, and we optimize the software in our storage solutions for capacity-driven and performance-driven applications and environments.
Software. Our research and development efforts include the development of software libraries, tools and utilities that facilitate extremely efficient management and operation of our systems, and enable software applications to run faster on our systems. We continue to enhance the SGI Management Center, our premier policy-based software tool for managing high performance, highly scalable technical computing environments, with a focus on accelerated system provisioning, proactive system health management, and system power management at the job level.
Application Engineering and Benchmarking. Our global benchmarking and solutions centers provide a full range of our server and storage hardware and software, integrated in a wide variety of configurations, for applications testing, benchmarking, and performance tuning. At these centers, the highly skilled personnel in our application engineering and benchmarking teams work with end-users to build and optimize large-scale cluster computing systems, conduct proof-of-concept testing, and simulate end-user applications. Through these centers, we also provide demonstrations of the standardized SGI workflow solutions we have developed and are developing for our strategic vertical markets. In addition, the SGI® Global Developer Program provides ISVs, systems integrators, and consultants technical information for developing and porting their applications, as well as access to our online systems to streamline the implementation.
We believe that focused investments in research and development are critical to our future performance and competitiveness in the marketplace. Our investments in this area will directly enhance our current product line and enable the development of new products that will provide differentiated and compelling solutions to the expanding range of challenges faced by our current and prospective customers. The execution of our business strategy relies on continued investment in engineering research and product development.
Manufacturing and Operations
Our sole manufacturing facility, located in Chippewa Falls, Wisconsin, is responsible for worldwide production, supply-chain management and order fulfillment. Our manufacturing operations involve the on-site assembly and testing of high-level subassemblies, subsystems and complete systems, configured to customer specifications. Our consolidated worldwide manufacturing operations increase our control over our supply chain and our inventories. Our manufacturing facility is ISO 9001:2008 certified.
Our supply base is composed of suppliers that meet our rigorous quality and technology standards. We maximize the use of industry-standard components in our products to reduce cost, and we custom design components where we believe that doing so adds value to the customer. We have established close relationships with key suppliers and work closely with them on new product introduction plans, strategic inventories, quality and delivery commitments. We depend on a limited number of key sub-contractors for the production of certain assemblies and multi-source standard components to minimize supply chain risk. Consistent with industry practice, we acquire components through a combination of formal purchase orders, supplier contracts and open orders based on projected demand information. These purchase commitments typically cover our requirements for periods ranging from 30 to 120 days.
9
In July 2013, the Company selected Jabil Circuit, Inc. ("Jabil") to be its primary global manufacturing services and supply chain management provider. The transition to Jabil was expected to be implemented as a “manage in place” model, which utilizes existing SGI facilities and personnel. On November 18, 2013, the Company signed an asset purchase agreement with Jabil, whereby Jabil would purchase SGI’s primary manufacturing facility, located in Chippewa Falls, Wisconsin. During the fourth quarter of fiscal 2014, the Company reevaluated its outsourcing model given lower than anticipated volumes of Company product sales. On August 4, 2014, the Company terminated the planned manage-in-place outsourcing structure and the asset purchase agreement referenced above. The Company agreed to pay approximately $0.6 million to Jabil for certain assets that were purchased for the manage-in-place model as well as for costs associated with streamlining the manufacturing process. The Company will continue to optimize all of its manufacturing capabilities with the objective of improving efficiency and flexibility. See Note 4 "Contract Manufacturing Transition" in our audited financial statements in this Form 10-K for further information on the contract manufacturing transition.
Competition
High performance server and storage markets are highly competitive, with rapid technological advances and constantly improving price/performance ratios. These advances and pricing pressures result in frequent product introductions and short product life cycles. We believe that purchasers make buying decisions based on many factors, including: solution features, performance, and scale, quality and reliability, application availability, ease of system management, customization, price/performance ratios, total cost of ownership and quality customer service and support. We believe we compete effectively in each of these areas by providing differentiated solutions that address the needs of our customers.
The market for our products is highly competitive, dynamic and subject to changing technology, customer needs and new product introductions. In the server market we compete primarily with large, build-to-order vendors of x86 servers based in the United States such as Dell Inc. (“Dell”), Hewlett-Packard Company (“HP”), International Business Machines Corporation (“IBM”), Oracle Corporation (“Oracle”) and Cray, Inc. (“Cray”). In the storage market we compete primarily with Dell, HP, IBM, Oracle, EMC Corporation (“EMC”), NetApp, Inc. (“NetApp”) and Hitachi Data Systems, Inc. (“HDS”). In addition, particularly in the storage market, there are many new companies introducing new products and technology with which we may compete.
Our largest competitors have considerably greater financial, technical, development and sales and marketing resources, broader name recognition and larger customer bases than us. Because a computing system is a substantial investment that can require extensive service and support commitments, company size can have a significant impact on purchase decisions. In addition, large competitors can leverage business lines we do not have to broaden offerings and support deep discounting to gain market share.
Proprietary Rights and Licenses
We rely on a combination of patent, trademark, copyright and trade secret laws and disclosure restrictions to protect our intellectual property rights. We also enter into confidentiality and proprietary rights agreements with our employees, consultants and other third parties. We have 632 granted patents and pending applications in the United States and abroad, and we intend to continue to protect our intellectual property with patents. We also hold various U.S. and foreign trademarks as well as copyrights in our original software. Although we believe the ownership of patents, copyrights, trademarks and service marks, and trade secrets is an important factor in our business and that our success depends in part on ownership rights, we rely primarily on the innovative skills, technical competence and marketing abilities of our personnel to differentiate our products and services within the marketplace.
As is customary in our industry, we license from third-parties a wide range of software, including the Linux, Microsoft CCS and UNIX operating systems, for internal use and use by our customers. We also license various patents and trade secrets of third-parties through agreements such as patent or technology licenses or cross-licenses. We expect the extent of such intellectual property license and cross-license activities may increase as the scope of our product line increases. In some cases, our intellectual property is licensed to third-parties.
10
Our success will depend in part on our ability to protect our intellectual property portfolio and proprietary information. From time to time, we may need to enforce our intellectual property rights through litigation. If a claim is asserted that we have infringed the intellectual property rights of a third-party, we may be required to seek licenses under those intellectual property rights, if available, pay damages and/or redesign our products. If we were to litigate, we would incur significant costs, litigation may be a significant distraction for our management team, and we might not ultimately prevail. Litigation or changes in the interpretation of intellectual property laws could expand or reduce the extent to which we or our competitors are able to protect intellectual property and could require significant changes in product design. Because of technological changes and the extent of issued patents in our industry, it is possible certain components of our products and business methods may unknowingly infringe existing patents of others. Our industry has seen a substantial increase in litigation with respect to intellectual property matters, and we have been engaged in intellectual property disputes as a defendant as well as a plaintiff in efforts to protect our rights. We expect that we will engage in patent infringement litigation from time to time. See Part I, Item 1A. “Risk Factors” in this Annual Report on Form 10-K.
Backlog
We manufacture products based on a combination of specific order requirements and forecasts of our customers’ demand. Orders are generally placed by customers on an as-needed basis. An accepted order can be canceled only with our written consent, and only on terms that will indemnify us against resulting losses, including, but not limited to, any costs already incurred in performing the order. In certain circumstances, purchase orders are subject to change with respect to quantity of product or timing of delivery resulting from changes in customer requirements. We experience some quarterly variability in our product and service revenue in any given period. Factors impacting the amount of product and service revenue in any given period includes deployment time of our larger systems, manufacturing and delivery schedules, changes in delivery schedules requested by our customers and the timing of our product development. Our business is also characterized by intra-quarter variability in demand and varying customer delivery and acceptance schedule. Accordingly, the timing for recognition of our backlog as revenue may be difficult to predict and current levels of backlog may not be a meaningful indicator of future revenue in any given quarter.
Environmental Laws
Our products and certain aspects of our operations are regulated under various environmental laws in the U.S., Europe and other parts of the world. These environmental laws are broad in scope and regulate numerous activities including the discharge of pollutants into the air and water, the management and disposal of hazardous substances and wastes, the cleanup of contaminated sites, the content of our products and the recycling and treatment and disposal of our products. Certain of these laws also pertain to tracking and labeling potentially harmful substances that have been incorporated into our products. These laws require us to know whether certain substances are present in our products, and to what degree. Environmental laws may limit the use of certain substances in our products, or may require us to provide product safety information to our customers if certain substances are present in our products in sufficient quantities. Additionally, we may be required to recycle certain of our products when they become waste. Compliance with environmental laws and regulations across multiple jurisdictions is complex and will require further capital expenditures in future periods, including expenditures for the implementation of new processes in supply chain management and order fulfillment. We believe that these expenditures are necessary to maintain our presence and competitive position in certain markets, including in particular the European Union. No material capital expenditures for environmental control facilities were made in fiscal 2014 and none are planned for the fiscal year ending June 26, 2015 ("fiscal 2015"). See Part I, Item 1A. “Risk Factors” in this Annual Report on Form 10-K.
Employees
As of June 27, 2014, we had over 1,150 employees worldwide. Our future success will require that we continue to retain and motivate highly qualified technical, sales, marketing, finance and management personnel. We have never had a work stoppage, and none of our U.S. employees are represented by a labor union. We have workers’ councils where required by the European Union or other applicable laws. We have employment-related agreements with a number of key employees or where required by applicable law. In general, where permitted by applicable law, employment with the Company is considered "at will" and our employment related agreements are not for a defined term.
Corporate Data
We were originally incorporated as Rackable Corporation and later changed our name to Rackable Systems, Inc. (“Rackable Systems”). Rackable Systems® was incorporated in the state of Delaware in December 2002 in connection with the acquisition of substantially all of the assets and liabilities of Rackable Systems’ predecessor company. On May 8, 2009, we completed the acquisition of substantially all of the assets, excluding certain assets unrelated to the ongoing business, and assumed certain liabilities of Silicon Graphics, Inc. Effective May 18, 2009, Rackable Systems changed its name to Silicon Graphics International Corp.
11
Our website address is www.sgi.com. Our annual reports on Form 10-K, quarterly reports on Form 10-Q, current reports on Form 8-K, and amendments to those reports are available, without charge, on the investor relations section of our website, www.sgi.com, as soon as reasonably practicable after they are electronically filed with or furnished to the SEC. Our Corporate Governance Guidelines, Code of Business Conduct and Ethics and the charters of the Audit Committee, Compensation Committee and Nominating and Corporate Governance Committee of our Board of Directors are also posted on our website at http://investors.sgi.com/. Copies are also available, without charge, from the Corporate Secretary, Silicon Graphics International Corp., 900 North McCarthy Blvd, Milpitas, California, 95035. The information contained in, or that can be accessed through, our website is not incorporated by reference herein.
Executive Officers of the Registrant
Our executive officers, their ages and positions as of September 8, 2014 are as follows:
Name | Age | Position | ||
Jorge Titinger | 53 | Chief Executive Officer, President and Director | ||
Robert Nikl | 59 | Executive Vice President and Chief Financial Officer | ||
Cassio Conceicao | 51 | Executive Vice President & Chief Operating Officer | ||
Jennifer Pileggi | 50 | Senior Vice President, General Counsel and Corporate Secretary | ||
Mekonnen Asrat | 46 | Vice President, Corporate Controller and Principal Accounting Officer | ||
Jorge Titinger joined SGI in February 2012 as our President and Chief Executive Officer and as a member of our board of directors. Previously, Mr. Titinger served as President and Chief Executive Officer of Verigy Ltd. (a company in the semiconductor automated test equipment business) from January 2011 to July 2011, as President and Chief Operating Officer from July 2010 to January 2011 and as Chief Operating Officer from June 2008 to July 2010. Verigy was acquired by Advantest Corporation in July 2011, and from such time until October 2011, Mr. Titinger provided transitional services as President and Chief Executive Officer of Verigy, then a subsidiary of Advantest. Prior to Verigy, Mr. Titinger was Sr. Vice President and General Manager of Product Business Groups at Form Factor, Inc. (a company in the computer chip technology business) from November 2007 to June 2008. Mr. Titinger previously held management positions at KLA-Tencor Corporation (a company in the semiconductor equipment industry), Applied Materials, Inc. (a company involved in the business of semiconductor manufacturing) and Hewlett-Packard Company. Mr. Titinger holds a Bachelor of Science degree in electrical engineering, a Master of Science degree in electrical engineering and a Master of Science degree in engineering management, each from Stanford University.
Robert Nikl joined SGI in May 2012 as our Executive Vice President and Chief Financial Officer. Mr. Nikl served as Executive Vice President and Chief Financial Officer of Verigy Ltd. (a company in the semiconductor automated test equipment business) from June 2006 to October 2011. Verigy was acquired by Advantest Corporation in July 2011. Prior to Verigy, Mr. Nikl was Sr. Vice President and Chief Financial Officer of Asyst Technologies, Inc. (a company in the semiconductor capital equipment business) from September 2004 to June 2006. Mr. Nikl previously held financial management positions at Solectron Corporation (an electronics manufacturing company) and Xerox Corporation and began his career in public accounting at KPMG Peat Marwick. Mr. Nikl is a certified public accountant with active licenses in California and New York and holds an MBA from the University of Connecticut as well as a Bachelor of Business Administration from Pace University in New York.
Cassio Conceicao joined SGI in January 2013 as our Executive Vice President and Chief Operating Officer. Mr. Conceicao has over 25 years of technology industry experience, leading change and continuous improvement across a broad range of business disciplines, such as operations, business development, product development, marketing, engineering and customer service. Prior to SGI, Mr. Conceicao served as Corporate Vice President and General Manager of the Services Business at Applied Materials, Inc. (a global provider of manufacturing equipment to the semiconductor, flat-panel display and solar energy industries) from October 1999 to January 2013. He also previously held the position of Vice President of Operations and Engineering at Kinetics Fluid Systems (a manufacturer of gas delivery systems and components for the semiconductor equipment industry) from April 1997 to October 1999. Mr. Conceicao earned a Bachelor of Science in Electrical Engineering and a Bachelor of Arts in English Literature, both from Stanford University.
12
Jennifer Pileggi joined SGI in September 2011 as our Senior Vice President, General Counsel and Corporate Secretary. Prior to joining SGI, Ms. Pileggi served as Executive Vice President, General Counsel and Corporate Secretary of Con-way Inc. (a global transportation and logistics services company) from December 2004 until June 2011. Ms. Pileggi originally joined Con-way in 1996 and previously served as Vice President and Corporate Counsel for Menlo Worldwide, Con-way's $1.5 billion supply chain management business segment. Ms. Pileggi earned a Bachelor of Arts degree in Art History from Yale University and a Juris Doctorate from New York University School of Law. Ms. Pileggi is a member of the American Bar Association and the California State Bar Association. She served on the board of directors of the California Chamber of Commerce and is a member of the General Counsel Executive Advisory Council of the Bay Area Chapter of the Association of Corporate Counsel.
Mekonnen Asrat joined SGI in June 2012 as our Vice President and Corporate Controller and since August 2012 has served SGI as our Principal Accounting Officer. Previously, Mr. Asrat served as Senior Director, Corporate Controller of Advantest America, Inc., a subsidiary of Advantest Corporation, (a company in the semiconductor automated test equipment business) from March 2011 to June 2012. Prior to that, Mr. Asrat served as Director and Controller at Verigy Ltd. for its Memory Test Solutions business unit, from January 2008 to June 2011 and as Director of SEC Reporting from June 2006 to December 2007. Verigy was acquired by Advantest Corporation in July 2011. Prior to Verigy, Mr. Asrat held a variety of accounting and financial planning and analysis roles at Agilent Technologies, Inc., Hewlett-Packard Company and Ernst & Young LLP. Mr. Asrat is a certified public accountant, actively licensed in California and holds a Master of Professional Accounting degree from the University of Texas at Arlington and a Bachelor of Arts in Economics from the College of William & Mary in Virginia.
13
Item 1A. Risk Factors
Customer Concentration—A relatively small number of customers that purchase our products in large quantities have historically accounted for a significant portion of our revenue. If we are unable to maintain or replace our relationships with such customers and/or diversify our customer base, our revenue may fluctuate or decline and our growth may be limited.
Historically, a significant portion of our revenue has come from a limited number of customers. There can be no guarantee that we will be able to sustain our revenue levels from these customers. For fiscal 2014, our top five customers worldwide accounted for approximately 35% of our total revenue, with the U.S. government, excluding system integrators, accounting for 16%.
This customer concentration increases the risk of quarterly fluctuations in our revenue and operating results. The loss or reduction of business from one or a combination of our significant customers, for example as a result of a customer's capital expenditure budget reductions or U.S. Government spending reductions, could materially adversely affect our revenue, financial condition and results of operations.
U.S. Government Sales—We derive a significant portion of our revenue from customers who directly or indirectly receive funding from the U.S. government. If our U.S. government-related sales decrease, or our ability to do business with the U.S. government or entities funded by the U.S. government is disrupted or limited, our operating performance could be adversely affected.
We generally derive a significant portion of our revenue directly from U.S. government entities, from research institutions funded by the U.S. government, and from system integrators that sell to the U.S. government through our subsidiary, Silicon Graphics Federal, LLC. For fiscal 2014, such sales represented approximately 38% of our total revenue. These sales present risks in addition to those involved in sales to commercial customers, including potential disruptions and delays due to changes in appropriation and spending priorities by the U.S. government. In addition, the U.S. government can terminate or modify its contracts with us at any time for its convenience. A significant reduction in such sales could adversely affect our operating performance.
Our U.S. government business is also subject to specific procurement regulations and a variety of other requirements applicable to companies doing business with the U.S government. Sales to the defense sector require us to comply with additional defense-specific regulations, including maintaining a compliant security program, obtaining security clearances for employees and passing various inspections. Failure to comply with applicable regulations and requirements could lead to our suspension or debarment from U.S. government contracting or subcontracting for a period of time as well as fines against the Company.
Any disruption or limitation in our ability to do business with the U.S. government or entities funded by the U.S. government could materially adversely affect our revenue and operating results.
Strong Competition—We face competition from the leading enterprise computing companies in the world as well as from emerging companies. Some of our competitors have greater name recognition and capital resources than we do. If we are unable to compete effectively, we might not be able to achieve sufficient market penetration, revenue growth or profitability.
The markets for compute server products and storage products are highly competitive. In addition to intensely competitive smaller companies, we face challenges from some of the most established companies in the computer server market, such as Dell Inc., Hewlett-Packard Company ("HP"), International Business Machines Corporation, Cray, Inc. and Oracle Corporation. In the storage market, we compete primarily with EMC Corporation, HP, Hitachi Data Systems, Inc. and NetApp, Inc. Our largest competitors have several advantages over us, such as:
• | substantially greater market presence and greater name recognition; |
• | substantially greater financial, technical, research and development, sales and marketing, manufacturing, distribution and other resources; |
• | longer operating histories; |
• | a broader offering of products and services; |
• | more established relationships with customers, suppliers and other technology companies; and |
• | the ability to acquire technologies or consolidate with other companies in the industry to compete more effectively. |
14
Because these competitors may have greater financial strength than we do and are able to offer a more diversified bundle of products and services, they may have the ability to severely undercut the pricing of our products or provide additional products or servicing at little or no cost, which would make us less competitive or force us to reduce our selling prices, negatively impacting our margins. We have had transactions where one or more competitors undercut our prices causing us to reduce our price, which negatively impacted our gross margin on that transaction and our overall gross margin. In addition, we have, on occasion, lost sales opportunities due to a competitor undercutting the pricing of our products or maintaining superior brand recognition. These competitors may be able to develop products that are superior to the commercially available components that we incorporate into our products, or may be able to offer products that provide significant price advantages over those we offer. For instance, a competitor could use its resources to develop proprietary motherboards with specifications and performance that are superior in comparison with the platforms that are currently available to the marketplace, which could give that competitor a distinct technological advantage. In addition, if our competitors' products become more widely accepted than our products, our competitive position will be impaired.
The intense competition we face in the sales of our products and services and general economic and business conditions can put pressure on us to change our prices. If our competitors offer deep discounts on certain products or services or develop products that the marketplace considers more valuable, we may need to lower prices or offer other favorable terms in order to compete successfully. Any such changes may reduce margins and could adversely affect operating results.
As the enterprise computing industry evolves, we expect to encounter additional competitors, including companies in adjacent technology businesses such as storage and networking infrastructure and management, companies providing technology that is complementary to ours in functionality, such as data center management software, contract manufacturers and other emerging companies that may announce server product offerings. Moreover, our current and potential competitors, including companies with whom we currently have strategic alliances, may establish cooperative relationships among themselves or with other third parties. If this occurs, new competitors or alliances may emerge that could negatively impact our competitive position.
Unproven Go-to-Market Strategy—We lack experience in marketing solutions to large enterprise customers. If we are not successful in increasing sales of our solutions into enterprise customers, our growth opportunities will be limited.
Despite our historical success in growing our revenue from certain agencies of the U.S. government as well as higher education, we have had limited success in broadening our base of enterprise customers. We have modified our go-to-market (GTM) strategy and have invested in sales and marketing personnel and programs to increase penetration of our HPC, Storage and High Performance Data Analytics solutions among enterprise customers. If we are not successful in increasing sales of our solutions into enterprise customers, our growth opportunities may be limited.
Fluctuations in Operating Results—Among other things, the timing of our revenue is primarily dependent upon the funding and implementation schedules of our customers, particularly as it relates to large IT projects where we can have long sales cycles and long build-out and acceptance schedules. Our periodic operating results have fluctuated significantly in the past and will continue to fluctuate in the future, which could cause our stock price to decline.
Our quarterly and annual periodic operating results have fluctuated significantly in the past, and we believe that they will continue to fluctuate in the future, due to a number of factors, many of which are beyond our control. We expect that our revenue, gross margin and earnings per share will fluctuate on a periodic basis in future periods. Factors that may affect our periodic operating results include the following:
• | fluctuations in the buying patterns and sizes of customer orders from one quarter to the next; |
• | increased competition causing us to sell our products or services at low margins; |
• | location and timing requirements for the delivery of our products and services; |
• | lengthy acceptance cycles of our products by certain customers; |
• | development or product delivery delays, and delays in obtaining necessary components from our suppliers, contractual provisions or other reasons; |
• | addition of new customers or loss of existing customers; |
• | gross margin pressures from the sales of products and services due to discounted pricing, especially to our largest customers; |
• | lack of reliability of our estimates to forecast sales and trends in our business to generate a sales pipeline; |
• | uncertainty regarding our sales pipeline and resulting customer contracts; our ability to align our product and service offerings and cost structure with customer needs; |
• | our ability to reduce operating expenses and total costs in procurement, which may involve delays in the anticipated timing of activities related to our cost savings plans and higher than expected or unanticipated costs to implement the plans; |
• | changes in the mix of products sold due to differences in profitability among our products; |
• | write-off of excess and obsolete inventory; |
15
• | impairment and shortening of the useful life of assets; |
• | unexpected changes in the price for, and the availability of, components from our suppliers; |
• | our ability to enhance our products with new and better designs and functionality; |
• | our ability to timely bring new capabilities to market combining our products and technologies with those produced by our strategic partners and OEMs to address new market opportunities; |
• | costs associated with obtaining components to satisfy customer demand; |
• | productivity and growth of our sales force; |
• | actions taken by our competitors, such as new product announcements or introductions or changes in pricing; |
• | market acceptance of newer products, |
• | technology regulatory compliance, certification and intellectual property issues associated with our products; |
• | the payment of unexpected legal fees and potential damages or settlements resulting from protecting or defending our intellectual property or other matters; |
• | the payment of significant damages, settlements or contractual penalties resulting from faulty or malfunctioning products or the provision of services unsatisfactory to our customers; |
• | compliance costs associated with new laws, rules and regulations, including environmental regulations; |
• | the payment of unexpected intellectual property licensing royalties to third parties who successfully assert that our product(s) infringe their intellectual property rights; |
• | the departure and acquisition of key management and other personnel; and |
• | general economic trends, including changes in information technology spending or geopolitical events such as war or incidents of terrorism. |
Lengthy Sales Cycle—Our sales cycle requires us to expend a significant amount of resources, and could have an adverse effect on the amount, timing and predictability of future revenue.
The sales cycle of our products, beginning from our first customer contact to closing of the sale, often ranges from three to six months. We may expend significant resources during the sales cycle and ultimately fail to close the sale. The success of our product sales process is subject to factors over which we have little or no control, including:
• | the timing of our customers' budget cycles and approval processes; |
• | our customers' existing use of, or willingness to adopt, open standard server products, or to replace their existing servers or expand their processing capacity with our products; |
• | the announcement or introduction of competing products; and |
• | established relationships between our competitors and our potential customers. |
We expend substantial time, effort and money educating our current and prospective customers as to the value of our products. Even if we are successful in persuading essential decision makers within our customers' organizations of the benefits of our products, senior management might nonetheless elect not to buy our products after months of sales efforts by our employees or resellers. If we are unsuccessful in closing sales after expending significant resources, our revenue and operating expenses will be adversely affected.
Even if we are successful in closing sales, several large transactions that we have entered into require us to invest cash up front to fund working capital without collecting cash for several periods. If we are unable to negotiate for more favorable cash collection terms in the future, our liquidity and ability to fund our operations could be adversely affected.
International Sales and Operations—The global nature of our operations exposes us to increased risks and compliance obligations, which may adversely affect our business.
During fiscal 2014, 2013 and 2012, we derived approximately 52%, 38% and 41% of our revenue from sales outside of the United States, respectively. Our international business operations require us to recruit and retain qualified technical and managerial employees, manage multiple, remote locations and ensure intellectual property protection outside of the United States. Our international operations subject us to increased risks, including:
• | supporting multiple languages; |
• | recruiting sales and technical support personnel internationally with the skills to design, manufacture, sell and support our products; |
• | complying with governmental regulations, including obtaining required import or export approval for our products; |
• | increased complexity and costs of managing international operations; |
• | increased exposure to foreign currency exchange rate fluctuations; |
• | commercial laws and business practices that favor local competition; |
• | longer sales cycles and manufacturing lead times; |
• | financial risks such as longer payment cycles and difficulties in collecting accounts receivable; |
• | difficulties associated with repatriating cash generated or held abroad in a tax-efficient manner; |
• | ineffective legal protection of intellectual property rights; |
16
• | more complicated logistics and distribution arrangements; |
• | additional taxes and penalties; |
• | inadequate local infrastructure that could result in business disruptions; |
• | global political and economic instability; and |
• | other factors beyond our control such as natural disasters, terrorism, civil unrest, war and infectious diseases. |
If any of the foreign economies in which we do business deteriorate or if we fail to effectively manage our global operations, our business and results of operations would be harmed.
In addition, our global operations are subject to numerous U.S. and foreign laws and regulations, including those related to anti-corruption, tax, corporate governance, imports and exports, financial and other disclosures, privacy and labor relations. These laws and regulations are complex and may have differing or conflicting legal standards, making compliance difficult and costly. If we or our employees, contractors or agents violate these laws and regulations, we could be subject to fines, penalties or criminal sanctions, and may be prohibited from conducting business in one or more countries. Any violation individually or in the aggregate could have a material adverse effect on our operations and financial condition.
Volatile Stock Price—Our stock price in the past has been volatile, and may continue to be volatile or may decline regardless of our operating performance, and investors may not be able to resell shares at or above the price at which they purchased the shares.
Our stock price has experienced high volatility. For example, during fiscal 2014, our stock price fluctuated from a high of $20.79 to a low of $8.30. Investors may not be able to sell shares at or above the price at which they purchase them. The market price of our common stock may fluctuate significantly in response to numerous factors, including without limitation:
• | price and volume fluctuations in the overall stock market; |
• | the financial projections we may provide to the public, any changes in these projections or our failure to meet these projections; |
• | actual or anticipated fluctuations in our operating results; |
• | changes in operating performance and stock market valuations of other technology companies generally, or those that sell enterprise computing products in particular; |
• | changes in financial estimates by any securities analysts who follow our company, our failure to meet these estimates or failure of those analysts to initiate or maintain coverage of our stock; |
• | ratings downgrades by any securities analysts who follow our company; |
• | the public's response to our press releases or other public announcements, including our filings with the SEC; |
• | increases in the total short position in our common stock; |
• | announcements by us or our competitors of significant technical innovations, customer wins or losses, acquisitions, strategic partnerships, joint ventures or capital commitments; |
• | introduction of technologies or product enhancements that reduce the need for our products; |
• | market conditions or trends in our industry or the economy as a whole; |
• | the loss of one or more key customers; |
• | the loss of key personnel; |
• | the development and sustainability of an active trading market for our common stock; |
• | lawsuits threatened or filed against us; |
• | future sales of our common stock by our officers, directors and significant stockholders; and |
• | other events or factors, including those resulting from war, incidents of terrorism or responses to these events. |
In addition, the stock markets, and in particular the NASDAQ Stock Market, have experienced extreme price and volume fluctuations that have affected and continue to affect the market prices of equity securities of many technology companies. Stock prices of many technology companies have fluctuated in a manner unrelated or disproportionate to the operating performance of those companies. In the past, stockholders have instituted securities class action litigation following periods of market volatility. We could become involved in securities litigation in the future, which could have substantial costs and divert resources and the attention of management from our business.
Due to these factors, sales of a substantial number of shares of our common stock in the public market could occur at any time. These sales, or the perception in the market that the holders of a large number of shares intend to sell shares, could reduce the market price of our common stock.
17
Contract Manufacturing-We are dependent on contract manufacturers and partners to assemble and test certain of our products, and our failure to successfully manage our relationships with these contract manufacturers and partners could impair our ability to deliver systems that meet our and/or our customers’ expectations, which could damage our relationships with our customers and decrease our revenue.
We have historically relied on a small number of contract manufacturers and partners to assemble and test certain of our products. None of these third-party contract manufacturers or partners are obligated to perform services or supply products to us for any specific period, or in any specific quantities, except as may be provided in a particular purchase order. For example, we design custom silicon chips for ASICs, but rely on a third-party to manufacture the ASICs for us. None of our contract manufacturers has provided contractual assurances to us that adequate capacity will be available to us to meet future demand for our products.
If we fail to properly manage our relationships with our other contract manufacturers or partners, or if one or more of them are not able to meet our manufacturing or capacity requirements, maintain our high standards of quality or experience delays or disruptions in their service delivery, our ability to deliver quality products to our customers on a timely basis may decline, which would damage our relationships with customers, decrease our revenue and negatively impact our growth.
Channel Sales—We are continuing to develop and execute upon a channel strategy to generate additional sales and revenue, and the failure to successfully expand channel sales might affect our ability to sustain revenue growth and may harm our business and operations.
An increasing portion of our sales strategy is to develop our sales efforts through the use of resellers and other third parties to sell our systems. We may not be successful in building or expanding relationships with these third parties. Further, even if we do develop and expand these relationships, they may conflict with our direct sales efforts in some territories. Ineffective marketing of our products by our resellers or disruptions in our distribution channels could lead to decreased sales or slower than expected growth in revenue and might harm our business and operations.
Foreign Currency Fluctuations—We may experience foreign currency gains and losses.
We have significant exposure to revenue, expenses and certain asset and liability balances denominated in currencies other than the U.S. Dollar. Changes in the exchange rates of major foreign currencies, particularly the Euro, Japanese Yen and British Pound, relative to the U.S. Dollar, can significantly affect revenue and our operating results. Our revenue and operating results are adversely affected when the U.S. Dollar strengthens relative to other currencies and are positively affected when the U.S. Dollar weakens. Although we engage in foreign currency hedging activity, we may be unable to hedge all of our foreign currency risk, which could have a negative impact on our results of operations. For fiscal 2014, 2013 and 2012, our combined revenue from our EMEA and APJ regions was $252.4 million, $270.7 million and $279.2 million, respectively. As of June 27, 2014 and June 28, 2013, the balance in our foreign currency cash accounts was $75.6 million and $54.8 million, respectively. An increase in the value of the U.S. Dollar relative to foreign currencies could make our products more expensive and, thus, not competitively priced in foreign markets. On the other hand, a decrease in the value of the U.S. Dollar relative to foreign currencies could increase our operating costs in foreign locations. In the future, a larger portion of our international revenue may be denominated in foreign currencies, which will subject us to additional risks associated with fluctuations in those foreign currencies. In addition, we may be unable to successfully hedge against any such fluctuations.
In fiscal 2013, we implemented a balance sheet hedging strategy intended to mitigate our currency exposures related to remeasuring monetary assets and liabilities by entering into foreign currency forward contracts that have maturities generally of three month or less. These contracts are used to reduce our risk associated with exchange rate movements, as gains and losses on these contracts are intended to mitigate the effect of exchange rate fluctuations on certain foreign currency denominated balance sheet accounts. In fiscal 2014, we implemented a cash flow hedging strategy and used forward contracts designated as cash flow hedges to hedge a portion of future forecasted non-USD cash flows to further mitigate the effect of exchange rate fluctuations for these currencies.
18
Information Security—We maintain confidential and proprietary information on our computer networks and employ security measures designed to protect this information from unauthorized access. If our security measures are breached and unauthorized access is obtained, we may lose proprietary data and may suffer economic losses.
We maintain confidential information on our computer networks, including information and data that are proprietary to our customers and third parties, as well as to our company. Although we have designed and employed security measures to protect this information from unauthorized access, our security measures may be breached as a result of third-party action, including computer hackers, employee error, malfeasance or otherwise, and result in someone obtaining unauthorized access to our customers' data or our data, including our intellectual property and other confidential business information. Because the techniques employed by hackers to obtain unauthorized access or to sabotage systems change frequently, we may be unable to anticipate these techniques or to implement adequate preventative measures. Any security breach could result in disclosure of our trade secrets or disclosure of confidential customer, supplier or employee data. If this should happen, we could be exposed to potentially significant legal liability, harm to our reputation and other harm to our business.
Export Controls—Our international sales may require export licenses and expose us to additional risks.
Our sales to customers outside the United States are subject to U.S. export regulations. Under these regulations, sales of many of our high-end products require approval and export licenses from the U.S. Department of Commerce. Our international sales would be adversely affected if these regulations were tightened, or if they are not adjusted over time, as technology changes, to reflect the increasing compute performance of our systems. Delay or denial in the approval of any required licenses could make it more difficult to sell to non-U.S. customers. In addition, we could be subject to regulations, fines and penalties for violations of import and export regulations if we were found in violation of these regulations. End users could circumvent end-user documentation requirements that are intended to aid in our compliance with export regulations, potentially causing us to violate these regulations. These violations could result in penalties, including prohibitions from exporting our products to one or more countries, and could materially harm our business, including our sales to the U.S. government.
Cost of Materials—Our products have incorporated or have been dependent upon, open standards, commoditized components and materials that we obtain in spot markets, and, as a result, our cost structure and our ability to respond in a timely manner to customer demand are sensitive to volatility of the market prices for these components and materials.
A significant portion of our cost of revenue is directly related to the pricing of commoditized materials and components utilized in the manufacture of our products, such as memory, hard drives, central processing units (“CPUs”), or power supplies. As part of our procurement model, we generally do not enter into long-term supply contracts for these materials and components, but instead purchase these materials and components in a competitive bid purchase order environment with suppliers or on the open market at spot prices. As a result, our cost structure is affected by the availability and price volatility in the marketplace for these components and materials, including new versions of hard drives and CPUs that are introduced by our suppliers. This volatility makes it difficult to predict expense levels and operating results and may cause them to fluctuate significantly. Further, if we are successful in growing our business, we may not be able to continue to procure components solely on the spot market, which would require us to enter into contracts with component suppliers to obtain these components.
In addition, because our procurement model involves our ability to maintain low inventory and to acquire materials and components as needed, and because we do not enter into long-term supply contracts for these materials and components, our ability to effectively and efficiently respond to customer orders may be constrained by the then-current availability or the terms and pricing of these materials and components. Our industry has experienced component shortages and delivery delays in the past, including a shortage for hard drives related to flooding in Southeast Asia in 2011, which affected hard drive manufacturing facilities. In the future, we may experience other shortages or delays of critical components as a result of strong demand, capacity constraints, supplier financial weaknesses, inability of suppliers to borrow funds in the credit markets, disputes with suppliers (some of whom are also customers), disruptions in the operations of component suppliers, natural disasters, other problems experienced by suppliers or problems faced during the transition to new suppliers.
The price of components may increase due to potential shortages or delays, and we may be exposed to quality issues or the components may not be available at all. We may therefore not be able to secure enough components at reasonable prices or of acceptable quality to build products or provide services in a timely manner in the quantities or according to the specifications needed. Accordingly, our revenue and gross margin could suffer as we could lose time-sensitive sales, incur additional freight costs or be unable to pass on price increases to our customers. If we cannot adequately address supply issues, we may have to reengineer some products or service offerings, resulting in further costs and delays.
19
In order to secure components for the provision of products or services, at times we may enter into non-cancelable commitments with vendors. In addition, we may purchase components strategically in advance of demand to take advantage of favorable pricing or to address concerns about the availability of future components. If we fail to anticipate customer demand properly, a temporary oversupply could result in excess or obsolete components. Further, we compete in an industry that is characterized by rapid technological advances in hardware with frequent introduction of new products. With new product introductions, we face risks in predicting customer demand for the new products as well as the transition from existing products. If we do not make an effective transition from existing products to future products, we could have an oversupply of components. For example, DRAM can represent a significant portion of our cost of revenue, and both the price and availability of various kinds of DRAM are subject to substantial volatility in the spot market. Additionally, if any of our suppliers of CPUs, such as Intel, or GPUs such as, NVIDIA were to increase the costs to us for components we use, we would either pass these price increases on to our customers, which could cause us to lose business from these customers, or we would need to absorb these price increases, which would cause our margins to decrease, either of which could adversely affect our business and financial results.
In addition to the component parts, we currently integrate ASICs in many of our products. The development of an ASIC is costly and may take up to many months to develop. These costs typically are expensed as incurred as research and development costs and will cause volatility in our operating results and may cause them to fluctuate significantly.
Supplier Relationships—If we fail to maintain or expand our relationships with our suppliers, in some cases single-source suppliers, we may not have adequate access to new or key technology necessary for our products, which may impair our ability to deliver leading-edge products.
In addition to the technologies we develop, our suppliers develop product innovations at our direction that are requested by our customers. In many cases, we retain the ownership of the intellectual property developed by these suppliers. Further, we rely heavily on our component suppliers, such as Intel and NVIDIA, to provide us with leading-edge components on time and in accordance with a product roadmap. If we are not able to maintain or expand our relationships with our suppliers or continue to leverage their research and development capabilities to develop new technologies desired by our customers, our ability to deliver leading-edge products in a timely manner may be impaired and we could be required to incur additional research and development expenses.
IT Infrastructure—Unsuccessful deployment of new transaction processing applications and other systems integration issues could disrupt our internal operations and any such disruption could reduce our expected revenue, increase our expenses and damage our reputation.
Portions of our IT infrastructure may experience interruptions, delays or cessations of service or produce errors in connection with systems integration and implementation of new transaction processing applications, including accounting, manufacturing and sales system. We may not be successful in implementing new systems and transitioning data, which could cause business disruptions and be more expensive, time consuming, disruptive and resource-intensive to remediate. Such disruptions could adversely impact our ability to fulfill orders and negatively impact our business or interrupt other processes. Delayed sales, lower margins or lost customers resulting from these disruptions have adversely affected us in the past, and in the future could adversely affect our financial results, public disclosures and reputation.
Dependence on Key Personnel-If we are unable to retain and attract adequate qualified personnel, we may not be able to execute on our business strategy.
During the past few fiscal years, we have experienced significant changes in our management team in the roles of chief executive officer, chief financial officer, chief accounting officer, chief operating officer and head of sales. Our future success depends in large part upon the continued service and enhancement of our management team and our employees. If there are further changes in management, such changes could be disruptive and could negatively affect our operations, our culture and our strategic direction.
Our employees may terminate their employment with us at any time. Our U.S. employees are “at will,” while outside of the U.S., notice or severance may be required if we wish to terminate an employee. The failure of our management team to seamlessly manage employee transitions, or the loss of services of one or more members of our executive management or sales team or other key employees could seriously harm our business. Competition for qualified executives is intense and if we are unable to continue expanding our management team, or successfully integrate new additions to our management team in a manner that enables us to scale our business and operations effectively, our ability to operate effectively and efficiently could be limited or negatively impacted.
20
Additionally, to help attract, retain and motivate certain qualified employees, we use share-based incentive awards such as employee stock options and non-vested share units (restricted stock units). If the value of such stock awards does not appreciate as measured by the performance of the price of our common stock, or if our share-based compensation otherwise ceases to be viewed as a valuable benefit, our ability to attract, retain and motivate employees could be weakened, which could harm our results of operations.
Credit Facility Restrictions—We are subject to restrictions under our credit facility that may result in our inability to engage in favorable business activities or finance future operations or capital needs.
On December 5, 2011, we entered into a five-year senior secured credit facility in the aggregate principal amount of $35.0 million, which amount was increased to $40.0 million on May 1, 2012. On February 25, 2013, the Company amended the agreement and reduced the revolver amount to $25.0 million. The credit facility includes a $10.0 million letter of credit subfacility. The credit facility contains various financial and other covenants that, among other things:
• | require us to maintain a fixed charge coverage ratio (applicable during certain periods); |
• | limit our ability to incur indebtedness, grant liens, or consign inventory; and |
• | require us to obtain the bank's consent prior to selling the Company via a consolidation, merger or transfer of substantially all of our assets. |
Although we can terminate the facility for convenience at any time, such termination would require repayment of any outstanding indebtedness. If we were unable to repay such indebtedness, we could not terminate the facility and we would be subject to its covenants and conditions. As a result of these covenants we may be restricted in the manner in which we conduct our business. In addition, we may be unable to engage in favorable business activities or finance future operations or capital needs, including without limitation, funding acquisitions or repurchasing our stock. This indebtedness may also adversely affect our ability to access sources of capital or incur certain liens. Accordingly, these restrictions may limit our ability to successfully operate our business. A failure to comply with these restrictions could lead to an event of default, which could result in an acceleration of the indebtedness and could adversely affect our cash flow and operating results. If any of the Company's indebtedness is accelerated, the Company may not have sufficient funds available to repay such indebtedness.
Acquisition Strategy—We may not be able to realize the potential financial or strategic benefits of acquisitions that we may complete in the future, or find suitable target businesses or technologies to acquire, which could impair our ability to grow our business, develop new products or sell our products.
If appropriate opportunities present themselves, we may consider acquiring or making investments in companies, assets or technologies that we believe are strategic. Acquisitions are difficult, time consuming and pose a number of risks, including:
• | the acquired products may fail to achieve projected sales or operating margin targets; |
• | the acquired business, asset or technology may not further our business strategy or we may not realize expected synergies or cost savings; |
• | we might overpay for the acquired business, asset or technology; |
• | we might experience difficulties integrating the acquired assets, technologies, operations or personnel or retaining the key personnel of the acquired company; |
• | disruption of ongoing business, including diversion of management's attention; |
• | we might experience difficulties entering and competing in new product or geographic markets in which we are not experienced; |
• | assumption of unknown liabilities, including tax and litigation or problems with product quality, and the related expenses and diversion of resources; |
• | potential downward pressure on operating margins due to lower operating margins of acquired businesses, increased headcount costs and other expenses associated with adding and supporting new products; |
• | potential negative impact on our relationships with customers, distributors and business partners; and |
• | potential negative impact on our earnings per share/negative impact on our earnings resulting from the application of ASC 805, Business Combinations, which became applicable to us in January 2009. |
In addition, if we were to proceed with one or more significant acquisitions or investments in which the consideration included cash, we could be required to use a substantial portion of our available cash. To the extent we issue shares of capital stock or other rights to purchase capital stock, including options and warrants, existing stockholders might be diluted and earnings per share might decrease. In addition, acquisitions and investments may result in the incurrence of debt, large one-time write-offs, such as acquired in-process research and development costs and restructuring charges.
If we do not appropriately manage these risks, any acquisitions that we complete may have an adverse effect on our business and financial condition. Additionally, if we determine that we cannot use or sell the acquired products or technology, we will be required to write down the associated intangible assets, which would negatively impact our operating results.
21
Financial Reporting Risks-We make estimates and assumptions in connection with the preparation of our consolidated financial statements, and any changes to those estimates and assumptions could have a material adverse effect on our results of operations. In addition, changes in accounting standards could also adversely affect our reported operating results.
In connection with the preparation of our consolidated financial statements, we use certain estimates and assumptions based on experience and other factors. Our most critical accounting estimates are described in “Management's Discussion and Analysis of Financial Condition and Results of Operations” in Part II, Item 7 of this Annual Report on Form 10-K. While we believe that these estimates and assumptions are reasonable under the circumstances, they are subject to significant uncertainties, some of which are beyond our control. Should any of these estimates and assumptions change or prove to have been incorrect, it could have a material adverse effect on our results of operations, and we may be required to restate our financial results for prior periods which could cause our stock price to decline.
We prepare our consolidated financial statements in conformity with U.S. Generally Accepted Accounting Principles ("GAAP"). These principles are subject to interpretation by the SEC, the Financial Accounting Standards Board (FASB) and various other bodies formed to interpret and create appropriate accounting principles and guidance. A change in existing principles or guidance can have a significant effect on our reported results and may retroactively affect previously reported results. Additionally, proposed accounting standards could have a significant impact on our operational processes, revenue and expenses, and could cause unexpected financial reporting fluctuations.
Tax Exposure—Unanticipated changes in our tax provisions or exposure to additional income tax liabilities could affect our profitability.
We are subject to income taxes in the United States and numerous foreign jurisdictions. Our tax liabilities are affected by the amounts we charge for inventory, services, funding and other items in intercompany transactions. We are subject to ongoing tax audits in various jurisdictions. Tax authorities may disagree with our intercompany charges, cross-jurisdictional transfer pricing or other matters and assess additional taxes.
We regularly assess the likely outcomes of these audits in order to determine the appropriateness of our tax provision. However, there can be no assurance that we will accurately predict the outcomes of these audits, and the amounts ultimately paid upon resolution of audits could be materially different from the amounts previously included in our income tax expense and therefore could have a material impact on our tax provision, net income and cash flows.
In addition, our effective tax rate in the future could be adversely affected by changes to our operating structure, changes in the mix of earnings in countries with differing statutory tax rates, changes in the valuation of deferred tax assets and liabilities, changes in tax laws and the discovery of new information in the course of our tax return preparation process.
Environmental Laws and Liabilities—Unforeseen environmental costs could impact our future net earnings.
We are subject to various federal, state, local and foreign laws and regulations concerning environmental protection, including laws addressing the discharge of pollutants into the air and water, the management and disposal of hazardous substances and wastes, the cleanup of contaminated sites, the content of our products and the recycling, treatment and disposal of our products. In particular, we face increasing complexity in our product design and procurement operations as we adjust to new and future requirements relating to the chemical and materials composition of our products, their safe use, the energy consumption associated with those products, and climate change laws and regulations. We could incur substantial costs, our products could be restricted from entering certain jurisdictions, and we could face other sanctions, if we were to violate or become liable under environmental laws or if our products become non-compliant with environmental laws. Our potential exposure includes fines and civil or criminal sanctions, third-party property damage, personal injury claims, compliance-related costs and clean-up costs. Further, liability under some environmental laws relating to contaminated sites can be imposed retroactively, on a joint and several basis, and without any finding of noncompliance or fault. The amount and timing of costs under environmental laws are difficult to predict and such costs could have a negative effect on our profitability. If we are found to be in violation of any environmental laws, costs associated with such liability may have an adverse effect on our financial results.
Geographic Business Concentrations—Business disruptions could affect our operating results.
A significant portion of our manufacturing, research and development activities and certain other critical business operations is concentrated in a few geographic areas. We are a highly automated business and a disruption or failure of our systems could cause delays in completing sales and providing services. A major earthquake, fire, tornado or other catastrophic event that results in the destruction or disruption of any of our critical business or information technology systems could severely affect our ability to conduct normal business operations and, as a result, our future operating results could be materially and adversely affected.
22
Further, we maintain a program of insurance coverage for various types of property, casualty and other risks. We place our insurance coverage with various carriers in numerous jurisdictions. However, there is a risk that a claim may go unpaid, such as in the event of a widespread catastrophic event that materially affects the resources of our insurer. The types and amounts of insurance that we obtain vary from time to time and from location to location, depending on availability, cost and our decisions with respect to risk retention. The policies are subject to deductibles and exclusions that result in our retention of a level of risk on a self-insurance basis. Losses not covered by insurance may be substantial and may increase our expenses, which could harm our results of operations and financial condition.
Weak Global Economy—Weak or unstable global market and economic conditions may have serious adverse consequences on our business.
The global economy has experienced significant uncertainty, stock market volatility, tightened credit markets, concerns about both deflation and inflation, reduced demand for products, lower consumer confidence, reduced capital spending, liquidity concerns and business insolvencies. Declines and uncertainty about economic conditions could negatively impact our customers' businesses, causing our customers to postpone their decision-making or decrease their spending or affecting our customers' ability to pay for our products, which would harm our operating results. In addition, if one or more of our current service providers, manufacturers and other partners go out of business, it could directly affect our ability to attain our operating goals on schedule and on budget.
If the global economy experiences uncertainty, our ability to obtain credit on favorable terms could be jeopardized. Failure to secure any necessary financing in a timely manner and on favorable terms could have a material adverse effect on our financial performance and stock price and could require us to change our business plans. Furthermore, should any of our banking partners declare bankruptcy or otherwise default on their obligations, it could adversely affect our financial results and our business.
Intellectual Property Enforcement—If we are unable to protect our intellectual property adequately, we may not be able to compete effectively.
Our intellectual property is critical to our success and our ability to compete. If we fail to protect our intellectual property rights adequately, our competitors might gain access to our technology. Unauthorized parties may attempt to copy or otherwise obtain and use our proprietary technology despite our efforts to protect our intellectual property. In addition, we license our technology and intellectual property to third parties, including in some cases, our competitors, which could under some circumstances make our patent rights more difficult to enforce. Third parties could also obtain licenses to some of our intellectual property as a consequence of a merger or acquisition. Also, our participation in standard setting organizations or industry initiatives may require us to license our patents to other companies that adopt certain standards or specifications. As a result of such licensing, our patents might not be enforceable against others who might otherwise be infringing those patents and the value of our intellectual property may be impaired.
Monitoring unauthorized use of our technology is difficult, and we cannot be certain that the steps we have taken will prevent unauthorized use of our technology, particularly in foreign countries where the laws may not protect our proprietary rights as fully as the laws of the United States. Any claims or litigation that we have initiated or that we may initiate in the future to protect our proprietary technology could be time consuming and expensive and divert the attention of our technical and management resources whether or not the claims or litigation are decided in our favor. Litigation is inherently uncertain, and there is no assurance that any litigation we initiate will have a successful outcome. Enforcing our rights could subject us to claims that the intellectual property right is invalid, is otherwise not enforceable, or is licensed to the party against whom we are asserting a claim. Also, assertion of our intellectual property rights could result in the other party seeking to assert alleged intellectual property rights of its own or assert other claims against us, which could harm our business.
We currently have numerous patents issued and a number of patent applications pending in the United States and other countries. These patents may be limited in value in asserting our intellectual property rights against more established companies in the computer technology sector that have sizable patent portfolios and greater capital resources. In addition, patents may not be issued from these patent applications, and even if patents are issued, they may not benefit us or give us adequate protection from competing products. For example, issued patents might be circumvented or challenged, and could be declared invalid or unenforceable. Moreover, if other companies develop unpatented proprietary technology similar to ours or competing technologies, our competitive position will be weakened.
23
Intellectual Property Risks—If we are found to have violated the intellectual property rights of others, we could be required to indemnify our customers, resellers or suppliers, redesign our products, pay significant royalties and enter into license agreements with third parties.
Our industry is characterized by a large number of patents, copyrights, trade secrets and trademarks and by frequent litigation based on allegations of infringement or other violation of intellectual property rights. As we continue our business, expand our product lines and our product functionality, and expand into new jurisdictions around the world, third parties may assert that our technology or products violate their intellectual property rights. Because of technological changes and the extent of issued patents in our industry, it is possible that certain components of our products and business methods may unknowingly infringe existing patents of others. Any claim, regardless of its merits, could be expensive and time consuming to defend against. Such claims would also divert the attention of our technical and management resources. Successful intellectual property claims against us could result in significant financial liability, impair our ability to compete effectively, or prevent us from operating our business or portions of our business. In addition, resolution of claims may require us to redesign our technology, to obtain licenses to use intellectual property belonging to third parties, which we may not be able to obtain on reasonable terms or at all, to cease using the technology covered by those rights, and to indemnify our customers, resellers or suppliers. Any of these events could result in unexpected expenses, negatively affect our competitive position and materially harm our business, financial condition and results of operations.
In addition, we are also subject to risks related to ownership of our patentable inventions as a result of recent changes in U.S. patent law under the America Invents Act (“AIA”). As a result of the AIA, the United States is now a “first-to-file” system. For any patent applications that are filed on or after March 16, 2013 and that do not otherwise properly claim the benefit of an application filed before that March 16, 2013 date, said applications will be subject to the new “first-to-file” requirements versus the “first-to-invent” standard of law that existed prior to that date. Accordingly, with respect to patent applications filed on or after March 16, 2013, even if we are the first to invent, we will not obtain ownership of an invention unless we are the first to file a patent application or can establish that such an earlier filing is derived from a previous public disclosure of our inventive work. If we are the first to invent but not the first to file a patent application, we will not be able to fully protect our intellectual property rights and may be found to have violated the intellectual property rights of others if we continue to operate in the absence of a patent issued to us. If we are not the first to file one or more patent applications to protect our intellectual property rights when the new patent regime becomes effective, we may be required to redesign our technology, cease using the related technology or attempt to license rights from another party, any of which could materially harm our business, financial condition and results of operations.
Open Source Software-Our use of open source and third-party software could limit our sales and growth opportunities and impose unanticipated conditions or restrictions on our ability to commercialize our products.
We incorporate open source software into our products. A majority of the server systems that we sold in fiscal 2014, 2013 and 2012 ran on the Linux® operating system. Products based on the Linux operating system and sold by other software vendors have been the subject of intellectual property infringement litigation, including litigation by Microsoft Corporation. It is possible that a party could prove a claim for proprietary rights in the Linux operating system or other programs developed and distributed under the GNU General Public License or other open source software licenses. In addition, the GNU General Public License has itself been, and may be in the future, a subject of litigation, and it is possible that a court could hold these licenses to be unenforceable in that litigation. Any ruling by a court that the Linux operating system or significant portions of it may not be copied, modified or distributed, that users or distributors of Linux must pay royalties to Microsoft or others or that these licenses are not enforceable could also impede broader Linux adoption and materially harm our ability to sell our products based on the Linux operating system. Further, because potential customers have often invested significant capital and other resources in existing systems, many of which run mission-critical applications, customers may be hesitant to make dramatic changes to their data center systems. The failure of our customers and potential customers to purchase and adopt open standard-based technologies could have a material adverse impact on our ability to maintain or generate additional revenue.
In addition, open source software is made available to us and to the public by its authors or other third parties under licenses that impose certain obligations on licensees in the event those licensees re-distribute or make derivative works of the open source software. The terms of many open source licenses have not been interpreted by United States or other courts, and these licenses could be construed in a manner that imposes unanticipated conditions or restrictions on our ability to commercialize our products. In this event, we could be required to seek licenses from third parties in order to continue offering our products, to make generally available, in source code form, proprietary code that links to certain open source modules, to re-engineer our products, or to discontinue the sale of our products if re-engineering could not be accomplished on a timely basis, any of which might harm our business, operating results and financial condition.
24
Litigation—Adverse litigation results could affect our business.
We may be subject to legal claims or regulatory matters involving consumer, stockholder, competition and other issues on a global basis. Litigation can be lengthy, expensive and disruptive to our operations, and results cannot be predicted with certainty. An adverse decision could include monetary damages or, in cases for which injunctive relief is sought, an injunction prohibiting us from manufacturing or selling one or more of our products. If we were to receive an unfavorable ruling on a matter, our business, operating results or financial condition could be materially harmed. Additional information regarding legal matters is discussed under "Legal Proceedings" in Part I, Item 3 of this Annual Report on Form 10-K.
Global Restructuring—We may not fully realize the anticipated positive impacts to future financial results from our restructuring efforts.
While we have undertaken restructuring efforts to streamline operations and reduce operating expenses, we may undertake additional restructuring efforts or other cost reduction measures in the future. Our ability to achieve the anticipated cost savings and other benefits from our restructuring efforts and costs reduction measures within expected time frames is subject to many estimates and assumptions, and may vary materially based on factors such as negotiations with third parties. These estimates and assumptions are subject to significant economic, competitive and other uncertainties, some of which are beyond our control. There can be no assurance that we will fully realize the anticipated positive impacts to future financial results from our current or future restructuring efforts and cost reduction measures. If our estimates and assumptions are incorrect or if other unforeseen events occur, we may not achieve the cost savings expected from such actions, and our business and results of operations could be adversely affected.
Internal Controls—If we are unable to maintain effective internal control over financial reporting in the future, the accuracy and timeliness of our financial reporting may be adversely affected.
Effective internal controls over financial reporting are necessary for us to provide reliable financial reports and effectively prevent fraud. As a publicly traded company we must maintain effective disclosure controls and procedures and internal control over financial reporting, which can be difficult to do. A company's internal control over financial reporting is a process designed to provide reasonable assurance regarding the reliability of financial reporting and the preparation of financial statements for external purposes in accordance with generally accepted accounting principles.
A failure to have effective internal controls and procedures for financial reporting in place could result in a restatement of our financial statements, impact our ability to accurately report financial information on a timely basis, make it difficult or impossible to obtain an audit of our financial statements or result in a qualification of any such audit. Any such event could lead to a loss of market confidence in our financial statements, delisting from the NASDAQ Global Select Market, loss of financing sources, and litigation, any of which could adversely affect our stock price.
Corporate Governance—We are subject to evolving corporate governance and public disclosure regulations that have increased both our compliance costs and the risk of noncompliance, which could have an adverse effect on our stock price.
We are subject to changing rules and regulations promulgated by a number of governmental and self-regulated organizations, including the SEC, the NASDAQ Global Select Market and the FASB. These rules and regulations continue to evolve in scope and complexity and many new requirements have been created in response to laws enacted by Congress, making compliance more difficult and uncertain. Our efforts to comply with new regulations have resulted in, and are likely to continue to result in, increased general and administrative expenses and a diversion of management time and attention from revenue-generating activities to compliance activities.
Anti-takeover Provisions—Some provisions in our certificate of incorporation and bylaws may deter third parties from acquiring us.
Our certificate of incorporation and bylaws contain provisions that may make the acquisition of our company more difficult without the approval of our board of directors, including the following:
• | limitations on persons authorized to call a special meeting of stockholders; |
• | our stockholders may take action only at a meeting of stockholders and not by written consent; |
• | our certificate of incorporation authorizes undesignated preferred stock, the terms of which may be established and shares of which may be issued without stockholder approval; and |
• | advance notice procedures required for stockholders to nominate candidates for election as directors or to bring matters before an annual meeting of stockholders. |
25
These anti-takeover defenses could discourage, delay or prevent a transaction involving a change in control of our company. These provisions could also discourage proxy contests and make it more difficult for stockholders to elect directors of their choosing and cause us to take other corporate actions they desire.
Conflict Minerals Risks—We are subject to the SEC's rules regarding the use and disclosure of conflict minerals, which we expect will increase our operating and compliance costs and could potentially harm our reputation, causing a decline in our stock price.
The SEC adopted its final rule implementing Section 1502 of the Dodd-Frank Wall Street Reform and Consumer Protection Act concerning conflict minerals in August 2012. The objective of the rule is to reduce funding for armed groups that are abusing human rights in the "conflict region" as defined in the final rule. This new rule requires us to: (1) determine whether conflict minerals (tin, tantalum, tungsten, gold or similar derivatives) are used in our products and, if so, determine if the minerals originated from the Democratic Republic of Congo (DRC) or its immediately adjoining countries; and (2), if so, conduct due diligence regarding the source and chain of custody of these conflict minerals to determine whether the conflict minerals financed or benefitted armed groups. The rule requires us to submit forms and reports to the SEC annually that disclose our determinations and due diligence measures. We are currently conducting conflict minerals due diligence with our supply chain partners. Presently, we have not determined how many or if any of our supply chain partners use conflict minerals or how much expense our due diligence exercise will add to our operational cost. If we do not properly assess supply chain partners and appropriately control costs and budget for conflict minerals compliance, our results of operations and profitability in the future could suffer, our reputation could be harmed and our stock price could suffer as a result.
Item 1B. Unresolved Staff Comments
Not applicable.
Item 2. Properties
Our properties consist of leased and owned facilities used for manufacturing, warehouse, sales and marketing, research and development, services and support and administrative purposes worldwide. As of June 27, 2014, we owned and leased approximately 624,000 square feet of space in our domestic and international locations. We owned approximately 43% of this space and leased the remaining approximately 57%.
Approximately 87% of our owned and leased properties are located in the United States. These domestic locations are primarily located in Milpitas, California, which is our corporate headquarters, and in Chippewa Falls, Wisconsin, which is where our manufacturing and warehouse facilities are located. Our international locations, which comprise approximately 13% of all our properties, are mainly located in Tokyo, Japan, Paris, France, Munich, Germany, and Winnersh, United Kingdom. Our international properties are primarily used for sales, services, research and development and administrative offices.
We believe that our existing properties are in good condition, are suitable for the conduct of our business, and appropriately support our current business needs.
Item 3. Legal Proceedings
We are involved in various legal proceedings and disputes that arise in the normal course of business. These matters include product liability actions, patent infringement actions, contract disputes, domestic and international federal, state and local tax reviews and audits and other matters. We may also be subject to litigation and/or adverse rulings or judgments as a result of certain contractual indemnification obligations. We do not know whether we will prevail in these matters, nor can we assure that any remedy or resolution will be reached on commercially reasonable terms, if at all. We intend to defend ourselves vigorously in these actions. Based on currently available information, we believe that we have meritorious defenses and that the resolution of these cases, individually or in the aggregate, is not likely to have a material adverse effect on our business, financial condition or future results of operations. We record a liability when it is both probable that a liability has been incurred and the amount of the loss can be reasonably estimated. These provisions are reviewed at least quarterly and adjusted to reflect the impacts of negotiations, settlements, rulings, advice of legal counsel and other information and events pertaining to a particular case.
From time to time, we may be involved in litigation or other legal proceedings relating to claims arising out of our day-to-day operations or otherwise. Litigation is inherently uncertain, and we could experience unfavorable judgments or rulings in the future. Should we experience an unfavorable judgment or ruling, there exists the possibility of a material adverse impact on our financial condition, results of operations, cash flows or on our business for the period in which the judgment or ruling occurs and/or future periods.
26
Item 4. Mine Safety Disclosures
Not applicable.
27
PART II
Item 5. Market for Registrant’s Common Equity, Related Stockholder Matters and Issuer Purchase of Equity Securities
Market Information
Our common stock is listed on the NASDAQ National Market under the symbol “SGI". The following table sets forth for the periods indicated the high and low sale prices of our common stock, as reported by the NASDAQ Markets.
Fiscal Year Ending June 27, 2014 | High | Low | ||||||
Fourth Quarter | $ | 13.34 | $ | 8.30 | ||||
Third Quarter | 14.06 | 12.00 | ||||||
Second Quarter | 16.35 | 11.59 | ||||||
First Quarter | 20.79 | 13.58 | ||||||
Fiscal Year Ending June 28, 2013 | High | Low | ||||||
Fourth Quarter | $ | 15.10 | $ | 11.83 | ||||
Third Quarter | 15.93 | 9.95 | ||||||
Second Quarter | 10.64 | 7.47 | ||||||
First Quarter | 9.49 | 5.97 | ||||||
Holders
As of August 29, 2014, there were 34,609,203 shares of our common stock outstanding. As of August 29, 2014, we had nine registered holders of record of our outstanding common stock. A substantially greater number of holders of our outstanding common stock are “street name” or beneficial holders, whose shares are held of record by banks, brokers and other financial institutions.
Dividends
We have never declared or paid any dividends on our capital stock and our current credit facility restricts our ability to declare or pay dividends. We currently intend to retain any future earnings to fund the development and expansion of our business, and therefore we do not anticipate paying cash dividends on our common stock in the foreseeable future.
Recent Sale of Unregistered Securities
None
Issuer Purchases of Equity Securities
The following table summarizes the activity related to stock repurchases during the fourth quarter ended June 27, 2014:
Issuers Repurchases of Equity Securities | ||||||||||
(in thousands, except per share amounts) | ||||||||||
Total Number of Shares Purchased | Weighted Average Price Paid Per Share | Total Number of Shares Purchased as Part of Publicly Announced Plans or Programs | Maximum Amount That May Yet Be Purchased Under the Plans or Programs | |||||||
Mar. 29, 2014 - Apr. 25, 2014 | — | N/A | — | $19,176 | ||||||
Apr. 26, 2014 - May 23, 2014 | 223 | $9.52 | 223 | $17,050 | ||||||
May 24, 2014 - Jun. 27, 2014 | 95 | $8.67 | 95 | $16,235 | ||||||
Total | 318 | $9.26 | 318 | $16,235 | ||||||
In January 2013, the Company's board of directors approved a plan for the Company to repurchase shares of its common stock with a market value of up to $15.0 million. In November 2013, the Company announced an increase in the authorized repurchase amount to $30.0 million. The Company's common stock may be repurchased in the open market or through negotiated transactions, including 10b5-1 trading plans that would enable the Company to repurchase its shares during periods
28
outside of its normal trading windows. The repurchase program expires December 31, 2014. Purchases will cease if the authorized funds are spent or the program is discontinued. The Company is not obligated to acquire any particular amount of stock, and the program may be suspended or terminated at any time at the Company's discretion. These repurchases are reflected in our balance sheet as treasury stock and are available for future issuance
During fiscal year 2014, the Company repurchased approximately 898,000 shares of its common stock for approximately $11.0 million. Since the inception of the repurchase plan in January 2013, the Company has repurchased approximately 1,095,000 shares of its common stock for $13.8 million. As of June 27, 2014, the Company had a remaining authorization of $16.2 million for future share repurchases.
29
Performance Graph (1)
The following graph shows the cumulative total stockholder return of an investment of $100 in cash at market close on June 26, 2009 through market close on June 27, 2014, for (i) our common stock, (ii) the NASDAQ Composite Index and (iii) the RDG Technology Composite Index. Pursuant to applicable SEC rules, all values assume reinvestment of the full amount of all dividends; however, no dividends have been declared on our common stock to date. The stockholder return shown on the graph below is not necessarily indicative of future performance, and we do not make or endorse any predictions as to future stockholder returns.
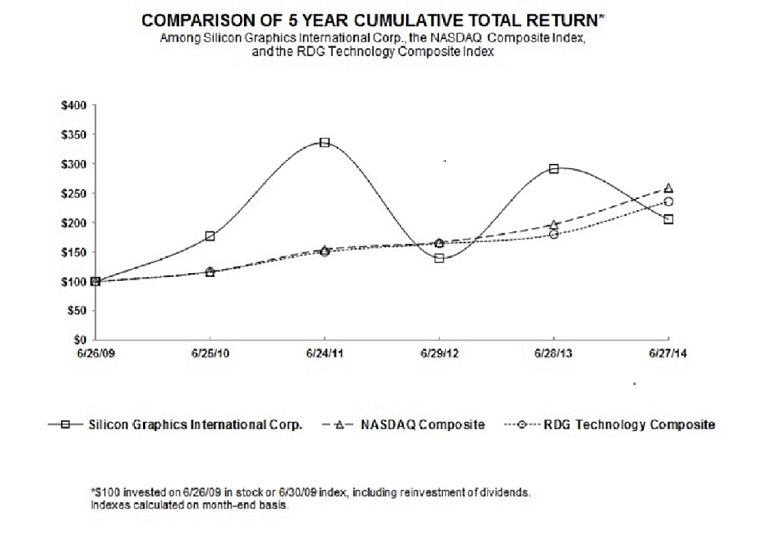
6/26/2009 | 6/25/2010 | 6/24/2011 | 6/29/2012 | 6/28/2013 | 6/27/2014 | |||||||||||||
Silicon Graphics International Corp. | 100.00 | 177.07 | 336.03 | 140.17 | 292.14 | 206.55 | ||||||||||||
NASDAQ Composite | 100.00 | 117.06 | 154.79 | 167.05 | 197.48 | 259.41 | ||||||||||||
RDG Technology Composite | 100.00 | 116.59 | 150.95 | 164.67 | 180.09 | 236.65 | ||||||||||||
(1) | This graph and data are not “soliciting material,” are not deemed “filed” with the SEC and are not to be incorporated by reference in any filing of Silicon Graphics International Corp. under the 1933 Act or the 1934 Act whether made before or after the date hereof and irrespective of any general incorporation language in any such filing. |
30
Item 6. Selected Financial Data
The following selected summary consolidated financial data should be read in conjunction with Part II, Item 8. “Financial Statements and Supplementary Data,” and with Part II, Item 7. “Management’s Discussion and Analysis of Financial Condition and Results of Operations” in this Annual Report on Form 10-K.
Fiscal Year Ended | ||||||||||||||||||||
June 27, 2014 | June 28, 2013 | June 29, 2012 | June 24, 2011 | June 25 2010 | ||||||||||||||||
(in thousands, except per share amounts) | ||||||||||||||||||||
Revenue | $ | 529,946 | $ | 767,227 | $ | 752,987 | $ | 629,568 | $ | 403,717 | ||||||||||
Gross profit (1) | 138,407 | 189,052 | 193,817 | 169,812 | 89,589 | |||||||||||||||
Loss from continuing operations before income taxes (2) | (52,802 | ) | (15,443 | ) | (23,460 | ) | (19,991 | ) | (93,302 | ) | ||||||||||
Income tax provision (benefit) from continuing operations | 12 | (12,623 | ) | 1,001 | 1,242 | (4,441 | ) | |||||||||||||
Net loss from continuing operations | (52,814 | ) | (2,820 | ) | (24,461 | ) | (21,233 | ) | (88,861 | ) | ||||||||||
Income from discontinued operations | — | — | — | — | 409 | |||||||||||||||
Income tax benefit from discontinued operations | — | — | — | — | — | |||||||||||||||
Income from discontinued operations, net of tax | — | — | — | — | 409 | |||||||||||||||
Net loss | $ | (52,814 | ) | $ | (2,820 | ) | $ | (24,461 | ) | $ | (21,233 | ) | $ | (88,452 | ) | |||||
Basic and dilutive net (loss) income per share: | ||||||||||||||||||||
Continuing operations | (1.54 | ) | (0.09 | ) | (0.77 | ) | (0.69 | ) | (2.95 | ) | ||||||||||
Discontinued operations | — | — | — | — | 0.01 | |||||||||||||||
$ | (1.54 | ) | $ | (0.09 | ) | $ | (0.77 | ) | $ | (0.69 | ) | $ | (2.94 | ) | ||||||
Shares used in computing basic and diluted net (loss) income per share: | 34,260 | 32,909 | 31,653 | 30,608 | 30,130 | |||||||||||||||
June 27, 2014 | June 28, 2013 | June 29, 2012 | June 24, 2011 | June 25 2010 | ||||||||||||||||
(in thousands) | ||||||||||||||||||||
Consolidated Balance Sheet Data: | ||||||||||||||||||||
Cash and cash equivalents | $ | 109,297 | $ | 175,181 | $ | 104,851 | $ | 139,868 | $ | 129,343 | ||||||||||
Working capital | 57,470 | 130,866 | 112,960 | 133,970 | 124,495 | |||||||||||||||
Total assets | 364,938 | 407,853 | 496,880 | 538,009 | 497,212 | |||||||||||||||
Total liabilities | 282,786 | 277,599 | 385,988 | 414,723 | 362,283 | |||||||||||||||
Total stockholders’ equity | 82,152 | 130,254 | 110,892 | 123,286 | 134,929 | |||||||||||||||
(1) | Gross profit includes the following items: |
Fiscal Year Ended | ||||||||||||||||||||
June 27, 2014 | June 28, 2013 | June 29, 2012 | June 24, 2011 | June 25 2010 | ||||||||||||||||
(in thousands) | ||||||||||||||||||||
Share-based compensation | $ | 1,676 | $ | 1,598 | $ | 1,358 | $ | 685 | $ | 691 | ||||||||||
Impairment of investments and long-lived assets | $ | 2,946 | $ | — | $ | — | $ | — | $ | — | ||||||||||
31
(2) | Loss from continuing operations before income taxes includes the following items: |
Fiscal Year Ended | ||||||||||||||||||||
June 27, 2014 | June 28, 2013 | June 29, 2012 | June 24, 2011 | June 25 2010 | ||||||||||||||||
(in thousands) | ||||||||||||||||||||
Share-based compensation | $ | 11,979 | $ | 10,100 | $ | 10,061 | $ | 5,898 | $ | 4,827 | ||||||||||
Restructuring charges | 1,251 | 9,048 | 2,469 | 5,072 | 5,213 | |||||||||||||||
Acquisition-related | — | — | — | 1,271 | (3,264 | ) | ||||||||||||||
Impairment of investments and long-lived assets | 2,946 | 189 | 527 | — | — | |||||||||||||||
Total charges | $ | 16,176 | $ | 19,337 | $ | 13,057 | $ | 12,241 | $ | 6,776 | ||||||||||
32
ITEM 7A. Quantitative and Qualitative Disclosures About Market Risk
In the normal course of business, our financial position is routinely subject to a variety of risks, including market risk for investments associated with interest rate movements, liquidity risks, credit risks and foreign exchange market risk associated with currency rate movements on non-U.S. dollar denominated assets and liabilities. We regularly assess these risks and have established policies and business practices to protect against the adverse effects of these and other potential exposures.
Investment Risk
We invest our excess cash in various fixed-income securities and money market funds. The primary objectives of our investment activities are to preserve principal and maintain short-term liquidity while maximizing the income we receive from our investments. The market value of these securities can vary depending upon prevailing interest rates, and if we were forced to liquidate our position in a security before its maturity date we could suffer loss of principal. We also are exposed to credit and liquidity risk related to these securities. If the issuer of a security were to default on its obligations, we would suffer loss of principal. If there were disruptions in the pricing and trading of securities in the financial markets, it is possible that there would not be a liquid market for our securities, which could limit our ability to meet cash requirements. To preserve principal and maintain short-term liquidity, our investment policy dictates that we maintain our portfolio of cash, cash equivalents, and investments in high credit quality, readily liquid securities, of relatively short duration. Our portfolio of investments have a range of original maturities and typically have average remaining maturities of less than two years.
We actively monitor market conditions and developments specific to the securities and security classes in which we invest. We believe that we take a conservative approach to investing our funds in that we invest only in highly-rated securities with relatively short maturities. While we believe we take prudent measures to mitigate investment related risks, such risks cannot be fully eliminated as there are circumstances outside of our control that could have a material adverse affect on our financial position.
Interest Rate Risk
Our exposure to market risks for changes in interest rates relates primarily to our investment portfolio. As of June 27, 2014, our cash and cash equivalents of $109.3 million consisted primarily of cash and money market funds. We believe that the exposure of our principal to interest rate risk is minimal, although our future interest income is subject to reinvestment risk.
Given the short term nature of our cash and cash equivalents, the risk of loss in fair value resulting from interest rate changes is minimal.
Foreign Exchange Risk
As of June 27, 2014 and June 28, 2013, foreign currency cash accounts totaled $75.6 million and $54.8 million, respectively, primarily in Japanese Yen, Canadian dollars, British Pound, and the Euro.
Foreign currency risks are associated with our cash and cash equivalents, investments, receivables and payables denominated in foreign currencies. Fluctuations in exchange rates will result in foreign exchange gains and losses on these foreign currency assets and liabilities, which are included in other income, net in our consolidated statements of operations. Our exposure to foreign currency exchange rate risk relates to sales commitments, anticipated sales, purchases and other expenses and assets and liabilities denominated in foreign currencies. For most currencies, we are a net receiver of the foreign currency and are adversely affected by a stronger U.S. dollar relative to the foreign currency. In fiscal 2013, we implemented a balance sheet hedging strategy that is intended to mitigate our currency exposures related to remeasuring monetary assets and liabilities by entering into foreign currency forward contracts that have maturities generally of one month or less. These contracts are used to reduce our risk associated with exchange rate movements, as gains and losses on these contracts are intended to mitigate the effect of exchange rate fluctuations on certain foreign currency denominated balance sheet accounts. In fiscal 2014, we implemented a cash flow hedging strategy and used forward contracts designated as cash flow hedges to hedge a portion of future forecasted non-USD cash flows to further mitigate the effect of exchange rate fluctuations for these currencies.
We assessed the risk of loss in fair values from the impact of hypothetical changes in foreign currency exchange rates. For foreign currency exchange rate risk, a 10% increase or decrease of foreign currency exchange rates against the U.S. dollar with all other variables held constant would have resulted in a $7.6 million change in the value of our foreign currency cash accounts as of June 27, 2014.
33
ITEM 7. Management’s Discussion and Analysis of Financial Condition and Results of Operations
The following discussion should be read in conjunction with, and is qualified in its entirety by reference to, our consolidated financial statements and the related notes included elsewhere in this Annual Report on Form 10-K. The discussions in this section contain forward-looking statements that involve risks and uncertainties, and actual results could differ materially from those discussed below. See “Item 1A—Risk Factors” and “Cautionary Statement Regarding Forward-Looking Information” at the beginning of this Annual Report on Form 10-K for a discussion of these risks and uncertainties.
Overview
Business Summary
SGI is a global leader in high performance computing ("HPC"). We are focused on helping customers solve their most demanding business and technology challenges by delivering high performance computing and data analytics solutions that accelerate time to discovery, innovation and profitability.
We develop, market and sell a broad line of low cost, mid-range and high-end scale-out and scale-up servers, enterprise-class storage hardware, differentiating software and designed-to-order solutions for large-scale deployments, coupled with global support and highly experienced professional services. SGI solutions are designed to provide greater flexibility and scalability, with lower total cost of ownership.
SGI solutions are utilized by scientific, business and government communities to fulfill highly data intensive application needs in petascale environments. Delivering industry-leading computing power and fast and efficient data movement, both within the computing system and to and from large-scale data storage installations, SGI systems enable customers to access, analyze, transform, manage and visualize information in real and near real-time.
Our goal is to accelerate time to results in key markets including federal government, defense and strategic systems, weather and climate, physical and life sciences, energy (including oil and gas), aerospace, automotive, internet, financial services, media and entertainment and cloud services.
SGI expects market growth in our core markets of high performance computing and storage and real time analytic. We believe that these are the markets that will provide the biggest growth opportunity and where we expect to gain share. We are continuing to target our investments towards key vertical markets and horizontal solutions where we can provide the highest value to our customers and differentiate our offerings and will focus on winning large strategic projects. We have a strong suite of products and a go-to-market strategy aligned with these growing opportunities. During fiscal 2014, we have introduced new configurations for our Rackable, ICE X and UV compute platforms. During the second half of fiscal 2015 we plan to launch our new SGI UV for SAP HANA which will largely target commercial enterprise businesses and is designed to streamline database management for single large node environments, which require extremely high capacity and scale to meet the needs of in-memory databases. Our management continues to focus on opportunities to enhance operational efficiency and reduce costs. We believe that this strategic plan will help create a strong foundation for our business results in the long-term.
Basis of Presentation
Included in this report are our consolidated balance sheets as of June 27, 2014 and June 28, 2013, and the related consolidated statements of operations, comprehensive loss, stockholders' equity and cash flows for the fiscal years ended June 27, 2014 ("fiscal 2014"), June 28, 2013 ("fiscal 2013") and June 29, 2012 ("fiscal 2012").
The Company has a 52 or 53-week fiscal year ending on the last Friday in June. Both fiscal 2014 and fiscal 2013 were comprised of 52 weeks. Fiscal year 2012 was comprised of 53 weeks.
Significant events
Our financial results during fiscal 2014, 2013 and 2012 were affected by certain significant events that should be considered in comparing the periods presented.
34
Acquisition of FileTek, Inc.
On September 30, 2013, we acquired certain assets of FileTek, Inc. ("FileTek"), a global provider of High Performance Data Analytics storage virtualization, large-scale data management, and active archive solutions. The total purchase price was approximately $9.2 million in cash. This acquisition expanded our storage solutions by enabling customers to manage data assets efficiently and lower the cost and administration of high-volume storage. Under the terms of the agreement, we acquired FileTek's StorHouse and Trusted Edge software, worldwide customers, engineering team and services and support resources.
We recorded the acquired assets and assumed liabilities at their estimated fair values. We determined the estimated fair values using estimates and valuations including discounted cash flow and cost approach analyses.
Contract Manufacturing Transition
In July 2013, we selected Jabil Circuit, Inc. ("Jabil") to be our primary global manufacturing services and supply chain management provider. The transition to Jabil was expected to be implemented as a “manage in place” model, which utilizes existing SGI facilities and personnel. On November 18, 2013, the Company signed an asset purchase agreement with Jabil, whereby Jabil would purchase SGI’s primary manufacturing facility, located in Chippewa Falls, Wisconsin and certain other manufacturing assets for $6.3 million in cash.
The total carrying of these assets held for sale were written down to their fair value of $6.3 million resulting in an impairment charge of $0.9 million recorded in general and administrative expenses in the second quarter of fiscal 2014.
We also expected that approximately 120 of our manufacturing personnel in Chippewa Falls would transfer to Jabil. During the second quarter of fiscal 2014, we accrued approximately $0.7 million of compensation costs associated with the transfer of these employees as part of the agreement with Jabil, which was recorded within cost of revenue.
During the fourth quarter of fiscal 2014, we reevaluated our outsourcing model given lower than anticipated volumes of Company product sales. On August 4, 2014, we terminated the planned manage-in-place outsourcing structure and the asset purchase agreement referenced above. We agreed to pay approximately $0.6 million to Jabil for certain assets that were purchased for the manage-in-place model as well as for costs associated with streamlining the manufacturing process. In addition, we reversed the $0.7 million accrual previously booked for compensation costs associated with the proposed employee transfer discussed above. The Company will continue to optimize all of its manufacturing capabilities with the objective of improving efficiency and flexibility.
Impairment of Long-lived Assets
We review the carrying values of long-lived assets for indicators of impairment whenever events or changes in circumstances indicate that the carrying amount of an asset may not be recoverable. Recoverability of long-lived assets is measured by a comparison of the carrying amount of the assets to the estimated undiscounted future cash flows expected to be generated by the assets.
As a result of recent decisions to stop investment in certain next generation Storage products, we determined that intangible assets related to the product development of these next generation products were impaired. We recorded an impairment charge of $2.9 million in the fourth quarter of fiscal 2014, which was recorded as cost of revenue.
Results of Operations
Summarized below are the results of our operations for fiscal 2014, 2013, and 2012.
Financial Highlights
Comparison of Fiscal 2014 and Fiscal 2013
• | On September 30, 2013 we acquired certain assets of FileTek for approximately $9.2 million in cash, expanding the Company's storage solutions by enabling customers to manage data assets efficiently and lower the cost and administration of high-volume storage. Under the terms of the agreement, we acquired FileTek's StorHouse and Trusted Edge software, worldwide customers, engineering team and services and support resources. |
• | Our total revenue decreased $237.3 million or 30.9% to $529.9 million in fiscal 2014 from $767.2 million in fiscal 2013. The decrease in revenue was due primarily as a result of lower sales of our legacy cloud product. This is consistent with our strategic decision to withdraw from low margin commodity service infrastructure and to focus our investments in strategic areas of HPC, High Performance Data Analytics, storage and services. In addition, we were also negatively impacted by the spending freeze instituted by the federal government prior to its shutdown during the first fiscal quarter of fiscal 2014 and the after-effects which delayed funding for certain federal programs. |
35
• | Our overall gross margin increased by 1.5 percentage points from 24.6% in fiscal 2013 to 26.1% in fiscal 2014. The favorable change in gross margin was primarily driven by a more profitable product mix compared to the comparable period last year, as we were impacted by a few significant low margin deals during fiscal 2013 in Europe and Japan and our strategic decision to withdraw from low margin commodity service infrastructure. We also benefited from a decrease in compensation and related expenses due to the reductions in headcount. This was partially offset by higher excess and obsolete inventory charges incurred during fiscal 2014 compared to fiscal 2013 for inventory primarily related to our withdrawal from the legacy cloud business and other products that are at the end of the product life cycle. We also incurred additional costs associated with the agreement with Jabil to terminate the planned manage-in-place outsourcing structure and an impairment of our storage intangible assets as discussed above. |
• | Our research and development and selling, general and administrative expenses decreased $1.7 million or 0.9% from $193.7 million in fiscal 2013 to $192.0 million in fiscal 2014. The primary driver of this decline was the decrease in compensation and related expenses due to reductions in headcount. Total headcount as of June 27, 2014 was 1,166, which reflects a reduction of 244 employees from 1,410 as of June 28, 2013 due to our cost reduction and restructuring actions as well as attrition. This was also partially offset by a $0.9 million asset impairment charge related to our manufacturing facility, costs incurred associated with our plans to transition our manufacturing and supply chain management to Jabil referenced above, as well as costs to relocate our corporate headquarters and higher share-based compensation costs. We also incurred severance expense of $10.9 million for fiscal 2014, as compared to $5.0 million for fiscal 2013 related to voluntary and involuntary employee termination programs implemented to reduce costs recorded in fiscal 2014. |
• | We incurred restructuring expense of $1.3 million for fiscal 2014, as compared to $9.0 million for fiscal 2013 related to the fiscal 2012 restructuring action primarily focused on cost reductions in Europe. |
• | We recognized approximately $1.7 million in other income associated with the sale of an investment. |
• | We recognized a net loss for fiscal 2014 of $52.8 million compared to a net loss of $2.8 million in fiscal 2013. The $50.0 million increase in net loss was mainly driven by the lower sales of our legacy cloud products and U.S. government-related contracts as previously discussed above, income tax benefit recorded of $12.6 million in fiscal 2013 as well as higher asset impairment and excess and obsolete inventory charges. |
• | We continue to streamline our operations and size the business for profitability while continuing to invest in our more differentiated growth initiatives. |
Comparison of Fiscal 2013 and Fiscal 2012
• | Our total revenue increased $14.2 million or 1.9% to $767.2 million in fiscal 2013 from $753.0 million in fiscal 2012. The increase in revenue was primarily due to higher sales from our scale out server products as well as our legacy cloud/web solutions, and was partially offset by a decline in our customer support and professional service offerings. |
• | Our overall gross margin decreased by 1.1 percentage points from 25.7% in fiscal 2012 to 24.6% in fiscal 2013. The unfavorable change in gross margin was due to unfavorable margins resulting from low margin deals in Japan and EMEA recognized during fiscal 2013. This was partially offset by lower excess and obsolete inventory charges. In fiscal 2012, we recorded a $10.1 million inventory write down to reflect reduced demand for manufacturing parts for earlier generation products and a revaluation of spare inventories to reflect reduced expected usage. |
• | Our research and development and selling, general and administrative expenses decreased $19.1 million or 9.0% from $212.8 million in fiscal 2012 to $193.7 million in fiscal 2013. The primary driver of this decline was the decrease in compensation and related expenses due to reductions in headcount. Total headcount as of June 28, 2013 was 1,410, which reflects a reduction of 169 employees from 1,579 as of June 29, 2012 due to restructuring actions in fiscal 2012 as well as attrition. The savings from the headcount reductions more than offset the increases in salaries and wages due to merit increases. We have actively been controlling our costs across all functions in order to streamline our operations and reduce operating expenses. We have also benefited from lower charges for the amortization of intangible assets as these assets are nearing full amortization. |
• | We incurred restructuring expense of $9.0 million for fiscal 2013, as compared to $2.5 million for fiscal 2012 related to the fiscal 2012 restructuring action primarily focused on cost reductions in Europe. |
• | We recognized a net loss for fiscal 2013 of $2.8 million compared to a net loss of $24.5 million in fiscal 2012. The $21.6 million increase in net income was mainly driven by the income tax benefit recorded of $12.6 million as a result of unrecognized tax benefits, and a decrease in our total operating expenses, which was partially offset by low margin deals that were recognized during the first and third quarters of fiscal 2013. |
36
Net Revenue
Fiscal Year Ended | 2014 over 2013 | 2013 over 2012 | ||||||||||||||||||||
June 27, 2014 | June 28, 2013 | June 29, 2012 | Change | Change | ||||||||||||||||||
$ | % | $ | % | |||||||||||||||||||
Net revenue from products: | ||||||||||||||||||||||
Compute | $ | 307,440 | $ | 498,166 | $ | 486,188 | $ | (190,726 | ) | (38.3)% | $ | 11,978 | 2.5% | |||||||||
As a percent of total net revenue | 58.0 | % | 64.9 | % | 64.5 | % | (6.9) ppts | 0.4 ppts | ||||||||||||||
Storage | 67,125 | 92,523 | 70,545 | (25,398 | ) | (27.5)% | 21,978 | 31.2% | ||||||||||||||
As a percent of total net revenue | 12.7 | % | 12.1 | % | 9.4 | % | 0.6 ppts | 2.7 ppts | ||||||||||||||
Net revenue from products | 374,565 | 590,689 | 556,733 | (216,124 | ) | (36.6)% | 33,956 | 6.1% | ||||||||||||||
Net revenue from services: | 155,381 | 176,538 | 196,254 | (21,157 | ) | (12.0)% | (19,716 | ) | (10.0)% | |||||||||||||
As a percent of total net revenue | 29.3 | % | 23.0 | % | 26.1 | % | 6.3 ppts | (3.1) ppts | ||||||||||||||
Total net revenue | $ | 529,946 | $ | 767,227 | $ | 752,987 | $ | (237,281 | ) | (30.9)% | $ | 14,240 | 1.9% | |||||||||
Revenue. We derive revenue from the sale of products and services directly to end-users as well as through resellers and system integrators. Product revenue is derived from the sale of mid-range to high-end computing servers and data storage systems as well as software. We enter into sales contracts to deliver multiple products and/or services. In accordance with our revenue recognition policy, certain sales contracts are deferred and recognized over the service period. Service revenue is generated from the sale of standard maintenance contracts as well as custom maintenance contracts that are tailored to individual customers' needs. We recognize service revenue ratably over the service periods. Maintenance contracts are typically between one to three years in length and we actively pursue renewals of these contracts. We also generate professional services revenue related to implementation of and training on our products.
We continuously make revisions to our product offerings and improvements of our product's performance and data storage capacity. Accordingly, we are unable to directly compare our products from period to period, and are therefore unable to quantify the changes in pricing of our products from period to period. We believe that our on-going revisions to product offerings and product feature improvements help mitigate competitive pricing pressures by shifting the competitive landscape to differentiated value rather than price. Among other things, the timing of our revenue is primarily dependent upon the funding and implementation schedule of our customers. A significant portion of our revenue relates to large IT projects, which can have long sales cycles and long build-out and acceptance schedules.
The following table presents revenue by geographic region for fiscal 2014, 2013 and 2012 (in thousands except percentages):
Fiscal Year Ended | 2014 over 2013 | 2013 over 2012 | ||||||||||||||||||||
June 27, 2014 | June 28, 2013 | June 29, 2012 | Change | Change | ||||||||||||||||||
$ | % | $ | % | |||||||||||||||||||
Americas | $ | 277,536 | $ | 496,508 | $ | 473,746 | $ | (218,972 | ) | (44.1)% | $ | 22,762 | 4.8% | |||||||||
As a percent of total net revenue | 52.4 | % | 64.7 | % | 62.9 | % | (12.3) ppts | 1.8 ppts | ||||||||||||||
EMEA | 116,071 | 134,152 | 108,849 | $ | (18,081 | ) | (13.5)% | 25,303 | 23.2% | |||||||||||||
As a percent of total net revenue | 21.9 | % | 17.5 | % | 14.5 | % | 4.4 ppts | 3.0 ppts | ||||||||||||||
APJ | 136,339 | 136,567 | 170,392 | $ | (228 | ) | (0.2)% | (33,825 | ) | (19.9)% | ||||||||||||
As a percent of total net revenue | 25.7 | % | 17.8 | % | 22.6 | % | 7.9 ppts | (4.8) ppts | ||||||||||||||
Total revenue | $ | 529,946 | $ | 767,227 | $ | 752,987 | $ | (237,281 | ) | (30.9)% | 14,240 | 1.9% | ||||||||||
The Americas geographic region includes both North and South America. The Europe geographic region ("EMEA") includes European countries, as well as the Middle East and Africa. The Asia-Pacific geographic region ("APJ") includes Australia, Japan and all other Asian countries.
37
Our revenue mix by geography illustrates that we continue to have strong international presence representing 52.3%, 37.9% and 40.6%, of our total revenue during fiscal 2014, 2013 and 2012, respectively. For fiscal 2014, various agencies of the United States government, excluding system integrators contributed more than 10% of total revenue. For fiscal 2013, Amazon and various agencies of the United States government, excluding system integrators, were the only customers that contributed more than 10% of total revenue. For fiscal 2012, Amazon was our only customer that contributed more than 10% of total revenue.
Cost of revenue and gross profit
Cost of revenue and gross profit for fiscal 2014, 2013 and 2012 were as follows (in thousands except percentages):
Fiscal Year Ended | 2014 over 2013 | 2013 over 2012 | ||||||||||
June 27, 2014 | June 28, 2013 | June 29, 2012 | Change | Change | ||||||||
$ | % | $ | % | |||||||||
Total cost of revenue | $391,539 | $578,175 | $559,170 | $(186,636) | (32.3)% | $19,005 | 3.4% | |||||
Total gross profit | $138,407 | $189,052 | $193,817 | $(50,645) | (26.8)% | $(4,765) | (2.5)% | |||||
Total gross margin | 26.1% | 24.6% | 25.7% | 1.5 ppts | (1.1) ppts | |||||||
Cost of revenue consists of costs associated with direct material, labor, manufacturing overhead, shipment of products, inventory write downs and share-based compensation. Cost of revenue also includes personnel costs for providing maintenance and professional services. Our manufacturing overhead and professional services personnel costs are fixed or semi-variable. Our gross margins are impacted by changes in customer and product mix, pricing actions by our competitors and commodity prices that comprise a significant portion of cost of revenue from period to period. In addition, when certain sales contracts are deferred in accordance with our revenue recognition policy, the related cost of revenue is deferred and recognized upon recognition of revenue.
Our cost of revenue and gross profit are impacted by price changes, product configuration, revenue mix and product material costs. Our service cost of revenue and gross margin are impacted by timing of support service initiations and renewals, and incremental investments in our customer support infrastructure.
Overall gross profit decreased by $50.6 million to $138.4 million in fiscal 2014 from $189.1 million in fiscal 2013 due to a decrease in revenue volume primarily related to lower sales for our legacy cloud products and U.S. government-related business. However, our overall gross margin increased to 26.1% in fiscal 2014 from 24.6% in fiscal 2013. The increase in gross margins in fiscal 2014 compared to fiscal 2013 was primarily driven by more favorable product mix due to our strategic decision to withdraw from low margin commodity server infrastructure and to focus our investments in strategic areas of HPC, High Performance Data Analytics, storage and services, as well as a higher mix of service revenue which typically generates higher gross margins. We also benefited from the decrease in compensation and related expenses due to the reductions in headcount. This was slightly offset by higher excess and obsolete inventory charges during fiscal 2014 compared to fiscal 2013 as a result of our strategic withdrawal from the legacy cloud business, higher costs incurred during fiscal 2014 associated with the plan and termination of the manage in place contract manufacturing model with Jabil and an impairment charge of $2.9 million for intangible assets related to our Storage business unit. In addition, during fiscal 2013, our gross margins were negatively impacted as a result of the low margin deals in Japan and Europe, impacting both our product and service margins.
Overall gross profit decreased $4.8 million or 2.5% to $189.1 million in fiscal 2013 from $193.8 million in fiscal 2012. Overall gross margin percentage decreased to 24.6% in fiscal 2013 from 25.7% in fiscal 2012. Our gross margin decreased primarily as a result of a few low margin deals that occurred in fiscal 2013 that negatively impacted our margins in Japan and Europe, impacting both our product and service margins. This was offset by lower excess and obsolete inventory charges during fiscal 2013 compared to fiscal 2012 as well as from the savings from the lower headcount discussed above.
38
Operating expenses
Operating expenses for fiscal 2014, 2013 and 2012 were as follows:
Fiscal Year Ended | 2014 over 2013 | 2013 over 2012 | ||||||||||||||||||||||
June 27, 2014 | June 28, 2013 | June 29, 2012 | Change | Change | ||||||||||||||||||||
$ | % | $ | % | |||||||||||||||||||||
(in thousands, except percentages) | ||||||||||||||||||||||||
Research and development | $ | 63,526 | $ | 60,611 | $ | 62,356 | $ | 2,915 | 4.8 | % | $ | (1,745 | ) | (2.8 | )% | |||||||||
Sales and marketing | 72,681 | 78,730 | 88,414 | (6,049 | ) | (7.7 | )% | (9,684 | ) | (11.0 | )% | |||||||||||||
General and administrative | 55,796 | 54,317 | 62,021 | 1,479 | 2.7 | % | (7,704 | ) | (12.4 | )% | ||||||||||||||
Restructuring | 1,251 | 9,048 | 2,469 | (7,797 | ) | (86.2 | )% | 6,579 | 266.5 | % | ||||||||||||||
Total operating expense | $ | 193,254 | $ | 202,706 | $ | 215,260 | $ | (9,452 | ) | (4.7 | )% | $ | (12,554 | ) | (5.8 | )% | ||||||||
Research and development. Research and development expense consists primarily of personnel and related costs, contractor fees, new component testing and evaluation, test equipment, new product design and testing, other product development activities, share-based compensation, facilities and information technology costs. During fiscal 2014, 2013 and 2012, we received $1.0 million, $1.3 million and $1.6 million, respectively, in third-party funding which offset a portion of our research and development expenses.
Research and development expense increased $2.9 million or 4.8% to $63.5 million in fiscal 2014 from $60.6 million in fiscal 2013. The increase in research and development expense was primarily due to higher severance expense related to voluntary and involuntary employee termination programs implemented to reduce costs. This was partially offset by cost savings associated with the reductions in headcount as well as lower non-recurring engineering costs due to timing of product introductions.
Research and development expense decreased $1.7 million or 2.8% to $60.6 million in fiscal 2013 from $62.4 million in fiscal 2012. The decrease in research and development expense was primarily due to a reduction in third party provider and non-recurring engineering costs of approximately $1.0 million and equipment and materials of $1.6 million as we were ramping up for new product introductions in fiscal 2012. This was offset by higher depreciation of $0.5 million as we continue to invest in research and development activities, as well as higher stock based compensation expense of approximately $0.3 million.
We believe that focused investments in research and development are critical to our future performance and competitiveness in the marketplace. Our investments in this area will directly relate to enhancement of our current product line, development of new products that achieve market acceptance, and our ability to meet an expanding range of customer requirements. As such, we expect to continue to spend on current and future product development efforts.
Sales and marketing. Sales and marketing expense consists primarily of salaries, bonuses and commissions paid to our sales and marketing employees, amortization of intangible assets, share-based compensation, facilities and information technology costs. We also incur marketing expenses for activities such as trade shows, direct mail and advertising.
Sales and marketing expense decreased $6.0 million or 7.7% to $72.7 million in fiscal 2014 from $78.7 million in fiscal 2013. This reduction was primarily due to a decrease in our compensation and related expenses as a result of lower headcount as well as lower commissions and bonus expense reflecting lower achievement of sales commission targets and performance metrics. This was partially offset by higher share-based compensation costs.
Sales and marketing expense decreased $9.7 million or 11.0% to $78.7 million in fiscal 2013 from $88.4 million in fiscal 2012. This reduction was primarily due to a decrease in our compensation and related expenses as a result of lower headcount as well as lower commissions and bonus expense reflecting lower achievement of sales commission targets and performance metrics. In addition, we also benefited from a decrease in intangible amortization expense of $0.7 million as some of our intangible assets became fully amortized, and have reduced our marketing costs by focusing on more strategic and cost effective ways to help generate business. This reduction was offset by an increase of $1.8 million of severance charges incurred during fiscal 2013 primarily impacting our APJ region.
We will continue to deploy our sales and support organizations to focus on key vertical markets such as defense and strategic systems, weather and climate, physical sciences, life sciences, energy (including oil and gas), aerospace and automotive, media and entertainment, semiconductor design, manufacturing, financial services, data centers and business intelligence and data analytics. In addition, we are also investing in our marketing functions in order to ensure that we are in markets and technologies that will provide us with growth in our target segments.
General and administrative. General and administrative expense consists primarily of personnel costs, legal and professional service costs, depreciation, share-based compensation, facilities and information technology costs.
39
General and administrative expense increased $1.5 million or 2.7% to $55.8 million in fiscal 2014 from $54.3 million in fiscal 2013. For fiscal 2014, we recorded a $0.9 million asset impairment charge for our manufacturing facility located in Chippewa Falls, as previously described above. We also incurred higher severance expense related to voluntary and involuntary employee termination programs implemented to reduce costs as well as higher share-based compensation costs. This was partially offset by lower compensation and related benefits as a result of the reduction in headcount as well as a reduction in our professional fees, including legal related expenses and other third party consulting fees. In addition, during fiscal 2013, we also benefited from a $0.7 million gain on a sale of assets.
General and administrative expense decreased $7.7 million or 12.4% to $54.3 million in fiscal 2013 from $62.0 million in fiscal 2012. For fiscal 2013, we reduced our professional fees, including legal related expenses and other third party consulting fees by approximately $3.1 million and recruiting fees by approximately $1.0 million, primarily due to cost control measures. We also benefited from lower compensation and related benefits of $0.5 million as a result of the reduction of headcount, a gain on the sale of assets of $0.7 million, as well as a decrease in share-based compensation expense of $0.6 million. In fiscal 2012, share-based compensation included the impact of stock modifications for former executive officers more fully described below. This was partially offset by higher bonus expense reflecting higher achievement of performance metrics compared to fiscal 2012.
Restructuring. Total restructuring expense related to our restructuring actions was approximately $1.3 million, $9.0 million, and $2.5 million for fiscal 2014, 2013 and 2012, respectively.
On March 16, 2012, the Company's Board of Directors approved a restructuring action to reduce approximately 25% of the Company's European workforce and close certain legal entities and offices in Europe in order to streamline operations and reduce operating expenses.
Total expense incurred in connection with this restructuring plan, for actions taken through June 27, 2014 was $12.6 million. This restructuring action is substantially complete.
Total other income (expense), net
Total other income (expense), net for fiscal 2014, 2013 and 2012 was as follows:
Fiscal Year Ended | 2014 over 2013 | 2013 over 2012 | |||||||||||||||||||||||
June 27, 2014 | June 28, 2013 | June 29, 2012 | Change | Change | |||||||||||||||||||||
$ | % | $ | % | ||||||||||||||||||||||
(in thousands, except percentages) | |||||||||||||||||||||||||
Interest expense, net | $ | (117 | ) | $ | (311 | ) | $ | (297 | ) | $ | 194 | (62.4 | )% | $ | (14 | ) | 4.7 | % | |||||||
Other income (expense), net | 2,162 | (1,478 | ) | (1,720 | ) | 3,640 | (246.3 | )% | 242 | (14.1 | )% | ||||||||||||||
Total other income (expense), net | $ | 2,045 | $ | (1,789 | ) | $ | (2,017 | ) | $ | 3,834 | (214.3 | )% | $ | 228 | (11.3 | )% | |||||||||
Interest expense, net. Interest expense, net primarily consists of interest expense relating to our credit facility and to certain tax payments, as well interest earned on our interest-bearing investment accounts which include money market funds and U.S. treasury bills.
Other income (expense), net. Other income (expense), net consists primarily of foreign exchange losses as a result of the strengthening of the U.S. Dollar against the Euro, British Pound, Japanese Yen and Canadian dollar against the U.S. Dollar as well as gains or losses associated with other non-operating business activities. During fiscal 2014, we recorded $1.7 million of other income associated with a sale of an investment.
Income tax (benefit) provision
Income tax provision for fiscal 2014, 2013 and 2012 was as follows:
Fiscal Year Ended | 2014 over 2013 | 2013 over 2012 | |||||||||||||||||||||
June 27, 2014 | June 28, 2013 | June 29, 2012 | Change | Change | |||||||||||||||||||
$ | % | $ | % | ||||||||||||||||||||
(in thousands, except percentages) | |||||||||||||||||||||||
Income tax (benefit) provision | $ | 12 | $ | (12,623 | ) | $ | 1,001 | $ | 12,635 | N.M. | $ | (13,624 | ) | N.M. | |||||||||
N.M- Not meaningful
We recorded an immaterial amount of tax expense of for fiscal 2014. Our tax expense for fiscal 2014 includes current and deferred tax benefit primarily related to our foreign operations, current tax expense attributable to U.S. state income taxes, and tax expense for unrecognized tax benefits and related interest. The Company believes that it is more likely than
40
not that the majority of the deferred tax assets of its foreign subsidiaries will not be realized. As such, the Company recorded deferred tax benefit related to the release of valuation allowance for certain of its foreign subsidiaries. The effective tax rate differed from the combined U.S. federal and state statutory income tax rates for fiscal 2014 primarily due to current and deferred tax expense incurred by the Company's foreign subsidiaries, a refund of foreign taxes paid, change in valuation allowance and a tax expense associated with unrecognized tax benefits and related interest.
We recorded a tax benefit of $12.6 million for fiscal 2013. Our tax benefit for fiscal 2013 includes current and deferred tax benefit primarily related to our foreign operations of $2.2 million, current tax expense attributable to the U.S. state income taxes of $0.2 million, and tax benefit of $10.6 million for unrecognized tax benefits and related interest. The Company believes that it is more likely than not that the majority of the deferred tax assets of its foreign subsidiaries will not be realized. As such, the Company recorded deferred tax benefit of $0.5 million related to the release of valuation allowance for certain of its foreign subsidiaries. The effective tax rate differed from the combined U.S. federal and state statutory income tax rates for fiscal 2013 primarily due to domestic operating losses generated during the period from which the Company does not benefit, current and deferred tax expense incurred by the Company's foreign subsidiaries, a refund of foreign taxes paid, and a tax benefit associated with unrecognized tax benefits and related interest.
We recorded a tax expense of $1.0 million for fiscal 2012. Our tax expense for fiscal 2012 includes current and deferred tax expense primarily related to our foreign operations of $2.0 million, current tax expense attributable to the U.S. state income taxes of $0.2 million, and an offsetting benefit of $1.2 million for previously unrecognized tax benefits and related accrued interest. The Company believes that it is more likely than not that the majority of the deferred tax assets of its foreign subsidiaries will not be realized. As such, the Company recorded deferred tax expense of $1.7 million related to the recording of valuation allowance for its foreign subsidiaries. The effective tax rate differed from the combined U.S. federal and state statutory income tax rates for fiscal 2012 primarily due to domestic operating losses generated during the period from which the Company does not benefit, current and deferred tax expense incurred by the Company's foreign subsidiaries and a tax benefit associated with unrecognized tax benefits and related interest.
As of June 27, 2014, we recorded a valuation allowance against the majority of our net deferred tax assets. Based on all available positive and negative evidence, on a jurisdictional basis, including our historical operating results, and the uncertainty of predicting our future income, the valuation allowance reduces the majority of our deferred tax assets to an amount that is more likely than not to be realized. The valuation allowance is attributable to U.S. federal, state and certain foreign deferred tax assets primarily consisting of net operating loss carryovers, tax credit carryovers, accrued expenses, and other temporary differences. We continue to evaluate the future realization of our deferred tax assets. If our assessment of deferred tax assets or the corresponding valuation allowance were to change, we would record the related adjustment to income tax expense during the period in which management makes the determination.
Segment Operating Performance
Commencing in the first quarter of fiscal 2014, the Company started managing its business primarily on a business unit basis versus the geographic basis previously used by management. Accordingly, the Company has determined its operating and reporting segments, which is based on the business unit structure, to be Compute, Storage and Service. The Company's operating segments are determined based upon several criteria including: the Company's internal organizational structure; the manner in which the Company's operations are managed; the criteria used by the Company's Chief Executive Officer, the Chief Operating Decision Maker (“CODM”), to evaluate segment performance; and the availability of separate financial information.
The Company's CODM evaluates the performance of its operating segments based on revenue and operating profit (loss). Revenue is generally allocated based on the type of products and service provided to our customers. Operating profit (loss) for each segment includes related cost of sales and operating expenses directly attributable to the segment. A portion of the segments' expenses arise from shared services and infrastructure that the Company provides to the segments in order to realize economies of scale and to efficiently use resources. These expenses, collectively called corporate charges, include costs of centralized research and development and other corporate infrastructure expenses. These corporate charges are allocated to the segments and are reassessed on a periodic basis. The allocations have been determined on a basis that the Company considers to be a reasonable reflection of the utilization of services provided to or benefits received by the segments. The profitability of each of the segments is measured after excluding share based compensation expenses, amortization of intangibles, restructuring charges, general and administration charges, other unallocated corporate charges and other items, as management does not include this information in its measurement of the performance of the operating segments.
All historical segment numbers for fiscal 2013 and 2012 have been recast to conform to the fiscal 2014 business unit presentation.
41
Compute:
Our compute solutions segment includes our scale-out computing, scale-up computing and software solutions. Compute solutions also include integrated third-party hardware and software products that we sell to provide a single source solution for our customers. Our compute solutions are designed to minimize the number and complexity of interconnects for power and data transfer to improve reliability, speed of implementation and serviceability.
Operating results for our Compute segment for fiscal 2014, 2013 and 2012 were as follow (in thousands except percentage):
Fiscal Year Ended | 2014 over 2013 | 2013 over 2012 | ||||||||||
June 27, 2014 | June 28, 2013 | June 29, 2012 | Change | Change | ||||||||
$ | % | $ | % | |||||||||
Net revenue | $307,440 | $498,166 | $486,188 | $(190,726) | (38.3)% | $11,978 | 2.5% | |||||
Operating (loss) profit | (989) | 30,304 | 25,320 | (31,293) | (103.3)% | 4,984 | 19.7% | |||||
Operating margin | (0.3)% | 6.1% | 5.2% | (6.4) ppts | 0.9 ppts | |||||||
Revenue for our Compute segment decreased $190.7 million or 38.3% to $307.4 million in fiscal 2014 from $498.2 million during fiscal 2013. These decreases were primarily due as a result of lower sales for our legacy cloud products. This is consistent with our strategic decision to withdraw from low margin commodity server infrastructure and to focus our investments in strategic areas of HPC, High Performance Data Analytics, storage and service. In addition, we were also negatively impacted by the spending freeze instituted by the federal government prior to its shutdown during the first quarter of fiscal 2014 and the after-effects which delayed funding for certain federal programs.
Revenue for our Compute segment increased $12.0 million or 2.5% in fiscal 2013 compared to $486.2 million in fiscal 2012. These increases were due primarily driven by the strength in our scale-out computing and legacy cloud products partially offset by a reduction in our scale-up computing products.
Overall operating profit for our Compute segment decreased by $31.3 million to an operating loss of $1.0 million in fiscal 2014 from $30.3 million operating profit in fiscal 2013. For fiscal 2014, gross margins were about flat compared to the comparable period a year ago on lower revenue. Gross margins in fiscal 2013 were negatively impacted as a result of low margin deals in Japan and EMEA as well as a higher mix of legacy cloud products, which historically generated lower gross margins. Gross margins in fiscal 2014, had a higher mix of third party products and ICE-X products, which generally carry lower margins than our other product offerings in this segment. Although we benefited from our tight controls over our spending and reductions in headcount discussed above resulting in lower compensation and related expenses, as well as lower bonuses and commissions expense, these reductions were not enough to offset the relative fixed costs on significantly lower revenue volume, negatively impacting the segment results during the period.
Overall operating profit for our Compute segment increased by $5.0 million to $30.3 million in fiscal 2013 from $25.3 million operating income in fiscal 2012. Gross margins for fiscal 2013 were lower compared to fiscal 2012. During fiscal 2013, our gross margins were negatively impacted as a result of a few significant low margin deals in Japan and Europe. In addition, fiscal 2012 we had a higher mix of scale-up computing products, which generally generates higher margins than our other product offerings in this segment. We benefited from reductions in headcount discussed above resulting in lower compensation and related expenses, as well as lower bonuses and commissions expense as well as lower third party costs in research and development due to timing of product introductions.
42
Storage:
Our Storage solutions segment includes both hardware and software offerings to address virtually every type of data storage and management requirement. Products range from entry-level disk arrays to complex storage systems, with innovative technology and hardware, to include the SGI Modular InfiniteStorage™ platform, SGI InfiniteStorage™ gateway and SGI CXFS™ file system. Our storage solutions are designed to provide extreme scale, broad flexibility, and to minimize the cost to store data. A significant portion of our segment revenue is generated from follow on sales to support the storage needs of our Compute customers.
Operating results for our Storage segment for fiscal 2014, 2013 and 2012 were as follow (in thousands except percentage):
Fiscal Year Ended | 2014 over 2013 | 2013 over 2012 | ||||||||||
June 27, 2014 | June 28, 2013 | June 29, 2012 | Change | Change | ||||||||
$ | % | $ | % | |||||||||
Net revenue | $67,125 | $92,523 | $70,545 | $(25,398) | (27.5)% | $21,978 | 31.2% | |||||
Operating profit (loss) | 843 | 1,140 | (2,069) | (297) | (26.1)% | 3,209 | 155.1% | |||||
Operating margin | 1.3% | 1.2% | (2.9)% | 0.1 ppts | 4.1 ppts | |||||||
Revenue for our Storage segment decreased $25.4 million or 27.5% to $67.1 million in fiscal 2014 from $92.5 million in fiscal 2013. Revenue for our Storage segment was negatively impacted by the spending freeze instituted by the federal government prior to its shutdown during the first quarter of fiscal 2014 and its after-effects which delayed funding for certain federal programs.
For fiscal 2013, our Storage segment's revenue increased $22.0 million or 31.2% to $92.5 million from $70.5 million in fiscal 2012. This increase was due primarily as a result of higher revenue generated by increased demand in our storage infrastructure and third party products compared to the same period a year ago.
Overall operating profit for our Storage segment decreased by $0.3 million to $0.8 million operating income in fiscal 2014 from a $1.1 million operating income in fiscal 2013. Gross margins for fiscal 2014 were higher compared to fiscal 2013. During fiscal 2013, our gross margins were negatively impacted as a result of a few significant low margin deals in Japan and Europe. Storage operating expenses for fiscal 2014 were flat compared to the comparable period a year ago. The Storage segment incurred higher operating expenses due to increased development in research and development in order to capitalize on software acquired as part of the recent FileTek acquisition offset by reductions in headcount discussed above resulting in lower compensation and related expenses, as well as lower bonuses and commissions expense.
Overall operating profit for our Storage segment increased by $3.2 million to $1.1 million operating income in fiscal 2013 compared to $2.1 million operating loss in fiscal 2012. Gross margins for fiscal 2013 were lower compared to fiscal 2012. During fiscal 2013, our gross margins were negatively impacted as a result of a few significant low margin deals in Japan and Europe. We benefited from reductions in headcount discussed above resulting in lower compensation and related expenses, as well as lower bonuses and commissions expense however this was partially offset by increased investment in research and development.
43
Service:
The Service segment is comprised of customer service support and professional services. Our customer service support organization provides ongoing maintenance and technical support for our products and some third-party products, as well as contracted maintenance services, hardware deployment services (install and de-install), time and materials-based services and spare parts. Our professional services organization provides value added services associated with technology consulting, project management and customer education, all of which help our customers realize the full value of their information technology investments.
Operating results for our Service segment for fiscal 2014, 2013 and 2012 were as follows (in thousands except percentage):
Fiscal Year Ended | 2014 over 2013 | 2013 over 2012 | ||||||||||
June 27, 2014 | June 28, 2013 | June 29, 2012 | Change | Change | ||||||||
$ | % | $ | % | |||||||||
Net revenue | $155,381 | $176,538 | $196,254 | $(21,157) | (12.0)% | $(19,716) | (10.0)% | |||||
Operating profit | 60,412 | 58,805 | 56,616 | 1,607 | 2.7% | 2,189 | 3.9% | |||||
Operating margin | 38.9% | 33.3% | 28.8% | 5.6 ppts | 4.5 ppts | |||||||
Our service revenue will typically fluctuate due to timing of when services were performed on consulting and product integration services. Our service revenue is typically recognized ratably over the respective service periods. Revenue for our Service segment decreased $21.2 million or 12.0% to $155.4 million in fiscal 2014 from $176.5 million in fiscal 2013. The decrease compared to a year ago was primarily due to the lower volume of products sold requiring service needs, the timing of professional services provided as well as a deterioration in customer service maintenance contracts. In addition, we experienced lower support revenue as our new products replace our installed base of older generation products.
Revenue for our Service segment decreased $19.7 million or 10.0% to $176.5 million in fiscal 2013 from $196.3 million in fiscal 2012. The decrease was primarily due to timing of professional services provided as well as a deterioration in customer service maintenance contracts. In addition, we experienced lower support revenue as our new products replace our installed base of older generation products.
Overall operating profit for our Service segment increased by $1.6 million to $60.4 million operating income in fiscal 2014 from $58.8 million operating income in fiscal 2013. Despite the decrease in revenue, overall operating profit increased for our Service segment during fiscal 2014 compared to fiscal 2013. The Service segment was more profitable on lower revenue as we benefited from lower spending associated with using third party providers and the reductions in headcount discussed above resulting in lower compensation and related expenses, as well as lower bonuses and commissions.
Overall operating profit for our Service segment increased by $2.2 million to $58.8 million operating income in fiscal 2013 from $56.6 million operating income in fiscal 2012. During fiscal 2013, we generated higher gross margins due to lower material costs and utilization of third third party providers. In addition, during fiscal 2013, our gross margin was negatively impacted by a few low margin deals that occurred in Japan and Europe.
Liquidity and Capital Resources
We had $109.3 million of cash and cash equivalents at June 27, 2014 compared with $175.2 million of cash and cash equivalents at June 28, 2013. As of June 27, 2014, we had $66.5 million of cash and cash equivalents that are held outside the United States. Historically, we have required capital principally to fund our working capital needs. If we invest any of our cash outside of non-interest-bearing operating accounts, it is our investment policy to invest in a manner that preserves capital, provides liquidity and maintains appropriate diversification and optimizes after-tax yield and return within our policy's framework and stipulated benchmarks. Adherence with our policy requires the assets to be liquid on and before their maturity dates. This liquidity requirement means that the holder of the assets must be able to pay us, upon our demand, the cash value of the assets invested.
At June 27, 2014, we had short-term and long-term restricted cash and cash equivalents of $4.5 million that are pledged as collateral for various guarantees issued to cover rent on leased facilities and equipment, to government authorities for value-added tax (“VAT”) and other taxes and certain vendors to support payments in advance of delivery of goods and services.
As described further below under the section titled "Contractual Obligations and Other Commitments," in December 2011 we entered into a five-year senior secured credit facility in the aggregate principal amount of $35.0 million, which has since been adjusted to $25.0 million. The credit facility is intended to be used primarily to fund working capital
44
requirements, capital expenditures and operations to the extent that cash provided by operating activities is not sufficient to fund our cash needs. During fiscal 2013, we made a $15.7 million payment to pay down the outstanding balance with interest of the credit facility. Accordingly, as of June 27, 2014, we had no outstanding balance owed on the credit facility. We have a $2.0 million outstanding letter of credit under this credit facility to back the Company's obligation to pay for goods or services to a supplier. As of June 27, 2014, the maximum amount available to be borrowed under the credit facility was approximately $23.0 million.
At June 27, 2014, we believe our current cash and cash equivalents, in conjunction with the funds that may be drawn down under our credit facility, will be sufficient to fund working capital requirements, capital expenditures, stock repurchase and operations for at least the next twelve months. We have implemented processes to more effectively monitor our working capital. We have intensified our cash management processes related to monitoring, projecting and controlling procedures to operate our business and are more broadly requiring advance and milestone payments for certain large projects that would otherwise involve a significant lag between our payments to vendors for equipment and materials and the installation, acceptance, billing and collection from the customer. We intend to retain any future earnings to support operations, to finance the growth and development of our business and to fund our stock repurchase program. We do not anticipate paying any dividends in the foreseeable future. In June 2013, we signed a lease for a new headquarters facility and incurred approximately $10.7 million for capital expenditures and received approximately $5.9 million in lease incentives.
The adequacy of these resources to meet our liquidity needs beyond the next twelve months will depend on our growth, operating results and capital expenditures required to meet our business needs. If we fail to generate cash from our operations on a timely basis, we may not have the cash resources required to run our business and we may need to seek additional sources of funds.
If we require additional capital resources to expand our business internally or to acquire complementary products, technologies and businesses at any time in the future, we may seek to sell additional equity or debt securities or obtain other debt financing. The sale of additional equity or debt securities could result in more dilution to our stockholders. Financing arrangements may not be available to us, or may not be available in amounts or on terms acceptable to us.
The following is a summary of cash activity (in thousands):
Fiscal Year Ended | |||||||||||||
June 27, 2014 | June 28, 2013 | June 29, 2012 | |||||||||||
Consolidated statements of cash flows data: | |||||||||||||
Net cash (used in) provided by operating activities | $ | (33,080 | ) | $ | 76,825 | $ | (46,828 | ) | |||||
Net cash used in investing activities and acquisitions | (26,311 | ) | (1,560 | ) | (7,700 | ) | |||||||
Net cash (used in) provided by financing activities | (5,530 | ) | (2,547 | ) | 19,059 | ||||||||
Effect of exchange rate changes on cash and cash equivalents | (963 | ) | (2,388 | ) | 452 | ||||||||
Net (decrease) increase in cash and cash equivalents | $ | (65,884 | ) | $ | 70,330 | $ | (35,017 | ) | |||||
Operating Activities
Cash used in operating activities was $33.1 million for fiscal 2014. Our net loss was $52.8 million for fiscal 2014. Non-cash items included in net loss consisted primarily of depreciation and amortization expense of $14.5 million, share-based compensation expense of $12.0 million, a gain on sales of investment of $1.7 million, impairment on investments and long-lived assets of $4.6 million, changes in deferred income taxes of $0.2 million and changes in other non-cash items of $0.6 million. Net change in operating assets and liabilities was $10.1 million. The primary sources of cash in operating activity were driven by decreases in inventory, deferred cost of revenue, as well as an increase in accounts payable and other liabilities. The primary uses of cash in operating activities were decreases in deferred revenue, accrued compensation, and increase in accounts receivable as well as prepaid and other assets for payments to our suppliers and vendors.
45
For fiscal 2014, inventory decreased $10.1 million reflecting timing of customer shipments and acceptance for a number of our large sales contracts for which we had built up inventory over the past few quarters in order to meet customer demand. Deferred cost also decreased by $8.4 million primarily due to the timing and recognition of revenue for these large deals. We continue to receive milestone payments from our customers, improving our cash position. Additionally, accounts payables increased $2.2 million and other liabilities increased $12.2 million. These increases are primarily due to timing of purchases of inventory and payments to our suppliers. This was partially offset by a decrease in deferred revenue of $14.6 million and increase in accounts receivable increased $13.0 million reflecting the timing of revenue recognition and timing of collection of the trade receivables. Additionally, accrued compensation decreased $8.4 million primarily due to lower bonuses and commissions and timing of payments. We continue our efforts to more closely align payments with customer receipts and as part of the efforts to manage our working capital more closely.
Cash provided by operating activities was $76.8 million for fiscal 2013. Our net loss was $2.8 million for fiscal 2013. Non-cash items included in net loss consisted primarily of depreciation and amortization expense of $14.3 million, share-based compensation expense of $10.1 million, release of previously recorded unrecognized tax benefit of $10.3 million, impairment on investments and long-lived assets of $0.2 million, changes in deferred income taxes of $0.5 million and changes in other non-cash items of $1.0 million. Net change in operating assets and liabilities was $64.8 million. The primary sources of cash in operating activity were driven by decreases in inventory, deferred cost of revenue, accounts receivable and other assets as well as an increase in accrued compensation. The primary uses of cash in operating activities were decreases in deferred revenue, income taxes payable and accounts payable and other liabilities for payments to our suppliers and vendors.
For fiscal 2013, inventory decreased $54.3 million reflecting timing of customer shipments and acceptance for a number of our large sales contracts for which we had built up inventory over the past few quarters in order to meet customer demand. Deferred cost also decreased by $36.3 million primarily due to the timing and recognition of revenue for these large deals. Accounts receivable decreased $35.3 million reflecting the timing of collection of the trade receivables. Additionally, accrued compensation increased $5.1 million primarily due to timing of payments for bonuses and commissions. This was partially offset by a decrease in deferred revenue of $46.3 million primarily due to the timing of revenue recognition on sales transactions, which were required to be released in accordance with our revenue recognition policy. Additionally, accounts payable decreased $17.3 million, primarily due to timing of purchases of inventory and payments to our suppliers.
Cash used in operating activities was $46.8 million for fiscal 2012. Our net loss was $24.5 million for fiscal 2012. Non-cash items included in net loss consisted primarily of depreciation and amortization expense of $14.6 million, share-based compensation expense of $10.1 million, gain on pension plan curtailment of $1.3 million, loss on settlement of pension plan of $1.0 million, impairment on investments and long-lived assets of $0.5 million, changes in deferred income taxes of $1.7 million and changes in other non-cash items of $1.0 million. Net change in operating assets and liabilities was $50.0 million. The primary uses of cash in operating activity were an increase in inventory and a decrease in deferred revenue. The primary sources of cash in operating activities were an increase in accounts receivable and decrease in deferred cost of revenue.
For fiscal 2012, deferred revenue decreased $36.5 million and deferred cost of revenue decreased $37.3 million, primarily due to the timing of revenue recognition on sales transactions, which were required to be deferred in accordance with our revenue recognition policy. Inventory increased $44.6 million primarily related to finished goods inventory that has already been shipped to our customers for which we are awaiting customer acceptance. This was partially offset by a $7.2 million inventory write down to reflect reduced demand for manufacturing parts for earlier generation products. Additionally, accounts payable decreased $2.5 million, primarily due to our efforts to more closely align payments with customer receipts and as part of the efforts to manage our working capital more closely. Accrued compensation decreased $5.3 million primarily due to timing of payments.
Investing Activities and Acquisition
Cash used in investing activities and acquisition was $26.3 million in fiscal 2014, primarily due to purchases of property and equipment of $16.8 million largely for our new headquarters facility, cash used to acquire FileTek of $9.2 million and an increase in restricted cash and other investment activities of $2.1 million. This was offset by cash proceeds of $1.7 million for the sale of an investment.
Cash used in investing activities and acquisition was $1.6 million in fiscal 2013, primarily due to purchases of property and equipment of $3.8 million offset by proceeds from other investing activities of $2.3 million.
Cash used in investing activities and acquisition was $7.7 million in fiscal 2012, primarily due to purchases of property and equipment of $5.5 million and other investing activities of $2.2 million.
46
Financing Activities
Cash used in financing activities was $5.5 million in fiscal 2014, primarily due to the repurchase of our common stock of $11.0 million, the funding of restricted stock units withheld for taxes of $2.7 million, which was partially offset by the issuance of stock under our employee stock purchase plan and stock option exercises of $8.1 million.
Cash used in financing activities was $2.5 million in fiscal 2013, primarily due to the payment of our credit facility of $15.3 million, the repurchase of our common stock of $2.8 million, the funding of restricted stock units withheld for taxes of $2.1 million, which was partially offset by the issuance of stock under our employee stock purchase plan and stock option exercises of $17.6 million.
Cash provided by financing activities was $19.1 million in fiscal 2012, primarily due to proceeds from draw-downs on our credit facility of $15.0 million, the issuance of stock under our employee stock purchase plan and stock option exercises of $5.2 million, which was partially offset by the funding of RSUs withheld for taxes of $1.1 million. We did not purchase any treasury stock during fiscal 2012.
In January 2013, the Company's board of directors approved a plan for the Company to repurchase shares of its common stock with a market value of up to $15.0 million. In November 2013, the Company announced an increase in the authorized repurchase amount to $30.0 million. The Company's common stock may be repurchased in the open market or through negotiated transactions, including 10b5-1 trading plans that would enable the Company to repurchase its shares during periods outside of its normal trading windows. The repurchase program expires December 31, 2014. Purchases will cease if the authorized funds are spent or the program is discontinued. The Company is not obligated to acquire any particular amount of stock, and the program may be suspended or terminated at any time at the Company's discretion. These repurchases are reflected in our balance sheet as treasury stock and are available for future issuance.
During fiscal 2014, we repurchased approximately 897,400 shares of outstanding common stock for a total of approximately $11.0 million. During fiscal 2013, we repurchased 197,622 shares of outstanding common stock for a total of approximately $2.8 million.
In February 2009, the Board of Directors authorized a share repurchase program of up to $40.0 million of our common stock. Under this program, we were able to purchase shares of common stock through open market transactions and privately negotiated purchases at prices deemed appropriate by management. During fiscal 2012, there were no repurchases. This share repurchase program expired in March 2012.
We expect to continue to invest in the business including working capital, capital expenditures and operating expenses. We intend to fund these activities with our cash reserves, cash generated from operations, if any, and with the principal that is available for withdrawal on the credit facility to the extent that cash provided by operating activities is not sufficient to fund our cash needs. Increases in operating expenses may not result in an increase in our revenue and our anticipated revenue may not be sufficient to support these increased expenditures. We anticipate that operating expenses and working capital will constitute a material use of our cash resources.
Contractual Obligations and Commitments
The following are contractual obligations and commitments at June 27, 2014, associated with lease obligations and contractual commitments (in thousands):
Payments due by period | ||||||||||||||||||||
Total | Less than 1 year | 1 - 3 years | 3 - 5 years | More than 5 years | ||||||||||||||||
Operating leases | $ | 28,991 | $ | 6,229 | $ | 6,841 | $ | 4,754 | $ | 11,167 | ||||||||||
Purchase obligations | 18,527 | 17,194 | 1,333 | — | — | |||||||||||||||
Total | $ | 47,518 | $ | 23,423 | $ | 8,174 | $ | 4,754 | $ | 11,167 | ||||||||||
Operating Leases—We lease certain real and personal property under non-cancelable operating leases. Certain leases require us to pay property taxes, insurance and routine maintenance and include renewal options and escalation clauses.
As of June 27, 2014, we had total outstanding commitments on non-cancelable operating leases of our real property of $28.0 million, of which $22.5 million related to our domestic leases. These domestic leases include our headquarters in Milpitas, California and our warehouse facility in Chippewa Falls, Wisconsin. A significant portion of our domestic leases will expire in fiscal 2024. The remainder of our domestic leases will expire in fiscal 2015 through 2019. The total outstanding commitment for non-cancelable international real property operating leases is $5.5 million. The total outstanding commitments included $2.4 million relating to our leased facility in Japan, which we assumed as part of our acquisition of SGI Japan that closed in March 2011. Our major facility leases in our international locations are generally for terms of two to nine years, and generally do not provide renewal options, except for our leases in Japan, that generally provide for a two-year renewal option.
47
As of June 27, 2014, personal property under operating lease was comprised primarily of automobiles and office equipments. Total outstanding commitments under these leases were approximately $1.0 million at June 27, 2014.
Purchase Obligations—From time to time, we issue purchase orders to our contract manufacturers for the procurement of materials to be used for upcoming orders, particularly for those components that have long lead times. These purchase orders vary in size depending on our projected requirements. If we do not consume these materials on a timely basis or if our relationship with one of our contract manufacturers was to terminate, we could experience an abnormal increase to our inventory carrying amount and related accounts payable.
In connection with supplier agreements, we agreed to purchase certain units of inventory and non-inventory through fiscal 2015. As of June 27, 2014, there was a remaining commitment of approximately $18.5 million, of which $17.2 million is expected to be paid in the next 12 months.
In June 2013, we signed a lease for a new headquarters facility and incurred approximately $10.7 million for capital expenditures and received approximately $5.9 million in lease incentives.
Other than the contractual obligations and commitments described above, we have no significant unconditional purchase obligations or similar instruments. We are not a guarantor of any other entities’ debt or other financial obligations.
Uncertain Tax Positions—As of June 27, 2014, the liability for uncertain tax positions, net of offsetting tax benefits associated with the correlative effects of state income taxes and interest deductions, was $2.1 million. As of June 27, 2014, the Company has accrued $7.3 million of interest and penalty associated with its uncertain tax positions. The Company cannot conclude on the range of cash payments that will be made within the next twelve months associated with its uncertain tax positions.
Credit facility—On December 5, 2011, we entered into a five-year credit facility in the aggregate principal amount of $35.0 million. The availability under the credit facility is limited to a borrowing base, subject to meeting certain conditions set forth in the credit facility. The credit facility included a feature that allowed the Company to increase the revolver amount in the first 18 months. The Company exercised this feature, and on May 1, 2012, the revolver amount of our credit facility was increased by $5.0 million to an aggregate principal amount of $40.0 million. On February 25, 2013, the Company amended the agreement and reduced the revolver amount to $25.0 million. During fiscal 2013, the Company made a $15.7 million payment to pay off the outstanding balance with interest on the credit facility. Accordingly, as of June 27, 2014, we had no outstanding balance owed on the credit facility. As of June 27, 2014, the maximum amount available to be borrowed under the credit facility was approximately $23.0 million which takes into account a $2.0 million outstanding letter of credit to back the Company's obligation to pay for goods or services to a supplier. This availability will fluctuate over time, and generally monthly, due to a variety of factors including our overall mix of sales and resulting accounts receivable with international and domestic customers, U.S. governmental agencies and a few individual customer accounts which may result in high concentrations of accounts receivable as compared to the overall level of our account receivable. See Note 16 "Credit Facility" in our audited financial statements in this Form 10-K for further information on the credit facility.
Guarantees and Indemnifications—We have issued financial guarantees to cover rent on leased facilities and equipment, to government authorities for VAT and other taxes and to various other parties to support payments in advance of future delivery on goods and services. The majority of our financial guarantees have terms of one year or more. The maximum potential obligation under financial guarantees at June 27, 2014 was $4.6 million, for which we have $4.5 million of assets held as collateral. The full amount of the assets held as collateral are included in short-term and long-term restricted cash and cash equivalents in the unaudited condensed consolidated balance sheets.
Additionally, we enter into standard indemnification agreements with our customers and certain other business partners in the ordinary course of business. These agreements include provisions for indemnifying the customer against any claim brought by a third party to the extent any such claim alleges that our product infringes a patent, copyright or trademark, or misappropriates a trade secret, of that third party. The agreements generally limit the scope of the available remedies in a variety of industry-standard methods, including, but not limited to, product usage and geography-based limitations, a right to control the defense or settlement of any claim, and a right to replace or modify the infringing products to make them non-infringing. We have not incurred significant expenses related to these indemnification agreements and no material claims for such indemnifications were outstanding as of June 27, 2014. As a result, we believe the estimated fair value of these indemnification agreements, if any, to be immaterial and, accordingly, no liability has been recorded with respect to such indemnifications as of June 27, 2014.
Off Balance Sheet Arrangements—Our credit facility includes a $10.0 million letter of credit subfacility. As of June 27, 2014 we have a $2.0 million outstanding letter of credit to back our obligation to pay or perform when required to do so pursuant to the requirements of an underlying agreement or the provision of goods or services to a supplier.
We had no other off-balance sheet arrangements as of June 27, 2014.
48
Critical Accounting Policies and Estimates
Our discussion and analysis of our financial condition and results of operations are based on our consolidated financial statements, which have been prepared in accordance with accounting principles generally accepted in the United States of America. The preparation of these financial statements requires us to make estimates and judgments that affect the reported amounts of revenue and expenses during the reporting period and the reported amounts of assets and liabilities and the disclosure of contingent assets and liabilities as of the date of the financial statements. We periodically evaluate our material estimates and judgments based on the terms of underlying agreements, the expected course of development, historical experience and other factors that we believe are reasonable under the circumstances. However, actual future results may vary from our estimates.
We believe that the following accounting policies are significantly affected by critical accounting estimates and that they are both highly important to the portrayal of our financial condition and results and require difficult management judgments and assumptions about matters that are inherently uncertain. Note 2 of the consolidated financial statements in Part II Item 8 of this Annual Report on Form 10-K describes the significant accounting policies used in the preparation of the consolidated financial statements. Certain of these significant accounting policies are considered to be critical accounting policies.
Our critical accounting policies and estimates are as follows:
• | Revenue recognition; |
• | Share-based compensation; |
• | Restructuring reserve; |
• | Inventory valuation; |
• | Impairment of intangibles and long-lived assets; |
• | Retirement benefit obligations; and |
• | Accounting for income taxes. |
Revenue Recognition. We enter into sales contracts to deliver multiple products and/or services. A typical multiple-element arrangement includes product, third-party product, customer support services and professional services. We also sell software products as part of certain multiple-element arrangements. In addition to selling multiple-element arrangements, we also sell certain products and services on a stand-alone basis.
Product revenue. We recognize revenue from sales of products, primarily hardware, when persuasive evidence of an arrangement exists, shipment has occurred and title has transferred, the sales price is fixed or determinable and collection of the resulting receivable is reasonably assured. In arrangements where a formal acceptance of products or services is required by the customer, revenue is recognized upon meeting such acceptance criteria.
Service revenue. Service revenue includes customer support services, primarily hardware maintenance services and professional services, which include consulting services and product integration services. Professional services are offered under time and material or fixed fee-based contracts or as part of multiple-element arrangements. Professional services revenue is recognized as services are completed.
Multiple-element arrangements. Our multiple-element arrangements include products, customer support services and/or professional services. Certain multiple-element arrangements include software products integrated with the hardware (“Hardware Appliance”) and we provide unspecified software updates and enhancements to the software through our service contracts.
The Financial Accounting Standards Board ("FASB") amended the Accounting Standards Codification (“ASC”) as summarized in Accounting Standards Update ("ASU") No. 2009-14, Software (Topic 985): Certain Revenue Arrangements That Include Software Elements and ASU No. 2009-13, Revenue Recognition (Topic 605): Multiple-Deliverable Revenue Arrangements. ASU 2009-14 amends industry specific revenue accounting guidance for software and software related transactions to exclude from its scope tangible products containing software components and non-software components that function together to deliver the product's essential functionality. ASU 2009-13 amends the accounting for multiple-element arrangements to provide guidance on how the deliverables in an arrangement should be separated and eliminates the use of the residual method. ASU 2009-13 also requires an entity to allocate revenue using the relative selling price method. The standard establishes a hierarchy of evidence to determine the stand-alone selling price of a deliverable based on vendor-specific objective evidence ("VSOE"), third-party evidence ("TPE") and the best estimate of selling price ("BESP"). If VSOE is available, it would be used to determine the selling price of a deliverable. If VSOE is not available, the entity would determine whether TPE is available. If so, TPE must be used to determine the selling price. If TPE is not available, then the BESP would be used.
49
We adopted the provisions of ASU 2009-13 and ASU 2009-14 on a prospective basis for new and materially modified arrangements originating after June 25, 2010. Pursuant to the guidance of ASU 2009-13, when a sales arrangement contains multiple elements, such as products, software, customer support services, and/or professional services, we allocate revenue to each element based on the aforementioned selling price hierarchy. In multiple element arrangements where software is essential to the functionality of the products, revenue is allocated to each separate unit of accounting for each of the non-software deliverables and to the software deliverables as a group using the relative selling prices of each of the deliverables in the arrangement based on the aforementioned selling price hierarchy. If the arrangement contains more than one software deliverable, the arrangement consideration allocated to the software deliverables as a group is then recognized as one unit of accounting using the guidance for recognizing software revenue.
We evaluate each deliverable in an arrangement to determine whether they represent separate units of accounting. The delivered item constitutes a separate unit of accounting when it has standalone value and there are no customer-negotiated refunds or return rights for the delivered elements. The Company's Hardware Appliances are sold on a stand-alone basis and customers are able to sell the Hardware Appliances to other buyers; accordingly, the Company has concluded that its Hardware Appliances have stand-alone value. Allocation of the consideration is determined at arrangement inception on the basis of each unit's relative selling price. We limit the amount of revenue recognition for delivered product elements to the amount that is not contingent on the future delivery of products or services, future performance obligations or subject to customer-specified return or refund privileges.
We have not consistently established VSOE of fair value of any of our products or services. In addition, we have not established TPE as there are no similar or interchangeable competitor products or services in standalone sales to similarly situated customers. Therefore, revenue from our multiple-element arrangements is allocated based on the BESP. The objective of BESP is to determine the price at which we would transact a sale if a product or service were sold on a stand-alone basis. We determine BESP for product or service by considering multiple factors including, but not limited to, overall market conditions, including geographic or regional specific market factors, profit objectives and pricing practices.
For sales contracts entered into prior to fiscal 2011, we recognize revenue pursuant to the previous guidance for multiple-element arrangements. For arrangements which include Hardware Appliances or arrangements where the undelivered element is post contract customer support ("PCS"), we have not established VSOE of fair value of the element. Therefore, revenue and related cost of revenue from these arrangements have been deferred and recognized ratably over the PCS period as combined product and service revenue in the consolidated statements of operations.
Share-Based Compensation. We use the fair value method of accounting for share-based compensation arrangements, including grants of employee stock awards and purchases under an employee stock purchase plan. The fair values of our unvested stock awards are calculated based on the fair value of our common stock at the dates of grant, using the Black-Scholes option-pricing model, which requires the input of subjective assumptions. These assumptions include estimating the length of time employees will retain their vested stock awards before exercising them, the estimated volatility of our common stock over the expected term and the number of awards that will ultimately not vest (i.e. forfeitures).
Our assumptions on the estimated length of time employees will retain their vested stock awards before exercising them is based on examining our historical pattern of option exercises to determine if there were any discernible activity patterns based on certain employee populations. From this analysis, we identified two employee populations to which to apply the Black-Scholes model. We analyzed SGI's historical forfeiture rate and calculated forfeiture rate using a weighted average of the actual forfeitures as a percentage of average unvested options. We determined the implied volatility based on historical volatility of SGI's common stock. Prior to the third quarter of fiscal 2012, we utilized the average of historical volatility and volatility calculated based on actively traded options on SGI common stock. The estimated fair value of stock awards is expensed on a straight-line basis over the expected term of the grant. Compensation expense for purchases under the employee stock purchase plan is recognized based on the estimated fair value of the common stock during each offering period and the percentage of the purchase discount.
The assumptions used in calculating the fair value of share-based payment awards represent our best estimates, but these estimates involve inherent uncertainties and the application of management judgment. Changes to any of these assumptions could have a material impact on our reported share-based compensation expense.
50
Restructuring Reserve. In recent years, we have recorded accruals in connection with our restructuring programs. These accruals include estimates of employee separation costs, fixed asset write-offs and the settlements of contractual obligations, including lease terminations resulting from our actions. Accruals associated with employee termination costs are accrued when it is determined that a liability has been incurred, which is generally when individuals have been notified of their termination dates and expected severance payments. Fixed asset write-offs primarily consist of equipment, leasehold improvements, and furnitures and fixtures associated with lease terminations, and are based on an estimate of the amounts and timing of future cash flows related to the expected future remaining use and ultimate sale or disposal of the equipment and furniture. Accruals associated with vacated facilities are accrued when we have vacated the premises. Our estimates may need to be adjusted upon the occurrence of future events, which include, but are not limited to, changes in the estimated time to enter into a sublease, the sublease terms and the sublease rates. Due to the extended contractual obligations of certain of these leases and the inherent volatility of the commercial real estate markets, future adjustments to these vacated facilities accruals could have a material impact on our results of operations and financial position.
Inventory Valuation. We value our inventories at the lower of cost or market with cost determined on a first-in, first-out basis. We write down obsolete inventory or inventory in excess of our estimated usage to its estimated market value less cost to sell, if less than its cost. Inherent in our estimates of market value in determining inventory valuation are estimates related to future demand and technological obsolescence of our products. Any significant unanticipated changes in demand or technological developments could have a significant impact on the value of our inventories and our results of operations and financial position could be materially affected.
Impairment of Intangibles and Long-Lived Assets. We assess the carrying values of long-lived assets, including our intangible assets with finite lives, for possible impairment when we identify events or when we believe that circumstances may have changed to indicate that the carrying amount of a long-lived asset may not be recoverable. Such events or changes in circumstances may include the significant under-performance relative to historical or projected future operating results, significant changes in the strategy for our overall business, discontinuation of a product or product line, a sudden or consistent decline in the forecast for a product, changes in technology or in the way an asset is being used, or an adverse change in legal factors or in the business climate. An impairment loss would be recognized when the sum of the estimated future cash flows expected to result from the use of the asset and its eventual disposition is less than its carrying amount. Such impairment loss would be measured as the difference between the carrying amount of the asset and its fair value. Cash flow assumptions used in calculating the fair value are based on historical and forecasted revenue, operating costs and other relevant factors. This analysis requires judgment with respect to many factors, including future cash flows, changes in technology, the continued success of product lines and future volume and revenue and expense growth rates. If our estimate of future operating results changes, or if there are changes to other assumptions, the estimate of the fair value of our long-lived assets could change significantly. Such change could result in impairment charges in future periods, which could have a material impact on our results of operations and financial position.
Retirement Benefit Obligations. Our defined benefit obligations and plan assets are dependent on various assumptions. Our major assumptions relate primarily to discount rates, rates of compensation growth and expected long-term rates of return on plan assets. Our discount rate assumption is based on current investment yields of a portfolio of high quality, fixed-income debt instruments that would produce cash flows sufficient in timing and amount to settle projected future benefits. Expected long-term rate of return on assets is determined using the projected long-term rate of return estimated by the insurance company for its general fund for the defined benefit plan in Germany and based on historical portfolio results and target asset allocations, as well as the projected long-term rate of return based on the Japanese market for the defined benefit plan in Japan. The weighted-average rates used are set forth in Note 20 to the consolidated financial statements in Part II, Item 8 of this Annual Report on Form 10-K. For fiscal 2014, the effect of rate changes in these assumptions does not result in a material change in the net periodic benefit cost.
Accounting for Income Taxes. The determination of our tax provision is subject to judgments and estimates. The carrying value of our net deferred tax assets, which is comprised primarily of future tax deductions, net operating loss carryovers and tax credit carryovers, is subject to significant judgment as to whether it is more likely than not our deferred tax assets will be realized. In determining whether the realization of these deferred tax assets may be impaired, we evaluate both positive and negative evidence. As of June 27, 2014, we have recorded a valuation allowance against the majority of our net deferred tax assets. Based on all available evidence, on a jurisdictional basis, including our historical operating results, and the uncertainty of predicting our future income, the valuation allowance reduces our deferred tax assets to an amount that is more likely than not to be realized. The valuation allowance is attributable to U.S. federal, state and certain foreign deferred tax assets primarily consisting of net operating loss carryovers, tax credit carryovers, accrued expenses and other temporary differences.
51
We recognize liabilities for uncertain tax positions based on a two-step process. The first step is to evaluate the tax position for recognition by determining solely on its technical merits of the law whether the more likely than not threshold is met. If the first step is satisfied, the second step requires us to estimate and measure the tax benefit as the largest amount that is more than 50% likely to be realized upon ultimate settlement with the taxing authorities. We evaluate these uncertain tax positions on a quarterly basis, based on factors including, but not limited to, changes in facts or circumstances, changes in tax law, effectively settled issues under audit, new audit activity and lapses in the statutes of limitations on assessment. A change in recognition or measurement would result in the recognition of a tax benefit or an additional charge to the tax provision in the period that such event occurs and could have a material impact on our results of operations and financial position.
Recent Accounting Pronouncements
See Note 2 to our consolidated financial statements in Part II, Item 8 of this Annual Report on Form 10-K for a description of recent accounting pronouncements, including our expected adoption dates and estimated effects on our results of operations, financial condition and cash flows.
52
Item 8. Financial Statements and Supplementary Data
Index to Consolidated Financial Statements
Page | ||
Financial Statements: | ||
Consolidated Statements of Comprehensive Income (Loss) | ||
Financial Statement Schedule: | ||
53
REPORT OF INDEPENDENT REGISTERED PUBLIC ACCOUNTING FIRM
To the Board of Directors and Stockholders of
Silicon Graphics International Corp.
Milpitas, CA
We have audited the accompanying consolidated balance sheets of Silicon Graphics International Corp. and subsidiaries (the "Company") as of June 27, 2014 and June 28, 2013, and the related consolidated statements of operations, comprehensive loss, stockholders' equity, and cash flows for each of the three years in the period ended June 27, 2014. These financial statements and financial statement schedule are the responsibility of the Company's management. Our responsibility is to express an opinion on the financial statements and financial statement schedule based on our audits.
We conducted our audits in accordance with the standards of the Public Company Accounting Oversight Board (United States). Those standards require that we plan and perform the audit to obtain reasonable assurance about whether the financial statements are free of material misstatement. An audit includes examining, on a test basis, evidence supporting the amounts and disclosures in the financial statements. An audit also includes assessing the accounting principles used and significant estimates made by management, as well as evaluating the overall financial statement presentation. We believe that our audits provide a reasonable basis for our opinion.
In our opinion, such consolidated financial statements present fairly, in all material respects, the financial position of Silicon Graphics International Corp. and subsidiaries at June 27, 2014 and June 28, 2013, and the results of their operations and their cash flows for each of the three years in the period ended June 27, 2014, in conformity with accounting principles generally accepted in the United States of America. Also, in our opinion, such financial statement schedule, when considered in relation to the basic consolidated financial statements taken as a whole, presents fairly, in all material respects, the information set forth therein.
We have also audited, in accordance with the standards of the Public Company Accounting Oversight Board (United States), the Company's internal control over financial reporting as of June 27, 2014, based on the criteria established in Internal Control - Integrated Framework (1992) issued by the Committee of Sponsoring Organizations of the Treadway Commission and our report dated September 8, 2014 expressed an unqualified opinion on the Company's internal control over financial reporting.
/s/ DELOITTE & TOUCHE LLP
San Jose, CA
September 8, 2014
54
SILICON GRAPHICS INTERNATIONAL CORP.
CONSOLIDATED STATEMENTS OF OPERATIONS
(In thousands, except per share amounts)
Fiscal Year Ended | |||||||||||
June 27, 2014 | June 28, 2013 | June 29, 2012 | |||||||||
Revenue | |||||||||||
Product | $ | 353,267 | $ | 530,625 | $ | 479,530 | |||||
Service | 154,366 | 172,883 | 191,274 | ||||||||
Combined product and service | 22,313 | 63,719 | 82,183 | ||||||||
Total revenue (Note 2) | 529,946 | 767,227 | 752,987 | ||||||||
Cost of revenue | |||||||||||
Product | 293,115 | 435,288 | 398,272 | ||||||||
Service | 84,312 | 103,469 | 108,065 | ||||||||
Combined product and service | 14,112 | 39,418 | 52,833 | ||||||||
Total cost of revenue | 391,539 | 578,175 | 559,170 | ||||||||
Gross profit | 138,407 | 189,052 | 193,817 | ||||||||
Operating expenses: | |||||||||||
Research and development | 63,526 | 60,611 | 62,356 | ||||||||
Sales and marketing | 72,681 | 78,730 | 88,414 | ||||||||
General and administrative | 55,796 | 54,317 | 62,021 | ||||||||
Restructuring | 1,251 | 9,048 | 2,469 | ||||||||
Total operating expenses | 193,254 | 202,706 | 215,260 | ||||||||
Loss from operations | (54,847 | ) | (13,654 | ) | (21,443 | ) | |||||
Interest expense, net | (117 | ) | (311 | ) | (297 | ) | |||||
Other income (expense), net | 2,162 | (1,478 | ) | (1,720 | ) | ||||||
Total other income (expense), net | 2,045 | (1,789 | ) | (2,017 | ) | ||||||
Loss before income taxes | (52,802 | ) | (15,443 | ) | (23,460 | ) | |||||
Income tax provision (benefit) | 12 | (12,623 | ) | 1,001 | |||||||
Net loss | $ | (52,814 | ) | $ | (2,820 | ) | $ | (24,461 | ) | ||
Basic and diluted net loss per share: | $ | (1.54 | ) | $ | (0.09 | ) | $ | (0.77 | ) | ||
Shares used in computing basic and diluted net loss per share: | 34,260 | 32,909 | 31,653 | ||||||||
See accompanying notes.
55
SILICON GRAPHICS INTERNATIONAL CORP.
CONSOLIDATED STATEMENTS OF COMPREHENSIVE LOSS
(In thousands)
Fiscal Year Ended | ||||||||||||
June 27, 2014 | June 28, 2013 | June 29, 2012 | ||||||||||
Net loss | $ | (52,814 | ) | $ | (2,820 | ) | $ | (24,461 | ) | |||
Other components of comprehensive loss: | ||||||||||||
Unrecognized gain (loss) on defined benefit plans, net of zero tax | (940 | ) | 65 | (2,150 | ) | |||||||
Change in unrealized gains and losses on derivative instruments, net of zero tax | (1,738 | ) | — | — | ||||||||
Unrealized losses on derivative instruments reclassified into earnings, net of zero tax | 1,651 | — | — | |||||||||
Cumulative translation adjustment | (710 | ) | (736 | ) | 97 | |||||||
Other comprehensive loss | (1,737 | ) | (671 | ) | (2,053 | ) | ||||||
Total comprehensive loss | $ | (54,551 | ) | $ | (3,491 | ) | $ | (26,514 | ) | |||
56
SILICON GRAPHICS INTERNATIONAL CORP.
CONSOLIDATED BALANCE SHEETS
(In thousands, except per share amounts)
June 27, 2014 | June 28, 2013 | ||||||
ASSETS | |||||||
Current assets: | |||||||
Cash and cash equivalents | $ | 109,297 | $ | 175,181 | |||
Current portion of restricted cash | 2,273 | 531 | |||||
Accounts receivable, net of allowance for doubtful accounts of $287 and $1,074 as of June 27, 2014 and June 28, 2013, respectively | 72,076 | 59,842 | |||||
Inventories | 47,354 | 61,770 | |||||
Deferred cost of revenue | 12,180 | 21,204 | |||||
Prepaid expenses and other current assets | 19,802 | 14,094 | |||||
Total current assets | 262,982 | 332,622 | |||||
Non-current portion of restricted cash | 2,177 | 2,853 | |||||
Property and equipment, net | 34,584 | 26,170 | |||||
Goodwill and intangible assets, net | 13,207 | 6,174 | |||||
Non-current portion of deferred cost of revenue | 7,592 | 7,281 | |||||
Other assets | 44,396 | 32,753 | |||||
Total assets | $ | 364,938 | $ | 407,853 | |||
LIABILITIES AND STOCKHOLDERS’ EQUITY | |||||||
Current liabilities: | |||||||
Accounts payable | $ | 53,128 | $ | 51,531 | |||
Accrued compensation | 20,049 | 28,504 | |||||
Current portion of deferred revenue | 78,675 | 86,357 | |||||
Other current liabilities | 53,660 | 35,364 | |||||
Total current liabilities | 205,512 | 201,756 | |||||
Non-current portion of deferred revenue | 45,422 | 50,362 | |||||
Long-term income taxes payable | 10,114 | 10,149 | |||||
Retirement benefit obligations | 12,931 | 11,542 | |||||
Other non-current liabilities | 8,807 | 3,790 | |||||
Total liabilities | 282,786 | 277,599 | |||||
Commitments and contingencies (Note 24) | |||||||
Stockholders’ equity: | |||||||
Preferred stock, par value $0.001 per share; 12,000 shares authorized; none outstanding | — | — | |||||
Common stock, par value $0.001 per share; 120,000 shares authorized; 36,173 shares and 34,795 shares issued and outstanding at June 27, 2014 and June 28, 2013, respectively | 36 | 35 | |||||
Additional paid-in capital | 527,525 | 510,092 | |||||
Treasury stock, at cost (1,844 shares at June 27, 2014 and 946 at June 28, 2013) | (18,677 | ) | (7,692 | ) | |||
Accumulated other comprehensive loss | (3,888 | ) | (2,151 | ) | |||
Accumulated deficit | (422,844 | ) | (370,030 | ) | |||
Total stockholders’ equity | 82,152 | 130,254 | |||||
Total liabilities and stockholders’ equity | $ | 364,938 | $ | 407,853 | |||
See accompanying notes.
57
SILICON GRAPHICS INTERNATIONAL CORP.
CONSOLIDATED STATEMENTS OF STOCKHOLDERS' EQUITY
(In thousands, except share amounts)
Common Stock | Treasury Stock | Additional Paid-in Capital | Accumulated Other Comprehensive Income (Loss) | Accumulated Deficit | Total Stockholders’ Equity | |||||||||||||||||||||||||
Shares | Amount | Shares | Amount | |||||||||||||||||||||||||||
Balance at June 24, 2011 | 31,850,239 | $ | 31 | (748,795 | ) | $ | (4,912 | ) | $ | 470,343 | $ | 573 | $ | (342,749 | ) | $ | 123,286 | |||||||||||||
Net loss | — | — | — | — | — | — | (24,461 | ) | (24,461 | ) | ||||||||||||||||||||
Other comprehensive loss | — | — | — | — | — | (2,053 | ) | — | (2,053 | ) | ||||||||||||||||||||
Issuance of common stock under employee stock options and employee stock purchase plan, net of taxes | 704,792 | 2 | — | — | 4,057 | — | — | 4,059 | ||||||||||||||||||||||
Restricted common stock | 167,975 | — | — | — | — | — | — | — | ||||||||||||||||||||||
Share-based compensation in connection with employee stock option plans and other | — | — | — | — | 10,061 | — | — | 10,061 | ||||||||||||||||||||||
Balance at June 29, 2012 | 32,723,006 | 33 | (748,795 | ) | (4,912 | ) | 484,461 | (1,480 | ) | (367,210 | ) | 110,892 | ||||||||||||||||||
Net loss | — | — | — | — | — | — | (2,820 | ) | (2,820 | ) | ||||||||||||||||||||
Other comprehensive loss | — | — | — | — | — | (671 | ) | — | (671 | ) | ||||||||||||||||||||
Issuance of common stock under employee stock options and employee stock purchase plan, net of taxes | 1,820,629 | 2 | — | — | 15,531 | — | — | 15,533 | ||||||||||||||||||||||
Repurchase of treasury stock | — | — | (197,622 | ) | (2,780 | ) | — | — | — | (2,780 | ) | |||||||||||||||||||
Restricted common stock | 251,705 | — | — | — | — | — | — | — | ||||||||||||||||||||||
Share-based compensation in connection with employee stock option plans and other | — | — | — | — | 10,100 | — | — | 10,100 | ||||||||||||||||||||||
Balance at June 28, 2013 | 34,795,340 | 35 | (946,417 | ) | (7,692 | ) | 510,092 | (2,151 | ) | (370,030 | ) | 130,254 | ||||||||||||||||||
Net loss | — | — | — | — | — | — | (52,814 | ) | (52,814 | ) | ||||||||||||||||||||
Other comprehensive loss | — | — | — | — | — | (1,737 | ) | — | (1,737 | ) | ||||||||||||||||||||
Issuance of common stock under employee stock options and employee stock purchase plan, net of taxes | 1,033,273 | 1 | — | — | 5,454 | — | — | 5,455 | ||||||||||||||||||||||
Repurchase of treasury stock | — | — | (897,400 | ) | (10,985 | ) | — | — | — | (10,985 | ) | |||||||||||||||||||
Restricted common stock | 344,177 | — | — | — | — | — | — | — | ||||||||||||||||||||||
Share-based compensation in connection with employee stock option plans and other | — | — | — | — | 11,979 | — | — | 11,979 | ||||||||||||||||||||||
Balance at June 27, 2014 | 36,172,790 | $ | 36 | (1,843,817 | ) | $ | (18,677 | ) | $ | 527,525 | $ | (3,888 | ) | $ | (422,844 | ) | $ | 82,152 | ||||||||||||
See accompanying notes.
58
SILICON GRAPHICS INTERNATIONAL CORP.
CONSOLIDATED STATEMENTS OF CASH FLOWS
(In thousands)
Fiscal Year Ended | |||||||||||
June 27, 2014 | June 28, 2013 | June 29, 2012 | |||||||||
CASH FLOWS FROM OPERATING ACTIVITIES: | |||||||||||
Net loss | $ | (52,814 | ) | $ | (2,820 | ) | $ | (24,461 | ) | ||
Adjustments to reconcile net loss to net cash (used in) provided by operating activities: | |||||||||||
Depreciation and amortization | 14,549 | 14,269 | 14,574 | ||||||||
Share-based compensation | 11,979 | 10,100 | 10,061 | ||||||||
Release of liability for unrecognized tax benefits | — | (10,306 | ) | — | |||||||
Gain on sale of investment | (1,717 | ) | — | — | |||||||
Gain on pension plan curtailment | — | — | (1,265 | ) | |||||||
Loss on settlement of pension plan | — | 39 | 993 | ||||||||
Impairment on investments and long-lived assets | 4,554 | 189 | 527 | ||||||||
Deferred income taxes | (191 | ) | (473 | ) | 1,655 | ||||||
Other non-cash items, net | 644 | 1,004 | 1,030 | ||||||||
Changes in operating assets and liabilities: | |||||||||||
Accounts receivable | (13,042 | ) | 35,292 | 10,102 | |||||||
Inventories | 10,088 | 54,263 | (44,587 | ) | |||||||
Deferred cost of revenue | 8,396 | 36,258 | 37,342 | ||||||||
Prepaid expenses and other assets | (5,794 | ) | 3,712 | (2,191 | ) | ||||||
Other assets | (1,066 | ) | (1,703 | ) | 2,986 | ||||||
Accounts payable | 2,215 | (17,319 | ) | (2,519 | ) | ||||||
Accrued compensation | (8,384 | ) | 5,078 | (5,280 | ) | ||||||
Other current liabilities | 1,893 | (1,063 | ) | (688 | ) | ||||||
Deferred revenue | (14,582 | ) | (46,348 | ) | (36,486 | ) | |||||
Income taxes payable | (147 | ) | (1,287 | ) | (3,111 | ) | |||||
Other operating liabilities | 10,339 | (2,060 | ) | (5,510 | ) | ||||||
Net cash (used in) provided by operating activities | (33,080 | ) | 76,825 | (46,828 | ) | ||||||
CASH FLOWS FROM INVESTING ACTIVITIES AND ACQUISITIONS: | |||||||||||
Purchases of property and equipment | (16,762 | ) | (3,847 | ) | (5,461 | ) | |||||
Proceeds from sale of investment | 1,717 | — | — | ||||||||
Cash used in acquisition, net | (9,200 | ) | — | — | |||||||
Other investing activities | (2,066 | ) | 2,287 | (2,239 | ) | ||||||
Net cash used in investing activities and acquisitions | (26,311 | ) | (1,560 | ) | (7,700 | ) | |||||
CASH FLOWS FROM FINANCING ACTIVITIES: | |||||||||||
Payment of credit facility | — | (15,300 | ) | — | |||||||
Proceeds from draw-down on credit facility | — | — | 15,000 | ||||||||
Funding of restricted stock units withheld for taxes | (2,685 | ) | (2,080 | ) | (1,126 | ) | |||||
Purchase of treasury stock | (10,985 | ) | (2,780 | ) | — | ||||||
Proceeds from issuance of common stock upon exercise of stock options | 3,858 | 14,169 | 1,920 | ||||||||
Proceeds from issuance of common stock under employee stock purchase plan | 4,282 | 3,444 | 3,265 | ||||||||
Net cash (used in) provided by financing activities | (5,530 | ) | (2,547 | ) | 19,059 | ||||||
Effect of exchange rate changes on cash and cash equivalents | (963 | ) | (2,388 | ) | 452 | ||||||
Net (decrease) increase in cash and cash equivalents | (65,884 | ) | 70,330 | (35,017 | ) | ||||||
Cash and cash equivalents—beginning of period | 175,181 | 104,851 | 139,868 | ||||||||
Cash and cash equivalents—end of period | $ | 109,297 | $ | 175,181 | $ | 104,851 | |||||
SUPPLEMENTAL DISCLOSURE OF OTHER CASH FLOW INFORMATION | |||||||||||
Income taxes refunded (paid) | $ | 114 | $ | 937 | $ | (310 | ) | ||||
Cash paid for interest | $ | 136 | $ | 645 | $ | 646 | |||||
NON-CASH INVESTING AND FINANCING ACTIVITIES | |||||||||||
Property and equipment purchases in accounts payable | $ | 368 | $ | 559 | $ | 685 | |||||
Inventory transfers to property and equipment | $ | 2,372 | $ | 4,318 | $ | 2,003 | |||||
See accompanying notes.
59
SILICON GRAPHICS INTERNATIONAL CORP.
NOTES TO CONSOLIDATED FINANCIAL STATEMENTS
1. DESCRIPTION OF BUSINESS
Silicon Graphics International Corp. ("SGI" or the "Company", "we", "us" or "our") is a global leader in high performance computing (HPC). We are focused on helping customers solve their most demanding business and technology challenges by delivering high performance computing and data analytics solutions that accelerate time to discovery, innovation and profitability.
We develop, market and sell a broad line of low cost, mid-range and high-end scale-out and scale-up servers, enterprise-class storage hardware, differentiating software and designed to order solutions for large-scale deployments, coupled with global support and highly experienced professional services. SGI solutions are designed to provide greater flexibility and scalability, with lower total cost of ownership.
The Company's solutions are utilized by scientific, business and government communities to fulfill highly data intensive application needs in petascale environments. Delivering industry-leading computing power and fast and efficient data movement, both within the computing system and to and from large-scale data storage installations, SGI systems enable customers to access, analyze, transform, manage and visualize information in real and near real-time. The vertical markets the Company serves include the federal government, defense and strategic systems, weather and climate, physical sciences, life sciences, energy (including oil and gas), aerospace and automotive, internet, financial services, media and entertainment and business intelligence and data analytics. The Company's headquarters is located in Milpitas, California and its primary manufacturing facility is located in Chippewa Falls, Wisconsin.
2. SUMMARY OF SIGNIFICANT ACCOUNTING POLICIES
Basis of Presentation. The consolidated financial statements reflect all adjustments, consisting only of normal, recurring adjustments that, in the opinion of management, are necessary for a fair presentation of the results of operations for the periods presented.
Fiscal Year-End. The Company has a 52 or 53-week fiscal year ending on the last Friday in June. Fiscal year 2014 was comprised of 52 weeks and ended on June 27, 2014. Fiscal year 2013 and fiscal year 2012 were comprised of 52 and 53 weeks and ended on June 28, 2013 and June 29, 2012, respectively. Included in this report are the Company’s consolidated balance sheets as of June 27, 2014 and June 28, 2013, the consolidated statements of operations, statement of comprehensive (loss) income, statements of stockholders’ equity and statements of cash flows for the three fiscal years ended June 27, 2014 ("fiscal 2014"), June 28, 2013 ("fiscal 2013") and June 29, 2012 ("fiscal 2012").
Principles of Consolidation. The consolidated financial statements include the accounts of the Company and its wholly owned subsidiaries. All inter-company balances and transactions have been eliminated.
Estimates and Assumptions. The preparation of consolidated financial statements in accordance with generally accepted accounting principles in the United States of America requires management to make estimates and assumptions that affect the reported amounts of assets, liabilities, revenue and expenses as presented in the consolidated financial statements and accompanying notes. Management bases its estimates on historical experience and various other assumptions believed to be reasonable. Although these estimates are based on management’s best knowledge of current events and actions that may impact the Company in the future, actual results may be different from the estimates. The Company’s critical accounting policies are those that affect the Company’s financial statements materially and involve difficult, subjective or complex judgments by management and include revenue recognition, share-based compensation, restructuring reserve, inventory valuation, impairment of intangibles and long-lived assets, retirement benefit obligations and accounting for income taxes.
Revenue Recognition. The Company enters into sales contracts to deliver multiple products and/or services. A typical multiple-element arrangement includes product, customer support services and professional services. The Company also sells software products as part of certain multiple-element arrangements. In addition to selling multiple-element arrangements, the Company also sells certain products and services on a stand-alone basis.
Product revenue. The Company recognizes revenue from sales of products, primarily hardware, when persuasive evidence of an arrangement exists, shipment has occurred and title has transferred, the sales price is fixed or determinable and collection of the resulting receivable is reasonably assured. In arrangements where a formal acceptance of products or services is required by the customer, revenue is recognized upon meeting such acceptance criteria.
60
SILICON GRAPHICS INTERNATIONAL CORP.
NOTES TO CONSOLIDATED FINANCIAL STATEMENTS (Continued)
Service revenue. Service revenue includes customer support services, primarily hardware maintenance services and professional services, which include consulting services and product integration services. Hardware maintenance services is deferred and recognized over the contractual period or as services are rendered to the customer. Professional services are offered under time and material or fixed fee-based contracts or as part of multiple-element arrangements. Professional services revenue is recognized as services are completed.
Multiple-element arrangements. The Company's multiple-element arrangements include products, customer support services and/or professional services. Certain multiple-element arrangements include software products integrated with the hardware (“Hardware Appliance”) and the Company provides unspecified software updates and enhancements to the software through its service contracts. For arrangements which do not include Hardware Appliances, the Company recognizes revenue from the sale of products without regard to the completion of services as product sales are not dependent on services to be functional.
The Financial Accounting Standards Board ("FASB") amended the Accounting Standards Codification (“ASC”) as summarized in Accounting Standards Update ("ASU") No. 2009-14, Software (Topic 985): Certain Revenue Arrangements That Include Software Elements and ASU No. 2009-13, Revenue Recognition (Topic 605): Multiple-Deliverable Revenue Arrangements. ASU 2009-14 amends industry specific revenue accounting guidance for software and software related transactions to exclude from its scope tangible products containing software components and non-software components that function together to deliver the product's essential functionality. ASU 2009-13 amends the accounting for multiple-element arrangements to provide guidance on how the deliverables in an arrangement should be separated and eliminates the use of the residual method. ASU 2009-13 also requires an entity to allocate revenue using the relative selling price method. The standard establishes a hierarchy of evidence to determine the stand-alone selling price of a deliverable based on vendor-specific objective evidence ("VSOE"), third-party evidence ("TPE") and the best estimate of selling price ("BESP"). If VSOE is available, it would be used to determine the selling price of a deliverable. If VSOE is not available, the entity would determine whether TPE is available. If so, TPE must be used to determine the selling price. If TPE is not available, then the BESP would be used.
The Company adopted the provisions of ASU 2009-13 and ASU 2009-14 on a prospective basis for new and materially modified arrangements originating after June 25, 2010. Pursuant to the guidance of ASU 2009-13, when a sales arrangement contains multiple elements, such as products, software, customer support services and/or professional services, the Company allocates revenue to each element based on the aforementioned selling price hierarchy. In multiple element arrangements where software is essential to the functionality of the products, revenue is allocated to each separate unit of accounting for each of the non-software deliverables and to the software deliverables as a group using the relative selling prices of each of the deliverables in the arrangement based on the aforementioned selling price hierarchy. If the arrangement contains more than one software deliverable, the arrangement consideration allocated to the software deliverables as a group is then recognized as one unit of accounting using the guidance for recognizing software revenue.
The Company evaluates each deliverable in an arrangement to determine whether they represent separate units of accounting. The delivered item constitutes a separate unit of accounting when it has standalone value and there are no customer-negotiated refunds or return rights for the delivered elements. The Company's Hardware Appliances are sold on a stand-alone basis and customers are able to sell the Hardware Appliances to other buyers; accordingly, the Company has concluded that its Hardware Appliances have stand-alone value. Allocation of the consideration is determined at arrangement inception on the basis of each unit's relative selling price. The Company limits the amount of revenue recognition for delivered product elements to the amount that is not contingent on the future delivery of products or services, future performance obligations or subject to customer-specified return or refund privileges.
The Company has not consistently established VSOE of fair value of any of its products or services. In addition, the Company has not established TPE as there are no similar or interchangeable competitor products or services in standalone sales to similarly situated customers. Therefore, revenue from these multiple-element arrangements is allocated based on the BESP. The objective of BESP is to determine the price at which the Company would transact a sale if a product or service were sold on a stand-alone basis. The Company determines BESP for product or service by considering multiple factors including, but not limited to, overall market conditions, including geographic or regional specific market factors, profit objectives and pricing practices.
For sales contracts entered into prior to fiscal 2011, the Company recognizes revenue pursuant to the previous guidance for multiple-element arrangements. For arrangements which include Hardware Appliances or arrangements where the undelivered element is post contract customer support ("PCS"), the Company had not established VSOE of fair value of the element. Therefore, revenue and related cost of revenue from these arrangements have been deferred and recognized ratably over the PCS period as combined product and service revenue in the accompanying consolidated statements of operations. Revenue from those arrangements is reported as "Combined product and service" in the Consolidated Statement of Operations.
61
SILICON GRAPHICS INTERNATIONAL CORP.
NOTES TO CONSOLIDATED FINANCIAL STATEMENTS (Continued)
Shipping and Handling Costs. Shipping and handling costs are classified as a component of cost of revenue. Customer payments of shipping and handling costs are recorded as revenue.
Research and Development. Costs related to research, design and development of Company products are charged to research and development expense as incurred. Software development costs are required to be capitalized when a product’s technological feasibility has been established through the date the product is available for general release to customers. The Company has not capitalized any software development costs, as technological feasibility is generally not established until a working model is completed, at which time substantially all development is complete.
Advertising. Advertising costs are expensed as incurred and included in selling, general and administrative expenses in the Consolidated Statements of Operations. Advertising expenses were immaterial in fiscal 2014, 2013 and 2012.
Share-Based Compensation. The Company uses the fair value method of accounting for share-based compensation arrangements. Share-based compensation arrangements currently include stock options granted, restricted shares issued (“RSAs”), restricted stock unit awards granted (“RSUs”), time-based RSUs ("executive time-based RSUs") and performance-based RSUs (“executive PSUs”) and purchases of common stock by the Company’s employees under the employee stock purchase plan ("ESPP"). The fair values of stock options and ESPP awards are estimated using the Black-Scholes option-pricing model. The fair value of RSUs and PSUs are determined based on the fair value of the stock on the date of grant. The estimated fair value of stock options, RSUs and PSUs is expensed on a straight-line basis over the vesting term of the grant. Compensation expense for purchases under the ESPP is recognized based on the estimated fair value of the common stock during each offering period and the percentage of the purchase discount.
Share-based compensation expense for stock options, RSUs, PSUs and ESPP awards has been reduced for estimated forfeitures so that compensation expense is based on options, RSUs, PSUs and ESPP awards that are ultimately expected to vest. The Company’s estimated annual forfeiture rates are based on its historical forfeiture experience.
Restructuring Expense. The Company recognizes restructuring expense resulting from significant reductions in headcount, excess manufacturing or administrative facilities that the Company plans to close, or consolidate and from other exit activities. In connection with exit activities, the Company records restructuring charges for employee termination costs, long-lived asset impairments, costs related to leased facilities abandoned or subleased and other exit-related costs. These charges are incurred pursuant to formal plans developed and approved by management. The recognition of restructuring expense requires management to make judgments and estimates regarding the nature, timing and amount of costs associated with the planned exit activity, including estimating sublease income and the fair value, less selling costs of property and equipment to be disposed of. Estimates of future liabilities may change, requiring the Company to record additional restructuring expense or to reduce the amount of liabilities previously recorded. At the end of each reporting period, the Company evaluates the remaining accrued balances to ensure their adequacy, that no excess accruals are retained and that the utilization of the provisions is for the intended purpose in accordance with developed exit plans. In the event circumstances change and the provision is no longer required, the provision is reversed. There were no significant reversals or long-lived asset impairments related to our restructuring actions in any periods presented.
Foreign Currency Transactions. The functional currency of the Company's foreign subsidiaries is the U.S. dollar, except for its Japanese subsidiary. Accordingly, all monetary assets and liabilities of the foreign subsidiaries, except for the Japanese subsidiary, are re-measured into U.S. dollars at the exchange rates in effect at the reporting date. Nonmonetary assets and liabilities are translated at historical rates and revenue and expenses are translated at exchange rates in effect during each reporting period. The foreign currency gains and losses are included as a component of other income (expense), net in the accompanying consolidated statements of operations.
The Company uses the Japanese yen as the functional currency for its Japanese subsidiary. Assets and liabilities of the Japanese subsidiary with Japanese yen are translated to U.S. dollars using exchange rates in effect at the balance sheet dates. Revenue and expenses are translated at average exchange rates in effect during the period. Translation adjustments are included in stockholders' equity in the accompanying consolidated balance sheet as a component of accumulated other comprehensive (loss) income.
Comprehensive (Loss) Income. Comprehensive (loss) income consists of two components, net loss and other comprehensive (loss) income. Other comprehensive (loss) income refers to revenue, expenses, gains and losses that under generally accepted accounting principles are recorded as an element of shareholders’ equity but are excluded from net loss. The Company’s other comprehensive (loss) income consists of unrealized gains and losses on investments categorized as available-for-sale, unrecognized gain (loss) related to defined benefit pension plans, foreign currency translation adjustments from those subsidiaries not using the U.S. dollar as the functional currency and unrealized gains and losses on derivative instruments designated as cash flow hedges.
62
SILICON GRAPHICS INTERNATIONAL CORP.
NOTES TO CONSOLIDATED FINANCIAL STATEMENTS (Continued)
Fair Value of Financial Instruments. The Company measures its financial instruments in its consolidated financial statements at fair value. The Company maximizes the use of observable inputs and minimizes the use of unobservable inputs when developing fair value measurements. When available, the Company uses quoted market prices to measure fair value (Level 1). If market prices are not available, fair value measurement is based upon models that use primarily market-based or independently-sourced market parameters (Level 2). If market observable inputs for model-based valuation techniques are not available, the Company makes judgments about assumptions market participants would use in estimating the fair value of the financial instrument (Level 3). Carrying values of cash and cash equivalents, accounts receivable, accounts payable, accrued liabilities and credit facility due within one year approximate their fair values due to the short-term nature and liquidity of these financial instruments.
Derivative Instruments. Derivatives that are not designated as hedges are adjusted to fair value through earnings. If the derivative is designated as a cash flow hedge, the effective portion of the contracts’ gains and losses resulting from changes in fair value is recognized in accumulated other comprehensive income. Amounts associated with cash flow hedges are reclassified and recognized in income when the forecasted transaction occurs or it becomes probable the forecasted transaction will not occur. The ineffective portion of the hedge is recognized in earnings immediately.
As a result of our significant international operations, we are subject to risks associated with fluctuating exchange rates. We use derivative financial instruments, principally foreign currency exchange forward contracts, to attempt to minimize the impact of exchange rate movements on our subsidiaries’ and consolidated balance sheets and operating results. Factors that could have an impact on the effectiveness of our hedging program include the accuracy of forecasts and the volatility of foreign currency markets. These programs reduce, but do not entirely eliminate, the impact of currency exchange movements. The maturities of these instruments are generally less than one year.
Cash and Cash Equivalents. The Company classifies highly liquid investments with remaining contractual maturity at date of purchase of three months or less as cash equivalents. Cash equivalents consist primarily of money market funds. Due to the short-term nature and liquidity of these financial instruments, the carrying values of these assets approximate fair value.
Restricted Cash. Short-term and long-term restricted cash consist primarily of cash deposits with banks. The cash deposits are pledged as collateral for various guarantees issued to cover rent on leased facilities and equipment, to government authorities for value-added tax (“VAT”) and other taxes and certain vendors to support payments in advance of delivery of goods and services. The deposits are classified as short-term or long-term depending on the nature of the period of guarantee.
Accounts Receivable. Accounts receivable are recorded at the invoiced amount and do not bear interest. Accounts receivable have been reduced by an estimated allowance for doubtful accounts, which is management’s best estimate of the amount of probable credit losses in existing accounts receivable. Among other factors, management determines the allowance based on customer specific experience and the aging of the receivables.
Concentration of Credit Risk. Financial instruments that potentially expose the Company to concentrations of credit risk consist primarily of cash and cash equivalents, restricted cash and accounts receivable. The Company maintains cash and cash equivalents with high credit quality financial institutions. The Company derives a significant portion of its revenue from a limited number of individual customers spread globally. The Company also derives revenue from several large customers in different industries and geographies. If the financial condition or results of operations of any one of the large customers deteriorates substantially, the Company’s operating results could be adversely affected. To reduce credit risk, management performs ongoing credit evaluations of the financial condition of significant customers. The Company generally does not require collateral and maintains reserves for probable credit losses on customer accounts.
Inventories. Inventories are stated at the lower of cost or market, which approximates actual cost on a first-in, first-out basis. The Company assesses the value of inventory on a quarterly basis based upon estimates about future demand and actual usage. To the extent that the Company determines that it is holding excess or obsolete inventory, it writes down the value of its inventory to its net realizable value. Such write downs are reflected in cost of revenue. If the inventory value is written down to its net realizable value and subsequently there is an increased demand for the inventory at a higher value, the increased value of the inventory is not realized until the inventory is sold either as a component of a system or as separate inventory.
In addition, the Company records a liability for firm, noncancelable and unconditional purchase commitments with contract manufacturers and suppliers for quantities in excess of future demand forecasts consistent with the Company's valuation of excess and obsolete inventory.
The Company maintains a long-term service inventory of parts to support maintenance arrangements. The long-term service inventory is valued based on assumptions about product life cycles, historical usage, current production status and installed base and is periodically tested for impairment. The long-term service inventory is included in other assets in the accompanying consolidated balance sheets.
63
SILICON GRAPHICS INTERNATIONAL CORP.
NOTES TO CONSOLIDATED FINANCIAL STATEMENTS (Continued)
Sales and Value Added Taxes. The Company collects various types of taxes from its customers that are assessed by governmental authorities, which are imposed on and concurrent with revenue-producing transactions. Such taxes are recorded on a net basis and are not included in revenue in the accompanying consolidated statements of operations.
Property and Equipment. Property and equipment is stated at cost, net of accumulated depreciation and amortization. Equipment and capitalized software are depreciated on a straight-line basis over their estimated useful lives, generally two to seven years. Buildings are depreciated on a straight-line basis over their estimated useful life, generally 30 to 32 years. Leasehold improvements are amortized using the straight-line method over the shorter of the estimated useful lives of the respective assets, or the original lease term.
Repairs and maintenance are charged to expense as incurred and significant improvements and betterments that substantially enhance the life of an asset are capitalized.
Impairment of Long-lived Assets. The Company reviews the carrying values of long-lived assets other than goodwill for indicators of impairment whenever events or changes in circumstances indicate that the carrying amount of an asset may not be recoverable. Recoverability of long-lived assets is measured by a comparison of the carrying amount of the assets to the estimated undiscounted future cash flows expected to be generated by the assets. If such assets are considered to be impaired, the impairment to be recognized is measured by the amount by which the carrying amount of the assets exceeds their fair value.
We review our goodwill for impairment annually in the fourth quarter of our fiscal year, or more frequently if impairment indicators arise. Impairment of goodwill is tested at the reporting unit level by comparing the reporting unit's carrying amount, including goodwill, to the fair value of the reporting unit. The fair values of the reporting units are estimated using an income approach that uses discounted cash flows. If the carrying amount of the reporting unit exceeds its fair value, goodwill is considered impaired and a second step is performed to measure the amount of impairment loss. We have three reporting units for which we assess goodwill for impairment.
Intangible Assets. Intangible assets with finite lives consist of customer relationships, customer backlog, purchased technology, trademarks and trade names acquired in business combinations. Intangible assets with finite lives are carried at cost, less accumulated amortization. Amortization is computed using the straight-line method over the estimated useful lives of the respective assets, generally two to five years, except for the customer backlog intangible asset, which is amortized as acceptance is received for a particular customer order, reflecting the use of the asset. Amortization expense is primarily recognized within cost of revenue and sales and marketing on the consolidated statement of operations.
Warranty Reserve. The warranty period for the Company’s products is generally one to three years. Estimated future warranty costs are expensed as a cost of revenue. The warranty accrual is based upon historical experience and is affected by actual product failure rates, material usage and service delivery costs incurred in correcting the product failure. The Company periodically assesses the adequacy of the warranty reserve and adjusts the amount as considered necessary. The short-term portion of the warranty reserve is included in other current liabilities and the long-term portion of the warranty reserve is recorded in non-current liabilities on the accompanying consolidated balance sheets.
Deferred Revenue and Deferred Cost of Revenue. Deferred revenue is recorded when products or services provided are invoiced prior to completion of the related performance obligations and is recognized as revenue ratably over the PCS period. We more broadly require advance and milestone payments for certain larger projects that would otherwise involve a significant lag between payments to our vendors and final acceptance of our products. These advance and milestone payments are recorded as deferred revenue and are recognized when all revenue recognition criteria have been met. Deferred revenue also includes revenue deferred for arrangements which include hardware appliances or arrangements where the undelivered element is PCS for arrangements that were entered into prior to the fiscal 2011 adoption of ASU 2009-13 and ASU 2009-14.
Deferred cost of revenue primarily consists of product costs related to revenue deferred in accordance with the Company’s revenue recognition policy. Deferred revenue and associated deferred cost of revenue, expected to be realized within one year are classified as current liabilities and current assets, respectively, on the accompanying consolidated balance sheets.
Retirement Benefit Obligations. The Company recognizes the overfunded or underfunded status of a defined benefit pension or postretirement plan as an asset or liability in the accompanying consolidated balance sheets. Changes in the funded status are recognized through accumulated other comprehensive (loss) income, a component of stockholder’s equity, in the year in which the changes occur.
64
SILICON GRAPHICS INTERNATIONAL CORP.
NOTES TO CONSOLIDATED FINANCIAL STATEMENTS (Continued)
Income Taxes. The Company computes income taxes using the asset and liability method, under which deferred income taxes are provided for temporary differences between financial reporting basis and tax basis of assets and liabilities and operating loss and tax credit carry forwards. A valuation allowance is established when necessary to reduce deferred tax assets to the amount expected to be realized. Deferred tax assets and liabilities are measured using enacted statutory tax rates expected to be realized in the years in which those temporary differences and operating loss and tax credit carryforwards are estimated to be recovered or settled.
The Company is subject to audits and examinations of tax returns by tax authorities in various jurisdictions, including the Internal Revenue Service. The Company regularly assesses the likelihood of adverse outcomes resulting from these examinations to determine the adequacy of the provision for income taxes.
Recently Issued Accounting Standards.
Revenue from Contracts with Customers. In May 2014, the FASB issued ASU 2014-09, “Revenue from Contracts with Customers,” which supersedes the revenue recognition requirements in Topic 605, “Revenue Recognition” and requires entities to recognize revenue in a way that depicts the transfer of promised goods or services to customers in an amount that reflects the consideration to which the entity expects to be entitled in exchange for those goods or services. The amendments in ASU 2014-09 are effective for annual reporting periods beginning after December 15, 2016, including interim periods within that reporting period, with early application not permitted. This guidance will be effective for the Company in fiscal 2018. The Company is currently evaluating the effects, if any, that the adoption of this guidance will have on the Company’s financial position, results of operations and cash flows.
Reporting of Discontinued Operations and Disclosures of Disposals of Component of an Entity. In April 2014, the Financial Accounting Standards Board (“FASB”) issued Accounting Standard Update (“ASU”) 2014-08, “Reporting of Discontinued Operations and Disclosures of Disposals of Components of an Entity,” which provides a narrower definition of discontinued operations than under existing U.S. GAAP. ASU 2014-08 requires that only a disposal of a component of an entity, or a group of components of an entity, that represents a strategic shift that has, or will have, a major effect on the reporting entity’s operations and financial results should be reported in the financial statements as discontinued operations. ASU 2014-08 also provides guidance on the financial statement presentations and disclosures of discontinued operations. The amendments in ASU 2014-08 are effective for all disposals of components of an entity that occur within annual periods beginning on or after December 15, 2014, and interim periods within annual periods beginning on or after December 15, 2015, with early application permitted. This guidance will be effective during the Company's third quarter of fiscal 2016. The adoption of this standard will not have a significant effect on the Company's condensed consolidated statements of operations.
3. ACQUISITION
Acquisition of FileTek
On September 30, 2013, the Company acquired certain assets of FileTek, Inc. ("FileTek"), a global provider of High Performance Data Analytics storage virtualization, large-scale data management, and active archive solutions. The total purchase price was approximately $9.2 million in cash. This acquisition expanded the Company's storage solutions by enabling customers to manage data assets efficiently and lower the cost and administration of high-volume storage. Under the terms of the agreement, SGI acquired FileTek's StorHouse and Trusted Edge software, worldwide customers, engineering team, and services and support resources.
The acquired assets and assumed liabilities were recorded by the Company at their estimated fair values as part of the Storage segment. The Company determined the estimated fair values using estimates and valuations including discounted cash flow and cost approach analyses.
65
SILICON GRAPHICS INTERNATIONAL CORP.
NOTES TO CONSOLIDATED FINANCIAL STATEMENTS (Continued)
The following table summarizes the allocation of the purchase price to the estimated fair values of the assets acquired and liabilities assumed as of the Closing Date (in thousands):
Amount | ||||
Tangible assets acquired | $ | 169 | ||
Tangible liabilities assumed | (2,922 | ) | ||
Net tangible liabilities | (2,753 | ) | ||
Intangible assets | 4,900 | |||
Goodwill | 7,053 | |||
Total net asset acquired | $ | 9,200 | ||
The fair value of the major components of the intangibles assets acquired and their estimated useful lives is as follows (in thousands):
Weighted Average Useful Life | ||||||
Intangible Asset Class | Fair Value | (in Years) | ||||
Purchased technology | $ | 4,400 | 6.25 | |||
Maintenance and service agreements and related relationships | 100 | 4 | ||||
Trade name / trademarks | 400 | 4 | ||||
Total intangible assets | $ | 4,900 | ||||
Acquisition and integration costs directly related to the acquisition were $0.2 million and were recorded in selling, general and administrative expenses.
Unaudited Pro Forma Financial Information
The unaudited financial information in the table below summarizes the combined results of operations for the Company and FileTek on a pro forma basis, as though the companies had been combined as of the beginning of fiscal 2013. The pro forma financial information is presented for informational purposes only and may not be indicative of the results of operations that would have been achieved if the acquisition had taken place at the beginning of fiscal 2013. The pro forma financial information for the periods presented include the business combination accounting effect on historical FileTek revenue, amortization and development charges from acquired intangible assets and related tax effects.
Fiscal Year Ended | ||||||
June 27, 2014 | June 28, 2013 | |||||
(In thousands, except per share amounts) | ||||||
Revenue | $ | 531,446 | $ | 773,640 | ||
Net loss | $ | (52,467 | ) | $ | (1,995 | ) |
Net loss per share - basic and diluted | $ | (1.53 | ) | $ | (0.06 | ) |
4. CONTRACT MANUFACTURING TRANSITION
In July 2013, the Company selected Jabil Circuit, Inc. ("Jabil") to be its primary global manufacturing services and supply chain management provider. The transition to Jabil was expected to be implemented as a “manage in place” model, which utilizes existing SGI facilities and personnel. On November 18, 2013, the Company signed an asset purchase agreement with Jabil, whereby Jabil would purchase SGI’s primary manufacturing facility, located in Chippewa Falls, Wisconsin and certain other manufacturing assets for $6.3 million in cash.
The total carrying of these assets held for sale were written down to their fair value of $6.3 million, resulting in an impairment charge of $0.9 million recorded in general and administrative expenses in the second quarter of fiscal 2014.
66
SGI also expected that approximately 120 of its manufacturing personnel in Chippewa Falls would transfer to Jabil. During the second quarter of fiscal 2014, the Company accrued approximately $0.7 million of compensation costs associated with the transfer of these employees as part of the agreement with Jabil, which was recorded within cost of revenue.
During the fourth quarter of fiscal 2014, the Company reevaluated its outsourcing model given lower than anticipated volumes of Company product sales. On August 4, 2014, the Company terminated the planned manage-in-place outsourcing structure and the asset purchase agreement referenced above. The Company agreed to pay approximately $0.6 million to Jabil for certain assets that were purchased for the manage-in-place model as well as for costs associated with streamlining the manufacturing process. In addition, SGI reversed the $0.7 million accrual previously booked for compensation costs associated with the proposed employee transfer discussed above. The Company will continue to optimize all of its manufacturing capabilities with the objective of improving efficiency and flexibility.
5. FINANCIAL INSTRUMENTS AND FAIR VALUE
The Company measures its assets and liabilities at fair value based upon the expected exit price, representing the amount that would be received on the sale of an asset or paid to transfer a liability in an orderly transaction between market participants. As such, fair value reflects the assumptions market participants would use in pricing an asset or liability based on the best information available. Assumptions include the risks inherent in a particular valuation technique (such as a pricing model) and/or the risks inherent in the inputs to the model.
The Company uses a three-level fair value hierarchy that prioritizes the inputs to valuation techniques used to measure fair value. The hierarchy gives the highest priority to unadjusted quoted prices in active markets for identical assets or liabilities (Level 1 measurements) and the lowest priority to unobservable inputs (Level 3 measurements). The three levels of the fair value hierarchy are described below:
• | Level 1 - Unadjusted quoted prices in active markets that are accessible at the measurement date for identical, unrestricted assets or liabilities; |
• | Level 2 - Quoted prices in markets that are not active or financial instruments for which all significant inputs are observable, either directly or indirectly; and |
• | Level 3 - Prices or valuations that require inputs that are both significant to the fair value measurement and unobservable. |
The Company’s assessment of the hierarchy level of the assets or liabilities measured at fair value is determined based on the lowest level input that is significant to the fair value measurement in its entirety. The Company considers an active market to be one in which transactions for the asset or liability occur with sufficient frequency and volume to provide pricing information on an ongoing basis, and views an inactive market as one in which there are a few transactions for the asset or liability, the prices are not current, or price quotations vary substantially either over time or among market makers. Where appropriate, the Company or the counterparty’s non-performance risk is considered in determining the fair values of liabilities and assets, respectively.
Assets and Liabilities Measured at Fair Value on a Recurring Basis
The following table presents the Company's assets that are measured at fair value on a recurring basis (in thousands):
June 27, 2014 | |||||||||||||||||
Carrying | Fair Value Measured Using | Total | |||||||||||||||
Value | Level 1 | Level 2 | Level 3 | Balance | |||||||||||||
Assets | |||||||||||||||||
Money market funds | $ | 130 | $ | 130 | $ | — | $ | — | $ | 130 | |||||||
Pension investments held by insurance companies | 5,624 | — | 5,624 | — | 5,624 | ||||||||||||
Derivative assets | 1,092 | — | 1,092 | — | 1,092 | ||||||||||||
Total assets measured at fair value | $ | 6,846 | $ | 130 | $ | 6,716 | $ | — | $ | 6,846 | |||||||
Derivative liabilities | $ | 3,019 | $ | — | $ | 3,019 | $ | — | $ | 3,019 | |||||||
Total liabilities measured at fair value | $ | 3,019 | $ | — | $ | 3,019 | $ | — | $ | 3,019 | |||||||
67
SILICON GRAPHICS INTERNATIONAL CORP.
NOTES TO CONSOLIDATED FINANCIAL STATEMENTS (Continued)
June 28, 2013 | |||||||||||||||||
Carrying | Fair Value Measured Using | Total | |||||||||||||||
Value | Level 1 | Level 2 | Level 3 | Balance | |||||||||||||
Assets | |||||||||||||||||
Money market funds | $ | 20,015 | $ | 20,015 | $ | — | $ | — | $ | 20,015 | |||||||
Pension investments held by insurance companies | 5,549 | — | 5,549 | — | 5,549 | ||||||||||||
Derivative assets | 69 | — | 69 | — | 69 | ||||||||||||
Total assets measured at fair value | $ | 25,633 | $ | 20,015 | $ | 5,618 | $ | — | $ | 25,633 | |||||||
Derivative liabilities | $ | 208 | — | 208 | — | $ | 208 | ||||||||||
Total liabilities measured at fair value | $ | 208 | $ | — | $ | 208 | $ | — | $ | 208 | |||||||
There were no transfers between Level 1 and Level 2 of the fair value hierarchy during both fiscal 2014 and fiscal 2013. The Company's cash equivalents, consisting primarily of money market funds, are classified within Level 1 of the fair value hierarchy as they were valued using quoted market prices of the identical underlying securities in active markets.
Level 2 assets include investments that are pooled with other investment held by insurance companies within their general funds for our pension plans. The investments held by the insurance companies are valued by taking the percentage owned by the plan in the underlying net asset value of the insurance company's general fund. The valuation of the underlying net assets of the insurance company's general fund is based on quoted market prices of the investments in active markets or for quoted market prices in active markets of similar assets. The market inputs used to value these instruments generally consist of market yields, reported trades, broker/dealer quotes or alternative pricing sources with reasonable levels of price transparency. Pricing sources include industry standard data providers, security master files from large financial institutions and other third party sources. Our derivative financial instruments are classified within Level 2, as there is not an active market for each hedge contract, but the inputs used to calculate the value of the instruments are tied to active markets.
The fair values of accounts receivable, accounts payable, and accrued liabilities, due within one year approximates their carrying values because of their short-term nature.
Assets and Liabilities Measured at Fair Value on a Non-recurring Basis
The Company does not have any assets or liabilities measured at fair value on a non-recurring basis as of June 27, 2014 and June 28, 2013.
6. DERIVATIVES
The Company is exposed to foreign currency exchange rate fluctuations in the normal course of our business. As part of the Company's risk management strategy, we use derivative instruments, primarily forward contracts to hedge economic exposures resulting from changes in foreign currency exchange rates.
Cash Flow Hedges
Beginning in fiscal 2014, we implemented a cash flow hedging strategy to protect anticipated non-functional currency revenue and expenses. The Company uses forward contracts designated as cash flow hedges to hedge a portion of future forecasted non-U.S. Dollar ("USD") cash flows. In general, these foreign exchange contracts, carried at fair value, have maturities between one and twelve months. As of June 27, 2014, the Company has 17 open hedges with the aggregate notional amount in USD equivalent to approximately $44.1 million. The Company currently designates hedges for the Euro, British Pound and the Australian Dollar. These derivative instruments are designated and qualify as cash flow hedges under the criteria prescribed in the authoritative guidance. All amounts related to gains / losses on designated hedges, currently in accumulated other comprehensive income ("AOCI") are expected to be reclassified into earnings over the next 12 months.
68
SILICON GRAPHICS INTERNATIONAL CORP.
NOTES TO CONSOLIDATED FINANCIAL STATEMENTS (Continued)
For derivative instruments that are designated and qualify as cash flow hedges under Accounting Standards Codification ("ASC") No. 815-Derivatives and Hedging, the effective portion of the gain or loss on the derivative is reported as a component of accumulated other comprehensive loss and reclassified into earnings into the same financial statement line as the item being hedged. SGI assesses the prospective and retrospective effectiveness of its hedge programs using statistical analysis. The Company uses the spot-to-spot method to measure ineffectiveness in the hedge relationship. Gains and losses on the derivative representing either hedge ineffectiveness or hedge components excluded from the assessment of effectiveness are recognized in other income (expense), net. For derivative instruments that are not designated as hedging instruments under ASC No. 815 or that have been de-designated following recognition of the hedge item, gains and losses are recognized in other income (expense), net.
Balance Sheet Hedges
Additionally, the Company enters into foreign exchange contracts to hedge monetary assets and liabilities that are denominated in currencies other than the functional currency of our subsidiaries. These foreign exchange contracts are carried at fair value and do not qualify for hedge accounting treatment and are not designated as hedging instruments. Changes in fair value of these derivatives are recognized in other income (expense), net in the condensed consolidated statement of operations, in the current period, along with the offsetting foreign currency gain or loss on the underlying assets or liabilities. As of June 27, 2014, the Company has 17 open non-designated hedges with the aggregate USD-equivalent notional amount of approximately $5.9 million.
The before tax effect of derivative instruments for foreign exchange contracts designated as hedging instruments and non-designated hedging instruments in our condensed consolidated statement of operations was as follows (in thousands):
Fiscal Year Ended | |||||||||||||
Location | June 27, 2014 | June 28, 2013 | June 29, 2012 | ||||||||||
Designated Derivatives | |||||||||||||
Cash Flow Hedges: | |||||||||||||
Loss initially recorded in AOCI on effective portion of derivatives | AOCI | $ | (1,738 | ) | $ | — | $ | — | |||||
Loss reclassified from AOCI into income | Net revenue | (2,539 | ) | — | — | ||||||||
Gain reclassified from AOCI into income | Operating expenses | 888 | — | — | |||||||||
Ineffective portion and amounts excluded from effectiveness testing | Other income (expense), net | 115 | — | — | |||||||||
Non-designated Derivatives | |||||||||||||
Foreign exchange contracts | Other income (expense), net | $ | (1,431 | ) | $ | (496 | ) | $ | — | ||||
The Company's use of derivative instruments exposes it to non-performance risk to the extent that the counterparties may be unable to meet the terms of the agreement. The Company mitigates such risks by limiting our counterparties to major financial institutions, which are selected based on their credit ratings and other factors. The Company has established policies and procedures for mitigating non-performance risk that include establishing counterparty credit limits, monitoring credit exposures, and continually assessing the creditworthiness of counterparties. Therefore the Company does not consider counterparty non-performance risk a material risk at this time.
A number of the Company's derivative agreements contain threshold limits to the net liability position with counterparties and are dependent on the Company's corporate credit rating determined by the major credit rating agencies. The counterparties to the derivative instruments may request collateralization, in accordance with derivative agreements, on derivative instruments in net liability positions.
The aggregate fair value of all derivative instruments with credit-risk-related contingent features that were in a net liability position as of June 27, 2014, was $1.9 million. The credit-risk-related contingent features underlying these agreements had not been triggered as of June 27, 2014.
As of June 27, 2014, the Company has designated derivatives with notional values of approximately $44.1 million and non-designated derivatives with notional values of approximately $5.9 million in Euro, British Pound, Canadian Dollar, Australian Dollar, and other currencies.
69
SILICON GRAPHICS INTERNATIONAL CORP.
NOTES TO CONSOLIDATED FINANCIAL STATEMENTS (Continued)
Derivative instruments are subject to master netting arrangements and are disclosed gross in the statement of financial position. The gross fair values and location of derivative instruments included in the condensed consolidated statement of financial position as of June 27, 2014 were as follows (in thousands):
Offsetting of Derivative Assets | ||||||||||||||||||
Gross Amount Offset In the Statement of Financial Position | Gross Amounts Not Offset in the Statement of Financial Position | |||||||||||||||||
Gross Amount of Recognized Assets | Gross Amount Offset in the Statement of Financial Position | Net Amounts of Assets Presented in the Statement of Financial Position | Financial Instruments | Cash Collateral Received | Net Amount | |||||||||||||
Derivatives | ||||||||||||||||||
Foreign currency forward contracts | $ | 1,092 | $ | — | $ | — | $ | (1,092 | ) | $ | — | $ | — | |||||
Total | $ | 1,092 | $ | — | $ | — | $ | (1,092 | ) | $ | — | $ | — | |||||
Offsetting of Derivative Liabilities | ||||||||||||||||||
Gross Amount Offset In the Statement of Financial Position | Gross Amounts Not Offset in the Statement of Financial Position | |||||||||||||||||
Gross Amount of Recognized Liabilities | Gross Amount Offset in the Statement of Financial Position | Net Amounts of Liabilities Presented in the Statement of Financial Position | Financial Instruments | Cash Collateral Pledged | Net Amount | |||||||||||||
Derivatives | ||||||||||||||||||
Foreign currency forward contracts | $ | (3,019 | ) | $ | — | $ | — | $ | 1,092 | $ | — | $ | (1,927 | ) | ||||
Total | $ | (3,019 | ) | $ | — | $ | — | $ | 1,092 | $ | — | $ | (1,927 | ) | ||||
The gross fair value and location of derivative instruments held in the condensed consolidated statement of financial position as of June 27, 2014 and June 28, 2013 were as follows (in thousands):
Fair Values of Derivative Instruments | ||||||||||||||||||
Asset Derivatives | Liability Derivatives | |||||||||||||||||
Location | June 27, 2014 | June 28, 2013 | Location | June 27, 2014 | June 28, 2013 | |||||||||||||
Designated Derivatives: | ||||||||||||||||||
Foreign exchange contracts | Foreign exchange contracts | |||||||||||||||||
Other current assets | $ | 88 | $ | — | Other current liabilities | $ | 209 | $ | — | |||||||||
Non- designated Derivatives: | ||||||||||||||||||
Foreign exchange contracts | Foreign exchange contracts | |||||||||||||||||
Other current assets | 1,004 | 69 | Other current liabilities | 2,810 | 208 | |||||||||||||
Total derivatives | $ | 1,092 | $ | 69 | $ | 3,019 | $ | 208 | ||||||||||
70
SILICON GRAPHICS INTERNATIONAL CORP.
NOTES TO CONSOLIDATED FINANCIAL STATEMENTS (Continued)
The following table provides the balances and changes in the accumulated other comprehensive loss (income) related to derivative instruments during fiscal 2014 (in thousands):
Amount | ||||
AOCI - Balance of losses or (gain) at June 28, 2013 | $ | — | ||
Loss recognized in OCI on derivatives (effective portion) before reclassifications | 1,738 | |||
Loss reclassified into earnings | (1,651 | ) | ||
AOCI - balance of losses at June 27, 2014 | $ | 87 | ||
See Statement of Comprehensive Loss and Note 5 for more information regarding derivatives.
7. INVENTORIES
Inventories consist of the following (in thousands):
June 27, 2014 | June 28, 2013 | |||||||
Finished goods | $ | 13,700 | $ | 11,332 | ||||
Work in process | 10,795 | 20,716 | ||||||
Raw materials | 22,859 | 29,722 | ||||||
Total inventories | $ | 47,354 | $ | 61,770 | ||||
Finished goods include inventory at customer sites undergoing installation testing prior to customer acceptance; such amounts were $7.9 million at June 27, 2014 and $2.6 million at June 28, 2013.
8. PREPAID EXPENSES AND OTHER CURRENT ASSETS
Prepaid expenses and other current assets consist of the following (in thousands):
June 27, 2014 | June 28, 2013 | |||||||
Value-added tax receivable | $ | 9,611 | $ | 5,626 | ||||
Deferred tax assets | 126 | 281 | ||||||
Prepaid taxes | 1,011 | 1,229 | ||||||
Other prepaid and current assets | 9,054 | 6,958 | ||||||
Total prepaid expenses and other current assets | $ | 19,802 | $ | 14,094 | ||||
71
SILICON GRAPHICS INTERNATIONAL CORP.
NOTES TO CONSOLIDATED FINANCIAL STATEMENTS (Continued)
9. PROPERTY AND EQUIPMENT, NET
Property and equipment, net consist of the following (in thousands):
Estimated Useful Life | June 27, 2014 | June 28, 2013 | ||||||||
Land | N/A | $ | 768 | $ | 799 | |||||
Building | 30-32 | 13,705 | 13,892 | |||||||
Computer equipment and software | 2-6 | 37,254 | 32,323 | |||||||
Manufacturing equipment | 2-7 | 7,389 | 7,122 | |||||||
Leasehold improvements | 2-7 | 12,615 | 8,053 | |||||||
Furniture and fixtures | 2-7 | 1,391 | 1,503 | |||||||
Vehicles | 5 | 40 | 51 | |||||||
Construction in progress | N/A | 495 | 1,690 | |||||||
73,657 | 65,433 | |||||||||
Less accumulated depreciation and amortization | (39,073 | ) | (39,263 | ) | ||||||
Total property and equipment, net | $ | 34,584 | $ | 26,170 | ||||||
Depreciation and amortization expense for fiscal 2014, 2013 and 2012 was $10.7 million, $10.6 million and $9.5 million, respectively.
72
SILICON GRAPHICS INTERNATIONAL CORP.
NOTES TO CONSOLIDATED FINANCIAL STATEMENTS (Continued)
10. GOODWILL AND INTANGIBLE ASSETS, NET
The goodwill balances and the movements in fiscal 2014 and 2013 for each of our reportable segments are shown in the table below (in thousands):
Compute | Storage | Service | Total | |||||||||||||
Goodwill as of June 29, 2012 | $ | 320 | $ | 135 | $ | 1,076 | $ | 1,531 | ||||||||
Goodwill arising from acquisitions | — | — | — | — | ||||||||||||
Goodwill as of June 28, 2013 | 320 | 135 | 1,076 | 1,531 | ||||||||||||
Goodwill arising from acquisitions | — | 7,053 | — | 7,053 | ||||||||||||
Goodwill as of June 27, 2014 | $ | 320 | $ | 7,188 | $ | 1,076 | $ | 8,584 | ||||||||
The Company reviews goodwill for impairment annually in the fourth quarter of its fiscal year, or more frequently if impairment indicators arise. Impairment of goodwill is tested at the reporting unit level by comparing the reporting unit's carrying amount, including goodwill, to the fair value of the reporting unit. The fair values of the reporting units are estimated using a combination of the income approach that uses discounted cash flows and the market approach that utilizes comparable companies' data. If the carrying amount of the reporting unit exceeds its fair value, goodwill is considered impaired and a second step is performed to measure the amount of impairment loss. We have three reporting units for which we assess goodwill for impairment. Commencing in the first quarter of fiscal 2014, the Company started managing its business on a business unit basis versus the geographic basis previously used by management. Accordingly, we allocated the goodwill balances at the beginning of fiscal 2014 based on relative fair value of each of its business units. Based on our annual assessment no impairment was recorded for fiscal 2014, 2013 or 2012.
Intangible assets by major asset class consist of the following (in thousands):
Intangible Asset Class | Weighted Average Useful Life (in Years) | June 27, 2014 | ||||||||||||
Gross Carrying Amount | Accumulated Amortization and Impairment | Net | ||||||||||||
Customer relationships | 5 | $ | 7,300 | $ | (6,975 | ) | $ | 325 | ||||||
Purchased technology | 5 | 12,200 | (10,406 | ) | 1,794 | |||||||||
Customer backlog | (a) | 10,540 | (10,215 | ) | 325 | |||||||||
Trademark/trade name portfolio | 5 | 3,767 | (3,685 | ) | 82 | |||||||||
Patents and other | 2 (b) | 2,297 | (200 | ) | 2,097 | |||||||||
Total | $ | 36,104 | $ | (31,481 | ) | $ | 4,623 | |||||||
Intangible Asset Class | Weighted Average Useful Life (in Years) | June 28, 2013 | ||||||||||||
Gross Carrying Amount | Accumulated Amortization | Net | ||||||||||||
Customer relationships | 5 | $ | 6,900 | $ | (5,750 | ) | $ | 1,150 | ||||||
Purchased technology | 5 | 7,800 | (6,000 | ) | 1,800 | |||||||||
Customer backlog | (a) | 10,540 | (9,572 | ) | 968 | |||||||||
Trademark/ trade name portfolio | 5 | 3,667 | (3,072 | ) | 595 | |||||||||
Patents and other | 2 (b) | 330 | (200 | ) | 130 | |||||||||
Total | $ | 29,237 | $ | (24,594 | ) | $ | 4,643 | |||||||
(a) | The customer backlog intangible asset is amortized as all revenue recognition criteria is accomplished for a particular customer order, reflecting the use of the asset. |
(b) | Includes other intangibles assets with an indefinite life. |
Intangible assets amortization expense was $3.8 million, $3.7 million and $5.2 million in fiscal 2014, 2013 and 2012, respectively.
73
SILICON GRAPHICS INTERNATIONAL CORP.
NOTES TO CONSOLIDATED FINANCIAL STATEMENTS (Continued)
The Company reviews the carrying values of long-lived assets for indicators of impairment whenever events or changes in circumstances indicate that the carrying amount of an asset may not be recoverable. Recoverability of long-lived assets is measured by a comparison of the carrying amount of the assets to the estimated undiscounted future cash flows expected to be generated by the assets.
As a result of a decision made in the fourth quarter of fiscal 2014 to stop investment in certain next generation Storage products, we determined that intangible assets related to the product development of these next generation products were impaired. We recorded an impairment charge of $2.9 million in the fourth quarter of fiscal 2014, which was recorded as a cost of revenue.
No impairment of intangible assets was recorded in fiscal 2013 and 2012.
As of June 27, 2014, expected amortization expense for all intangible assets is as follows (in thousands):
Fiscal Year | Amortization Expense | |||
2015 | $ | 874 | ||
2016 | 793 | |||
2017 | 759 | |||
2018 | 100 | |||
Total amortization | $ | 2,526 | ||
74
SILICON GRAPHICS INTERNATIONAL CORP.
NOTES TO CONSOLIDATED FINANCIAL STATEMENTS (Continued)
11. OTHER ASSETS
Other assets consist of the following (in thousands):
June 27, 2014 | June 28, 2013 | |||||||
Long-term service inventory | $ | 15,969 | $ | 15,045 | ||||
Restricted pension plan assets | 8,242 | 7,822 | ||||||
Deferred tax assets | 16,663 | 5,764 | ||||||
Long-term refundable deposits | 2,895 | 3,178 | ||||||
Other assets | 627 | 944 | ||||||
Total other assets | $ | 44,396 | $ | 32,753 | ||||
12. OTHER CURRENT LIABILITIES
Other current liabilities consist of the following (in thousands):
June 27, 2014 | June 28, 2013 | |||||||
Accrued sales and use tax payable | $ | 15,033 | $ | 9,545 | ||||
Deferred tax liabilities | 15,846 | 5,292 | ||||||
Accrued professional services fees | 3,421 | 3,635 | ||||||
Accrued warranty, current portion | 4,216 | 3,303 | ||||||
Income taxes payable | 379 | 491 | ||||||
Accrued restructuring and severance | 2,741 | 3,965 | ||||||
Derivatives | 3,019 | 208 | ||||||
Other | 9,005 | 8,925 | ||||||
Total other current liabilities | $ | 53,660 | $ | 35,364 | ||||
13. OTHER NON-CURRENT LIABILITIES
Other non-current liabilities consist of the following (in thousands):
June 27, 2014 | June 28, 2013 | |||||||
Accrued warranty, non-current portion | $ | 1,828 | $ | 2,319 | ||||
Deferred rent | 6,312 | 11 | ||||||
Other | 667 | 1,460 | ||||||
Total other non-current liabilities | $ | 8,807 | $ | 3,790 | ||||
14. WARRANTY RESERVE
Activity in the warranty reserve, which is included in other current and non-current liabilities, is as follows (in thousands):
June 27, 2014 | June 28, 2013 | |||||||
Balance at beginning of period | $ | 5,622 | $ | 7,302 | ||||
Current period accrual | 3,301 | 4,091 | ||||||
Warranty expenditures charged to accrual | (3,790 | ) | (4,515 | ) | ||||
Changes in accrual for pre-existing warranties | 911 | (1,256 | ) | |||||
Balance at end of period | $ | 6,044 | $ | 5,622 | ||||
75
SILICON GRAPHICS INTERNATIONAL CORP.
NOTES TO CONSOLIDATED FINANCIAL STATEMENTS (Continued)
15. RESTRUCTURING ACTIVITY
The Company has implemented restructuring actions to streamline operations and reduce operating expenses. Total expense for all restructuring actions was $1.3 million, $9.0 million, and $2.5 million for fiscal 2014, 2013 and 2012, respectively. The restructuring expense is included in operating expenses in the accompanying consolidated statement of operations. The total restructuring liability was $0.3 million of June 27, 2014 and was classified as current liabilities in the accompanying consolidated balance sheet.
Fiscal 2012 Restructuring Action
On March 16, 2012, the Company's Board of Directors approved a restructuring action to reduce approximately 25% of the Company's European workforce and close certain legal entities and offices in Europe.
Total expense incurred in connection with this restructuring plan, for actions taken through June 27, 2014 was $12.6 million. This restructuring action is substantially complete.
Activity in accrued restructuring for the fiscal 2012 restructuring action was as follows (in thousands):
Employee Terminations | ||||
Balance at June 29, 2012 | $ | 1,621 | ||
Cost incurred | 9,048 | |||
Cash payments | (8,252 | ) | ||
Balance at June 28, 2013 | 2,417 | |||
Costs incurred | 1,251 | |||
Cash payments | (3,399 | ) | ||
Balance at June 27, 2014 | $ | 269 | ||
76
SILICON GRAPHICS INTERNATIONAL CORP.
NOTES TO CONSOLIDATED FINANCIAL STATEMENTS (Continued)
16. CREDIT FACILITY
On December 5, 2011, the Company entered into a five-year senior secured credit facility in the aggregate principal amount of $35.0 million. The availability under the credit facility is limited to a borrowing base, subject to meeting certain conditions set forth in the credit facility. The credit facility included a feature that allowed the Company to increase the revolver amount in the first 18 months. The Company exercised this feature, and on May 1, 2012 the revolver amount was increased by $5.0 million to an aggregate principal amount of $40.0 million. On February 25, 2013, the Company amended the agreement and reduced the revolver amount to $25.0 million. The credit facility includes a $10.0 million letter of credit subfacility. See Note 24 "Commitments and Contingencies" for more information regarding the letter of credit.
The availability of the aggregate principal amount under the credit facility will fluctuate, generally monthly, based on eligible domestic accounts receivable and inventory due to a variety of factors including the Company's overall mix of sales and resulting accounts receivable with international and domestic customers, United States governmental agencies and a few individual customer accounts which may result in high concentrations of accounts receivable as compared to the overall level of the Company's accounts receivable. The credit facility contains financial covenants including, under certain conditions, maintaining a minimum fixed charge coverage ratio, as well as other non-financial covenants, including restrictions on declaring and paying dividends, and is secured by substantially all of the Company's assets. The credit facility terminates on December 5, 2016. Borrowings under the credit facility bear interest based on a rate of the Company's choice equal to either: 1) the LIBOR plus a margin of 2.50% per annum or 2) the base rate plus a margin of 1.75% per annum. The base rate is the greater of (a) the Federal Funds rate plus 0.50%, (b) the LIBOR rate plus 1.00% or (c) the prime rate of the financial institution. The LIBOR rate and the base rate are determined at the specified date preceding or at the time of the borrowing in accordance with the terms of the credit facility. In addition, unused line fees are payable on the credit facility at rates of 0.40 percent per annum.
During fiscal 2013 the Company made a $15.7 million payment to pay off the outstanding balance under the credit facility, which included $0.4 million of accrued interest. Accordingly, as of June 27, 2014, the Company had no outstanding balance owed on the credit facility. As of June 27, 2014, the maximum amount available to be borrowed under the credit facility was approximately $23.0 million which takes into account a $2.0 million outstanding letter of credit to back the Company's obligation to pay for goods or services to a supplier. The Company was in compliance with all covenants as of June 27, 2014.
17. SHARE-BASED COMPENSATION
Share-Based Compensation Plans
In 2005, the Company’s Board of Directors adopted and its stockholders approved the Company’s 2005 Equity Incentive Plan (“2005 Plan”), 2005 Non-Employee Directors’ Stock Option Plan ("2005 Director Plan") and 2005 Employee Stock Purchase Plan (“2005 ESPP Plan”). As of June 27, 2014, the aggregate number of shares of common stock available for grant under each plan is 2,810,074, 81,666 and 592,350 shares, respectively. Each plan contains a provision that automatically increases the number of shares of common stock reserved for issuance on January 1 of each year through January 1, 2015. During fiscal 2012, the number of shares authorized for issuance under each Plan was increased by 1,295,453 shares, 0 shares and 1,123,863 shares, respectively. During fiscal 2013, the number of shares authorized for issuance under each Plan was increased by 886,075 shares, 0 shares and 51,653 shares, respectively. During fiscal 2014, the number of shares authorized for issuance under each Plan was increased by 798,805 shares, 0 shares and 365,263 shares, respectively.
The Company’s Board of Directors adopted the 2006 New Recruit Equity Incentive Plan (“New Recruit Plan”) in January 2006 which allows the Company to grant non-statutory stock awards to newly hired employees as an inducement to join the Company. No grants may be made under the New Recruit Plan to persons who are continuing employees or directors. The New Recruit Plan provides for the grant of the following stock awards: (i) non-statutory stock options, (ii) stock purchase awards, (iii) stock bonus awards, (iv) stock appreciation rights, (v) stock unit awards and (vi) other stock awards. As of June 27, 2014, the number of shares of common stock available for grant under the 2006 Plan is 196,116 shares. There have been no increases in the total shares of common stock reserved for the New Recruit Plan during fiscal 2014, 2013 and 2012. The exercise price of each non-statutory stock option shall be not less than 100% of the fair market value of the common stock subject to the option on the date the option is granted.
Stock awards expire ten years from the date of grant, or such shorter period specified in the award agreement. The awards vest over a period of time as determine by the board of directors, generally over four years from the date the award is granted. The Company issues new shares of its common stock upon exercise of stock options, issuance of restricted stock units (“RSU”)
77
SILICON GRAPHICS INTERNATIONAL CORP.
NOTES TO CONSOLIDATED FINANCIAL STATEMENTS (Continued)
and issuance of shares purchased under its 2005 ESPP Plan. Common stock to be issued for grants of RSUs are not issued until the RSU vests and do not have rights to vote or receive dividends.
Determining Fair Value
The fair value of certain share-based awards is estimated using the Black-Scholes option-pricing model with the following weighted-average assumptions for the following periods:
Fiscal Year Ended | |||||||||
June 27, 2014 | June 28, 2013 | June 29, 2012 | |||||||
Option Plans Shares | |||||||||
Risk-free interest rate | N/A | 0.7 | % | 1.0 | % | ||||
Volatility | N/A | 66.1 | % | 69.7 | % | ||||
Weighted average expected life (in years) | N/A | 4.99 | 4.73 | ||||||
Expected dividend yield | N/A | — | % | — | % | ||||
Weighted average grant date fair value | N/A | $4.83 | $6.67 | ||||||
ESPP Plan shares | |||||||||
Risk-free interest rate | 0.2 | % | 0.2 | % | 0.2 | % | |||
Volatility | 56.7 | % | 79.4 | % | 78.0 | % | |||
Weighted average expected life (in years) | 1.25 | 1.25 | 1.25 | ||||||
Expected dividend yield | — | % | — | % | — | % | |||
Weighted average grant date fair value | $5.59 | $4.84 | $5.39 | ||||||
The computation of expected life is based on an analysis of the Company's historical exercise and post-vesting forfeiture experience. The expected volatility is based on the implied and historical volatility for the Company from fiscal 2010 through the second quarter of fiscal 2012 and historical volatility from the third quarter of fiscal 2012 through the fourth quarter of fiscal 2014; this change had no significant impact on the volatility rate used during the year. The interest rate is based on the implied yield currently available on U.S. Treasury zero-coupon issues with an equivalent remaining term. As share-based compensation expense recognized in the accompanying consolidated statements of operations is based on awards ultimately expected to vest, it has been reduced for estimated forfeitures. Forfeitures are estimated at the time of grant and revised, if necessary, in subsequent periods if actual forfeitures differ from those estimated.
Share-Based Compensation Expense
Total share-based compensation expense is as follows (in thousands):
Fiscal Year Ended | ||||||||||||
June 27, 2014 | June 28, 2013 | June 29, 2012 | ||||||||||
Cost of revenue | $ | 1,676 | $ | 1,598 | $ | 1,358 | ||||||
Research and development | 2,072 | 2,250 | 1,938 | |||||||||
Sales and marketing | 2,598 | 1,629 | 1,570 | |||||||||
General and administrative | 5,633 | 4,623 | 5,195 | |||||||||
Total share-based compensation expense | $ | 11,979 | $ | 10,100 | $ | 10,061 | ||||||
Total share-based compensation expense for the fiscal 2012 includes $1.4 million of share-based expense recognized by the Company due to the modification of certain terms of the vested options held by the Company's former Chief Executive Officer and former Chief Financial Officer.
78
SILICON GRAPHICS INTERNATIONAL CORP.
NOTES TO CONSOLIDATED FINANCIAL STATEMENTS (Continued)
Stock Option Activity
The following table summarizes the Company’s stock option activity for fiscal 2014 and 2013.
Options Outstanding | |||||||||||||
Shares | Weighted Average Exercise Price | Weighted Average Remaining Contractual term in years | Aggregate Intrinsic Value | ||||||||||
(in thousands) | |||||||||||||
Balance at June 29, 2012 | 3,703,660 | $ | 10.79 | ||||||||||
Options granted | 154,000 | 8.87 | |||||||||||
Options exercised | (1,334,910 | ) | 10.65 | ||||||||||
Options cancelled | (241,349 | ) | 12.57 | ||||||||||
Balance at June 28, 2013 | 2,281,401 | 10.56 | |||||||||||
Options granted | — | — | |||||||||||
Options exercised | (492,825 | ) | 7.83 | ||||||||||
Options cancelled | (180,140 | ) | 18.32 | ||||||||||
Balance at June 27, 2014 | 1,608,436 | $ | 10.53 | 5.59 | $ | 1,934 | |||||||
Vested and expected to vest at June 27, 2014 | 1,572,035 | $ | 10.56 | 5.54 | $ | 1,875 | |||||||
Exercisable at June 27, 2014 | 1,299,280 | $ | 10.76 | 5.13 | $ | 1,602 | |||||||
The total intrinsic value of options exercised in fiscal 2014, 2013 and 2012 was $3.9 million, $4.4 million and $1.0 million, respectively. The total fair value of shares vested during fiscal 2014, 2013 and 2012 was $2.5 million, $4.1 million and $3.1 million, respectively.
As of June 27, 2014, there was $0.4 million of total unrecognized compensation cost related to non-vested stock options, which is expected to be recognized over a weighted average period of 0.83 years.
The following table summarizes information about stock options outstanding under all option plans as of June 27, 2014:
Options Outstanding | Options Exercisable | |||||||||||||||
Exercise Price Range | Number of Outstanding Options | Weighted Average Remaining Contractual Life (In Years) | Weighted Average Exercise Price | Number of Options Exercisable | Weighted Average Exercise Price | |||||||||||
$ 5.07 - $ 5.07 | 18,568 | 4.92 | $ | 5.07 | 18,568 | $ | 5.07 | |||||||||
5.34 - 5.34 | 221,274 | 4.81 | 5.34 | 221,148 | 5.34 | |||||||||||
5.60 - 6.58 | 162,971 | 6.48 | 5.87 | 83,075 | 5.88 | |||||||||||
6.69 - 7.99 | 174,720 | 5.39 | 7.69 | 160,135 | 7.77 | |||||||||||
8.35 - 9.68 | 108,417 | 5.35 | 9.05 | 99,663 | 9.05 | |||||||||||
9.78 - 9.78 | 212,396 | 7.68 | 9.78 | 76,979 | 9.78 | |||||||||||
9.82 - 11.61 | 169,394 | 7.16 | 10.76 | 153,769 | 10.74 | |||||||||||
11.69 - 14.15 | 165,301 | 5.37 | 12.25 | 163,321 | 12.22 | |||||||||||
14.26 - 14.68 | 19,000 | 7.12 | 14.35 | 13,937 | 14.35 | |||||||||||
14.69 - 37.91 | 356,395 | 3.89 | 17.34 | 308,685 | 17.72 | |||||||||||
5.07 - 37.91 | 1,608,436 | 5.59 | 10.53 | 1,299,280 | 10.76 | |||||||||||
79
SILICON GRAPHICS INTERNATIONAL CORP.
NOTES TO CONSOLIDATED FINANCIAL STATEMENTS (Continued)
Restricted Stock Activity
The following table summarizes the Company’s RSU activity for fiscal 2014 and 2013.
Number of Shares | Weighted Average Grant Date Fair Value | Weighted Average Remaining Contractual Life | Aggregate Intrinsic Value | ||||||||||
(in thousands) | |||||||||||||
Balance at June 29, 2012 | 918,764 | $ | 10.12 | ||||||||||
Awarded | 991,239 | 10.24 | |||||||||||
Released | (411,534 | ) | 12.63 | ||||||||||
Forfeited | (160,702 | ) | 11.10 | ||||||||||
Balance at June 28, 2013 | 1,337,767 | 10.27 | |||||||||||
Awarded | 1,237,967 | 14.41 | |||||||||||
Released | (558,481 | ) | 12.17 | ||||||||||
Forfeited | (320,430 | ) | 11.98 | ||||||||||
Balance at June 27, 2014 | 1,696,823 | $ | 12.67 | 1.28 | $ | 16,052 | |||||||
Vested and expected to vest at June 27, 2014 | 1,340,412 | $ | 12.56 | 1.14 | $ | 12,922 | |||||||
In August 2012, the Company granted time-based RSUs ("2012 executive time-based RSUs") and performance-based RSUs (“2012 executive PSUs”) to members of the Company's executive management team. The 2012 executive time-based RSUs vest over four years, with 25% vesting after one year and an additional 6.25% vesting quarterly thereafter, subject to the recipient's continuous service through each vesting date. The 2012 executive PSUs are eligible to vest upon the achievement of certain financial performance criteria for the Company for fiscal 2013. In general, the 2012 executive PSUs grants may be increased or decreased depending on the level of attainment by the Company of the performance metrics established by the Board. The financial performance criteria were achieved for fiscal 2013 and the Company awarded the 2012 executive PSU at 135% of the amounts initially awarded in August 2012. Accordingly, 25% of the 2012 executive PSUs vested following the Company's public announcement of financial results for fiscal 2013 and the remaining 75% of the 2012 executive PSUs vested in three annual installments of 25% thereafter, subject to the recipient's continued service through each vesting date.
In August 2013, the Company granted time-based RSUs ("2013 executive time-based RSUs") and performance-based RSUs (“2013 executive PSUs”) to members of the Company's executive management team. The 2013 executive time-based RSUs vest quarterly over four years, subject to the recipient's continuous service through each vesting date. The 2013 executive PSUs were eligible to vest upon the achievement of certain financial performance criteria for the Company for fiscal 2014. If the performance criteria were not met, none of the 2013 executive PSUs would vest and would be forfeited. If the performance criteria were met, 25% of the 2013 executive PSUs would vest following the Company's public announcement of financial results for fiscal 2014 and the remaining 75% of the 2013 executive PSUs would vest in twelve quarterly installments thereafter, subject to the recipient's continued service through each vesting date. The financial performance criteria for the 2013 executive PSUs were not achieved and none of the 2013 executive PSUs vested.
As of June 27, 2014, there was $7.6 million of total unrecognized compensation cost related to RSUs, which is expected to be recognized over a weighted average period of 1.55 years.
RSUs are converted into common stock upon vesting. Upon the vesting of restricted stock, the Company primarily uses the net share settlement approach, which withholds a portion of the shares to cover the applicable taxes and decreases the shares issued to the employee by a corresponding value. The withholding tax obligations were based upon the fair market value of the Company’s common stock on the vesting date. The number and the value of the shares netted for employee taxes are summarized in the table below (in thousands except share amounts):
Fiscal Year Ended | ||||||||||||
June 27, 2014 | June 28, 2013 | June 29, 2012 | ||||||||||
RSUs shares withheld for taxes | 214,304 | 159,829 | 95,746 | |||||||||
RSUs amounts withheld for taxes | $ | 2,671 | $ | 2,080 | $ | 1,126 | ||||||
80
SILICON GRAPHICS INTERNATIONAL CORP.
NOTES TO CONSOLIDATED FINANCIAL STATEMENTS (Continued)
Employee Stock Purchase Plan
At June 27, 2014, the total compensation cost related to options to purchase the Company’s common stock under the 2005 ESPP Plan not yet recognized was approximately $0.4 million. This cost will be amortized on a straight-line basis over approximately 1.9 years. The following table shows the shares issued and their respective weighted-average purchase price per share during fiscal 2014, 2013 and 2012.
Fiscal Year Ended | ||||||||||||
June 27, 2014 | June 28, 2013 | June 29, 2012 | ||||||||||
Shares issued | 540,448 | 485,707 | 508,132 | |||||||||
Weighted-average purchase price per share | $ | 7.92 | $ | 7.09 | $ | 6.42 | ||||||
18. STOCKHOLDERS’ EQUITY
Stock Repurchase
In February 2009, the Company's Board of Directors authorized a share repurchase program of up to $40.0 million of its common stock. Under the program, the Company was able to purchase shares of common stock through open market transactions and privately negotiated purchases at prices deemed appropriate by management. The timing and amount of repurchase transactions under this program were dependent on market conditions, corporate and regulatory considerations and other relevant considerations. This program expired in March 2012. There were no share repurchases during fiscal 2012.
In January 2013, the Company's board of directors approved a plan for the Company to repurchase shares of its common stock with a market value of up to $15.0 million. In November 2013, the Company announced an increase in the authorized repurchased amount to $30.0 million. The Company's common stock may be repurchased in the open market or through negotiated transactions, including 10b5-1 trading plans that would enable the Company to repurchase its shares during periods outside of its normal trading windows. The repurchase program expires December 31, 2014. Purchases will cease if the authorized funds are spent or the program is discontinued. The Company is not obligated to acquire any particular amount of stock, and the program may be suspended or terminated at any time at the Company's discretion.
The following table shows the total number of shares repurchased during fiscal 2014 and 2013 (in thousands, except per share amount):
Treasury Stock | |||||||||||
Number of Shares | Amount | Average Purchase Price per Share | |||||||||
Cumulative balance at June 29, 2012 | 749 | $ | 4,912 | $ | 6.56 | ||||||
Repurchase of Treasury Stock: | |||||||||||
Twelve months ended June 28, 2013 | 197 | 2,780 | $ | 14.07 | |||||||
Cumulative balance at June 28, 2013 | 946 | $ | 7,692 | $ | 8.13 | ||||||
Repurchase of Treasury Stock: | |||||||||||
Twelve months ended June 27, 2014 | 898 | 10,985 | $ | 12.24 | |||||||
Cumulative balance at June 27, 2014 | 1,844 | $ | 18,677 | $ | 10.13 | ||||||
Amount available to purchase under current approved plan | $ | 16,235 | |||||||||
81
SILICON GRAPHICS INTERNATIONAL CORP.
NOTES TO CONSOLIDATED FINANCIAL STATEMENTS (Continued)
Accumulated Other Comprehensive (Loss) Income
The following table summarizes the components of accumulated other comprehensive loss as of June 27, 2014, June 28, 2013 and June 29, 2012 (in thousands):
June 27, 2014 | June 28, 2013 | June 29, 2012 | ||||||||||
Cumulative translation adjustment | $ | (608 | ) | $ | 102 | $ | 838 | |||||
Unrealized loss on cash flow hedges | (87 | ) | — | — | ||||||||
Loss on pension assets | (3,193 | ) | (2,253 | ) | (2,318 | ) | ||||||
Accumulated other comprehensive loss | $ | (3,888 | ) | $ | (2,151 | ) | $ | (1,480 | ) | |||
The related tax effects of these components of accumulated other comprehensive loss is not material to the Company.
19. EARNINGS PER SHARE
Basic and diluted net income (loss) per common share is computed by dividing consolidated net income (loss) by the weighted average number of common shares outstanding during the period. Diluted net income (loss) per share is computed by dividing consolidated net income (loss) by the weighted average number of common shares outstanding and dilutive common shares equivalent shares outstanding during the period. For fiscal 2014, 2013 and 2012, the effect of outstanding options and RSUs were anti-dilutive to loss per share and were therefore excluded from the calculation of diluted loss per share.
The dilutive effect of outstanding options and RSUs is reflected in diluted net income per share, but not diluted loss per share, by application of the treasury stock method required by accounting principles generally accepted in the U.S. As the Company had a net loss in fiscal 2014, 2013 and 2012, basic and diluted net loss per share are the same for these fiscal years.
The following table sets forth the computation of basic and diluted net loss per share for fiscal 2014, 2013 and 2012 (in thousands, except per share amount):
Fiscal Year Ended | ||||||||||||
June 27, 2014 | June 28, 2013 | June 29, 2012 | ||||||||||
Numerator: | ||||||||||||
Net loss | $ | (52,814 | ) | $ | (2,820 | ) | $ | (24,461 | ) | |||
Denominator: | ||||||||||||
Weighted-average common shares used in computing basis and diluted net loss per share | 34,260 | 32,909 | 31,653 | |||||||||
Basic and diluted net loss per share | $ | (1.54 | ) | $ | (0.09 | ) | $ | (0.77 | ) | |||
The following table sets forth potential shares of common stock, which are excluded from the calculation of diluted net loss per share, as the result would be anti-dilutive (in thousands):
Fiscal Year Ended | |||||||||
June 27, 2014 | June 28, 2013 | June 29, 2012 | |||||||
Options, RSUs and ESPP | 3,442 | 3,667 | 4,623 | ||||||
20. RETIREMENT BENEFIT PLAN
Defined Benefit Plans
The Company sponsors defined benefit plans covering certain of its international employees in Germany and Japan.
Pension benefits associated with these plans generally are based on each participant's years of service, compensation and age at retirement or termination. The Company funds these pension plans in amounts sufficient to meet the minimum requirements of the local laws and regulations. Additional funding may be provided as deemed appropriate.
82
SILICON GRAPHICS INTERNATIONAL CORP.
NOTES TO CONSOLIDATED FINANCIAL STATEMENTS (Continued)
German Plan
Employees joining the Company prior to May 2009 are eligible for the German defined benefit plan. The German plan is managed by an insurance company and the insurance company makes investment decisions with the guidelines set by the German regulation. The plan assets are invested as part of the insurance company’s general fund and the Company does not have control over the target allocation or visibility of the investment strategies of these investments.
Japan Plan
In October 2011, SGI Japan, Ltd ("SGI Japan"), its employees and the Japanese Ministry of Health, Labor and Welfare approved an action to change SGI Japan's retirement benefit plan effective October 1, 2011 in accordance with the Defined Benefit Corporate Pension Law and Defined Contribution Corporate Pension Law of 2001 (the "Acts"). SGI Japan shifted a portion of its defined benefit plan to a defined contribution plan and modified the terms of its defined benefit plan in accordance with the Acts. The change in the retirement benefit plan reduced SGI Japan's retirement benefit obligation and resulted in a gain from curtailment of $1.3 million and a loss from settlement of $1.0 million. In addition, SGI Japan agreed to increase its employer contribution to the defined benefit plan and defined contribution plan to fund the underfunded portion of the retirement benefit obligation as required under the Acts.
The Japan plan is managed by an insurance company and the insurance company makes investment decisions with the guidelines set by the Japanese regulation. The plan assets are invested as part of the insurance company's general fund and the Company does not have control over the target allocation or visibility of the investment strategies of these investments.
83
SILICON GRAPHICS INTERNATIONAL CORP.
NOTES TO CONSOLIDATED FINANCIAL STATEMENTS (Continued)
Following is a reconciliation of the projected benefit obligation and the fair value of plan assets as of June 27, 2014 and June 28, 2013 for both the German and Japan plans (in thousands):
Germany Plan | Japan Plan | Total | ||||||||||||||||||||||
Fiscal Year Ended | Fiscal Year Ended | Fiscal Year Ended | ||||||||||||||||||||||
June 27, 2014 | June 28, 2013 | June 27, 2014 | June 28, 2013 | June 27, 2014 | June 28, 2013 | |||||||||||||||||||
Projected Benefit Obligation | ||||||||||||||||||||||||
Benefit obligation, beginning of year | $ | 12,768 | $ | 11,863 | $ | 4,690 | $ | 6,053 | $ | 17,458 | $ | 17,916 | ||||||||||||
Service cost | 47 | 140 | 384 | 544 | 431 | 684 | ||||||||||||||||||
Interest cost | 470 | 498 | 78 | 93 | 548 | 591 | ||||||||||||||||||
Actuarial losses | 1,074 | 152 | (33 | ) | 154 | 1,041 | 306 | |||||||||||||||||
Benefits paid | (526 | ) | (396 | ) | (467 | ) | (9 | ) | (993 | ) | (405 | ) | ||||||||||||
Effect of curtailments | — | — | — | (85 | ) | — | (85 | ) | ||||||||||||||||
Effect of settlements | — | — | — | (926 | ) | — | (926 | ) | ||||||||||||||||
Effect of amendment | — | — | — | (24 | ) | — | (24 | ) | ||||||||||||||||
Foreign exchange rate changes | 584 | 511 | (167 | ) | (1,110 | ) | 417 | (599 | ) | |||||||||||||||
Benefit obligation, ending of year | $ | 14,417 | $ | 12,768 | $ | 4,485 | $ | 4,690 | $ | 18,902 | $ | 17,458 | ||||||||||||
Fair Value of Plan Assets | ||||||||||||||||||||||||
Fair value of plan assets, beginning of year | $ | 2,633 | $ | 2,429 | $ | 2,916 | $ | 3,698 | $ | 5,549 | $ | 6,127 | ||||||||||||
Expected return on plan assets | 91 | 90 | 85 | 100 | 176 | 190 | ||||||||||||||||||
Participant contributions | 9 | 12 | 529 | 769 | 538 | 781 | ||||||||||||||||||
Effect of settlement | — | — | — | (887 | ) | — | (887 | ) | ||||||||||||||||
Actuarial losses | (33 | ) | (126 | ) | (60 | ) | (61 | ) | (93 | ) | (187 | ) | ||||||||||||
Benefit payments | (180 | ) | (108 | ) | (448 | ) | (9 | ) | (628 | ) | (117 | ) | ||||||||||||
Foreign exchange rate changes | 186 | 336 | (104 | ) | (694 | ) | 82 | (358 | ) | |||||||||||||||
Fair value of plan assets, ending of year | $ | 2,706 | $ | 2,633 | $ | 2,918 | $ | 2,916 | $ | 5,624 | $ | 5,549 | ||||||||||||
Underfunded Status | ||||||||||||||||||||||||
Projected benefit obligation | $ | 14,417 | $ | 12,768 | $ | 4,485 | $ | 4,690 | $ | 18,902 | $ | 17,458 | ||||||||||||
Fair value of plan assets | 2,706 | 2,633 | 2,918 | 2,916 | 5,624 | 5,549 | ||||||||||||||||||
Underfunded status of plan | $ | 11,711 | $ | 10,135 | $ | 1,567 | $ | 1,774 | $ | 13,278 | $ | 11,909 | ||||||||||||
The Company has life insurance policies with cash surrender values that have been earmarked by the Company to partly cover the underfunded status of the German plan. As of June 27, 2014, the cash surrender values of the life insurance plans of $0.4 million and $8.2 million are included in other current assets and other assets, respectively, in the accompanying consolidated balance sheets. As of June 28, 2013, the cash surrender values of the life insurance plans of $0.3 million and $7.8 million are included in other current assets and other assets, respectively, in the accompanying consolidated balance sheets.
84
SILICON GRAPHICS INTERNATIONAL CORP.
NOTES TO CONSOLIDATED FINANCIAL STATEMENTS (Continued)
The following table summarizes the amounts recognized on the consolidated balance sheets as of June 27, 2014 and June 28, 2013 for both the German and Japan plans (in thousands):
German Plan | Japan Plan | Total | |||||||||||||||||||
June 27, 2014 | June 28, 2013 | June 27, 2014 | June 28, 2013 | June 27, 2014 | June 28, 2013 | ||||||||||||||||
Amounts recognized in the consolidated balance sheets | |||||||||||||||||||||
Accrued benefit cost | |||||||||||||||||||||
Current liabilities | $ | 347 | $ | 367 | $ | — | $ | — | $ | 347 | $ | 367 | |||||||||
Non-current liabilities | $ | 11,364 | $ | 9,768 | $ | 1,567 | $ | 1,774 | $ | 12,931 | $ | 11,542 | |||||||||
Amounts recognized in accumulated other comprehensive loss | |||||||||||||||||||||
Net actuarial loss | $ | (2,948 | ) | $ | (2,036 | ) | $ | (245 | ) | $ | (217 | ) | $ | (3,193 | ) | $ | (2,253 | ) | |||
The following table summarizes the amounts recorded to other comprehensive (loss) income net of taxes during fiscal 2014 and 2013 (in thousands):
Fiscal Year Ended | ||||||||
June 27, 2014 | June 28, 2013 | |||||||
Amounts recognized in other comprehensive (loss) income | ||||||||
Net actuarial (loss) gain - German Plan | $ | (912 | ) | $ | 125 | |||
Net actuarial loss - Japan Plan | (28 | ) | (60 | ) | ||||
Total recognized in other comprehensive (loss) income | $ | (940 | ) | $ | 65 | |||
The Company expects to recognize less than $0.1 million of amortization from accumulated other comprehensive (loss) income into net periodic benefit cost during fiscal 2015.
The following table summarizes the amounts related to the pension plan with accumulated benefit obligation in excess of plan assets at June 27, 2014 and June 28, 2013 (in thousands):
German Plan | Japan Plan | Total | |||||||||||||||||||
June 27, 2014 | June 28, 2013 | June 27, 2014 | June 28, 2013 | June 27, 2014 | June 28, 2013 | ||||||||||||||||
Projected benefit obligation | $ | 14,417 | $ | 12,768 | $ | 4,485 | $ | 4,690 | $ | 18,902 | $ | 17,458 | |||||||||
Accumulated benefit obligation | $ | 14,345 | $ | 12,704 | $ | 3,936 | $ | 3,844 | $ | 18,281 | $ | 16,548 | |||||||||
Fair value of plan assets | $ | 2,706 | $ | 2,633 | $ | 2,918 | $ | 2,916 | $ | 5,624 | $ | 5,549 | |||||||||
The Company carries the interest and service cost of the plan. Actuarial gains and losses are amortized over the expected life of the plan.
Weighted average assumptions used to determine benefit obligations for the German and Japan plans were as follows:
German Plan | Japan Plan | ||||||
June 27, 2014 | June 28, 2013 | June 27, 2014 | June 28, 2013 | ||||
Assumptions used to determine benefits obligations: | |||||||
Discount rate | 3.1% - 3.2% | 3.6% | 1.2% | 1.7 | % | ||
Rate of compensation increase | 0.0% - 1.0% | 0.0% - 1.0% | 5.7% | 5.7 | % | ||
Assumptions used to determine net periodic benefit cost: | |||||||
Discount rate | 3.6% | 3.6% | 1.7% | 1.7 | % | ||
Expected long-term rate of return on plan assets | 3.3% - 4.1% | 3.3% - 4.1% | 3.0% | 3.0 | % | ||
Rate of compensation increase | 0.0% - 1.0% | 0.0% - 1.0% | 5.7% | 5.7 | % | ||
The discount rate reflects the current rate at which the Company believes associated liabilities could be effectively settled at the end of the year. The Company sets its rate to reflect the yield of a portfolio of high quality, fixed-income debt instruments that would produce cash flows sufficient in timing and amount to settle projected future benefits.
85
SILICON GRAPHICS INTERNATIONAL CORP.
NOTES TO CONSOLIDATED FINANCIAL STATEMENTS (Continued)
Expected long-term rate of return on assets assumptions for the German plan is determined using the projected long-term rate of return estimated by the insurance company for its general fund. Expected long-term rate of return on assets assumptions for the Japan plan is determined by SGI Japan in consideration of the portfolio of SGI Japan's pension plan and projected long-term rate of return based on the Japanese market.
The net periodic benefit cost of the German and Japan plans was comprised of the following components (in thousands):
German Plan | Japan Plan | Total | ||||||||||||||||||||||||||||
Fiscal Year Ended | Fiscal Year Ended | Fiscal Year Ended | ||||||||||||||||||||||||||||
June 27, 2014 | June 28, 2013 | June 29, 2012 | June 27, 2014 | June 28, 2013 | June 29, 2012 | June 27, 2014 | June 28, 2013 | June 29, 2012 | ||||||||||||||||||||||
Net periodic benefit cost | ||||||||||||||||||||||||||||||
Service cost | $ | 47 | $ | 140 | $ | 118 | $ | 384 | $ | 544 | $ | 749 | $ | 431 | $ | 684 | $ | 867 | ||||||||||||
Interest expense | 470 | 498 | 563 | 78 | 93 | 128 | 548 | 591 | 691 | |||||||||||||||||||||
Expected return on plan assets | (91 | ) | (90 | ) | (97 | ) | (85 | ) | (100 | ) | (97 | ) | (176 | ) | (190 | ) | (194 | ) | ||||||||||||
Amortization on actuarial losses | 128 | 170 | — | — | — | — | 128 | 170 | — | |||||||||||||||||||||
Loss on settlement | — | — | — | — | 39 | 993 | — | 39 | 993 | |||||||||||||||||||||
Gain from curtailment | — | — | — | — | — | (1,265 | ) | — | — | (1,265 | ) | |||||||||||||||||||
Net periodic benefit cost | $ | 554 | $ | 718 | $ | 584 | $ | 377 | $ | 576 | $ | 508 | $ | 931 | $ | 1,294 | $ | 1,092 | ||||||||||||
The Company does not expect to make any contributions to the German plan during the next fiscal year as contributions are not required by funding regulations or laws and the cash surrender value of the life insurance plan earmarked by the Company substantially covers the under-funded status of the German plan.
The Company expects to make contributions to the Japan plan of approximately $0.5 million during fiscal 2015.
Fair Value of Plan Assets
The plan assets measured at fair value consisted of the following as of June 27, 2014 (in thousands):
Level 1 | Level 2 | Level 3 | Total | |||||||||||||
Pension investments held by insurance companies- German Plan | $ | — | $ | 2,706 | $ | — | $ | 2,706 | ||||||||
Pension investments held by insurance companies - Japan Plan | — | 2,918 | — | 2,918 | ||||||||||||
Total assets measured at fair value | $ | — | $ | 5,624 | $ | — | $ | 5,624 | ||||||||
The plan assets measured at fair value consisted of the following as of June 28, 2013 (in thousands):
Level 1 | Level 2 | Level 3 | Total | |||||||||||||
Pension investments held by insurance companies- German Plan | $ | — | $ | 2,633 | $ | — | $ | 2,633 | ||||||||
Pension investments held by insurance companies - Japan Plan | — | 2,916 | — | 2,916 | ||||||||||||
Total assets measured at fair value | $ | — | $ | 5,549 | $ | — | $ | 5,549 | ||||||||
As previously indicated, these plans are managed by local insurance companies and these companies make investment decisions with the guidelines set by the local regulations.
Level 2 assets include investments that are pooled with other investment held by insurance companies within their general funds for our pension plans. The investments held by the insurance companies are valued by taking the percentage owned by the plan in the underlying net asset value of the insurance company's general fund. The valuation of the underlying net assets of the insurance company's general fund is based on quoted market prices of the investments in active markets or for quoted market prices in active markets of similar assets. The market inputs used to value these instruments generally consist of market yields, reported trades, broker/dealer quotes or alternative pricing sources with reasonable levels of price transparency. Pricing sources include industry standard data providers, security master files from large financial institutions and other third party sources.
86
SILICON GRAPHICS INTERNATIONAL CORP.
NOTES TO CONSOLIDATED FINANCIAL STATEMENTS (Continued)
Future Employee Benefit Payments
The following table provides the estimated pension payments that are payable from the plans to participants (in thousands):
Future Payments | ||||||||||
Fiscal Year | Germany | Japan | Total | |||||||
2015 | $ | 454 | $ | 154 | 608 | |||||
2016 | 468 | 157 | 625 | |||||||
2017 | 500 | 158 | 658 | |||||||
2018 | 678 | 349 | 1,027 | |||||||
2019 | 894 | 161 | 1,055 | |||||||
Following five years | 4,025 | 1,367 | 5,392 | |||||||
Total | $ | 7,019 | $ | 2,346 | $ | 9,365 | ||||
Defined Contribution Plan
The Company's U.S. employees are eligible to participate in the Company's qualified defined contribution plan under section 401(k) of the Internal Revenue Code. The plan provides for voluntary salary reduction contributions up to the maximum allowed under Internal Revenue Service rules. Under the terms of the plan, the Company may provide a discretionary matching contribution at the discretion of its management or the Company can make annual contributions to the plan at the discretion of the Board of Directors. The Company contributed $2.8 million, $1.5 million and $1.4 million during fiscal 2014, 2013 and 2012, respectively.
21. INCOME TAXES
The provision (benefit) for income taxes for fiscal years 2014, 2013 and 2012 was as follows (in thousands):
Fiscal Year Ended | ||||||||||||
June 27, 2014 | June 28, 2013 | June 29, 2012 | ||||||||||
Federal: | ||||||||||||
Current | $ | — | $ | (137 | ) | $ | 7 | |||||
Deferred | — | — | — | |||||||||
— | (137 | ) | 7 | |||||||||
State: | ||||||||||||
Current | 205 | (18 | ) | (136 | ) | |||||||
Deferred | — | — | — | |||||||||
205 | (18 | ) | (136 | ) | ||||||||
Foreign: | ||||||||||||
Current | (3 | ) | (11,995 | ) | (524 | ) | ||||||
Deferred | (190 | ) | (473 | ) | 1,654 | |||||||
(193 | ) | (12,468 | ) | 1,130 | ||||||||
Income tax (benefit) provision | $ | 12 | $ | (12,623 | ) | $ | 1,001 | |||||
87
SILICON GRAPHICS INTERNATIONAL CORP.
NOTES TO CONSOLIDATED FINANCIAL STATEMENTS (Continued)
The components of loss before income taxes consisted of the following (in thousands):
Fiscal Year Ended | ||||||||||||
June 27, 2014 | June 28, 2013 | June 29, 2012 | ||||||||||
Domestic sources | $ | (58,790 | ) | $ | (23,429 | ) | $ | (17,817 | ) | |||
Foreign sources | 5,988 | 7,986 | (5,643 | ) | ||||||||
Total | $ | (52,802 | ) | $ | (15,443 | ) | $ | (23,460 | ) | |||
Deferred tax assets and liabilities reflect the effects of tax losses, credits and the future income tax effects of temporary differences between the consolidated financial statement carrying amounts of existing assets and liabilities and their respective tax bases and are measured using enacted statutory tax rates that are realized the years in which those temporary differences are estimated to be recovered or settled.
As of June 27, 2014 and June 28, 2013, the significant components of the Company’s deferred tax assets and liabilities were (in thousands):
Fiscal Year Ended | ||||||||
June 27, 2014 | June 28, 2013 | |||||||
Deferred tax assets: | ||||||||
Net operating losses and tax credit carry forwards | $ | 126,541 | $ | 146,488 | ||||
Stock based compensation | 7,692 | 11,949 | ||||||
Intangible and fixed assets | 13,927 | 12,850 | ||||||
Accruals and reserves | 21,134 | 18,644 | ||||||
Other | 1,128 | 2,301 | ||||||
Total deferred tax assets | 170,422 | 192,232 | ||||||
Deferred tax liabilities: | ||||||||
Deferred revenue | (1,348 | ) | (28,171 | ) | ||||
Total deferred tax liabilities | (1,348 | ) | (28,171 | ) | ||||
Net deferred tax assets | 169,074 | 164,061 | ||||||
Less valuation allowance | (168,131 | ) | (163,308 | ) | ||||
Net deferred tax assets | $ | 943 | $ | 753 | ||||
The valuation allowance against the Company's deferred tax assets increased from $163.3 million as of June 28, 2013 to $168.1 million as of June 27, 2014. The increase was primarily due to a reduction of deferred tax liabilities related to a prior year income tax accounting method change. The net deferred tax asset as of June 27, 2014 is attributable to deferred tax assets of certain foreign subsidiaries which we believe are more likely than not of being realized. The majority of deferred tax assets are subject to full valuation allowance as they are more likely than not unrealized based on all available positive and negative evidence including our history of operating results and uncertainty of predicting future income.
As of June 27, 2014, the Company has federal, state, other foreign and Japan net operating loss carryforwards of $212.9 million, $135.0 million, $83.7 million and $68.7 million, respectively. If not utilized, the net operating loss carryforwards will begin to expire in fiscal 2015 for state and foreign, fiscal 2017 for Japan and fiscal 2028 for federal. Substantially all Japan net operating losses of $68.7 million will expire by fiscal 2021. The amounts expiring in fiscal 2015 are immaterial to our financial statements.
As a result of a cumulative ownership change of greater than 50% occurring in January, 2010, the Company's ability to utilize federal and state net operating loss and credit carryforwards is subject to an annual limitation as defined by sections 382 and 383 of the Internal Revenue Code. The Company anticipates that all net operating loss carryforwards will become available prior to expiration if there are no subsequent events that produce a greater restriction on the net operating losses.
Tax attributes related to stock option windfalls deductions are not recorded until the deductions result in a reduction of cash taxes payable. The amount of the Company's unrealized federal and state net operating losses relating to stock options deductions as of June 27, 2014 was $17.5 million. The benefit of these net operating losses will be recorded to additional paid-in capital if and when the Company realizes a reduction of cash taxes payable.
88
SILICON GRAPHICS INTERNATIONAL CORP.
NOTES TO CONSOLIDATED FINANCIAL STATEMENTS (Continued)
As of June 27, 2014, the Company has federal and state Research and Development tax credits of $5.6 million and $6.0 million, respectively and $4.8 million of foreign investment tax credits. If not utilized, the federal and foreign tax credits will begin to expire in fiscal 2027 and 2019, respectively. The state tax credits do not expire.
The Company's policy with respect to its undistributed foreign earnings is to consider those earnings to be indefinitely reinvested or repatriated tax-free and, accordingly, no related provision for income or withholding taxes have been provided. Upon distribution of those earnings in the form of dividends or otherwise, the Company may be subject to both income taxes and withholding taxes in the U.S. and various foreign countries. At June 27, 2014, the Company did not record deferred tax liabilities of $5.0 million on approximately $17.9 million of earnings that are deemed to be permanently reinvested overseas or repatriated tax free.
A reconciliation of the statutory federal income tax rate for fiscal 2014, 2013 and 2012 is as follows:
Fiscal Year Ended | |||||||||
June 27, 2014 | June 28, 2013 | June 29, 2012 | |||||||
Federal statutory rate provision | 35.0 | % | 35.0 | % | 35.0 | % | |||
State taxes, net of federal tax benefit | (0.2 | ) | (1.3 | ) | (0.9 | ) | |||
Foreign rate differential | 2.3 | 13.8 | (5.4 | ) | |||||
Stock based compensation | 0.1 | (2.1 | ) | (2.3 | ) | ||||
Valuation allowance - US | (38.3 | ) | (47.0 | ) | (20.9 | ) | |||
Valuation allowance - Foreign | 0.4 | 3.1 | (7.4 | ) | |||||
Unrecognized tax benefits | (0.1 | ) | 68.9 | 4.9 | |||||
Foreign tax refunds | 2.6 | 15.8 | — | ||||||
Foreign withholding tax | — | — | (2.9 | ) | |||||
Federal research credits | 0.7 | 4.5 | 1.7 | ||||||
Foreign dividend and other | (2.5 | ) | (8.6 | ) | (6.3 | ) | |||
Effective tax rate | — | % | 82.1 | % | (4.5 | )% | |||
A reconciliation of the unrecognized tax benefits (excluding interest and penalties) from June 24, 2011 through June 27, 2014 are as follows (in thousands):
Balance at June 24, 2011 | $ | 22,863 | |
Increase to current year positions | 1,142 | ||
Decrease to prior year positions | (12,556 | ) | |
Decrease due to lapse of statute of limitations | (2,182 | ) | |
Balance at June 29, 2012 | 9,267 | ||
Increase to current year positions | 524 | ||
Decrease to prior year positions | (3,685 | ) | |
Decrease due to lapse of statute of limitations | (804 | ) | |
Decrease of unrecognized tax benefits related to settlements | (315 | ) | |
Balance at June 28, 2013 | 4,987 | ||
Increase to current year positions | 344 | ||
Increase to prior year positions | 910 | ||
Decrease due to lapse of statute of limitations | (270 | ) | |
Balance at June 27, 2014 | $ | 5,971 | |
At June 27, 2014, the Company had approximately $6.0 million of gross unrecognized tax benefit of which $2.1 million, if recognized, will impact the effective tax rate. The Company does not expect that the total unrecognized tax benefits will significantly increase or decrease in the next 12 months.
The Company classifies interest expense and penalties related to unrecognized tax benefits as components of income tax expense. As of June 27, 2014, the Company has accrued interest and penalties of approximately $6.8 million and $0.5 million, respectively, on the Company’s consolidated balance sheet.
89
SILICON GRAPHICS INTERNATIONAL CORP.
NOTES TO CONSOLIDATED FINANCIAL STATEMENTS (Continued)
During fiscal 2014, the Company recognized net expense of approximately $0.3 million for interest and $0.3 million for penalties resulting from reversals of unrecognized tax benefits and current year additions as recorded in the consolidated statement of operations.
The Company’s U.S. federal tax returns for 2007 and prior years are no longer subject to examination. The Company’s state tax returns for years prior to 2007 are not subject to examination.
The Company’s foreign subsidiaries file income tax returns in the countries in which they have operations. Generally, these countries have statute of limitations ranging from 3 to 7 years. Tax years still open to examination by foreign tax authorities range from 2007 through 2013.
It is reasonably possible that over the next twelve-month period the Company may experience an increase or decrease in its unrecognized tax benefits. However, it is not possible to estimate either the estimated amount or the range of any increase or decrease at this time.
22. SEGMENT INFORMATION
Commencing in the first quarter of fiscal 2014, the Company started managing its business primarily on a business unit basis versus the geographic basis previously used by management. Accordingly, the Company has determined its operating and reporting segments, which is based on the business unit structure, to be Compute, Storage and Service. The Company's operating segments are determined based upon several criteria including: the Company's internal organizational structure; the manner in which the Company's operations are managed; the criteria used by the Company's Chief Executive Officer, the Chief Operating Decision Maker (“CODM”), to evaluate segment performance; and the Company's availability of separate financial information.
A description of Company's three reportable segments is as follows:
Compute—The Compute solutions segment includes our scale-out computing, scale-up computing and software solutions. Compute solutions also include integrated third-party hardware and software products that we sell to provide a single source solution for our customers. Our compute solutions are designed to minimize the number and complexity of interconnects for power and data transfer to improve reliability, speed of implementation and serviceability.
Storage—The Storage solutions segment includes both hardware and software offerings to address virtually every type of data storage and management requirement. Products range from entry-level disk arrays to complex storage systems, with innovative technology and hardware, to include the SGI Modular InfiniteStorage™ platform, SGI InfiniteStorage™ gateway and SGI CXFS™ file system. Our storage solutions are designed to provide extreme scale, broad flexibility and to minimize the cost to store data.
Service—The Service segment is comprised of customer service support and professional services. Our customer support organization provides ongoing maintenance and technical support for our products and some third-party products, as well as contracted maintenance services, hardware deployment services (install and de-install), time and materials-based services and spare parts. Our professional services organization provides value added services associated with technology consulting, project management and customer education, all of which help our customers realize the full value of their information technology investments.
All historical segment numbers for fiscal 2013 and 2012 have been recast to conform to the fiscal 2014 business unit presentation.
The Company's CODM evaluates the performance of its operating segments based on revenue and operating profit (loss). Revenue is generally allocated based on the type of products and service provided to our customers. Operating profit (loss) for each segment includes related cost of sales and operating expenses directly attributable to the segment. A portion of the segments' expenses arise from shared services and infrastructure that the Company provides to the segments in order to realize economies of scale and to efficiently use resources. These expenses, collectively called corporate charges, include costs of centralized research and development and other corporate infrastructure expenses. The corporate charges that are directly attributable to the segments are allocated and are reassessed on a periodic basis. The allocations have been determined on a basis that the Company considers to be a reasonable reflection of the utilization of services provided to or benefits received by the segments. The profitability of each of the segments is measured after excluding share based compensation expenses, amortization of intangibles, restructuring charges, manufacturing transition costs, general and administration charges, other unallocated corporate charges and other items as noted in the reconciliation below as management does not include this information in its measurement of the performance of the operating segments.
90
SILICON GRAPHICS INTERNATIONAL CORP.
NOTES TO CONSOLIDATED FINANCIAL STATEMENTS (Continued)
Segment Results
The following table presents revenue and operating profit (loss) for the Company’s segments for fiscal 2014, 2013 and 2012 (in thousands):
Fiscal Year Ended | ||||||||||||
June 27, 2014 | June 28, 2013 | June 29, 2012 | ||||||||||
Total net revenue | ||||||||||||
Compute | $ | 307,440 | $ | 498,166 | $ | 486,188 | ||||||
Storage | 67,125 | 92,523 | 70,545 | |||||||||
Service | 155,381 | 176,538 | 196,254 | |||||||||
Total net revenue | $ | 529,946 | $ | 767,227 | $ | 752,987 | ||||||
Operating profit from reportable segments | ||||||||||||
Compute | $ | (989 | ) | $ | 30,304 | $ | 25,320 | |||||
Storage | 843 | 1,140 | (2,069 | ) | ||||||||
Service | 60,412 | 58,805 | 56,616 | |||||||||
Total operating profit from reportable segments (1) | $ | 60,266 | $ | 90,249 | $ | 79,867 | ||||||
(1) The profitability of each of the segments is measured after excluding unallocated corporate charges, restructuring and severance, amortization and impairment of acquired intangibles, share based compensation expenses, manufacturing transition and termination costs, and other items as noted in the reconciliation below.
The following table reconciles segment results to our total company results from operations before taxes:
Fiscal Year Ended | ||||||||||||
June 27, 2014 | June 28, 2013 | June 29, 2012 | ||||||||||
(in thousands) | ||||||||||||
Total reportable segments' operating profit | $ | 60,266 | $ | 90,249 | $ | 79,867 | ||||||
All other corporate charges: | ||||||||||||
Unallocated operating expenses | 73,357 | 76,186 | 73,054 | |||||||||
Restructuring and severance | 12,222 | 13,965 | 3,092 | |||||||||
Amortization and impairment of intangibles | 6,748 | 3,709 | 5,190 | |||||||||
Share based compensation | 11,979 | 10,100 | 10,061 | |||||||||
Manufacturing transition / termination costs | 2,199 | — | — | |||||||||
Excess and obsolescence inventory charges | 5,424 | — | 10,135 | |||||||||
Other | 3,184 | (57 | ) | (222 | ) | |||||||
Total all other corporate charges | 115,113 | 103,903 | 101,310 | |||||||||
Loss from operations, as reported | $ | (54,847 | ) | $ | (13,654 | ) | $ | (21,443 | ) | |||
The Company derives the results of the business segments directly from its internal management reporting system. The presentation of our revenue for segment information purposes differs from the accompanying unaudited condensed consolidated statements of operations. The segment information is presented on the basis which the Company's CODM evaluates the performance of its operating segments. The combined product and service revenue is allocated to product and service revenue on a contractual basis for segment information purposes.
The Company's assets are located primarily in the United States and are not allocated to any specific business segment. The Company does not measure the performance of its business segments on any asset-based metrics. Therefore, reportable segment information is presented only for revenue and operating profit (loss).
Customer Information
For fiscal 2014, various agencies of the United States government, excluding system integrators, accounted for 10% or more of our revenue. For fiscal 2013 and 2012, Amazon accounted for approximately 18% and 16% of our revenue,
91
SILICON GRAPHICS INTERNATIONAL CORP.
NOTES TO CONSOLIDATED FINANCIAL STATEMENTS (Continued)
respectively. Our direct sales to the U.S. government accounted for16%, 19%, and less than 10% of our revenue in fiscal 2014, 2013, and 2012, respectively.
At June 27, 2014, two customers accounted for 27% of the Company's accounts receivable. At June 28, 2013, one customer accounted for 20% of the Company's accounts receivable.
Geographic Information
The following table presents revenue by geographic region for fiscal 2014, 2013 and 2012 (in thousands except percentages):
Fiscal Year Ended | |||||||||||
June 27, 2014 | June 28, 2013 | June 29, 2012 | |||||||||
Americas | $ | 277,536 | $ | 496,508 | 473,746 | ||||||
As a percent of total net revenue | 52.4 | % | 64.7 | % | 62.9 | % | |||||
EMEA | 116,071 | 134,152 | 108,849 | ||||||||
As a percent of total net revenue | 21.9 | % | 17.5 | % | 14.5 | % | |||||
APJ | 136,339 | 136,567 | 170,392 | ||||||||
As a percent of total net revenue | 25.7 | % | 17.8 | % | 22.6 | % | |||||
Total revenue | $ | 529,946 | $ | 767,227 | 752,987 | ||||||
Americas includes both North and South America. EMEA includes European countries, as well as the Middle East and Africa. APJ includes Australia, Japan and all other Asian countries.
International sales to Japan, the only foreign country which accounted for ten percent or more of revenue, was $108.3 million for fiscal 2014 or 20% of revenue, $98.9 million for fiscal 2013 or 13% of revenue and $130.9 million or 17% of revnue for fiscal 2012.
Approximately 97% and 94% of the Company’s property and equipment was located in the United States as of June 27, 2014 and June 28, 2013, respectively. No individual foreign country’s property and equipment was material for disclosure purposes.
23. FINANCIAL GUARANTEES
The Company has issued financial guarantees to cover rent on leased facilities and equipment, to government authorities for VAT and other taxes and to various other parties to support payments in advance of future delivery on goods and services. The majority of the Company’s financial guarantees have terms of one year or more. The maximum potential obligation under financial guarantees at June 27, 2014 was $4.6 million for which the Company has $4.5 million of assets held as collateral. The full amount of the assets held as collateral are included in short-term and long-term restricted cash in the consolidated balance sheets.
24. COMMITMENTS AND CONTINGENCIES
Leases
The Company leases certain real and personal property under non-cancelable operating leases. The Company leases its facilities and office buildings under operating leases that expire at various dates through November 2023. Certain leases also contain escalation and renewal option clauses calling for increased rents. Where a lease contains an escalation clause or a concession such as a rent holiday, rent expense is recognized using the straight line method over the term of the lease.
92
SILICON GRAPHICS INTERNATIONAL CORP.
NOTES TO CONSOLIDATED FINANCIAL STATEMENTS (Continued)
Future minimum lease payments under operating leases are as follows (in thousands):
Fiscal Year | Amount | |||
2015 | $ | 6,229 | ||
2016 | 4,086 | |||
2017 | 2,755 | |||
2018 | 2,376 | |||
2019 | 2,377 | |||
Thereafter | 11,167 | |||
Total | $ | 28,990 | ||
Rent expense for fiscal 2014, 2013 and 2012 was approximately $7.4 million, $7.5 million and $8.3 million, respectively.
Purchase Commitments
In connection with supplier agreements, the Company has purchase obligations that include agreements to purchase certain units of inventory and non-inventory items through 2015. These purchase obligations that are enforceable and legally binding on the Company specify all significant terms, including fixed or minimum quantities to be purchased, fixed, minimum or variable price provisions and the approximate timing of the transaction.
As of June 27, 2014, these non-cancelable purchase commitments were approximately $18.5 million, of which $17.2 million are due in the next 12 months.
In June 2013, the Company signed a lease for a new headquarters facility and incurred approximately $10.7 million for capital expenditures and received approximately $5.9 million in lease incentives.
Indemnification Agreements
The Company enters into standard indemnification agreements with its customers and certain other business partners in the ordinary course of business. These agreements include provisions for indemnifying the customer against any claim brought by a third party to the extent any such claim alleges that the Company’s product infringes a patent, copyright or trademark, or misappropriates a trade secret, of that third-party. The agreements generally limit the scope of the available remedies in a variety of industry-standard methods, including, but not limited to, product usage and geography-based limitations, a right to control the defense or settlement of any claim and a right to replace or modify the infringing products to make them non-infringing. The Company has not incurred significant expenses related to these indemnification agreements and no material claims for such indemnifications were outstanding as of June 27, 2014. As a result, the Company believes the estimated fair value of these indemnification agreements, if any, to be immaterial; accordingly, no liability has been recorded with respect to such indemnifications as of June 27, 2014.
Credit facility
The Company's credit facility includes a $10.0 million letter of credit subfacility. As of June 27, 2014, the Company has a $2.0 million outstanding letter of credit to back the Company's obligation to pay or perform when required to do so pursuant to the requirements of an underlying agreement or the provision of goods or services to a supplier. See Note 16 "Credit Facility" for more information regarding the credit facility.
Contingencies
The Company may, from time to time, be involved in legal proceedings and disputes that arise in the normal course of business. These matters include product liability actions, patent infringement actions, contract disputes, domestic and international federal, state and local tax reviews and audits and other matters. The Company also may be subject to litigation and/or adverse rulings or judgments as a result of certain contractual indemnification obligations. The Company records a provision for a liability when management believes that it is both probable that a liability has been incurred and it can reasonably estimate the amount of the loss. The Company believes it has adequate provisions for any such matters. The Company reviews these provisions at least quarterly and adjusts these provisions to reflect the impact of negotiations, settlements, rulings, advice of legal counsel and other information and events pertaining to a particular case.
Third parties in the past have asserted, and may in the future assert, intellectual property infringement claims against the Company, and such future claims, if proven, could require the Company to pay substantial damages or to redesign its existing products or pay fees to obtain cross-license agreements. Litigation may be necessary in the future to enforce or defend the
93
SILICON GRAPHICS INTERNATIONAL CORP.
NOTES TO CONSOLIDATED FINANCIAL STATEMENTS (Continued)
Company's intellectual property rights, to protect the Company's trade secrets or to determine the validity and scope of its proprietary rights or the proprietary rights of others. Any such litigation could result in substantial costs and diversion of management resources, either of which could harm the Company's business, operating results and financial condition. Further, many of the Company's current and potential competitors have the ability to dedicate substantially greater resources to enforcing and defending their intellectual property rights than the Company.
Additionally, from time to time, the Company receives inquiries from regulatory agencies informally requesting information or documentation. There can be no assurance in any given case that such informal review will not lead to further proceedings involving the Company in the future.
The Company is not aware of any pending disputes, including those outlined above, that would be likely to have a material adverse effect, either individually or in the aggregate, on its consolidated financial condition, results of operations or liquidity. However, litigation is subject to inherent uncertainties and costs and unfavorable outcomes could occur. An unfavorable outcome could include the payment of monetary damages, cash or other settlement, or an injunction prohibiting it from selling one or more products. If an unfavorable resolution were to occur, there exists the possibility of a material adverse impact on the Company's consolidated financial condition, results of operations or cash flows of the period in which the resolution occurs or on future periods.
94
SILICON GRAPHICS INTERNATIONAL CORP.
NOTES TO CONSOLIDATED FINANCIAL STATEMENTS (Continued)
25. SELECTED QUARTERLY FINANCIAL INFORMATION (UNAUDITED)
The following is a summary of quarterly results of operations for fiscal 2014 and 2013 (in thousands, except per share amounts).
Fiscal Quarter Ended | ||||||||||||||||
June 27, 2014 | March 28, 2014 | December 27, 2013 | September 27, 2013 | |||||||||||||
Revenue | $ | 142,084 | $ | 124,283 | $ | 116,060 | $ | 147,519 | ||||||||
Gross profit | $ | 35,606 | $ | 31,070 | $ | 33,483 | $ | 38,248 | ||||||||
Net loss | $ | (10,449 | ) | $ | (21,858 | ) | $ | (13,684 | ) | $ | (6,823 | ) | ||||
Basic and diluted net loss per share: | $ | (0.30 | ) | $ | (0.64 | ) | $ | (0.40 | ) | $ | (0.20 | ) | ||||
Shares used in the calculation of basic and diluted net loss per share: | 34,445 | 34,325 | 34,176 | 34,096 | ||||||||||||
Fiscal Quarter Ended | ||||||||||||||||
June 28, 2013 | March 29, 2013 | December 28, 2012 | September 28, 2012 | |||||||||||||
Revenue | $ | 170,532 | $ | 232,588 | $ | 171,226 | $ | 192,881 | ||||||||
Gross profit | $ | 46,786 | $ | 52,492 | $ | 47,564 | $ | 42,210 | ||||||||
Net (loss) income | $ | (4,465 | ) | $ | 9,224 | $ | 1,101 | $ | (8,680 | ) | ||||||
Basic and diluted net (loss) income per share: | ||||||||||||||||
Basic | $ | (0.13 | ) | $ | 0.28 | $ | 0.03 | $ | (0.27 | ) | ||||||
Diluted | $ | (0.13 | ) | $ | 0.27 | $ | 0.03 | $ | (0.27 | ) | ||||||
Shares used in the calculation of net (loss) income per share: | ||||||||||||||||
Basic | 33,859 | 33,201 | 32,410 | 32,166 | ||||||||||||
Diluted | 33,859 | 34,467 | 32,778 | 32,166 | ||||||||||||
95
SCHEDULE II.
SILICON GRAPHICS INTERNATIONAL CORP.
VALUATION AND QUALIFYING ACCOUNTS
(In thousands)
Fiscal Year Ended | ||||||||
June 27, 2014 | June 28, 2013 | |||||||
Allowance for doubtful accounts: | ||||||||
Beginning balance | $ | 1,074 | $ | 1,597 | ||||
Charges, net of recoveries | 70 | 38 | ||||||
Write-offs and adjustments | (857 | ) | (561 | ) | ||||
Ending balance | $ | 287 | $ | 1,074 | ||||
96
Item 9. Changes in and Disagreements with Accountants on Accounting and Financial Disclosure
None
Item 9A. Controls and Procedures
Disclosure Controls and Procedures
Under the supervision and with the participation of our management, including our chief executive officer and chief financial officer, we have evaluated the effectiveness of our disclosure controls and procedures, as such term is defined under Rule 13a-15(e) promulgated under the Securities and Exchange Act of 1934, as amended (the "Exchange Act"). The evaluation considered the procedures designed to ensure that the information included in reports we file under the Exchange Act, is recorded, processed, summarized and reported within the appropriate time periods and that information is accumulated and communicated to our management, including our chief executive officer and chief financial officer, as appropriate, to allow timely decisions regarding required disclosures. Based on that evaluation, our management, including our chief executive officer and chief financial officer, has concluded that our disclosure controls and procedures were effective at the reasonable assurance level as of June 27, 2014.
Management’s Report on Internal Control Over Financial Reporting
Management is responsible for establishing and maintaining adequate internal control over financial reporting, as such term is defined in Exchange Act Rules 13a-15(f) and 15d-15(f). The Company’s internal control over financial reporting is a process designed to provide reasonable assurance regarding the reliability of financial reporting and the preparation of financial statements for external purposes in accordance with generally accepted accounting principles. Because of its inherent limitations, internal control over financial reporting may not prevent or detect misstatements. Also, projections of any evaluation of effectiveness to future periods are subject to the risks that controls may become inadequate because of changes in conditions, or that the degree of compliance with the policies or procedures may deteriorate.
Under the supervision and with the participation of our management, including our principal executive officer and principal financial officer, we conducted an evaluation of our internal control over financial reporting based on the criteria established in Internal Control—Integrated Framework (1992) issued by the Committee of Sponsoring Organizations of the Treadway Commission. Based on this evaluation, our management has concluded that the Company’s internal control over financial reporting was effective as of June 27, 2014.
The effectiveness of our internal control over financial reporting as of June 27, 2014 has been audited by Deloitte & Touche LLP, independent registered public accounting firm, as stated in its report appearing below.
Changes in Internal Control over Financial Reporting
The Company also evaluated changes to its internal control over financial reporting. There were no changes in the Company's internal control over financial reporting during the fiscal year ended June 27, 2014 that have materially affected or are reasonably likely to materially affect the Company's internal control over financial reporting.
97
REPORT OF INDEPENDENT REGISTERED PUBLIC ACCOUNTING FIRM
To the Board of Directors and Stockholders of
Silicon Graphics International Corp.
Milpitas, CA
We have audited the internal control over financial reporting of Silicon Graphics International Corp. and subsidiaries (the "Company") as of June 27, 2014, based on criteria established in Internal Control - Integrated Framework (1992) issued by the Committee of Sponsoring Organizations of the Treadway Commission. The Company's management is responsible for maintaining effective internal control over financial reporting and for its assessment of the effectiveness of internal control over financial reporting, included in the accompanying Management’s Report on Internal Control over Financial Reporting. Our responsibility is to express an opinion on the Company's internal control over financial reporting based on our audit.
We conducted our audit in accordance with the standards of the Public Company Accounting Oversight Board (United States). Those standards require that we plan and perform the audit to obtain reasonable assurance about whether effective internal control over financial reporting was maintained in all material respects. Our audit included obtaining an understanding of internal control over financial reporting, assessing the risk that a material weakness exists, testing and evaluating the design and operating effectiveness of internal control based on the assessed risk, and performing such other procedures as we considered necessary in the circumstances. We believe that our audit provides a reasonable basis for our opinion.
A company's internal control over financial reporting is a process designed by, or under the supervision of, the company's principal executive and principal financial officers, or persons performing similar functions, and effected by the company's board of directors, management, and other personnel to provide reasonable assurance regarding the reliability of financial reporting and the preparation of financial statements for external purposes in accordance with generally accepted accounting principles. A company's internal control over financial reporting includes those policies and procedures that (1) pertain to the maintenance of records that, in reasonable detail, accurately and fairly reflect the transactions and dispositions of the assets of the company; (2) provide reasonable assurance that transactions are recorded as necessary to permit preparation of financial statements in accordance with generally accepted accounting principles, and that receipts and expenditures of the company are being made only in accordance with authorizations of management and directors of the company; and (3) provide reasonable assurance regarding prevention or timely detection of unauthorized acquisition, use, or disposition of the company's assets that could have a material effect on the financial statements.
Because of the inherent limitations of internal control over financial reporting, including the possibility of collusion or improper management override of controls, material misstatements due to error or fraud may not be prevented or detected on a timely basis. Also, projections of any evaluation of the effectiveness of the internal control over financial reporting to future periods are subject to the risk that the controls may become inadequate because of changes in conditions, or that the degree of compliance with the policies or procedures may deteriorate.
In our opinion, the Company maintained, in all material respects, effective internal control over financial reporting as of June 27, 2014, based on the criteria established in Internal Control - Integrated Framework (1992) issued by the Committee of Sponsoring Organizations of the Treadway Commission.
We have also audited, in accordance with the standards of the Public Company Accounting Oversight Board (United States), the consolidated financial statements as of and for the year ended June 27, 2014 of the Company and our report dated September 8, 2014 expressed an unqualified opinion on those financial statements and financial statement schedule.
/s/ DELOITTE & TOUCHE LLP
San Jose, CA
September 8, 2014
98
Item 9B. Other Information
None
99
PART III
Item 10. Directors, Executive Officers and Corporate Governance
Information required by this Item with respect to our executive officers is contained in Item 1 of Part I of this Annual Report on Form 10-K under the heading “Executive Officers of the Registrant.”
All other information required by this Item is incorporated by reference herein to our definitive Proxy Statement for the 2014 Annual Meeting of Stockholders (the “Proxy Statement”) scheduled for December 9, 2014.
Item 11. Executive Compensation
The information required by this Item is incorporated herein by reference to the Proxy Statement.
Item 12. Security Ownership of Certain Beneficial Owners and Management and Related Stockholder Matters
The information required by this Item is incorporated herein by reference to the Proxy Statement.
Item 13. Certain Relationships and Related Transactions, and Director Independence
The information required by this Item is incorporated herein by reference to the Proxy Statement.
Item 14. Principal Accounting Fees and Services
The information required by this Item is incorporated herein by reference to the Proxy Statement.
100
PART IV
Item 15. Exhibits and Financial Statement Schedules
(a) 1. Financial Statements
See Index to Consolidated Financial Statements in Item 8 of Part II of this Annual Report on Form 10-K, which is incorporated herein by reference.
2. Financial Statement Schedules
All other financial statement schedules have been omitted because they are either not applicable or the required information is shown in the consolidated financial statements or notes thereto.
3. Exhibits
See the Exhibit Index following the signature page of this Annual Report on Form 10-K, which is incorporated herein by reference.
101
SIGNATURES
Pursuant to the requirements of Section 13 or 15(d) of the Securities Exchange Act of 1934, the registrant has duly caused this report to be signed on its behalf by the undersigned, thereunto duly authorized.
SILICON GRAPHICS INTERNATIONAL CORP. | |||
By: | /s/ ROBERT J. NIKL | ||
Robert J. Nikl Chief Financial Officer | |||
Dated: September 8, 2014
102
Exhibit 24.1
POWER OF ATTORNEY
KNOW ALL PERSONS BY THESE PRESENTS, that each person whose signature appears below constitutes and appoints Jorge L. Titinger and Robert J. Nikl, and each of them, acting individually, as his or her attorney-in-fact, each with full power of substitution and resubstitution, for him or her and in his or her name, place and stead, in any and all capacities, to sign any and all amendments to this Annual Report on Form 10-K, and to file the same, with all exhibits thereto, and other documents in connection therewith, with the Securities and Exchange Commission, granting unto said attorneys-in-fact and agents, and each of them, full power and authority to do and perform each and every act and thing requisite and necessary to be done in connection therewith and about the premises, as fully to all intents and purposes as he or she might or could do in person, hereby ratifying and confirming all that said attorneys-in-fact and agents, or any of them, or their or his substitute or substitutes, may lawfully do or cause to be done by virtue hereof. This Power of Attorney may be signed in several counterparts.
Pursuant to the requirements of the Securities Exchange Act of 1934, this report has been signed below by the following persons on behalf of the registrant and in the capacities and on the dates indicated.
Signature | Title | Date | ||
/s/ Jorge L. Titinger | President, Chief Executive Officer and Director | September 8, 2014 | ||
Jorge L. Titinger | (Principal Executive Officer) | |||
/s/ Robert J. Nikl | Executive Vice President and Chief Financial Officer | September 8, 2014 | ||
Robert J. Nikl | (Principal Financial Officer) | |||
/s/ Mekonnen P. Asrat | Vice President of Finance and Corporate Controller | September 8, 2014 | ||
Mekonnen P. Asrat | (Principal Accounting Officer) | |||
/s/ Charles M. Boesenberg | Director | September 8, 2014 | ||
Charles M. Boesenberg | ||||
/s/ Gary A. Griffiths | Director | September 8, 2014 | ||
Gary A. Griffiths | ||||
/s/ Michael W. Hagee | Director | September 8, 2014 | ||
Michael W. Hagee | ||||
/s/ Douglas R. King | Director | September 8, 2014 | ||
Douglas R. King | ||||
/s/ Hagi Schwartz | Director | September 8, 2014 | ||
Hagi Schwartz | ||||
/s/ Ronald D. Verdoorn | Chairman of the Board of Directors | September 8, 2014 | ||
Ronald D. Verdoorn | ||||
103
EXHIBIT INDEX
Exhibit Number | Exhibit Description | Incorporated by Reference | Filing Date | Filed Herewith | |||||||||
Form | Ex. No. | File No. | |||||||||||
2.1 | Asset Purchase Agreement dated as of March 31, 2009, by and among Silicon Graphics, Inc., the subsidiaries of Silicon Graphics, Inc. listed on Schedule I thereto, and Rackable Systems, Inc. | 8-K | 2.1 | 000-51333 | 4/1/2009 | ||||||||
2.2 | Amendment to Asset Purchase Agreement dated as of March 31, 2009, by and among Silicon Graphics, Inc., the subsidiaries of Silicon Graphics, Inc. listed on Schedule I thereto, and Rackable Systems, Inc., dated as of April 30, 2009. | 8-K | 2.1 | 000-51333 | 5/5/2009 | ||||||||
2.3 | Stock Purchase Agreement dated as of March 8, 2011, by and among Silicon Graphics World Trade B.V., SGI Japan, Ltd., certain subsidiaries of SGI Japan and NEC CORPORATION as the Stockholders' Representative. | 8-K | 2.1 | 000-51333 | 3/9/2011 | ||||||||
3.1 | Amended and Restated Certificate of Incorporation. | 10-Q | 3.1 | 000-51333 | 8/12/2005 | ||||||||
3.2 | Amended and Restated Bylaws. | X | |||||||||||
3.3 | Certificate of Ownership and Merger. | 8-K | 3.3 | 000-51333 | 5/21/2009 | ||||||||
4.1 | Reference is made to Exhibits 3.1, 3.2 and 3.3. | ||||||||||||
4.2 | Form of Specimen Common Stock Certificate. | 8-K | 4.2 | 000-51333 | 5/21/2009 | ||||||||
10.1 | * | Form of Indemnification Agreement for directors and executive officers. | 8-K | 99.1 | 000-51333 | 5/14/2012 | |||||||
10.2 | * | 2005 Equity Incentive Plan, as amended. | 10-K | 10.3 | 0000-51333 | 9/10/2012 | |||||||
10.3 | * | 2005 Non-Employee Directors’ Stock Option Plan. | S-1 | 10.1 | 333-122576 | 2/4/2005 | |||||||
10.4 | * | 2005 Employee Stock Purchase Plan, as amended. | 10-K | 10.5 | 0000-51333 | 9/10/2012 | |||||||
10.5 | * | Form of Stock Option Agreement under the 2006 New Recruit Equity Incentive Plan. | 8-K | 10.2 | 000-51333 | 1/30/2006 | |||||||
10.6 | * | 2006 New Recruit Equity Inventive Plan, as amended and restated. | 10-K | 10.48 | 000-51333 | 2/28/2007 | |||||||
10.7 | * | Form of Option Agreement and Grant Notices under the 2005 Equity Incentive Plan. | 8-K | 10.2 | 000-51333 | 9/5/2006 | |||||||
10.8 | * | Form of Stock Bonus Award Agreement and Grant Notice under the 2005 Equity Incentive Plan. | 8-K | 10.3 | 000-51333 | 9/5/2006 | |||||||
10.9 | * | Form of Non-statutory Stock Option Agreement under the 2005 Non-Employee Directors’ Stock Option Plan. | 10-Q | 10.11 | 000-51333 | 11/14/2006 | |||||||
10.10 | * | Form of 2005 Equity Incentive Plan Restricted Stock Unit Grant Notice and Restricted Stock Unit Award Agreement | 10-K | 10.16 | 000-51333 | 9/10/2012 | |||||||
10.11 | * | Offer Letter made by the Registrant to Anthony Carrozza, dated January 24, 2008 | 10-K | 10.73 | 000-51333 | 3/19/2009 | |||||||
10.12 | * | First Amendment to Employment Agreement, dated December 23, 2008, between the Registrant and Anthony Carrozza | 10-K | 10.74 | 000-51333 | 3/19/2009 | |||||||
104
Exhibit Number | Exhibit Description | Incorporated by Reference | Filing Date | Filed Herewith | ||||||||||
Form | Ex. No. | File No. | ||||||||||||
10.13 | * | Second Amendment to the Employment Agreement Letter dated December 17, 2012 between the Company and Anthony Carrozza. | 10-K | 10.15 | 000-51333 | 9/9/2013 | ||||||||
10.14 | * | Third Amendment to the Employment Agreement Letter, dated February 21, 2013 between the Company and Anthony Carrozza. | 10-Q | 10.4 | 000-51333 | 5/3/2013 | ||||||||
10.15 | * | Separation Agreement dated August 26, 2013 between the Company and Anthony Carrozza. | 8-K | 10.1 | 000-51333 | 8/28/2013 | ||||||||
10.16 | * | Offer Letter, dated September 9, 2011, between the Registrant and Jennifer Pileggi. | 10-Q | 10.1 | 000-51333 | 11/9/2011 | ||||||||
10.17 | * | First Amendment to Employment Agreement Letter dated December 17, 2012 between the Company and Jennifer W. Pileggi. | 10-K | 10.19 | 000-5133 | 9/9/2013 | ||||||||
10.18 | * | Second Amendment to Employment Agreement Letter dated February 21, 2013 between the Company and Jennifer W. Pileggi. | 10-Q | 10.3 | 000-51333 | 5/3/2013 | ||||||||
10.19 | * | Employment Agreement Letter, dated February 21, 2012, between the Registrant and Jorge L. Titinger. | 8-K | 10.1 | 000-51333 | 2/23/2012 | ||||||||
10.20 | * | First Amendment to Employment Letter, dated April 8, 2013 between the Registrant and Jorge L. Titinger | 101-Q | 10.1 | 000-51333 | 11/4/2013 | ||||||||
10.21 | * | Employment Agreement Letter, dated April 30, 2012, between the Registrant and Robert J. Nikl. | 8-K | 10.1 | 000-51333 | 4/30/2012 | ||||||||
10.22 | * | First Amendment to Employment Letter, dated December 20, 2012 between the Registrant and Robert J. Nikl | 10-Q | 10.2 | 000-51333 | 11/4/2013 | ||||||||
10.23 | * | Employment Agreement Letter dated January 18, 2013 between the registrant and Cassio Conceicao. | 8-K | 10.1 | 000-51333 | 1/22/2013 | ||||||||
10.24 | Credit Agreement, dated December 5, 2011, by and among the Registrant, Silicon Graphics Federal, Inc. and Wells Fargo Capital Finance, LLC. | 8-K | 10.1 | 000-51333 | 12/9/2011 | |||||||||
10.25 | Amendment Number One to Credit Agreement, dated February 7, 2012, among the Registrant, Silicon Graphics Federal, Inc. and Wells Fargo Capital Finance, LLC. | 10-K | 10.35 | 000-51333 | 9/10/2012 | |||||||||
10.26 | Amendment Number Two to Credit Agreement, dated March 30, 2012, among the Registrant, Silicon Graphics Federal, Inc. and Wells Fargo Capital Finance, LLC. | 10-K | 10.36 | 000-51333 | 9/10/2012 | |||||||||
10.27 | Amendment Number Three to Credit Agreement, dated March 30, 2012, among the Registrant, Silicon Graphics Federal, Inc. and Wells Fargo Capital Finance, LLC. | 10-K | 10.37 | 000-51333 | 9/10/2012 | |||||||||
10.28 | Amendment Number Four to Credit Agreement, dated February 25, 2013, by and among the Registrant, Silicon Graphics Federal, Inc., the Lenders that are signatories thereto and Wells Fargo Capital Finance, LLC. | 8-K | 10.1 | 000-51333 | 2/26/2013 | |||||||||
10.29 | Amendment Number Five to Credit Agreement and Waiver, dated July 15, 2013, by and among the Registrant, Silicon Graphics Federal, Inc., the Lenders that are signatories thereto and Wells Fargo Capital Finance, LLC. | 10-Q | 10.3 | 000-51333 | 11/4/2013 | |||||||||
10.30 | Amendment Number Six to Credit Agreement and Limited Waiver, Consent and Release dated January 16, 2014 by and among the Company and SGI Federal, and the Lenders and Agent. | 8-K | 10.1 | 000-51333 | 1/21/2014 | |||||||||
105
Exhibit Number | Exhibit Description | Incorporated by Reference | Filing Date | Filed Herewith | ||||||||
Form | Ex. No. | File No. | ||||||||||
10.31 | Lease dated June 27, 2013 between the Registrant and The Irvine Company LLC. | 8-K | 10.1 | 000-51333 | 6/27/2013 | |||||||
21.1 | Significant Subsidiaries of the Company | X | ||||||||||
23.1 | Consent of Independent Registered Public Accounting Firm | X | ||||||||||
24.1 | Power of Attorney (Included within document after SIGNATURES) | X | ||||||||||
31.1 | Certification required by Rule 13a-14(a) or Rule 15d-14(a). | X | ||||||||||
31.2 | Certification required by Rule 13a-14(a) or Rule 15d-14(a). | X | ||||||||||
32.1 | ** | Certifications required by Rule 13a-14(b) or Rule 15d-14(b) and Section 1350 of Chapter 63 of Title 18 of the United States Code (18 U.S.C. §1350). | X | |||||||||
* | Indicates a management contract or compensatory plan or arrangement. |
** | The certification attached as Exhibit 32.1 accompanies the Annual Report on Form 10-K pursuant to Section 906 of the Sarbanes-Oxley Act of 2002 and shall not be deemed “filed” by Silicon Graphics International Corp. for purposes of Section 18 of the Securities Exchange Act of 1934, as amended. |
106