Attached files
| file | filename |
|---|---|
| 8-K - FORM 8-K - STERLING FINANCIAL CORP /WA/ | a012420138-k.htm |
| EX-99.1 - RESULTS OF OPERATIONS - STERLING FINANCIAL CORP /WA/ | q42012earningsresults.htm |

Earnings Release Supplement For the Quarter and Year Ended December 31, 2012 January 25, 2013

Safe Harbor (1) The Reform Act defines the term "forward-looking statements" to include: statements of management plans and objectives, statements regarding the future economic performance, and projections of revenues and other financial data, among others. The Reform Act precludes liability for oral or written forward-looking statements if the statement is identified as such and accompanied by "meaningful cautionary statements identifying important factors that could cause actual results to differ materially from those made in the forward-looking statements." In the course of our presentation, we may discuss matters that are deemed to be forward-looking statements, which are intended to be covered by the safe harbor for “forward-looking statements” provided by the Private Securities Litigation Reform Act of 1995 (the “Reform Act”)(1). Forward-looking statements involve substantial risks and uncertainties, many of which are difficult to predict and are generally beyond our control. Actual results may differ materially and adversely from projected results. We assume no obligation to update any forward-looking statements (including any projections) to reflect any changes or events occurring after the date hereof. Additional information about risks of achieving results suggested by any forward-looking statements may be found in Sterling’s 10-K, 10-Q and other SEC filings, included under the headings “Risk Factors” and “Management’s Discussion and Analysis of Financial Condition and Results of Operations.” 2

(in thousands, except per share) Per Diluted $ Share Q4 net income, as reported $20,946 $0.33 Debt prepay charge 32,678 0.52 Securities gains (11,243) (0.18) Montana divestiture gain (8,371) (0.13) Legal settlement 2,000 0.03 Income tax benefit (3,201) (0.05) Total $32,809 $0.52 Items Impacting Q4 2012 Net Income Four significant items, in the aggregate, reduced net income by $11.9 million, or $0.19 per diluted share 1. Prepaid $250MM of structured repo; sold securities to fund transaction 2. Gain on sale recorded in connection with Montana divestiture 3. Settlement charge related to a previously disclosed ERISA class action 4. Income tax benefit related to deferred tax asset valuation allowance 3

2012 Loan Growth Summary Total portfolio loan balances increased $734 million, or 13% year-over-year Organic loan growth supplemented with bank acquisition and select bulk purchases For 2012, organic production produced 6% growth Selected purchases of residential mortgage and prime indirect auto loans Portfolio concentrations managed through sales of multifamily loans $187.5 million reduction in loans during 2012 due to NPL resolution 4 (in millions) 2012 12/31/2011 (1) 3/31/2012 6/30/2012 9/30/2012 12/31/2012 YTD Ending balance $5,545 $6,013 $6,084 $6,142 $6,253 $6,253 $ Growth: Total, net 468 71 58 111 708 Purchased 37 49 44 27 157 Acquired/(divested), net 350 - - (41) 309 Sold (1) (50) (2) (10) (63) Organic, net 82 72 16 135 305 % Growth (annualized): Total, net 33.8% 4.7% 3.8% 7.2% 12.8% Purchased 2.7% 3.3% 2.9% 1.8% 2.8% Acquired/(divested), net 25.2% 0.0% 0.0% -2.7% 5.6% Sold -0.1% -3.3% -0.1% -0.7% -1.1% Organic, net 5.9% 4.8% 1.1% 8.8% 5.5% (1) Includes $26.2 million of loans that were classified as held for sale at 12/31/11, that were transferred to portfolio loans during Q1 2012.

Balance Sheet Repositioning Objective: Reduce cost of funds Prepaid $250MM of repurchase agreements with a weighted average cost of 4.26% and weighted average remaining life of 3.4 years Funded by sales of MBS and other investments Net impact to margin: positive 17 basis points Structured repo balances decreased $450 million, or 45%, from 12/31/11 5 Transaction Summary: (in thousands, except per share) Book Average Gain/ Value Yield/Cost (Loss) Repo borrowings terminated $250,000 4.26% ($32,678) MBS sold 343,471 1.62% 8,822 Corporate bond sold 18,310 3.24% 2,537 Net transaction loss, pre-tax ($21,319) Per diluted share ($0.34) Transaction expected annual impact to: (in thousands) Interest income (1) ($4,345) Interest expense (10,642) Net interest income $6,297 Net interest margin (bp) 17 (1) Assumes that $112.4 million differential will be replaced with other earning assets having an equivalent yield of 1.62%. Remaining Repo Borrowings at 12/31/12: (in thousands) Maturity Balance Avg Cost Q1 2013 $50,000 2.04% Q1 2015 50,000 2.47% Q2 2017 100,000 4.39% Q3 2017 100,000 4.34% Q4 2017 200,000 3.80% Q1 2018 50,000 2.62% Total/Avg. $550,000 3.62%

($ in thousands) Q1 2012 Q2 2012 Q3 2012 Q4 2012 Personnel Expense Salaries Expense $34,213 $32,634 $32,463 $32,927 Benefits Expense 9,165 8,523 7,444 7,239 Bonus and Incentive Expense 8,994 10,465 13,537 17,341 Deferred Equity Comp Expense 1,664 1,945 1,421 1,329 Other Personnel Expense 934 919 1,329 1,647 Deferred Direct Orig Exp (7,589) (8,001) (10,558) (10,960) Total Personnel $47,381 $46,485 $45,636 $49,523 Bonus Expense $709 $647 $741 $2,332 Commission Expense 6,135 6,595 8,881 10,199 Incentive Expense 1,971 2,998 3,712 4,774 Awards 179 225 203 36 Total Bonus and Incentive Expense $8,994 $10,465 $13,537 $17,341 Multifamily Group $478 $760 $396 $1,207 Home Loan Division 5,263 5,479 8,097 8,512 All Other Departments 394 356 388 480 Total Commission Expense $6,135 $6,595 $8,881 $10,199 Employee Compensation and Benefits Personnel expenses heavily influenced by incentive compensation in Home Loan Division and Multifamily Group 6 Adjusting bonus accrual in response to TARP CPP termination; Expect 2013 run rate approx. $1.0MM/qtr Commercial and retail performance based incentive plan increase in accrual for Q4; Expect 2013 run rate approx. $3.7MM/qtr

SBA 7A: $65 / 63% SBA 504: $4 / 4% SBA Express: $10 / 10% USDA: $18 / 17% CRE, OO: $4 / 4% CRE, NOO: $2 / 2% (in millions) Key Statistics as of 9/30/2012 (millions) Total assets $142 Net loans $ 95 Total deposits $121 Equity $ 15 Acquisition of Borrego Springs Bank, N.A. 7 SBA franchise with opportunity to expand o One of the top SBA 7(a) producers in the country (ranked 13th by number of loans for FY 2012 ) o 94% of loan portfolio is SBA or USDA o Currently restricted growth due to concentration issues and capital constraints $6.5 million purchase price (52% of TBV) Effective team of producers and administrators Superior SBA 1502 reporting and collection performance Expected close in Q1 ‘13 3 branches, 8 loan offices (1) Retail Branch: LPO: Loan mix by category (1) Image does not include LPO in Panama City Beach, FL.

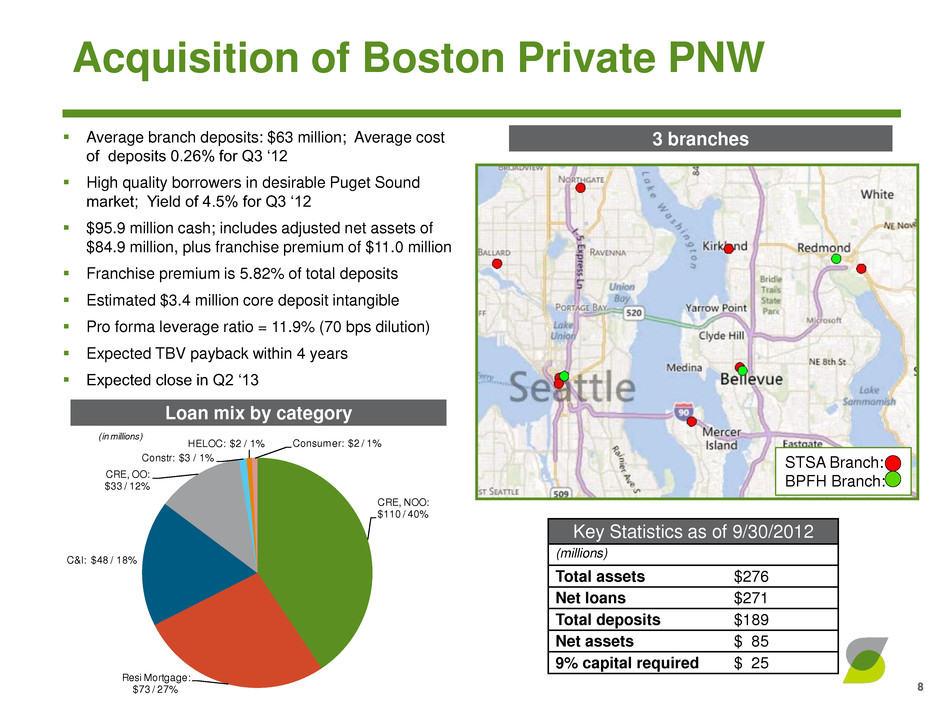
Key Statistics as of 9/30/2012 (millions) Total assets $276 Net loans $271 Total deposits $189 Net assets $ 85 9% capital required $ 25 Acquisition of Boston Private PNW 8 Average branch deposits: $63 million; Average cost of deposits 0.26% for Q3 ‘12 High quality borrowers in desirable Puget Sound market; Yield of 4.5% for Q3 ‘12 $95.9 million cash; includes adjusted net assets of $84.9 million, plus franchise premium of $11.0 million Franchise premium is 5.82% of total deposits Estimated $3.4 million core deposit intangible Pro forma leverage ratio = 11.9% (70 bps dilution) Expected TBV payback within 4 years Expected close in Q2 ‘13 3 branches STSA Branch: BPFH Branch: Loan mix by category CRE, NOO: $110 / 40% Resi Mortgage: $73 / 27% C&I: $48 / 18% CRE, OO: $33 / 12% Constr: $3 / 1% HELOC: $2 / 1% Consumer: $2 / 1% (in millions)
