Attached files
Table of Contents
UNITED STATES SECURITIES AND EXCHANGE COMMISSION
Washington, D.C. 20549
FORM 10-K
(Mark One)
| x | ANNUAL REPORT PURSUANT TO SECTION 13 OR 15(d) OF THE SECURITIES EXCHANGE ACT OF 1934 |
| For the year ended DECEMBER 31, 2010 |
| OR |
| ¨ | TRANSITION REPORT PURSUANT TO SECTION 13 OR 15(d) OF THE SECURITIES EXCHANGE ACT OF 1934 |
| For the transition period from to |
COMMISSION FILE NUMBER 001-34696
STERLING FINANCIAL CORPORATION
(Exact name of registrant as specified in its charter)
| Washington | 91-1572822 | |
| (State or other jurisdiction of incorporation or organization) |
(IRS Employer Identification No.) |
111 North Wall Street, Spokane, Washington 99201
(Address of principal executive offices) (Zip code)
Registrant’s telephone number, including area code: (509) 458-3711
Securities registered pursuant to Section 12(b) of the Act:
| None | None | |
| (Title of each class) | (Name of each exchange on which registered) |
Securities registered pursuant to Section 12(g) of the Act:
(Title of class) Common Stock
Indicate by check mark if the registrant is a well-known seasoned issuer, as defined in Rule 405 of the Securities Act. Yes ¨ No x
Indicate by check mark if the registrant is not required to file reports pursuant to Section 13 or Section 15(d) of the Act. Yes ¨ No x
Indicate by check mark whether the registrant (1) has filed all reports required to be filed by Section 13 or 15(d) of the Securities Exchange Act of 1934 during the preceding 12 months (or for such shorter period that the registrant was required to file such reports), and (2) has been subject to such filing requirements for the past 90 days. Yes x No ¨
Indicate by check mark whether the registrant has submitted electronically and posted on its corporate web site, if any, every Interactive Data File required to be submitted and posted pursuant to Rule 405 of Regulation S-T (section 232.405 of this chapter) during the preceding 12 months (or for such shorter period that the registrant was required to submit and post such files). Yes ¨ No ¨
Indicate by check mark if disclosure of delinquent filers pursuant to Item 405 of Regulation S-K is not contained herein, and will not be contained, to the best of registrant’s knowledge, in definitive proxy or information statements incorporated by reference in Part III of this Form 10-K or any amendment to this Form 10-K. ¨
Indicate by check mark whether the registrant is a large accelerated filer, an accelerated filer, a non-accelerated filer, or a smaller reporting company. See definitions of “large accelerated filer,” “accelerated filer” and “smaller reporting company” in Rule 12b-2 of the Exchange Act. (Check one):
Large accelerated filer ¨ Accelerated filer ¨ Non-accelerated filer x Smaller Reporting Company ¨
Indicate by check mark whether the registrant is a shell company (as defined in Rule 12b-2 of the Exchange Act). Yes ¨ No x
As of June 30, 2010, the aggregate market value of the common equity held by non-affiliates of the registrant, computed by reference to the average of the bid and asked prices on such date as reported by the NASDAQ Capital Market, was $28 million.
The number of shares outstanding of the registrant’s common stock as of January 31, 2011 was 61,929,501.
DOCUMENTS INCORPORATED BY REFERENCE
Specific portions of the registrant’s Proxy Statement for its 2011 annual meeting of shareholders are incorporated by reference into Part III hereof.
Table of Contents
STERLING FINANCIAL CORPORATION
DECEMBER 31, 2010 ANNUAL REPORT ON FORM 10-K
| Page | ||||
| 1 | ||||
| Item 1. |
1 | |||
| 1 | ||||
| 1 | ||||
| 3 | ||||
| 4 | ||||
| 4 | ||||
| 5 | ||||
| 9 | ||||
| 9 | ||||
| 11 | ||||
| 11 | ||||
| 11 | ||||
| 11 | ||||
| 23 | ||||
| 24 | ||||
| Item 1A. |
25 | |||
| Item 1B. |
39 | |||
| Item 2. |
39 | |||
| Item 3. |
40 | |||
| Item 4. |
41 | |||
| 42 | ||||
| Item 5. |
42 | |||
| 42 | ||||
| Item 6. |
44 | |||
| Item 7. |
Management’s Discussion and Analysis of Financial Condition and Results of Operations |
46 | ||
| 46 | ||||
| 46 | ||||
| 49 | ||||
Table of Contents
| Page | ||||
| 55 | ||||
| 67 | ||||
| 68 | ||||
| Off-Balance Sheet Arrangements and Aggregate Contractual Obligations |
69 | |||
| 69 | ||||
| 70 | ||||
| 70 | ||||
| 71 | ||||
| Item 7A. |
71 | |||
| Item 8. |
71 | |||
| Item 9. |
Changes in and Disagreements with Accountants on Accounting and Financial Disclosure |
71 | ||
| Item 9A. |
71 | |||
| Management’s Report on Internal Control Over Financial Reporting |
71 | |||
| 72 | ||||
| Item 9B. |
73 | |||
| 73 | ||||
| Item 10. |
73 | |||
| Item 11. |
73 | |||
| Item 12. |
Security Ownership of Certain Beneficial Owners and Management and Related Stockholder Matters |
73 | ||
| Item 13. |
Certain Relationships and Related Transactions, and Director Independence |
73 | ||
| Item 14. |
73 | |||
| 74 | ||||
| Item 15. |
74 | |||
| 75 | ||||
Table of Contents
| PART I |
This report contains forward-looking statements within the meaning of the Private Securities Litigation Reform Act of 1995. For a discussion of the risks and uncertainties inherent in such statements, see “Business—Forward-Looking Statements” and “Risk Factors.”
Sterling Financial Corporation is a bank holding company, organized under the laws of Washington State in 1992, the principal operating subsidiary of which is Sterling Savings Bank. References to “Sterling,” “the Company,” “we,” “our,” or “us” in this report refer to Sterling Financial Corporation, a Washington corporation, and its consolidated subsidiaries on a combined basis, unless otherwise specified or the context otherwise requires. References to “Sterling Savings Bank” refer to our subsidiary Sterling Savings Bank, a Washington state-chartered commercial bank. References to “our subsidiary bank” or “our banking subsidiary” refer to Sterling Savings Bank. Sterling Savings Bank, headquartered in Spokane, Washington, commenced operations in 1983 as a Washington State-chartered, federally insured, stock savings and loan association, and in 2005 converted to a commercial bank. Sterling Savings Bank offers commercial banking products and services, mortgage lending, construction financing and investment products to individuals, small business, commercial organizations and corporations.
Sterling’s dedication to personalized service and relationship banking has enabled it to attract both retail deposits and lending relationships in the western United States. With $9.49 billion in total assets as of December 31, 2010, Sterling originates loans and attracts Federal Deposit Insurance Corporation (“FDIC”) insured and uninsured deposits from the general public throughout its footprint through Sterling Savings Bank. On August 2, 2010, Golf Savings Bank, which was a wholly owned subsidiary of Sterling, was merged into Sterling Savings Bank, with the residential units of both banks combined within the home loan division (“Home Loan Division”) of Sterling Savings Bank. The Home Loan Division originates residential loans, both for sale into the secondary market and for the loan portfolio. Sterling also markets fixed income and equity products, mutual funds, annuities and other financial products through wealth management representatives located across Sterling’s network of financial service centers.
Sterling recorded a net loss of $224.3 million for the year ended December 31, 2010 compared with a net loss of $838.1 million for the year ended December 31, 2009. The results for 2010 included a provision for credit losses of $250.2 million. In addition, Sterling recorded a $90.0 million increase in the allowance against the deferred tax asset, which resulted in Sterling not recognizing an income tax benefit during 2010. By comparison, 2009 results included a provision for credit losses of $681.4 million and an initial allowance against the deferred tax asset of $269.0 million. The 2009 results also included a non-cash goodwill impairment charge of $227.6 million. Earnings per common share for 2010 included two separate non-cash items related to the Recapitalization Transactions, as defined below.
On August 26, 2010, Sterling completed several transactions as part of its recapitalization and recovery plan, receiving $730.0 million in aggregate proceeds (collectively, the “Recapitalization Transactions” or the “Recapitalization”). The Recapitalization consisted of three principal transactions.
| Ÿ | an investment of approximately $170.9 million by each of (a) Thomas H. Lee Equity Fund VI, L.P., Thomas H. Lee Parallel Fund VI, L.P., Thomas H. Lee Parallel (DT) Fund VI, L.P. and THL Sterling Equity Investors, L.P. (collectively, “THL” or an “Anchor Investor”) and (b) Warburg Pincus Private Equity X, L.P. (“Warburg Pincus” or an “Anchor Investor”), pursuant to which each received 1,035,848 shares of common stock, 1,709,150 shares of Series B preferred stock, and a seven-year warrant to purchase 1,312,500 shares of common stock at an exercise price of $14.52 per share (the “Anchor Investments”); |
| TX1 |
Table of Contents
| Ÿ | the exchange of 303,000 shares of preferred stock held by the U.S. Department of the Treasury (“Treasury”) at a discounted exchange value into 5,738,636 shares of common stock at a conversion price of $13.20 per share, and amendment of the terms of the warrant held by Treasury (the “Treasury Warrant”) to provide for a revised exercise price of $13.20 per share for a ten-year term for 97,540.56 shares of Sterling common stock (the “Treasury Exchange”), effected pursuant to an exchange agreement between Sterling and Treasury (the “Exchange Agreement”); and |
| Ÿ | investments by accredited investors (the “Private Placement Investors”) of an aggregate of $388.2 million in exchange for an aggregate of 2,352,545 shares of common stock and 3,881,700 shares of Series D preferred stock. |
The Treasury Exchange resulted in a gain of $84.3 million because the book value of the preferred stock plus accrued dividends was greater than the $230.9 million fair value of the common stock issued to Treasury and the fair value of the new warrant. This is accounted for as a non-cash increase in income available to common shareholders, but had no effect on Sterling’s overall equity or its regulatory capital position.
The issuance price of $13.20 per share for the Series B and D preferred stock on an as-converted basis represented a $26.40 per share discount from the common stock’s market price of $39.60 per share. For accounting purposes, this discount is considered a beneficial conversion feature. Accordingly, Sterling recorded this discount, valued at $604.6 million in aggregate, as a reduction to preferred stock and as an increase to common stock.
On September 27, 2010, Sterling announced that its banking regulators had terminated the cease and desist order put in place in October 2009 with Sterling Savings Bank, reflecting a strengthened balance sheet and capital position. Since termination of the cease and desist order, Sterling Savings Bank has been deemed well-capitalized by its regulators. Although the cease and desist order is no longer applicable, Sterling Savings Bank will continue to be subject to enhanced supervisory review by the FDIC and the Washington Department of Financial Institutions (“WDFI”) under a memorandum of understanding (the “SSB MOU”), pursuant to which Sterling Savings Bank must maintain Tier 1 capital in an amount that ensures that its leverage ratio is at least 8 percent. Sterling Savings Bank will also be required to meet certain asset quality targets and comply with other requirements. As of the date of this filing, Sterling continues to be subject to a regulatory agreement (the “Reserve Bank Agreement”) with the Federal Reserve Bank of San Francisco (the “Reserve Bank”). The Reserve Bank Agreement is intended to enhance Sterling’s ability to act as a source of strength to Sterling Savings Bank. See “Management’s Discussion and Analysis (“MD&A”)—Regulatory Agreements.”
On October 21, 2010, Sterling held a Special Meeting at which shareholders approved: (1) the increase in the authorized number of shares of common stock from 11,363,636 to 151,515,151; (2) the conversion of outstanding Series B and D preferred stock into, and the exercisability of the warrants issued to THL and Warburg Pincus for shares of common stock; and (3) an amendment to Sterling’s Restated Articles of Incorporation to authorize a reverse stock split, which occurred on November 19, 2010, at a rate, as determined by the board of directors, of 1-for-66. All per share amounts that are presented in this Form 10-K have been restated to reflect this reverse split.
On October 22, 2010 the series B and D preferred stock were converted into 50,878,788 shares of common stock. Upon conversion the $604.6 million discount was amortized and recognized as a non-cash dividend paid to the preferred shareholders, and had no effect on Sterling’s overall equity or its regulatory capital position.
Recent additions to Sterling’s board of directors and executive management team bring a broad level of financial services and corporate executive management experience, as well as regulatory expertise. Leslie S. Biller, the former vice chairman and chief operating officer of Wells Fargo & Company, now serves as non-executive chairman of Sterling’s board. Additional board appointments include David A. Coulter, managing director of Warburg Pincus and former chairman and chief executive officer of BankAmerica Corp.; Scott L. Jaeckel, managing director of THL and director for several public and private companies; Howard P. Behar, past president, North America, of Starbucks
| TX2 |
Table of Contents
Coffee Company; Robert C. Donegan, president of Seattle based Ivar’s Inc.; C. Webb Edwards, formerly president of Wells Fargo Services Company, the technology, call center and operations subsidiary of Wells Fargo & Company; and Robert H. Hartheimer, a former FDIC division director, investment banker and regulatory consultant. As of the date of this report, the appointments of Mr. Behar and Mr. Edwards remain subject to regulatory approval. Recent management additions include two industry veterans: David S. DePillo, who joined as chief credit officer during 2010; and subsequent to year end, Patrick J. Rusnak, who joined as chief financial officer.
Sterling’s goal is to be one of the leading regional community banks in the nation by offering customers a range of highly personalized financial products and services consistent with our “Hometown Helpful”® philosophy. This strategy centers on bringing the full product suite of a large regional institution to consumer and commercial customers with the personalized service of a local community bank. The four tenets of this philosophy are:
| Ÿ | Knowledgeable bankers—Employee development, training and compensation initiatives designed to enable our talented team of bankers to capably serve our customers across our footprint. |
| Ÿ | Fair pricing—Offer a meaningful value proposition for our customers, while providing competitive funding and returns. |
| Ÿ | Convenience and ease of use—We operate 178 retail banking locations and 33 mortgage loan origination offices; we provide customer-oriented hours, full-service net banking and on-line bill pay. Our goal is to meet our customers where they want to be met. |
| Ÿ | Competitive products and services—We offer a full range of consumer, small business, commercial, corporate, wealth management and mortgage banking products and services across our five-state footprint. Our treasury management products include an advanced and easy to use Remote Deposit Capture system that rivals those of the largest banks operating in our area. |
Our “back to basics” banking model is built around the development of core customer relationships. Our main focus during 2010 continued to be on credit management, operating efficiency and the repositioning of our balance sheet. We realigned our organization by adding experienced and talented individuals to our operations and by incorporating the following strategies:
| Ÿ | Strengthening Asset Quality Oversight and Resolution. Sterling’s credit administration group focuses on identifying and resolving classified assets that are currently or expected to become problem assets, including construction and commercial real estate related assets. Sterling continues to execute its strategic goal of achieving targeted levels of loan portfolio diversification while addressing issues related to problem assets. In addition, Sterling’s asset recovery team proactively markets other real estate owned (“OREO”). Classified assets declined 32% during 2010. |
| Ÿ | Emphasizing Growth in Multifamily, Commercial Business and Consumer Lending While Reducing Exposure to Construction and Commercial Real Estate Loans. Sterling’s 65% reduction in the |
| concentration of construction loan balances during 2010 influenced the quarterly reductions in the provision for loan losses. Building core business and consumer banking relationships within the commercial, consumer and multifamily banking teams will further rebalance the loan portfolio, improving the overall mix of earning assets, reducing credit risks and helping Sterling achieve increased risk adjusted returns. |
| Ÿ | Originating Lower-Cost Core Deposits with Relationship Banking Initiatives. Sterling has implemented a number of relationship-focused deposit initiatives to grow core deposits, while improving the overall mix of deposits. The change in deposit mix and market conditions have contributed to Sterling’s cost of funds decreasing from 2.28% for 2009 to 1.69% for 2010. |
| Ÿ | Expanding and Diversifying Fee Income. Sterling continues to develop and enhance its offering of financial products and services to grow fee and service charge income. Our emphasis on responsiveness, simplicity and customer support continues to positively influence residential loan originations, while an experienced secondary marketing team secures profitable fee income |
| TX3 |
Table of Contents
| from mortgage banking operations. Bringing together full relationship banking, cash management products and services, and fair pricing with Sterling’s Hometown Helpful value proposition provides growth opportunities for transaction, service and account fees. Over the long-run, delivering consistent customer value and satisfaction provides the firm foundation to grow fee income. |
| Ÿ | Improving Operating Efficiency Through Improved Expense Management. In an effort to maximize core earnings and offset credit-related expenses, Sterling has implemented several initiatives to improve efficiency, including the August 2010 merger of Golf Savings Bank into Sterling Savings Bank. |
| Ÿ | Maintaining Well-Capitalized Levels. Following the Recapitalization Transactions, Sterling and Sterling Savings Bank exceed the requirements to be deemed well-capitalized and also exceed the levels required by the SSB MOU. Sterling has developed strategies to maintain its capital at appropriate levels to meet regulatory requirements. Sterling’s tier 1 leverage ratio was 10.1% at December 31, 2010, compared to 3.5% at December 31, 2009. |
“Back to basics” banking is a focus on the customer; it reflects a Sterling belief that every customer deserves a banking relationship built on trust and a superior experience with every interaction. We lowered our balance sheet risk profile by reducing concentrations of construction loans and wholesale borrowings, and strengthened capital levels through the Recapitalization Transactions. Sterling’s improvements in core funding and reductions in the cost of such funding show ongoing progress in growing core business and consumer customer relationships.
Achieving profitability depends upon executing the following strategies:
| Ÿ | Growing core deposits, particularly commercial, consumer and public sector transaction deposits; |
| Ÿ | Expanding full relationship banking products and services for commercial and public sector customers, including depository and treasury management services such as lockbox, online banking, merchant services, analyzed and sweep accounts, remote deposit capture and international services; |
| Ÿ | Improving asset quality through robust underwriting and credit approval functions, and the reduction of non-performing assets; |
| Ÿ | Diversifying and growing noninterest income through existing and new sources, including deposit fees, transaction fees, mortgage banking revenues and other initiatives; |
| Ÿ | Growing and changing the mix of the loan portfolio to increase the volume of higher-yielding products, such as commercial banking, multifamily, and consumer loans, that are prudently underwritten; |
| Ÿ | Managing interest rate risk to protect net interest margin in a changing interest rate environment; and |
| Ÿ | Controlling expenses and increasing operating efficiency. |
Sterling believes these strategies, combined with our initiatives to manage risk, will contribute to high quality, consistent earnings, and build shareholder value. The effect of these strategies on Sterling’s financial results is discussed further in the MD&A.
For purposes of measuring and reporting financial results during 2010, 2009 and 2008, Sterling was divided into five business segments:
| Ÿ | The Community Banking segment provides traditional banking and wealth management services through the retail, private and commercial banking groups of Sterling Savings Bank. |
| Ÿ | The Residential Construction Lending segment has historically originated and serviced loans through the real estate division of Sterling Savings Bank. Origination activity in this segment has been substantially curtailed, and realigned with an emphasis on credit resolution. |
| Ÿ | The Residential Mortgage Banking segment originates and sells residential loans on a servicing-retained and servicing-released basis |
| TX4 |
Table of Contents
| through loan production offices of the Home Loan Division. The Home Loan Division’s operations were previously performed primarily by Sterling’s subsidiary Golf Savings Bank, which on August 2, 2010 was merged into Sterling Savings Bank. |
| Ÿ | The Commercial Mortgage Banking segment originates, sells and services commercial real estate loans and participation interests in commercial real estate loans through offices in the western region of the United States. |
| Ÿ | The Other and Eliminations segment represents the parent company expenses and intercompany eliminations of revenue and expenses. |
The results of operations are reported by segment in the accompanying notes to the consolidated financial statements.
Descriptions of Sterling’s relationship focused lending products are as follows:
Commercial Lending. Sterling’s Commercial Banking Group provides a full range of credit and financial services products to small- and medium-sized businesses. Credit products include lines of credit, receivable and inventory financing, equipment loans, and term real estate financing for owner-occupied properties. Loans may be fully secured, partially secured or unsecured, based on certain credit criteria. The product line for businesses includes standardized products as well as customized solutions, including cash flow and treasury management services.
Within Sterling’s Commercial Banking Group, Sterling’s Small Business Administration (“SBA”) team consists of specially trained and experienced business development officers strategically located in Sterling’s key business markets of Seattle, WA, Portland, OR, Spokane, WA and Santa Rosa, CA. Sterling’s business development officers assist small businesses with their financing, cash management and general business planning needs, primarily by helping them access the Small Business Administration’s guaranteed 7(a) and 504 lending programs. These lending programs provide small businesses with critical and flexible funding for establishing a new business, or for the operation, acquisition or expansion of an existing business. From their four primary locations, Sterling’s business development officers work side-by-side with Sterling’s commercial bankers to support small businesses’ banking requirements throughout Sterling’s service area.
Sterling has established underwriting standards to review new and renewing commercial loans. These criteria include analysis of sources of repayment, financial strength and other credit enhancements such as guarantees. Typically, the primary source of repayment is recurring cash flow of the borrower or cash flow from the business or project being financed. Depending on the type of loan, underwriting standards include minimum financial requirements, maximum loan-to-collateral value ratios, minimum cash flow coverage of debt service, debt-to-income ratios, and minimum liquidity requirements. Exceptions to the minimum underwriting standards may be made depending upon the type of loan and financial strength of the borrower. Exceptions are reported to the appropriate level of authority up to and including the board of directors. Common forms of collateral pledged to secure commercial banking loans include real estate, accounts receivable, inventory, equipment, agricultural crops or livestock and marketable securities. Most loans have maximum terms of one to ten years and loan-to-value ratios in the range of 50% to 80%, based on an analysis of the collateral pledged.
Commercial banking loans generally are backed by collateral that may be difficult to obtain or to liquidate following a default. However, these loans typically offer higher yields than residential loans and include variable interest rates. Establishing full-service deposit and cash management banking relationships with Sterling provides business customers with more ready access to lending facilities and generally improves the overall creditworthiness and profitability of the total relationship.
Multifamily Residential and Commercial Real Estate Lending. Sterling offers multifamily residential and commercial real estate loans as both construction and permanent loans collateralized by real property. Construction loans on such properties typically have terms of 12 to 24 months and have
| TX5 |
Table of Contents
variable interest rates. Permanent fixed- and adjustable-rate loans on existing properties typically have maturities of three to ten years. Multifamily residential and commercial real estate loans generally involve a higher degree of risk than one- to four-family residential real estate loans, because they typically involve large loan balances to single borrowers or groups of related borrowers. The payment experience on such loans typically depends on successfully operating the real estate project and is subject to certain risks not present in one- to four-family residential mortgage lending. These risks include excessive vacancy rates or inadequate operating cash flows. Construction lending is subject to risks such as construction delays, cost overruns, insufficient values and an inability to obtain permanent financing in a timely manner.
One- to Four-Family Residential Lending. Sterling originates residential mortgages underwritten to correspond to agency and investor guidelines. Loans are originated through Sterling’s network of retail mortgage offices and consumer direct lending channels. Products include: a) fixed-rate residential mortgages; b) adjustable-rate residential mortgages (“ARMs”), which have interest rates that adjust annually with a fixed period of three, five or seven years and are indexed to a variety of market indices; c) and interest only residential mortgages underwritten to amortizing payment standards. Sterling focuses its residential lending efforts on originating traditional amortizing loans for owner occupied homes, second homes and investment properties.
Residential loans Sterling originates that meet agency guidelines are primarily sold into the secondary mortgage market. Within the secondary mortgage market, Sterling sells its conventional residential loans on a servicing-retained basis to the Federal Home Loan Mortgage Corporation (“Freddie Mac”) and to the Federal National Mortgage Association (“Fannie Mae”). Loans sold on a servicing-released basis to investors include government guaranteed loans, program specific conventional loans, and fixed rate jumbo loans. Sterling retains a portion of conventional ARMs and jumbo ARMs as held for investment loans. Loans sold into the secondary market are sold with limited recourse to Sterling, meaning that Sterling may be obligated to repurchase any loans that are not underwritten in accordance with agency guidelines or loans with identified post-closing borrower misrepresentations. Sterling maintains a credit loss reserve to cover the costs associated with these potential repurchases. See Note 17 of “Notes to Consolidated Financial Statements.”
Generally, conventional and government guaranteed residential mortgage loans are originated for up to 80% of the appraised value or selling price of the mortgaged property, whichever is less. Borrowers must purchase mortgage insurance from approved third parties so that Sterling’s risk is limited to approximately 80% of the appraised value on most loans with loan-to-value ratios in excess of 80%. Sterling’s residential lending programs are designed to comply with all applicable regulatory requirements. For a discussion of Sterling’s management of interest rate risk (“IRR”) on residential loans, see “- Secondary Market Activities.”
Residential Construction Lending. Sterling originates residential construction loans, but the number of new, viable, residential construction projects that meet Sterling’s underwriting standards has been limited during the current economic cycle. Construction financing is generally considered to involve a higher degree of risk than long-term financing on improved, occupied real estate. Sterling’s risk of loss on construction loans depends largely upon the value of the underlying property, and the estimated cost (including interest) of the project. If the estimate of construction costs proves to be inaccurate, Sterling might have to advance funds beyond the amount originally committed to permit completion of the development and to protect its security position. Sterling’s underwriting, monitoring and disbursement practices with respect to construction financing are intended to ensure that sufficient funds are available to complete construction projects. Sterling endeavors to limit its risk through its underwriting procedures by using only approved, qualified appraisers and by dealing only with qualified builders/borrowers.
Consumer Lending. Consumer loans and lines of credit are originated directly through Sterling’s retail branches and Private Banking teams, and indirectly through Sterling’s Dealer Banking Department. Sterling finances purchases of consumer goods including automobiles, boats and recreational vehicles, and lines of credit for personal
| TX6 |
Table of Contents
use. Generally, consumer loans are originated for terms ranging from six months to ten years. Interest rates may be either fixed or adjustable based on a contractual formula tied to established external indices. Sterling also makes loans secured by borrowers’ savings accounts and equity loans collateralized by residential real estate. Equity loans may have maturities of up to 20 years.
Sterling’s Private Banking teams provide a full line of financial and credit services to higher-net-worth and higher-income borrowers, including personalized services for a wide variety of consumer loans. The Private Banking teams also serve the needs of the owners and key employees of the Commercial Banking customers.
Secondary Market Activities. Sterling has developed correspondent relationships with a number of mortgage companies and financial institutions to facilitate the sale of mortgage loans on a servicing-retained or released basis. Sterling generally receives a fee of approximately 100 to 200 basis points of the principal balance of mortgage loans for releasing the servicing. For sales of loans on a servicing-retained basis, Sterling records a servicing asset of approximately 100 to 150 basis points of the principal balance. At December 31, 2010 and 2009, Sterling had recorded $20.6 million and $12.1 million in servicing rights, respectively.
Sterling purchases mortgage loans in the secondary market. Agents who present loans to Sterling for purchase are required to provide a processed loan package prior to commitment. Sterling then underwrites the loan in accordance with its established lending standards. During 2010, Sterling purchased $82.7 million of multifamily loans in the secondary market, while in 2009, no loan purchases were transacted.
During the years ended December 31, 2009 and 2008, Sterling sold $20.9 million and $15.8 million, respectively, in loans under participation agreements, resulting in net gains of $1.6 million and $24,000, respectively. During 2010, Sterling did not enter into any of these transactions.
Derivatives and Hedging. As part of its mortgage banking activities, commitments to prospective borrowers on residential mortgage loan applications may have the interest rates fixed for a period of 10 to 60 days (interest rate lock commitments). To offset the exposure to interest rate risk, the pricing for the sale of these loans is fixed with various qualified investors under both non-binding (“best-efforts”) and binding (“mandatory”) delivery programs. For mandatory delivery programs, Sterling hedges interest rate risk by entering into offsetting forward sale agreements on mortgage-backed securities (“MBS”) with third parties. Risks inherent in mandatory delivery programs include the risk that if Sterling does not close the loans subject to interest rate lock commitments, it is nevertheless obligated to deliver MBS to the counterparty under the forward sale agreement. Sterling could incur significant costs in acquiring replacement loans or MBS and such costs could have a material adverse effect on mortgage banking operations in future periods.
Interest rate lock commitments and loan delivery commitments are off balance sheet commitments that are considered to be derivatives. As of December 31, 2010, Sterling had $118.6 million of interest rate lock commitments, $207.0 million of residential mortgage loans held for sale that were not committed to investors and offsetting forward sale agreements on MBS valued at $285.3 million. In addition, Sterling had mandatory delivery commitments to sell mortgage loans to investors valued at $800,000 as of December 31, 2010. As of December 31, 2009, Sterling had $110.0 million of interest rate lock commitments, $119.7 million of residential mortgage loans held for sale that were not committed to investors and offsetting forward sale agreements on MBS valued at $234.0 million. In addition, Sterling had mandatory delivery commitments to sell mortgage loans to investors valued at $29.5 million as of December 31, 2009. As of December 31, 2010 and 2009, Sterling had entered into best efforts forward commitments to sell $18.5 million and $51.6 million of mortgage loans, respectively.
From time to time, Sterling may enter into interest rate swap transactions with loan customers. The interest rate risk on these swap transactions is managed by entering into offsetting interest rate swap agreements with various counterparties (“broker-dealers” or “dealers”). The counterparty swap agreements include certain representations, warranties and covenants, which include terms that
| TX7 |
Table of Contents
allow for an early termination in the event of default. Failure to maintain a well-capitalized position is one event that may be considered a default, and counterparties to the swap agreements could require an early termination settlement or an increase in the collateral to secure derivative instruments that are in net liability positions to Sterling. During 2010, no counterparties declared an early termination event. As a result of the Recapitalization Transactions, management believes that Sterling is not likely to experience an early termination event in connection with its capital levels. Both customer and dealer related interest rate derivatives are carried at fair value by Sterling.
Loan Servicing. Sterling services its own loans, as well as loans owned by others. Loan servicing includes collecting and remitting loan payments, accounting for principal and interest, holding escrow funds for the payment of real estate taxes and insurance premiums, contacting delinquent borrowers and supervising foreclosures in the event of unremedied defaults. For loans serviced for others, Sterling generally receives a fee based on the unpaid principal balance of each loan to compensate for the costs of performing the servicing function.
For residential mortgage loans serviced for other investors, Sterling receives a fee, generally ranging from 5 to 25 basis points of the unpaid principal balance. At December 31, 2010 and 2009, Sterling serviced for itself and for other investors, residential mortgage loans totaling $2.66 billion and $1.88 billion, respectively. Of such mortgage loans, $1.94 billion in 2010 and $1.09 billion in 2009 were primarily serviced for Freddie Mac and Fannie Mae.
Sterling receives a fee for servicing commercial and multifamily real estate loans for other investors. This fee generally ranges from 5 to 25 basis points of the unpaid principal balance. At December 31, 2010 and 2009, Sterling serviced for itself and other investors, commercial and multifamily real estate loans totaling $3.28 billion and $3.45 billion, respectively.
Classified and Nonperforming Assets. To measure the quality of loans and OREO, Sterling has established guidelines for classifying and determining provisions for anticipated losses. Sterling’s system employs the risk rating categories of “substandard,” “doubtful” and “loss” for its classified assets. Substandard assets have deficiencies, which give rise to the distinct possibility that Sterling will sustain some loss if the deficiencies are not corrected. Doubtful assets have the same weaknesses as substandard assets, and on the basis of currently existing facts, are also deemed to have a high probability of loss. An asset classified as loss is considered uncollectible and of such little value that it should not be included as an asset of Sterling. Total classified assets were $1.12 billion at December 31, 2010, down from $1.65 billion at December 31, 2009. As a percentage of total assets, classified assets were 11.8% and 15.2% as of December 31, 2010 and 2009, respectively. See “MD&A—Financial Position—Loans Receivable.”
One of the roles of the credit administration group is to focus on identifying and resolving potential problem credits before they become classified. When an asset becomes classified, management of the relationship is assumed by Sterling’s special assets department. Sterling actively engages the borrower and guarantor to remedy the situation by requesting updated financial information from the borrower(s) and guarantor(s) to determine a course of action. In addition, updated collateral values are obtained in order for Sterling’s management to perform evaluations for regulatory and decision making purposes and updated title information is obtained to determine the status of encumbrances on the collateral. When possible, Sterling will require the borrower to provide additional collateral or capital. In conjunction with the receipt of additional collateral, Sterling will sometimes modify the terms of the loan. Often the new modified terms of the loan are consistent with terms that Sterling would offer a new borrower. If the modification of terms is considered concessionary, Sterling classifies the loan as a Troubled Debt Restructure and reports it as a nonperforming loan.
Sterling also may consider allowing a borrower to sell the underlying collateral for less than the outstanding balance on the loan if the current collateral evaluation supports the offer price. These transactions are known as “short sales.” In such situations, Sterling typically requires the borrower to sign a new note for the resulting deficiency or bring cash to closing.
| TX8 |
Table of Contents
If Sterling and a borrower are unable to achieve an acceptable resolution, Sterling may take a deed in lieu of foreclosure or initiate foreclosure on the underlying collateral. Under such circumstances, Sterling also simultaneously evaluates legal action for recovery against the borrowers and guarantors. After obtaining the collateral, Sterling actively works to sell the collateral.
Allowance for Credit Losses. Sterling regularly reviews its classified assets for impairment. If a loan is determined to be impaired, Sterling performs a valuation analysis on the loan. Valuation analysis compares the estimated fair value (market value less selling costs, foreclosure costs and projected holding costs), and the book balance (loan principal and accrued interest or carrying value of OREO). For loans that are considered collateral dependent, the difference between the fair value and the book value is charged off as a confirmed loss. Sterling may record a specific reserve on collateral dependent impaired loans to recognize market declines since the last appraisal. For certain non-collateral dependent loans, Sterling establishes a specific reserve for the difference between fair value and book value of these loans, as the loss is not defined as a confirmed loss because it is not based solely on collateral values. Allowances are established and periodically adjusted, if necessary, based on the review of information obtained through on-site inspections, market analysis, appraisals and purchase offers.
Sterling maintains an allowance for credit losses at a level deemed appropriate by management to adequately provide for probable losses related to specifically identified loans and probable losses in the remaining portfolio, as well as unfunded commitments. The allowance is based upon historical loss experience, loan migration analysis, delinquency trends, portfolio size, concentrations of risk, prevailing and anticipated economic conditions, industry experience, estimated collateral values, management’s assessment of credit risk inherent in the portfolio, specific problem loans and other relevant factors. The portfolio is grouped into standard industry categories for homogeneous loans based on characteristics such as loan type, borrower and collateral. Information regarding annual and quarterly loan migration to loss is used to determine the probability of default. Loss experience from the most recent 12 months is used to estimate the amount that would be lost if a default were to occur, which is termed the loss given default. The probability of default is multiplied by the loss given default to calculate the expected losses for each loan category.
Additions to the allowance, in the form of provisions, are reflected in current operating results, while charge-offs to the allowance are made when a loss is determined to be a confirmed loss. Because the allowance for credit losses is based on estimates, ultimate losses may materially differ from the estimates. See Note 4 of “Notes to Consolidated Financial Statements.”
Investments and Mortgage-Backed Securities
At December 31, 2010 and 2009, investments and MBS classified as available for sale were $2.83 billion and $2.16 billion, respectively. The carrying value of these investments and MBS at December 31, 2010 includes net unrealized losses of $6.5 million, compared with net unrealized gains of $25.8 million as of December 31, 2009. Fluctuations in prevailing interest rates continue to cause volatility in this component of accumulated comprehensive income and may continue to do so in future periods. Investments and MBS that management has the positive intent and ability to hold to maturity are classified as held to maturity and carried at amortized cost. At December 31, 2010 and 2009, investments classified as held to maturity were $13.5 million and $17.6 million, respectively. See “MD&A—Critical Accounting Policies—Investments and MBS.”
Sterling invests primarily in MBS issued by Freddie Mac, Fannie Mae and the Government National Mortgage Association (“Ginnie Mae”), and has limited investments in other non-agency obligations. Such investments provide Sterling with a relatively liquid source of interest income and collateral, which can be used to secure borrowings.
Sterling’s primary sources of funds are: retail, public and brokered deposits; the collection of principal and interest primarily from loans, as well as from mortgage backed securities; the sale of loans into the secondary market in connection with Sterling’s mortgage banking activities; borrowings from the
| TX9 |
Table of Contents
Federal Home Loan Bank (“FHLB”) and the Federal Reserve; and borrowings from commercial banks (including reverse repurchase agreements). The availability and volume of these funds are influenced significantly by prevailing interest rates and other economic conditions, as well as regulatory statutes. Borrowings may be used on a short-term basis to compensate for reductions in other sources of funds (such as deposit inflows at less than projected levels). Borrowings may also be used on a longer-term basis to support expanded lending activities and to match repricing intervals of assets. See “—Lending Activities” and “—Investments and Mortgage-Backed Securities.”
Deposit Activities. Sterling offers a wide variety of deposit products and related services to businesses, individuals, and public sector entities throughout its primary market areas. Deposit accounts include transaction (checking) accounts, savings accounts, money market demand accounts (“MMDA”), and certificates of deposit (“CDs”). These deposit products and services are marketed by its 178 depository banking offices and each of its private and commercial banking offices. Sterling offers both interest- and noninterest bearing checking accounts, MMDA, CDs and savings accounts that earn interest at rates established by management and are based on a competitive market analysis. The method of compounding varies from simple interest credited at maturity to daily compounding, depending on the type of account.
With the exception of certain promotional CDs and variable-rate products, most CDs carry a fixed rate of interest for a defined term from the opening date of the account. Penalties are imposed if principal is withdrawn from most CDs prior to maturity.
Sterling competes with other financial institutions and financial intermediaries in attracting deposits. There is strong competition for transaction, money market and time deposit balances from commercial banks, credit unions and nonbank corporations, such as securities brokerage companies, mutual funds and other diversified companies, some of which have nationwide networks of offices. Many of Sterling’s marketing efforts have been directed toward attracting additional deposit customer relationships and balances. Sterling provides electronic banking products, including debit card, online banking, bill pay, merchant services and treasury management services, which include remote deposit capture. All of these products and services are intended to enhance customer relationships and attract and increase retail deposit balances.
Sterling has 169 automated teller machines (“ATM”). Customers also can access ATMs operated by other financial institutions. Sterling is a member of the Plus System ATM network that allows participating customers to deposit or withdraw funds from transaction accounts, MMDA and savings accounts at numerous locations in the United States and internationally.
Sterling supplements its retail deposit gathering by soliciting funds from public entities and through the acquisition of brokered deposits. Public funds are generally obtained by competitive bidding among qualifying financial institutions, and usually require Sterling to provide collateral in the form of qualifying securities for any non FDIC insured portion of the deposit. Brokered deposits were 4% and 14% of deposits at December 31, 2010 and 2009, respectively. Public funds were 12% and 11% of deposits at December 31, 2010 and 2009, respectively.
Borrowings. Although deposit accounts are Sterling’s primary source of funds, Sterling also uses other borrowings to supplement its deposit gathering efforts. These borrowings include advances from the FHLB, reverse repurchase agreements, primary credits and term auction facilities from the Federal Reserve, as well as federal funds purchased. See “MD&A—Liquidity and Capital Resources.”
The FHLB of Seattle is part of a system that consists of 12 regional Federal Home Loan Banks that provide secured credit to financial institutions. As a condition of membership in the FHLB of Seattle, Sterling Savings Bank is required to own stock of the FHLB of Seattle in an amount determined by a formula based upon the larger of its total qualifying mortgages and MBS, or total advances from the FHLB of Seattle. At December 31, 2010, Sterling Savings Bank held more than the minimum FHLB of Seattle stock ownership requirement.
Sterling also borrows funds under reverse repurchase agreements with major broker/dealers and financial entities pursuant to which it sells investments (generally, U.S. agency obligations and MBS) under
| TX10 |
Table of Contents
an agreement to buy them back at a specified price at a later date. These agreements to repurchase are deemed to be borrowings collateralized by the investments and MBS sold. Sterling uses these borrowings to supplement deposit gathering for funding the origination of loans. Sterling had $1.03 billion in reverse repurchase agreements outstanding at both December 31, 2010 and 2009. The use of reverse repurchase agreements and other secured borrowings may expose Sterling to certain risks, including the possibility that additional collateral may have to be provided if the market value of the pledged collateral declines.
Sterling’s principal operating subsidiary is Sterling Savings Bank. See exhibit 21.1 for a complete list of subsidiaries for Sterling and Sterling Savings Bank.
Sterling faces strong competition, both in attracting deposits and in originating, purchasing and selling loans, from commercial banks, savings and loan associations, mutual savings banks, credit unions and other institutions, many of which have greater resources than Sterling. Sterling also faces strong competition in marketing financial products such as annuities, mutual funds and other financial products and in pursuing acquisition opportunities. Some or all of these competitive businesses operate in Sterling’s market areas. As of June 30, 2010, Sterling Savings Bank’s deposit market share was as follows:
| State |
Branches | Rank | Market Share | |||||||||
| Washington |
72 | 7 | 3.20 | % | ||||||||
| Oregon |
67 | 7 | 3.58 | % | ||||||||
| California |
13 | 46 | 0.14 | % | ||||||||
| Idaho |
18 | 11 | 2.57 | % | ||||||||
| Montana |
8 | 14 | 1.21 | % | ||||||||
As of December 31, 2010, Sterling had 2,498 full-time equivalent employees. Employees are not represented by a collective bargaining unit. Sterling believes it has good relations with its employees.
The following is not intended to be a complete discussion but is intended to be a summary of some of the more significant provisions of laws applicable to Sterling and its subsidiaries. This regulatory framework is intended to protect depositors, federal deposit insurance funds and the banking system as a whole, and not to protect security holders. To the extent that the information describes statutory and regulatory provisions, it is qualified in its entirety by reference to those provisions. Further, such statutes, regulations and policies are continually under review by Congress and state legislatures, and federal and state regulatory agencies. A change in statutes, regulations or regulatory policies applicable to Sterling, including changes in interpretation or implementation thereof, could have a material effect on Sterling’s business.
General. As a bank holding company, Sterling is subject to regulation, examination and supervision by the Board of Governors of the Federal Reserve under the Bank Holding Company Act of 1956, as amended (the “BHCA”), and by the WDFI. Our subsidiary Sterling Savings Bank is a Washington state-chartered commercial bank, and its deposits are insured by the FDIC. It is subject to regulation, examination and supervision by the FDIC and the WDFI. Numerous federal and state laws, as well as regulations promulgated by the Federal Reserve, the FDIC and state banking regulators, govern almost all aspects of the operation of our bank subsidiary, and Sterling’s non-bank subsidiaries are also subject to regulation by applicable federal and state agencies for the states in which they conduct business.
Bank Holding Company Regulation. The BHCA limits a bank holding company’s business to owning or controlling banks and engaging in other banking-related activities. Bank holding companies must obtain the Federal Reserve’s approval before they: (1) acquire direct or indirect ownership or control of any voting shares of any bank that results in total ownership or control, directly or indirectly, of more than 5% of the voting shares of such bank; (2) merge or consolidate with another bank holding company; or (3) acquire substantially all of the assets of any additional banks. Subject to certain state laws, such as age and contingency restrictions, a bank holding company that is adequately capitalized and adequately managed may acquire the
| TX11 |
Table of Contents
assets of both in-state banks and out-of-state banks. With certain exceptions, the BHCA prohibits bank holding companies from acquiring direct or indirect ownership or control of voting shares in any company that is not a bank or a bank holding company unless the Federal Reserve determines that the activities of such company are incidental or closely related to the business of banking. If a bank holding company is well-capitalized and meets certain criteria specified by the Federal Reserve, it may engage de novo in certain permissible non-banking activities without prior Federal Reserve approval.
A number of provisions of the Dodd-Frank Wall Street Reform and Consumer Protection Act of 2010 (the “Dodd-Frank Act”), a few of which are described here, will affect the regulation and operations of bank holding companies. Pursuant to the statute, the FDIC is given back-up supervisory authority over bank holding companies engaging in conduct that poses a foreseeable and material risk to the Deposit Insurance Fund, and the Federal Reserve gains heightened authority to examine, prescribe regulations and take action with respect to all of a bank holding company’s subsidiaries. A newly created agency, the Office of Financial Research, will have authority to collect data from all financial institutions for the purpose of studying threats to U.S. financial stability. Bank holding companies with $10 billion or more in assets will also be required to conduct and publish the results of annual stress tests. See “Risk Factors—Recent changes have created regulatory uncertainty.”
Holding companies of banks chartered under Washington law are subject to applicable provisions of Washington’s banking laws and to the examination, supervision and enforcement powers of the WDFI. Among other powers, the WDFI has the authority to issue and enforce cease and desist orders on such holding companies and to bring actions to remove their directors, officers and employees.
Change in Control. Subject to certain exceptions, the BHCA and the Change in Bank Control Act, together with regulations promulgated thereunder, require Federal Reserve approval prior to any person or company acquiring “control” of a bank or bank holding company. Control is conclusively presumed to exist if an individual or company acquires 25% or more of any class of voting securities. Control is rebuttably presumed to exist if a person acquires 10% or more, but less than 25%, of any class of an institution’s voting securities and either that institution has registered securities under Section 12 of the Exchange Act or no other person owns a greater percentage of that class of voting securities immediately after the transaction. In certain cases, a company may also be presumed to have control under the Bank Holding Company Act if it acquires 5% or more of any class of voting securities.
On September 22, 2008, the Federal Reserve issued a policy statement on minority equity investments in banks and bank holding companies that permits investors—without triggering the various regulatory requirements associated with control—to (1) acquire up to 33% of the total equity of a target bank or bank holding company, subject to certain conditions including (but not limited to) the condition that the investing firm does not acquire 15% or more of any class of voting securities, and (2) designate at least one director to serve on the board of directors.
Pursuant to the Dodd-Frank Act, a bank holding company may acquire control of an out-of-state bank only if the bank holding company is well-capitalized and well-managed, and interstate merger transactions are prohibited unless the resulting bank would be well-capitalized and well-managed following the transaction.
Washington state law requires that the WDFI be given notice at least 30 days in advance of any proposed change of control of a Washington state-chartered bank. Washington law defines “control” of an entity to mean directly or indirectly, alone or in concert with others, to own, control or hold the power to vote 25% or more of the outstanding stock or voting power of the entity.
Capital Requirements. The Federal Reserve has adopted guidelines pursuant to which it assesses the adequacy of capital in examining and supervising a bank holding company such as Sterling, and in analyzing applications to it under the Bank Holding Company Act. The FDIC has adopted similar guidelines to assess the adequacy of capital in state-chartered non-member banks such as Sterling Savings Bank. These guidelines include quantitative
| TX12 |
Table of Contents
measures that assign risk weightings to assets and off-balance sheet items and that define and set minimum regulatory capital requirements. The definitions of capital and the tests for measuring the adequacy of capital required by the Federal Reserve for bank holding companies and by the FDIC for state-chartered non-member banks are similar, but not identical.
In general, all bank holding companies are required to maintain Tier 1 Capital of at least 4% of risk-weighted assets and off-balance sheet items, Total Capital (the sum of Tier 1 Capital and Tier 2 Capital) of at least 8% of risk-weighted assets and off-balance sheet items, and Tier 1 Capital of at least 3% of adjusted quarterly average assets. Pursuant to the terms of the SSB MOU, Sterling Savings Bank is required to maintain a Tier 1 Capital level of at least 8%.
Under FDIC regulations, all insured depository institutions are assigned to one of the following capital categories:
| Ÿ | Well-Capitalized—A well-capitalized insured depository institution: (1) has a total risk-based capital ratio of 10% or greater, (2) has a Tier 1 risk-based capital ratio of 6% or greater, (3) having a leverage capital ratio of 5% or greater, and (4) is not subject to any order or written directive to meet and maintain a specific capital level for any capital measure. |
| Ÿ | Adequately Capitalized—An adequately capitalized insured depository institution: (1) has a total risk-based capital ratio of 8% or greater, (2) has a Tier 1 risk-based capital ratio of 4% or greater, and (3) has a leverage capital ratio of 4% or greater or a leverage capital ratio of 3% or greater if the institution is rated composite 1 under the CAMELS (Capital, Assets, Management, Earnings, Liquidity and Sensitivity to market risk) rating system. |
| Ÿ | Undercapitalized—An undercapitalized insured depository institution: (1) has a total risk-based capital ratio of less than 8%, (2) has a Tier 1 risk-based capital ratio of less than 4%, or (3) has a leverage capital ratio of less than 4%, or if the institution is rated a composite 1 under the CAMELS rating system, a leverage capital ratio of less than 3%. |
| Ÿ | Significantly Undercapitalized—A significantly undercapitalized insured depository institution: (1) has a total risk-based capital ratio of less than 6%, (2) has a Tier 1 risk-based capital ratio of less than 3%, or (3) a leverage capital ratio of less than 3%. |
| Ÿ | Critically Undercapitalized—A critically undercapitalized institution: has a ratio of tangible equity to total assets that is equal to or less than 2%. |
The regulations permit the appropriate federal banking regulator to downgrade an institution to the next lower category if the regulator determines (1) after notice and opportunity for hearing or response, that the institution is in an unsafe or unsound condition or (2) that the institution has received and not corrected a less-than-satisfactory rating for any of the categories of asset quality, management, earnings or liquidity in its most recent examination. Supervisory actions by the appropriate federal banking regulator depend upon an institution’s classification within the five categories. For the purposes of these tests, Tier 1 Capital generally consists of common equity, retained earnings and a limited amount of qualifying preferred stock, less goodwill and certain core deposit intangibles. Tier 2 Capital consists of non-qualifying preferred stock, certain types of debt and a limited amount of other items. The regulations require certain items, such as goodwill, to be deducted when calculating certain capital requirements.
In measuring the adequacy of capital, assets are generally weighted for risk at rates that range from zero percent to 100%. Certain assets, such as cash and U.S. government securities, have a zero percent risk weighting. Others, such as certain commercial and consumer loans, have a 100% risk weighting. Risk weightings are also assigned for off-balance sheet items such as loan commitments. The various items are multiplied by the appropriate risk-weighting to determine risk-adjusted assets for the capital calculations. For the leverage ratio mentioned above, assets are not risk-weighted.
On September 12, 2010, the Basel Committee announced new capital standards commonly referred to as “Basel III.” The standards would, among other things, impose more restrictive eligibility
| TX13 |
Table of Contents
requirements for Tier 1 and Tier 2 capital; increase the minimum Tier 1 common equity ratio to 4.5%, net of regulatory deductions, and introduce a capital conservation buffer of an additional 2.5% of common equity to risk-weighted assets, raising the target minimum common equity ratio to 7%; increase the minimum Tier 1 capital ratio to 8.5% inclusive of the capital conservation buffer; increase the minimum total capital ratio to 10.5% inclusive of the capital buffer; and introduce a countercyclical capital buffer of up to 2.5% of common equity or other fully loss absorbing capital for periods of excess credit growth. Basel III also introduces a non-risk adjusted Tier 1 leverage ratio of 3%, based on a measure of total exposure rather than total assets, and new liquidity standards. If adopted in the U.S., these standards could lead to significantly higher capital requirements, higher capital charges and more restrictive leverage and liquidity ratios. See “Risk Factors—We may be subject to more stringent capital requirements.”
As of December 31, 2010, as a result of the recently completed Recapitalization Transactions, Sterling and Sterling Savings Bank’s capital levels were above those currently required to be deemed “well-capitalized.” As noted, capital requirements will likely be increasing gradually over the next several years as a result of the implementation of the Dodd-Frank Act and the U.S. federal banking regulators’ implementation of the recently announced Basel III standards. If a depository institution fails to remain well-capitalized, it becomes subject to a variety of enforcement remedies that increase as the capital condition worsens. See “Prompt Corrective Action” below.
Commitments to Subsidiary Bank. Under Federal Reserve policy, as well as pursuant to the Reserve Bank Agreement, we are expected to act as a source of financial strength to our subsidiary bank and to commit resources to support our subsidiary bank in circumstances when we might not do so absent such policy. The Dodd-Frank Act requires this Federal Reserve policy to be made law. Under the BHCA, the Federal Reserve may require a bank holding company to terminate any activity or relinquish control of a nonbank subsidiary, other than a nonbank subsidiary of a bank, upon the Federal Reserve’s determination that such activity or control constitutes a serious risk to the financial soundness or stability of any depository institution subsidiary. Further, the Federal Reserve has discretion to require a bank holding company to divest itself of any bank or nonbank subsidiaries if the agency determines that any such divestiture may aid the depository institution’s financial condition. In addition, any capital loans by us to our subsidiary bank would be subordinate in right of payment to depositors and to certain other indebtedness of Sterling Savings Bank.
If Sterling were to enter bankruptcy, any commitment by it to a federal bank regulatory agency to maintain the capital of Sterling Savings Bank would generally be assumed by the bankruptcy trustee and entitled to a priority of payment. However, recent case law has held that, under certain circumstances, the assumption by the trustee and the priority of payment may be disallowed. It is not clear what impact, if any, this case law would have on our obligations.
Prompt Corrective Action. The Federal Deposit Insurance Corporation Improvement Act of 1991 (“FDICIA”) established a system of prompt corrective action to resolve the problems of undercapitalized insured depository institutions. Under this system, the federal banking regulators are required to rate insured depository institutions on the basis of five capital categories as described above under “Capital Requirements.” The federal banking regulators are also required to take mandatory supervisory actions and are authorized to take other discretionary actions with respect to insured depository institutions in the three undercapitalized categories, the severity of which will depend upon the capital category in which the insured depository institution is assigned. Generally, subject to a narrow exception, FDICIA requires the banking regulators to appoint a receiver or conservator for an insured depository institution that is critically undercapitalized. The federal banking agencies have specified by regulation the relevant capital level for each category.
FDICIA generally prohibits a depository institution from making any capital distribution, including payment of a dividend, or paying any management fee to its holding company if the depository institution would thereafter be undercapitalized. See “Dividends.” “Undercapitalized” depository institutions are also subject to restrictions on borrowing from the Federal Reserve System, may not
| TX14 |
Table of Contents
accept brokered deposits absent a waiver from the FDIC, and are subject to growth limitations. In addition, a depository institution’s holding company must guarantee a capital plan, up to an amount equal to the lesser of 5% of the depository institution’s assets at the time it becomes undercapitalized or the amount of the capital deficiency when the institution fails to comply with the plan. Federal banking agencies may not accept a capital plan without determining, among other things, that the plan is based on realistic assumptions and is likely to succeed in restoring the depository institution’s capital. If a depository institution fails to submit an acceptable plan, it is treated as if it is significantly undercapitalized.
“Significantly undercapitalized” depository institutions may be subject to a number of requirements and restrictions, including orders to sell sufficient voting stock to become adequately capitalized, requirements to reduce total assets, and cessation of receipt of deposits from correspondent banks. “Critically undercapitalized” institutions are subject to the appointment of a receiver or conservator.
Washington state law gives the WDFI powers similar to those granted to the FDIC under the prompt corrective action provisions of FDICIA.
Dividends. Sterling is a legal entity separate and distinct from Sterling Savings Bank and other subsidiaries. The principal source of funds for our payment of dividends on our common and preferred stock and principal and interest on our debt is dividends from our subsidiaries. Various federal and state statutory provisions and regulations limit the amount of dividends Sterling, Sterling Savings Bank and certain other subsidiaries may pay without regulatory approval.
Pursuant to the Reserve Bank Agreement, Sterling is prohibited from paying any dividends without the prior written approval of the Reserve Bank. Sterling is also prohibited from directly or indirectly taking dividends, or any other form of payment that would represent a reduction in capital from our banking subsidiary without the prior written approval of the Reserve Bank.
Under the Federal Reserve guidance reissued on February 24, 2009 the Federal Reserve may restrict Sterling’s ability to pay dividends on any class of capital stock or any other Tier 1 capital instrument if it is not deemed to have a strong capital position. In addition, dividends may have to be reduced or eliminated if:
| Ÿ | Sterling’s net income available to shareholders for the past four quarters, net of dividends previously paid during that period, is not sufficient to fully fund the dividends; |
| Ÿ | Sterling’ Savings Bank’s prospective rate of earnings retention is not consistent with the holding company’s capital needs and overall current and prospective financial condition; or |
| Ÿ | Sterling will not meet, or is in danger of not meeting, Sterling’s minimum regulatory capital adequacy ratios. |
Federal bank regulatory agencies have the authority to prohibit Sterling Savings Bank from engaging in unsafe or unsound practices in conducting its business, and the payment of dividends, depending on the bank’s financial condition, could be deemed an unsafe or unsound practice. Pursuant to the SSB MOU, Sterling Savings Bank is prohibited from paying dividends without the prior written consent of the FDIC and the WDFI. The ability of Sterling Savings Bank to pay dividends in the future will continue to be influenced by bank regulatory policies and capital guidelines.
FDICIA generally prohibits a depository institution from making any capital distribution, including payment of a dividend, or paying any management fee to its holding company if the institution would thereafter be undercapitalized. In addition, federal and state banking regulations applicable to us and our bank subsidiaries require minimum levels of capital that limit the amounts available for payment of dividends.
Under the terms of Sterling’s junior subordinated notes and the trust documents relating to its junior subordinated debentures, Sterling is allowed to defer payments of interest for up to 20 consecutive quarterly periods without default. During the deferral period, however, Sterling generally may not pay cash dividends on or repurchase common stock, until all accrued interest payments are paid and regularly scheduled interest payments are resumed. We are currently, and expect to continue to be, in
| TX15 |
Table of Contents
deferral on the payment of interest relating to the junior subordinated debentures and will therefore be unable to pay cash dividends on common stock or preferred stock in the foreseeable future. Pursuant to the terms of the Treasury Exchange, subject to certain exceptions, we will be unable to pay cash dividends on common stock without the Treasury’s consent until the earlier of December 5, 2011, or such time as the Treasury ceases to own any debt or equity securities acquired pursuant to the Exchange Agreement or the Treasury Warrant. See “Dividend Policy” below.
Deposit Insurance and Assessments. Deposits held by Sterling Savings Bank are insured by the Deposit Insurance Fund (the “DIF”) as administered by the FDIC. The Dodd-Frank Act raised the standard maximum deposit insurance amount to $250,000 per depositor, per insured depository institution for each account ownership category. The change makes permanent the temporary coverage limit increase from $100,000 to $250,000 that had been in effect since October 2008.
In November 2008, the FDIC expanded deposit insurance limits for qualifying transaction accounts under the Transaction Account Guarantee (“TAG”) program. The TAG program continued until the end of 2010. Under it, noninterest-bearing transaction accounts and qualified NOW checking accounts at Sterling Savings Bank were fully guaranteed by the FDIC for an unlimited amount of coverage. Effective December 31, 2010, and continuing through December 31, 2012, the Dodd-Frank Act provides unlimited FDIC insurance for noninterest-bearing transaction accounts in all banks. The new, two-year coverage picks up where the TAG program left off, though some accounts that were covered under the TAG program, such as NOW checking accounts, will not benefit from the coverage extension.
The FDIC maintains the DIF by assessing each depository institution an insurance premium. The amount of the FDIC assessments paid by a DIF member institution is based on its relative risk of default as measured by the company’s FDIC supervisory rating, and other various measures, such as the level of brokered deposits, secured debt and debt issuer ratings.
The DIF assessment base rate currently ranges from 12 to 45 basis points for institutions that do not trigger factors for brokered deposits and unsecured debt, and higher rates for those that do trigger those risk factors. In February 2011, the FDIC redefined the deposit insurance assessment base, and updated the assessment rates. Sterling is currently evaluating these changes and the impact on Sterling is not yet clear. See “Risk Factors.”
The Dodd-Frank Act effects further changes to the law governing deposit insurance assessments. There is no longer an upper limit for the reserve ratio designated by the FDIC each year, and the maximum reserve ratio may not be less than 1.35% of insured deposits, or the comparable percentage of the assessment base. Under prior law the maximum reserve ratio was 1.15%. The Dodd-Frank Act permits the FDIC until September 30, 2020 to raise the reserve ratio, which is currently negative, to 1.35%. The FDIC is required to offset the effect of increased assessments necessitated by the Dodd-Frank Act on insured depository institutions with total consolidated assets of less than $10 billion, but we cannot currently predict how this offset will affect us, and implementing rules are not expected until mid-2011. See “Risk Factors—Recent changes have created regulatory uncertainty” and “Risk Factors—Current and future increases in FDIC insurance premiums, including FDIC special assessments imposed on all FDIC-insured institutions, will decrease our earnings.” The Dodd-Frank Act also eliminates requirements under prior law that the FDIC pay dividends to member institutions if the reserve ratio exceeds certain thresholds, and the FDIC has proposed that in lieu of dividends, it will adopt lower rate schedules when the reserve ratio exceeds certain thresholds.
All FDIC-insured depository institutions must pay an annual assessment to provide funds for the payment of interest on bonds issued by the Financing Corporation, a federal corporation chartered under the authority of the Federal Housing Finance Board. The bonds, which are referred to as FICO bonds, were issued to capitalize the Federal Savings and Loan Insurance Corporation. FDIC-insured depository institutions paid between 1.02 cents to 1.14 cents per $100 of DIF-assessable deposits in 2009, and between 1.04 to 1.06 cents during 2010.
Transactions with Affiliates and Insiders. A variety of legal limitations restrict Sterling Savings Bank from lending or otherwise supplying funds or
| TX16 |
Table of Contents
in some cases transacting business with Sterling or its nonbank subsidiaries. Sterling Savings Bank is subject to Sections 23A and 23B of the Federal Reserve Act and Federal Reserve Regulation W. Section 23A places limits on the amount of covered transactions which include loans or extensions of credit to, investments in or certain other transactions with, affiliates as well as the amount of advances to third parties collateralized by the securities or obligations of affiliates. The aggregate of all covered transactions is limited to 10% of the bank’s capital and surplus for any one affiliate and 20% for all affiliates. Furthermore, within the foregoing limitations as to amount, each covered transaction must meet specified collateral requirements ranging from 100% to 130%. Also, banks are prohibited from purchasing low quality assets from an affiliate.
Section 23B, among other things, prohibits an institution from engaging in certain transactions with affiliates unless the transactions are on terms substantially the same, or at least as favorable to the bank, as those prevailing at the time for comparable transactions with nonaffiliated companies. Except for limitations on low quality asset purchases and transactions that are deemed to be unsafe or unsound, Regulation W generally excludes affiliated depository institutions from treatment as affiliates. Transactions between a bank and any of its subsidiaries that are engaged in certain financial activities may be subject to the affiliated transaction limits. The Federal Reserve also may designate bank subsidiaries as affiliates.
Banks are also subject to quantitative restrictions on extensions of credit to executive officers, directors, principal shareholders, and their related interests. In general, such extensions of credit (1) may not exceed certain dollar limitations, (2) must be made on substantially the same terms, including interest rates and collateral, as those prevailing at the time for comparable transactions with third parties and (3) must not involve more than the normal risk of repayment or present other unfavorable features. Certain extensions of credit also require the approval of a bank’s board of directors.
The Dodd-Frank Act expands the 23A and 23B affiliate transaction rules. Among other things, upon the statutory changes’ effective date, which will likely be mid- to late- 2012, the scope of the definition of “covered transaction” under 23A will expand, collateral requirements will increase and certain exemptions will be eliminated.
Standards for Safety and Soundness. The Federal Deposit Insurance Act requires the federal bank regulatory agencies to prescribe, by regulation or guideline, operational and managerial standards for all insured depository institutions relating to: (1) internal controls; (2) information systems and audit systems; (3) loan documentation; (4) credit underwriting; (5) interest rate risk exposure; and (6) asset quality.
The agencies also must prescribe standards for earnings, and stock valuation, as well as standards for compensation, fees and benefits. The federal banking agencies have adopted regulations and Interagency Guidelines Prescribing Standards for Safety and Soundness to implement these required standards. These guidelines set forth the safety and soundness standards used to identify and address problems at insured depository institutions before capital becomes impaired. Under the regulations, if a regulator determines that a bank fails to meet any standards prescribed by the guidelines, the regulator may require the bank to submit an acceptable plan to achieve compliance, consistent with deadlines for the submission and review of such safety and soundness compliance plans.
Regulatory Examination. Federal and state banking agencies require Sterling and Sterling Savings Bank to prepare annual reports on financial condition and to conduct an annual audit of financial affairs in compliance with minimum standards and procedures. Sterling and Sterling Savings Bank must undergo regular on-site examinations by the appropriate banking agency. A bank regulator conducting an examination has complete access to the books and records of the examined institution. The results of the examination are confidential. The cost of examinations may be assessed against the examined institution as the agency deems necessary or appropriate. The FDIC has developed a method for insured depository institutions to provide supplemental disclosure of the estimated fair market value of assets and liabilities, to the extent feasible and practicable, in any balance sheet, financial statement, report of condition or any other report.
| TX17 |
Table of Contents
State Law and Regulation. Sterling Savings Bank as a Washington state-chartered institution, is subject to regulation by the WDFI, which conducts regular examinations to ensure that its operations and policies conform with applicable law and safe and sound banking practices. Among other things, state law regulates the amount of credit that can be extended to any one borrower and the amount of money that can be invested in various types of assets. Sterling Savings Bank generally cannot extend credit to any one borrower in an amount greater than 20% of Sterling Savings Bank’s capital and surplus. State law also regulates the types of loans Sterling Savings Bank can make. With the WDFI’s approval, Sterling Savings Bank can currently invest up to 10% of its total assets or 50% of its net worth (whichever is less) in other corporations, whether or not such corporations are engaged in activities related to Sterling Savings Bank’s business, but such authority is subject to restrictions imposed by federal law. Sterling Savings Bank also operates depository branches within the states of Oregon, Idaho, California and Montana and therefore its operations in these states are subject to the supervision of the Oregon Department of Consumer and Business Services, the Idaho Department of Finance, the California Department of Financial Institutions and the Montana Department of Finance, as applicable. Sterling and its subsidiaries are also required to comply with applicable laws and regulations for activities in Alaska, Arizona, Colorado, Hawaii, Nevada, Texas and Utah.
Community Reinvestment Act. The Community Reinvestment Act (the “CRA”) requires that the appropriate federal bank regulator evaluate the record of our banking subsidiary in meeting the credit needs of its local community, including low and moderate income neighborhoods. These evaluations are considered in evaluating mergers, acquisitions, and applications to open a branch or facility. Failure to adequately meet these criteria could result in additional requirements and limitations on the bank. As of Sterling’s last CRA regulatory exam, Sterling Savings Bank received a rating of “satisfactory.”
Consumer Protection Regulations. Retail activities of banks are subject to a variety of statutes and regulations designed to protect consumers. The Dodd-Frank Act creates a Bureau of Consumer Financial Protection that, together with the statute’s other enhancements to consumer protection laws such as limits on debit card interchange fees and provisions on mortgage-related matters, will likely increase the compliance costs of consumer banking operations. Interest and other charges collected or contracted for by banks are subject to state usury laws and federal laws concerning interest rates. Loan operations are also subject to federal laws applicable to credit transactions, such as:
| Ÿ | the federal Truth-In-Lending Act and Regulation Z issued by the Federal Reserve, governing disclosures of credit terms to consumer borrowers; |
| Ÿ | the Home Mortgage Disclosure Act and Regulation C issued by the Federal Reserve, requiring financial institutions to provide information to enable the public and public officials to determine whether a financial institution is fulfilling its obligation to help meet the housing needs of the community it serves; |
| Ÿ | the Equal Credit Opportunity Act and Regulation B issued by the Federal Reserve, prohibiting discrimination on the basis of race, creed or other prohibited factors in extending credit; |
| Ÿ | the Fair Credit Reporting Act and Regulation V issued by the Federal Reserve, governing the use and provision of information to consumer reporting agencies; |
| Ÿ | the Fair Debt Collection Act, governing the manner in which consumer debts may be collected by collection agencies; and |
| Ÿ | the guidance of the various federal agencies charged with the responsibility of implementing such federal laws. |
Deposit operations also are subject to:
| Ÿ | the Truth in Savings Act and Regulation DD issued by the Federal Reserve, which requires disclosure of deposit terms to consumers; |
| Ÿ | Regulation CC issued by the Federal Reserve, which relates to the availability of deposit funds to consumers; |
| TX18 |
Table of Contents
| Ÿ | the Right to Financial Privacy Act, which imposes a duty to maintain the confidentiality of consumer financial records and prescribes procedures for complying with administrative subpoenas of financial records; and |
| Ÿ | the Electronic Funds Transfer Act and Regulation E issued by the Federal Reserve, which governs automatic deposits to and withdrawals from deposit accounts and customers’ rights and liabilities arising from the use of automated teller machines and other electronic banking services. |
Commercial Real Estate Lending. Lending operations that involve concentrations of commercial real estate loans are subject to enhanced scrutiny by federal banking regulators. The regulators have advised financial institutions of the risks posed by commercial real estate lending concentrations. Such loans generally include land development, construction loans and loans secured by multifamily property, and nonfarm, nonresidential real property where the primary source of repayment is derived from rental income associated with the property. The guidance prescribes the following guidelines for examiners to help identify institutions that are potentially exposed to excessive concentration risk and may warrant greater supervisory scrutiny:
| Ÿ | total reported loans for construction, land development and other land represent 100% or more of the institutions total risk-based capital (ratio was 64% for Sterling Savings Bank at December 31, 2010, compared with 271% at December 31, 2009), or |
| Ÿ | total commercial real estate loans, as defined, represent 300% or more of the institution’s total risk-based capital (ratio was 238% for Sterling Savings Bank at December 31, 2010, compared with 636% at December 31, 2009), and the outstanding balance of the institution’s commercial real estate loan portfolio has increased by 50% or more during the prior 36 months. |
In October 2009, the federal banking agencies issued additional guidance on commercial real estate lending that reinforces these considerations.
The Dodd-Frank Act contains provisions on credit risk retention that require federal banking regulators to adopt regulations mandating the retention of 5% of the credit risk of assets transferred, sold or conveyed through issuances of asset-backed securities. Implementing regulations will provide for the allocation of the risk retention obligation between securitizers and originators of loans, including residential and commercial mortgages.
Branching. The Riegle-Neal Interstate Banking and Branching Efficiency Act of 1994 (the “Interstate Act”) permits nationwide interstate banking and branching under certain circumstances. This legislation generally authorizes interstate branching and relaxes federal law restrictions on interstate banking. Currently, bank holding companies may purchase banks in any state, and states may not prohibit these purchases. Additionally, banks are permitted to merge with banks in other states, as long as the home state of neither merging bank has opted out under the legislation. The Interstate Act requires regulators to consult with community organizations before permitting an interstate institution to close a branch in a low-income area.
Washington enacted “opting in” legislation in accordance with the Interstate Act, allowing banks to engage in interstate merger transactions, subject to certain “aging” requirements. Once an out-of-state bank has acquired a bank within the state, either through merger or acquisition of all or substantially all of the bank’s assets, the out-of-state bank may open additional branches within the state. In addition, an out-of-state bank may establish a de novo branch in Washington or acquire a branch in Washington if the out-of-state bank’s home state gives Washington banks substantially the same or more favorable rights to establish and maintain branches in that state.
Anti-Tying Restriction. In general, a bank may not extend credit, lease, sell property, or furnish any services or fix or vary the consideration for products and services on the condition that (1) the customer obtain or provide some additional credit, property, or services from or to the bank or bank holding company or their subsidiaries, or (2) the customer not obtain some other credit, property, or services from a competitor, except to the extent reasonable conditions are imposed to assure the soundness of the credit extended. A bank may, however, offer combined-balance products and may otherwise offer
| TX19 |
Table of Contents
more favorable terms if a customer obtains two or more traditional bank products. Also, certain foreign transactions are exempt from the general rule.
Anti-Money Laundering. Financial institutions must maintain anti-money laundering programs that include established internal policies, procedures, and controls; a designated compliance officer; an ongoing employee training program; and testing of the program by an independent audit function. We are prohibited from entering into specified financial transactions and account relationships and must meet enhanced standards for due diligence in dealings with foreign financial institutions and foreign customers. We also must take reasonable steps to conduct enhanced scrutiny of account relationships to guard against money laundering and to report any suspicious transactions. Recent laws provide law enforcement authorities with increased access to financial information maintained by banks. Anti-money laundering obligations have been substantially strengthened as a result of the Uniting and Strengthening America by Providing Appropriate Tools Required to Intercept and Obstruct Terrorism Act of 2001 (the “USA Patriot Act”), enacted in 2001, renewed in 2006 and extended, in part, in 2011. Bank regulators routinely examine institutions for compliance with these obligations and are required to consider compliance in connection with the regulatory review of applications.
The USA Patriot Act amended, in part, the Bank Secrecy Act and provides for the facilitation of information sharing among governmental entities and financial institutions for the purpose of combating terrorism and money laundering. The statute also creates enhanced information collection tools and enforcement mechanics for the U.S. government, including: (1) requiring standards for verifying customer identification at account opening; (2) promulgating rules to promote cooperation among financial institutions, regulators, and law enforcement entities in identifying parties that may be involved in terrorism or money laundering; (3) requiring reports by nonfinancial trades and businesses filed with the Treasury’s Financial Crimes Enforcement Network for transactions exceeding $10,000; and (4) mandating the filing of suspicious activities reports if a bank believes a customer may be violating U.S. laws and regulations. The statute also requires enhanced due diligence requirements for financial institutions that administer, maintain, or manage private bank accounts or correspondent accounts for non-U.S. persons.
The Federal Bureau of Investigation may send bank regulatory agencies lists of the names of persons suspected of involvement in terrorist activities. Sterling may be subject to a request for a search of its records for any relationships or transactions with persons on those lists and may be required to report any identified relationships or transactions. Furthermore, the Office of Foreign Assets Control (“OFAC”) is responsible for helping to ensure that U.S. entities do not engage in transactions with certain prohibited parties, as defined by various Executive Orders and Acts of Congress. OFAC has sent, and will send, bank regulatory agencies lists of names of persons and organizations suspected of aiding, harboring or engaging in terrorist acts, known as Specially Designated Nationals and Blocked Persons. If we find a name on any transaction, account or wire transfer that is on an OFAC list, we must freeze such account, file a suspicious activity report and notify the appropriate authorities.
Privacy and Credit Reporting. Financial institutions are required to disclose their policies for collecting and protecting confidential customer information. Customers generally may prevent financial institutions from sharing nonpublic personal financial information with nonaffiliated third parties, with some exceptions, such as the processing of transactions requested by the consumer. Financial institutions generally may not disclose certain consumer or account information to any nonaffiliated third party for use in telemarketing, direct mail marketing or other marketing. Federal and state banking agencies have prescribed standards for maintaining the security and confidentiality of consumer information, and we are subject to such standards, as well as certain
federal and state laws or standards for notifying consumers in the event of a security breach.
Our banking subsidiary utilizes credit bureau data in underwriting activities. Use of such data is regulated under the Fair Credit Reporting Act and Regulation V on a uniform, nationwide basis, including credit reporting, prescreening, sharing of information between affiliates and the use of credit
| TX20 |
Table of Contents
data. The Fair and Accurate Credit Transactions Act, which amended the Fair Credit Reporting Act, permits states to enact identity theft laws that are consistent with the conduct required by the provisions of that Act.
Enforcement Powers. Banks and their “institution-affiliated parties,” including management, employees, agents, independent contractors and consultants, such as attorneys and accountants and others who participate in the conduct of the institution’s affairs, are subject to potential civil and criminal penalties for violations of law, regulations or written orders of a government agency. Violations can include failure to timely file required reports, filing false or misleading information or submitting inaccurate reports. Civil penalties may be as high as $1 million a day for such violations and criminal penalties for some financial institution crimes may include imprisonment for 20 years. Regulators have flexibility to commence enforcement actions against institutions and institution-affiliated parties, and the FDIC has the authority to terminate deposit insurance. When issued by a banking agency, cease-and-desist orders or other regulatory agreements may, among other things, require affirmative action to correct any harm resulting from a violation or practice, including restitution, reimbursement, indemnifications or guarantees against loss. A financial institution may also be ordered to restrict its growth, dispose of certain assets, rescind agreements or contracts, or take other actions determined to be appropriate by the ordering agency. The federal banking agencies also may remove a director or officer from an insured depository institution (or bar them from the industry) if a violation is willful or reckless. The WDFI has similar enforcement powers.
For information on the SSB MOU and the Reserve Bank Agreement applicable to Sterling, see “MD&A—Regulatory Agreements.”
Corporate Governance. The Dodd-Frank Act contains a number of provisions that will require changes to financial institutions’ corporate governance and executive compensation practices, including proxy access for publicly-traded banks’ director nominations, clawback of incentive-based compensation from executive officers and increased disclosure on compensation arrangements. Publicly-traded bank holding companies with more than $10 billion in assets will also be required to have risk committees with a number of independent directors to be determined by the Federal Reserve and that include at least one risk management expert with experience in risk management at large, complex companies.
Monetary Policy and Economic Controls. Our earnings are affected by the policies of regulatory authorities, including the monetary policy of the Federal Reserve. An important function of the Federal Reserve is to promote orderly economic growth by influencing interest rates and the supply of money and credit. Among the methods that have been used to achieve this objective are open market operations in U.S. government securities, changes in the discount rate for bank borrowings, expanded access to funds for nonbanks and changes in reserve requirements against bank deposits. These methods are used in varying combinations to influence overall growth and distribution of bank loans, investments and deposits, interest rates on loans and securities, and rates paid for deposits. In recent years, in response to the financial crisis, the Federal Reserve has created several innovative programs to stabilize certain financial institutions and to ensure the availability of credit. The effects of the various Federal Reserve policies on our future business and earnings cannot be predicted.
Depositor Preference Statute. Federal law provides that deposits and certain claims for administrative expenses and employee compensation against an insured depository institution are afforded priority over other general unsecured claims against such institution, including federal funds and letters of credit, in the liquidation or other resolution of the institution by any receiver.
Troubled Asset Relief Program (“TARP”) Regulations. Under the Emergency Economic Stabilization Act of 2008 (“EESA”), Congress has the ability to impose “after-the-fact” terms and conditions on participants in Treasury Department’s Capital Purchase Program, a program created to deploy TARP funds. As a participant in the TARP Capital Purchase Program, we are subject to any such retroactive legislation. On February 10, 2009, the Treasury announced the Financial Stability Plan under the EESA, which is intended to further stabilize financial institutions and stimulate lending
| TX21 |
Table of Contents
across a broad range of economic sectors. On February 18, 2009, President Obama signed the American Recovery and Reinvestment Act of 2009
(“ARRA”), a broad economic stimulus package that included additional restrictions on, and potential additional regulation of, financial institutions.
On June 10, 2009, under the authority granted to it under ARRA and EESA, the Treasury Department issued an interim final rule under Section 111 of EESA, as amended by ARRA, regarding compensation and corporate governance restrictions that would be imposed on TARP recipients, effective June 15, 2009. As a TARP recipient with currently outstanding TARP obligations, we are subject to the compensation and corporate governance restrictions and requirements set forth in the interim final rule, which, among other things: (1) prohibit us from paying or accruing bonuses, retention awards or incentive compensation, except for certain long-term stock awards, to our senior executives and next 20 most highly compensated employees; (2) prohibit us from making severance payments to any of our senior executive officers or next five most highly compensated employees; (3) require us to conduct semi-annual risk assessments to assure that our compensation arrangements do not encourage “unnecessary and excessive risks” or the manipulation of earnings to increase compensation; (4) require us to recoup or “clawback” any bonus, retention award or incentive compensation paid by us to a senior executive officer or any of our next 20 most highly compensated employees, if the payment was based on financial statements or other performance criteria that are later found to be materially inaccurate; (5) prohibit us from providing tax gross-ups to any of our senior executive officers or next 20 most highly compensated employees; (6) require us to provide enhanced disclosure of perquisites, and the use and role of compensation consultants; (7) required us to adopt a corporate policy on luxury and excessive expenditures; (8) require our chief executive officer and chief financial officer to provide period certifications about our compensation practices and compliance with the interim final rule; (9) require us to provide enhanced disclosure of the relationship between our compensation plans and the risk posed by those plans; and (10) require us to provide an annual non-binding shareholder vote, or “say-on-pay” proposal, to approve the compensation of our executives, consistent with regulations promulgated by the Securities and Exchange Commission (“SEC”). On January 12, 2010, the SEC adopted final regulations setting forth the parameters for such say-on pay proposals for public company TARP participants.
We are also obligated under the terms of the Treasury Exchange to take all necessary actions to comply with the executive compensation restrictions under EESA and any subsequent amendments thereto for so long as we remain subject to such restrictions. The Exchange Agreement further requires that we obtain a waiver with respect to the application of the executive compensation restrictions under EESA from each employee who is subject to the restrictions. The Exchange Agreement also reiterates the $500,000 limitation on the deduction of compensation to our senior executive officers under EESA, ARRA and the regulations promulgated thereunder. Finally, if any payments are made that are in violation these Exchange Agreement provisions, such amounts must be subject to clawback and repayment to Sterling, and Sterling must provide notice to Treasury of any violation and clawback that occurs.
Additional regulations applicable to TARP recipients adopted as part of EESA, the Financial Stability Plan, ARRA or other legislation may subject us to additional regulatory requirements. The impact of these additional requirements may put us at competitive disadvantage in comparison to financial institutions that have either repaid all TARP funds or never accepted TARP funds and may materially adversely affect our business and results of operations.
Environmental Laws. Environmentally related hazards have become a source of high risk and potentially unlimited liability for financial institutions relative to their loans. Environmentally contaminated properties owned by an institution’s borrowers may result in a drastic reduction in the value of the collateral securing the institution’s loans to such borrowers, high environmental clean-up costs to the borrower affecting its ability to repay the loans, the subordination of any lien in favor of the institution to a state or federal lien securing clean-up costs, and liability to the institution for clean-up costs if it forecloses on the contaminated property or becomes involved in the management of the borrower. To minimize this risk,
| TX22 |
Table of Contents
Sterling may require an environmental examination and report with respect to the property of any borrower or prospective borrower if circumstances affecting the property indicate a potential for contamination, taking into consideration the potential loss to the institution in relation to the burdens to the borrower. This examination must be performed by an engineering firm experienced in environmental risk studies and acceptable to the institution, with the costs of such examinations and reports being the responsibility of the borrower. These costs may be substantial and may deter a prospective borrower from entering into a loan
transaction with Sterling. Sterling is not aware of any borrower who is currently subject to any environmental investigation or clean-up proceeding that is likely to have a material adverse effect on the financial condition or results of operations of Sterling.
From time to time, Sterling and its senior managers have made and will make forward-looking statements that are not historical facts and that are intended to be covered by the safe harbor for “forward-looking statements” provided by the Private Securities Litigation Reform Act of 1995. These forward-looking statements may include, but are not limited to, statements about Sterling’s plans, objectives, expectations and intentions and other statements contained in this release that are not historical facts and pertain to Sterling’s future operating results. When used in this report, the words “expects,” “anticipates,” “intends,” “plans,” “believes,” “seeks,” “estimates” and similar expressions are generally intended to identify forward-looking statements. We make forward-looking statements regarding projected sources of funds, use of proceeds, availability of acquisition and growth opportunities, ability to repay government funds, payment of dividends, adequacy of our allowance for loan and lease losses and provision for loan and lease losses, our real estate portfolio and subsequent charge-offs. Such statements may be contained in this report and in other documents that Sterling files with the Securities and Exchange Commission. Such statements may also be made by Sterling and its senior managers in oral or written presentations to analysts, investors, the media and others.
Actual results may differ materially from the results discussed in these forward-looking statements because such statements are inherently subject to significant assumptions, risks and uncertainties, many of which are difficult to predict and are generally beyond Sterling’s control. These include but are not limited to:
| Ÿ | our ability to maintain adequate liquidity; |
| Ÿ | our ability to comply with the Reserve Bank Agreement and the SSB MOU; |
| Ÿ | our ability to attract and retain deposits and loans; |
| Ÿ | demand for financial services in our market areas; |
| Ÿ | competitive market pricing factors; |
| Ÿ | further deterioration in economic conditions that could result in increased loan and lease losses; |
| Ÿ | risks associated with concentrations in real estate-related loans; |
| Ÿ | market interest rate volatility; |
| Ÿ | stability of funding sources and continued availability of borrowings; |
| Ÿ | changes in legal or regulatory requirements or the results of regulatory examinations that could restrict growth; |
| Ÿ | our ability to recruit and retain key management and staff; |
| Ÿ | risks associated with merger and acquisition integration; |
| Ÿ | our ability to incur debt on reasonable terms; |
| Ÿ | regulatory limits on the ability of Sterling Savings Bank to pay dividends to Sterling; |
| Ÿ | impact of legislative and regulatory change on the financial sector; |
| Ÿ | future legislative or administrative changes to the TARP Capital Purchase Program; and |
| Ÿ | the impact of EESA and ARRA and related rules and regulations on Sterling’s business operations and competitiveness, including the impact of executive compensation restrictions, which may affect Sterling’s ability to retain and recruit executives in competition with other firms who do not operate under those restrictions. |
| TX23 |
Table of Contents
Other factors that could cause actual conditions, events or results to differ significantly from those described in the forward-looking statements may be found under the headings “Risk Factors” and “Management’s Discussion and Analysis of Financial Condition and Results of Operations” below, as updated periodically in Sterling’s filings with the SEC. Unless legally required, Sterling disclaims any obligation to update any forward-looking statements. You should consider any forward-looking statements in light of this explanation, and we caution you about relying on forward-looking statements.
Where You Can Find More Information
The periodic reports Sterling files with the SEC are available on Sterling’s website at www.sterlingfinancialcorporation-spokane.com after the reports are filed with the SEC. The SEC maintains a website located at www.sec.gov that also contains this information. The information on Sterling’s website and the SEC’s website is not part of this annual report on Form 10-K. Sterling will provide you with copies of these reports, without charge, upon request made to:
Investor Relations
Sterling Financial Corporation
111 North Wall Street
Spokane, Washington 99201
(509) 458-3711
| TX24 |
Table of Contents
Set forth below and elsewhere in this Annual Report on Form 10-K and in other documents we file with the SEC are risks and uncertainties that could cause actual results to differ materially from the results contemplated by the forward-looking statements contained in this Annual Report on Form 10-K.
The risks described below are not the only ones facing our company. Additional risks not presently known to us or that we currently deem immaterial may also impair our business operations. Our business, financial condition, results of operations or prospects could be materially and adversely affected by any of these risks. The trading price of, and market for, shares of Sterling common stock could decline due to any of these risks. This report, including the documents incorporated by reference herein, also contain forward-looking statements that involve risks and uncertainties. Our actual results could differ materially from those anticipated in these forward-looking statements as a result of certain factors, including the risks described below and in the documents incorporated by reference herein.
If our current capital levels are not sufficient to satisfy our needs or to satisfy changing regulatory requirements, we may need additional capital and could be subject to further regulatory restrictions, either of which could significantly adversely affect us and the trading price of our stock.
The proceeds from the Recapitalization have been raised to strengthen our common equity capital base. If the proceeds from the Recapitalization prove not to be sufficient, or if economic conditions continue to be difficult or worsen or fail to improve in a timely manner, or if our operations or financial condition deteriorates or fails to improve, particularly in the residential and commercial real estate markets where Sterling operates, there may be a need to raise significant additional capital. Factors affecting whether we would need to raise additional capital include, among others, changing requirements of regulators, additional provisions for loan losses and loan charge-offs and other risks discussed in this “Risk Factors” section. If we were to need to raise additional capital, we may not be able to do so in the amounts required and in a timely manner, or at all. Our ability to raise additional capital may be constrained by our need to preserve our deferred tax assets. For more information, see “Our ability to use our deferred tax assets may be materially impaired” below. In addition, any such additional capital raised may be significantly dilutive to our existing shareholders and may result in the issuance of securities that have rights, preferences and privileges that are senior to our common stock.
We may issue securities that could dilute the ownership of our existing shareholders and may adversely affect the market price of our common stock and warrants.
We may decide to raise additional funds through public or private debt or equity financings for a number of reasons, including in response to regulatory or other requirements to meet our liquidity and capital needs as discussed above, to finance our operations and business strategy (including potential acquisitions) or for other reasons. If we raise funds by issuing equity securities or instruments that are convertible into equity securities, the percentage ownership of our existing shareholders will be reduced, the new equity securities may have rights, preferences and privileges superior to those of our common stock and additional issuances could be at a purchase price that is lower than the available market price for our common stock. The Anchor Investors and Private Placement Investors also have pre-emptive rights to maintain their ownership percentages in certain circumstances. In addition, there are anti-dilution adjustments in the warrants issued to the Anchor Investors and the amended warrant issued to Treasury that may protect the holders thereof against below-market issuances. There is generally no such protection available to holders of our common stock. To the extent that any new issuance of equity securities triggers these anti-dilution adjustments, your ownership could be further diluted. Except as described above, holders of our common stock have no pre-emptive rights that entitle them to purchase their pro rata share of any offering of shares of any class or series. The market price of our common stock or our warrants could decline as a result of sales of a large number of shares of common stock, preferred stock or similar securities in the market as a result of future sales of common stock or the perception that such sales
| TX25 |
Table of Contents
could occur. We may also issue equity securities as consideration for acquisitions we may make that could be dilutive to existing shareholders.
We cannot determine whether or when certain agreements entered into with our regulators will be lifted.
Following the September 2010 termination of its cease and desist order, Sterling Savings Bank remains subject to enhanced supervisory review on an informal basis in the form of the SSB MOU. Though the requirements of the SSB MOU are less strenuous than were the requirements of the cease and desist order, Sterling Savings Bank is required to maintain Tier 1 capital in an amount that ensures that its leverage ratio is at least 8%. The SSB MOU also requires Sterling Savings Bank to meet certain asset quality targets, develop a written capital plan, develop a three-year strategic plan and accept other limitations.
Under the terms of the Reserve Bank Agreement, Sterling is subject to restrictions on its ability to pay dividends and distributions, incur debt, purchase or redeem stock and appoint new board members or senior executive officers. Under the Reserve Bank Agreement, Sterling is also required to act as a source of strength to Sterling Savings Bank and to report quarterly to the Reserve Bank on steps taken to improve its capital ratios and risk, liquidity and funds management and on other matters.
We cannot determine whether or when the SSB MOU or the Reserve Bank Agreement will be lifted or terminated. Even if the Reserve Bank Agreement is lifted or terminated, Sterling may remain subject to a memorandum of understanding or other undertaking with the Reserve Bank that restricts our activities and continues to impose higher capital ratios, as the SSB MOU does. The requirements and restrictions of the Reserve Bank Agreement are judicially enforceable, and Sterling Savings Bank is obligated to comply with the undertakings set forth in the SSB MOU. The failure to comply with the SSB MOU and the Reserve Bank Agreement may result in the issuance of a new cease and desist order or subject Sterling and Sterling Savings Bank to additional regulatory restrictions including: the imposition of civil monetary penalties; the issuance of directives to increase capital or enter into a strategic transaction, whether by merger or otherwise, with a third party; and other limitations or restrictions on our business or activities.
Acquisitions present many risks, and we may not realize the financial and strategic goals that are contemplated at the time of any future acquisitions.
Our growth strategy includes an intent to acquire other banks. This strategy entails risk. Acquisitions and related transition and integration activities may disrupt our ongoing business and divert management’s attention. In addition, an acquisition may not further our corporate strategy as we expected, we may pay more than the acquired banks or assets are ultimately worth or we may not integrate an acquired bank or assets as successfully as we expected, which could adversely affect our business, results of operations and financial condition. We may be adversely affected by liabilities or pre-existing contractual relationships that we assume and may also fail to anticipate or accurately estimate litigation or other exposure, unfavorable accounting consequences, increases in taxes due or a loss of anticipated tax benefits. Other potential adverse consequences include higher than anticipated costs associated with the acquired bank or assets or integration activities. The use of cash to pay for acquisitions may limit our use of cash for other potential activities, such as dividends. The use of equity securities to pay for acquisitions could significantly dilute existing shareholders. If we use debt to finance acquisitions, we may significantly increase our expenses, leverage and debt service requirements. The occurrence of any of these risks could have a material adverse effect on our business, results of operations, financial condition or cash flows, particularly in the case of a large acquisition or several concurrent acquisitions.
Our strategy of pursuing acquisitions of troubled institutions may not be successful.
We anticipate that a part of our future business strategy will be to pursue the acquisition of troubled banks. We are not currently qualified to bid on these transactions. Although we plan to be intensely focused on complying with and being released from the SSB MOU and the Reserve Bank Agreement and becoming qualified to bid on such transactions, we
| TX26 |
Table of Contents
may not be successful in the near term or at all. Prolonged or indefinite failure to achieve such qualification could cause us to miss the opportunity to bid on banks that we believe would be attractive acquisition candidates. The bidding process for failing banks has become very competitive, and we may not be able to match or beat the bids of other acquirers unless we bid aggressively by increasing the premium paid on assumed deposits, reducing the discount bid on assets purchased or taking other actions, any of which could make the acquisition less attractive.
The FDIC Policy Statement will limit our ability to acquire failed banks, which may harm our competitive position.
As the agency responsible for resolving failed depository institutions, the FDIC has discretion to determine whether a party is qualified to bid on a failed institution. The FDIC Policy Statement imposes additional restrictions and requirements on certain “private investors” and institutions, to the extent that those investors or institutions seek to acquire a failed institution from the FDIC. These include, among others, a requirement that certain private investors in those institutions agree to a three-year transfer restriction on their shares. Since its initial adoption on August 26, 2009, the FDIC has issued several interpretations which have modified the Policy Statement and the FDIC may change it in the future. On April 23, 2010, the FDIC issued an interpretation that would permit a recapitalized institution (such as Sterling) to acquire failed banks without being subject to the FDIC Policy Statement, provided the assets of the failed banks acquired during the 18 months following a recapitalization do not exceed 100% of the total assets of the recapitalized institution. It is not clear how the FDIC would calculate percentage of assets, and whether that percentage is based on assets at the time of the Recapitalization or whether the percentage is based on growth or contraction in an institution over time. We do not intend to make any acquisition that would subject us to the FDIC Policy Statement absent the consent of those shareholders to whom the FDIC Policy Statement would apply, and it is possible that any such consent might not be obtained. If we are able to obtain requisite shareholder consent to be bound by the FDIC Policy Statement and we enter into such transactions, our operating flexibility could be harmed by having to comply with the other requirements set forth in the FDIC Policy Statement. On the other hand, if we are not able to pursue transactions that we otherwise believe are attractive, our growth strategy, competitive position, and stock price may be adversely affected.
We could be materially and adversely affected if we or any of our officers or directors fail to comply with bank and other laws and regulations.
As a bank holding company, Sterling is subject to extensive regulation by U.S. federal and state regulatory agencies and face risks associated with investigations and proceedings by regulatory agencies, including those that we may believe to be immaterial. Like any corporation, we are also subject to risk arising from potential employee misconduct, including non-compliance with our policies. Any interventions by authorities may result in adverse judgments, settlements, fines, penalties, injunctions, suspension or expulsion of our officers or directors from the banking industry or other relief. In addition to the monetary consequences, these measures could, for example, impact our ability to engage in, or impose limitations on, certain of our businesses. The number of these investigations and proceedings, as well as the amount of penalties and fines sought, has increased substantially in recent years with regard to many firms in the industry. Significant regulatory action against us or our officers or directors could materially and adversely affect our business, financial condition or results of operations or cause us significant reputational harm, which could seriously harm our business.
Our common stock is equity and is subordinate to our existing and future indebtedness, and our common stock would be subordinate to any future preferred stock.
Shares of our common stock are equity interests in Sterling, do not constitute indebtedness, and, therefore, are not insured against loss by the FDIC or by any other public or private entity. Shares of our common stock will rank junior to all of our indebtedness and to other non-equity claims against us and our assets available to satisfy such claims,
| TX27 |
Table of Contents
including in liquidation. Our board of directors is authorized to issue additional classes or series of preferred stock without any action on the part of the holders of our common stock, and the holders of our common stock do not have the right to prevent us from incurring indebtedness or other claims.
Resales of our common stock may be impeded by transfer restrictions.
Subject to certain exceptions, our common stock issued in connection with the Recapitalization is subject to transfer restrictions designed to prevent (a) any person from acquiring ownership, for relevant tax purposes, of 5% or more of our shares and (b) the disposition of shares by any person that owns 5% or more of our shares, subject to certain exceptions. These restrictions may adversely affect the ability of certain shareholders to resell our common stock by rendering any transactions in violation of this prohibition void. We have also amended our restated articles of incorporation to impose these transfer restrictions on all holders of our common stock.
In addition, on April 14, 2010, we adopted a shareholder rights plan (the “Rights Plan”), which is described in our Form 8-K filed on April 15, 2010. In December of 2010, we amended the Rights Plan to extend the expiration of the plan until August 26, 2013. The purpose of the Rights Plan is to minimize the likelihood of an “ownership change,” as defined in Section 382 of the Code, and thus to protect our ability to use our net operating loss carry-forward and certain built-in losses to offset future income. The Rights Plan provides an economic disincentive for any one person or group to become a Threshold Holder (as defined therein, generally an owner of 5% or more of our stock) and for any existing Threshold Holder to acquire more than a specified amount of additional shares, and so may adversely affect one’s ability to resell our common stock and negatively affect the trading price of our common stock.
In addition, shareholders that are not residents of the Republic of Korea, will not be permitted to sell or transfer Sterling shares to a Korean resident until August 26, 2011, and shareholders residing in the Republic of Korea, will not be permitted to sell or transfer Sterling shares to another Korean resident other than a professional investor until August 26, 2011; provided that, in each case, such restrictions shall not apply to open market transactions effected through the New York Stock Exchange or NASDAQ. These restrictions may limit the ability of shareholders to resell Sterling shares.
We are not currently able to pay dividends on our common stock.
Under the terms of our junior subordinated notes and the trust documents relating to our trust preferred securities, Sterling is allowed to defer payments of interest for up to 20 consecutive quarterly periods without default. During the deferral period, however, Sterling may not pay cash dividends on or repurchase common stock, until all accrued interest payments are paid and regularly scheduled interest payments are resumed. Sterling is currently, and expects to continue to be, in deferral on the payment of interest relating to the trust preferred securities and will therefore be unable to pay cash dividends on common stock or preferred stock in the foreseeable future. Pursuant to the terms of the Treasury Exchange, subject to certain exceptions, we will be unable to pay cash dividends on common stock without the Treasury’s consent until the earlier of December 5, 2011, or such time as the Treasury ceases to own any debt or equity securities acquired pursuant to the Exchange Agreement or Treasury’s warrant. Under the SSB MOU and the Reserve Bank Agreement, we are prohibited from paying dividends without the prior approval of the FDIC, WDFI and the Reserve Bank. See “Dividend Policy” below.
We may suffer substantial losses due to our agreements to indemnify certain investors against a broad range of potential claims.
In connection with the Recapitalization, we have agreed to indemnify THL, Warburg Pincus, the Private Placement Investors and certain related parties for a broad range of claims, including any inaccuracies or breaches of our representations and warranties in the relevant Recapitalization agreements and any losses arising out of or resulting from any legal, administrative or other proceedings arising out of the transactions contemplated by the relevant Recapitalization agreements and the terms of the securities being offered. While these indemnities are capped at the
| TX28 |
Table of Contents
aggregate purchase price of $730 million, if all or some claims were successfully brought against Sterling, it could potentially result in significant losses for Sterling.
As a result of the Recapitalization, THL and Warburg Pincus are substantial holders of our common stock.
Following the closing of the Recapitalization, THL and Warburg Pincus each became beneficial owners of our outstanding common stock, with their respective ownership percentages each equating to approximately 23% as of January 31, 2011, assuming the full exercise of such Anchor Investor’s warrant. Each has a representative on our Board of Directors. Accordingly, THL and Warburg Pincus have substantial influence over the election of directors to our board and over corporate policy, including decisions to enter into mergers or other extraordinary transactions. In addition, as part of the negotiations for the Anchor Investments, THL and Warburg Pincus requested, and our board of directors agreed to grant, pre-emptive rights to maintain THL’s and Warburg Pincus’s fully diluted percentage ownership of our common stock in the event of certain issuances of securities by us. In pursuing its economic interests, THL and Warburg Pincus may make decisions with respect to fundamental corporate transactions that may not be aligned with the interests of other shareholders.
Our stock price has been and may continue to be volatile, which could cause the value of our common stock to decline.
In recent periods, the trading price of our common stock has been and may continue to be highly volatile and subject to wide fluctuations in price. This volatility is in response to various factors, many of which are beyond our control, including:
| Ÿ | actual or anticipated variations in quarterly operating results from historical results or estimates of results prepared by securities analysts; |
| Ÿ | announcements of new services or products by us or our competitors; |
| Ÿ | announcements by us of significant acquisitions, strategic partnerships, joint ventures or capital commitments; |
| Ÿ | conditions or trends in the financial industry; |
| Ÿ | additions or departures of key personnel; |
| Ÿ | general economic conditions and interest rates; |
| Ÿ | the sales and trading volume of our common stock; |
| Ÿ | instability in the United States and other financial markets and the ongoing and possible escalation of unrest in the Middle East, other armed hostilities or further acts or threats of terrorism in the United States or elsewhere; |
| Ÿ | the potential impact of the secondary trading of our stock on foreign exchanges that are subject to less regulatory oversight than the NASDAQ Capital Market, without our permission, and the activity of the market makers of our stock on such exchanges, including the risk that such market makers may engage in “naked” short sales and/or other deceptive trading practices that may artificially depress or otherwise affect the price of our common stock on the NASDAQ Capital Market; |
| Ÿ | earnings estimates and recommendations of securities analysts; |
| Ÿ | the performance and stock price of other companies that investors and analysts deem comparable to us; |
| Ÿ | the soundness or predicted soundness of other financial institutions; and |
| Ÿ | the public perception of the banking industry and its safety and soundness. |
In addition, the stock market in general, and the NASDAQ Capital Market and the market for commercial banks and other financial services companies in particular, has experienced significant price and volume volatility that sometimes have been unrelated or disproportionate to the operating performance of those companies. These broad market and industry factors may seriously harm the market price of our common stock, regardless of our operating performance. In the past, following periods of volatility in the market price of a company’s securities, securities class action litigation has often been instituted. Sterling is currently engaged in securities class action litigation, the Employee Retirement Income Security
| TX29 |
Table of Contents
Act of 1974, as amended (“ERISA”) class action litigation, and derivative class action litigation, and these actions or any other suit against us could result in substantial costs, potential liabilities and the diversion of management’s attention and resources. As a result of these factors, among others, the value of your investment may decline, and you may be unable to sell your shares of our common stock at or above your purchase price. See “Legal Proceedings.”
The trading volume of our common stock is lower than that of other financial services companies.
Our common stock is listed on the NASDAQ Capital Market under the symbol “STSA.” The average daily trading volume for shares of our common stock is lower than larger financial institutions. During the 12 months ended December 31, 2010, the average daily trading volume for our common stock was 27,852 shares. As a result, sales of our common stock may place significant downward pressure on the market price of our common stock. Furthermore, it may be difficult for holders to resell their shares at prices they find attractive, or at all.
Our ability to realize the benefit of our deferred tax assets may be materially impaired.
As of December 31, 2010, our net deferred tax asset was approximately $359 million, which includes approximately $263 million of federal and state net operating losses (“NOLs”). We currently have a valuation allowance of $359 million against this deferred tax asset. Our ability to use our deferred tax assets to offset future taxable income will be limited if we experience an “ownership change” as defined in Section 382 of the Code. As a result of the Recapitalization we are now close to the “ownership change” threshold.
In general, an ownership change will occur if there is a cumulative increase in our ownership by “5-percent shareholders” (as defined in the Code) that exceeds 50 percentage points over a rolling three-year period. A corporation that experiences an ownership change will generally be subject to an annual limitation on the use of its pre-ownership change deferred tax assets equal to the equity value of the corporation immediately before the ownership change, multiplied by the applicable long-term tax-exempt rate.
While we have implemented measures to reduce the likelihood that future transactions in our common stock will result in an ownership change, such an ownership change might occur in the future. More specifically, while the Rights Plan we have adopted, as well as the protective amendment to our restated articles of incorporation approved by our shareholders, are intended to discourage or prevent transfers of Sterling shares that would increase a shareholder’s ownership to 5% or more of our common stock or that would increase the percentage of our common stock owned by a shareholder already deemed to be a “5-percent shareholder”, these restrictions might not deter a shareholder from increasing its ownership interests beyond these limits. Such an increase could adversely affect our ownership change calculations.
Our calculations regarding our current cumulative change and the likelihood of a future ownership change are based on current law. Any change in applicable law may result in an ownership change.
We have incurred significant losses since the fourth quarter of 2008 and may continue do so in the future.
Cumulatively, from the fourth quarter of 2008 through the fourth quarter of 2010, Sterling has incurred a net loss of $1.42 billion, primarily due to a $1.16 billion provision for credit losses, a $451.3 million charge for goodwill impairment and the establishment of a $359.0 million deferred tax asset valuation allowance. In light of the current economic environment, significant additional provisions for credit losses may be necessary to supplement the allowance for credit losses in the future. As a result, we may incur significant credit costs in 2011 and future periods, which would continue to have an adverse impact on our financial condition and results of operations, and could adversely affect the price of, and market for, our common stock.
Our estimated allowance for losses in our loan portfolio may be inadequate, which would cause our results of operations and financial condition to be adversely affected.
We maintain an allowance for credit losses, which is a reserve established through a provision for credit losses charged as an expense and represents
| TX30 |
Table of Contents
management’s best estimate of incurred losses within our existing portfolio of loans. The level of the allowance reflects management’s estimates based upon various assumptions and judgments as to specific credit risks, evaluation of industry concentrations, loan loss experience, current loan portfolio quality, present economic, political and regulatory conditions and unidentified losses inherent in the current loan portfolio. The determination of the appropriate level of the allowance for credit losses inherently involves a high degree of subjectivity and requires management to make significant estimates and judgments regarding current credit risks and future trends, all of which may undergo material changes. If our estimates prove to be incorrect, our allowance for credit losses may not be sufficient to cover losses in our loan portfolio and our expense relating to the additional provision for credit losses could increase substantially. In addition, bank regulatory agencies periodically review the adequacy of our allowance for credit losses as part of their examination process, and may require an increase in the provision for possible credit losses or the recognition of further loan charge-offs. Any such increases in the allowance for credit losses may have a material adverse effect on our results of operations, financial condition and the value of our common stock.
The effects of the current economic recession have been particularly severe in our primary market areas in the Pacific Northwest and California.
Substantially all of our loans are to businesses and individuals in Washington, Oregon, Idaho, Montana and California. The Pacific Northwest and California have some of the nation’s highest unemployment rates, and major employers in Washington, Oregon, Idaho and California have recently implemented substantial employee layoffs or scaled back growth plans. Severe declines in housing prices and property values have been particularly acute in our primary market areas, and each state continues to face fiscal challenges, which may have adverse long term effects on the economy of our region. A further deterioration in the economic conditions or a prolonged delay in economic recovery in our primary market areas could result in the following consequences, any of which could materially and adversely affect our business: collateral for loans, especially real estate, may decline further in value, in turn reducing customers’ borrowing power and further reducing the value of assets and collateral associated with our existing loans; loan delinquencies may increase; problem assets and foreclosures may increase; demand for our products and services may decrease; and access to low cost or noninterest bearing deposits may decrease.
A large percentage of our loan portfolio is secured by real estate. Continued deterioration in the real estate market or other segments of our loan portfolio would lead to additional losses, which could have a material adverse effect on our business, financial condition and results of operations.
Approximately 89% of our loan portfolio was secured by real estate as of December 31, 2010. As a result of increased levels of commercial and consumer delinquencies and declining real estate values, we have experienced increasing levels of net charge-offs and provisions for credit losses. Continued increases in commercial and consumer delinquency levels or continued declines in real estate market values would require increased net charge-offs and increases in the provision for credit losses, which could have a material adverse effect on our business, financial condition and results of operations and prospects. Acts of nature, including earthquakes, floods and fires, which may cause uninsured damage and other loss of value to real estate that secures these loans, may also have a negative impact on our financial condition. In addition, we may face risks associated with our real estate lending under various federal, state and local environmental laws that impose certain requirements on the owner or operator of a property.
A portion of our loan portfolio is secured by non-owner-occupied commercial real estate, which generally involves a higher degree of risk than owner-occupied commercial loans.
At December 31, 2010, approximately 23% of our commercial real estate secured loans were secured by non-owner-occupied commercial real estate. Non-owner-occupied commercial real estate loans generally depend on the cash flow from the property to service the debt. Cash flow may be significantly affected by general economic conditions. Many of
| TX31 |
Table of Contents
our non-owner occupied commercial real estate borrowers have more than one loan outstanding with us. Consequently, losses incurred on loans to a small number of borrowers could have a material adverse impact on our income and financial condition.
A rapid change in interest rates could make it difficult to maintain our current net interest income spread and could result in reduced earnings.
Our earnings are largely derived from net interest income, which is interest income earned on loans and investments, less interest paid on deposits and other borrowings. Interest rates are highly sensitive to many factors that are beyond the control of our management, including general economic conditions and the policies of various governmental and regulatory authorities. As interest rates change, net interest income is affected. With fixed rate assets (such as fixed rate loans and most investment securities) and liabilities (such as certificates of deposit), the effect on net interest income depends on the cash flows associated with the maturity of the asset or liability. Asset/liability management policy may not be successfully implemented and from time to time our risk position is not balanced. An unanticipated rapid decrease or increase in interest rates could have an adverse effect on the spreads between the interest rates earned on assets and the rates of interest paid on liabilities, and therefore on the level of net interest income. For instance, any rapid increase in interest rates in the future could result in interest expense increasing faster than interest income because of fixed rate loans and longer-term investments. Further, substantially higher interest rates could reduce loan demand and may result in slower loan growth than previously experienced. This could have an adverse negative effect on our earnings.
Our cost of funds may increase as a result of many factors, which may reduce profitability.
Our cost of funds may increase because of general economic conditions, unfavorable conditions in the capital markets, changes in interest rates, government intervention and support of competitors, government price controls and competitive pressures. We have traditionally obtained funds principally through deposits and, to a lesser extent, other borrowings, including repurchase agreements. As a general rule, deposits are a cheaper and more stable source of funds than borrowings. Checking and savings account balances and other forms of deposits can decrease when our deposit customers perceive alternative investments, such as the stock market or other non-depository investments, as providing superior expected returns, seek to spread their deposits over several banks to maximize FDIC insurance coverage or perceive weakness in our financial stability. Furthermore, technology and other changes have made it more convenient for bank customers to transfer funds into alternative investments, including products offered by other financial institutions or non-bank service providers. Additional increases in short-term interest rates could increase transfers of deposits to higher yielding deposits. Efforts and initiatives we undertake to retain and increase deposits, including deposit pricing, can increase our costs. When bank customers move money out of bank deposits in favor of alternative investments or into higher yielding deposits, or spread their accounts over several banks, we can lose a relatively inexpensive source of funds, thus increasing our funding costs. If, as a result of general economic conditions, market interest rates, competitive pressures or other factors, our level of deposits decreases relative to our overall banking activities, we may need to rely more heavily on borrowings and/or wholesale funding as a source of funds, and this may negatively impact our net interest margin and subject us to additional liquidity and funding risks.
We may have reduced access to wholesale funding sources.
As a part of our liquidity management, we use a number of funding sources in addition to core deposit growth and repayments and maturities of loans and investments. Our financial flexibility will be severely constrained if we are unable to maintain sufficient collateral or access to funding at acceptable interest rates. If we are required to rely more heavily on more expensive funding sources, and our revenues do not increase in proportion with our costs, our profitability will be impacted.
| TX32 |
Table of Contents
We are subject to extensive governmental regulation, and further regulatory actions against us may impair our operations or restrict our growth.
Sterling and Sterling Savings Bank are subject to extensive regulation under federal and state laws including those of the Federal Reserve, the FDIC and the WDFI. These laws and regulations are primarily intended to protect customers, depositors and the Deposit Insurance Fund rather than shareholders. In addition, Sterling is subject to regulation and supervision by the Federal Reserve and the SEC and to the listing standards of the NASDAQ Capital Market. Sterling Savings Bank is also subject to the supervision by and the regulations of the FDIC, and the state agencies for the states in which it conducts business. As a Washington state-chartered commercial bank, Sterling Savings Bank is primarily regulated by the WDFI.
Statutes and regulations affecting our business may be changed at any time, and the interpretation of these statutes and regulations by examining authorities may also change. Within the last several years, Congress and the President have passed and enacted significant changes to these statutes and regulations, including most recently, the Dodd-Frank Act signed into law on July 21, 2010. Such changes to the statutes and regulations or to their interpretation may adversely affect our business. In addition to governmental supervision and regulation, we are subject to changes in other federal and state laws, including changes in tax laws, which could materially affect the banking industry. The regulators may continue to limit our activities or growth and may impose monetary penalties, which could severely limit or end certain of our operations. Banking laws and regulations change from time to time. Bank regulations can hinder our ability to compete with financial services companies that are not regulated in the same manner or are less regulated.
Bank regulatory authorities have the authority to bring enforcement actions against banks and bank holding companies for unsafe or unsound practices in the conduct of their businesses or for violations of any law, rule or regulation, any condition imposed in writing by the appropriate bank regulatory agency or any written agreement with the authority.
Recent changes have created regulatory uncertainty.
Regulation of the financial services industry is undergoing major changes. The Dodd-Frank Act significantly revises and expands the rulemaking, supervisory and enforcement authority of federal bank regulators. Although the statute will have a greater impact on larger institutions than regional bank holding companies such as Sterling, many of its provisions will apply to us. Among other things, the Dodd-Frank Act:
| Ÿ | is changing the capital requirements for bank holding companies and would require less favorable capital treatment for future issuances of trust preferred (although our existing trust preferred are grandfathered and therefore not subject to the new rules); |
| Ÿ | raises prudential standards by requiring, for instance, annual internal stress testing and establishment of independent risk committees for banks with $10 billion or more in assets; |
| Ÿ | grants the FDIC back-up supervisory authority with respect to depository institution holding companies that engage in conduct that poses a foreseeable and material risk to the Deposit Insurance Fund, and heightens the Federal Reserve’s authority to examine, prescribe regulations and take action with respect to all subsidiaries of a bank holding company; |
| Ÿ | prohibits insured state-chartered banks from engaging in derivatives transactions unless the chartering state’s lending limit laws take into consideration credit exposure to derivative transactions; |
| Ÿ | specifies that a bank holding company may acquire control of an out-of-state bank only if it is well-capitalized and well-managed, and does not allow interstate merger transactions unless the resulting bank would be well-capitalized and well-managed after the transaction; |
| Ÿ | changes how the FDIC calculates deposit insurance assessments and effectively requires increases in deposit insurance fees that will be borne primarily by institutions with assets of greater than $10 billion; |
| TX33 |
Table of Contents
| Ÿ | subjects both large and small financial institutions to data and information gathering by a newly created Office of Financial Research; |
| Ÿ | requires retention of 5% of the credit risk in assets transferred, sold or conveyed through issuances of asset-backed securities, with the risk-retention obligation spread between securitizers and originators; |
| Ÿ | creates a new Consumer Bureau given rulemaking, examination and enforcement authority over consumer protection matters, imposes limits on debit card interchange fees that may be charged by card issuers with $10 billion or more in assets and contains provisions on mortgage-related matters such as steering incentives, determinations as to a borrowers’ ability to repay and prepayment penalties; and |
| Ÿ | mandates and allows certain changes regarding corporate governance and executive compensation such as shareholder proxy access for publicly traded banks’ director nominations, clawback of incentive-based compensation from executive officers and increased disclosure on compensation arrangements. |
Some of these changes are effective immediately, though most will be phased in gradually. In addition, the statute in many instances calls for future rulemaking to implement its provisions, so the precise contours of the law and its effects on us cannot yet be fully understood. The provisions of the Dodd-Frank Act and the subsequent exercise by regulators of their revised and expanded powers thereunder could materially impact the profitability of our business, the value of assets we hold or the collateral available for our loans, require changes to business practices or force us to discontinue businesses and expose us to additional costs, taxes, liabilities, enforcement actions and reputational risk. Legislators and regulators are also considering a wide range of proposals beyond the Dodd-Frank Act that, if enacted, could result in major changes to the way banking operations are regulated.
We may be subject to more stringent capital requirements.
As discussed above, the Dodd-Frank Act would require the federal banking agencies to establish stricter risk-based capital requirements and leverage limits to apply to banks and bank holding companies. In addition, the “Basel III” standards recently announced by the Basel Committee on Banking Supervision (the “Basel Committee”), if adopted, could lead to significantly higher capital requirements, higher capital charges and more restrictive leverage and liquidity ratios. The standards would, among other things, impose more restrictive eligibility requirements for Tier 1 and Tier 2 capital; increase the minimum Tier 1 common equity ratio to 4.5%, net of regulatory deductions, and introduce a capital conservation buffer of an additional 2.5% of common equity to risk-weighted assets, raising the target minimum common equity ratio to 7%; increase the minimum Tier 1 capital ratio to 8.5% inclusive of the capital conservation buffer; increase the minimum total capital ratio to 10.5% inclusive of the capital buffer; and introduce a countercyclical capital buffer of up to 2.5% of common equity or other fully loss absorbing capital for periods of excess credit growth. Basel III also introduces a non-risk adjusted Tier 1 leverage ratio of 3%, based on a measure of total exposure rather than total assets, and new liquidity standards.
The new Basel III capital standards will be phased in from January 1, 2013 until January 1, 2019, and it is not yet known how these standards will be implemented by U.S. regulators generally or how they will be applied to financial institutions of our size. Implementation of these standards, or any other new regulations, may adversely affect our ability to pay dividends, or require us to restrict growth or raise capital, including in ways that may adversely affect our results of operations or financial condition.
Difficult market conditions have adversely affected and may continue to have an adverse effect on our industry.
The capital and credit markets have been experiencing difficulty for more than three years. Dramatic declines in the housing market over the past three years, with falling home prices and increasing foreclosures, unemployment and under-employment, have had a negative impact on the performance of mortgage loans and have resulted in significant write-downs of asset values by financial institutions, including government-sponsored entities as well as major commercial and investment banks. These write-downs have caused many financial institutions to seek additional capital, to
| TX34 |
Table of Contents
merge with larger and stronger institutions and, in some cases, to fail. Reflecting concern about the stability of the financial markets generally and the strength of counterparties, many lenders and institutional investors have reduced or ceased providing funding to borrowers, including to other financial institutions. This market turmoil and tightening of credit have led to an increased level of commercial and consumer delinquencies, lack of consumer confidence, increased market volatility and widespread reduction of business activity generally. The resulting economic pressure on consumers and lack of confidence in the financial markets has adversely affected our business, financial condition and results of operations. We expect that the difficult conditions in the financial markets will improve only slowly in the near future. A worsening of these conditions would likely exacerbate the adverse effects of these difficult market conditions on us and others in the financial institutions industry. In particular, we may face the following risks in connection with these events:
| Ÿ | While increased regulation and enforcement is now certain in the financial sector, with increased compliance costs, the scope of such regulation is uncertain, and that uncertainty affects our business opportunities and plans. |
| Ÿ | Our ability to assess the creditworthiness of our customers may be impaired if the models and approaches we use to select, manage, and underwrite our customers become less predictive of future behaviors. |
| Ÿ | The process we use to estimate losses inherent in our loan portfolio requires difficult, subjective and complex judgments, including forecasts of economic conditions and how these economic predictions might impair the ability of our borrowers to repay their loans, which may no longer be capable of accurate estimation and may, in turn, have a negative impact on the reliability of the process. |
| Ÿ | The market value and trading volume of our common stock may be subject to increased volatility. |
| Ÿ | Our ability to engage in routine funding transactions could be adversely affected by the actions and commercial soundness of other financial institutions and government sponsored entities. |
| Ÿ | We may face increased competition due to intensified consolidation of the financial services industry. |
If a failure or slowing of the current modest recovery from recessionary conditions occurs, we may experience an adverse effect, which may be material, on our ability to access capital and on our business, financial condition and results of operations.
The value of our investment and MBS securities portfolio may be negatively affected by interest rate changes or disruptions in securities markets and we may realize losses on our investment securities in future periods.
The market for some of the investment securities held in our portfolio experienced extreme volatility over the past two years. Volatile market conditions may detrimentally affect the value of these securities, such as through reduced valuations due to the perception of heightened credit and liquidity risks. Declines in market value associated with these disruptions may result in other-than-temporary or permanent impairments of these assets, which would lead to accounting charges that could have a material adverse effect on our net income, capital levels and liquidity.
In addition, we held $201.1 million of municipal bonds as of December 31, 2010. The current economic downturn has impacted the credit worthiness of a number of municipalities. A continued or further decline in the economy could result in credit ratings downgrades for the municipalities that have issued the bonds held by us, which could negatively impact the value of the bonds.
A decline in the value of our FHLB common stock may occur, resulting in an other-than-temporary impairment charge which would cause our earnings and shareholders’ equity to decrease.
We own common stock of the FHLB in order to qualify for membership in the FHLB system, which enables us to borrow funds under the FHLB advance program. The carrying value of our FHLB common
| TX35 |
Table of Contents
stock was approximately $100 million as of December 31, 2010, the substantial majority of which was with the FHLB of Seattle. The FHLB Seattle has experienced losses from credit-related charges associated with projected losses on its investments in private-label mortgage-backed securities, and is currently unable to repurchase or redeem capital stock or to pay dividends. Consequently, for this and other reasons, there is a risk that our investment in the common stock of the FHLB could be deemed other than temporarily impaired at some time in the future, which would adversely affect our earnings, our shareholders’ equity and the value of our common stock.
As a bank holding company that conducts substantially all of our operations through our banking subsidiary, Sterling Savings Bank, our ability to pay dividends, repurchase our shares or to repay our indebtedness depends upon liquid assets held by the holding company and the results of operations of our subsidiary.
Sterling is a separate and distinct legal entity from its subsidiaries, and receives substantially all of its revenue from dividends paid by Sterling Savings Bank. There are legal limitations on the extent to which Sterling Savings Bank may extend credit, pay dividends or otherwise supply funds to, or engage in transactions with Sterling. A prolonged inability to receive dividends from Sterling Savings Bank would reduce liquidity available to Sterling, which could adversely affect Sterling’s financial condition.
Sterling’s net income depends primarily upon Sterling Savings Bank’s net interest income, which is the income that remains after deducting from total income generated by earning assets the expense attributable to the acquisition of the funds required to support earning assets (primarily interest paid on deposits). The amount of interest income is dependent on many factors including the volume of earning assets, the general level of interest rates, the dynamics of changes in interest rates and the levels of nonperforming loans. All of those factors affect our banking subsidiary’s ability to pay dividends to the holding company.
Various statutory provisions restrict the amount of dividends Sterling Savings Bank can pay to Sterling without regulatory approval. Sterling Savings Bank may not pay cash dividends if those payments could reduce the amount of its capital below that necessary to meet the “adequately capitalized” level in accordance with regulatory capital requirements. Sterling Savings Bank is also restricted from paying dividends to Sterling pursuant to the terms of the SSB MOU. It is also possible that, depending upon the financial condition of Sterling Savings Bank and other factors, regulatory authorities could assert that payment of dividends or other payments, including payments to us, is an unsafe or unsound practice. Under Washington banking law, Sterling Savings Bank may not pay a dividend greater than its retained earnings without WDFI approval.
We are currently subject to certain pending shareholder litigation and may be subject to similar claims in the future.
A securities class action lawsuit has been filed against Sterling and certain of our current and former officers alleging that the defendants violated sections 10(b) and 20(a) of the U.S. Exchange Act and SEC Rule 10b-5 by making false and misleading statements concerning our business and financial results. A shareholder derivative suit also has been filed against certain of our current and former officers and directors, and Sterling as a nominal defendant, alleging breaches of fiduciary duty, waste of corporate assets, and unjust enrichment. A class action lawsuit is also pending against Sterling, and certain current and former officers and directors of Sterling, alleging violations of ERISA, by breaching their fiduciary duties to participants in the Sterling Savings Bank Employee Savings and Investment Plan and Trust. These lawsuits are all premised on similar allegations that: 1) the defendants failed to adequately disclose the extent of Sterling’s delinquent commercial real estate, construction and land development loans, properly record losses for impaired loans, properly reserve for loan losses, and properly account for goodwill and deferred tax assets, thereby causing Sterling’s stock price to be artificially inflated during the purported class period; or 2) the defendants failed to prevent Sterling from issuing improper financial statements, maintain a sufficient allowance for loan and lease losses, and establish effective credit risk management and oversight mechanisms. It is possible that additional suits will be filed with respect to these same matters and also naming Sterling and/or its current and former officers and directors.
| TX36 |
Table of Contents
These lawsuits could divert the attention and resources of our management and cause us to incur significant expenses for legal fees and costs, including those associated with our advancement of fees and costs on behalf of our current and former officers and directors. We cannot predict the outcome of any of these lawsuits. Since the legal responsibility and financial impact with respect to these lawsuits and claims, if any, cannot currently be ascertained, we have not established any reserves for any potential liability relating to the lawsuits. An unfavorable outcome in any of these lawsuits could result in the payment of substantial damages in connection with a settlement or judgment and have a material adverse effect on our business, financial condition, results of operations or cash flows.
The financial services industry is highly competitive.
We face pricing competition for loans and deposits. We also face competition with respect to customer convenience, product lines, accessibility of service and service capabilities. Our most direct competition comes from other banks, brokerages, mortgage companies and savings institutions. We also face competition from credit unions, government-sponsored enterprises, mutual fund companies, insurance companies and other non-bank businesses. A number of these banks and other financial institutions are significantly larger than we are and have substantially greater access to capital and other resources, as well as larger lending limits and branch systems, and offer a wider array of banking services. Many of our nonbank competitors are not subject to the same extensive regulations that apply to financial institutions. As a result, these non-bank competitors have advantages over us in providing certain services. This significant competition in attracting and retaining deposits and making loans as well as in providing other financial services throughout our market area may have an adverse impact on future earnings and growth.
Our business is highly reliant on technology and our ability to manage the operational risks associated with technology and we are in the process of converting to a new core processing system.
We depend on internal and outsourced technology to support all aspects of our business operations. We expect to convert from the core processing system that is used to manage customer accounts to a processing system offered by another software vendor during the second quarter of 2011. Interruption or failure of these systems creates a risk of business loss as a result of adverse customer experiences, damage claims and civil fines. Risk management programs are expensive to maintain and will not protect us from all risks associated with maintaining the security of customer information, proprietary data, external and internal intrusions, disaster recovery and failures in the controls used by vendors.
Changes in accounting standards may have a material impact on how we report our financial condition and results of operations.
Our accounting policies and methods are fundamental to how we record and report our financial condition and results of operations. From time to time the Financial Accounting Standards Board changes the financial accounting and reporting standards that govern the preparation of our financial statements. These changes can be difficult to predict and can have a material impact on how we record and report our financial condition and results of operations. In some cases, we could be required to apply a new or revised standard retroactively, resulting in a restatement of prior period financial statements.
We may be required to repurchase mortgage loans in some circumstances, which could harm our liquidity, results of operations and financial condition.
When we sell mortgage loans, whether as whole loans or pursuant to a securitization, we are required to make certain representations and warranties to the purchaser about the mortgage loans and the manner in which they were originated. Our sales agreements on whole loans require us to repurchase or substitute mortgage loans in the event we breach any of these representations or warranties. In addition, we may be required to repurchase mortgage loans as a result of borrower fraud or in the event of early payment default of the borrower on a mortgage loan. Likewise, we are required to repurchase or substitute mortgage loans if we breach a representation or warranty in connection with our securitizations. The
| TX37 |
Table of Contents
remedies available to us against the originating broker or correspondent may not be as broad as the remedies available to a purchaser of mortgage loans against us, and we face the further risk that the originating broker or correspondent may not have the financial capacity to perform remedies that otherwise may be available to us. Therefore, if a purchaser enforces its remedies against us, we may not be able to recover our losses from the originating broker or correspondent. If repurchase and indemnity demands increase, our liquidity, results of operations and financial condition will be adversely affected.
Our operations could be interrupted if our third-party service providers experience difficulty, terminate their services or fail to comply with banking regulations.
We depend, and will continue to depend, to a significant extent, on a number of relationships with third-party service providers. Specifically, we receive core systems processing, essential web hosting and other Internet systems and deposit and other transaction processing services from third-party service providers. If these third-party service providers experience difficulties or terminate their services, and we are unable to replace them with other service providers, our operations could be interrupted. If an interruption were to continue for a significant period of time, our business, financial condition and results of operations could be materially adversely affected.
Our internal control systems could fail to detect certain events.
We are subject to certain operations risks, including but not limited to data processing system failures and errors and customer or employee fraud. We maintain a system of internal controls to mitigate against such occurrences and maintain insurance coverage for such risks, but should such an event occur that is not prevented or detected by our internal controls, uninsured or in excess of applicable insurance limits, it could have a significant adverse impact on our business, financial condition or results of operations.
The network and computer systems on which we depend could fail or experience a security breach.
Our computer systems could be vulnerable to unforeseen problems. Because we conduct part of our business over the Internet and outsource several critical functions to third parties, operations will depend on our ability, as well as the ability of third-party service providers, to protect computer systems and network infrastructure against damage from fire, power loss, telecommunications failure, physical break-ins or similar catastrophic events. Any damage or failure that causes interruptions in operations could have a material adverse effect on our business, financial condition and results of operations.
In addition, a significant barrier to online financial transactions is the secure transmission of confidential information over public networks. Our Internet banking system relies on encryption and authentication technology to provide the security and authentication necessary to effect secure transmission of confidential information. Advances in computer capabilities, new discoveries in the field of cryptography or other developments could result in a compromise or breach of the algorithms our third-party service providers use to protect customer transaction data. If any such compromise of security were to occur, it could have a material adverse effect on our business, financial condition and results of operations.
We could be held responsible for environmental liabilities of properties acquired through foreclosure.
If we are forced to foreclose on a defaulted mortgage loan to recover our investment, we may be subject to environmental liabilities related to the underlying real property. Hazardous substances or wastes, contaminants, pollutants or sources thereof may be discovered on properties during our ownership or after a sale to a third party. The amount of environmental liability could exceed the value of real property. We may be fully liable for the entire cost of any removal and clean-up on an acquired property, the cost of removal and clean-up may exceed the value of the property, and we may be unable to recover costs from any third party. In addition, we may find it difficult or impossible to sell the property prior to or following any environmental remediation.
| TX38 |
Table of Contents
Item 1B. Unresolved Staff Comments
Not applicable.
Sterling owns the building in which its headquarters are located in Spokane, Washington. As of December 31, 2010, Sterling also owned 101 of its 178 depository banking offices, while leasing the remainder of the properties. These facilities are located throughout Sterling’s banking network, primarily in the Pacific Northwest. Additionally, Sterling operates 33 non-depository loan production offices throughout the western United States, the majority of which are leased. See Note 6 of “Notes to Consolidated Financial Statements.”
| TX39 |
Table of Contents
Securities Class Action Litigation
On December 11, 2009, a putative securities class action was filed in the United States District Court for the Eastern District of Washington against Sterling and certain of our current and former officers. The Court appointed a lead plaintiff on March 8, 2010. On June 18, 2010, the lead plaintiff filed a consolidated complaint. The complaint alleges that the defendants violated sections 10(b) and 20(a) of the Securities Exchange Act of 1934 and SEC Rule 10b-5 by making false and misleading statements concerning our business and financial results. The complaint alleges that defendants failed to disclose the extent of Sterling’s delinquent construction loans, properly record losses for impaired loans, and properly reserve for loan losses. The complaint seeks, on behalf of persons who purchased our common stock during the period from July 23, 2008 to October 15, 2009, damages of an unspecified amount and attorneys’ fees and costs. On August 30, 2010, Sterling moved to dismiss the complaint. A hearing on the motion to dismiss occurred on March 2, 2011 and an order has not yet been issued. Failure by Sterling to obtain a favorable resolution of the claims set forth in the complaint could have a material adverse effect on our business, results of operations and financial condition. Currently, a loss resulting from these claims is not considered probable or estimable in amount.
ERISA Class Action Litigation
On January 20 and 22, 2010, two putative class action complaints were filed in the United States District Court for the Eastern District of Washington against Sterling Financial Corporation and Sterling Savings Bank (collectively, “Sterling”), as well as certain of Sterling’s current and former officers and directors. The two complaints were merged in a Consolidated Amended Complaint (the “Complaint”) filed on July 16, 2010 in the same court. The Complaint does not name all of individuals named in the prior complaints, but it is expected that additional defendants will be added. The Complaint alleges that the defendants breached their fiduciary duties under sections 404 and 405 of ERISA, with respect to the Sterling Savings Bank Employee Savings and Investment Plan (the “401(k) Plan”) and the FirstBank Northwest Employee Stock Ownership Plan (“ESOP”) (collectively, the “Plans”). Specifically, the Complaint alleges that the defendants breached their duties by investing assets of the Plans in Sterling’s securities when it was imprudent to do so, and by investing such assets in Sterling securities when defendants knew or should have known that the price of those securities was inflated due to misrepresentations and omissions about Sterling’s business practices. The business practices at issue include alleged over-reliance on risky construction loans; alleged inadequate loan reserves; alleged spiking increases in nonperforming assets, nonperforming loans, classified assets, and 90+-day delinquent loans; alleged inadequate accounting for rising loan payment shortfalls; alleged unsafe and unsound banking practices; and a capital base that was allegedly inadequate to withstand the significant deterioration in the real estate markets. The putative class periods are October 22, 2007 to the present for the 401(k) Plan class, and October 22, 2007 to November 14, 2008 for the ESOP class. The Complaint seeks damages of an unspecified amount and attorneys’ fees and costs. A hearing on the motion to dismiss is currently scheduled for March 22, 2011. Failure by Sterling to obtain a favorable resolution of the claims set forth in the Complaint could have a material adverse effect on Sterling’s business, results of operations, and financial condition. Currently, a loss resulting from these claims is not considered probable or estimable in amount.
Derivative Class Action Litigation
On February 10, 2010, a shareholder derivative action was filed in the Superior Court for Spokane County, Washington, allegedly on behalf of and for the benefit of Sterling, against certain of our current and former officers and directors. On August 2, 2010, an amended complaint was filed alleging, among other claims, breach of fiduciary duty, waste of corporate assets, and unjust enrichment. The amended complaint names Sterling as a nominal defendant. The complaint seeks unspecified damages, restitution, disgorgement of profits, equitable and injunctive relief, attorneys’ fees, costs, and expenses. The complaint alleges that the individual defendants failed to prevent Sterling from issuing improper financial statements,
| TX40 |
Table of Contents
maintain a sufficient allowance for loan and lease losses, and establish effective credit risk management and oversight mechanisms regarding Sterling’s construction loans, losses and reserves recorded for impaired loans, and accounting for goodwill and deferred tax assets. On September 13, 2010, Sterling moved to dismiss the complaint. A hearing on the motion to dismiss occurred on January 14, 2011, with the court indicating that it would deny the motion. An order has not yet been issued. Because the complaint is derivative in nature, it does not seek monetary damages from Sterling. However, Sterling may be required throughout the pendency of the action to advance the legal fees and costs incurred by the individual defendants and to incur other financial obligations, which could have a material adverse effect on our business, results of operations and financial condition. Currently, a loss resulting from these claims is not considered probable or estimable in amount.
| TX41 |
Table of Contents
| PART II |
Item 5. Market for Registrant’s Common Equity, Related Stockholder Matters and Issuer Purchases of Equity Securities
Stock Market and Dividend Information
Sterling’s common stock is listed on the NASDAQ Capital Market under the symbol “STSA.” As of January 31, 2011, Sterling’s common stock was held by 1,347 shareholders of record. On November 18, 2010, Sterling effected a 1-for-66 reverse stock split, as reflected at the open of trading on the following day. All prior per share amounts have been restated to reflect this split. The following table sets forth certain per share information for Sterling’s common stock for the periods indicated:
| 2010 Quarters Ended | ||||||||||||||||
| December 31 | September 30 | June 30 | March 31 | |||||||||||||
| Dividends declared per common share |
$ | 0.00 | $ | 0.00 | $ | 0.00 | $ | 0.00 | ||||||||
| Dividends paid per common share |
0.00 | 0.00 | 0.00 | 0.00 | ||||||||||||
| Market price per share: |
||||||||||||||||
| High |
46.20 | 49.50 | 133.99 | 61.39 | ||||||||||||
| Low |
14.85 | 32.34 | 30.36 | 28.38 | ||||||||||||
| Quarter end |
18.97 | 42.90 | 36.30 | 37.62 | ||||||||||||
| 2009 Quarters Ended | ||||||||||||||||
| December 31 | September 30 | June 30 | March 31 | |||||||||||||
| Dividends declared per common share |
$ | 0.00 | $ | 0.00 | $ | 0.00 | $ | 0.00 | ||||||||
| Dividends paid per common share |
0.00 | 0.00 | 0.00 | 0.00 | ||||||||||||
| Market price per share: |
||||||||||||||||
| High |
132.01 | 236.96 | 339.93 | 605.94 | ||||||||||||
| Low |
32.35 | 126.07 | 132.01 | 66.01 | ||||||||||||
| Quarter end |
40.92 | 132.01 | 192.08 | 136.63 | ||||||||||||
The board of directors of Sterling from time to time evaluates the payment of cash dividends. The timing and amount of any future dividends will depend upon earnings, cash and capital requirements, the financial condition of Sterling and its subsidiaries, applicable government regulations and other factors deemed relevant by Sterling’s board of directors. Currently, Sterling is not to pay cash dividends or make any other payments or distributions representing a reduction of Sterling Savings Bank capital without the prior written consent from its regulators. During the third quarter of 2009, Sterling elected to defer regularly scheduled interest payments on its junior subordinated debentures. Sterling is allowed to defer payments of interest on the junior subordinated debentures for up to 20 consecutive quarterly periods without triggering an event of default. As of December 31, 2010 and 2009, the accrued deferred interest was $9.4 million and $3.4 million, respectively. Sterling is precluded from paying dividends on its common stock without first paying the accrued interest on these junior subordinated debentures. Pursuant to the terms of the Treasury Exchange, subject to certain exceptions, Sterling will be unable to pay cash dividends on its common stock without the Treasury’s consent until the earlier of December 5, 2011, or such time as the Treasury ceases to own any debt or equity securities acquired pursuant to the Exchange Agreement or the Treasury Warrant.
Information concerning securities authorized for issuance under equity compensation plans is set forth under the caption “Equity Compensation Plan Information” in Sterling’s Proxy Statement and is incorporated herein by reference.
| TX42 |
Table of Contents
Performance Graph
The following graph, which is “furnished,” not “filed,” compares the cumulative return of our common stock during the five years ended December 31, 2010, with the Russell 2000 Index and the SNL Bank NASDAQ Index. The presentation assumes an initial investment of $100 and the reinvestment of dividends.
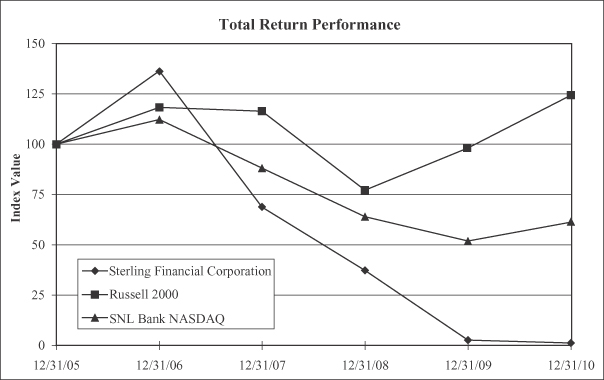
| TX43 |
Table of Contents
Item 6. Selected Financial Data
The following selected financial data is derived from Sterling’s audited financial statements. Comparability among particular amounts may be affected by past acquisitions:
| Years Ended December 31, | ||||||||||||||||||||
| 2010 | 2009 | 2008 | 2007 | 2006 | ||||||||||||||||
| (Dollars in thousands, except per share amounts) | ||||||||||||||||||||
| Income Statement Data: |
||||||||||||||||||||
| Interest income |
$ | 445,133 | $ | 599,347 | $ | 715,062 | $ | 766,978 | $ | 550,855 | ||||||||||
| Interest expense |
161,106 | 255,370 | 355,510 | 411,618 | 286,943 | |||||||||||||||
| Net interest income |
284,027 | 343,977 | 359,552 | 355,360 | 263,912 | |||||||||||||||
| Provision for credit losses |
250,229 | 681,371 | 333,597 | 25,088 | 18,703 | |||||||||||||||
| Net interest income after provision for credit losses |
33,798 | (337,394 | ) | 25,955 | 330,272 | 245,209 | ||||||||||||||
| Noninterest income |
136,965 | 123,814 | 91,895 | 93,406 | 69,164 | |||||||||||||||
| Noninterest expense |
395,045 | 369,974 | 305,517 | 285,465 | 206,197 | |||||||||||||||
| Goodwill impairment |
0 | 227,558 | 223,765 | 0 | 0 | |||||||||||||||
| Total noninterest expense |
395,045 | 597,532 | 529,282 | 285,465 | 206,197 | |||||||||||||||
| (Loss) income before income taxes |
(224,282 | ) | (811,112 | ) | (411,432 | ) | 138,213 | 108,176 | ||||||||||||
| Income tax (provision) benefit |
0 | (26,982 | ) | 75,898 | (44,924 | ) | (34,230 | ) | ||||||||||||
| Net (loss) income |
(224,282 | ) | (838,094 | ) | (335,534 | ) | 93,289 | 73,946 | ||||||||||||
| Preferred stock dividend |
(11,598 | ) | (17,369 | ) | (1,208 | ) | 0 | 0 | ||||||||||||
| Other shareholder allocations (1) |
(520,263 | ) | 0 | 0 | 0 | 0 | ||||||||||||||
| Net (loss) income applicable to common shareholders |
$ | (756,143 | ) | $ | (855,463 | ) | $ | (336,742 | ) | $ | 93,289 | $ | 73,946 | |||||||
| (Loss) earnings per common share: |
||||||||||||||||||||
| Basic (2) |
$ | (53.05 | ) | $ | (1,087.41 | ) | $ | (429.70 | ) | $ | 123.67 | $ | 133.99 | |||||||
| Diluted (2) |
(53.05 | ) | (1,087.41 | ) | (429.70 | ) | 122.61 | 132.47 | ||||||||||||
| Dividends declared per common share (2) |
$ | 0.00 | $ | 0.00 | $ | 19.80 | $ | 23.10 | $ | 17.82 | ||||||||||
| Weighted average shares outstanding: |
||||||||||||||||||||
| Basic (2) |
14,253,869 | 786,701 | 783,662 | 754,339 | 551,865 | |||||||||||||||
| Diluted (2) |
14,253,869 | 786,701 | 783,662 | 760,871 | 558,210 | |||||||||||||||
| Other Data: |
||||||||||||||||||||
| Book value per common share (2) |
$ | 12.45 | $ | 36.80 | $ | 1,075.14 | $ | 1,520.64 | $ | 1,229.58 | ||||||||||
| Tangible book value per common share (2) |
$ | 12.17 | $ | 9.21 | $ | 752.98 | $ | 898.26 | $ | 796.62 | ||||||||||
| Return on average assets |
-2.21 | % | -6.81 | % | -2.65 | % | 0.83 | % | 0.88 | % | ||||||||||
| Return on average common equity |
-297.2 | % | -129.8 | % | -28.8 | % | 8.6 | % | 13.0 | % | ||||||||||
| Dividend payout ratio |
0 | % | 0 | % | -5 | % | 19 | % | 13 | % | ||||||||||
| Shareholders’ equity to total assets |
8.1 | % | 3.0 | % | 8.9 | % | 9.8 | % | 8.0 | % | ||||||||||
| Tangible common equity to tangible assets |
8.0 | % | 0.1 | % | 4.7 | % | 6.0 | % | 5.3 | % | ||||||||||
| Operating efficiency |
93.8 | % | 127.7 | % | 117.2 | % | 63.6 | % | 61.9 | % | ||||||||||
| Tax equivalent net interest margin |
2.83 | % | 2.92 | % | 3.08 | % | 3.42 | % | 3.33 | % | ||||||||||
| Nonperforming assets to total assets |
8.83 | % | 9.08 | % | 4.77 | % | 1.11 | % | 0.13 | % | ||||||||||
| Employees (full-time equivalents) |
2,498 | 2,641 | 2,481 | 2,571 | 2,405 | |||||||||||||||
| Depository branches |
178 | 178 | 178 | 178 | 166 | |||||||||||||||
| (1) | The August 26, 2010 conversion of Series C preferred stock into common stock resulted in an increase in income available to common shareholders. The October 22, 2010 conversion of Series B and D preferred stock into common stock resulted in a decrease in income available to common shareholders. |
| (2) | Reflects the 1-for-66 reverse stock split in November 2010. |
| TX44 |
Table of Contents
Item 6. Selected Financial Data (continued)
| December 31, | ||||||||||||||||||||
| 2010 | 2009 | 2008 | 2007 | 2006 | ||||||||||||||||
| (Dollars in thousands) | ||||||||||||||||||||
| Balance Sheet Data: |
||||||||||||||||||||
| Total assets |
$ | 9,493,169 | $ | 10,877,423 | $ | 12,790,716 | $ | 12,149,775 | $ | 9,834,492 | ||||||||||
| Loans receivable, net |
5,379,081 | 7,344,199 | 8,807,094 | 8,948,307 | 7,021,241 | |||||||||||||||
| Investments and MBS—available for sale |
2,825,010 | 2,160,325 | 2,639,290 | 1,853,271 | 1,728,686 | |||||||||||||||
| Investments—held to maturity |
13,464 | 17,646 | 175,830 | 132,793 | 93,063 | |||||||||||||||
| Deposits |
6,911,007 | 7,775,190 | 8,350,407 | 7,677,772 | 6,746,028 | |||||||||||||||
| FHLB advances |
407,211 | 1,337,167 | 1,726,549 | 1,687,989 | 1,308,617 | |||||||||||||||
| Reverse repurchase agreements and funds purchased |
1,032,512 | 1,049,146 | 1,163,023 | 1,178,845 | 616,354 | |||||||||||||||
| Other borrowings |
245,285 | 248,281 | 248,276 | 273,015 | 240,226 | |||||||||||||||
| Shareholders’ equity |
770,767 | 323,249 | 1,141,036 | 1,185,330 | 783,416 | |||||||||||||||
| Regulatory Capital Ratios: |
||||||||||||||||||||
| Tier 1 leverage ratio: |
||||||||||||||||||||
| Sterling |
10.1 | % | 3.5 | % | 9.2 | % | 8.7 | % | 8.7 | % | ||||||||||
| Sterling Savings Bank |
9.8 | % | 4.2 | % | 8.3 | % | 8.5 | % | 8.6 | % | ||||||||||
| Tier 1 risk-based capital ratio: |
||||||||||||||||||||
| Sterling |
16.2 | % | 4.9 | % | 11.7 | % | 10.1 | % | 10.0 | % | ||||||||||
| Sterling Savings Bank |
15.7 | % | 5.9 | % | 10.6 | % | 9.8 | % | 9.7 | % | ||||||||||
| Total risk-based capital ratio: |
||||||||||||||||||||
| Sterling |
17.5 | % | 7.9 | % | 13.0 | % | 11.3 | % | 11.1 | % | ||||||||||
| Sterling Savings Bank |
17.0 | % | 7.3 | % | 11.8 | % | 11.0 | % | 10.8 | % | ||||||||||
| TX45 |
Table of Contents
Item 7. Management’s Discussion and Analysis of Financial Condition and Results of Operations
The following discussion and analysis should be read in conjunction with the Consolidated Financial Statements and Notes thereto presented elsewhere in this report. This report contains forward-looking statements within the meaning of the Private Securities Litigation Reform Act of 1995. For a discussion of the risks and uncertainties inherent in such statements, see “Business—Forward-Looking Statements” and “Risk Factors.”
Executive Summary and Highlights
Sterling recorded a net loss of $224.3 million for the year ended December 31, 2010 compared with a net loss of $838.1 million for the year ended December 31, 2009. The results for 2010 included a provision for credit losses of $250.2 million. In addition, Sterling recorded a $90.0 million increase in the allowance against the deferred tax asset, which resulted in Sterling not recognizing an income tax benefit during 2010. By comparison, 2009 results included a provision for credit losses of $681.4 million and an initial allowance against the deferred tax asset of $269.0 million. The 2009 results also included a non-cash goodwill impairment charge of $227.6 million. Earnings per common share for 2010 included two separate non-cash items related to the Recapitalization Transaction. The August 26, 2010 conversion of Series C preferred stock into common stock resulted in an increase of $84.3 million in income available to common shareholders. The October 22, 2010 conversion of Series B and D preferred stock into common stock resulted in a decrease of $604.6 million in income available to common shareholders. Net interest income was down year over year, mostly due to a lower amount of interest earned on loans, which was partially offset by lower funding costs.
During the year ended December 31, 2010, Sterling raised $730 million of equity capital, the Treasury preferred stock was converted into common stock, and the cease and desist order issued by the FDIC and WDFI was terminated and replaced by the SSB MOU. See “—Regulatory Agreements.” Key financial measures for the year include:
| Ÿ | Tier 1 leverage ratio was 10.1% at December 31, 2010, compared to 3.5% at December 31, 2009. |
| Ÿ | Non-performing loans declined to $654.6 million at December 31, 2010, compared to $895.9 million at December 31, 2009. |
| Ÿ | Allowance for credit losses to total loans was 4.58% at December 31, 2010, compared with 4.62% at December 31, 2009. |
| Ÿ | Construction loan exposure decreased 65% to $525.7 million from the $1.52 billion at December 31, 2009. |
| Ÿ | Deposit funding costs decreased to 1.31% for 2010, which was 73 basis points below the 2009 level. |
Sterling’s accounting and reporting policies conform to generally accepted accounting principles (“GAAP”) and to general practices within the banking industry. The preparation of the financial statements in accordance with GAAP requires management to make estimates and assumptions that affect the amounts reported in the financial statements and accompanying notes. Actual results could differ from those estimates. Sterling’s management has identified the accounting policies described below as those that, due to the judgments, estimates and assumptions inherent in those policies are critical to an understanding of Sterling’s Consolidated Financial Statements and MD&A.
Income Recognition. Sterling recognizes interest income according to general accounting practices within the banking industry. In the event management believes collection of all or a portion of contractual interest on a loan has become doubtful, which generally occurs when the loan is 90 days past due or when Sterling restructures a troubled loan, Sterling discontinues the accrual of interest, and any previously accrued interest recognized in income deemed uncollectible is reversed. Interest received on nonperforming loans is included in income only if principal recovery is reasonably assured. A nonperforming loan is restored to accrual status when it is brought current, has performed according to contractual terms for a reasonable period of time, generally six months, and the collectability of the total contractual principal and interest is no longer in doubt.
| TX46 |
Table of Contents
Allowance for Credit Losses. The allowance for credit losses is comprised of the allowance for loan losses and the reserve for unfunded credit commitments. In general, determining the amount of the allowance requires significant judgment and the use of estimates by management. Sterling maintains an allowance for credit losses to absorb probable losses in the loan portfolio based on a quarterly analysis of the portfolio and expected future losses. This analysis is designed to determine an appropriate level and allocation of the allowance for losses among loan types by considering factors affecting loan losses, including specific and confirmed losses, levels and trends in classified and nonperforming loans, historical loan loss experience, loan migration analysis, current national and local economic conditions, volume, growth and composition of the portfolio, regulatory guidance and other relevant factors. Management monitors the loan portfolio to evaluate the adequacy of the allowance. The allowance can increase or decrease each quarter based upon the results of management’s analysis.
The portfolio is grouped into standard industry categories for homogeneous loans based on characteristics such as loan type, borrower and collateral. Annual and quarterly loan migration to loss data is used to determine the probability of default. Currently, Sterling is establishing the expected loss rate on loans using losses from the most recent 12 months to estimate the amount that would be lost if a default were to occur, which is termed the “loss given default.” The probability of default is multiplied by the loss given default to calculate the expected losses for each loan category.
Sterling may also maintain an unallocated allowance to provide for other credit losses that may exist in the loan portfolio that are not taken into consideration in establishing the probability of default and loss given default. The unallocated amount may generally be maintained at higher levels during times of economic uncertainty. The unallocated amount is reviewed at least quarterly based on credit and economic trends. As of December 31, 2010, the unallocated allowance was 13% of the allowance for loan losses.
Individual loan reviews are based upon specific quantitative and qualitative criteria, including the size of the loan, loan quality ratings, value of collateral, repayment ability of borrowers and guarantors, as applicable, and historical experience factors. The historical experience factors utilized and allowances for homogeneous loans (such as residential mortgage loans, consumer loans, etc.) are collectively evaluated based upon historical loss experience, loan migration analysis, trends in losses and delinquencies, growth of loans in particular markets, and known changes in economic conditions in each particular lending market.
A loan is considered impaired when, based on current information and events, it is probable Sterling will be unable to collect the scheduled payments of principal and interest when due according to the contractual terms of the loan agreement. Factors considered by management in determining impairment include payment status, collateral value and the probability of collecting scheduled principal and interest payments when due. Loans that experience insignificant payment delays and payment shortfalls generally are not classified as impaired. Management determines the significance of payment delays and payment shortfalls on a case-by-case basis, taking into consideration all of the circumstances surrounding the loan and the borrower, including the length of delay, the reasons for the delay, the borrower’s prior payment record, the ability and willingness of guarantors, and the amount of the shortfall in relation to the principal and interest owed. Impairment is measured on a loan-by-loan basis by either the present value of expected future cash flows discounted at the loan’s effective interest rate, the loan’s obtainable market price or the fair value of collateral if the loan is collateral dependent.
The fair value of the underlying collateral for real estate loans, which may or may not be collateral dependent, is determined by using appraisals from qualified external sources. For commercial properties and residential development loans, the external appraisals are reviewed by qualified internal appraisal staff to ensure compliance with appropriate standards and technical accuracy. Appraisals are updated according to regulatory provisions for extensions or restructurings of commercial or residential real estate construction and permanent loans that have not performed within the terms of the original loan. Updated appraisals are also ordered for loans that have not
| TX47 |
Table of Contents
been restructured, but that have stale valuation information, generally defined in the current market as information older than one year, and deteriorating credit quality that warrants classification as substandard.
The timing of obtaining appraisals may vary, depending on the nature and complexity of the property being evaluated and the general breadth of appraisal activity in the marketplace, but generally it is within 30 to 90 days of recognition of substandard status, following determination of collateral dependency, or in connection with a loan’s maturity or a negotiation that may result in the restructuring or extension of a real estate secured loan. Delays in timing may occur to comply with actions such as a bankruptcy filing or provisions of an SBA guarantee.
Estimates of fair value may be used for substandard collateral dependent loans at quarter end if external appraisals are not expected to be completed in time for determining quarter end results or to update values between appraisal dates to reflect recent sales activity of comparable inventory or pending property sales of the subject collateral. Sterling records a specific reserve for impaired loans for which an updated valuation analysis has not been completed within the last quarter. The specific reserve is calculated by applying an estimated fair value adjustment to each loan based on market and property type. Estimates of value are not used to raise a value; however, estimates may be used to recognize deterioration of market values in quarters between appraisal updates. The judgment with respect to recognition of any provision or related charge-off for a confirmed loss also takes into consideration whether the loan is collateral dependent or whether it is supported by sources of repayment or cash flow beyond the collateral that is being valued. For loans that are deemed to be collateral dependent, the amount of charge-offs is determined in relation to the collateral’s appraised value. For loans that are not deemed to be collateral dependent, the amount of charge-offs may differ from the collateral’s appraised value because there is additional support for the loan, such as cash flow from other sources.
While management uses available information to provide for loan losses, the ultimate collectability of a substantial portion of the loan portfolio and the need for future additions to the allowance will be influenced by changes in economic conditions and other relevant factors. There can be no assurance that the allowance for credit losses will be adequate to cover all losses, but management believes the allowance for credit losses was adequate at December 31, 2010.
Investments and MBS. Assets in the investment and MBS portfolios are initially recorded at cost, which includes any premiums and discounts. Sterling amortizes premiums and discounts as an adjustment to interest income over the estimated life of the security. The cost of investment securities sold, and any resulting gain or loss, is based on the specific identification method. Sterling’s MBS are primarily in agency securities, with limited investments in non-agency obligations. The majority of the municipal bonds that Sterling holds are general obligation bonds, spread throughout Sterling’s footprint. Sterling does not invest in collateralized debt obligations or similar exotic structured investment products.
The loans underlying Sterling’s MBS are subject to the prepayment of principal. The rate at which prepayments are expected to occur in future periods impacts the amount of premium to be amortized in the current period. If prepayments in a future period are higher or lower than expected, then Sterling will need to amortize a larger or smaller amount of the premium to interest income in that future period.
Management determines the appropriate classification of investment securities at the time of purchase. Held-to-maturity securities are those securities that Sterling has the positive intent and ability to hold to maturity and are recorded at amortized cost. Available-for-sale securities are those securities that would be available to be sold in the future in response to Sterling’s liquidity needs, changes in market interest rates, and asset-liability management strategies, among other factors. Available-for-sale securities are reported at fair value, with unrealized holding gains and losses reported in shareholders’ equity as a separate component of other comprehensive income, net of applicable deferred income taxes.
Management evaluates investment securities for other than temporary declines in fair value on a quarterly basis. If the fair value of investment securities falls below their amortized cost and the decline is deemed to be other than temporary, the
| TX48 |
Table of Contents
securities will be written down to current market value, resulting in a loss. There were no investment securities that management identified to be other than-temporarily impaired at December 31, 2010, because the decline in fair value of certain classes of securities was attributable to temporary disruptions of credit markets and the related impact on securities within those classes, not deteriorating credit quality of specific securities. As of December 31, 2010, Sterling expects the return of all principal and interest on all securities within its investment and MBS portfolio pursuant to the contractual terms, has the ability and intent to hold these investments, has no intent to sell securities that are deemed to have a market value impairment, and believes it is unlikely that it would be required to sell these investments before a recovery in market price occurs, or until maturity. Realized losses could occur in future periods due to a change in management’s intent to hold the investments to recovery, a change in management’s assessment of credit risk, or a change in regulatory or accounting requirements.
Fair Value of Financial Instruments. Sterling’s available-for-sale securities portfolio totaled $2.83 billion and $2.16 billion as of December 31, 2010 and 2009, respectively, and were the majority of Sterling’s financial instruments that are carried at fair value. These securities are valued using a third party pricing service’s matrix technique based on quoted prices for similar instruments, which Sterling validates with non-binding broker quotes, in depth collateral analysis and cash flow stress testing.
Loans held for sale are also carried at fair value in order to match changes in the value of the loans with the value of the economic hedges on the loans without having to apply complex hedge accounting. The fair value of loans held for sale is determined based upon an analysis of investor quoted pricing inputs.
Other Real Estate Owned. Prior to foreclosure, Sterling considers all viable alternatives, checks with the proper authorities to ensure the existence of a valid and recorded lien on the property and determines the current market value of the collateral. Property and other assets acquired through foreclosure of defaulted mortgage or other collateralized loans are carried at fair value, less estimated costs to sell the property and other assets. The fair value of OREO is generally determined using “as is” or disposition values from appraisals obtained by independent appraisers.
An allowance for losses on OREO is designed to include amounts for estimated losses as a result of impairment in value of the real property after repossession. Sterling reviews its OREO for impairment in value at least quarterly or whenever events or circumstances indicate that the carrying value of the property or other assets may not be recoverable. In performing the review, if the fair value, less selling costs, is less than its carrying value, an impairment loss is recognized as a charge to operating expenses.
Income Taxes. Sterling estimates income taxes payable based on the amount it expects to owe various taxing authorities. Accrued income taxes represent the net estimated amount due to, or to be received from, taxing authorities. In estimating accrued income taxes, Sterling assesses the relative merits and risks of the appropriate tax treatment of transactions, taking into account the applicable statutory, judicial and regulatory guidance in the context of Sterling’s tax position. Sterling also considers recent audits and examinations, as well as its historical experience in making such estimates. Although Sterling uses available information to record income taxes, underlying estimates and assumptions can change over time as a result of unanticipated events or circumstances. Penalties and interest associated with any potential estimate variances would be included in income tax expense on the Consolidated Statement of Income.
Sterling estimates future earnings, and evaluates its loss carryback ability and tax planning strategies to determine whether or not the benefit of its net deferred tax asset will be realized. Sterling assesses whether it is more likely than not that it will realize the benefits of its deferred tax asset. During the year ended December 31, 2010, Sterling did not recognize any tax benefit for losses incurred.
The most significant component of earnings for a financial institution typically is net interest income, which is the difference between interest income, primarily from loans, MBS and investment securities portfolios, and interest expense, primarily on deposits and borrowings. Net interest spread refers to the difference between the yield on interest-earning assets and the rate paid on interest-bearing liabilities. Net interest margin refers to net interest income divided by total average interest-earning assets and is influenced by the level and relative mix of interest-earning assets and interest-bearing liabilities.
| TX49 |
Table of Contents
The following table sets forth, on a tax equivalent basis, information with regard to Sterling’s net interest income, net interest spread and net interest margin:
| Years Ended December 31, | ||||||||||||||||||||||||||||||||||||
| 2010 | 2009 | 2008 | ||||||||||||||||||||||||||||||||||
| Average Balance |
Income/ Expense |
Average Yield/ Rate |
Average Balance |
Income/ Expense |
Average Yield/ Rate |
Average Balance |
Income/ Expense |
Average Yield/ Rate |
||||||||||||||||||||||||||||
| (Dollars in thousands) | ||||||||||||||||||||||||||||||||||||
| ASSETS: |
||||||||||||||||||||||||||||||||||||
| Loans: |
||||||||||||||||||||||||||||||||||||
| Mortgage |
$ | 4,188,338 | $ | 185,214 | 4.42 | % | $ | 5,321,761 | $ | 266,150 | 5.00 | % | $ | 5,501,102 | $ | 350,718 | 6.38 | % | ||||||||||||||||||
| Commercial and consumer |
2,951,479 | 174,896 | 5.93 | % | 3,685,058 | 213,828 | 5.80 | % | 3,850,263 | 249,020 | 6.47 | % | ||||||||||||||||||||||||
| Total loans (1) |
7,139,817 | 360,110 | 5.04 | % | 9,006,819 | 479,978 | 5.33 | % | 9,351,365 | 599,738 | 6.41 | % | ||||||||||||||||||||||||
| MBS (2) |
2,004,864 | 74,806 | 3.73 | % | 2,310,582 | 108,513 | 4.70 | % | 2,051,882 | 102,863 | 5.01 | % | ||||||||||||||||||||||||
| Investments and cash (2) |
965,615 | 15,005 | 1.55 | % | 530,479 | 15,647 | 2.95 | % | 324,172 | 16,660 | 5.14 | % | ||||||||||||||||||||||||
| FHLB stock |
100,409 | 0 | 0.00 | % | 100,565 | 0 | 0.00 | % | 99,196 | 0 | 0.00 | % | ||||||||||||||||||||||||
| Total interest-earning assets |
10,210,705 | 449,921 | 4.41 | % | 11,948,445 | 604,138 | 5.06 | % | 11,826,615 | 719,261 | 6.08 | % | ||||||||||||||||||||||||
| Noninterest-earning assets (3) |
(42,376 | ) | 357,766 | 841,147 | ||||||||||||||||||||||||||||||||
| Total average assets |
$ | 10,168,329 | $ | 12,306,211 | $ | 12,667,762 | ||||||||||||||||||||||||||||||
| LIABILITIES and EQUITY: |
||||||||||||||||||||||||||||||||||||
| Deposits: |
||||||||||||||||||||||||||||||||||||
| Interest-bearing deposits |
$ | 809,351 | 1,918 | 0.24 | % | $ | 844,154 | 2,534 | 0.30 | % | $ | 441,708 | 1,372 | 0.31 | % | |||||||||||||||||||||
| Savings and MMDA |
1,656,816 | 10,180 | 0.61 | % | 1,758,678 | 15,941 | 0.91 | % | 2,173,133 | 46,231 | 2.13 | % | ||||||||||||||||||||||||
| Time deposits |
3,774,891 | 82,609 | 2.19 | % | 4,718,946 | 150,786 | 3.20 | % | 4,553,160 | 186,734 | 4.10 | % | ||||||||||||||||||||||||
| Total deposits |
6,241,058 | 94,707 | 1.52 | % | 7,321,778 | 169,261 | 2.31 | % | 7,168,001 | 234,337 | 3.27 | % | ||||||||||||||||||||||||
| Borrowings |
2,309,294 | 66,399 | 2.88 | % | 2,893,477 | 86,109 | 2.98 | % | 3,292,287 | 121,173 | 3.68 | % | ||||||||||||||||||||||||
| Total interest-bearing liabilities |
8,550,352 | 161,106 | 1.88 | % | 10,215,255 | 255,370 | 2.50 | % | 10,460,288 | 355,510 | 3.40 | % | ||||||||||||||||||||||||
| Noninterest-bearing deposits (4) |
999,857 | 980,021 | 880,224 | |||||||||||||||||||||||||||||||||
| Other noninterest-bearing liabilities |
172,338 | 158,666 | 136,082 | |||||||||||||||||||||||||||||||||
| Total average liabilities |
9,722,547 | 11,353,942 | 11,476,594 | |||||||||||||||||||||||||||||||||
| Total average shareholders’ equity |
445,782 | 952,269 | 1,191,168 | |||||||||||||||||||||||||||||||||
| Total average liabilities and equity |
$ | 10,168,329 | $ | 12,306,211 | $ | 12,667,762 | ||||||||||||||||||||||||||||||
| Tax equivalent net interest spread (5) |
$ | 288,815 | 2.52 | % | $ | 348,768 | 2.56 | % | $ | 363,751 | 2.68 | % | ||||||||||||||||||||||||
| Tax equivalent net interest margin (5) |
2.83 | % | 2.92 | % | 3.08 | % | ||||||||||||||||||||||||||||||
| TX50 |
Table of Contents
| (1) | Includes gross nonaccrual loans. |
| (2) | Does not include market value adjustments on available for sale securities that are included in accumulated other comprehensive income. |
| (3) | Includes charge-offs on nonperforming loans (“confirmed losses”) and the allowance for credit losses. |
| (4) | Total average cost of borrowed funds, which includes noninterest-bearing deposits, for 2010 was 1.69%, compared with 2.28% in 2009, and 3.13% in 2008. |
| (5) | Interest income on certain loans and securities are presented gross of their applicable tax savings using a 37% effective tax rate. |
Changes in Sterling’s net interest income are a function of changes in both rates and volumes of interest-earning assets and interest-bearing liabilities. Volume refers to the dollar level of interest-earning assets and interest-bearing liabilities. The following table presents the composition of the change in net interest income, on a tax equivalent basis, for the periods presented. Interest income from municipal loans and bonds is presented gross of applicable tax savings. For each category of interest-earning assets and interest-bearing liabilities, the following table provides information on changes attributable to:
| Ÿ | Volume—changes in volume multiplied by comparative period rate; |
| Ÿ | Rate—changes in rate multiplied by comparative period volume; and |
| Ÿ | Rate/volume—changes in rate multiplied by changes in volume. |
| December 31, 2010 | December 31, 2009 | |||||||||||||||||||||||||||||||
| Increase (Decrease) Due to: | Increase (Decrease) Due to: | |||||||||||||||||||||||||||||||
| Volume | Rate | Rate/ Volume |
Total | Volume | Rate | Rate/ Volume |
Total | |||||||||||||||||||||||||
| (Dollars in thousands) | ||||||||||||||||||||||||||||||||
| Interest income: |
||||||||||||||||||||||||||||||||
| Loans: |
||||||||||||||||||||||||||||||||
| Mortgage |
$ | (47,525 | ) | $ | (54,422 | ) | $ | 21,005 | $ | (80,942 | ) | $ | (2,649 | ) | $ | (19,334 | ) | $ | (62,587 | ) | $ | (84,570 | ) | |||||||||
| Commercial and consumer |
(42,783 | ) | 4,767 | (909 | ) | (38,925 | ) | (2,740 | ) | (5,258 | ) | (27,193 | ) | (35,191 | ) | |||||||||||||||||
| Total loans |
(90,308 | ) | (49,655 | ) | 20,096 | (119,867 | ) | (5,389 | ) | (24,592 | ) | (89,780 | ) | (119,761 | ) | |||||||||||||||||
| MBS |
(12,157 | ) | (24,269 | ) | 2,719 | (33,707 | ) | 3,269 | (1,638 | ) | 4,020 | 5,651 | ||||||||||||||||||||
| Investment and cash equivalents |
9,496 | (5,531 | ) | (4,608 | ) | (643 | ) | 1,212 | (840 | ) | (1,385 | ) | (1,013 | ) | ||||||||||||||||||
| Total interest income |
(92,969 | ) | (79,455 | ) | 18,207 | (154,217 | ) | (908 | ) | (27,070 | ) | (87,145 | ) | (115,123 | ) | |||||||||||||||||
| Interest expense: |
||||||||||||||||||||||||||||||||
| Deposits |
(31,137 | ) | (53,233 | ) | 9,816 | (74,554 | ) | (2,239 | ) | (16,496 | ) | (46,340 | ) | (65,075 | ) | |||||||||||||||||
| Borrowings |
(17,737 | ) | 4,240 | (6,213 | ) | (19,710 | ) | (4,538 | ) | (4,932 | ) | (25,595 | ) | (35,065 | ) | |||||||||||||||||
| Total interest expense |
(48,874 | ) | (48,993 | ) | 3,603 | (94,264 | ) | (6,777 | ) | (21,428 | ) | (71,935 | ) | (100,140 | ) | |||||||||||||||||
| Changes in net interest income on a tax equivalent basis |
$ | (44,095 | ) | $ | (30,462 | ) | $ | 14,604 | $ | (59,953 | ) | $ | 5,869 | $ | (5,642 | ) | $ | (15,210 | ) | $ | (14,983 | ) | ||||||||||
2010 versus 2009
Net Interest Income. Net interest income for the year ended December 31, 2010 declined by 17% compared with the level during the year ended December 31, 2009, mainly due to a 25% decrease in interest income on loans. The decline in interest income on loans reflected a decline in average loan balances, and an increase in the amount of interest income reversed on nonperforming loans. Average
| TX51 |
Table of Contents
loan balances declined by 21% compared to 2009, reflecting weak loan demand, credit resolutions, including charge-offs and foreclosures, and low capital levels in the first half of 2010. Interest income reversed on nonperforming loans increased by 27% over 2009, and reduced net interest margin by 76 basis points during 2010, and 51 basis points during 2009. Partially offsetting these effects was a decline in total funding costs to 1.69% for 2010, as compared to 2.28% for 2009.
Provision for Credit Losses. Management’s policy is to establish valuation allowances for estimated losses by charging corresponding provisions against income. The evaluation of the adequacy of specific and general valuation allowances is an ongoing process. This process includes information derived from many factors, including historical loss trends, trends in classified assets, trends in delinquent and nonaccrual loans, trends in portfolio volume, diversification as to type of loan, size of individual credit exposure, current and anticipated economic conditions, loan policies, collection policies and effectiveness, quality of credit personnel, effectiveness of policies, procedures and practices, and recent loss experience of peer banking institutions.
Sterling recorded provisions for credit losses of $250.2 million and $681.4 million for the years ended December 31, 2010 and 2009, respectively. The decline in the level of the provision over these periods primarily relates to the reduction in the level of classified loans, particularly in the construction portfolio, and the amount of losses previously recognized on these classified loans.
Noninterest Income. Noninterest income was as follows for the years presented:
| Years Ended December 31, | ||||||||||||
| 2010 | 2009 | % Change |
||||||||||
| (Dollars in thousands) | ||||||||||||
| Fees and service charges |
$ | 54,740 | $ | 58,326 | -6 | % | ||||||
| Mortgage banking operations |
62,564 | 47,298 | 32 | % | ||||||||
| Gains on sales of securities |
25,745 | 13,467 | 91 | % | ||||||||
| Bank-owned life insurance |
7,307 | 6,954 | 5 | % | ||||||||
| Loan servicing fees |
3,762 | 2,378 | 58 | % | ||||||||
| Charge on prepayment of debt |
(11,296 | ) | 0 | N/A | ||||||||
| Other |
(5,857 | ) | (4,609 | ) | 27 | % | ||||||
| Total noninterest income |
$ | 136,965 | $ | 123,814 | 11 | % | ||||||
Increases in income from mortgage banking operations and securities sales, were partially offset by an $11.3 million prepayment charge on the early retirement of FHLB borrowings. Sterling expects to recapture this charge through lower interest expense in future periods. The increase in mortgage banking operations reflects a higher margin on loan sales during 2010 as compared with 2009. Securities sales during 2010 were driven both from the realization of certain valuations, and rebalancing within the portfolio. The change in loan servicing income included market adjustments to mortgage servicing rights. The reduction in fees and service charges income primarily relates to lower non-sufficient funds fees and loan fees. The following table presents components of mortgage banking income for the periods presented:
| Years Ended December 31, | ||||||||
| 2010 | 2009 | |||||||
| (Dollars in thousands) | ||||||||
| Residential loan sales |
$ | 2,455,144 | $ | 2,843,057 | ||||
| Margin on residential loan sales |
2.40 | % | 1.53 | % | ||||
| TX52 |
Table of Contents
Improvements in the pricing execution of residential loan sales during 2010 reflected an increase in the percentages of loans that were delivered to agencies on a mandatory basis.
Noninterest Expense. Noninterest expense was as follows for the years presented:
| Years Ended December 31, | ||||||||||||
| 2010 | 2009 | % Change |
||||||||||
| (Dollars in thousands) | ||||||||||||
| Employee compensation and benefits |
$ | 168,793 | $ | 164,198 | 3 | % | ||||||
| OREO operations |
62,578 | 48,041 | 30 | % | ||||||||
| Occupancy and equipment |
39,643 | 42,668 | -7 | % | ||||||||
| Insurance |
34,704 | 30,585 | 13 | % | ||||||||
| Data processing |
23,116 | 20,779 | 11 | % | ||||||||
| Professional fees |
22,394 | 18,464 | 21 | % | ||||||||
| Depreciation |
13,391 | 14,041 | -5 | % | ||||||||
| Advertising |
11,536 | 12,576 | -8 | % | ||||||||
| Amortization of core deposit intangibles |
4,898 | 4,898 | 0 | % | ||||||||
| Travel and entertainment |
3,975 | 4,758 | -16 | % | ||||||||
| Other |
10,017 | 8,966 | 12 | % | ||||||||
| Noninterest expense before impairment charge |
395,045 | 369,974 | 7 | % | ||||||||
| Goodwill impairment |
0 | 227,558 | -100 | % | ||||||||
| Total noninterest expense |
$ | 395,045 | $ | 597,532 | -34 | % | ||||||
The increase in noninterest expense before impairment charge was primarily due to a higher level of OREO operating expenses and valuation write-downs as a result of increased levels of OREO. Professional fees increased primarily as a result of advisory costs related to Sterling’s Recapitalization and ongoing litigation, as well as higher fees paid to members of the board of directors. Insurance, which is primarily comprised of FDIC deposit insurance premiums, showed an increase in 2010 due to the higher assessment rates applicable to Sterling Savings Bank prior to its returning to a well-capitalized status. Noninterest expense for 2009 included a writeoff of the remaining balance of goodwill.
Income Tax Provision. Sterling did not recognize a federal or state income tax benefit during 2010, as Sterling recorded a $90.0 million increase to its deferred tax valuation allowance against the increase in its deferred tax asset primarily related to the increase in its NOL carryforward.
2009 versus 2008
Net Interest Income. For the years ended December 31, 2009 and 2008, net interest income was $344.0 million and $359.6 million, respectively, with the 4% decrease attributable to the decline in interest income on loans being greater than the drop in funding costs. The lower level of interest income on loans was from the increase in the amount of interest income reversed on nonperforming loans, and a reduction in loan balances due to lower portfolio originations and higher charge-offs. Sterling increased its loan originations during 2009, the majority of which were sold into the secondary market through Sterling’s mortgage banking segment.
During the years ended December 31, 2009 and 2008, net interest margin was 2.92% and 3.08%, respectively. Net interest margin was negatively affected by the increase in the amount of interest income reversed on nonperforming loans. When loans reach nonperforming status, the reversal and
| TX53 |
Table of Contents
cessation of accruing interest has an immediate negative impact on net interest margin.
Provision for Credit Losses. Sterling recorded provisions for credit losses of $681.4 million and $333.6 million for the years ended December 31, 2009 and 2008, respectively. Sterling increased its provision for credit losses in response to an increase in the level of classified loans, particularly in the multifamily and commercial construction, commercial real estate and commercial banking portfolios, and increases in loss rates from reduced appraisal values.
Noninterest Income. Noninterest income was as follows for the years presented:
| Years Ended December 31, | ||||||||||||
| 2009 | 2008 | % Change |
||||||||||
| (Dollars in thousands) | ||||||||||||
| Fees and service charges |
$ | 58,326 | $ | 59,867 | -3 | % | ||||||
| Mortgage banking operations |
47,298 | 27,651 | 71 | % | ||||||||
| Gains on sales of securities |
13,467 | 409 | 3193 | % | ||||||||
| Bank-owned life insurance |
6,954 | 5,286 | 32 | % | ||||||||
| Loan servicing fees |
2,378 | 431 | 452 | % | ||||||||
| Other |
(4,609 | ) | (1,749 | ) | 164 | % | ||||||
| Total noninterest income |
$ | 123,814 | $ | 91,895 | 35 | % | ||||||
The increase in noninterest income was driven by income from mortgage banking operations, and gains on the sale of securities. Growth in mortgage banking income was driven by the increase in residential loan originations. Favorable market conditions provided the opportunity to realize gains within the securities portfolio during 2009. The decrease in fees and service charges was a result of lower loan related fees, including prepayment penalties. In 2008, fees and service charges income benefited from higher financial services commissions reflecting more non-deposit product transactions and higher real estate exchange fees. The increase in loan servicing income for 2009 reflected positive market adjustments to mortgage servicing rights. Other noninterest income for 2009 included a $1.1 million loss resulting from the failure of a Washington state public depository bank.
The following table summarizes certain information about Sterling’s residential and commercial mortgage banking activities for the years indicated:
| As of and for the Years Ended December 31, |
||||||||
| 2009 | 2008 | |||||||
| (Dollars in millions) | ||||||||
| Originations of residential mortgage loans |
$ | 3,047 | $ | 1,465 | ||||
| Originations of commercial real estate loans |
176 | 327 | ||||||
| Sales of residential loans |
2,795 | 1,316 | ||||||
| Sales of commercial real estate loans |
36 | 16 | ||||||
| Principal balances of residential loans serviced for others |
1,090 | 502 | ||||||
| Principal balances of commercial real estate loans serviced for others |
1,598 | 1,680 | ||||||
| TX54 |
Table of Contents
Noninterest Expense. Noninterest expense was as follows for the years presented:
| Years Ended December 31, | ||||||||||||
| 2009 | 2008 | % Change |
||||||||||
| (Dollars in thousands) | ||||||||||||
| Employee compensation and benefits |
$ | 164,198 | $ | 159,133 | 3 | % | ||||||
| OREO operations |
48,041 | 19,787 | 143 | % | ||||||||
| Occupancy and equipment |
42,668 | 40,245 | 6 | % | ||||||||
| Insurance |
30,585 | 7,372 | 315 | % | ||||||||
| Data processing |
20,779 | 21,118 | -2 | % | ||||||||
| Professional fees |
18,464 | 6,979 | 165 | % | ||||||||
| Depreciation |
14,041 | 14,023 | 0 | % | ||||||||
| Advertising |
12,576 | 11,748 | 7 | % | ||||||||
| Amortization of core deposit intangibles |
4,898 | 4,901 | 0 | % | ||||||||
| Travel and entertainment |
4,758 | 6,977 | -32 | % | ||||||||
| Other |
8,966 | 13,234 | -32 | % | ||||||||
| Noninterest expense before impairment charge |
369,974 | 305,517 | 21 | % | ||||||||
| Goodwill impairment |
227,558 | 223,765 | 2 | % | ||||||||
| Total noninterest expense |
$ | 597,532 | $ | 529,282 | 13 | % | ||||||
In addition to the goodwill impairment charges during 2009 and 2008, noninterest expense increased mainly due to a $28.3 million increase in OREO costs, and a $23.2 million increase in insurance. Insurance is primarily comprised of FDIC deposit insurance premiums, and included a $5.6 million special assessment in 2009. The elevation in OREO costs reflects losses from the impairment in values of the properties subsequent to repossession, and expenses associated with Sterling’s efforts to resolve problem accounts through foreclosure and liquidation. Professional fees increased as a result of higher regulatory compliance costs, while the decline in travel expense primarily reflected an emphasis on cost controls.
Income Tax Provision. Sterling recorded a provision for federal and state income tax of $27.0 million for the year ended December 31, 2009, and a benefit of $75.9 million for the year ended December 31, 2008. The effective tax rates were 3% and (18%) for 2009 and 2008, respectively. During 2009, due to the three-year cumulative loss for the period ending December 31, 2009, a valuation allowance was established against the deferred tax asset, with the allowance totaling $269.0 million as of December 31, 2009. Sterling will not be able to recognize the tax benefits on carryover losses until it can show that it is more likely than not that it will generate enough taxable income in future periods to realize the benefits of its deferred tax asset and loss carryforwards.
Assets. At December 31, 2010, Sterling’s assets were $9.49 billion, down $1.38 billion from $10.88 billion at December 31, 2009, with decreases in the loan portfolio partially offset by an increase in the securities portfolio.
| TX55 |
Table of Contents
Investments and MBS. Sterling’s investment and MBS portfolio at December 31, 2010 was $2.84 billion, an increase of $660.5 million from the December 31, 2009 balance of $2.18 billion, mostly due to investing the net proceeds from the Recapitalization Transactions. On December 31, 2010, the investment and MBS portfolio had an unrealized loss of $6.6 million versus an unrealized gain of $25.8 million at December 31, 2009. The following table sets forth the carrying values and classifications of Sterling’s investment and MBS portfolio as of the dates indicated:
| December 31, | ||||||||||||
| 2010 | 2009 | 2008 | ||||||||||
| (Dollars in thousands) | ||||||||||||
| MBS |
$ | 2,602,610 | $ | 1,944,989 | $ | 2,420,012 | ||||||
| Municipal bonds |
201,143 | 195,282 | 260,873 | |||||||||
| Short term commercial paper |
0 | 0 | 99,117 | |||||||||
| Other |
34,721 | 37,700 | 35,118 | |||||||||
| Total |
$ | 2,838,474 | $ | 2,177,971 | $ | 2,815,120 | ||||||
| Available for sale |
$ | 2,825,010 | $ | 2,160,325 | $ | 2,639,290 | ||||||
| Held to maturity |
13,464 | 17,646 | 175,830 | |||||||||
| Total |
$ | 2,838,474 | $ | 2,177,971 | $ | 2,815,120 | ||||||
The following table provides the carrying value and weighted average yield of Sterling’s investment and MBS portfolio by contractual maturity. Actual maturities for MBS will differ from contractual maturities from the level of prepayments experienced on the underlying mortgages.
| December 31, 2010 | ||||||||||||||||||||
| One Year or Less |
After One through Five Years |
After Five through Ten Years |
After Ten Years |
Total | ||||||||||||||||
| (Dollars in thousands) | ||||||||||||||||||||
| MBS |
||||||||||||||||||||
| Balance |
$ | 0 | $ | 0 | $ | 225,894 | $ | 2,376,716 | $ | 2,602,610 | ||||||||||
| Weighted average yield |
0.00 | % | 0.00 | % | 3.03 | % | 3.12 | % | 3.25 | % | ||||||||||
| Municipal bonds |
||||||||||||||||||||
| Balance |
$ | 25 | $ | 767 | $ | 22,178 | $ | 178,173 | $ | 201,143 | ||||||||||
| Weighted average yield (1) |
4.78 | % | 1.59 | % | 4.90 | % | 4.72 | % | 4.73 | % | ||||||||||
| Other |
||||||||||||||||||||
| Balance |
$ | 0 | $ | 0 | $ | 0 | $ | 34,721 | $ | 34,721 | ||||||||||
| Weighted average yield |
0.00 | % | 0.00 | % | 0.00 | % | 1.21 | % | 1.21 | % | ||||||||||
| Total carrying value |
$ | 25 | $ | 767 | $ | 248,072 | $ | 2,589,610 | $ | 2,838,474 | ||||||||||
| Weighted average yield |
4.78 | % | 1.59 | % | 3.20 | % | 3.21 | % | 3.21 | % | ||||||||||
| (1) | The weighted average yields on municipal bonds reflect the actual yields on the bonds and are not presented on a tax-equivalent basis. |
| TX56 |
Table of Contents
Loans Receivable. The following table sets forth the composition of Sterling’s loan portfolio by type of loan at the dates indicated:
| December 31, | ||||||||||||||||||||||||||||||||||||||||
| 2010 | 2009 | 2008 | 2007 | 2006 | ||||||||||||||||||||||||||||||||||||
| Amount | % | Amount | % | Amount | % | Amount | % | Amount | % | |||||||||||||||||||||||||||||||
| (Dollars in thousands) | ||||||||||||||||||||||||||||||||||||||||
| Residential real estate |
$ | 758,410 | 13 | % | $ | 839,170 | 11 | % | $ | 867,384 | 10 | % | $ | 703,826 | 8 | % | $ | 654,661 | 9 | % | ||||||||||||||||||||
| Multifamily real estate |
517,022 | 9 | 517,408 | 7 | 477,615 | 5 | 389,388 | 4 | 263,053 | 4 | ||||||||||||||||||||||||||||||
| Commercial real estate (1) |
1,314,657 | 23 | 1,403,560 | 18 | 1,364,885 | 15 | 1,223,036 | 13 | 795,386 | 11 | ||||||||||||||||||||||||||||||
| Construction: |
||||||||||||||||||||||||||||||||||||||||
| Residential |
156,853 | 3 | 720,964 | 9 | 1,455,860 | 16 | 1,933,125 | 21 | 1,429,772 | 20 | ||||||||||||||||||||||||||||||
| Multifamily |
90,518 | 2 | 233,501 | 3 | 324,818 | 4 | 263,873 | 3 | 189,819 | 3 | ||||||||||||||||||||||||||||||
| Commercial |
278,297 | 5 | 561,643 | 7 | 754,017 | 8 | 747,913 | 8 | 671,291 | 9 | ||||||||||||||||||||||||||||||
| Total Construction |
525,668 | 10 | 1,516,108 | 19 | 2,534,695 | 28 | 2,944,911 | 32 | 2,290,882 | 32 | ||||||||||||||||||||||||||||||
| Consumer |
744,068 | 13 | 1,116,522 | 15 | 1,248,520 | 14 | 1,175,456 | 13 | 1,038,330 | 15 | ||||||||||||||||||||||||||||||
| Commercial banking (2) |
1,770,426 | 32 | 2,301,944 | 30 | 2,532,158 | 28 | 2,639,196 | 30 | 2,069,086 | 29 | ||||||||||||||||||||||||||||||
| Gross loans receivable |
5,630,251 | 100 | % | 7,694,712 | 100 | % | 9,025,257 | 100 | % | 9,075,813 | 100 | % | 7,111,398 | 100 | % | |||||||||||||||||||||||||
| Net deferred origination fees |
(4,114 | ) | (7,070 | ) | (9,798 | ) | (16,480 | ) | (12,308 | ) | ||||||||||||||||||||||||||||||
| Allowance for losses on loans |
(247,056 | ) | (343,443 | ) | (208,365 | ) | (111,026 | ) | (77,849 | ) | ||||||||||||||||||||||||||||||
| Loans receivable, net |
$ | 5,379,081 | $ | 7,344,199 | $ | 8,807,094 | $ | 8,948,307 | $ | 7,021,241 | ||||||||||||||||||||||||||||||
| (1) | Comprised of non owner-occupied commercial real estate (“CRE”). |
| (2) | Comprised of commercial and industrial (“C&I”), and owner-occupied CRE loans. |
| TX57 |
Table of Contents
The contraction in the loan portfolio during 2009 and 2010 reflects Sterling’s efforts to resolve credit issues and reduce concentrations in the construction loan portfolio. Other areas of the loan portfolio were also affected by charge-offs, as well as loan repayments and sales, and weakened demand for credit.
The following table sets forth the loan loss allowance by category and the percentage of loans in each category to total loans:
| December 31, | ||||||||||||||||||||||||||||||||||||||||
| 2010 | 2009 | 2008 | 2007 | 2006 | ||||||||||||||||||||||||||||||||||||
| Allowance Amount |
Loans in Category as a Percentage of Total Loans |
Allowance Amount |
Loans in Category as a Percentage of Total Loans |
Allowance Amount |
Loans in Category as a Percentage of Total Loans |
Allowance Amount |
Loans in Category as a Percentage of Total Loans |
Allowance Amount |
Loans in Category as a Percentage of Total Loans |
|||||||||||||||||||||||||||||||
| (Dollars in thousands) | ||||||||||||||||||||||||||||||||||||||||
| Residential real estate |
$ | 17,307 | 13 | % | $ | 28,319 | 11 | % | $ | 8,147 | 10 | % | $ | 965 | 8 | % | $ | 1,405 | 9 | % | ||||||||||||||||||||
| Multifamily real estate |
9,668 | 9 | 8,984 | 7 | 4,795 | 5 | 659 | 4 | 671 | 4 | ||||||||||||||||||||||||||||||
| Commercial real estate |
49,362 | 23 | 42,296 | 18 | 13,712 | 15 | 21,244 | 13 | 17,565 | 11 | ||||||||||||||||||||||||||||||
| Construction |
65,877 | 10 | 185,222 | 19 | 118,279 | 28 | 50,109 | 32 | 12,098 | 32 | ||||||||||||||||||||||||||||||
| Consumer |
14,645 | 13 | 19,198 | 15 | 14,608 | 14 | 12,330 | 13 | 11,085 | 15 | ||||||||||||||||||||||||||||||
| Commercial banking |
56,951 | 32 | 59,135 | 30 | 40,027 | 28 | 23,830 | 30 | 34,209 | 29 | ||||||||||||||||||||||||||||||
| Unallocated |
33,246 | N/A | 289 | N/A | 8,797 | N/A | 1,889 | N/A | 816 | N/A | ||||||||||||||||||||||||||||||
| $ | 247,056 | 100 | % | $ | 343,443 | 100 | % | $ | 208,365 | 100 | % | $ | 111,026 | 100 | % | $ | 77,849 | 100 | % | |||||||||||||||||||||
| TX58 |
Table of Contents
The decrease in the loan loss allowance allocated to construction loans is in line with the decrease in the size of the construction loan portfolio. While credit trends in Sterling’s loan portfolio have begun to exhibit signs of improvement, Sterling believes it is prudent to maintain a larger than historical unallocated loan loss allowance until the sustainability of the credit trend can be determined. The following table sets forth changes in Sterling’s allowance for estimated credit losses for the periods indicated:
| Years Ended December 31, | ||||||||||||||||||||
| 2010 | 2009 | 2008 | 2007 | 2006 | ||||||||||||||||
| (Dollars in thousands) | ||||||||||||||||||||
| Allowance—loans, January 1 |
$ | 343,443 | $ | 208,365 | $ | 111,026 | $ | 77,849 | $ | 52,034 | ||||||||||
| Charge-offs: |
||||||||||||||||||||
| Residential real estate |
(37,347 | ) | (31,401 | ) | (6,187 | ) | (30 | ) | (32 | ) | ||||||||||
| Multifamily real estate |
(18,039 | ) | (3,510 | ) | (30 | ) | 0 | 0 | ||||||||||||
| Commercial real estate |
(49,424 | ) | (50,733 | ) | (9,237 | ) | (70 | ) | (902 | ) | ||||||||||
| Construction |
(238,596 | ) | (420,539 | ) | (178,033 | ) | (3,430 | ) | (12 | ) | ||||||||||
| Consumer |
(14,765 | ) | (15,396 | ) | (9,917 | ) | (3,152 | ) | (1,442 | ) | ||||||||||
| Commercial banking |
(18,683 | ) | (45,085 | ) | (19,920 | ) | (1,000 | ) | (2,017 | ) | ||||||||||
| Total charge-offs |
(376,854 | ) | (566,664 | ) | (223,324 | ) | (7,682 | ) | (4,405 | ) | ||||||||||
| Recoveries: |
||||||||||||||||||||
| Residential real estate |
2,131 | 306 | 66 | 5 | 5 | |||||||||||||||
| Multifamily real estate |
189 | 5 | 0 | 0 | 0 | |||||||||||||||
| Commercial real estate |
1,311 | 348 | 69 | 41 | 157 | |||||||||||||||
| Construction |
20,213 | 6,803 | 221 | 3 | 20 | |||||||||||||||
| Consumer |
1,869 | 1,667 | 1,642 | 756 | 503 | |||||||||||||||
| Commercial banking |
4,163 | 1,875 | 80 | 128 | 68 | |||||||||||||||
| Total recoveries |
29,876 | 11,004 | 2,078 | 933 | 753 | |||||||||||||||
| Net charge-offs |
(346,978 | ) | (555,660 | ) | (221,246 | ) | (6,749 | ) | (3,652 | ) | ||||||||||
| Provision |
250,591 | 690,738 | 318,585 | 24,632 | 16,312 | |||||||||||||||
| Acquired |
0 | 0 | 0 | 15,294 | 13,155 | |||||||||||||||
| Allowance—loans, December 31 |
247,056 | 343,443 | 208,365 | 111,026 | 77,849 | |||||||||||||||
| Allowance—unfunded commitments, January 1 |
11,967 | 21,334 | 6,306 | 5,840 | 3,449 | |||||||||||||||
| Provision |
(360 | ) | (9,367 | ) | 15,012 | 466 | 2,391 | |||||||||||||
| Amounts written off |
(900 | ) | 0 | 16 | 0 | 0 | ||||||||||||||
| Allowance—unfunded commitments, December 31 |
10,707 | 11,967 | 21,334 | 6,306 | 5,840 | |||||||||||||||
| Balance at end of period |
$ | 257,763 | $ | 355,410 | $ | 229,699 | $ | 117,332 | $ | 83,689 | ||||||||||
| Allowances on specific impaired loans |
$ | 21,237 | $ | 27,129 | $ | 1,980 | $ | 8,678 | $ | 1,379 | ||||||||||
| Ratio of net charge-offs to average loans outstanding during the period |
4.86 | % | 6.17 | % | 2.37 | % | 0.08 | % | 0.06 | % | ||||||||||
| TX59 |
Table of Contents
The following table sets forth the contractual principal repayments of Sterling’s loan portfolio, as well as sensitivities of these loans to changes in interest rates. Demand loans, loans having no stated repayment schedule and no stated maturity, and overdrafts are reported as due in one year or less. Loan balances do not include undisbursed loan proceeds, deferred loan origination costs and fees, or allowances for credit losses.
| Balance Outstanding at December 31, 2010 |
Principal Payments Contractually Due in Fiscal Years | |||||||||||||||||||||||||||||||
| 2011 | 2012-2015 | Thereafter | ||||||||||||||||||||||||||||||
| (Dollars in thousands) | ||||||||||||||||||||||||||||||||
| fixed | variable | fixed | variable | fixed | variable | fixed | variable | |||||||||||||||||||||||||
| Mortgage |
$ | 986,179 | $ | 1,603,910 | $ | 233,309 | $ | 406,114 | $ | 290,718 | $ | 641,263 | $ | 462,152 | $ | 556,533 | ||||||||||||||||
| Construction: |
||||||||||||||||||||||||||||||||
| Residential |
14,750 | 142,103 | 14,139 | 136,213 | 611 | 5,890 | 0 | 0 | ||||||||||||||||||||||||
| Multifamily |
18,030 | 72,488 | 18,030 | 72,488 | 0 | 0 | 0 | 0 | ||||||||||||||||||||||||
| Commercial |
17,301 | 260,996 | 15,824 | 238,700 | 1,477 | 22,296 | 0 | 0 | ||||||||||||||||||||||||
| Total Construction |
50,081 | 475,587 | 47,993 | 447,401 | 2,088 | 28,186 | 0 | 0 | ||||||||||||||||||||||||
| Consumer |
413,444 | 330,624 | 45,468 | 5,582 | 132,879 | 24,571 | 235,097 | 300,471 | ||||||||||||||||||||||||
| Commercial banking |
533,645 | 1,236,781 | 198,057 | 487,803 | 274,334 | 429,986 | 61,254 | 318,992 | ||||||||||||||||||||||||
| $ | 1,983,349 | $ | 3,646,902 | $ | 524,827 | $ | 1,346,900 | $ | 700,019 | $ | 1,124,006 | $ | 758,503 | $ | 1,175,996 | |||||||||||||||||
The following table sets forth Sterling’s loan originations for the periods indicated:
| Years Ended December 31, | ||||||||||||||||||||
| 2010 | 2009 | 2008 | 2007 | 2006 | ||||||||||||||||
| (Dollars in thousands) | ||||||||||||||||||||
| Residential real estate |
$ | 2,562,553 | $ | 3,047,380 | $ | 1,464,673 | $ | 1,492,026 | $ | 830,619 | ||||||||||
| Multifamily real estate |
29,369 | 82,696 | 170,975 | 35,870 | 4,215 | |||||||||||||||
| Commercial real estate |
98,172 | 176,256 | 326,853 | 163,315 | 131,001 | |||||||||||||||
| Construction: |
||||||||||||||||||||
| Residential |
19,584 | 32,692 | 383,922 | 1,584,449 | 1,425,248 | |||||||||||||||
| Multifamily |
0 | 0 | 25,374 | 118,799 | 156,932 | |||||||||||||||
| Commercial |
500 | 31,968 | 192,755 | 488,372 | 752,458 | |||||||||||||||
| Total construction |
20,084 | 64,660 | 602,051 | 2,191,620 | 2,334,638 | |||||||||||||||
| Consumer |
87,817 | 291,602 | 516,940 | 601,647 | 516,532 | |||||||||||||||
| Commercial banking |
130,976 | 318,544 | 541,978 | 995,732 | 1,154,304 | |||||||||||||||
| Total loans originated |
$ | 2,928,971 | $ | 3,981,138 | $ | 3,623,470 | $ | 5,480,210 | $ | 4,971,309 | ||||||||||
During 2010, Sterling purchased $82.7 million of multifamily loans, with no loan purchases transacting in 2009. New loan production for 2010 and 2009 was primarily generated through the Home Loan Division. Sterling’s lending initiatives include a commitment to support and restore economic growth and development in the communities it serves through funding affordable housing, consumer loans, small business loans and financing programs to support business growth.
| TX60 |
Table of Contents
The following table presents classified assets, which are comprised of performing substandard loans, nonperforming loans and OREO:
| December 31, | ||||||||||||||||||||
| 2010 | 2009 | 2008 | 2007 | 2006 | ||||||||||||||||
| (Dollars in thousands) | ||||||||||||||||||||
| Residential real estate |
$ | 104,467 | $ | 128,561 | $ | 34,333 | $ | 711 | $ | 2,110 | ||||||||||
| Multifamily real estate |
43,331 | 44,258 | 16,741 | 248 | 28 | |||||||||||||||
| Commercial real estate |
173,444 | 154,859 | 37,890 | 3,224 | 0 | |||||||||||||||
| Construction |
||||||||||||||||||||
| Residential construction |
112,600 | 487,789 | 548,384 | 117,424 | 3,219 | |||||||||||||||
| Commercial construction |
186,229 | 337,380 | 89,252 | 3,566 | 0 | |||||||||||||||
| Multifamily construction |
76,818 | 124,708 | 30,096 | 0 | 0 | |||||||||||||||
| Total construction |
375,647 | 949,877 | 667,732 | 120,990 | 3,219 | |||||||||||||||
| Consumer |
18,868 | 11,996 | 4,556 | 2,627 | 1,667 | |||||||||||||||
| Commercial banking |
222,125 | 269,521 | 143,748 | 95,461 | 37,300 | |||||||||||||||
| Total classified loans |
937,882 | 1,559,072 | 905,000 | 223,261 | 44,324 | |||||||||||||||
| OREO |
161,653 | 83,272 | 62,320 | 11,075 | 4,032 | |||||||||||||||
| Total classified assets |
$ | 1,099,535 | $ | 1,642,344 | $ | 967,320 | $ | 234,336 | $ | 48,356 | ||||||||||
| Classified loans/ total loans |
16.7 | % | 20.3 | % | 10.0 | % | 2.5 | % | 0.6 | % | ||||||||||
| Classified assets/ total assets |
11.6 | % | 15.1 | % | 7.6 | % | 1.9 | % | 0.5 | % | ||||||||||
The decline in classified assets during 2010 was primarily due to the $574.2 million decrease in classified construction loans. This decrease was partially offset by an increase in OREO resulting from Sterling taking possession of properties at the last stage of asset resolution.
| TX61 |
Table of Contents
The following table provides information regarding the classified loans of the top 30 borrowing relationships as of December 31, 2010, which together constituted 30% of all classified assets at year end:
| Description |
Location |
December 31, 2010 | ||||
| (Dollars in thousands) | ||||||
| Commercial Construction & Real Estate: 5 loans |
Other WA & Other OR | $ | 28,734 | |||
| Commercial Construction: 3 loans |
Puget Sound, WA & Other WA | 27,528 | ||||
| Commercial & Residential Construction: 2 loans |
Puget Sound, WA & Other ID | 21,476 | ||||
| Commercial Construction & Real Estate: 2 loans |
Northern CA | 17,170 | ||||
| Commercial Construction: 1 loan |
Portland, OR | 14,578 | ||||
| Commercial Construction & Commercial: 2 loans |
Puget Sound, WA & Other OR | 14,576 | ||||
| Commercial Construction & Real Estate: 4 loans |
Puget Sound, WA | 13,625 | ||||
| Commercial Construction: 1 loan |
Northern CA | 11,673 | ||||
| Multifamily: 3 loans |
Puget Sound, WA | 11,321 | ||||
| Commercial Real Estate: 1 loan |
Puget Sound, WA | 10,074 | ||||
| Multifamily: 2 loans |
Northern CA | 9,727 | ||||
| Commercial: 1 loan |
Arizona | 9,680 | ||||
| Commercial Construction: 2 loans |
Arizona | 9,108 | ||||
| Commercial Construction: 1 loan |
Southern CA | 8,989 | ||||
| Commercial: 1 loan |
Northern CA | 8,476 | ||||
| Commercial Construction: 1 loan |
Other OR | 8,470 | ||||
| Residential Construction: 17 loans |
Puget Sound, WA | 8,421 | ||||
| Multifamily: 2 loans |
Northern CA | 8,370 | ||||
| Commercial Construction: 1 loan |
Northern CA | 8,172 | ||||
| Residential Construction: 1 loan |
Puget Sound, WA | 8,107 | ||||
| Commercial Construction: 3 loans |
Puget Sound, WA | 8,032 | ||||
| Commercial Construction: 2 loans |
Other | 7,558 | ||||
| Multifamily: 1 loan |
Portland, OR | 7,420 | ||||
| Residential Construction: 2 loans |
Portland, OR & Other OR | 7,245 | ||||
| Commercial: 2 loans |
Northern & Southern CA | 7,157 | ||||
| Multifamily: 1 loan |
Puget Sound, WA | 6,723 | ||||
| Commercial & Residential Construction: 5 loans |
Portland, OR & Other OR | 6,628 | ||||
| Multifamily: 1 loan |
Puget Sound, WA | 6,559 | ||||
| Commercial & Residential Construction: 5 loans |
Portland, OR | 6,520 | ||||
| Portland, OR, Puget Sound, WA, | ||||||
| Residential Construction: 6 loans |
Northern CA, Utah | 6,423 | ||||
| Total—Classified Loans of top 30 borrowers |
$ | 328,540 | ||||
| TX62 |
Table of Contents
Nonperforming assets, a subset of classified assets that includes nonperforming loans and OREO, and related information are summarized in the following table as of the dates indicated:
| December 31, | ||||||||||||||||||||
| 2010 | 2009 | 2008 | 2007 | 2006 | ||||||||||||||||
| (Dollars in thousands) | ||||||||||||||||||||
| Past due 90 days or more |
$ | 0 | $ | 0 | $ | 0 | $ | 0 | $ | 0 | ||||||||||
| Nonaccrual loans |
546,133 | 824,652 | 474,172 | 123,790 | 8,486 | |||||||||||||||
| Restructured loans |
108,504 | 71,279 | 56,618 | 350 | 0 | |||||||||||||||
| Total nonperforming loans |
654,637 | 895,931 | 530,790 | 124,140 | 8,486 | |||||||||||||||
| OREO |
161,653 | 83,272 | 62,320 | 11,075 | 4,052 | |||||||||||||||
| Total nonperforming assets |
816,290 | 979,203 | 593,110 | 135,215 | 12,538 | |||||||||||||||
| Specific reserves—loans |
(21,237 | ) | (27,129 | ) | (1,980 | ) | (8,678 | ) | (1,379 | ) | ||||||||||
| Net nonperforming assets |
$ | 795,053 | $ | 952,074 | $ | 591,130 | $ | 126,537 | $ | 11,159 | ||||||||||
| Nonperforming loans before charge-offs, gross |
$ | 858,805 | $ | 1,202,660 | $ | 462,511 | $ | 0 | $ | 0 | ||||||||||
| Charge-offs on nonperforming loans |
(319,773 | ) | (500,183 | ) | (165,906 | ) | 0 | 0 | ||||||||||||
| Nonperforming loans, net of charge-offs |
539,032 | 702,477 | 296,605 | 0 | 0 | |||||||||||||||
| Nonperforming loans without charge-offs (1) |
115,605 | 193,454 | 234,185 | 124,140 | 8,486 | |||||||||||||||
| Total nonperforming loans |
$ | 654,637 | $ | 895,931 | $ | 530,790 | $ | 124,140 | $ | 8,486 | ||||||||||
| Nonperforming assets to total assets |
8.60 | % | 9.00 | % | 4.64 | % | 1.11 | % | 0.13 | % | ||||||||||
| Nonperforming loans to loans |
11.64 | % | 11.65 | % | 5.89 | % | 1.37 | % | 0.12 | % | ||||||||||
| Nonperforming loans carried at fair value to total nonperforming loans |
82.3 | % | 78.4 | % | 55.9 | % | N/A | N/A | ||||||||||||
| Charge-offs plus specific loan reserves to nonperforming loans |
39.7 | % | 43.8 | % | 36.3 | % | N/A | N/A | ||||||||||||
| Loan loss allowance to nonperforming loans |
37.7 | % | 38.3 | % | 39.3 | % | 89.4 | % | 917.4 | % | ||||||||||
| Loan loss allowance to nonperforming loans excluding loans carried at fair value (2) |
195.3 | % | 163.5 | % | 89.0 | % | 89.4 | % | 917.4 | % | ||||||||||
| (1) | Charge-offs have not been recorded on these nonperforming loans, as the value of the underlying collateral exceeds the carrying value of the loans. |
| (2) | Excludes the specific loan loss reserve. |
As of December 31, 2010, Sterling has recognized confirmed losses totaling $319.8 million on collateral dependent nonperforming loans held in its portfolio. As a result of these confirmed losses, Sterling has written down the carrying value of these loans to the appraisal value of their underlying collateral. The allowance for loan losses to nonperforming loans, excluding these loans for which the full loss to date has been charged off, was 195.3% of nonperforming loans at December 31, 2010. Further declines in real estate appraisal values could result in additional losses on these loans.
| TX63 |
Table of Contents
The following table presents certain information on Sterling’s nonperforming assets:
| December 31, | ||||||||||||
| 2010 | 2009 | 2008 | ||||||||||
| (Dollars in thousands) | ||||||||||||
| Construction—residential |
||||||||||||
| Puget Sound |
$ | 55,365 | $ | 152,796 | $ | 72,424 | ||||||
| Portland, OR |
48,781 | 114,628 | 117,098 | |||||||||
| Vancouver, WA |
12,455 | 23,332 | 14,486 | |||||||||
| N. California |
9,474 | 20,204 | 3,093 | |||||||||
| Bend, OR |
7,479 | 28,730 | 20,993 | |||||||||
| Southern California |
4,574 | 8,893 | 57,449 | |||||||||
| Boise, ID |
2,614 | 21,659 | 21,123 | |||||||||
| Utah |
757 | 3,766 | 29,215 | |||||||||
| Other |
24,161 | 61,333 | 57,973 | |||||||||
| Total residential construction |
165,660 | 435,341 | 393,854 | |||||||||
| Construction—commercial |
||||||||||||
| Puget Sound |
48,619 | 22,045 | 3,500 | |||||||||
| N. California |
45,132 | 47,044 | 58,748 | |||||||||
| S. California |
27,227 | 38,003 | 7,636 | |||||||||
| Other |
76,860 | 60,711 | 723 | |||||||||
| Total construction—commercial |
197,838 | 167,803 | 70,607 | |||||||||
| Construction—multi-family |
||||||||||||
| Puget Sound |
41,407 | 27,195 | 0 | |||||||||
| Portland, OR |
7,420 | 15,497 | 0 | |||||||||
| Other |
17,965 | 32,640 | 3,894 | |||||||||
| Total construction—multi-family |
66,792 | 75,332 | 3,894 | |||||||||
| Construction—total |
430,290 | 678,476 | 468,355 | |||||||||
| Commercial banking |
110,872 | 134,391 | 61,520 | |||||||||
| Residential real estate |
115,923 | 70,492 | 45,522 | |||||||||
| Commercial real estate |
123,146 | 68,758 | 7,272 | |||||||||
| Multi-family real estate |
25,806 | 20,478 | 4,757 | |||||||||
| Consumer |
10,253 | 6,608 | 5,684 | |||||||||
| Total nonperforming assets |
816,290 | 979,203 | 593,110 | |||||||||
| Specific reserves—loans |
(21,237 | ) | (27,129 | ) | (1,980 | ) | ||||||
| Net nonperforming assets |
$ | 795,053 | $ | 952,074 | $ | 591,130 | ||||||
At the applicable foreclosure date, OREO is recorded at the fair value of the real estate, less the estimated sales costs. The carrying value of OREO is periodically evaluated and, if necessary, an allowance is established to reduce the carrying value to net realizable value. The following table sets forth the activity in Sterling’s OREO for the periods indicated:
| Years Ended December 31, | ||||||||||||||||||||
| 2010 | 2009 | 2008 | 2007 | 2006 | ||||||||||||||||
| (Dollars in thousands) | ||||||||||||||||||||
| Balance at beginning of period |
$ | 83,272 | $ | 62,320 | $ | 11,075 | $ | 4,052 | $ | 779 | ||||||||||
| Loan foreclosures and other additions |
265,115 | 156,449 | 80,900 | 8,252 | 4,581 | |||||||||||||||
| Improvements and other changes |
5,434 | 1,654 | (1,819 | ) | 119 | (244 | ) | |||||||||||||
| Sales |
(155,409 | ) | (106,130 | ) | (10,208 | ) | (1,348 | ) | (894 | ) | ||||||||||
| Provisions for losses |
(36,759 | ) | (31,021 | ) | (17,628 | ) | 0 | (170 | ) | |||||||||||
| Balance at end of period |
$ | 161,653 | $ | 83,272 | $ | 62,320 | $ | 11,075 | $ | 4,052 | ||||||||||
| TX64 |
Table of Contents
OREO balances increased during 2010 as a result of Sterling taking possession of properties associated with non performing loans at the last stage of asset resolution.
Deposits. The following table sets forth the composition of Sterling’s deposits at the dates indicated:
| December 31, | ||||||||||||||||||||||||
| 2010 | 2009 | 2008 | ||||||||||||||||||||||
| Amount | % | Amount | % | Amount | % | |||||||||||||||||||
| (Dollars in thousands) | ||||||||||||||||||||||||
| Interest-bearing transaction |
$ | 497,395 | 7.2 | $ | 1,014,032 | 13.0 | $ | 449,060 | 5.4 | |||||||||||||||
| Noninterest-bearing transaction |
992,368 | 14.4 | 1,001,771 | 12.9 | 897,198 | 10.7 | ||||||||||||||||||
| Savings and MMDA |
1,886,425 | 27.3 | 1,577,900 | 20.3 | 2,113,425 | 25.3 | ||||||||||||||||||
| Time deposits—brokered |
249,029 | 3.6 | 1,079,997 | 13.9 | 1,480,569 | 17.7 | ||||||||||||||||||
| Time deposits—retail |
3,285,790 | 47.5 | 3,101,490 | 39.9 | 3,410,155 | 40.9 | ||||||||||||||||||
| Total deposits |
$ | 6,911,007 | 100.0 | $ | 7,775,190 | 100.0 | $ | 8,350,407 | 100.0 | |||||||||||||||
Changes in deposits during 2010 were primarily from the non-renewal of brokered time deposits that reached maturity. Brokered deposits were down 77% from December 31, 2009. Under the recently terminated cease and desist order, Sterling Savings Bank was precluded from participating in the brokered deposit market. The brokered deposit runoff helped improve the mix of deposits, with retail deposits increasing to 85% of total deposits, up from 76% of total deposits at the beginning of the year. Expiration of the TAG program in December 2010 resulted in a shift of deposits from transaction accounts to savings and MMDA accounts.
The following table presents the average balance outstanding and weighted average interest rate paid for each major category of deposits for the periods indicated:
| Years Ended December 31, | ||||||||||||||||||||||||
| 2010 | 2009 | 2008 | ||||||||||||||||||||||
| Average Balance |
Weighted Average Interest Rate |
Average Balance |
Weighted Average Interest Rate |
Average Balance |
Weighted Average Interest Rate |
|||||||||||||||||||
| (Dollars in thousands) | ||||||||||||||||||||||||
| Transaction accounts: |
||||||||||||||||||||||||
| Interest-bearing |
$ | 809,351 | 0.24 | % | $ | 844,154 | 0.30 | % | $ | 441,708 | 0.31 | % | ||||||||||||
| Noninterest-bearing |
999,857 | 0.00 | 980,021 | 0.00 | 880,224 | 0.00 | ||||||||||||||||||
| Savings and MMDA |
1,656,816 | 0.61 | 1,758,678 | 0.91 | 2,173,133 | 2.13 | ||||||||||||||||||
| Time deposits |
3,774,891 | 2.19 | 4,718,946 | 3.20 | 4,553,160 | 4.10 | ||||||||||||||||||
| $ | 7,240,915 | 1.31 | % | $ | 8,301,799 | 2.04 | % | $ | 8,048,225 | 2.91 | % | |||||||||||||
| TX65 |
Table of Contents
The following table shows the amounts and remaining maturities of time deposits that had balances of $100,000 or more as of period end:
| December 31, | ||||
| 2010 | ||||
| (Dollars in thousands) | ||||
| Three months or less |
$ | 685,732 | ||
| After three months through six months |
443,987 | |||
| After six months through twelve months |
404,936 | |||
| After twelve months |
529,296 | |||
| $ | 2,063,951 | |||
Borrowings. Deposit accounts are Sterling’s primary source of funds. Sterling uses other borrowings to supplement its deposit gathering efforts. These borrowings include advances from the FHLB, reverse repurchase agreements, primary credits and term auction facilities from the Federal Reserve, as well as federal funds purchased. During 2010, these borrowings decreased in aggregate by $949.6 million due to FHLB advances reaching maturity and the prepayment of $295.0 million of advances. The prepaid FHLB advances had a weighted average remaining term of 14 months, and a weighted average cost of 3.78%. The prepayment is expected to have a positive impact on Sterling’s net interest margin for the next several quarters.
The following table presents the ending balances of Sterling’s borrowings as of the dates indicated:
| December 31, | ||||||||||||
| 2010 | 2009 | 2008 | ||||||||||
| (Dollars in thousands) | ||||||||||||
| FHLB advances: |
||||||||||||
| Short-term |
$ | 1,333 | $ | 635,182 | $ | 548,819 | ||||||
| Long-term |
405,878 | 701,985 | 1,177,730 | |||||||||
| Securities sold subject to reverse repurchase agreements and funds purchased: |
||||||||||||
| Short-term |
32,512 | 49,146 | 163,023 | |||||||||
| Long-term |
1,000,000 | 1,000,000 | 1,000,000 | |||||||||
| Junior subordinated debentures |
245,285 | 245,281 | 245,276 | |||||||||
| Other |
0 | 3,000 | 3,000 | |||||||||
| Total borrowings |
$ | 1,685,008 | $ | 2,634,594 | $ | 3,137,848 | ||||||
| TX66 |
Table of Contents
Certain other information related to the short-term portion of Sterling’s borrowings as of and for the periods indicated is as follows:
| Years Ended December 31, | ||||||||||||
| 2010 | 2009 | 2008 | ||||||||||
| (Dollars in thousands) | ||||||||||||
| Maximum amount outstanding at any month-end during the period: |
||||||||||||
| Short-term advances |
$ | 600,160 | $ | 653,000 | $ | 594,614 | ||||||
| Short-term reverse repurchase agreements and funds purchased |
35,231 | 60,465 | 118,343 | |||||||||
| Average amount outstanding during the period: |
||||||||||||
| Short-term advances |
$ | 246,061 | $ | 613,520 | $ | 444,806 | ||||||
| Short-term reverse repurchase agreements and funds purchased |
27,738 | 43,027 | 100,924 | |||||||||
| Average rate during the period: |
||||||||||||
| Short-term advances |
2.41 | % | 2.68 | % | 3.76 | % | ||||||
| Short-term reverse repurchase agreements and funds purchased |
0.46 | % | 4.09 | % | 1.51 | % | ||||||
| Average rate as of the end of the period: |
||||||||||||
| Short-term advances |
5.97 | % | 1.63 | % | 3.87 | % | ||||||
| Short-term reverse repurchase agreements and funds purchased |
0.33 | % | 0.50 | % | 2.03 | % | ||||||
Asset and Liability Management
The principal objective of Sterling’s asset and liability management activities is to provide optimum levels of net interest income and stable sources of funding while maintaining acceptable levels of interest-rate risk and liquidity risk. The Asset/Liability Committee (“ALCO”) measures interest rate risk exposure primarily through interest rate shock simulations for both net interest income and the economic value of equity (“EVE”). Interest rate risk arises from mismatches in assets and liabilities, with mismatches due to differences in the timing of rate repricing for the various instruments, the amount or volume of the underlying assets and liabilities that are repricing, and by how much or the level at which the rate is repricing. The specific characteristics of the underlying assets and liabilities, including any embedded optionality, such as a prepayment option on a loan, influence these differences.
The net interest income interest rate shock simulation measures the effect of changes in interest rates on net interest income over 12 months. This simulation consists of measuring the change in net interest income over the next 12 months from the base case scenario, from which rates are shocked, in a parallel fashion, up and down. The base case uses the assumption of the existing balance sheet and existing interest rates. The simulation requires numerous assumptions, including relative levels of market interest rates, instantaneous and parallel shifts in the yield curve, loan prepayments and reactions of depositors to changes in interest rates, and should not be relied upon as being indicative of actual or future results. The analysis does not contemplate actions Sterling may undertake in response to changes in interest rates and market conditions. The results of this simulation are included in the following table for the periods presented:
| December 31, | ||||||||
| Change in Interest Rate in |
2010 | 2009 | ||||||
| % Change in NII |
% Change in NII |
|||||||
| +300 |
(11.2 | ) | (9.6 | ) | ||||
| +200 |
(5.5 | ) | (5.1 | ) | ||||
| +100 |
(2.4 | ) | (0.3 | ) | ||||
| Static |
0.0 | 0.0 | ||||||
| -100 |
N/A | (1) | N/A | (1) | ||||
| 1) | Results are not meaningful in a low interest rate environment. |
EVE simulation analysis measures risk in the balance sheet that might not be taken into account in the net interest income simulation. Whereas net interest income simulation highlights exposure over a relatively short time period of 12 months, EVE simulation analysis incorporates all cash flows over the estimated remaining life of all balance sheet
| TX67 |
Table of Contents
positions. The EVE simulation analysis of the balance sheet, at a point in time, is defined as the discounted present value of asset cash flows minus the discounted value of liability cash flows. The difference between the present value of the asset and liability represents the EVE. As with net interest income, the base case simulation uses current market rates, from which rates are shocked up and down in a parallel fashion. As with the net interest income simulation model, EVE simulation analysis is based on key assumptions about the timing and variability of balance sheet cash flows. However, because the simulation represents much longer time periods, inaccuracy of assumptions may increase the variability of outcomes within the simulation. It also does not take into account actions management may undertake in response to anticipated changes in interest rates. The results of this simulation are included in the following table for the periods presented:
| At December 31, | ||||||||
| Change in Interest Rate in Basis Points (Rate Shock) |
2010 | 2009 | ||||||
| % Change in EVE |
% Change in EVE |
|||||||
| +300 |
(21.7 | ) | (36.0 | ) | ||||
| +200 |
(8.2 | ) | (16.5 | ) | ||||
| +100 |
(1.4 | ) | (0.1 | ) | ||||
| Static |
0.0 | 0.0 | ||||||
| -100 |
N/A | (1) | N/A | (1) | ||||
| (1) | Results are not meaningful in a low interest rate environment. |
The lower percentage change in EVE for a rate shock at December 31, 2010 as compared with December 31, 2009 reflects the increase in shareholders’ equity due to the Recapitalization. As of December 31, 2010, Sterling has customer-related interest rate swap derivatives outstanding with a total notional amount of $98.3 million. For a description, see “Business—Lending—Derivatives and Hedging.” As of December 31, 2010, Sterling has not entered into any other derivative transactions as part of managing its interest rate risk. However, Sterling continues to consider derivatives, including non-customer related interest rate swaps, caps and floors as viable alternatives in the asset and liability management process.
Liquidity and Capital Resources
Sterling’s primary sources of funds are: retail, public and brokered deposits; the collection of principal and interest primarily from loans, as well as from mortgage backed securities; the sale of loans into the secondary market in connection with Sterling’s mortgage banking activities; borrowings from the FHLB and the Federal Reserve; and borrowings from commercial banks (including reverse repurchase agreements). Public deposits from states, municipalities, and other public entities are generally obtained by competitive rate offerings and bidding among qualifying financial institutions. Certain states require collateralization for substantially all uninsured public deposits. Reverse repurchase agreements allow Sterling to sell investments (generally U.S. agency securities and MBS) under an agreement to buy them back at a specified price at a later date. These agreements to repurchase are deemed to be borrowings collateralized by the investments and MBS sold. The use of reverse repurchase agreements may expose Sterling to certain risks not associated with other borrowings, including interest rate risk and the possibility that additional collateral may have to be provided if the market value of the pledged collateral declines. Sterling Savings Bank’s credit line with FHLB of Seattle provides for borrowings up to a percentage of its total assets, subject to collateralization requirements, with borrowing terms ranging from overnight cash management advances (“CMA”) to 30 year advances. Sterling Savings Bank actively manages its liquidity in an effort to maintain an adequate margin over the level necessary to support the funding of loans and deposit withdrawals. Liquidity may vary from time to time, depending on economic conditions, deposit fluctuations, loan funding needs and regulatory requirements.
The total value of Sterling’s cash and cash equivalents and securities was $3.27 billion at December 31, 2010, compared with $2.75 billion at December 31, 2009. Available liquidity as of December 31, 2010 of $1.68 billion included unpledged portions of cash and cash equivalents and securities of $840 million, available borrowing capacity from the FHLB and the Federal Reserve of $614 million, as well as loans held for sale of $222 million, and compared to total available liquidity of $2.69 billion as of December 31, 2009.
| TX68 |
Table of Contents
Sterling, on a parent company-only basis, had cash of approximately $47.5 million and $24.3 million at December 31, 2010 and 2009, respectively. Sterling received cash dividends from Sterling Savings Bank of $0 and $9.7 million during 2010 and 2009, respectively. Sterling Savings Bank’s ability to pay dividends is generally limited by its earnings, financial condition, and capital and regulatory requirements. During 2010, Sterling invested $650.0 million in Sterling Savings Bank common stock. No capital was downstreamed from Sterling to Sterling Savings Bank during 2009.
Off-Balance Sheet Arrangements and Aggregate Contractual Obligations
The following table represents Sterling’s on-and-off-balance sheet aggregate contractual obligations to make future payments as of December 31, 2010:
| Payments Due by Period | ||||||||||||||||||||||||
| Total | Less than 1 year |
1 to 3 years | Over 3 to 5 years |
More than 5 years |
Indeterminate Maturity |
|||||||||||||||||||
| (Dollars in thousands) | ||||||||||||||||||||||||
| Deposits (1) |
$ | 6,911,007 | $ | 2,510,666 | $ | 761,935 | $ | 194,755 | $ | 67,463 | $ | 3,376,188 | ||||||||||||
| Borrowings (1) |
1,685,008 | 33,845 | 619,269 | 155,550 | 876,344 | 0 | ||||||||||||||||||
| Operating leases |
71,527 | 14,275 | 21,074 | 13,158 | 23,020 | 0 | ||||||||||||||||||
| Purchase obligations (2) |
47,004 | 11,665 | 18,539 | 16,800 | 0 | 0 | ||||||||||||||||||
| Other long-term liabilities (3) |
31,912 | 1,310 | 2,868 | 3,167 | 24,567 | 0 | ||||||||||||||||||
| Total |
$ | 8,746,458 | $ | 2,571,761 | $ | 1,423,685 | $ | 383,430 | $ | 991,394 | $ | 3,376,188 | ||||||||||||
| (1) | Excludes interest payments. Deposits with indeterminate maturities are composed of transaction, savings and MMDA accounts. See Notes 8—11 of “Notes to Consolidated Financial Statements.” |
| (2) | Excludes recurring accounts payable amounts due in the first quarter of 2011. |
| (3) | Includes amounts associated with retirement and benefit plans and other compensation arrangements. The amounts represent the total future potential payouts assuming all current participants become fully vested in their respective plans or arrangements. See Note 18 of “Notes to Consolidated Financial Statements.” |
For discussion of commitments to extend credit, see Note 17 of “Notes to Consolidated Financial Statements.” For a discussion of derivative transactions associated with our mortgage banking operations, and interest rate swaps transactions with loan customers, see Note 1 of Notes to Consolidated Financial Statements, and Item 1 “Business—Lending—Derivatives and Hedging.”
During the third quarter of 2010, Sterling Savings Bank returned to a well-capitalized status following the termination of the FDIC cease and desist order, with the termination of the order occurring subsequent to Sterling receiving aggregate proceeds of $730.0 million in connection with the Recapitalization Transactions and Sterling downstreaming $650.0 million to Sterling Savings Bank in the form of a common stock investment. See “—Recent Developments” for further discussion.
Sterling’s total shareholders’ equity was $770.8 million at December 31, 2010, compared with $323.2 million at December 31, 2009, with the increase reflecting the receipt of the proceeds from the Recapitalization, partially offset by the loss during the period. Shareholders’ equity was 8.12% of total assets at December 31, 2010, compared with 2.97% at December 31, 2009.
Sterling has various outstanding series of junior subordinated debentures issued to investors. The junior subordinated debentures are treated as debt of Sterling, and qualify as Tier 1 capital, subject to certain limitations. During the third quarter of 2009, Sterling elected to defer regularly scheduled interest payments on these securities, and continued to
| TX69 |
Table of Contents
defer these payments through December 31, 2010. As of December 31, 2010 and 2009, the accrued deferred interest was $9.4 million and $3.4 million, respectively. Sterling is allowed to defer payments of interest on the junior subordinated notes for up to 20 consecutive quarterly periods without triggering an event of default.
On September 27, 2010, Sterling announced that its banking regulators had terminated the cease and desist order put in place in October 2009 with Sterling Savings Bank, reflecting a strengthened balance sheet and capital position. Although the cease and desist is no longer applicable, Sterling Savings Bank will continue to be subject to enhanced supervisory review by the FDIC and WDFI under the SSB MOU, pursuant to which Sterling Savings Bank must maintain Tier 1 capital in an amount that ensures that its leverage ratio is at least 8 percent. Sterling Savings Bank will also be required to meet certain asset quality targets, develop a written capital plan, develop a three-year strategic plan and comply with other requirements.
As of the date of this filing, Sterling continues to be subject to the Reserve Bank Agreement. Under the terms of the Reserve Bank Agreement, Sterling is subject to restrictions on its ability to pay dividends and distributions, incur debt, purchase or redeem its stock and appoint new board members or senior executive officers. Under the Reserve Bank Agreement, Sterling is also required to act as a source of strength to Sterling Savings Bank and to report quarterly to the Reserve Bank on steps taken to improve its capital ratios and risk, liquidity and fund management and on other matters.
Recent Accounting Pronouncements
In June 2009, the Financial Accounting Standards Board (the “FASB”) issued Accounting Standards Update (“ASU”) 2009-16, “Accounting for Transfers of Financial Assets.” This standard removes the concept of qualifying special-purpose entities as an accounting criteria that had provided an exception to consolidation, provided additional guidance on requirements for consolidation, and is an update to codification topic 860. This guidance became effective for Sterling on January 1, 2010, and did not have a material impact on its consolidated financial statements.
In January 2010, the FASB issued ASU 2010-06, “Fair Value Measurements and Disclosures.” This guidance is related to implementation of fair value measurement disclosures. This update to the codification topic 820 specifically addresses: 1) transfers between levels 1, 2 and 3 of the fair value hierarchy; 2) level of disaggregation of derivative contracts for fair value measurement disclosures; and 3) disclosures about fair value measurement inputs and valuation techniques. This guidance became effective for Sterling on March 31, 2010, and did not have a material impact on its consolidated financial statements.
In February 2010, the FASB issued ASU 2010-09, “Amendments to Certain Recognition and Disclosure Requirements,” that standardizes accounting for and disclosures of events that occur after the balance sheet date but before financial statements are issued or are available to be issued, and was an update to codification topic 855. As a public reporting company, Sterling is required to evaluate subsequent events through the date its financial statements are issued. The adoption of these rules did not have a material impact on Sterling’s consolidated financial statements.
In April 2010, the FASB issued ASU 2010-18, “Effect of a Loan Modification When the Loan Is Part of a Pool That Is Accounted for as a Single Asset.” This update addresses modifications of loans that are accounted for within a pool by specifying that a troubled debt restructuring would not result in the removal of those loans from the pool for impairment analysis purposes. This guidance will be effective for Sterling as of September 30, 2010. Sterling does not currently have any loans for which this guidance would be applicable.
In July 2010, the FASB issued ASU 2010-20, “Disclosures about the Credit Quality of Financing Receivables and the Allowance for Credit Losses.” This update amends codification topic 310 on receivables to improve the disclosures that an entity provides about the credit quality of its financing receivables and the related allowance for credit losses. As a result of these amendments, an entity is required to disaggregate by portfolio segment or class certain existing disclosures and provide certain new disclosures about its financing receivables and related allowance for credit losses. This guidance is being phased in, with the new disclosure
| TX70 |
Table of Contents
requirements for period end balances effective as of December 31, 2010, and the new disclosure requirements for activity during the reporting period are effective March 31, 2011. The troubled debt restructuring disclosures in this ASU have been delayed by ASU 2011-01, “Deferral of the Effective Date of Disclosures about Troubled Debt Restructurings in Update No. 2010-20,” which was issued in January 2011.
Effects of Inflation and Changing Prices
A financial institution has an asset and liability structure that is interest-rate sensitive. As a holder of monetary assets and liabilities, an institution’s performance may be significantly influenced by changes in interest rates. Although changes in the prices of goods and services do not necessarily move in the same direction as interest rates, increases in inflation generally have resulted in increased interest rates, which may have an adverse effect on Sterling’s business.
Item 7A. Quantitative and Qualitative Disclosures About Market Risk
For a discussion of Sterling’s market risk, see “MD&A—Asset and Liability Management.”
Item 8. Financial Statements and Supplementary Data
The required information is contained on pages F-1 through F-50 of this Form 10-K.
Item 9. Changes in and Disagreements with Accountants on Accounting and Financial Disclosure
There were no disagreements with Sterling’s independent accountants on accounting and financial disclosures.
Item 9A. Controls and Procedures
Sterling’s management, with the participation of Sterling’s principal executive officer and principal financial officer, has evaluated the effectiveness of Sterling’s disclosure controls and procedures (as such term is defined in Rules 13a-15(e) and 15d-15(e) under the Exchange Act) as of the end of the period covered by this report. Based on such evaluation, Sterling’s principal executive officer and principal financial officer have concluded that, as of the end of such period, Sterling’s disclosure controls and procedures are effective in recording, processing, summarizing and reporting, on a timely basis, information required to be disclosed by Sterling in the reports that it files or submits under the Exchange Act.
There were no changes in internal control over financial reporting (as defined in Exchange Act Rules 13a-15(f) and 15d-15(f)), during the fourth fiscal quarter that has materially affected, or is reasonably likely to materially affect, Sterling’s internal control over financial reporting.
Management’s Report on Internal Control Over Financial Reporting
Sterling’s management, including the principal executive officer and principal financial officer, is responsible for establishing and maintaining adequate internal control over financial reporting, as such term is defined in Exchange Act Rules 13a-15(f). Under the supervision and with the participation of Sterling’s management, Sterling conducted an evaluation of the effectiveness of its internal control over financial reporting based on the framework described in Internal Control—Integrated Framework issued by the Committee of Sponsoring Organizations of the Treadway Commission (the “COSO Criteria”). Based on management’s evaluation under the COSO Criteria, Sterling’s management has concluded that Sterling’s internal control over financial reporting was effective as of December 31, 2010.
The effectiveness of Sterling’s internal control over financial reporting as of December 31, 2010 has been attested to by BDO USA, LLP, the independent registered public accounting firm that audited the financial statements included in Sterling’s annual report on Form 10-K, as stated in their report which is included herein.
| TX71 |
Table of Contents
Report of Independent Registered Public Accounting Firm
Board of Directors and Shareholders
Sterling Financial Corporation
Spokane, Washington
We have audited Sterling Financial Corporation’s internal control over financial reporting as of December 31, 2010, based on criteria established in Internal Control—Integrated Framework issued by the Committee of Sponsoring Organizations of the Treadway Commission (the COSO criteria). Sterling Financial Corporation’s management is responsible for maintaining effective internal control over financial reporting and for its assessment of the effectiveness of internal control over financial reporting, included in the accompanying Management’s Report on Internal Control Over Financial Reporting. Our responsibility is to express an opinion on the company’s internal control over financial reporting based on our audit.
We conducted our audit in accordance with the standards of the Public Company Accounting Oversight Board (United States). Those standards require that we plan and perform the audit to obtain reasonable assurance about whether effective internal control over financial reporting was maintained in all material respects. Our audit included obtaining an understanding of internal control over financial reporting, assessing the risk that a material weakness exists, and testing and evaluating the design and operating effectiveness of internal control based on the assessed risk. Our audit also included performing such other procedures as we considered necessary in the circumstances. We believe that our audit provides a reasonable basis for our opinion.
A company’s internal control over financial reporting is a process designed to provide reasonable assurance regarding the reliability of financial reporting and the preparation of financial statements for external purposes in accordance with generally accepted accounting principles. A company’s internal control over financial reporting includes those policies and procedures that (1) pertain to the maintenance of records that, in reasonable detail, accurately and fairly reflect the transactions and dispositions of the assets of the company; (2) provide reasonable assurance that transactions are recorded as necessary to permit preparation of financial statements in accordance with generally accepted accounting principles, and that receipts and expenditures of the company are being made only in accordance with authorizations of management and directors of the company; and (3) provide reasonable assurance regarding prevention or timely detection of unauthorized acquisition, use, or disposition of the company’s assets that could have a material effect on the financial statements.
Because of its inherent limitations, internal control over financial reporting may not prevent or detect misstatements. Also, projections of any evaluation of effectiveness to future periods are subject to the risk that controls may become inadequate because of changes in conditions, or that the degree of compliance with the policies or procedures may deteriorate.
In our opinion, Sterling Financial Corporation maintained, in all material respects, effective internal control over financial reporting as of December 31, 2010, based on the COSO criteria.
We also have audited, in accordance with the standards of the Public Company Accounting Oversight Board (United States), the consolidated balance sheets of Sterling Financial Corporation as of December 31, 2010 and 2009, and the related consolidated statements of operations, comprehensive income (loss), changes in shareholders’ equity, and cash flows for each of the three years in the period ended December 31, 2010, and our report dated March 8, 2011, expressed an unqualified opinion thereon.
BDO USA, LLP
Spokane, Washington
March 8, 2011
| TX72 |
Table of Contents
None.
| PART III |
Item 10. Directors, Executive Officers and Corporate Governance
In response to this Item, the information set forth in Sterling’s Proxy Statement for its 2010 annual meeting of shareholders, under the headings “Board of Directors of Sterling Financial Corporation,” “Executive Officers,” and “Section 16(a) Beneficial Ownership Reporting Compliance” is incorporated herein by reference.
Information concerning Sterling’s Audit Committee and the Audit Committee’s financial expert is set forth under the caption “Information Concerning the Board of Directors and Its Committees - Committees of the Board of Directors” in Sterling’s Proxy Statement and is incorporated herein by reference.
Sterling has adopted a Code of Ethics that applies to all Sterling employees and directors, including Sterling’s senior financial officers. The Code of Ethics is publicly available on Sterling’s website at www.sterlingfinancialcorporation-spokane.com.
Item 11. Executive Compensation
In response to this Item, the information set forth in the Proxy Statement under the headings “Executive Compensation,” “Personnel Committee Report,” and “Personnel Committee Interlocks and Insider Participation” is incorporated herein by reference.
Item 12. Security Ownership of Certain Beneficial Owners and Management and Related Stockholder Matters
In response to this Item, the information set forth in the Proxy Statement under the headings “Security Ownership of Management and Certain Beneficial Owners” and “Equity Compensation Plan Information” is incorporated herein by reference.
Item 13. Certain Relationships and Related Transactions, and Director Independence
In response to this Item, the information set forth in the Proxy Statement under the headings “Interests of Directors, Officers and Others in Certain Transactions” and “Corporate Governance—Affirmative Determinations Regarding Director Independence” is incorporated herein by reference.
Item 14. Principal Accounting Fees and Services
In response to this Item, the information set forth in the Proxy Statement under the headings “Independent Public Accounting Firm’s Fees,” “Pre-Approval of Audit and Non-Audit Services” and “Audit Committee Report,” is incorporated herein by reference.
| TX73 |
Table of Contents
| PART IV |
Item 15. Exhibits, Financial Statement Schedules
| (a) | Documents which are filed as a part of this report: |
| 1. | Financial Statements: The required financial statements are contained in pages F-1 through F-50 of this Form 10-K. |
| 2. | Financial Statement Schedules: Financial statement schedules have been omitted as they are not applicable or the information is included in the Consolidated Financial Statements. |
| 3. | Exhibits: The exhibits filed as part of this report and the exhibits incorporated herein by reference are listed in the Exhibit Index at page E-1. |
| (b) | See (a)(3) above for all exhibits filed herewith. |
| (c) | All schedules are omitted as the required information is not applicable or the information is presented in the Consolidated Financial Statements or related notes. |
| TX74 |
Table of Contents
Pursuant to the requirements of Section 13 or 15(d) of the Securities Exchange Act of 1934, as amended, the registrant has duly caused this report to be signed on its behalf by the undersigned, thereunto duly authorized.
STERLING FINANCIAL CORPORATION
| /s/ J. Gregory Seibly J. Gregory Seibly |
President, Chief Executive Officer and Director |
March 8, 2011 |
Pursuant to the requirements of the Securities Exchange Act of 1934, as amended, this report has been signed below by the following persons on behalf of the registrant and in the capacities and on the dates indicated.
| /s/ J. Gregory Seibly J. Gregory Seibly |
President, Chief Executive Officer and Director | March 8, 2011 | ||
| /s/ Patrick J. Rusnak Patrick J. Rusnak |
Executive Vice President and Principal Financial Officer | March 8, 2011 | ||
| /s/ Robert G. Butterfield Robert G. Butterfield |
Senior Vice President, Controller and Principal Accounting Officer | March 8, 2011 | ||
| /s/ Leslie S. Biller Leslie S. Biller |
Chairman of the Board | March 8, 2011 | ||
| /s/ Ellen R.M. Boyer Ellen R.M. Boyer |
Director | March 8, 2011 | ||
| /s/ David A. Coulter David A. Coulter |
Director | March 8, 2011 | ||
| /s/ Robert C. Donegan Robert C. Donegan |
Director | March 8, 2011 | ||
| /s/ William L. Eisenhart William L. Eisenhart |
Director | March 8, 2011 | ||
| /s/ Robert H. Hartheimer Robert H. Hartheimer |
Director | March 8, 2011 | ||
| /s/ Scott L. Jaeckel Scott L. Jaeckel |
Director | March 8, 2011 | ||
| /s/ Michael F. Reuling Michael F. Reuling |
Director | March 8, 2011 | ||
| TX75 |
Table of Contents
| Exhibit No. |
Exhibit Index | |
| 3.1 | Restated Articles of Incorporation of Sterling. Filed as Exhibit 4.1 to Sterling’s Amendment No. 1 to the Registration Statement on Form S-3 dated May 8, 2009, and incorporated by reference herein. | |
| 3.2 | Articles of Amendment of Restated Articles of Incorporation of Sterling increasing the authorized shares of common stock. Filed as Exhibit 4.2 to Sterling’s Amendment No. 1 to the Registration Statement on Form S-3 dated September 21, 2009, and incorporated by reference herein. | |
| 3.3 | Articles of Amendment to Sterling’s Restated Articles of Incorporation designating Fixed Rate Cumulative Mandatorily Convertible Preferred Stock, Series C. Filed as Exhibit 3.1 to Sterling’s Current Report on Form 8-K dated August 30, 2010, and incorporated by reference herein. | |
| 3.4 | Articles of Amendment to Sterling’s Restated Articles of Incorporation eliminating par value of Sterling Common Stock. Filed as Exhibit 3.2 to Sterling’s Current Report on Form 8-K dated August 30, 2010, and incorporated by reference herein. | |
| 3.5 | Articles of Amendment to Sterling’s Restated Articles of Incorporation designating Fixed Rate Cumulative Mandatorily Convertible Preferred Stock, Series B. Filed as Exhibit 3.3 to Sterling’s Current Report on Form 8-K dated August 30, 2010, and incorporated by reference herein. | |
| 3.6 | Articles of Amendment to Sterling’s Restated Articles of Incorporation designating Fixed Rate Cumulative Mandatorily Convertible Preferred Stock, Series D. Filed as Exhibit 3.4 to Sterling’s Current Report on Form 8-K dated August 30, 2010, and incorporated by reference herein. | |
| 3.7 | Articles of Amendment to Sterling’s Restated Articles of Incorporation increasing the authorized shares of common stock. Filed as Exhibit 3.7 to Sterling’s Amendment No. 1 to the Registration Statement on Form S-1 dated November 3, 2010, and incorporated by reference herein. | |
| 3.8 | Articles of Amendment to Sterling’s Restated Articles of Incorporation reducing the authorized shares of common stock. Filed as Exhibit 3.1 to Sterling’s Current Report on Form 8-K dated November 18, 2010, and incorporated by reference herein. | |
| 3.9 | Articles of Amendment to Sterling’s Restated Articles of Incorporation regarding certain transfer restrictions. Filed herewith. | |
| 3.10 | Amended and Restated Bylaws of Sterling. Filed as Exhibit 4.3 to Sterling’s Registration Statement on Form S-3 dated January 6, 2009, and incorporated by referenced herein. | |
| 4.1 | Reference is made to Exhibits 3.1 through 3.10. | |
| 4.2 | Form of Common Stock Certificate. Filed as Exhibit 4.3 to Sterling’s Registration Statement on Form S-3 dated July 20, 2009, and incorporated by reference herein. | |
| 4.3 | Shareholder Rights Plan, dated as of April 14, 2010, between Sterling Financial Corporation and American Stock Transfer & Trust Company, LLC, as Rights Agent, which includes the Form of Articles of Amendment to the Restated Articles of Incorporation of Sterling Financial Corporation (Series E Participating Cumulative Preferred Stock) as Exhibit A, the Summary of Terms of the Rights Agreement as Exhibit B and the Form of Right Certificate as Exhibit C. Filed as Exhibit 4.1 to Sterling’s Current Report on Form 8-K filed on April 15, 2010, and incorporated by reference herein. | |
| 4.4 | First Amendment to Shareholder Rights Plan, dated as of December 8, 2010, between Sterling Financial Corporation and American Stock Transfer & Trust Company, LLC, as Rights Agent. Filed as Exhibit 4.1 to Sterling’s Current Report on Form 8-K filed on December 10, 2010, and incorporated by reference herein. | |
| 4.5 | Form of Warrant to Purchase Shares of Sterling Common Stock, dated August 26, 2010 and issued to Thomas H. Lee Equity Fund VI, L.P., Thomas H. Lee Parallel Fund VI, L.P., Thomas H. Lee Parallel (DT) Fund VI, L.P. and THL Sterling Equity Investors, L.P. Filed as Exhibit 4.7 to Sterling’s Registration Statement on Form S-1 dated September 24, 2010 and incorporated by reference herein. | |
| E-EXIND1 |
Table of Contents
| Exhibit No. |
Exhibit Index | |
| 4.6 | Form of Warrant to Purchase Shares of Sterling Common Stock, dated August 26, 2010 and issued to Warburg Pincus Private Equity X, L.P. Filed as Exhibit 4.8 to Sterling’s Registration Statement on Form S-1 dated September 24, 2010 and incorporated by reference herein. | |
| 4.7 | Amended and Restated Warrant to purchase shares of Sterling Common Stock, dated August 26, 2010 and issued to the United States Department of the Treasury. Filed as Exhibit 4.9 to Sterling’s Registration Statement on Form S-1 dated September 24, 2010 and incorporated by reference herein. | |
| 4.9 | Sterling has outstanding certain long-term debt. None of such debt exceeds ten percent of Sterling’s total assets; therefore, copies of the constituent instruments defining the rights of the holders of such debt are not included as exhibits. Copies of instruments with respect to such long-term debt will be furnished to the Securities and Exchange Commission upon request. | |
| 10.1 | First Amendment to Second Amended and Restated Investment Agreement by and between Sterling Financial Corporation and Thomas H. Lee Equity Fund VI, L.P., Thomas H. Lee Parallel Fund VI, L.P., Thomas H. Lee Parallel (DT) Fund VI, L.P. and THL Sterling Equity Investors, L.P. Filed as Exhibit 10.1 to Sterling’s Current Report on Form 8-K dated August 20, 2010, and incorporated by reference herein. | |
| 10.2 | First Amendment to the Investment Agreement by and between Sterling Financial Corporation and Warburg Pincus Private Equity X, L.P. Filed as Exhibit 10.2 to Sterling’s Current Report on Form 8-K dated August 20, 2010, and incorporated by reference herein. | |
| 10.3 | Form of Subscription Agreement by and between Sterling Financial Corporation and private placement investors. Filed as Exhibit 10.3 to Sterling’s Current Report on Form 8-K dated August 20, 2010, and incorporated by reference herein. | |
| 10.4 | Second Amended and Restated Investment Agreement, dated as of May 25, 2010, between Sterling Financial Corporation and Thomas H. Lee Equity Fund VI, L.P., Thomas H. Lee Parallel Fund VI, L.P., and Thomas H. Lee Parallel (DT) Fund VI, L.P. Filed as Exhibit 10.1 to Sterling’s Current Report on Form 8-K filed on May 27, 2010, and incorporated by reference herein. | |
| 10.5 | Investment Agreement, dated as of May 25, 2010, between Sterling Financial Corporation and Warburg Pincus Private Equity X, L.P. Filed as Exhibit 10.2 to Sterling’s Current Report on Form 8-K filed on May 27, 2010, and incorporated by reference herein. | |
| 10.6 | Amended and Restated Investment Agreement, dated as of May 25, 2010, between Sterling Financial Corporation and Thomas H. Lee Equity Fund VI, L.P., Thomas H. Lee Parallel Fund VI, L.P., and Thomas H. Lee Parallel (DT) Fund VI, L.P. Filed as Exhibit 10.1 to Sterling’s Current Report on Form 8-K filed on May 6, 2010, and incorporated by reference herein. | |
| 10.7 | Investment Agreement, dated as of May 5, 2010, between Sterling Financial Corporation and Thomas H. Lee Equity Fund VI, L.P., Thomas H. Lee Parallel Fund VI, L.P. and Thomas H. Lee Parallel (DT) Fund VI, L.P. Filed as Exhibit 10.1 to Sterling’s Quarterly Report on Form 10-Q for the period ended March 31, 2010, dated May 3, 2010, and incorporated by reference herein. | |
| 10.8 | Exchange Agreement, dated April 29, 2010 by and between Sterling and the U. S. Department of the Treasury. Filed as Exhibit 10.2 to Sterling’s Quarterly Report on Form 10-Q for the period ended March 31, 2010, dated May 3, 2010, and incorporated by reference herein. | |
| 10.9 | Reference is made to Exhibits 4.3 and 4.4. | |
| 10.10 | Letter Agreement, dated December 5, 2008, between Sterling and the U. S. Department of the Treasury. Filed as Exhibit 10.1 to Sterling’s Current Report on Form 8-K dated December 8, 2008, and incorporated by reference herein. | |
| E-EXIND2 |
Table of Contents
| Exhibit No. |
Exhibit Index | |
| 10.11 | Employment Agreement by and between Sterling and Daniel G. Byrne, dated January 31, 2011. Filed herewith. | |
| 10.12 | Offer Letter by and between Sterling and Patrick J. Rusnak, dated January 21, 2011. Filed as Exhibit 10.1 to Sterling’s Current Report on Form 8-K dated February 17, 2011, and incorporated by reference herein. | |
| 10.13 | Offer Letter by and between Sterling and David S. DePillo, dated October 19, 2010. Filed as Exhibit 10.6 to Sterling’s Quarterly Report on Form 10-Q dated November 5, 2010, and incorporated by reference herein. | |
| 10.14 | Offer Letter by and between Sterling and Leslie S. Biller, dated August 26, 2010. Filed as Exhibit 10.1 to Sterling’s Current Report on Form 8-K dated August 30, 2010, and incorporated by reference herein. | |
| 10.15 | Employment Agreement by and between Sterling and J. Gregory Seibly, dated August 28, 2008. Filed as Exhibit 10.7 to Sterling’s Annual Report on Form 10-K dated March 6, 2009, and incorporated by reference herein. | |
| 10.16 | Employment Agreement by and between Sterling and Ezra A. Eckhardt, dated August 27, 2008. Filed herewith. | |
| 10.17 | Amended and Restated Employment Agreement by and between Sterling and Daniel G. Byrne. Filed as Exhibit 10.3 to Sterling’s Current Report on Form 8-K dated August 11, 2008, and incorporated by reference herein. | |
| 10.18 | Form of First Amendment to the Amended and Restated Employment Agreement by and between Sterling and Daniel G. Byrne and J. Gregory Seibly, entered into on December 4, 2008. Filed as exhibit 10.2 to Sterling’s Current Report on Form 8-K dated December 8, 2008, and incorporated by reference herein. | |
| 10.19 | Sterling Financial Corporation 2007 Long-Term Incentive Plan. Filed as Exhibit 99.1 to Sterling’s Registration Statement on Form S-8 dated July 30, 2007, and incorporated by reference herein. | |
| 10.20 | Sterling Financial Corporation 2003 Long-Term Incentive Plan. Filed as Exhibit 10.10 to Sterling’s Annual Report on Form 10-K for the year ended December 31, 2009, dated March 16, 2010, and incorporated by reference herein. | |
| 10.21 | Sterling Financial Corporation 2001 Long-Term Incentive Plan. Filed as Exhibit 10.9 to Sterling’s Annual Report on Form 10-K for the year ended December 31, 2009, dated March 16, 2010, and incorporated by reference herein. | |
| 10.22 | Sterling Financial Corporation 1998 Long-Term Incentive Plan. Filed as Exhibit 10.7 to Sterling’s Annual Report on Form 10-K for the year ended December 31, 2009, dated March 16, 2010, and incorporated by reference herein. | |
| 10.23 | Sterling Savings Bank Deferred Compensation Plan, effective date April 1, 2006. Filed as Exhibit 10.6 to Sterling’s Annual Report on Form 10-K dated February 28, 2007, and incorporated by reference herein. | |
| 10.24 | Sterling Financial Corporation Amended and Restated Deferred Compensation Plan, effective July 1, 1999. Filed as Exhibit 10.8 to Sterling’s Annual Report on Form 10-K for the year ended December 31, 2009, dated March 16, 2010, and incorporated by reference herein. | |
| 10.25 | Sterling Financial Corporation and Sterling Savings Bank Supplemental Executive Retirement Plan. Filed as Exhibit 10.12 to Sterling’s Annual Report on Form 10-K for the year ended December 31, 2009, dated March 16, 2010, and incorporated by reference herein. | |
| E-EXIND3 |
Table of Contents
| Exhibit No. |
Exhibit Index | |
| 12.1 | Statement of Ratio of Earnings to Fixed Charges and Preferred Dividends. | |
| 21.1 | List of Subsidiaries of Sterling. | |
| 23.1 | Consent of BDO USA, LLP, formerly known as BDO Seidman, LLP. | |
| 31.1 | Certification of Principal Executive Officer pursuant to Section 302 of the Sarbanes-Oxley Act of 2002. Filed herewith. | |
| 31.2 | Certification of Principal Financial Officer pursuant to Section 302 of the Sarbanes-Oxley Act of 2002. Filed herewith. | |
| 32.1 | Certification of Principal Executive Officer pursuant to 18 U.S.C. Section 1350, as adopted pursuant to Section 906 of the Sarbanes-Oxley Act of 2002. Furnished herewith. | |
| 32.2 | Certification of Principal Financial Officer pursuant to 18 U.S.C. Section 1350, as adopted pursuant to Section 906 of the Sarbanes-Oxley Act of 2002. Furnished herewith. | |
| 99.1 | Certification of Principal Executive Officer pursuant to Section 111(b)(4) of the Emergency Economic Stabilization Act of 2008. Filed herewith. | |
| 99.2 | Certification of Principal Financial Officer pursuant to Section 111(b)(4) of the Emergency Economic Stabilization Act of 2008. Filed herewith. | |
| E-EXIND4 |
Table of Contents
Report of Independent Registered Public Accounting Firm
Board of Directors and Shareholders
Sterling Financial Corporation
Spokane, Washington
We have audited the accompanying consolidated balance sheets of Sterling Financial Corporation as of December 31, 2010 and 2009, and the related consolidated statements of operations, comprehensive income (loss), changes in shareholders’ equity, and cash flows for each of the three years in the period ended December 31, 2010. These financial statements are the responsibility of the Company’s management. Our responsibility is to express an opinion on these financial statements based on our audits.
We conducted our audits in accordance with the standards of the Public Company Accounting Oversight Board (United States). Those standards require that we plan and perform the audit to obtain reasonable assurance about whether the financial statements are free of material misstatement. An audit includes examining, on a test basis, evidence supporting the amounts and disclosures in the financial statements, assessing the accounting principles used and significant estimates made by management, as well as evaluating the overall financial statement presentation. We believe that our audits provide a reasonable basis for our opinion.
In our opinion, the consolidated financial statements referred to above present fairly, in all material respects, the financial position of Sterling Financial Corporation at December 31, 2010 and 2009, and the results of its operations and its cash flows for each of the three years in the period ended December 31, 2010, in conformity with accounting principles generally accepted in the United States of America.
We also have audited, in accordance with the standards of the Public Company Accounting Oversight Board (United States), Sterling Financial Corporation's internal control over financial reporting as of December 31, 2010, based on criteria established in Internal Control—Integrated Framework issued by the Committee of Sponsoring Organizations of the Treadway Commission (COSO) and our report dated March 8, 2011, expressed an unqualified opinion thereon.
BDO USA, LLP
Spokane, Washington
March 8, 2011
| F-FIN1 |
Table of Contents
Sterling Financial Corporation
Consolidated Balance Sheets
December 31, 2010 and 2009
(Dollars in thousands)
| 2010 | 2009 | |||||||
| ASSETS: |
||||||||
| Cash and cash equivalents: |
||||||||
| Interest bearing |
$ | 341,425 | $ | 424,008 | ||||
| Noninterest bearing |
70,158 | 140,775 | ||||||
| Total cash and cash equivalents |
411,583 | 564,783 | ||||||
| Restricted cash |
15,681 | 8,223 | ||||||
| Investments and mortgage-backed securities (“MBS”): |
||||||||
| Available for sale |
2,825,010 | 2,160,325 | ||||||
| Held to maturity |
13,464 | 17,646 | ||||||
| Loans receivable, net |
5,379,081 | 7,344,199 | ||||||
| Loans held for sale (at fair value: $222,216 and $189,185) |
222,216 | 190,412 | ||||||
| Accrued interest receivable |
34,087 | 43,869 | ||||||
| Other real estate owned, net (“OREO”) |
161,653 | 83,272 | ||||||
| Property and equipment, net |
81,094 | 92,037 | ||||||
| Bank-owned life insurance (“BOLI”) |
169,288 | 164,743 | ||||||
| Other intangible assets, net |
16,929 | 21,827 | ||||||
| Mortgage servicing rights, net |
20,604 | 12,062 | ||||||
| Other assets |
142,479 | 174,025 | ||||||
| Total assets |
$ | 9,493,169 | $ | 10,877,423 | ||||
| LIABILITIES: |
||||||||
| Deposits: |
||||||||
| Noninterest bearing |
$ | 992,368 | $ | 1,001,771 | ||||
| Interest bearing |
5,918,639 | 6,773,419 | ||||||
| Total deposits |
6,911,007 | 7,775,190 | ||||||
| Advances from Federal Home Loan Bank (“FHLB”) |
407,211 | 1,337,167 | ||||||
| Securities sold subject to repurchase agreements and funds purchased |
1,032,512 | 1,049,146 | ||||||
| Other borrowings |
245,285 | 248,281 | ||||||
| Borrowers’ reserves for taxes and insurance |
2,663 | 2,283 | ||||||
| Accrued interest payable |
17,259 | 22,245 | ||||||
| Accrued expenses and other liabilities |
106,465 | 119,862 | ||||||
| Total liabilities |
8,722,402 | 10,554,174 | ||||||
| Commitments and contingencies |
||||||||
| SHAREHOLDERS’ EQUITY: |
||||||||
| Preferred stock—Series A |
0 | 294,136 | ||||||
| Common stock—61,926,187 and 791,077 shares outstanding |
1,960,871 | 962,874 | ||||||
| Accumulated other comprehensive (loss) income |
(4,179 | ) | 16,284 | |||||
| Accumulated deficit |
(1,185,925 | ) | (950,045 | ) | ||||
| Total shareholders’ equity |
770,767 | 323,249 | ||||||
| Total liabilities and shareholders’ equity |
$ | 9,493,169 | $ | 10,877,423 | ||||
See accompanying summary of significant accounting policies and notes to consolidated financial statements.
| F-FIN2 |
Table of Contents
Sterling Financial Corporation
Consolidated Statements of Operations
For the Years Ended December 31, 2010, 2009 and 2008
(Dollars in thousands, except per share amounts)
| 2010 | 2009 | 2008 | ||||||||||
| Interest income: |
||||||||||||
| Loans |
$ | 359,572 | $ | 479,436 | $ | 599,192 | ||||||
| MBS |
74,806 | 108,513 | 102,863 | |||||||||
| Investments and cash equivalents |
10,755 | 11,398 | 13,007 | |||||||||
| Total interest income |
445,133 | 599,347 | 715,062 | |||||||||
| Interest expense: |
||||||||||||
| Deposits |
94,707 | 169,261 | 234,337 | |||||||||
| Short-term borrowings |
6,517 | 16,476 | 20,820 | |||||||||
| Long-term borrowings |
59,882 | 69,633 | 100,353 | |||||||||
| Total interest expense |
161,106 | 255,370 | 355,510 | |||||||||
| Net interest income |
284,027 | 343,977 | 359,552 | |||||||||
| Provision for credit losses |
250,229 | 681,371 | 333,597 | |||||||||
| Net interest income (expense) after provision for credit losses |
33,798 | (337,394 | ) | 25,955 | ||||||||
| Noninterest income: |
||||||||||||
| Fees and service charges |
54,740 | 58,326 | 59,867 | |||||||||
| Mortgage banking operations |
62,564 | 47,298 | 27,651 | |||||||||
| Gains on sales of securities |
25,745 | 13,467 | 409 | |||||||||
| BOLI |
7,307 | 6,954 | 5,286 | |||||||||
| Loan servicing fees |
3,762 | 2,378 | 431 | |||||||||
| Charge on prepayment of debt |
(11,296 | ) | 0 | 0 | ||||||||
| Other |
(5,857 | ) | (4,609 | ) | (1,749 | ) | ||||||
| Total noninterest income |
136,965 | 123,814 | 91,895 | |||||||||
| Noninterest expense before impairment charge |
395,045 | 369,974 | 305,517 | |||||||||
| Goodwill impairment |
0 | 227,558 | 223,765 | |||||||||
| Total noninterest expense |
395,045 | 597,532 | 529,282 | |||||||||
| Loss before income taxes |
(224,282 | ) | (811,112 | ) | (411,432 | ) | ||||||
| Income tax (provision) benefit |
||||||||||||
| Current |
113 | 51,266 | 16,638 | |||||||||
| Deferred |
(113 | ) | (78,248 | ) | 59,260 | |||||||
| Total tax (provision) benefit |
0 | (26,982 | ) | 75,898 | ||||||||
| Net loss |
(224,282 | ) | (838,094 | ) | (335,534 | ) | ||||||
| Preferred stock dividends and accretion |
(11,598 | ) | (17,369 | ) | (1,208 | ) | ||||||
| Other shareholder allocations |
(520,263 | ) | 0 | 0 | ||||||||
| Net loss available to common shareholders |
$ | (756,143 | ) | $ | (855,463 | ) | $ | (336,742 | ) | |||
| Loss per share—basic |
$ | (53.05 | ) | $ | (1,087.41 | ) | $ | (429.70 | ) | |||
| Loss per share—diluted |
$ | (53.05 | ) | $ | (1,087.41 | ) | $ | (429.70 | ) | |||
| Weighted average shares outstanding—basic |
14,253,869 | 786,701 | 783,662 | |||||||||
| Weighted average shares outstanding—diluted |
14,253,869 | 786,701 | 783,662 | |||||||||
See accompanying summary of significant accounting policies and notes to consolidated financial statements.
| F-FIN3 |
Table of Contents
Sterling Financial Corporation
Consolidated Statements of Comprehensive Income (Loss)
For the Years Ended December 31, 2010, 2009 and 2008
(Dollars in thousands)
| 2010 | 2009 | 2008 | ||||||||||
| Net loss |
$ | (224,282 | ) | $ | (838,094 | ) | $ | (335,534 | ) | |||
| Other comprehensive income (loss): |
||||||||||||
| Change in unrealized gains or losses on investments and MBS available for sale, net of reclassification adjustments |
(32,286 | ) | 54,358 | (71 | ) | |||||||
| Less deferred income tax benefit (provision) |
11,823 | (20,208 | ) | 172 | ||||||||
| Net other comprehensive (loss) income |
(20,463 | ) | 34,150 | 101 | ||||||||
| Comprehensive loss |
$ | (244,745 | ) | $ | (803,944 | ) | $ | (335,433 | ) | |||
See accompanying summary of significant accounting policies and notes to consolidated financial statements.
| F-FIN4 |
Table of Contents
Sterling Financial Corporation
Consolidated Statements of Changes in Shareholders' Equity
For the Years Ended December 31, 2010, 2009 and 2008
(Dollars in thousands)
| Preferred Stock | Common Stock | Accumulated Other Comprehensive Income (Loss) |
Retained Earnings (Deficit) |
Total Shareholders' Equity |
||||||||||||||||||||||||
| Shares | Amount | Shares | Amount | |||||||||||||||||||||||||
| Balance, January 1, 2008 |
0 | $ | 0 | 779,643 | $ | 943,484 | $ | (17,967 | ) | $ | 259,813 | $ | 1,185,330 | |||||||||||||||
| Adoption of BOLI EITF 06-4 |
(2,055 | ) | (2,055 | ) | ||||||||||||||||||||||||
| Shares issued in U.S. Treasury Capital Purchase Program |
303,000 | 291,809 | 11,191 | 303,000 | ||||||||||||||||||||||||
| Accretion of preferred stock |
155 | (155 | ) | 0 | ||||||||||||||||||||||||
| Shares issued upon exercise of stock options |
3,593 | 1,390 | 1,390 | |||||||||||||||||||||||||
| Shares issued for 401(k) match and direct stock purchases |
3,239 | 2,015 | 2,015 | |||||||||||||||||||||||||
| Change in unrealized gain or loss on investments and MBS available for sale, net of income tax |
101 | 101 | ||||||||||||||||||||||||||
| Cash common dividends declared |
(15,599 | ) | (15,599 | ) | ||||||||||||||||||||||||
| Cash preferred dividends declared |
(1,052 | ) | (1,052 | ) | ||||||||||||||||||||||||
| Equity based compensation and related tax amounts |
3,435 | 3,440 | 3,440 | |||||||||||||||||||||||||
| Net loss |
(335,534 | ) | (335,534 | ) | ||||||||||||||||||||||||
| Balance, December 31, 2008 |
303,000 | 291,964 | 789,910 | 961,520 | (17,866 | ) | (94,582 | ) | 1,141,036 | |||||||||||||||||||
| Accretion of preferred stock |
2,172 | (2,172 | ) | 0 | ||||||||||||||||||||||||
| Shares issued for direct stock purchases |
205 | 21 | 21 | |||||||||||||||||||||||||
| Change in unrealized gain or loss on investments and MBS available for sale, net of income tax |
34,150 | 34,150 | ||||||||||||||||||||||||||
| Cash preferred dividends declared |
(15,197 | ) | (15,197 | ) | ||||||||||||||||||||||||
| Equity based compensation and related tax amounts |
962 | 1,333 | 1,333 | |||||||||||||||||||||||||
| Net loss |
(838,094 | ) | (838,094 | ) | ||||||||||||||||||||||||
| Balance, December 31, 2009 |
303,000 | 294,136 | 791,077 | 962,874 | 16,284 | (950,045 | ) | 323,249 | ||||||||||||||||||||
| Accretion of preferred stock |
1,248 | (1,248 | ) | 0 | ||||||||||||||||||||||||
| Shares issued in direct stock purchases |
360 | 18 | 18 | |||||||||||||||||||||||||
| Shares of Series B and D preferred stock and common stock issued |
7,300,000 | 604,592 | 4,424,242 | 75,074 | 679,666 | |||||||||||||||||||||||
| Preferred stock beneficial conversion feature |
(604,592 | ) | 604,592 | 0 | ||||||||||||||||||||||||
| Shares issued from Series A preferred stock conversion into Series C preferred stock, and simultaneous conversion into common |
(303,000 | ) | (295,384 | ) | 5,738,636 | 315,248 | 19,864 | |||||||||||||||||||||
| Shares issued from Series B and D preferred stock conversion into common stock |
(7,300,000 | ) | 50,878,788 | – | ||||||||||||||||||||||||
| Change in unrealized gain or loss on investments and MBS available for sale, net of income tax |
(20,463 | ) | (20,463 | ) | ||||||||||||||||||||||||
| Preferred dividend |
(10,350 | ) | (10,350 | ) | ||||||||||||||||||||||||
| Equity based compensation and related tax amounts |
85,740 | 3,065 | 3,065 | |||||||||||||||||||||||||
| Fraction shares issued in stock split |
7,344 | 0 | ||||||||||||||||||||||||||
| Net loss |
(224,282 | ) | (224,282 | ) | ||||||||||||||||||||||||
| Balance, December 31, 2010 |
0 | $ | 0 | 61,926,187 | $ | 1,960,871 | $ | (4,179 | ) | $ | (1,185,925 | ) | $ | 770,767 | ||||||||||||||
See accompanying summary of significant accounting policies and notes to consolidated financial statements.
| F-FIN5 |
Table of Contents
Sterling Financial Corporation
Consolidated Statements of Cash Flows
For the Years Ended December 31, 2010, 2009 and 2008
(Dollars in thousands)
| 2010 | 2009 | 2008 | ||||||||||
| Cash flows from operating activities: |
||||||||||||
| Net loss |
$ | (224,282 | ) | $ | (838,094 | ) | $ | (335,534 | ) | |||
| Adjustments to reconcile net loss to net cash provided by operating activities: |
||||||||||||
| Provisions for credit losses and OREO |
286,988 | 712,392 | 351,225 | |||||||||
| Goodwill impairment |
0 | 227,558 | 223,765 | |||||||||
| Deferred tax asset valuation allowance |
0 | 269,000 | 0 | |||||||||
| Accretion of deferred gains on sale of buildings |
(804 | ) | (804 | ) | (804 | ) | ||||||
| Net gain on sales of loans, investments and MBS |
(87,664 | ) | (64,060 | ) | (20,306 | ) | ||||||
| Stock based compensation |
3,163 | 2,137 | 2,587 | |||||||||
| Excess tax benefit from stock based compensation |
98 | 804 | (853 | ) | ||||||||
| Stock issuances relating to 401(k) match and direct stock purchases |
18 | 21 | 2,015 | |||||||||
| Loss at foreclosure and on sale of OREO |
55,979 | 46,049 | 0 | |||||||||
| Other gains and losses |
2,338 | 4,205 | 5,648 | |||||||||
| Charge on prepayment of debt |
11,296 | 0 | 0 | |||||||||
| Increase in cash surrender value of BOLI |
(7,307 | ) | (6,954 | ) | (5,130 | ) | ||||||
| Depreciation and amortization |
36,549 | 33,616 | 23,019 | |||||||||
| Deferred income tax (provision) benefit |
(113 | ) | (190,752 | ) | 59,260 | |||||||
| Change in: |
||||||||||||
| Accrued interest receivable |
9,782 | 13,437 | 6,343 | |||||||||
| Prepaid expenses and other assets |
23,538 | 4,341 | (191,488 | ) | ||||||||
| Cashiers checks issued and payable |
(2,101 | ) | (2,319 | ) | 7,998 | |||||||
| Accrued interest payable |
(4,986 | ) | (19,386 | ) | 1,422 | |||||||
| Accrued expenses and other liabilities |
6,774 | (3,286 | ) | 7,544 | ||||||||
| Proceeds from sales of loans originated for sale |
2,485,664 | 2,705,675 | 1,113,370 | |||||||||
| Loans originated for sale |
(2,455,895 | ) | (2,656,039 | ) | (1,093,064 | ) | ||||||
| Net cash provided by operating activities |
139,035 | 237,541 | 157,017 | |||||||||
| Cash flows from investing activities: |
||||||||||||
| Change in restricted cash |
(7,458 | ) | (6,730 | ) | (393 | ) | ||||||
| Loans funded and purchased |
(982,229 | ) | (2,109,418 | ) | (3,848,603 | ) | ||||||
| Loan principal received |
2,041,948 | 2,561,729 | 3,517,430 | |||||||||
| Proceeds from sales of portfolio loans |
324,328 | 51,869 | 0 | |||||||||
| Purchase of investments securities |
(33,179 | ) | (693,990 | ) | (1,315,867 | ) | ||||||
| Proceeds from maturities of investments securities |
5,500 | 764,156 | 1,115,269 | |||||||||
| Proceeds from sales of investments securities |
17,534 | 98,617 | 0 | |||||||||
| Purchase of MBS |
(2,325,488 | ) | (851,543 | ) | (912,433 | ) | ||||||
| Principal payments on MBS |
608,776 | 798,632 | 276,916 | |||||||||
| Proceeds from sales of MBS |
1,039,143 | 572,863 | 0 | |||||||||
| Purchase of property and equipment |
(4,685 | ) | (15,138 | ) | (13,980 | ) | ||||||
| Sale of property and equipment |
1,651 | 14 | (24 | ) | ||||||||
| Improvements and other changes to OREO |
(5,434 | ) | (1,993 | ) | 1,820 | |||||||
| Proceeds from sales of OREO |
165,504 | 104,637 | 10,208 | |||||||||
| Net cash provided by (used in) investing activities |
845,911 | 1,273,705 | (1,169,657 | ) | ||||||||
See accompanying summary of significant accounting policies and notes to consolidated financial statements.
| F-FIN6 |
Table of Contents
| 2010 | 2009 | 2008 | ||||||||||
| Cash flows from financing activities: |
||||||||||||
| Net change in transaction and savings deposits |
$ | (229,226 | ) | $ | 115,008 | $ | (113,771 | ) | ||||
| Proceeds from acceptance of time deposits |
1,388,639 | 2,880,826 | 5,173,702 | |||||||||
| Payments for maturing time deposits |
(2,117,558 | ) | (3,754,059 | ) | (4,612,075 | ) | ||||||
| Interest credited to deposits |
93,962 | 183,008 | 224,779 | |||||||||
| Advances from FHLB |
538,050 | 220,000 | 781,906 | |||||||||
| Repayment of advances from FHLB |
(1,478,995 | ) | (608,930 | ) | (742,733 | ) | ||||||
| Net change in securities sold subject to repurchase agreements and funds purchased |
(16,634 | ) | (113,877 | ) | (15,822 | ) | ||||||
| Repayment of other borrowings |
0 | 0 | (24,000 | ) | ||||||||
| Proceeds from stock issuance, net |
683,334 | 0 | 303,000 | |||||||||
| Proceeds from stock sales |
0 | 0 | 1,390 | |||||||||
| Excess tax benefit from stock based compensation |
(98 | ) | (804 | ) | 853 | |||||||
| Cash dividends paid to shareholders |
0 | (6,733 | ) | (20,487 | ) | |||||||
| Other |
380 | 296 | 222 | |||||||||
| Net cash (used in) provided by financing activities |
(1,138,146 | ) | (1,085,265 | ) | 956,964 | |||||||
| Net change in cash and cash equivalents |
(153,200 | ) | 425,981 | (55,676 | ) | |||||||
| Cash and cash equivalents, beginning of year |
564,783 | 138,802 | 194,478 | |||||||||
| Cash and cash equivalents, end of year |
$ | 411,583 | $ | 564,783 | $ | 138,802 | ||||||
| Supplemental disclosures: |
||||||||||||
| Cash paid (refunded) during the period for: |
||||||||||||
| Interest |
$ | 166,092 | $ | 274,756 | $ | 354,088 | ||||||
| Income taxes |
(49,342 | ) | (69,718 | ) | 17,039 | |||||||
| Noncash financing and investing activities: |
||||||||||||
| Foreclosed real estate acquired in settlement of loans |
331,189 | 200,666 | 124,610 | |||||||||
| Preferred stock cash dividend accrued |
10,350 | 9,563 | 1,052 | |||||||||
| Conversion of preferred stock into common stock |
295,384 | 0 | 0 | |||||||||
| Conversion of preferred stock accrued dividends into common stock |
19,865 | 0 | 0 | |||||||||
| Conversion of Treasury warrant |
3,669 | 0 | 0 | |||||||||
| Employee stock grants |
1,445 | 0 | 0 | |||||||||
See accompanying summary of significant accounting policies and notes to consolidated financial statements.
| F-FIN7 |
Table of Contents
Sterling Financial Corporation
Notes to Consolidated Financial Statements
1. Summary of Significant Accounting Policies:
Business
Sterling Financial Corporation (“Sterling”) is a bank holding company, organized under the laws of Washington State in 1992. The principal operating subsidiary of Sterling is Sterling Savings Bank. Sterling Savings Bank, headquartered in Spokane, Washington, commenced operations in 1983 as a Washington State-chartered federally insured stock savings and loan association, and in 2005 converted to a commercial bank. Sterling Savings Bank offers commercial banking products and services, mortgage lending, construction financing and investment products to individuals, small business, commercial organizations and corporations.
Sterling’s dedication to personalized service and relationship banking has enabled it to attract both retail deposits and lending relationships in the western United States. With $9.49 billion in total assets as of December 31, 2010, Sterling originates loans and attracts Federal Deposit Insurance Corporation (“FDIC”) insured and uninsured deposits from the general public throughout its five-state footprint through Sterling Savings Bank. On August 2, 2010, Golf Savings Bank, which was a wholly owned subsidiary of Sterling, was merged into Sterling Savings Bank, with the residential units of both banks combined within the (“Home Loan Division”) of Sterling Savings Bank. The Home Loan Division originates residential loans, both for sale into the secondary market and for the loan portfolio. Sterling also markets fixed income and equity products, mutual funds, annuities and other financial products through wealth management representatives located throughout Sterling’s network of financial service centers.
Principles of Consolidation
The accompanying consolidated financial statements include the accounts of Sterling and its directly and indirectly wholly owned subsidiaries. All significant intercompany accounts and transactions have been eliminated in consolidation.
Estimates
The preparation of financial statements in accordance with accounting principles generally accepted in the United States of America requires the use of estimates and assumptions that affect the reported amounts of assets and liabilities, disclosure of contingent assets and liabilities known to exist as of the date the financial statements are published and the reported amounts of revenues and expenses during the reporting period. Uncertainties with respect to such estimates and assumptions are inherent in the preparation of Sterling’s consolidated financial statements; accordingly, it is possible that the actual results could differ from these estimates and assumptions, which could have a material effect on the reported amounts of Sterling’s consolidated financial position and results of operations.
Cash and Cash Equivalents
Cash equivalents include investments with a remaining maturity of three months or less at the date of purchase. Cash and cash equivalents are deposited with other banks and financial institutions in amounts that may at times exceed the federal insurance limit. Sterling evaluates the credit quality of these banks and financial institutions to mitigate its credit risk.
Restricted cash consists of noninterest bearing deposits maintained as a reserve at the Federal Reserve Bank, and cash collateral balances with correspondent banks.
Sterling occasionally purchases securities under agreements with other institutions to resell the same or similar securities. The amounts advanced under these agreements represent short-term loans and are reflected as interest bearing cash equivalents in the consolidated balance sheet. The securities underlying the agreements are comprised of mutual fund shares that are primarily invested in U.S. government securities.
| F-FIN8 |
Table of Contents
Investments and MBS
Sterling classifies debt and equity investments and MBS as follows:
| Ÿ | Available for Sale. Debt and equity investments and MBS that are not classified as trading securities or held to maturity are classified as available for sale and are carried at fair value. These securities are valued using a third party pricing service’s matrix technique based on quoted prices for similar instruments, which Sterling validates with non-binding broker quotes, in depth collateral analysis and cash flow stress testing. Unrealized gains and losses are reported, net of deferred income taxes, as a component of accumulated other comprehensive income or loss in shareholders’ equity until realized. |
| Ÿ | Held to Maturity. These are investments that management of Sterling has the intent and ability to hold until maturity. As of December 31, 2010 and 2009, held to maturity securities are composed of equity tax credits that are carried at par, and amortized over the life of the credits. |
Premiums and discounts are amortized using the effective yield method over the estimated remaining term of the underlying security. Realized gains and losses on sales of investments and MBS are recognized in the statement of income in the period sold using the specific identification method. FHLB stock is carried at cost, and included in other assets.
Declines in the fair value of securities below their amortized cost that are other than temporary are reflected in earnings or other comprehensive income, as appropriate. For those debt securities whose fair value is less than their amortized cost basis, we consider our intent to sell the securities, whether it is more likely than not that we will be required to sell the securities before recovery, and whether or not we expect to recover our entire amortized cost basis in the investment. In making this assessment, considerations will include whether the issue is a government or government sponsored security, and whether or not rating downgrades have occurred. The assessment of other than temporary impairment includes an assessment of the carrying value of FHLB stock. FHLB stock is not a marketable security, and therefore, its value is primarily attributable to the borrowing capacity it provides.
Loans Receivable
Loans receivable that management of Sterling has the intent and ability to -hold for the foreseeable future or until maturity or pay-off are reported at their outstanding principal balance net of unamortized origination and commitment fees, direct loan origination costs and an allowance for losses.
Interest income is recognized over the term of loans based on their unpaid principal balance. The accrual of interest on loans is discontinued when, in management’s opinion, a borrower may be unable to make payments as they become due, which generally occurs when a loan is 90 days past due. When interest accrual is discontinued, all unpaid accrued interest is reversed. The interest payments received on these loans is accounted for on the cash basis or cost recovery method, until qualifying for a return to an accrual status. Loans return to an accrual status when all principal and interest is brought current, and future payments are reasonably assured.
A troubled debt restructuring occurs when, due to a borrower’s financial difficulties, Sterling grants a concession that it would not otherwise consider. The concession can take the form of an interest rate or principal reduction or an extension of payments of principal or interest, or both. Restructured loans are generally placed on nonaccrual until the borrower has demonstrated a willingness and ability to make the restructured loan payments for at least six months.
Allowance for Credit Losses
The allowance for credit losses is composed of the allowance for loan losses and the reserve for unfunded credit commitments. In general, determining the amount of the allowance requires significant judgment and the use of estimates by management. Sterling maintains an allowance for credit losses to absorb probable losses in the loan portfolio based on a quarterly analysis of the portfolio and expected future losses. This analysis is designed to determine an appropriate level and allocation of the allowance for losses among loan
| F-FIN9 |
Table of Contents
types by considering factors affecting loan losses, including specific and confirmed losses, levels and trends in classified and nonperforming loans, historical loan loss experience, loan migration analysis, current national and local economic conditions, volume, growth and composition of the portfolio, regulatory guidance and other relevant factors. Management monitors the loan portfolio to evaluate the adequacy of the allowance. The allowance can increase or decrease each quarter based upon the results of management’s analysis.
The portfolio is grouped into standard industry categories for homogeneous loans based on characteristics such as loan type, borrower and collateral. Annual and quarterly loan migration to loss data is used to determine the probability of default. Historically, Sterling had used both one-year and three-year loss history to establish the expected loss rate on loans. Due to the higher loss rates experienced during 2009, during the fourth quarter of 2009 Sterling began using losses from the most recent 12 months to estimate the amount that would be lost if a default were to occur, which is termed the loss given default. The probability of default is multiplied by the loss given default to calculate the expected losses for each loan category.
Sterling may also maintain an unallocated allowance to provide for other credit losses that may exist in the loan portfolio that are not taken into consideration in establishing the probability of default and loss given default. The unallocated amount generally may be maintained at higher levels during times of economic uncertainty. The unallocated amount is reviewed at least quarterly based on credit and economic trends. As of December 31, 2010, the unallocated allowance was 13% of the allowance for loan losses.
Individual loan reviews are based upon specific quantitative and qualitative criteria, including the size of the loan, loan quality ratings, value of collateral, repayment ability of borrowers, and historical experience factors. The historical experience factors utilized and allowances for homogeneous loans (such as residential mortgage loans, consumer loans, etc.) are collectively evaluated based upon historical loss experience, loan migration analysis, trends in losses and delinquencies, growth of loans in particular markets, and known changes in economic conditions in each particular lending market.
A loan is considered impaired when, based on current information and events, it is probable we will be unable to collect the scheduled payments of principal and interest when due according to the contractual terms of the loan agreement. Factors considered by management in determining impairment include payment status, collateral value and the probability of collecting scheduled principal and interest payments when due. Loans that experience insignificant payment delays and payment shortfalls generally are not classified as impaired. Management determines the significance of payment delays and payment shortfalls on a case-by-case basis, taking into consideration all of the circumstances surrounding the loan and the borrower, including the length of delay, the reasons for the delay, the borrower’s prior payment record and the amount of the shortfall in relation to the principal and interest owed. Impairment is measured on a loan-by-loan basis by either the present value of expected future cash flows discounted at the loan’s effective interest rate, the loan’s obtainable market price or the fair value of collateral if the loan is collateral dependent.
The fair value of the underlying collateral for real estate loans, which may or may not be collateral dependent, is determined by using appraisals from qualified external sources. For commercial properties and residential development loans, the external appraisals are reviewed by qualified internal appraisal staff to ensure compliance with appropriate standards and technical accuracy. Updated appraisals are ordered in accordance with regulatory provisions for extensions or restructurings of commercial or residential real estate construction and permanent loans that have not performed within the terms of the original loan. Updated appraisals are also ordered for loans that have not been restructured, but that have stale valuation information, generally defined in the current market as information older than one year, and deteriorating credit quality that warrants classification as substandard.
The timing of obtaining appraisals may vary, depending on the nature and complexity of the property being evaluated and the general breadth of appraisal activity in the marketplace, but generally it is within 30 to 90 days of recognition of substandard status, following determination of collateral dependency, or in connection with a
| F-FIN10 |
Table of Contents
loan’s maturity or a negotiation that may result in the restructuring or extension of a real estate secured loan. Delays in timing may occur to comply with actions such as a bankruptcy filing or provisions of a Small Business Administration (“SBA”) guarantee.
Estimates of fair value may be used for substandard collateral dependent loans at quarter end if external appraisals are not expected to be completed in time for determining quarter end results or to update values between appraisal dates that reflect updated values based on recent sales activity of comparable inventory or pending property sales of the subject collateral. Sterling records a specific reserve for impaired loans for which an updated valuation analysis has not been completed within the last quarter. The specific reserve is calculated by applying an estimated fair value adjustment to each loan based on market and property type. Estimates of value are not used to raise a value; however, estimates may be used to recognize deterioration of market values in quarters between appraisal updates. The judgment with respect to recognition of any provision or related charge-off for a confirmed loss also takes into consideration whether the loan is collateral dependent or whether it is supported by sources of repayment or cash flow beyond the collateral that is being valued. For loans that are deemed to be collateral dependent, the amount of charge-offs is determined in relation to the collateral’s appraised value. For loans that are not deemed to be collateral dependent, the amount of charge-offs may differ from the collateral’s appraised value because there is additional support for the loan, such as cash flow from other sources. For consumer loans, in accordance with regulatory guidelines, Sterling records a charge-off once a loan becomes 120 days past due.
Sterling maintains a reserve for probable losses on unfunded loan commitments. The reserve is established based upon current economic conditions, one year historical losses and expected disbursement levels.
While management uses available information to provide for loan losses, the ultimate collectability of a substantial portion of the loan portfolio and the need for future additions to the allowance will be influenced by changes in economic conditions and other relevant factors. The current slowdown in economic activity and further declines in real estate values could continue to adversely affect cash flows for both commercial and individual borrowers, and as a result Sterling could experience further increases in nonperforming assets, delinquencies and losses on loans. There can be no assurance that the allowance for credit losses will be adequate to cover all losses. See Note 3.
Loans Held for Sale
Any loan that management determines will not be held to maturity is classified as held for sale. Loans held for sale are carried at fair value in order to match changes in the value of the loans with the value of the economic hedges on the loans without applying complex hedge accounting. The fair value of loans held for sale is determined based upon an analysis of investor quoted pricing inputs.
Loan Origination and Commitment Fees
Loan origination fees, net of direct origination costs, are deferred and recognized as interest income using the effective yield method. If the related loan is sold, the remaining net amount, which is part of the basis of the loan, is considered in determining the gain or loss on sale.
Loan commitment fees are deferred until the expiration of the commitment period unless management believes there is a remote likelihood that the underlying commitment will be exercised, in which case the fees are amortized to fee income using the straight-line method over the commitment period. If a loan commitment is exercised, the deferred commitment fee is accounted for in the same manner as a loan origination fee. Deferred commitment fees associated with expired commitments are recognized as fee income.
Property and Equipment
Property and equipment is carried at cost less accumulated depreciation and amortization. Depreciation and amortization are computed using the straight-line method over the lesser of the estimated useful lives or the related lease terms of the assets. Expenditures for new property and equipment and major renewals or betterments are capitalized. Expenditures for repairs and maintenance are charged to expense as incurred. Upon sale or retirement, the cost and related accumulated depreciation are removed from the respective property or equipment accounts, and the resulting gains or losses are reflected in operations.
| F-FIN11 |
Table of Contents
Other Real Estate Owned
Assets acquired through or in lieu of foreclosure are initially recorded at fair value, net of selling costs, which becomes the new cost basis for the asset. Subsequent to taking possession, OREO is carried at the lower of cost or fair value less estimated selling costs. Development and improvement costs relating to the property are capitalized to the extent they are deemed to be recoverable. The carrying value of the property is periodically evaluated by management and, if necessary, allowances are established to reduce the carrying value to net realizable value.
Goodwill and Other Intangible Assets
Goodwill represents the difference between the value of consideration paid and the fair value of the net assets received in a business combination. Sterling records impairment losses as charges to noninterest expense and adjustments to the carrying value of goodwill. Goodwill is tested for impairment on an annual basis, or more frequently as events occur, or as current circumstances and conditions warrant. The analysis compares the fair value of each of the reporting units, including goodwill, to the respective carrying amounts. If the carrying amount of the reporting unit, including goodwill, exceeds the fair value of that reporting unit, then further testing for goodwill impairment is performed. During the year ended December 31, 2009, goodwill was determined to be fully impaired, and as such, had a zero carrying value at the balance sheet date.
Other intangible assets are comprised of core deposit intangibles, and are amortized over the estimated useful life of the deposit relationship, which is generally eight to ten years. Other intangible assets are periodically assessed for impairment when certain triggering events occur that indicate the possibility of impairment. See Note 7.
Mortgage Banking Operations
Sterling, when it originates and sells loans, recognizes a gain or loss on these loan sale transactions, which include a component reflecting the differential between the contractual interest rate of the loan and the interest rate to be received by the investor. The present value of the estimated future profit for servicing the loans, together with the normal servicing fee rate and changes in the fair value of any derivatives, is also taken into account in determining the amount of gain or loss on the sale of loans. The fair value of mortgage servicing rights is recorded as an asset, with their value estimated using a discounted cash flow methodology to arrive at the present value of future expected earnings from the servicing of the loans. Model inputs include prepayment speeds, market interest rates, contractual interest rates on the loans being serviced, and the amount of other fee income generated over the servicing contract. Mortgage servicing rights are amortized in proportion to, and over the estimated period of the servicing revenues. To the extent the carrying value of mortgage servicing rights exceeds its subsequent fair value estimates, an impairment charge is recognized. Subsequent recoveries in value are recognized up to the original carrying value of the mortgage servicing rights only to the extent of cumulative impairment charges.
Transfers of Financial Assets
Sterling’s sales of residential real estate loans and commercial loan participations are considered transfers of financial assets. These transfers are accounted for as sales when control over the asset has been surrendered, which is deemed to have occurred when: an asset does not have any claims to it by the transferor or their creditors, including in bankruptcy or other receivership situations; the transferee obtains the unconditional right to pledge or exchange the asset; or the transfer does not include a repurchase provision. Cash received from the sale of residential real estate loans from mortgage banking operations totaled $2.45 billion, $2.71 billion and $1.11 billion for 2010, 2009 and 2008, respectively, while commercial loan participations during 2010, 2009 and 2008 were immaterial for Sterling.
Income Taxes
Sterling accounts for income taxes using the liability method, which requires that deferred tax assets and liabilities be determined based on the temporary differences between the financial statement carrying amounts and the tax basis of assets and liabilities,
| F-FIN12 |
Table of Contents
and the tax attributes using enacted tax rates in effect in the years in which the temporary differences are expected to reverse. Sterling did not recognize a federal and state income tax benefit during 2010 because Sterling recorded a $90.0 million increase to its deferred tax valuation allowance against the increase in its deferred tax asset primarily related to the increase in its net operating loss (“NOL”) carryforward. During 2009, Sterling recorded a $269.0 million initial full valuation allowance against its deferred tax assets, which resulted in Sterling recognizing a net provision of $27.0 million for the year. See Note 12 for further information, including the total amount of Sterling’s deferred tax asset, and portion of the deferred tax asset related to net operating loss carryforwards as of both December 31, 2010 and 2009.
Earnings (Loss) Per Share
Earnings (loss) per share—basic is computed by dividing net income or loss available to common shareholders by the weighted average number of shares outstanding during the period. Earnings (loss) per share—diluted is computed by dividing net income or loss available to common shareholders by the weighted average number of shares outstanding, increased by the additional shares that would have been outstanding if all potentially dilutive and contingently issuable shares had been issued. The accounting standards codification requires a two-class method of computing earnings per share for entities that have participating securities such as Sterling’s unvested restricted shares. Application of the two-class method resulted in the materially equivalent earnings per share as the treasury method.
Stock-Based Compensation
Stock options issued as compensation are recorded as an expense at their estimated grant date fair value. The Black-Scholes option pricing model is used to estimate the fair value of stock options granted, while the value of restricted stock awards are recorded using the grant date market closing price of Sterling’s common stock. See Note 13 for further discussion, including Black-Scholes model input assumptions.
Comprehensive Income (Loss)
Comprehensive income (loss) consists of net income (loss) and other comprehensive income (loss). Other comprehensive income (loss) is comprised of unrealized gains and losses on available for sale securities, and is a separate component of shareholders’ equity. Sterling reports and displays comprehensive income and its components (revenues, expenses, gains and losses) in a full set of general-purpose financial statements.
Hedging Activities
As part of its mortgage banking activities, commitments to prospective borrowers on residential mortgage loan applications may have the interest rates fixed for a period of 10 to 60 days (interest rate lock commitments). To offset the exposure to interest rate risk, the pricing for the sale of these loans is fixed with various qualified investors under both non-binding (“best-efforts”) and binding (“mandatory”) delivery programs. For mandatory delivery programs, Sterling hedges interest rate risk by entering into offsetting forward sale agreements on MBS with third parties. Risks inherent in mandatory delivery programs include the risk that if Sterling does not close the loans subject to interest rate lock commitments, it is nevertheless obligated to deliver MBS to the counterparty under the forward sale agreement. Sterling could incur significant costs in acquiring replacement loans or MBS and such costs could have a material adverse effect on mortgage banking operations in future periods.
Interest rate lock commitments and loan delivery commitments are off balance sheet commitments that are considered to be derivatives. As of December 31, 2010, Sterling had $118.6 million of interest rate lock commitments, $207.0 million of residential mortgage loans held for sale that were not committed to investors and offsetting forward sale agreements on MBS valued at $285.3 million. In addition, Sterling had mandatory delivery commitments to sell mortgage loans to investors valued at $800,000 as of December 31, 2010. As of December 31, 2009, Sterling had $110.0 million of interest rate lock commitments, $119.7 million of residential mortgage loans held for sale that were not committed to investors and offsetting forward sale agreements on MBS valued at $234.0 million. In
| F-FIN13 |
Table of Contents
addition, Sterling had mandatory delivery commitments to sell mortgage loans to investors valued at $29.5 million as of December 31, 2009. As of December 31, 2010 and 2009, Sterling had entered into best efforts forward commitments to sell $18.5 million and $51.6 million of mortgage loans, respectively.
From time to time, Sterling may enter into interest rate swap transactions with loan customers. The interest rate risk on these swap transactions is managed by entering into offsetting interest rate swap agreements with various counterparties (“broker-dealers” or “dealers”). Both customer and dealer related interest rate derivatives are carried at fair value by Sterling.
Reclassifications
Certain amounts in prior period financial statements have been reclassified to conform to the current year’s presentation. These reclassifications had no effect on retained earnings or net income as previously reported.
Recent Accounting Pronouncements
In June 2009, the Financial Accounting Standards Board (the “FASB”) issued Accounting Standards Update (“ASU”) 2009-16, “Accounting for Transfers of Financial Assets.” This standard removes the concept of qualifying special-purpose entities as an accounting criteria that had provided an exception to consolidation, provided additional guidance on requirements for consolidation, and is an update to codification topic 860. This guidance became effective for Sterling on January 1, 2010, and did not have a material impact on its consolidated financial statements.
In January 2010, the FASB issued ASU 2010-06, “Fair Value Measurements and Disclosures.” This guidance is related to implementation of fair value measurement disclosures. This update to the codification topic 820 specifically addresses: 1) transfers between levels 1, 2 and 3 of the fair value hierarchy; 2) level of disaggregation of derivative contracts for fair value measurement disclosures; and 3) disclosures about fair value measurement inputs and valuation techniques. This guidance became effective for Sterling on March 31, 2010, and did not have a material impact on its consolidated financial statements.
In February 2010, the FASB issued ASU 2010-09, “Amendments to Certain Recognition and Disclosure Requirements,” that standardizes accounting for and disclosures of events that occur after the balance sheet date but before financial statements are issued or are available to be issued, and was an update to codification topic 855. As a public reporting company, Sterling is required to evaluate subsequent events through the date its financial statements are issued. The adoption of these rules did not have a material impact on Sterling’s consolidated financial statements.
In April 2010, the FASB issued ASU 2010-18, “Effect of a Loan Modification When the Loan Is Part of a Pool That Is Accounted for as a Single Asset.” This update addresses modifications of loans that are accounted for within a pool by specifying that a troubled debt restructuring would not result in the removal of those loans from the pool for impairment analysis purposes. This guidance was effective for Sterling as of September 30, 2010. Sterling does not currently have any loans for which this guidance would be applicable.
In July 2010, the FASB issued ASU 2010-20, “Disclosures about the Credit Quality of Financing Receivables and the Allowance for Credit Losses.” This update amends codification topic 310 on receivables to improve the disclosures that an entity provides about the credit quality of its financing receivables and the related allowance for credit losses. As a result of these amendments, an entity is required to disaggregate by portfolio segment or class certain existing disclosures and provide certain new disclosures about its financing receivables and related allowance for credit losses. This guidance is being phased in, with the new disclosure requirements for period end balances effective as of December 31, 2010, and the new disclosure requirements for activity during the reporting period are effective March 31, 2011. The troubled debt restructuring disclosures in this ASU have been delayed by ASU 2011-01, “Deferral of the Effective Date of Disclosures about Troubled Debt Restructurings in Update No. 2010-20,” which was issued in January 2011. See footnote 3.
| F-FIN14 |
Table of Contents
2. Investments and MBS:
The carrying and fair values of investments and MBS are summarized as follows:
| Amortized Cost |
Gross Unrealized Gains |
Gross Unrealized Losses |
Fair Value | |||||||||||||
| (Dollars in thousands) | ||||||||||||||||
| December 31, 2010 |
||||||||||||||||
| Available for sale |
||||||||||||||||
| MBS |
$ | 2,598,086 | $ | 30,017 | $ | (25,493 | ) | $ | 2,602,610 | |||||||
| Municipal bonds |
208,588 | 949 | (8,394 | ) | 201,143 | |||||||||||
| Other |
24,821 | 2 | (3,566 | ) | 21,257 | |||||||||||
| Total |
$ | 2,831,495 | $ | 30,968 | $ | (37,453 | ) | $ | 2,825,010 | |||||||
| Held to maturity |
||||||||||||||||
| Tax credits |
$ | 13,464 | $ | 0 | $ | 0 | $ | 13,464 | ||||||||
| Total |
$ | 13,464 | $ | 0 | $ | 0 | $ | 13,464 | ||||||||
| December 31, 2009 |
||||||||||||||||
| Available for sale |
||||||||||||||||
| MBS |
$ | 1,912,736 | $ | 44,579 | $ | (12,326 | ) | $ | 1,944,989 | |||||||
| Municipal bonds |
195,807 | 3,500 | (4,025 | ) | 195,282 | |||||||||||
| Other |
25,979 | 0 | (5,925 | ) | 20,054 | |||||||||||
| Total |
$ | 2,134,522 | $ | 48,079 | $ | (22,276 | ) | $ | 2,160,325 | |||||||
| Held to maturity |
||||||||||||||||
| Tax credits |
$ | 17,646 | $ | 0 | $ | 0 | $ | 17,646 | ||||||||
| Total |
$ | 17,646 | $ | 0 | $ | 0 | $ | 17,646 | ||||||||
Tax credit investments are in low income housing partnerships. Other available for sale securities were primarily comprised of a trust preferred security at both December 31, 2010 and 2009. At December 31, 2010 and 2009, accrued interest on investments and MBS was $10.2 million and $9.9 million, respectively. During the years ended December 31, 2010, 2009 and 2008, Sterling sold available-for-sale investments and MBS which resulted in the following (in thousands):
| Proceeds from Sales |
Gross Realized Gains |
Gross Realized Losses |
||||||||||
| (Dollars in thousands) | ||||||||||||
| Year ended December 31, 2010 |
$ | 1,056,677 | $ | 35,546 | $ | 9,804 | ||||||
| Year ended December 31, 2009 |
671,480 | 24,729 | 11,262 | |||||||||
| Year ended December 31, 2008 |
0 | 0 | 0 | |||||||||
Included in the 2010 security sales were $61.1 million of nonagency collateralized mortgage obligations at a loss of $6.0 million. The sales were a result of an updated assessment of the credit risk of certain securities held in the portfolio, including downgrades and potential downgrades by rating agencies.
| F-FIN15 |
Table of Contents
Reclassification adjustments from other comprehensive income, representing realized net gains on available-for-sale securities, net of related deferred income taxes, were as follows for the periods presented:
| Years Ended December 31, | ||||||||||||
| 2010 | 2009 | 2008 | ||||||||||
| (Dollars in thousands) | ||||||||||||
| Realized net gains reclassified from other comprehensive income |
$ | 32,330 | $ | 8,484 | $ | 0 | ||||||
The following table summarizes Sterling’s investments and MBS that had a market value below their amortized cost basis as of December 31, 2010 and 2009, grouped by the amount of time these securities have been in this unrealized loss position:
| Less than 12 months | 12 months or longer | Total | ||||||||||||||||||||||
| Market Value |
Unrealized Losses |
Market Value |
Unrealized Losses |
Market Value |
Unrealized Losses |
|||||||||||||||||||
| (Dollars in thousands) | ||||||||||||||||||||||||
| December 31, 2010 |
||||||||||||||||||||||||
| Municipal bonds |
$ | 89,364 | $ | (3,193 | ) | $ | 47,101 | $ | (5,201 | ) | $ | 136,465 | $ | (8,394 | ) | |||||||||
| MBS |
1,460,173 | (25,493 | ) | 0 | 0 | 1,460,173 | (25,493 | ) | ||||||||||||||||
| Other |
0 | 0 | 21,250 | (3,566 | ) | 21,250 | (3,566 | ) | ||||||||||||||||
| Total |
$ | 1,549,537 | $ | (28,686 | ) | $ | 68,351 | $ | (8,767 | ) | $ | 1,617,888 | $ | (37,453 | ) | |||||||||
| December 31, 2009 |
||||||||||||||||||||||||
| Municipal bonds |
$ | 13,758 | $ | (317 | ) | $ | 45,729 | $ | (3,708 | ) | $ | 59,487 | $ | (4,025 | ) | |||||||||
| MBS |
190,004 | (4,039 | ) | 115,266 | (8,287 | ) | 305,270 | (12,326 | ) | |||||||||||||||
| Other |
0 | 0 | 18,791 | (5,925 | ) | 18,791 | (5,925 | ) | ||||||||||||||||
| Total |
$ | 203,762 | $ | (4,356 | ) | $ | 179,786 | $ | (17,920 | ) | $ | 383,548 | $ | (22,276 | ) | |||||||||
The following table provides the amortized cost and fair value of available-for-sale and held-to-maturity debt securities as of December 31, 2010, by contractual maturity. Actual maturities for MBS will differ from contractual maturities as a result of the level of prepayments experienced on the underlying mortgages. As of December 31, 2010, the weighted average life of the MBS portfolio was 5.0 years, and its effective duration was 3.6%. This compares with a weighted average life of 3.8 years, and an effective duration of 3.5% at December 31, 2009.
| Held-to-maturity | Available-for-sale | |||||||||||||||
| Amortized Cost | Fair Value | Amortized Cost | Fair Value | |||||||||||||
| (Dollars in thousands) | ||||||||||||||||
| Due within one year |
$ | 0 | $ | 0 | $ | 25 | $ | 25 | ||||||||
| Due after one year through five years |
0 | 0 | 757 | 767 | ||||||||||||
| Due after five years through ten years |
0 | 0 | 247,708 | 248,072 | ||||||||||||
| Due after ten years |
13,464 | 13,464 | 2,583,005 | 2,576,146 | ||||||||||||
| Total |
$ | 13,464 | $ | 13,464 | $ | 2,831,495 | $ | 2,825,010 | ||||||||
| F-FIN16 |
Table of Contents
Management evaluates investment securities for other than temporary declines in fair value on a quarterly basis. If the fair value of investment securities falls below their amortized cost and the decline is deemed to be other than temporary, the securities will be written down to current market value, resulting in a loss. There were no investment securities that management identified to be other than-temporarily impaired at December 31, 2010, because the decline in fair value of certain classes of securities was attributable to temporary disruptions of credit markets and the related impact on securities within those classes, not deteriorating credit quality of specific securities. As of December 31, 2010, Sterling held nonagency collateralized mortgage obligations with an aggregate amortized cost of $47.6 million compared to a $48.4 million market value, or a net unrealized gain of $825,000. All nonagency collateralized mortgage obligations are internally monitored monthly and independently stress-tested quarterly for both credit quality and collateral strength, and are AAA rated according to at least one major rating agency. The vintage, or years of issuance, for these nonagency securities ranges from 2003 to 2005. In addition, Sterling held $201.1 million of municipal bonds with a net unrealized loss of $7.4 million as of December 31, 2010. The current economic downturn has impacted the credit worthiness of a number of municipalities. The majority of Sterling’s municipal bonds are general obligation bonds. Sterling reviews its municipal bonds for impairment at least quarterly.
As of December 31, 2010, Sterling expects the return of all principal and interest on all securities within its investment and MBS portfolio pursuant to the contractual terms, has the ability and intent to hold these investments, has no intent to sell securities that are deemed to have a market value impairment, and believes it is unlikely that Sterling would be required to sell these investments before a recovery in market price occurs, or until maturity. Realized losses could occur in future periods due to a change in management’s intent to hold the investments to recovery, a change in management’s assessment of credit risk, or a change in regulatory or accounting requirements.
At December 31, 2010 and 2009, U.S. government and agency obligations and MBS with an aggregate fair value of $908.1 million and $93.9 million, respectively, were pledged as collateral for the treasury tax and loan account in accordance with Federal Reserve Board regulations or for wholesale public funds deposits in accordance with Washington, Oregon, California, and Montana state laws and regulations. Additionally, Sterling periodically utilizes MBS as collateral for reverse repurchase agreements and other borrowing transactions. See Note 10.
| F-FIN17 |
Table of Contents
3. Loans Receivable and Allowance for Loan Losses:
The following table sets forth details by segment for Sterling’s loan portfolio and related allowance for loan losses as of and for the periods indicated:
| Real Estate | Consumer | Commercial Banking |
Unallocated | Total | ||||||||||||||||||||||||||||
| Residential | Multifamily | Commercial | Construction | |||||||||||||||||||||||||||||
| (Dollars in thousands) | ||||||||||||||||||||||||||||||||
| 2010 |
||||||||||||||||||||||||||||||||
| Loans receivable, gross—December 31: |
||||||||||||||||||||||||||||||||
| Individually evaluated for impairment |
$ | 91,411 | $ | 23,541 | $ | 106,085 | $ | 335,656 | $ | 7,973 | $ | 89,973 | $ | 0 | $ | 654,639 | ||||||||||||||||
| Collectively evaluated for impairment |
666,999 | 493,481 | 1,208,572 | 190,012 | 736,095 | 1,680,453 | 0 | 4,975,612 | ||||||||||||||||||||||||
| Total loans receivable, gross |
758,410 | 517,022 | 1,314,657 | 525,668 | 744,068 | 1,770,426 | 0 | 5,630,251 | ||||||||||||||||||||||||
| Deferred loan fees |
0 | 0 | 0 | 0 | 0 | 0 | (4,114 | ) | (4,114 | ) | ||||||||||||||||||||||
| Allowance for loan losses |
(17,307 | ) | (9,668 | ) | (49,362 | ) | (65,877 | ) | (14,645 | ) | (56,951 | ) | (33,246 | ) | (247,056 | ) | ||||||||||||||||
| Total/ Net |
$ | 741,103 | $ | 507,354 | $ | 1,265,295 | $ | 459,791 | $ | 729,423 | $ | 1,713,475 | $ | (37,360 | ) | $ | 5,379,081 | |||||||||||||||
| Allowance for loan losses: |
||||||||||||||||||||||||||||||||
| January 1 |
$ | 28,319 | $ | 8,984 | $ | 42,296 | $ | 185,222 | $ | 19,198 | $ | 59,135 | $ | 289 | $ | 343,443 | ||||||||||||||||
| Chargeoffs |
(37,347 | ) | (18,039 | ) | (49,424 | ) | (238,596 | ) | (14,765 | ) | (18,683 | ) | 0 | (376,854 | ) | |||||||||||||||||
| Recoveries |
2,131 | 189 | 1,311 | 20,213 | 1,869 | 4,163 | 0 | 29,876 | ||||||||||||||||||||||||
| Provisions |
24,204 | 18,534 | 55,179 | 99,038 | 8,343 | 12,336 | 32,957 | 250,591 | ||||||||||||||||||||||||
| December 31 |
$ | 17,307 | $ | 9,668 | $ | 49,362 | $ | 65,877 | $ | 14,645 | $ | 56,951 | $ | 33,246 | $ | 247,056 | ||||||||||||||||
| Individually evaluated for impairment |
$ | 1,239 | $ | 362 | $ | 4,670 | $ | 12,368 | $ | 33 | $ | 2,564 | $ | 0 | $ | 21,236 | ||||||||||||||||
| Collectively evaluated for impairment |
16,068 | 9,306 | 44,692 | 53,509 | 14,612 | 54,387 | 33,246 | 225,820 | ||||||||||||||||||||||||
| Total |
$ | 17,307 | $ | 9,668 | $ | 49,362 | $ | 65,877 | $ | 14,645 | $ | 56,951 | $ | 33,246 | $ | 247,056 | ||||||||||||||||
| Percent of total allowance |
7 | % | 4 | % | 20 | % | 27 | % | 6 | % | 23 | % | 13 | % | 100 | % | ||||||||||||||||
| 2009 |
||||||||||||||||||||||||||||||||
| Loans receivable, gross—December 31: |
||||||||||||||||||||||||||||||||
| Individually evaluated for impairment |
$ | 58,194 | $ | 20,330 | $ | 54,024 | $ | 639,572 | $ | 4,907 | $ | 118,904 | $ | 0 | $ | 895,931 | ||||||||||||||||
| Collectively evaluated for impairment |
780,976 | 497,078 | 1,349,536 | 876,536 | 1,111,615 | 2,183,040 | 0 | 6,798,781 | ||||||||||||||||||||||||
| Total loans receivable, gross |
839,170 | 517,408 | 1,403,560 | 1,516,108 | 1,116,522 | 2,301,944 | 0 | 7,694,712 | ||||||||||||||||||||||||
| Deferred loan fees |
0 | 0 | 0 | 0 | 0 | 0 | (7,070 | ) | (7,070 | ) | ||||||||||||||||||||||
| Allowance for loan losses |
(28,319 | ) | (8,984 | ) | (42,296 | ) | (185,222 | ) | (19,198 | ) | (59,135 | ) | (289 | ) | (343,443 | ) | ||||||||||||||||
| Total/ Net |
$ | 810,851 | $ | 508,424 | $ | 1,361,264 | $ | 1,330,886 | $ | 1,097,324 | $ | 2,242,809 | $ | (7,359 | ) | $ | 7,344,199 | |||||||||||||||
| Allowance for loan losses: |
||||||||||||||||||||||||||||||||
| January 1 |
$ | 8,147 | $ | 4,795 | $ | 24,720 | $ | 118,279 | $ | 14,608 | $ | 29,019 | $ | 8,797 | $ | 208,365 | ||||||||||||||||
| Chargeoffs |
(31,401 | ) | (3,510 | ) | (50,733 | ) | (420,539 | ) | (15,396 | ) | (45,085 | ) | 0 | (566,664 | ) | |||||||||||||||||
| Recoveries |
306 | 5 | 348 | 6,803 | 1,667 | 1,875 | 0 | 11,004 | ||||||||||||||||||||||||
| Provisions |
51,267 | 7,694 | 67,961 | 480,679 | 18,319 | 73,326 | (8,508 | ) | 690,738 | |||||||||||||||||||||||
| December 31 |
$ | 28,319 | $ | 8,984 | $ | 42,296 | $ | 185,222 | $ | 19,198 | $ | 59,135 | $ | 289 | $ | 343,443 | ||||||||||||||||
| Individually evaluated for impairment |
$ | 454 | $ | 37 | $ | 587 | $ | 24,925 | $ | 68 | $ | 1,058 | $ | 0 | $ | 27,129 | ||||||||||||||||
| Collectively evaluated for impairment |
27,865 | 8,947 | 41,709 | 160,297 | 19,130 | 58,077 | 289 | 316,314 | ||||||||||||||||||||||||
| Total |
$ | 28,319 | $ | 8,984 | $ | 42,296 | $ | 185,222 | $ | 19,198 | $ | 59,135 | $ | 289 | $ | 343,443 | ||||||||||||||||
| Percent of total allowance |
8 | % | 3 | % | 12 | % | 54 | % | 6 | % | 17 | % | 0 | % | 100 | % | ||||||||||||||||
| F-FIN18 |
Table of Contents
| Real Estate | Consumer | Commercial Banking (2) |
Unallocated | Total | ||||||||||||||||||||||||||||
| Residential | Multifamily | Commercial (1) | Construction | |||||||||||||||||||||||||||||
| (Dollars in thousands) | ||||||||||||||||||||||||||||||||
| 2008 |
||||||||||||||||||||||||||||||||
| Loans receivable, gross—December 31: |
||||||||||||||||||||||||||||||||
| Individually evaluated for impairment |
$ | 39,698 | $ | 4,757 | $ | 6,463 | $ | 418,782 | $ | 3,500 | $ | 57,590 | $ | 0 | $ | 530,790 | ||||||||||||||||
| Collectively evaluated for impairment |
827,686 | 472,858 | 1,358,422 | 2,115,913 | 1,245,020 | 2,474,568 | 0 | 8,494,467 | ||||||||||||||||||||||||
| Total loans receivable, gross |
867,384 | 477,615 | 1,364,885 | 2,534,695 | 1,248,520 | 2,532,158 | 0 | 9,025,257 | ||||||||||||||||||||||||
| Deferred loan fees |
0 | 0 | 0 | 0 | 0 | 0 | (9,798 | ) | (9,798 | ) | ||||||||||||||||||||||
| Allowance for loan losses: |
(8,147 | ) | (4,795 | ) | (13,712 | ) | (118,279 | ) | (14,608 | ) | (40,027 | ) | (8,797 | ) | (208,365 | ) | ||||||||||||||||
| Total |
$ | 859,237 | $ | 472,820 | $ | 1,351,173 | $ | 2,416,416 | $ | 1,233,912 | $ | 2,492,131 | $ | (18,595 | ) | $ | 8,807,094 | |||||||||||||||
| Allowance for loan losses: |
||||||||||||||||||||||||||||||||
| January 1 |
$ | 965 | $ | 659 | $ | 21,244 | $ | 50,109 | $ | 12,330 | $ | 23,830 | $ | 1,889 | $ | 111,026 | ||||||||||||||||
| Chargeoffs |
(6,187 | ) | (30 | ) | (9,237 | ) | (178,033 | ) | (9,917 | ) | (19,920 | ) | 0 | (223,324 | ) | |||||||||||||||||
| Recoveries |
66 | 0 | 69 | 221 | 1,642 | 80 | 0 | 2,078 | ||||||||||||||||||||||||
| Provisions |
13,303 | 4,166 | 1,636 | 245,982 | 10,553 | 36,037 | 6,908 | 318,585 | ||||||||||||||||||||||||
| December 31 |
$ | 8,147 | $ | 4,795 | $ | 13,712 | $ | 118,279 | $ | 14,608 | $ | 40,027 | $ | 8,797 | $ | 208,365 | ||||||||||||||||
| Individually evaluated for impairment |
1,794 | 0 | 0 | 172 | 0 | 15 | 0 | 1,981 | ||||||||||||||||||||||||
| Collectively evaluated for impairment |
6,353 | 4,795 | 13,712 | 118,107 | 14,608 | 40,012 | 8,797 | 206,384 | ||||||||||||||||||||||||
| Total |
$ | 8,147 | $ | 4,795 | $ | 13,712 | $ | 118,279 | $ | 14,608 | $ | 40,027 | $ | 8,797 | $ | 208,365 | ||||||||||||||||
| Percent of total allowance |
4 | % | 2 | % | 7 | % | 57 | % | 7 | % | 19 | % | 4 | % | 100 | % | ||||||||||||||||
| (1) | Comprised of non owner-occupied commercial real estate (“CRE”). |
| (2) | Comprised of commercial and industrial (“C&I”), and owner-occupied CRE loans. |
In establishing its allowance for loan losses, Sterling groups its loan portfolio into standard industry categories for homogeneous loans. The groups are further segregated based on internal risk rating groups. Both qualitative and quantitative data is considered in determining the probability of default and loss given default for each group of loans. The probability of default and loss given default are used to calculate an expected loss rate which is multiplied by the loan balance in each category to determine the general allowance for loan losses. If a loan is determined to be impaired, Sterling performs an individual evaluation of the loan. The individual evaluation compares the present value of the expected future cash flows or the fair value of the underlying collateral to the recorded investment in the loan. The results of the individual impairment evaluation could determine the need to record a confirmed loss or a specific reserve. See “Allowance for Credit Losses” significant accounting policy in Note 1.
Gross loans pledged as collateral with the FHLB and the Federal Reserve as part of their lending arrangements with Sterling totaled $1.52 billion and $4.41 billion as of December 31, 2010 and 2009, respectively. As of December 31, 2010 and 2009, the unamortized portion of discounts on acquired loans was $5.3 million and $6.4 million, respectively.
Sterling assigns risk rating classifications to its loans. These risk ratings are divided into the following groups:
| Ÿ | Pass—asset is considered of sufficient quality to preclude a Special Mention or an adverse rating. Pass assets generally are well protected by the current net worth and paying capacity of the obligor or by the value of the asset or underlying collateral. |
| Ÿ | Special Mention—asset has potential weaknesses that deserve management’s close attention. If left uncorrected, these potential |
| F-FIN19 |
Table of Contents
| weaknesses may result in deterioration of the repayment prospects for the asset or in Sterling’s credit position at some future date. Special Mention assets are not adversely classified and do not expose an institution to sufficient risk to warrant adverse classification. |
| Ÿ | Substandard—asset is inadequately protected by the current net worth and paying capacity of the obligor or by the collateral pledged, if any. Assets so classified have well-defined weaknesses. They are characterized by the distinct possibility that Sterling will sustain some loss if the deficiencies are not corrected. |
| Ÿ | Doubtful — asset has the weaknesses of those classified Substandard with the added characteristic that the weaknesses make collection or liquidation in full, on the basis of currently existing facts, conditions, and values, highly questionable and improbable. |
Credit quality indicators for Sterling’s loan portfolio as of December 31, 2010 and 2009 grouped according to internally assigned risk ratings and payment activity:
| Real Estate | Consumer | Commercial Banking |
Total | |||||||||||||||||||||||||
| Residential | Multifamily | Commercial | Construction | |||||||||||||||||||||||||
| (Dollars in thousands) | ||||||||||||||||||||||||||||
| 2010 |
||||||||||||||||||||||||||||
| Pass |
$ | 638,273 | $ | 446,363 | $ | 1,047,239 | $ | 68,099 | $ | 718,831 | $ | 1,474,312 | $ | 4,393,117 | ||||||||||||||
| Special mention |
15,670 | 29,566 | 91,870 | 89,524 | 7,074 | 89,680 | 323,384 | |||||||||||||||||||||
| Substandard |
104,467 | 41,093 | 175,548 | 368,045 | 18,163 | 205,354 | 912,670 | |||||||||||||||||||||
| Doubtful |
0 | 0 | 0 | 0 | 0 | 1,080 | 1,080 | |||||||||||||||||||||
| Total |
$ | 758,410 | $ | 517,022 | $ | 1,314,657 | $ | 525,668 | $ | 744,068 | $ | 1,770,426 | $ | 5,630,251 | ||||||||||||||
| Restructured |
$ | 20,569 | $ | 0 | $ | 10,856 | $ | 57,662 | $ | 119 | $ | 19,298 | $ | 108,504 | ||||||||||||||
| Nonaccrual |
70,842 | 23,541 | 95,229 | 277,992 | 7,854 | 70,675 | 546,133 | |||||||||||||||||||||
| Nonperforming |
91,411 | 23,541 | 106,085 | 335,654 | 7,973 | 89,973 | 654,637 | |||||||||||||||||||||
| Performing |
666,999 | 493,481 | 1,208,572 | 190,014 | 736,095 | 1,680,453 | 4,975,614 | |||||||||||||||||||||
| Total |
$ | 758,410 | $ | 517,022 | $ | 1,314,657 | $ | 525,668 | $ | 744,068 | $ | 1,770,426 | $ | 5,630,251 | ||||||||||||||
| 2009 |
||||||||||||||||||||||||||||
| Pass |
$ | 711,271 | $ | 437,741 | $ | 1,171,337 | $ | 558,829 | $ | 1,096,548 | $ | 1,926,015 | $ | 5,901,741 | ||||||||||||||
| Special mention |
28,131 | 39,962 | 80,140 | 79,696 | 8,565 | 117,696 | 354,190 | |||||||||||||||||||||
| Substandard |
99,768 | 38,862 | 149,299 | 848,195 | 11,392 | 245,971 | 1,393,487 | |||||||||||||||||||||
| Doubtful |
0 | 843 | 2,784 | 29,388 | 17 | 12,262 | 45,294 | |||||||||||||||||||||
| Total |
$ | 839,170 | $ | 517,408 | $ | 1,403,560 | $ | 1,516,108 | $ | 1,116,522 | $ | 2,301,944 | $ | 7,694,712 | ||||||||||||||
| Restructured |
$ | 13,091 | $ | 638 | $ | 0 | $ | 47,330 | $ | 120 | $ | 10,100 | $ | 71,279 | ||||||||||||||
| Nonaccrual |
45,103 | 19,692 | 54,024 | 592,242 | 4,787 | 108,804 | 824,652 | |||||||||||||||||||||
| Nonperforming |
58,194 | 20,330 | 54,024 | 639,572 | 4,907 | 118,904 | 895,931 | |||||||||||||||||||||
| Performing |
780,976 | 497,078 | 1,349,536 | 876,536 | 1,111,615 | 2,183,040 | 6,798,781 | |||||||||||||||||||||
| Total |
$ | 839,170 | $ | 517,408 | $ | 1,403,560 | $ | 1,516,108 | $ | 1,116,522 | $ | 2,301,944 | $ | 7,694,712 | ||||||||||||||
| F-FIN20 |
Table of Contents
Aging by class for Sterling’s loan portfolio as of December 31, 2010 and 2009 was as follows (Dollars in thousands):
| Real Estate | Consumer | Commercial Banking |
Total | |||||||||||||||||||||||||
| Residential | Multifamily | Commercial | Construction | |||||||||||||||||||||||||
| 2010 |
||||||||||||||||||||||||||||
| 30 – 59 days past due |
$ | 10,273 | $ | 3,235 | $ | 4,251 | $ | 27,251 | $ | 5,650 | $ | 12,994 | $ | 63,654 | ||||||||||||||
| 60 – 89 days past due |
4,179 | 6,146 | 7,089 | 15,419 | 1,837 | 4,099 | 38,769 | |||||||||||||||||||||
| > 90 days past due |
35,544 | 6,428 | 34,517 | 232,140 | 4,834 | 52,497 | 365,960 | |||||||||||||||||||||
| Total past due |
49,996 | 15,809 | 45,857 | 274,810 | 12,321 | 69,590 | 468,383 | |||||||||||||||||||||
| Current |
708,414 | 501,213 | 1,268,800 | 250,858 | 731,747 | 1,700,836 | 5,161,868 | |||||||||||||||||||||
| Total Loans |
$ | 758,410 | $ | 517,022 | $ | 1,314,657 | $ | 525,668 | $ | 744,068 | $ | 1,770,426 | $ | 5,630,251 | ||||||||||||||
| > 90 days accruing |
$ | 0 | $ | 0 | $ | 0 | $ | 0 | $ | 0 | $ | 0 | $ | 0 | ||||||||||||||
| 2009 |
||||||||||||||||||||||||||||
| 30 – 59 days past due |
8,837 | 2,081 | 14,151 | 59,492 | 11,629 | 28,938 | 125,128 | |||||||||||||||||||||
| 60 – 89 days past due |
1,274 | 891 | 3,339 | 101,621 | 2,719 | 19,611 | 129,455 | |||||||||||||||||||||
| > 90 days past due |
26,488 | 10,136 | 28,726 | 313,015 | 3,660 | 68,225 | 450,250 | |||||||||||||||||||||
| Total past due |
36,599 | 13,108 | 46,216 | 474,128 | 18,008 | 116,774 | 704,833 | |||||||||||||||||||||
| Current |
802,571 | 504,300 | 1,357,344 | 1,041,980 | 1,098,514 | 2,185,170 | 6,989,879 | |||||||||||||||||||||
| Total Loans |
$ | 839,170 | $ | 517,408 | $ | 1,403,560 | $ | 1,516,108 | $ | 1,116,522 | $ | 2,301,944 | $ | 7,694,712 | ||||||||||||||
| > 90 days accruing |
$ | 0 | $ | 0 | $ | 0 | $ | 0 | $ | 0 | $ | 0 | $ | 0 | ||||||||||||||
A troubled debt restructuring (“TDR”) occurs when, due to a borrower’s financial difficulties, Sterling grants a concession that it would not otherwise consider. The concession can take the form of an interest rate or principal reduction or an extension of payments of principal or interest, or both. Restructured loans performing in accordance with their new terms are not included in nonaccrual loans unless there is uncertainty as to the ultimate collection of principal or interest. As of December 31, 2010 and 2009, the recorded investment in restructured loans was $108.5 million and $71.3 million, respectively. As of December 31, 2010, commitments to advance additional funds to TDR borrowers totaled $1.8 million.
| F-FIN21 |
Table of Contents
Sterling considers its nonperforming loans to be impaired loans. Interest income of $8.9 million, $5.1 million and $1.3 million, was recorded during the years ended December 31, 2010, 2009 and 2008, respectively, on nonperforming loans. Additional interest income of $77.3 million, $60.6 million and $24.1 million, would have been recorded during the years ended December 31, 2010, 2009 and 2008, respectively, if the loans had been performing in accordance with their original contractual terms. The average balance of nonperforming loans during the years ended December 31, 2010, 2009 and 2008 was $840.5 million, $688.3 million and $305.6 million, respectively. Impaired loans by class were as follows at December 31, 2010 and 2009:
| Unpaid principal balance |
Charge-offs | Book balance |
Specific reserve |
|||||||||||||
| (Dollars in thousands) | ||||||||||||||||
| 2010 |
||||||||||||||||
| Residential real estate |
$ | 114,401 | $ | 22,990 | $ | 91,411 | $ | 1,239 | ||||||||
| Multifamily real estate |
30,464 | 6,923 | 23,541 | 362 | ||||||||||||
| Commercial real estate |
135,366 | 29,281 | 106,085 | 4,670 | ||||||||||||
| Construction |
539,330 | 203,674 | 335,656 | 12,369 | ||||||||||||
| Consumer |
12,740 | 4,767 | 7,973 | 33 | ||||||||||||
| Commercial banking |
142,111 | 52,138 | 89,973 | 2,564 | ||||||||||||
| Total |
$ | 974,412 | $ | 319,773 | $ | 654,639 | $ | 21,237 | ||||||||
| 2009 |
||||||||||||||||
| Residential real estate |
$ | 71,486 | $ | 13,292 | $ | 58,194 | $ | 454 | ||||||||
| Multifamily real estate |
24,589 | 4,259 | 20,330 | 37 | ||||||||||||
| Commercial real estate |
73,294 | 19,270 | 54,024 | 587 | ||||||||||||
| Construction |
1,030,670 | 391,098 | 639,572 | 24,925 | ||||||||||||
| Consumer |
7,761 | 2,854 | 4,907 | 68 | ||||||||||||
| Commercial banking |
188,314 | 69,410 | 118,904 | 1,058 | ||||||||||||
| Total |
$ | 1,396,114 | $ | 500,183 | $ | 895,931 | $ | 27,129 | ||||||||
4. OREO:
OREO is recorded at fair value, less estimated selling expenses, at foreclosure. The carrying value of OREO is regularly evaluated and, if necessary, an allowance is established to reduce the carrying value to net realizable value. Changes in the carrying value of OREO and related allowance are as follows for the periods presented:
| Years Ended December 31, | ||||||||||||
| 2010 | 2009 | 2008 | ||||||||||
| (Dollars in thousands) | ||||||||||||
| OREO, January 1 |
$ | 83,272 | $ | 62,320 | $ | 11,075 | ||||||
| Loan foreclosures and other additions |
265,115 | 156,449 | 80,900 | |||||||||
| Improvements and other changes |
5,434 | 1,654 | (1,819 | ) | ||||||||
| Sales |
(155,409 | ) | (106,130 | ) | (10,208 | ) | ||||||
| Provisions for losses |
(36,759 | ) | (31,021 | ) | (17,628 | ) | ||||||
| OREO, December 31 |
$ | 161,653 | $ | 83,272 | $ | 62,320 | ||||||
| Allowance, January 1 |
$ | 8,204 | $ | 17,555 | $ | 0 | ||||||
| Provision |
36,759 | 31,021 | 17,628 | |||||||||
| Charge-offs |
(23,164 | ) | (40,372 | ) | (73 | ) | ||||||
| Allowance, December 31 |
$ | 21,799 | $ | 8,204 | $ | 17,555 | ||||||
| F-FIN22 |
Table of Contents
OREO balances increased during 2010 as a result of Sterling taking possession of properties associated with non performing loans at the last stage of asset resolution.
5. Loan Servicing:
Loans serviced for others are not included in the consolidated balance sheets. The unpaid principal balances of these loans as of the dates indicated are summarized as follows:
| December 31, | ||||||||||||
| 2010 | 2009 | 2008 | ||||||||||
| (Dollars in thousands) | ||||||||||||
| Residential |
$ | 1,941,019 | $ | 1,090,197 | $ | 501,570 | ||||||
| Commercial real estate |
1,508,570 | 1,598,227 | 1,680,445 | |||||||||
| Commercial |
89,686 | 105,747 | 99,533 | |||||||||
| Total |
$ | 3,539,275 | $ | 2,794,171 | $ | 2,281,548 | ||||||
The following is an analysis of the changes in mortgage servicing rights (“MSR”) and related allowance:
| Years Ended December 31, | ||||||||||||
| 2010 | 2009 | 2008 | ||||||||||
| (Dollars in thousands) | ||||||||||||
| Mortgage servicing rights, January 1 |
$ | 12,062 | $ | 5,706 | $ | 9,042 | ||||||
| Originated servicing |
10,874 | 8,860 | 163 | |||||||||
| Amortization |
(3,447 | ) | (2,370 | ) | (2,015 | ) | ||||||
| Adjustment to fair value |
1,115 | (134 | ) | (1,484 | ) | |||||||
| Mortgage servicing rights, December 31 |
$ | 20,604 | $ | 12,062 | $ | 5,706 | ||||||
| Allowance—MSR, January 1 |
$ | 2,231 | $ | 2,096 | $ | 612 | ||||||
| Additions |
3,327 | 1,228 | 2,192 | |||||||||
| Recoveries |
(4,442 | ) | (1,093 | ) | (708 | ) | ||||||
| Allowance—MSR, December 31 |
$ | 1,116 | $ | 2,231 | $ | 2,096 | ||||||
Sterling sells residential loans into the secondary market on a servicing-retained or servicing-released basis. During the years ended December 31, 2010, 2009 and 2008, Sterling sold approximately $2.46 billion, $2.80 billion and $1.32 billion in residential real estate loans, resulting in net gains of $58.9 million, $49.5 million and $20.2 million, respectively. From time to time, Sterling sells participations in certain commercial real estate loans to investors on a servicing-retained basis. During the years ended December 31, 2009 and 2008, Sterling sold $20.9 million and $15.8 million, respectively, in loans under participation agreements, resulting in net gains of $1.6 million and $24,000, respectively. During 2010, Sterling did not enter into any of these transactions.
| F-FIN23 |
Table of Contents
6. Property and Equipment:
The components of property and equipment are as follows:
| December 31, | Estimated Useful Life |
|||||||||||
| 2010 | 2009 | |||||||||||
| (Dollars in thousands) | ||||||||||||
| Buildings and improvements |
$ | 56,443 | $ | 57,096 | 20-40 years | |||||||
| Furniture, fixtures, equipment and computer software |
84,112 | 81,371 | 3-10 years | |||||||||
| Leasehold improvements |
19,260 | 19,207 | 5-20 years | |||||||||
| Automobiles |
116 | 116 | 3-5 years | |||||||||
| 159,931 | 157,790 | |||||||||||
| Less accumulated depreciation and amortization |
(90,309 | ) | (77,432 | ) | ||||||||
| 69,622 | 80,358 | |||||||||||
| Land |
11,472 | 11,679 | ||||||||||
| Total property and equipment |
$ | 81,094 | $ | 92,037 | ||||||||
7. Goodwill and other Intangible Assets:
During 2009, mainly due to cumulative losses, Sterling recorded a goodwill impairment charge of $227.6 million, reducing the balance of goodwill to zero, as compared to the December 31, 2008 balance of $227.6 million. As of January 1, 2009, all goodwill was allocated to the Community Banking segment. Changes in the carrying value of goodwill for the years ended December 31, 2010 and 2009 are as follows (Dollars in thousands):
| Book Value | ||||
| Balance at January 1, 2009 |
$ | 227,558 | ||
| Adjustments |
0 | |||
| Impairments |
(227,558 | ) | ||
| Balance as of December 31, 2009 |
0 | |||
| Adjustments |
0 | |||
| Impairments |
0 | |||
| Balance as of December 31, 2010 |
$ | 0 | ||
The carrying value of core deposit intangibles at December 31, 2010 and 2009 are as follows:
| December 31, | ||||||||
| 2010 | 2009 | |||||||
| (Dollars in thousands) | ||||||||
| Gross carrying value |
$ | 43,446 | $ | 43,446 | ||||
| Accumulated amortization |
(26,517 | ) | (21,619 | ) | ||||
| Net carrying value |
$ | 16,929 | $ | 21,827 | ||||
The values of the core deposit intangibles are amortized over the estimated useful life of the deposit relationship, which is generally eight to ten years. Triggering events that resulted in the impairment of goodwill during 2009 and 2008 did not result in an impairment of core deposit intangibles. Core deposit intangible amortization expense was $4.9 million over each of the last three years. Core deposit intangible amortization expense over the next five years is projected as follows:
| Year Ending December 31, |
Amount | |||
| (Dollars in thousands) | ||||
| 2011 |
$ | 4,898 | ||
| 2012 |
4,814 | |||
| 2013 |
4,515 | |||
| 2014 |
1,738 | |||
| 2015 |
964 | |||
| F-FIN24 |
Table of Contents
8. Deposits:
The following table sets forth the composition of Sterling’s deposits at the dates indicated:
| December 31, 2010 | December 31, 2009 | |||||||||||||||
| Amount | % | Amount | % | |||||||||||||
| (Dollars in thousands) | ||||||||||||||||
| Interest-bearing transaction |
$ | 497,395 | 7.2 | $ | 1,014,032 | 13.0 | ||||||||||
| Noninterest-bearing transaction |
992,368 | 14.4 | 1,001,771 | 12.9 | ||||||||||||
| Savings and MMDA |
1,886,425 | 27.3 | 1,577,900 | 20.3 | ||||||||||||
| Time deposits—brokered |
249,029 | 3.6 | 1,079,997 | 13.9 | ||||||||||||
| Time deposits—retail |
3,285,790 | 47.5 | 3,101,490 | 39.9 | ||||||||||||
| Total deposits |
$ | 6,911,007 | 100.0 | $ | 7,775,190 | 100.0 | ||||||||||
| Average cost of deposits during the year |
1.31 | % | 2.04 | % | ||||||||||||
Changes in deposits during 2010 were primarily from the non-renewal of brokered time deposits that reached maturity. Brokered deposits were down 77% from December 31, 2009. Under the recently terminated cease and desist order, Sterling Savings Bank was precluded from participating in the brokered deposit market. The brokered deposit runoff helped improve the mix of deposits, with retail deposits increasing to 85% of total deposits, up from 76% of total deposits at the beginning of the year. Expiration of the Transaction Account Guarantee (“TAG”) program in December 2010 resulted in a shift of deposits from transaction accounts to savings and MMDA accounts.
At December 31, 2010, the scheduled maturities of time deposit accounts are as follows:
| Amount | Weighted Average Interest Rate |
|||||||
| (Dollars in thousands) | ||||||||
| Due within 1 year |
$ | 2,510,666 | 1.43 | % | ||||
| Due in 1 to 2 years |
560,255 | 2.47 | ||||||
| Due in 2 to 3 years |
201,680 | 3.65 | ||||||
| Due in 3 to 4 years |
102,144 | 3.35 | ||||||
| Due in 4 to 5 years |
92,611 | 2.68 | ||||||
| Due after 5 years |
67,463 | 3.60 | ||||||
| $ | 3,534,819 | 1.85 | % | |||||
At December 31, 2010, the remaining maturities of time deposit accounts with a minimum balance of $100,000 were as follows:
| December 31, 2010 | ||||
| (Dollars in thousands) | ||||
| Three months or less |
$ | 685,732 | ||
| After three months through six months |
443,987 | |||
| After six months through twelve months |
404,936 | |||
| After twelve months |
529,296 | |||
| $ | 2,063,951 | |||
| F-FIN25 |
Table of Contents
The components of interest expense associated with deposits are as follows:
| Years Ended December 31, | ||||||||||||
| 2010 | 2009 | 2008 | ||||||||||
| (Dollars in thousands) | ||||||||||||
| Transaction accounts |
$ | 1,918 | $ | 2,534 | $ | 1,346 | ||||||
| Savings and MMDA |
10,180 | 15,941 | 46,254 | |||||||||
| Time deposits |
82,609 | 150,786 | 186,737 | |||||||||
| $ | 94,707 | $ | 169,261 | $ | 234,337 | |||||||
9. Advances from Federal Home Loan Bank:
Sterling Savings Bank has a secured credit line with the FHLB of Seattle. At December 31, 2010 and 2009, this credit line represented a total borrowing capacity of $765.0 million and $2.43 billion, of which $459.3 million and $967.5 million was available, respectively. The decline in the borrowing capacity during the period is primarily from a lower level of pledged assets that Sterling made available to the FHLB for collateral. The advances from FHLB are repayable as follows:
| December 31, 2010 | December 31, 2009 | |||||||||||||||
| Amount | Weighted Average Interest |
Amount | Weighted Average Interest |
|||||||||||||
| (Dollars in thousands) | ||||||||||||||||
| Due within 1 year |
$ | 1,333 | 5.97 | % | $ | 635,182 | 1.57 | % | ||||||||
| Due in 1 to 2 years |
300,000 | 0.23 | 66,398 | 3.85 | ||||||||||||
| Due in 2 to 3 years |
69,269 | 2.96 | 480,000 | 1.53 | ||||||||||||
| Due in 3 to 4 years |
5,000 | 3.12 | 119,368 | 3.29 | ||||||||||||
| Due in 4 to 5 years |
550 | 2.84 | 5,000 | 3.12 | ||||||||||||
| Due after 5 years |
31,059 | 4.39 | 31,219 | 4.40 | ||||||||||||
| $ | 407,211 | 1.06 | % | $ | 1,337,167 | 1.89 | % | |||||||||
The amount of outstanding borrowings from the FHLB declined during 2010 as a result of maturing advances not being renewed, and as a result of Sterling prepaying $295.0 million of advances during the fourth quarter. The prepaid FHLB advances had a weighted average remaining term of 14 months, and a weighted average cost of 3.78%. The prepayment is expected to have a positive impact on Sterling’s net interest margin for the next several quarters. At December 31, 2010, total advances outstanding included $100.2 million of advances from the FHLB of San Francisco, which were assumed in the 2007 Northern Empire acquisition.
Only member institutions have access to funds from the Federal Home Loan Banks. As a condition of membership, Sterling is required to hold FHLB stock. As of both December 31, 2010 and 2009, Sterling held approximately $100 million of FHLB stock, which is included as a component of other assets on the Consolidated Balance Sheet. The FHLB Seattle has experienced losses from credit-related charges associated with projected losses on their investments in nonagency MBS, and is currently unable to repurchase or redeem capital stock or to pay dividends. FHLB stock does not have a readily determinable fair value and the equity ownership rights are more limited than would be the case for ownership rights in a public company. FHLB stock is viewed as a long term investment and as a restricted investment security carried at cost.
| F-FIN26 |
Table of Contents
10. Securities Sold Subject to Repurchase Agreements and Funds Purchased:
Sterling sells securities under agreements to repurchase the same or similar securities (“reverse repurchase agreements”). Reverse repurchase agreements are treated as financings, and the obligations to repurchase securities sold are reflected as a liability on the consolidated balance sheet. The securities underlying these agreements continue to be held by Sterling, but the title has been transferred to the counterparties to the agreements. The risk of default under such agreements is limited by the financial strength of these broker/dealers and the level of borrowings relative to the market value of pledged securities. At both December 31, 2010 and 2009, under the reverse repurchase agreements, Sterling had pledged as collateral $1.70 billion and $1.31 billion, respectively, of investments and MBS. The average balances of reverse repurchase agreements were $1.03 billion and $1.04 billion during the years ended December 31, 2010 and 2009, respectively. The maximum amount outstanding at any month end during these same periods was $1.04 billion and $1.06 billion, respectively. Sterling also may borrow from the Federal Reserve discount window, with no funds being purchased as of December 31, 2010, and $16.7 million being purchased as of December 31, 2009.
At December 31, 2010 and 2009, borrowings under reverse repurchase agreements and funds purchased are contractually repayable as follows. Actual repayments may vary due to default and call provisions:
| December 31, 2010 | December 31, 2009 | |||||||||||||||
| Amount | Weighted Average Interest Rate |
Amount | Weighted Average Interest Rate |
|||||||||||||
| (Dollars in thousands) | ||||||||||||||||
| Due within 1 yr |
$ | 32,512 | 0.33 | % | $ | 49,146 | 0.50 | % | ||||||||
| Due within 2 yrs |
150,000 | 4.19 | 0 | 0.00 | ||||||||||||
| Due within 3 yrs |
100,000 | 3.00 | 150,000 | 4.19 | ||||||||||||
| Due within 4 yrs |
0 | 0.00 | 100,000 | 3.00 | ||||||||||||
| Due within 5 yrs |
150,000 | 3.76 | 0 | 0.00 | ||||||||||||
| Thereafter |
600,000 | 3.91 | 750,000 | 3.86 | ||||||||||||
| $ | 1,032,512 | 3.73 | % | $ | 1,049,146 | 3.72 | % | |||||||||
11. Other Borrowings:
The components of other borrowings are as follows:
| December 31, | ||||||||
| 2010 | 2009 | |||||||
| (Dollars in thousands) | ||||||||
| Junior Subordinated Debentures |
$ | 245,285 | $ | 245,281 | ||||
| Other |
0 | 3,000 | ||||||
| Total other borrowings |
$ | 245,285 | $ | 248,281 | ||||
| F-FIN27 |
Table of Contents
Sterling has raised capital through the formation of trust subsidiaries. The trusts are business trusts in which Sterling owns all of the common equity. The proceeds from the sale of the securities were used to purchase junior subordinated debentures issued by Sterling. Sterling’s obligations under the junior subordinated debentures and related documents, taken together, constitute a full and unconditional guarantee by Sterling of the trusts’ obligations. The junior subordinated debentures are treated as debt of Sterling. The junior subordinated debentures generally mature 30 years after issuance and are redeemable at the option of Sterling under certain conditions, including, with respect to certain of the trusts, payment of call premiums. During the third quarter of 2009, Sterling elected to defer regularly scheduled interest payments on these securities, and continued to defer these payments through December 31, 2010. As of December 31, 2010 and 2009, the accrued deferred interest was $9.4 million and $3.4 million, respectively. Sterling is allowed to defer payments of interest on the junior subordinated debentures for up to 20 consecutive quarterly periods without triggering an event of default. Details of the junior subordinated debentures are as follows:
| Subsidiary Issuer |
Issue Date | Maturity Date |
Next Call Date |
Rate at December 31, 2010 |
Amount | |||||||||||||||||||
| (Dollars in thousands) | ||||||||||||||||||||||||
| Sterling Capital Trust IX |
July 2007 | Oct 2037 | Oct 2012 | Floating | 1.69 | % | $ | 46,392 | ||||||||||||||||
| Sterling Capital Trust VIII |
Sept 2006 | Sept 2036 | Dec 2011 | Floating | 1.93 | 51,547 | ||||||||||||||||||
| Sterling Capital Trust VII |
June 2006 | June 2036 | June 2011 | Floating | 1.83 | 56,702 | ||||||||||||||||||
| Lynnwood Capital Trust II |
June 2005 | June 2035 | Mar 2011 | Floating | 2.10 | 10,310 | ||||||||||||||||||
| Sterling Capital Trust VI |
June 2003 | Sept 2033 | Mar 2011 | Floating | 3.50 | 10,310 | ||||||||||||||||||
| Sterling Capital Statutory Trust V |
May 2003 | May 2033 | Feb 2011 | Floating | 3.55 | 20,619 | ||||||||||||||||||
| Sterling Capital Trust IV |
May 2003 | May 2033 | Feb 2011 | Floating | 3.44 | 10,310 | ||||||||||||||||||
| Sterling Capital Trust III |
April 2003 | April 2033 | Jan 2011 | Floating | 3.54 | 14,433 | ||||||||||||||||||
| Lynnwood Capital Trust I |
Mar 2003 | Mar 2033 | Mar 2011 | Floating | 3.45 | 9,452 | ||||||||||||||||||
| Klamath First Capital Trust I |
July 2001 | July 2031 | Jan 2011 | Floating | 4.43 | 15,210 | ||||||||||||||||||
| 2.44 | %* | $ | 245,285 | |||||||||||||||||||||
| * | Weighted average rate |
| F-FIN28 |
Table of Contents
12. Income Taxes:
The components of income tax expense (benefit) included in the consolidated statements of income were as follows:
| Years Ended December 31, | ||||||||||||
| 2010 | 2009 | 2008 | ||||||||||
| (Dollars in thousands) | ||||||||||||
| Current income taxes: |
||||||||||||
| Federal |
$ | (102 | ) | $ | (50,958 | ) | $ | (13,378 | ) | |||
| State |
(11 | ) | (308 | ) | (3,260 | ) | ||||||
| Total current income taxes |
(113 | ) | (51,266 | ) | (16,638 | ) | ||||||
| Deferred income taxes: |
||||||||||||
| Federal |
102 | 74,002 | (53,666 | ) | ||||||||
| State |
11 | 4,246 | (5,594 | ) | ||||||||
| Total deferred income taxes |
113 | 78,248 | (59,260 | ) | ||||||||
| Total income tax expense |
$ | 0 | $ | 26,982 | $ | (75,898 | ) | |||||
The tax effects of the principal temporary differences giving rise to deferred tax assets and liabilities were as follows:
| December 31, | ||||||||||||||||
| 2010 | 2009 | |||||||||||||||
| Assets | Liabilities | Assets | Liabilities | |||||||||||||
| (Dollars in thousands) | ||||||||||||||||
| Allowance for losses on loans |
$ | 102,852 | $ | 0 | $ | 135,097 | $ | 0 | ||||||||
| NOL carryforwards |
263,433 | 0 | 135,956 | 0 | ||||||||||||
| Deferred compensation |
11,197 | 0 | 11,281 | 0 | ||||||||||||
| Purchase accounting discounts |
7,270 | 0 | 8,831 | 0 | ||||||||||||
| Nonaccrual loans |
2,555 | 0 | 2,799 | 0 | ||||||||||||
| FHLB Seattle dividends |
0 | 16,592 | 0 | 16,665 | ||||||||||||
| Unrealized losses on available-for-sale securities |
2,305 | 0 | 0 | 9,564 | ||||||||||||
| Deferred loan fees |
0 | 5,864 | 0 | 6,766 | ||||||||||||
| Mortgage servicing rights |
0 | 7,369 | 0 | 3,923 | ||||||||||||
| Purchase accounting premiums |
0 | 2,415 | 0 | 2,797 | ||||||||||||
| Fair value |
0 | 806 | 0 | 1,064 | ||||||||||||
| Prepaid expenses |
0 | 2,239 | 0 | 763 | ||||||||||||
| Office properties and equipment |
391 | 0 | 0 | 548 | ||||||||||||
| FIN 48—Temporary Difference |
815 | 0 | 0 | 0 | ||||||||||||
| Other |
6,828 | 0 | 8,729 | 0 | ||||||||||||
| $ | 397,646 | $ | 35,285 | $ | 302,693 | $ | 42,090 | |||||||||
| F-FIN29 |
Table of Contents
Sterling uses an estimate of future earnings, and an evaluation of its loss carryback ability and tax planning strategies to determine whether or not the benefit of its net deferred tax asset will be realized. During 2009, Sterling determined that the negative evidence associated recent loss history, the regulatory agreements in place at the time of the assessment, and the credit condition of its loan portfolio outweighed the positive evidence in regards to whether or not Sterling would be able to generate taxable income in the near term. Therefore, during the third quarter of 2009, a full valuation allowance was established against its deferred tax asset, with the allowance totaling $359.0 million as of December 31, 2010. A rollforward of the allowance is as follows:
| 2010 | ||||
| (Dollars in thousands) | ||||
| Balance, January 1 |
$ | (269,000 | ) | |
| Reserve |
(90,000 | ) | ||
| Recoveries |
0 | |||
| Balance, December 31 |
$ | (359,000 | ) | |
In April 2010, Sterling’s Board of Directors adopted a shareholder rights plan designed to preserve substantial tax assets that include net operating losses, capital losses and certain built-in losses that could be utilized in certain circumstances to offset taxable income and reduce its federal income tax liability. Sterling’s ability to use its tax assets would be substantially limited if there were an “ownership change” as defined under Section 382 of the Internal Revenue Code and related Internal Revenue Service pronouncements. In general, an ownership change would occur if a shareholder or group of shareholders deemed “5-percent shareholders,” as defined under Section 382, collectively increase their ownership in Sterling by more than 50 percentage points over a rolling three-year period. Five-percent shareholders do not include certain institutional holders, such as mutual fund companies, that hold Sterling equity securities on behalf of several individual mutual funds where no single fund owns 5 percent or more of Sterling equity securities.
As part of the plan, the Sterling Board of Directors declared a dividend of one preferred share purchase right for each outstanding share of its common stock. The preferred share purchase rights were distributable to shareholders of record as of April 15, 2010, as well as to holders of common stock and Sterling securities convertible into common stock issued after that date, but would only be activated if triggered pursuant to the terms of the plan. See Sterling’s Current Report on Form 8-K, as filed with the SEC on April 15, 2010, for additional information regarding the shareholder rights plan.
| F-FIN30 |
Table of Contents
The following table summarizes the calculation of Sterling’s effective tax rates for the periods presented:
| Years Ended December 31, | ||||||||||||||||||||||||
| 2010 | 2009 | 2008 | ||||||||||||||||||||||
| Amount | % | Amount | % | Amount | % | |||||||||||||||||||
| (Dollars in thousands) | ||||||||||||||||||||||||
| Income tax provision at the federal statutory rate |
$ | (78,499 | ) | 35.0 | % | $ | (283,889 | ) | 35.0 | % | $ | (144,001 | ) | 35.0 | % | |||||||||
| Tax effect of: |
||||||||||||||||||||||||
| Deferred tax valuation allowance |
90,000 | (40.1 | ) | 269,000 | (33.2 | ) | 0 | 0.0 | ||||||||||||||||
| Goodwill impairment |
0 | 0.0 | 64,219 | (7.9 | ) | 78,318 | (19.0 | ) | ||||||||||||||||
| State taxes, net of federal benefit |
(7,116 | ) | 3.1 | (16,383 | ) | 2.0 | (5,755 | ) | 1.4 | |||||||||||||||
| Tax-exempt interest |
(2,158 | ) | 1.0 | (3,026 | ) | 0.4 | (1,832 | ) | 0.4 | |||||||||||||||
| Bank owned life insurance |
(2,557 | ) | 1.1 | (2,434 | ) | 0.3 | (2,298 | ) | 0.6 | |||||||||||||||
| Tax credits |
(1,912 | ) | 0.9 | (2,221 | ) | 0.3 | (1,912 | ) | 0.4 | |||||||||||||||
| Other, net |
2,242 | (1.0 | ) | 1,716 | (0.2 | ) | 1,582 | (0.4 | ) | |||||||||||||||
| $ | 0 | 0.0 | % | $ | 26,982 | -3.3 | % | $ | (75,898 | ) | 18.4 | % | ||||||||||||
The following is a reconciliation of the beginning and ending amount of unrecognized tax benefits for the periods presented:
| 2010 | 2009 | 2008 | ||||||||||
| (Dollars in thousands) | ||||||||||||
| Balance at January 1 |
$ | 6,665 | $ | 4,622 | $ | 1,786 | ||||||
| Additions—current year tax positions |
65 | 5,227 | 3,529 | |||||||||
| Additions—prior year tax positions |
22 | 41 | 517 | |||||||||
| Reductions—prior year tax positions |
(5,026 | ) | (3,225 | ) | (1,210 | ) | ||||||
| Balance at December 31 |
$ | 1,726 | $ | 6,665 | $ | 4,622 | ||||||
Included in income tax expense for the years ended December 31, 2010 and 2009 were potential penalties and interest associated with potential estimate variances in the amount of $0 and $114,000 respectively. At December 31, 2010 and 2009, the accrued balance for these potential penalties and interest totaled $206,000 and $507,000, respectively. Sterling’s tax positions for the years 2007 through 2010 remain subject to review by the Internal Revenue Service. Sterling’s uncertain tax position at December 31, 2010 includes $815,000 of temporary differences, an undetermined portion of which is expected to reverse within the next 12 months. As of December 31, 2010 and December 31, 2009, $912,000 and $1.5 million of the uncertain tax positions represented permanent differences.
| F-FIN31 |
Table of Contents
13. Stock Based Compensation:
The following share and per share amounts disclosed in this footnote, as well as all other share and per share amounts disclosed in these financial statements, have been restated to reflect the 1-for-66 reverse stock split that was effected in November 2010. Stock option transactions are summarized as follows:
| 2010 | 2009 | 2008 | ||||||||||||||||||||||
| Number | Weighted Average Exercise |
Number | Weighted Average Exercise |
Number | Weighted Average Exercise |
|||||||||||||||||||
| Balance, January 1 |
28,932 | $ | 1,390.07 | 30,215 | $ | 1,481.42 | 31,456 | $ | 1,396.74 | |||||||||||||||
| Granted |
0 | 0.00 | 2,822 | 122.10 | 3,950 | 1,167.39 | ||||||||||||||||||
| Exercised |
0 | 0.00 | 0 | 0.00 | (3,600 | ) | 386.65 | |||||||||||||||||
| Cancelled/expired |
(10,012 | ) | 1,450.72 | (4,105 | ) | 1,190.81 | (1,591 | ) | 1,504.63 | |||||||||||||||
| Balance, December 31 |
18,920 | $ | 1,357.97 | 28,932 | $ | 1,390.07 | 30,215 | $ | 1,481.42 | |||||||||||||||
| Exercisable |
14,655 | $ | 1,497.94 | 21,328 | $ | 1,506.15 | 22,825 | $ | 1,428.38 | |||||||||||||||
At December 31, 2010, the weighted average remaining contractual life and the aggregate intrinsic value of stock options outstanding was 2.8 years and $0, respectively, and of stock options exercisable was 2.6 years and $0, respectively, and at December 31, 2009, were 2.9 years and $0, respectively, and 2.4 years and $0, respectively. As of December 31, 2010, a total of 5,606,775 shares remained available for grant under Sterling’s 2001, 2003, 2007 and 2010 Long-Term Incentive Plans. The stock options granted under these plans have terms of four, six, eight or ten years. Restricted shares granted during 2010 have vesting schedules ranging from immediate to four years. During the years ended December 31, 2010, 2009 and 2008, the intrinsic value of options exercised were $0, $0 and $2.5 million, respectively, and fair value of options granted was $0, $193,000, and $1.1 million, respectively. The Black-Scholes option-pricing model was used in estimating the fair value of option grants. The weighted average assumptions used were:
| Years Ended December 31, | ||||||
| 2010 | 2009 | 2008 | ||||
| Expected volatility |
n/a | 72% | 30% – 56% | |||
| Expected lives (in years) |
n/a | 4.4 | 4.3 | |||
| Expected dividend yield |
n/a | 0.00% | 0% – 3.32% | |||
| Risk free interest rates |
n/a | 2.07% | 2.84% –3.11% | |||
Cancellations and forfeitures are not model inputs, but do affect the amount of expense that is recognized.
The following table summarizes information about Sterling’s plans at December 31, 2010:
| Range of Exercise Prices |
Options Outstanding | Options Exercisable | ||||||||||||||||||
| Number Outstanding |
Weighted Average Remaining Contractual |
Weighted Average Exercise Price |
Number Exercisable |
Weighted Average Exercise Price |
||||||||||||||||
| $ 0.00 - 500.00 |
2,717 | 4.0 years | $ | 138.51 | 810 | $ | 177.16 | |||||||||||||
| 500.01 - 1,000.00 |
1,322 | 0.5 years | 584.25 | 1,299 | 580.52 | |||||||||||||||
| 1,000.01 - 1,500.00 |
4,427 | 3.0 years | 1,209.17 | 2,893 | 1,227.76 | |||||||||||||||
| 1,500.01 - 2,000.00 |
7,144 | 2.7 years | 1,672.00 | 7,031 | 1,672.97 | |||||||||||||||
| 2,000.01 - 2,500.00 |
3,310 | 2.4 years | 2,189.22 | 2,622 | 2,189.22 | |||||||||||||||
| 18,920 | 14,655 | |||||||||||||||||||
| F-FIN32 |
Table of Contents
The following is a summary of restricted stock activity for the periods presented:
| 2010 | 2009 | 2008 | ||||||||||||||||||||||
| Number | Weighted Average Price |
Number | Weighted Average Price |
Number | Weighted Average Price |
|||||||||||||||||||
| Balance, January 1 |
4,000 | $ | 619.55 | 4,339 | $ | 1,330.19 | 1,290 | $ | 2,189.22 | |||||||||||||||
| Granted |
488,040 | 16.39 | 3,966 | 122.10 | 3,388 | 1,084.27 | ||||||||||||||||||
| Vested |
(121,935 | ) | 23.05 | (1,321 | ) | 1,306.91 | (323 | ) | 2,189.22 | |||||||||||||||
| Cancelled/forfeited |
(1,300 | ) | 723.41 | (2,984 | ) | 687.45 | (16 | ) | 1,174.14 | |||||||||||||||
| Balance, December 31 |
368,805 | $ | 18.24 | 4,000 | $ | 619.55 | 4,339 | $ | 1,330.19 | |||||||||||||||
Stock based compensation expense recognized during the periods presented was as follows:
| Years Ended | ||||||||||||
| 2010 | 2009 | 2008 | ||||||||||
| (Dollars in thousands) | ||||||||||||
| Stock based compensation expense: |
||||||||||||
| Stock options |
$ | 728 | $ | 1,001 | $ | 1,088 | ||||||
| Restricted stock |
2,435 | 1,136 | 1,443 | |||||||||
| Total |
$ | 3,163 | $ | 2,137 | $ | 2,531 | ||||||
As of December 31, 2010, unrecognized equity compensation expense totaled $6.7 million, as the underlying outstanding awards had not yet been earned. This amount will be recognized over a weighted average period of 1.3 years.
14. Shareholders’ Equity:
As of December 31, 2010, Sterling had 10 million shares of preferred stock authorized, with no shares being issued and outstanding. As of December 31, 2009, Sterling had 10 million shares of preferred stock authorized, with one series issued and outstanding, consisting of 303,000 shares of Series A preferred stock. As of December 31, 2010, there were 151,515,151 shares of common stock authorized, and at December 31, 2009, there were 11,363,636 shares of common stock authorized, with one class of common stock issued and outstanding at both dates. As of December 31, 2010, the number of common shares that were outstanding was 61,926,187. As of December 31, 2009, the number of common shares that were issued and outstanding was 791,077. During 2010, Sterling’s articles of incorporation were amended to eliminate the par value of its common stock, and a 1-for-66 reverse stock split was effected, both of which are reflected in prior period presentations within these financial statements.
On August 26, 2010, Sterling completed several transactions as part of its recapitalization and recovery plan, which included the issuance of 3,418,300 shares of Series B preferred stock at $92 per share, 3,881,700 shares of Series D preferred stock at $92 per share, 10,162,879 shares of common stock at $13.20 per share, and warrants to purchase 2,625,000 shares of common stock at an exercise price of $14.52 per share, raising aggregate proceeds for Sterling of $730.0 million (collectively, the “Recapitalization Transactions” or the “Recapitalization”). The Recapitalization consisted of three principal transactions.
| Ÿ | an investment of approximately $170.9 million by each of (a) Thomas H. Lee Equity Fund VI, L.P., Thomas H. Lee Parallel Fund VI, L.P., Thomas H. Lee Parallel (DT) Fund VI, L.P. and THL Sterling Equity Investors, L.P. (collectively, “THL” or an “Anchor Investor”) and (b) Warburg Pincus Private Equity X, L.P. (“Warburg Pincus” or an “Anchor Investor”), pursuant to which |
| F-FIN33 |
Table of Contents
| each received 1,035,848 shares of common stock, 1,709,150 shares of Series B preferred stock, and a seven-year warrant to purchase 1,312,500 shares of common stock at an exercise price of $14.52 per share (the “Anchor Investments”); |
| Ÿ | the exchange of 303,000 shares of preferred stock held by the U.S. Department of the Treasury (“Treasury”) at a discounted exchange value into 5,738,636 shares of common stock at a conversion price of $13.20 per share, and amendment of the terms of the warrant held by Treasury to purchase 97,540.56 shares of common stock at an exercise price of $465.96 per share to provide for an exercise price of $13.20 per share for a ten-year term (the “Treasury Exchange”); and |
| Ÿ | investments by accredited investors of an aggregate of $388.2 million in exchange for an aggregate of 2,352,545 shares of common stock and 3,881,700 shares of Series D preferred stock. |
The Treasury Exchange resulted in a gain of $84.3 million because the book value of the preferred stock plus accrued dividends was greater than the $230.9 million fair value of the common stock issued to Treasury and the fair value of the new warrant. This is accounted for as a non-cash increase in income available to common shareholders, but had no effect on Sterling’s overall equity or its regulatory capital position.
The issuance price of $13.20 per share for the Series B and D preferred stock on an as-converted basis represented a $26.40 per share discount from the common stock’s market price of $39.60 per share. For accounting purposes, this discount is considered a beneficial conversion feature. Accordingly, Sterling recorded this discount, valued at $604.6 million in aggregate, as a reduction to preferred stock and as an increase to common stock.
In addition to the adjustment to the exercise price of the warrant held by Treasury, the terms of the warrant were revised to include a future adjustment to the exercise price for any subsequent issuances of common stock by Sterling that would result in dilution to the warrant. This term is deemed a “ratchet provision,” resulting in the warrant being carried as a derivative liability as compared to a common stock equity equivalent for balance sheet purposes. As a derivative liability, the warrant is carried at fair value, with subsequent remeasurements flowing through earnings. The initial value attributed to warrant was $3.7 million, with the fair value estimated using the Black-Scholes option pricing model, with assumptions of 105% volatility, a risk-free rate of 2.63%, a yield of 0% and an estimated life of ten years. Changes to this instrument’s estimated value are being recorded in other noninterest income.
Subsequent to the Recapitalization Transactions on August 26, 2010, and assuming the warrants held by THL, Warburg and Treasury are fully exercised, THL and Warburg together owned approximately 45% of Sterling on an as-converted basis, and Treasury owned approximately 9% of Sterling on an as-converted basis.
On October 21, 2010, Sterling held a Special Meeting at which shareholders approved: (1) the increase in the authorized number of shares of common stock from 11,363,636 to 151,515,151; (2) the conversion of outstanding Series B and D preferred stock into, and the exercisability of the warrants issued to THL and Warburg Pincus for shares of common stock; and (3) an amendment to Sterling’s Restated Articles of Incorporation to authorize a reverse stock split, which occurred on November 19, 2010, at a rate, as determined by the board of directors, of 1-for-66.
On October 22, 2010 the series B and D preferred stock were converted into 50,878,788 shares of common stock. Upon conversion the $604.6 million discount was amortized and recognized as a non-cash dividend paid to the preferred shareholders, and had no effect on Sterling’s overall equity or its regulatory capital position.
| F-FIN34 |
Table of Contents
15. Earnings (Loss) Per Share:
The following share and per share amounts disclosed in this footnote, as well as all other share and per share amounts disclosed in these financial statements, have been restated to reflect the 1-for-66 reverse stock split that was effected in November 2010. The following table presents a reconciliation of the numerators and denominators used in the basic and diluted earnings (loss) per share computations.
| 2010 | 2009 | 2008 | ||||||||||
| (Dollars in thousands, except per share amounts) | ||||||||||||
| Numerator: |
||||||||||||
| Net loss available to common shareholders |
$ | (756,141 | ) | $ | (855,463 | ) | $ | (336,742 | ) | |||
| Denominator: |
||||||||||||
| Weighted average shares outstanding—basic |
14,253,869 | 786,701 | 783,662 | |||||||||
| Dilutive securities outstanding |
0 | 0 | 0 | |||||||||
| Weighted average shares outstanding—diluted |
14,253,869 | 786,701 | 783,662 | |||||||||
| Loss per share—basic |
$ | (53.05 | ) | $ | (1,087.41 | ) | $ | (429.70 | ) | |||
| Loss per share—diluted |
$ | (53.05 | ) | $ | (1,087.41 | ) | $ | (429.70 | ) | |||
| Antidilutive securities outstanding (weighted average): |
||||||||||||
| Stock options |
20,700 | 30,154 | 26,705 | |||||||||
| Warrants |
954,754 | 97,541 | 2,375 | |||||||||
| Restricted shares |
20,754 | 2,972 | 3,729 | |||||||||
| Total antidilutive securities outstanding |
996,208 | 130,667 | 32,809 | |||||||||
The August 26, 2010 conversion of Series C preferred stock into common stock resulted in an increase in income available to common shareholders of $84.3 million. The October 22, 2010 conversion of Series B and D preferred stock into common stock resulted in a decrease in income available to common shareholders of $604.6 million. The loss for 2009 included a goodwill impairment charge of $227.6 million, and an initial allowance against deferred tax assets of $269.0 million. The loss for 2008 included a goodwill impairment charge of $223.8 million.
16. Regulatory Matters and Capital Position:
On September 27, 2010, Sterling announced that its banking regulators had terminated the cease and desist order put in place in October 2009 with Sterling Savings Bank, reflecting a strengthened balance sheet and capital position. Although the cease and desist is no longer applicable, Sterling Savings Bank will continue to be subject to enhanced supervisory review by the FDIC and the Washington Department of Financial Institutions under a memorandum of understanding (the “SSB MOU”), pursuant to which Sterling Savings Bank must maintain Tier 1 capital in an amount that ensures that its leverage ratio is at least 8 percent. Sterling Savings Bank will also be required to meet certain asset quality targets and comply with other requirements. As of the date of this filing, Sterling continues to be subject to a regulatory agreement with the Federal Reserve Bank of San Francisco.
| F-FIN35 |
Table of Contents
During the third quarter of 2010, Sterling Savings Bank returned to well-capitalized status following the termination of the cease and desist order, with the termination of the order occurring subsequent to Sterling receiving aggregate proceeds of $730.0 million in connection with the Recapitalization Transactions and Sterling downstreaming $650.0 million to Sterling Savings Bank in the form of a common stock investment. The following table sets forth the respective capital positions for Sterling and Sterling Savings Bank as of the dates shown:
| Actual | Adequately Capitalized |
Well-Capitalized | ||||||||||||||||||||||
| Amount | Ratio | Amount | Ratio | Amount | Ratio | |||||||||||||||||||
| (Dollars in thousands) | ||||||||||||||||||||||||
| As of December 31, 2010: |
||||||||||||||||||||||||
| Tier 1 leverage (to average assets) |
||||||||||||||||||||||||
| Sterling |
$ | 1,001,004 | 10.1 | % | $ | 396,984 | 4.0 | % | $ | 496,230 | 5.0 | % | ||||||||||||
| Sterling Savings Bank |
965,802 | 9.8 | 396,257 | 4.0 | 495,321 | 5.0 | ||||||||||||||||||
| Tier I (to risk-weighted assets) |
||||||||||||||||||||||||
| Sterling |
1,001,004 | 16.2 | 247,067 | 4.0 | 370,600 | 6.0 | ||||||||||||||||||
| Sterling Savings Bank |
965,802 | 15.7 | 246,689 | 4.0 | 370,033 | 6.0 | ||||||||||||||||||
| Total (to risk-weighted assets) |
||||||||||||||||||||||||
| Sterling |
1,080,441 | 17.5 | 494,134 | 8.0 | 617,667 | 10.0 | ||||||||||||||||||
| Sterling Savings Bank |
1,045,123 | 17.0 | 493,377 | 8.0 | 616,722 | 10.0 | ||||||||||||||||||
| As of December 31, 2009: |
||||||||||||||||||||||||
| Tier 1 leverage (to average assets) |
||||||||||||||||||||||||
| Sterling |
$ | 394,836 | 3.5 | % | $ | 457,034 | 4.0 | % | $ | 571,292 | 5.0 | % | ||||||||||||
| Sterling Savings Bank |
458,260 | 4.2 | 434,458 | 4.0 | 543,073 | 5.0 | ||||||||||||||||||
| Tier I (to risk-weighted assets) |
||||||||||||||||||||||||
| Sterling |
394,836 | 4.9 | 323,678 | 4.0 | 485,517 | 6.0 | ||||||||||||||||||
| Sterling Savings Bank |
458,260 | 5.9 | 309,546 | 4.0 | 464,319 | 6.0 | ||||||||||||||||||
| Total (to risk-weighted assets) |
||||||||||||||||||||||||
| Sterling |
637,803 | 7.9 | 647,356 | 8.0 | 809,196 | 10.0 | ||||||||||||||||||
| Sterling Savings Bank |
561,083 | 7.3 | 619,091 | 8.0 | 773,864 | 10.0 | ||||||||||||||||||
| F-FIN36 |
Table of Contents
17. Commitments and Contingencies:
Sterling is a party to financial instruments with off-balance sheet risk in the normal course of business to meet the financing needs of its customers. These financial instruments include commitments to originate and purchase loans, provide funds under existing lines of credit, and include forward loan sale agreements to mortgage brokers. Commitments, which are disbursed subject to certain limitations, extend over various periods of time, with the majority of funds being disbursed within a twelve-month period. The undisbursed balances and other commitments as of the dates indicated are summarized as follows:
| December 31, | ||||||||
| 2010 | 2009 | |||||||
| (Dollars in thousands) | ||||||||
| Undisbursed loan funds—construction loans |
$ | 32,954 | $ | 167,906 | ||||
| Undisbursed lines of credit—commercial loans |
286,327 | 523,681 | ||||||
| Undisbursed lines of credit—consumer loans |
301,543 | 320,535 | ||||||
| Firm commitments to sell loans |
14,873 | 68,761 | ||||||
As of December 31, 2010 and 2009, the balance of the credit loss reserve for these unfunded commitments totaled $10.7 million and $12.0 million, respectively. A rollforward of this reserve is as follows for the periods presented:
| Years Ended December 31, | ||||||||||||
| 2010 | 2009 | 2008 | ||||||||||
| (Dollars in thousands) | ||||||||||||
| Allowance for unfunded |
||||||||||||
| January 1, |
$ | 11,967 | $ | 21,334 | $ | 6,306 | ||||||
| Provision |
(361 | ) | (9,367 | ) | 15,074 | |||||||
| Charge-offs |
(899 | ) | 0 | (46 | ) | |||||||
| December 31, |
$ | 10,707 | $ | 11,967 | $ | 21,334 | ||||||
As of December 31, 2010 and 2009, Sterling had approximately $16.5 million and $28.6 million of commercial and standby letters of credit outstanding, respectively. During the years ended December 31, 2010 and 2009, Sterling collected approximately $239,000 and $604,000 in fees from these off-balance sheet arrangements.
Future minimum rental commitments as of December 31, 2010, under non-cancelable operating leases with initial or remaining terms of more than one year, are as follows:
| Year Ending December 31, |
Amount | |||
| (Dollars in thousands) | ||||
| 2011 |
$ | 14,275 | ||
| 2012 |
11,725 | |||
| 2013 |
9,349 | |||
| 2014 |
7,652 | |||
| 2015 |
5,506 | |||
| Thereafter |
23,020 | |||
| $ | 71,527 | |||
| F-FIN37 |
Table of Contents
Rent expense recorded for the years ended December 31, 2010, 2009 and 2008 was $16.0 million, $15.8 million and $15.4 million, respectively.
Securities Class Action Litigation
On December 11, 2009, a putative securities class action was filed in the United States District Court for the Eastern District of Washington against Sterling and certain of our current and former officers. The Court appointed a lead plaintiff on March 8, 2010. On June 18, 2010, the lead plaintiff filed a consolidated complaint. The complaint alleges that the defendants violated sections 10(b) and 20(a) of the Securities Exchange Act of 1934 and SEC Rule 10b-5 by making false and misleading statements concerning our business and financial results. The complaint alleges that defendants failed to disclose the extent of Sterling’s delinquent construction loans, properly record losses for impaired loans, and properly reserve for loan losses. The complaint seeks, on behalf of persons who purchased our common stock during the period from July 23, 2008 to October 15, 2009, damages of an unspecified amount and attorneys’ fees and costs. On August 30, 2010, Sterling moved to dismiss the complaint. A hearing on the motion to dismiss occurred on March 2, 2011 and an order has not yet been issued. Failure by Sterling to obtain a favorable resolution of the claims set forth in the complaint could have a material adverse effect on our business, results of operations and financial condition. Currently, a loss resulting from these claims is not considered probable or estimable in amount.
ERISA Class Action Litigation
On January 20 and 22, 2010, two putative class action complaints were filed in the United States District Court for the Eastern District of Washington against Sterling Financial Corporation and Sterling Savings Bank (collectively, “Sterling”), as well as certain of Sterling’s current and former officers and directors. The two complaints were merged in a Consolidated Amended Complaint (the “Complaint”) filed on July 16, 2010 in the same court. The Complaint does not name all of individuals named in the prior complaints, but it is expected that additional defendants will be added. The Complaint alleges that the defendants breached their fiduciary duties under sections 404 and 405 of the Employee Retirement Income Security Act of 1974, as amended (“ERISA”), with respect to the Sterling Savings Bank Employee Savings and Investment Plan (the “401(k) Plan”) and the FirstBank Northwest Employee Stock Ownership Plan (“ESOP”) (collectively, the “Plans”). Specifically, the Complaint alleges that the defendants breached their duties by investing assets of the Plans in Sterling’s securities when it was imprudent to do so, and by investing such assets in Sterling securities when defendants knew or should have known that the price of those securities was inflated due to misrepresentations and omissions about Sterling’s business practices. The business practices at issue include alleged over-reliance on risky construction loans; alleged inadequate loan reserves; alleged spiking increases in nonperforming assets, nonperforming loans, classified assets, and 90+-day delinquent loans; alleged inadequate accounting for rising loan payment shortfalls; alleged unsafe and unsound banking practices; and a capital base that was allegedly inadequate to withstand the significant deterioration in the real estate markets. The putative class periods are October 22, 2007 to the present for the 401(k) Plan class, and October 22, 2007 to November 14, 2008 for the ESOP class. The Complaint seeks damages of an unspecified amount and attorneys’ fees and costs. A hearing on the motion to dismiss is currently scheduled for March 22, 2011. Failure by Sterling to obtain a favorable resolution of the claims set forth in the Complaint could have a material adverse effect on Sterling’s business, results of operations, and financial condition. Currently, a loss resulting from these claims is not considered probable or estimable in amount.
Derivative Class Action Litigation
On February 10, 2010, a shareholder derivative action was filed in the Superior Court for Spokane County, Washington, allegedly on behalf of and for the benefit of Sterling, against certain of our current and former officers and directors. On August 2, 2010, an amended complaint was filed alleging, among other claims, breach of fiduciary duty, waste of corporate assets, and unjust enrichment. The amended complaint names Sterling as a nominal defendant. The complaint seeks unspecified damages, restitution, disgorgement of
| F-FIN38 |
Table of Contents
profits, equitable and injunctive relief, attorneys’ fees, costs, and expenses. The complaint alleges that the individual defendants failed to prevent Sterling from issuing improper financial statements, maintain a sufficient allowance for loan and lease losses, and establish effective credit risk management and oversight mechanisms regarding Sterling’s construction loans, losses and reserves recorded for impaired loans, and accounting for goodwill and deferred tax assets. On September 13, 2010, Sterling moved to dismiss the complaint. A hearing on the motion to dismiss occurred on January 14, 2011, with the court indicating that it would deny the motion. An order has not yet been issued. Because the complaint is derivative in nature, it does not seek monetary damages from Sterling. However, Sterling may be required throughout the pendency of the action to advance the legal fees and costs incurred by the individual defendants and to incur other financial obligations, which could have a material adverse effect on our business, results of operations and financial condition. Currently, a loss resulting from these claims is not considered probable or estimable in amount.
18. Benefit Plans:
Sterling maintains an employee savings plan under Section 401(k) of the Internal Revenue Code. Substantially all employees are eligible to participate in the plan subject to certain requirements. Under the plan, employees may elect to contribute up to 10% of their salary, and Sterling will make a matching contribution equal to 35% of the employee’s contribution. All matching contributions made during 2010 were exclusively in the form of Sterling common stock. Each employee may make a supplemental contribution of an additional 65% of their salary. All employee contributions vest immediately and, if applicable, employer contributions vest over the employee’s first three years of employment. Employees have the option of investing their contributions among selected mutual funds and Sterling common stock. During the years ended December 31, 2010, 2009 and 2008, Sterling contributed approximately $2.8 million, $2.7 million and $2.8 million, respectively, to the employee savings plan.
Since 1984, Sterling has maintained a nonqualified deferred compensation plan (the “1984 DCP”). The 1984 DCP component of the overall compensation plan is intended to link compensation to the long-term performance of Sterling and to provide a strong incentive for increasing shareholder value. As of December 31, 2010, there was one participant in the 1984 DCP. The 1984 DCP was replaced with a Supplemental Executive Retirement Plan (the “SERP”) in 2002. All amounts in a participant’s account become 100% vested upon death, disability, normal retirement age of 60, a change in control, or upon termination of the 1984 DCP. Prior to such an event, amounts in a participant’s account vest at the rate of 10% per year of service, provided that such vesting shall reach 100% when the participant reaches the age of 60. Payment may be in a lump sum or in installments as determined by the Board, and installments may be accelerated by the Board. Payment must be commenced within one year of the termination of the participant’s employment with Sterling. Sterling had $8,000, $11,000 and $15,000 in expense related to this plan for the years ending December 31, 2010, 2009 and 2008, respectively.
Since 2002, Sterling has maintained a SERP. The SERP is a nonqualified, unfunded plan that is designed to provide retirement benefits for certain key employees of Sterling. Depending on their classification under the SERP, for 10 to 15 years, beginning at normal retirement age, participants will receive from 40% to 60% of their base salary amount as of January 1, 2002. Retirement benefits vest at the rate of 10% per year of service. Except for participants who have completed 25 years of service, benefits are reduced for early retirement. The present value of the retirement benefits becomes 100% vested if, within three years of a change in control of Sterling, either the SERP or the participant’s employment are terminated. Sterling maintains and administers three additional SERPs from past acquisitions. These SERPs are all nonqualified, unfunded plans that were designed to provide retirement benefits for certain key employees and directors of the acquired companies. All amounts and benefits were established and accrued at acquisition either by previous service or change of control clauses. Sterling continues to administer these benefit plans, as necessary. Sterling had $505,000, $326,000, and $940,000 for
| F-FIN39 |
Table of Contents
the years ended December 31, 2010, 2009 and 2008 in expenses related to the SERPs. As of December 31, 2010 and 2009, Sterling had $8.5 million and $8.4 million, respectively, accrued as future obligations associated with these SERPs.
In 2006, Sterling adopted a new nonqualified deferred compensation plan (the “2006 DCP”) which is primarily funded through employee deferral contributions. The 2006 DCP is designed to retain and attract key employees while serving as a vehicle to assist participants in deferring current compensation to a time when taxes may be at a more personally beneficial rate and aid in saving for long-term financial needs. Plan participation is limited to Directors and a select group of management or highly compensated employees as determined by the plan Committee. As of December 31, 2010, there were 53 participants in the 2006 DCP. Under the plan, participants may contribute up to 75% of their base salary and up to 100% of commissions, bonus and director fees. The deferred amounts are credited to the participants’ accounts, which do not hold assets but are maintained for record-keeping-purposes. The amounts deferred under the Plan are credited based on the return of measurement funds selected by the participants. The measurement funds are designed to mirror the performance of mutual funds selected by the plan Committee. All participant contributions vest immediately. Each year, based on a written agreement or at its sole discretion, Sterling may contribute amounts to all, some or none of the participants. No employer contributions have been made to this plan. The vesting of the Sterling contributions is determined based on a written agreement between the participant and Sterling or based on a vesting schedule determined by the plan Committee. Within 60 days after the later of the first business day of the plan year following the plan year in which the participant retires, or the last day of the six month period immediately following the date on which the participant retires, the participant’s account will be distributed either in a lump sum or installments up to 15 years as elected by the participant. Within 60 days after the plan Committee is notified of the participant’s death or the participant becomes disabled, the participants account will be distributed in a lump sum. Within 60 days after the last day of the six month period immediately following the date on which employment terminates, the participant’s account will be distributed in a lump sum payment. Participants may elect to receive a scheduled distribution with certain exclusions. Sterling had $132,000, $33,000 and $184,000 of net expenses related to the 2006 DCP for the years ended December 31, 2010, 2009 and 2008, respectively. As of both December 31, 2010 and 2009, Sterling had $5.0 million accrued to reflect the anticipated liability.
| F-FIN40 |
Table of Contents
19. Noninterest Expense:
The components of total noninterest expenses are as follows:
| Years Ended December 31, | ||||||||||||
| 2010 | 2009 | 2008 | ||||||||||
| (Dollars in thousands) | ||||||||||||
| Employee compensation and benefits |
$ | 168,793 | $ | 164,198 | $ | 154,485 | ||||||
| OREO operations |
62,578 | 48,041 | 19,787 | |||||||||
| Occupancy and equipment |
39,643 | 42,668 | 41,876 | |||||||||
| Insurance |
34,704 | 30,585 | 7,372 | |||||||||
| Data processing |
23,116 | 20,779 | 21,118 | |||||||||
| Professional fees |
22,394 | 18,464 | 8,473 | |||||||||
| Depreciation |
13,391 | 14,041 | 14,023 | |||||||||
| Advertising |
11,536 | 12,576 | 12,223 | |||||||||
| Amortization of core deposit intangibles |
4,898 | 4,898 | 4,901 | |||||||||
| Travel and entertainment |
3,975 | 4,758 | 6,102 | |||||||||
| Other |
10,017 | 8,966 | 15,157 | |||||||||
| Noninterest expense before impairment charge |
395,045 | 369,974 | 305,517 | |||||||||
| Goodwill impairment |
0 | 227,558 | 223,765 | |||||||||
| Total noninterest expense |
$ | 395,045 | $ | 597,532 | $ | 529,282 | ||||||
20. Segment Information:
For purposes of measuring and reporting financial results during 2010, 2009 and 2008, Sterling was divided into five business segments:
| Ÿ | The Community Banking segment provides traditional banking and wealth management services through the retail, private and commercial banking groups of Sterling Savings Bank. |
| Ÿ | The Residential Construction Lending segment has historically originated and serviced loans through the real estate division of Sterling Savings Bank. Origination activity in this segment has been substantially curtailed, and realigned with an emphasis on credit resolution. |
| Ÿ | The Residential Mortgage Banking segment originates and sells residential loans on a servicing-retained and servicing-released basis through loan production offices of the Home Loan Division. The Home Loan Division’s operations were previously performed primarily by Sterling’s subsidiary Golf Savings Bank, which on August 2, 2010 was merged into Sterling Savings Bank. |
| Ÿ | The Commercial Mortgage Banking segment originates, sells and services commercial real estate loans and participation interests in commercial real estate loans through offices in the western region of the United States. |
| Ÿ | The Other and Eliminations segment represents the parent company expenses and intercompany eliminations of revenue and expenses. |
| F-FIN41 |
Table of Contents
The following table presents certain financial information regarding Sterling’s segments and provides a reconciliation to Sterling’s consolidated totals as of and for the years ended December 31, 2010, 2009 and 2008 (Dollars in thousands):
| As of and for the Year Ended December 31, 2010 | ||||||||||||||||||||||||
| Community Banking |
Residential Construction Lending |
Residential Mortgage Banking |
Commercial Mortgage Banking |
Other and Eliminations |
Total | |||||||||||||||||||
| Interest income |
$ | 393,754 | $ | 34,559 | $ | 13,243 | $ | 3,573 | $ | 4 | $ | 445,133 | ||||||||||||
| Interest expense |
128,294 | 18,967 | 7,742 | 0 | 6,103 | 161,106 | ||||||||||||||||||
| Net interest income (expense) |
265,460 | 15,592 | 5,501 | 3,573 | (6,099 | ) | 284,027 | |||||||||||||||||
| Provision for losses on loans |
177,232 | 64,767 | 8,230 | 0 | 0 | 250,229 | ||||||||||||||||||
| Noninterest income |
67,499 | 60 | 65,099 | 2,470 | 1,837 | 136,965 | ||||||||||||||||||
| Noninterest expense |
332,557 | 7,291 | 36,785 | 5,070 | 13,342 | 395,045 | ||||||||||||||||||
| (Loss) income before income taxes |
$ | (176,830 | ) | $ | (56,406 | ) | $ | 25,585 | $ | 973 | $ | (17,604 | ) | $ | (224,282 | ) | ||||||||
| Total assets |
$ | 7,643,294 | $ | 25,562 | $ | 1,811,601 | $ | 6,340 | $ | 6,372 | $ | 9,493,169 | ||||||||||||
| As of and for the Year Ended December 31, 2009 | ||||||||||||||||||||||||
| Community Banking |
Residential Construction Lending |
Residential Mortgage Banking |
Commercial Mortgage Banking |
Other and Eliminations |
Total | |||||||||||||||||||
| Interest income |
$ | 538,503 | $ | 7,951 | $ | 29,058 | $ | 22,912 | $ | 923 | $ | 599,347 | ||||||||||||
| Interest expense |
194,836 | 39,633 | 13,587 | 0 | 7,314 | 255,370 | ||||||||||||||||||
| Net interest income (expense) |
343,667 | (31,682 | ) | 15,471 | 22,912 | (6,391 | ) | 343,977 | ||||||||||||||||
| Provision for losses on loans |
389,293 | 267,835 | 24,243 | 0 | 0 | 681,371 | ||||||||||||||||||
| Noninterest income |
77,465 | 304 | 54,771 | 2,891 | (11,617 | ) | 123,814 | |||||||||||||||||
| Noninterest expense |
309,280 | 7,273 | 39,565 | 8,299 | 5,557 | 369,974 | ||||||||||||||||||
| Goodwill impairment |
227,558 | 0 | 0 | 0 | 0 | 227,558 | ||||||||||||||||||
| (Loss) income before income taxes |
$ | (504,999 | ) | $ | (306,486 | ) | $ | 6,434 | $ | 17,504 | $ | (23,565 | ) | $ | (811,112 | ) | ||||||||
| Total assets |
$ | 9,302,660 | $ | 969,935 | $ | 586,765 | $ | 18,074 | $ | (11 | ) | $ | 10,877,423 | |||||||||||
| F-FIN42 |
Table of Contents
| As of and for the Year Ended December 31, 2008 | ||||||||||||||||||||||||
| Community Banking |
Residential Construction Lending |
Residential Mortgage Banking |
Commercial Mortgage Banking |
Other and Eliminations |
Total | |||||||||||||||||||
| Interest income |
$ | 565,767 | $ | 99,027 | $ | 30,559 | $ | 18,962 | $ | 747 | $ | 715,062 | ||||||||||||
| Interest expense |
262,637 | 62,492 | 17,570 | 0 | 12,811 | 355,510 | ||||||||||||||||||
| Net interest income (expense) |
303,130 | 36,535 | 12,989 | 18,962 | (12,064 | ) | 359,552 | |||||||||||||||||
| Provision for losses on loans |
105,915 | 221,135 | 6,547 | 0 | 0 | 333,597 | ||||||||||||||||||
| Noninterest income |
70,444 | 3,234 | 23,672 | 3,803 | (9,258 | ) | 91,895 | |||||||||||||||||
| Noninterest expense |
253,189 | 9,766 | 29,005 | 9,463 | 4,094 | 305,517 | ||||||||||||||||||
| Goodwill impairment |
192,695 | 0 | 31,070 | 0 | 0 | 223,765 | ||||||||||||||||||
| (Loss) income before income taxes |
$ | (178,225 | ) | $ | (191,132 | ) | $ | (29,961 | ) | $ | 13,302 | $ | (25,416 | ) | $ | (411,432 | ) | |||||||
| Total assets |
$ | 10,721,836 | $ | 1,526,416 | $ | 517,728 | $ | 14,958 | $ | 9,778 | $ | 12,790,716 | ||||||||||||
21. Quarterly Financial Data (Unaudited):
The following tables present Sterling’s condensed operations on a quarterly basis for the years ended December 31, 2010 and 2009:
| 2010 Quarters Ended | ||||||||||||||||
| March 31 | June 30 | September 30 | December 31 | |||||||||||||
| (Dollars in thousands, except per share amounts) | ||||||||||||||||
| Interest income |
$ | 119,492 | $ | 115,209 | $ | 106,654 | $ | 103,778 | ||||||||
| Interest expense |
44,602 | 42,114 | 39,219 | 35,171 | ||||||||||||
| Net interest income |
74,890 | 73,095 | 67,435 | 68,607 | ||||||||||||
| Provision for credit losses |
88,556 | 70,781 | 60,892 | 30,000 | ||||||||||||
| Net interest income after provision |
(13,666 | ) | 2,314 | 6,543 | 38,607 | |||||||||||
| Non interest income |
25,297 | 41,228 | 39,658 | 30,782 | ||||||||||||
| Non interest expenses |
95,977 | 97,315 | 94,223 | 107,530 | ||||||||||||
| Income before income taxes |
(84,346 | ) | (53,773 | ) | (48,022 | ) | (38,141 | ) | ||||||||
| Income tax benefit |
0 | 0 | 0 | 0 | ||||||||||||
| Net loss |
(84,346 | ) | (53,773 | ) | (48,022 | ) | (38,141 | ) | ||||||||
| Preferred stock dividend |
(4,412 | ) | (4,469 | ) | (2,717 | ) | – | |||||||||
| Other shareholder allocations |
0 | 0 | 84,329 | (604,592 | ) | |||||||||||
| Net (loss) income applicable to common shareholders |
$ | (88,758 | ) | $ | (58,242 | ) | $ | 33,590 | $ | (642,733 | ) | |||||
| (Loss) earnings per share—basic |
$ | (112.70 | ) | $ | (73.91 | ) | $ | 7.05 | $ | (12.79 | ) | |||||
| (Loss) earnings per share—diluted |
$ | (112.70 | ) | $ | (73.91 | ) | $ | 1.31 | $ | (12.79 | ) | |||||
| Weighted average shares outstanding—basic |
787,576 | 788,020 | 4,764,875 | 50,235,894 | ||||||||||||
| Weighted average shares outstanding—diluted |
787,576 | 788,020 | 25,739,308 | 50,235,894 | ||||||||||||
| F-FIN43 |
Table of Contents
| 2009 Quarters Ended | ||||||||||||||||
| March 31 | June 30 | September 30 | December 31 | |||||||||||||
| (Dollars in thousands, except per share amounts) | ||||||||||||||||
| Interest income |
$ | 160,131 | $ | 154,519 | $ | 148,768 | $ | 135,929 | ||||||||
| Interest expense |
71,783 | 66,900 | 61,709 | 54,978 | ||||||||||||
| Net interest income |
88,348 | 87,619 | 87,059 | 80,951 | ||||||||||||
| Provision for credit losses |
65,865 | 79,744 | 195,505 | 340,257 | ||||||||||||
| Net interest income after provision |
22,483 | 7,875 | (108,446 | ) | (259,306 | ) | ||||||||||
| Non interest income |
36,626 | 31,692 | 27,431 | 28,065 | ||||||||||||
| Non interest expenses before impairment charge |
79,988 | 105,149 | 90,367 | 94,470 | ||||||||||||
| Goodwill impairment |
0 | 0 | 227,558 | 0 | ||||||||||||
| Non interest expenses |
79,988 | 105,149 | 317,925 | 94,470 | ||||||||||||
| Income before income taxes |
(20,879 | ) | (65,582 | ) | (398,940 | ) | (325,711 | ) | ||||||||
| Income tax benefit (provision) |
436 | 36,049 | (60,467 | ) | (3,000 | ) | ||||||||||
| Net loss |
(20,443 | ) | (29,533 | ) | (459,407 | ) | (328,711 | ) | ||||||||
| Preferred stock dividend |
(4,347 | ) | (4,347 | ) | (4,318 | ) | (4,357 | ) | ||||||||
| Net (loss) applicable to common shareholders |
$ | (24,790 | ) | $ | (33,880 | ) | $ | (463,725 | ) | $ | (333,068 | ) | ||||
| Earnings per share—basic |
$ | (31.53 | ) | $ | (43.07 | ) | $ | (589.45 | ) | $ | (423.17 | ) | ||||
| Earnings per share—diluted |
$ | (31.53 | ) | $ | (43.07 | ) | $ | (589.45 | ) | $ | (423.17 | ) | ||||
| Weighted average shares outstanding—basic |
786,305 | 786,703 | 786,710 | 787,077 | ||||||||||||
| Weighted average shares outstanding—diluted |
786,305 | 786,703 | 786,710 | 787,077 | ||||||||||||
22. Fair Values of Financial Instruments:
Fair value estimates are determined as of a specific date using quoted market prices, where available, or various assumptions and estimates. As the assumptions underlying these estimates change, the fair value of the financial instruments will change. The use of assumptions and various valuation techniques, as well as the absence of secondary markets for certain financial instruments, will likely reduce the comparability of fair value disclosures between financial institutions. Accordingly, the aggregate fair value amounts presented do not represent and should not be construed to represent the full underlying value of Sterling.
| F-FIN44 |
Table of Contents
The carrying and fair values of financial instruments as of the periods indicated, were as follows. Other assets are comprised of FHLB stock and derivatives, while other liabilities are comprised of derivatives.
| December 31, | ||||||||||||||||
| 2010 | 2009 | |||||||||||||||
| Carrying Amount |
Fair Value | Carrying Amount |
Fair Value | |||||||||||||
| (Dollars in thousands) | ||||||||||||||||
| Financial assets: |
||||||||||||||||
| Cash and cash equivalents |
$ | 427,264 | $ | 427,264 | $ | 573,006 | $ | 573,006 | ||||||||
| Investments and MBS: |
||||||||||||||||
| Available for sale |
2,825,010 | 2,825,010 | 2,160,325 | 2,160,325 | ||||||||||||
| Held to maturity |
13,464 | 13,464 | 17,646 | 17,646 | ||||||||||||
| Loans held for sale |
222,216 | 222,216 | 190,412 | 190,412 | ||||||||||||
| Loans receivable, net |
5,379,081 | 5,078,157 | 7,344,199 | 7,309,894 | ||||||||||||
| Accrued interest receivable |
34,087 | 34,087 | 43,869 | 43,869 | ||||||||||||
| Other assets |
106,717 | 106,717 | 108,502 | 108,502 | ||||||||||||
| Financial liabilities: |
||||||||||||||||
| Non-maturity deposits |
3,376,188 | 3,123,840 | 3,593,703 | 3,331,416 | ||||||||||||
| Deposits with stated maturities |
3,534,819 | 3,588,051 | 4,181,487 | 4,241,141 | ||||||||||||
| Borrowings |
1,685,008 | 1,660,387 | 2,634,594 | 2,581,832 | ||||||||||||
| Accrued interest payable |
17,259 | 17,259 | 22,245 | 22,245 | ||||||||||||
| Other liabilities |
6,176 | 6,176 | 4,319 | 4,319 | ||||||||||||
Companies have the option of carrying financial assets and liabilities at fair value, which can be implemented on all or individually selected financial instruments. The framework for defining and measuring fair value requires that one of three valuation methods be used to determine fair market value: the market approach, the income approach or the cost approach. To increase consistency and comparability in fair value measurements and related disclosures, the standard also creates a fair value hierarchy to prioritize the inputs to these valuation methods into the following three levels:
| Ÿ | Level 1 inputs are a select class of observable inputs, based upon the quoted prices for identical instruments in active markets that are accessible as of the measurement date, and are to be used whenever available. |
| Ÿ | Level 2 inputs are other types of observable inputs, such as quoted prices for similar instruments in active markets; quoted prices for identical or similar instruments in markets that are inactive; or other inputs that are observable or can be derived from or supported by observable market data. Level 2 inputs are to be used whenever Level 1 inputs are not available. |
| Ÿ | Level 3 inputs are significantly unobservable, reflecting the reporting entity’s own assumptions regarding what market participants would assume when pricing a financial instrument. Level 3 inputs are to be used only when Level 1 and Level 2 inputs are unavailable. |
| F-FIN45 |
Table of Contents
Assets and Liabilities Measured at Fair Value on a Recurring Basis. The following presents Sterling’s financial instruments that are measured at fair value on a recurring basis:
| Total | Level 1 | Level 2 | Level 3 | |||||||||||||
| (Dollars in thousands) | ||||||||||||||||
| Balance, December 31, 2010: |
||||||||||||||||
| Investment securities available-for-sale: |
||||||||||||||||
| MBS |
$ | 2,602,610 | $ | 0 | $ | 2,602,610 | $ | 0 | ||||||||
| Municipal bonds |
201,143 | 0 | 201,143 | 0 | ||||||||||||
| Other |
21,257 | 0 | 21,257 | 0 | ||||||||||||
| Total investment securities available-for-sale |
2,825,010 | 0 | 2,825,010 | 0 | ||||||||||||
| Loans held for sale |
222,216 | 0 | 222,216 | 0 | ||||||||||||
| Other assets—derivatives |
6,746 | 0 | 1,869 | 4,877 | ||||||||||||
| Total assets |
$ | 3,053,972 | $ | 0 | $ | 3,049,095 | $ | 4,877 | ||||||||
| Other liabilities—derivatives |
$ | 6,176 | $ | 0 | $ | 1,750 | $ | 4,426 | ||||||||
| Balance, December 31, 2009: |
||||||||||||||||
| Investment securities available-for-sale: |
||||||||||||||||
| MBS |
$ | 1,944,989 | $ | 0 | $ | 1,944,989 | $ | 0 | ||||||||
| Municipal bonds |
195,282 | 0 | 195,282 | 0 | ||||||||||||
| Other |
20,054 | 0 | 20,054 | 0 | ||||||||||||
| Total investment securities available-for-sale |
2,160,325 | 0 | 2,160,325 | 0 | ||||||||||||
| Loans held for sale |
190,412 | 0 | 190,412 | 0 | ||||||||||||
| Other assets—derivatives |
7,820 | 0 | 3,273 | 4,547 | ||||||||||||
| Total assets |
$ | 2,358,557 | $ | 0 | $ | 2,354,010 | $ | 4,547 | ||||||||
| Other liabilities—derivatives |
$ | 4,319 | $ | 0 | $ | 0 | $ | 4,319 | ||||||||
The following table provides a reconciliation of interest rate swaps measured at fair value using significant unobservable or Level 3 inputs on a recurring basis during the year ended December 31, 2010 and 2009. Gains and losses on these interest rate swaps are included in earnings as interest income or expense.
| Beginning Balance |
Change included in earnings |
Ending Balance |
||||||||||
| (Dollars in thousands) | ||||||||||||
| Year Ended December 31, 2010: |
||||||||||||
| Other assets—derivatives |
$ | 4,547 | $ | 330 | $ | 4,877 | ||||||
| Other liabilities—derivatives |
4,319 | 107 | 4,426 | |||||||||
| Year Ended December 31, 2009: |
||||||||||||
| Other assets—derivatives |
7,460 | (2,913 | ) | 4,547 | ||||||||
| Other liabilities—derivatives |
7,460 | (3,141 | ) | 4,319 | ||||||||
| F-FIN46 |
Table of Contents
Level 2 derivatives represent mortgage banking interest rate lock and loan delivery commitments, as well as a common stock warrant carried as a derivative liability. Level 3 derivatives represent interest rate swaps, with market values for these instruments being a function of the interest rate and term of the underlying loan. See Note 11 for a further discussion of these derivatives. Changes in the fair value of available-for-sale securities are recorded on the balance sheet under accumulated-other-comprehensive income, while gains and losses from sales are recognized as income. The difference between the aggregate fair value and the aggregate unpaid principal balance of loans held for sale that are carried at fair value were included in earnings as follows:
| Year Ended December 31, | ||||||||
| 2010 | 2009 | |||||||
| (Dollars in thousands) | ||||||||
| Mortgage banking operations |
$ | (23 | ) | $ | 2,040 | |||
Assets and Liabilities Measured at Fair Value on a Non-recurring Basis. Sterling may be required, from time to time, to measure certain other financial assets at fair value on a non-recurring basis from application of lower of cost or market (“LOCOM”) accounting or write-downs of individual assets. The following table presents the carrying value for these financial assets as of the dates indicated:
| December 31, 2010 | Gains (losses) during year ended December 31, 2010 |
|||||||||||||||||||
| Total Carrying Value |
Level 1 | Level 2 | Level 3 | |||||||||||||||||
| (Dollars in thousands) | ||||||||||||||||||||
| Loans |
$ | 539,032 | $ | 0 | $ | 0 | $ | 539,032 | $ | (165,677 | ) | |||||||||
| OREO |
145,155 | 0 | 0 | 145,155 | (36,759 | ) | ||||||||||||||
| Mortgage servicing rights |
20,604 | 0 | 0 | 20,604 | 1,115 | |||||||||||||||
| December 31, 2009 | Gains (losses) during year ended December 31, 2009 |
|||||||||||||||||||
| Total Carrying Value |
Level 1 | Level 2 | Level 3 | |||||||||||||||||
| Loans |
$ | 702,477 | $ | 0 | $ | 0 | $ | 702,477 | $ | (434,499 | ) | |||||||||
| OREO |
78,302 | 0 | 0 | 78,302 | (31,909 | ) | ||||||||||||||
| Mortgage servicing rights |
12,062 | 0 | 0 | 12,062 | (134 | ) | ||||||||||||||
The loans disclosed above represent the carrying value of impaired loans at period end. Mortgage servicing rights fair value adjustments were mainly due to market derived assumptions associated with mortgage prepayment speeds. Sterling carries its mortgage servicing rights at LOCOM, and as such, they are measured at fair value on a non-recurring basis. OREO represents the carrying value after write-downs taken at foreclosure that were charged to the loan loss allowance, as well as specific reserves established subsequent to foreclosure due to updated appraisals. During 2009, goodwill was tested for impairment and determined to be fully impaired.
The methods and assumptions used to estimate the fair value of each class of financial instruments are as follows:
Cash and Cash Equivalents
The carrying value of cash and cash equivalents approximates fair value due to the relatively short-term nature of these instruments.
Investments and MBS
The fair value of investments and MBS has been valued using a matrix pricing technique based on quoted prices for similar instruments, which Sterling validates with non-binding broker quotes, in depth collateral analysis and cash flow stress testing.
| F-FIN47 |
Table of Contents
Loans Held for Sale
Sterling has elected to carry loans held for sale at fair value. The fair values are based on investor quotes in the secondary market based upon the fair value of options and commitments to sell or issue mortgage loans. The fair value election was made to match changes in the value of these loans with the value of their economic hedges. Loan origination fees, costs and servicing rights, which were previously deferred on these loans, are now recognized as part of the loan value at origination.
Loans Receivable
The fair value of performing loans is estimated by discounting the cash flows using interest rates that consider the current credit and interest rate risk inherent in the loans and current economic and lending conditions. The fair value of nonperforming loans is estimated by discounting management’s current estimate of future cash flows using a rate estimated to be commensurate with the risks involved. The fair value of nonperforming collateral dependent loans is estimated based upon the value of the underlying collateral. In addition, a liquidity discount has been applied against the portfolio to reflect the timing uncertainty surrounding a sale.
Mortgage Servicing Rights
The fair value of mortgage servicing rights is estimated using a discounted cash flow methodology to arrive at the present value of future expected earnings from the servicing of the loans. Model inputs include prepayment speeds, market interest rates, contractual interest rates on the loans being serviced, and the amount of other fee income generated over the servicing contract.
OREO
The fair value of OREO is estimated using third party appraisals, subject to updates to reflect comparable market transactions, with appraisals ordered for “as is” or “disposal value.”
Deposits
The fair values of deposits subject to immediate withdrawal such as interest and noninterest bearing checking, regular savings, and money market deposit accounts, are equal to the amounts payable on demand at the reporting date, net of a core deposit intangible. Fair values for time deposits are estimated by discounting future cash flows using interest rates currently offered on time deposits with similar remaining maturities.
Borrowings
The carrying amounts of short-term borrowings under repurchase agreements, federal funds purchased, short-term FHLB advances and other short-term borrowings approximate their fair values due to the relatively short period of time between the origination of the instruments and the expected payment dates on the instruments. The fair value of advances under lines of credit approximates their carrying value because such advances bear variable rates of interest. The fair value of long-term FHLB advances and other long-term borrowings is estimated using discounted cash flow analyses based on Sterling’s current incremental borrowing rates for similar types of borrowing arrangements with similar remaining terms.
| F-FIN48 |
Table of Contents
23. Related-Party Transactions:
At December 31, 2010 and 2009, loans outstanding to directors and executive officers were $1.1 million and $45.2 million, respectively. Related party loans and deposits are transacted as part of Sterling’s normal course of business, and are not subject to preferential terms or conditions.
During the year, the balance of loans outstanding to directors and executive officers changed as described in the following table. Reclassifications are due to changes in directors and executive officers.
| 2010 | 2009 | |||||||
| (Dollars in thousands) | ||||||||
| Balance, January 1 |
$ | 45,248 | $ | 78,850 | ||||
| New |
191 | 381 | ||||||
| Repayments |
(13 | ) | (8,275 | ) | ||||
| Reclassifications |
(44,374 | ) | (25,708 | ) | ||||
| Balance, December 31 |
$ | 1,052 | $ | 45,248 | ||||
24. Parent Company-Only Financial Information:
The following parent company-only financial information should be read in conjunction with the other notes to consolidated financial statements. The accounting policies for the parent company-only financial statements are the same as those used in the presentation of the consolidated financial statements other than the parent company-only financial statements account for the parent company’s investments in its subsidiaries under the equity method.
| Condensed Balance Sheets |
December 31, | |||||||
| 2010 | 2009 | |||||||
| (Dollars in thousands) | ||||||||
| Assets: |
||||||||
| Cash and cash equivalents |
$ | 47,520 | $ | 24,340 | ||||
| Investments in subsidiaries: |
||||||||
| Sterling Savings Bank |
973,564 | 488,720 | ||||||
| Golf Savings Bank |
0 | 62,574 | ||||||
| Golf Escrow Company |
789 | 200 | ||||||
| Tri-Cities Mortgage Company |
30 | 32 | ||||||
| Capital Trust Subsidiaries |
7,366 | 7,366 | ||||||
| Receivable from subsidiaries |
654 | 101 | ||||||
| Available for sale investments |
0 | 19 | ||||||
| Other assets |
2,173 | 60,235 | ||||||
| Total assets |
$ | 1,032,096 | $ | 643,587 | ||||
| Liabilities and Shareholders’ Equity: |
||||||||
| Accrued expenses payable |
$ | 5,157 | $ | 19,181 | ||||
| Junior Subordinated Debentures |
245,285 | 245,281 | ||||||
| Due to affiliates |
10,887 | 55,876 | ||||||
| Shareholders’ equity |
770,767 | 323,249 | ||||||
| Total liabilities and shareholders’ equity |
$ | 1,032,096 | $ | 643,587 | ||||
| F-FIN49 |
Table of Contents
| Years Ended December 31, | ||||||||||||
| 2010 | 2009 | 2008 | ||||||||||
| (Dollars in thousands) | ||||||||||||
| Condensed Statements of Income |
||||||||||||
| Interest income |
$ | 253 | $ | 439 | $ | 782 | ||||||
| Interest expense |
(6,349 | ) | (7,754 | ) | (13,729 | ) | ||||||
| Net interest expense |
(6,096 | ) | (7,315 | ) | (12,947 | ) | ||||||
| Equity in net earnings of subsidiary |
(206,677 | ) | (826,048 | ) | (324,807 | ) | ||||||
| Noninterest expenses |
(11,568 | ) | (5,223 | ) | (4,081 | ) | ||||||
| Income before income taxes |
(224,341 | ) | (838,586 | ) | (341,835 | ) | ||||||
| Income tax benefit |
59 | 492 | 6,301 | |||||||||
| Net (loss) |
$ | (224,282 | ) | $ | (838,094 | ) | $ | (335,534 | ) | |||
| Condensed Statements of Cash Flows |
||||||||||||
| Cash flows from operating activities: |
||||||||||||
| Net income |
$ | (224,282 | ) | $ | (838,094 | ) | $ | (335,534 | ) | |||
| Adjustments to reconcile net income to net cash used in operating activities |
214,128 | 830,146 | 317,138 | |||||||||
| Net cash used in operating activities |
(10,154 | ) | (7,948 | ) | (18,396 | ) | ||||||
| Cash flows from investing activities: |
||||||||||||
| Investments in subsidiaries, net |
(650,000 | ) | (60,000 | ) | (237,000 | ) | ||||||
| Repayment of advances to subsidiaries |
0 | 3,376 | 8,862 | |||||||||
| Dividends from subsidiary |
0 | 10,273 | 38,294 | |||||||||
| Cash flows from acquisitions |
0 | 0 | 0 | |||||||||
| Net cash used in investing activities |
(650,000 | ) | (46,351 | ) | (189,844 | ) | ||||||
| Cash flows from financing activities: |
||||||||||||
| Proceeds from other borrowings |
0 | 0 | 0 | |||||||||
| Repayment of other borrowings |
0 | 0 | (24,000 | ) | ||||||||
| Proceeds from stock issuance, net |
683,334 | 0 | 303,000 | |||||||||
| Proceeds from stock sales |
0 | 0 | 1,390 | |||||||||
| Excess tax benefit from stock based compensation |
0 | (804 | ) | 853 | ||||||||
| Dividends paid |
0 | (6,733 | ) | (20,487 | ) | |||||||
| Other |
0 | 0 | 0 | |||||||||
| Net cash provided by (used in) financing activities |
683,334 | (7,537 | ) | 260,756 | ||||||||
| Net change in cash and cash equivalents |
23,180 | (61,836 | ) | 52,516 | ||||||||
| Cash and cash equivalents, beginning of year |
24,340 | 86,176 | 33,660 | |||||||||
| Cash and cash equivalents, end of year |
$ | 47,520 | $ | 24,340 | $ | 86,176 | ||||||
25. Subsidiary Merger:
On August 2, 2010, Golf Savings Bank was merged into Sterling Savings Bank. The mortgage banking operations of Golf Savings Bank are continuing to operate as a division within Sterling Savings Bank. Both Golf Savings Bank and Sterling Savings Bank were wholly owned subsidiaries of Sterling and the transaction therefore did not impact the consolidated financial statements of Sterling.
| F-FIN50 |