Attached files
Table of Contents
UNITED STATES SECURITIES AND EXCHANGE COMMISSION
Washington, D.C. 20549
FORM 10-K
(Mark One)
| x | ANNUAL REPORT PURSUANT TO SECTION 13 OR 15(d) OF THE SECURITIES EXCHANGE ACT OF 1934 |
| For the year ended DECEMBER 31, 2009 |
| OR |
| ¨ | TRANSITION REPORT PURSUANT TO SECTION 13 OR 15(d) OF THE SECURITIES EXCHANGE ACT OF 1934 |
| For the transition period from to |
COMMISSION FILE NUMBER 0-20800
STERLING FINANCIAL CORPORATION
(Exact name of registrant as specified in its charter)
| Washington | 91-1572822 | |
| (State or other jurisdiction of incorporation or organization) |
(IRS Employer Identification No.) |
111 North Wall Street, Spokane, Washington 99201
(Address of principal executive offices) (Zip code)
Registrant’s telephone number, including area code: (509) 458-3711
Securities registered pursuant to Section 12(b) of the Act:
| None | None | |
| (Title of each class) | (Name of each exchange on which registered) |
Securities registered pursuant to Section 12(g) of the Act:
Common Stock ($1.00 par value)
(Title of class)
Indicate by check mark if the registrant is a well-known seasoned issuer, as defined in Rule 405 of the Securities Act. Yes ¨ No x
Indicate by check mark if the registrant is not required to file reports pursuant to Section 13 or Section 15(d) of the Act. Yes ¨ No x
Indicate by check mark whether the registrant (1) has filed all reports required to be filed by Section 13 or 15(d) of the Securities Exchange Act of 1934 during the preceding 12 months (or for such shorter period that the registrant was required to file such reports), and (2) has been subject to such filing requirements for the past 90 days. Yes x No ¨
Indicate by check mark whether the registrant has submitted electronically and posted on its corporate Web site, if any, every Interactive Data File required to be submitted and posted pursuant to Rule 405 of Regulation S-T (§232.405 of this chapter) during the preceding 12 months (or for such shorter period that the registrant was required to submit and post such files). Yes ¨ No ¨
Indicate by check mark if disclosure of delinquent filers pursuant to Item 405 of Regulation S-K is not contained herein, and will not be contained, to the best of registrant’s knowledge, in definitive proxy or information statements incorporated by reference in Part III of this Form 10-K or any amendment to this Form 10-K. ¨
Indicate by check mark whether the registrant is a large accelerated filer, an accelerated filer, a non-accelerated filer, or a smaller reporting company. See definitions of “large accelerated filer,” “accelerated filer” and “smaller reporting company” in Rule 12b-2 of the Exchange Act. (Check one):
Large accelerated filer ¨ Accelerated filer x Non-accelerated filer ¨ Smaller Reporting Company ¨
Indicate by check mark whether the registrant is a shell company (as defined in Rule 12b-2 of the Exchange Act). Yes ¨ No x
As of June 30, 2009, the aggregate market value of the common equity held by non-affiliates of the registrant, computed by reference to the average of the bid and asked prices on such date as reported by the NASDAQ Global Select Market, was $147 million.
The number of shares outstanding of the registrant’s common stock, par value $1.00 per share, as of January 31, 2010 was 52,167,895.
DOCUMENTS INCORPORATED BY REFERENCE
Specific portions of the registrant’s Proxy Statement for its 2010 annual meeting of shareholders are incorporated by reference into Part III hereof.
Table of Contents
STERLING FINANCIAL CORPORATION
DECEMBER 31, 2009 ANNUAL REPORT ON FORM 10-K
| Page | ||||
| 1 | ||||
| Item 1. |
1 | |||
| 1 | ||||
| 1 | ||||
| 3 | ||||
| 5 | ||||
| 5 | ||||
| 7 | ||||
| 21 | ||||
| 22 | ||||
| 26 | ||||
| 27 | ||||
| 27 | ||||
| 27 | ||||
| 28 | ||||
| 35 | ||||
| 37 | ||||
| Item 1A. |
38 | |||
| Item 1B. |
51 | |||
| Item 2. |
51 | |||
| Item 3. |
52 | |||
| Item 4. |
52 | |||
| 53 | ||||
| Item 5. |
53 | |||
| 53 | ||||
| Item 6. |
55 | |||
Table of Contents
| Page | ||||
| Item 7. |
Management’s Discussion and Analysis of Financial Condition and Results of Operations |
57 | ||
| 57 | ||||
| 57 | ||||
| 57 | ||||
| 62 | ||||
| 74 | ||||
| 77 | ||||
| 79 | ||||
| Off-Balance Sheet Arrangements and Aggregate Contractual Obligations |
82 | |||
| 83 | ||||
| 84 | ||||
| 85 | ||||
| 85 | ||||
| 86 | ||||
| Item 7A. |
86 | |||
| Item 8. |
86 | |||
| Item 9. |
Changes in and Disagreements with Accountants on Accounting and Financial Disclosure |
86 | ||
| Item 9A. |
87 | |||
| Management’s Report on Internal Control Over Financial Reporting |
87 | |||
| 88 | ||||
| Item 9B. |
89 | |||
| 89 | ||||
| Item 10. |
89 | |||
| Item 11. |
89 | |||
| Item 12. |
Security Ownership of Certain Beneficial Owners and Management and Related Stockholder Matters |
89 | ||
| Item 13. |
Certain Relationships and Related Transactions, and Director Independence |
89 | ||
| Item 14. |
89 | |||
| 90 | ||||
| Item 15. |
90 | |||
| 91 | ||||
Table of Contents
| PART I |
This report contains forward-looking statements within the meaning of the Private Securities Litigation Reform Act of 1995. For a discussion of the risks and uncertainties inherent in such statements, see “Business—Forward-Looking Statements” and “Risk Factors.”
Sterling Financial Corporation (“Sterling”) is a bank holding company, organized under the laws of Washington State in 1992. The principal operating subsidiaries of Sterling are Sterling Savings Bank and Golf Savings Bank. Sterling Savings Bank, headquartered in Spokane, Washington, commenced operations in 1983 as a Washington State-chartered federally insured stock savings and loan association, and in 2005 converted to a commercial bank. Sterling Savings Bank offers commercial banking products and services, mortgage lending, construction financing and investment products to individuals, small business, commercial organization and corporations. The main focus of Golf Savings Bank, a Washington State-chartered savings bank acquired by Sterling in July 2006, is the origination and sale of residential mortgage loans.
At December 31, 2009, Sterling had total assets of $10.9 billion, total liabilities, including deposits, of $10.6 billion and total shareholders’ equity of $323.2 million and operated 178 deposit-taking branches throughout the Western region of the United States, including the states of Washington, Oregon, Idaho, Montana and California. Our common stock is listed on the Nasdaq Global Select Market under the symbol “STSA.” Our principal offices are located at 111 North Wall Street, Spokane, Washington 99201 and our telephone number at that address is (509) 227-5389. We maintain an Internet website at www.sterlingfinancialcorporation-
spokane.com. Neither this website nor the information on this website is included or incorporated in, or is a part of, this Annual Report on Form 10-K.
Sterling faces a number of challenges resulting from current and prior year losses, driven by credit quality issues, and is categorized as being undercapitalized by regulatory guidelines. In the fourth quarter of 2009, Sterling Savings Bank entered into a Stipulation and Consent to the Issuance of an Order to Cease and Desist (the “SSB Consent Agreement”) with the Federal Deposit Insurance Corporation (“FDIC”) and the Washington State Department of Financial Institutions (“WDFI”). Under the terms of the agreement, Sterling Savings Bank has agreed to, among other things, raise capital of at least $300 million, and maintain a Tier 1 leverage ratio of not less than 10%. The agreement set a deadline of December 15, 2009 for meeting these capital requirements, which Sterling was not able to meet. During the fourth quarter, Sterling and the Federal Reserve Bank of San Francisco (the “Reserve Bank”) entered into a written agreement (the “Reserve Bank Agreement”) to enhance Sterling’s ability to act as a source of strength to Sterling Savings Bank and Golf Savings Bank. Substantially all of the requirements of the Reserve Bank Agreement are similar to those imposed on Sterling Savings Bank by the FDIC. Sterling Savings Bank has failed to increase its Tier 1 capital to the levels required by the SSB Consent Agreement and does not comply with certain of the
| TX1 |
Table of Contents
requirements of the Reserve Bank Agreement and the SSB Consent Agreement. The uncertainty around Sterling’s ability to comply with these agreements has raised substantial doubts about Sterling’s ability to continue as a going concern. See “—Risk Factors,” “—Forward-Looking Statements,” “Regulation—Federal and State Regulation of Banking Activities” and Note 25 of “Notes to Consolidated Financial Statements.”
During the fourth quarter, Sterling announced a management change that resulted in the appointment of a new President and Chief Executive Officer, a new Chief Operating Officer, as well as a new Chairman of the Board. This new Executive management team developed several strategies to address the capital and liquidity needs of the organization. In March 2010, the following Directors of Sterling Savings Bank were appointed to serve as Directors of Sterling: Ned M. Barnes, Rodney W. Barnett, Thomas H. Boone, Kermit K. Houser and Dianne E. Spires.
Sterling is in active negotiations with several private equity investors, two of its major stakeholders and its regulators about various strategic alternatives designed to put Sterling on a sound financial footing and allow it to recapitalize and grow its business.
Sterling’s recovery plan is expected to include a restructuring of its capital and liabilities. As such, Sterling has been actively engaged with two of its major stakeholders, the owners of its outstanding trust preferred securities (“TruPS”) and U.S. Department of the Treasury (“Treasury”), which holds preferred stock that Sterling issued as part of Treasury’s Capital Purchase Program, which was designed to support the health of the nation’s banking sector.
As part of that plan, Sterling requested and received a letter from the Treasury expressing conditional support for a plan to convert the Sterling preferred stock that Treasury holds into Sterling common stock. In addition, Sterling has received several non-binding proposals from private equity firms, and has entered into a non-binding letter of intent with one of these firms to provide additional capital to recapitalize Sterling.
In its letter, Treasury set forth several conditions for its approval of the conversion of Treasury-owned securities to common equity. Among other things, Sterling must obtain the consent for the redemption of Sterling’s TruPS by a substantial portion of the holders of those securities; must raise at least $650 million of additional capital through the issuance of new common equity at not greater than 20 cents per share; and must execute a definitive agreement for that conversion with Treasury. As a result of these alternatives, current shareholders are expected to have no more than a minimal stake in Sterling in the future.
Sterling also continues to consider and explore these and other alternatives, including the raising of capital through public or private equity offerings; the potential sale of Sterling or some or all of its assets; or other substantial adjustments to Sterling’s balance sheet. All proposals received by Sterling to date, contemplate a conversion of the Treasury’s preferred stock at a discount to the face value, and the exchange of a substantial portion of the TruPS into cash at a significantly reduced price.
In February 2010, Sterling began making cash offers to repurchase its outstanding series of TruPS at an 80% discount from the stated value. Formal offers have been extended to registered owners of Sterling’s managed TruPS series, who have until March 23, 2010 to consent to the terms of Sterling’s cash tender offer. Owners of Sterling’s unmanaged TruPS series have until March 31, 2010 to consent to the terms of Sterling’s cash offer. Sterling’s cash tender offer is conditioned upon a successful capital raise, as well as the receipt of all applicable approvals from the Reserve Bank.
Sterling is being assisted in its exploration of these various alternatives by financial advisors Sandler O’Neill + Partners, Barclays Capital and FBR Capital Markets.
There can be no assurance that any of these efforts will be successful, and if Sterling were to be unsuccessful, its ongoing viability would be in doubt. Such uncertainty is reflected in the opinion given by our auditors on our year-end financial statements, “Forward-Looking Statements” and “Risk Factors.” Regardless of the outcome, Sterling depositors continue to be protected by FDIC insurance up to $250,000 per account, and non- interest-bearing and certain interest-bearing
| TX2 |
Table of Contents
transaction accounts are fully protected regardless of dollar amount under the FDIC’s Transaction Account Guarantee (“TAG”) program. See “Risk Factors—The uncertainty of our financial viability could result in a loss of access to funding sources, which would have a negative impact on our liquidity and may cause our regulators to place us in receivership before we have implemented our strategic alternatives” and “Regulation.-Recent Legislative and Regulatory Initiatives to address Financial and Economic Crises.”
Sterling’s goal is to be the leading community bank in the West by offering customers a range of highly personalized sales and service consistent with our “Hometown Helpful”® philosophy. This strategy centers on bringing the full product suite of a large regional institution to customers with the personalized service of a local community bank. The four tenets of this philosophy are:
| Ÿ | Knowledgeable bankers—We are committed to ensuring our employees are highly trained and talented bankers who capably serve consumers and commercial customers across our five-state footprint. Our employee development, training, and compensation initiatives are designed to support the strongest team of bankers in the region. |
| Ÿ | Fair pricing—No one likes to be nickel and dimed. We are dedicated to providing value-driven pricing that generates the appropriate risk-adjusted rate of return and supports our market-driven competitive funding cost advantage. We have eliminated nuisance fees and are focused on creating meaningful value for our customers. |
| Ÿ | Convenience and ease of use—We have 178 retail banking locations and more than 30 mortgage loan origination offices; customer- oriented hours; full-service net banking and bill pay. We have the largest team of commercial bankers in the region and the highest commitment to personalized service. Our goal is to meet our customers where they want to be met. |
| Ÿ | Competitive products and services—We have one of the most advanced and user-friendly Remote Deposit Capture offerings in the western United States. Our treasury management products rival those of the largest banks operating in our area. We offer a full range of consumer, small business, commercial, corporate, wealth and mortgage banking products and services across our five-state footprint. |
Sterling believes that its dedication to personalized service and relationship banking has enabled it to grow both its retail deposit base and its lending portfolio in the western United States. Sterling originates loans and attracts FDIC insured and uninsured deposits from the general public throughout its five state footprint through its two subsidiary banks, Sterling Savings Bank and Golf Savings Bank, and through its commercial real estate division INTERVEST-Mortgage Investment Company (“INVERVEST”). Sterling also markets fixed income and equity products, mutual funds, fixed and variable annuities and other financial products through wealth management representatives located throughout Sterling’s financial service center network.
Historically, we have focused on growing our institution both organically and through acquisitions (we have completed eight whole bank acquisitions since our founding). Beginning in mid-2008, and in light of the current economic environment, we shifted our focus to internal improvements with an emphasis on the areas of credit management, operating efficiency and optimally sizing the balance sheet. Our business philosophy transformed from the traditionally effective asset growth model to the “back to basics banking” model built around development of core relationships. We realigned our organization to increase our profitability by adding seasoned and talented individuals to our operations and by incorporating the following strategies:
| Ÿ | Strengthening Asset Quality Oversight and Resolution. To address the deteriorating economic environment in early 2008, Sterling established a credit administration group to focus specifically on the identification and resolution of construction and commercial real estate-related assets that are currently or expected to become problem assets. This group operates independently from a parallel credit administration team dedicated to monitoring |
| TX3 |
Table of Contents
| the performing loans in Sterling’s loan portfolio. This separation of duties has allowed Sterling to continue its strategic goal of achieving targeted levels of loan portfolio diversification while addressing issues related to problem assets. In addition, the creation of a sales team to proactively handle the sale of other real estate owned (“OREO”) has facilitated efficient asset resolution which, in turn, has reduced the negative impact of carrying nonperforming assets on the balance sheet. |
| Ÿ | Emphasizing Growth in Commercial Business and Consumer Lending While Reducing Exposure to Construction and Commercial Real Estate Loans. Sterling continues to optimize its balance sheet mix to achieve increased risk adjusted returns by rebalancing loan-portfolio concentrations, aligning loan pricing with credit risk and improving the overall mix of earning assets. Since December 31, 2008, construction loans have declined $1.0 billion, or 40%. |
| Ÿ | Originating Lower-Cost Core Deposits with Relationship Banking Initiatives. We have implemented a number of relationship-focused deposit initiatives over the last two years, resulting in growth of core deposits including non-interest bearing checking accounts. The change in our deposit mix has contributed to Sterling’s cost of funds decreasing from 3.13% as of December 31, 2008 to 2.28% as of December 31, 2009. In addition, we expect to realize an increase in deposit-related fee income with the increase in transaction deposit account activity. We expect the growth in core deposits to reduce our reliance on wholesale borrowings as a funding source. |
| Ÿ | Expanding and Diversifying Our Fee Income. Sterling continues to explore opportunities to grow fee income through existing products and services as well as new sources, including deposit fees, transaction fees and fees from mortgage banking. These activities center around relationship banking and our Hometown Helpful value proposition. We are committed to providing our customers with knowledgeable bankers delivering valuable products and services at a fair price and in a convenient and accessible fashion. Income from mortgage banking operations has grown by $19.6 million, or 71.0%, during the year ended 2009, compared with the same period in 2008. |
| Ÿ | Improving Operating Efficiency Through Improved Expense Management. In an effort to maximize core earnings and offset credit-related expenses incurred in today’s deteriorating credit environment, Sterling has implemented expense savings initiatives. Earlier this year, Sterling Savings Bank revised its branch staffing model and eliminated redundant positions. Through these and other efforts during 2009, Sterling Savings Bank reduced its full-time equivalent branch and administrative staffing by approximately 4.8%. |
| Ÿ | Improving Capital Levels. For a discussion of the strategic alternatives designed to put Sterling on a sound financial footing and allow it to recapitalize and grow its business, see “—Recent Developments.” |
As we complete the organizational shift away from asset-driven growth to profit-driven core relationship banking, we will continue to emphasize maximizing the effectiveness of our funding costs. Initially, our priorities are balanced, aggressive, deposit growth and timely, cost-effective, asset resolution. In the future, increasing larger low-cost core funding sources will enable us to generate profitable, high quality assets. We have improved all of our core funding ratios with loans-to-deposits declining 11 percentage points to 94% as of December 31, 2009. We continue to emphasize progress in the realignment of our asset concentrations and the restructuring of our balance sheet.
Sterling’s revenues are derived primarily from interest earned on loans and mortgage-backed securities (“MBS”), fees and service charges, and mortgage banking operations. Sterling’s earnings per share and performance ratios for 2009 continued to be impacted by the major disruption in the housing market and downturn in the economy. For the year ended December 31, 2009, Sterling recorded a loss of $855.5 million, or $16.48 per common share, reflecting a $681.4 million provision for credit losses compared with $333.6 million for 2008, and recorded non-cash charges of $227.6 million to
| TX4 |
Table of Contents
reflect impairment of Sterling’s goodwill, and of $269.0 million to establish a valuation allowance against its deferred tax asset. During the third quarter of 2009, Sterling announced that, as part of its ongoing strategy to manage through the current economic cycle, it deferred regularly scheduled interest payments on its outstanding junior subordinated notes relating to its trust preferred securities. Sterling also announced the deferral of quarterly cash dividend payments on its $303 million in preferred stock. Sterling is allowed to defer payments of interest on the junior subordinated notes for up to 20 consecutive quarterly periods without default. Failure to pay dividends on CPP preferred stock for six dividend periods would trigger preferred shareholder board appointment rights.
The operations of Sterling, and banking institutions generally, are influenced significantly by general economic conditions and by policies of its primary regulatory authorities, the Board of Governors of the Federal Reserve System (the “Federal Reserve”), the FDIC and the WDFI.
We intend to return to profitability by:
| Ÿ | Growing our core deposits, particularly commercial, consumer and public sector transaction deposits. |
| Ÿ | Expanding full banking relationship products and services for commercial and public sector customers, including depository and treasury management services such as lockbox, online net banking, merchant services, analyzed and sweep accounts, remote deposit capture and international services. |
| Ÿ | Improving asset quality through robust underwriting and credit approval functions, and the reduction of non-performing assets. |
| Ÿ | Diversifying and growing our fee income through existing and new fee income sources, including deposit fees, transaction fees, fees from mortgage banking and other fees. |
| Ÿ | Changing the mix of the loan portfolio to increase the volume of higher-yielding commercial banking and consumer loans. |
| Ÿ | Managing interest rate risk to protect net interest margin in a changing interest rate environment. |
| Ÿ | Controlling expenses and increasing operating efficiency. |
Together, we believe these strategies will contribute to a return to high quality earnings and maximizing shareholder value. The effect of these strategies on our financial results is discussed further in Management’s Discussion and Analysis of Financial Condition and Results of Operations (“MD&A”).
For purposes of measuring and reporting financial results, Sterling is divided into five business segments:
| Ÿ | The Community Banking segment provides retail, commercial banking, and wealth management services and products through Sterling’s subsidiary, Sterling Savings Bank. |
| Ÿ | The Residential Construction Lending segment has historically originated and serviced loans through the real estate division of Sterling’s subsidiary, Sterling Savings Bank. Activity in this segment has been curtailed, and realigned with an emphasis on credit resolution. |
| Ÿ | The Residential Mortgage Banking segment originates and sells servicing-retained and servicing-released residential loans through loan production offices of Sterling’s subsidiary, Golf Savings Bank. |
| Ÿ | The Commercial Mortgage Banking segment originates, sells and services commercial real estate loans and participation interests in commercial real estate loans through offices in the western region primarily through Sterling Savings Bank’s subsidiary INTERVEST. |
| Ÿ | The Other and Eliminations segment represents the parent company expenses and intercompany eliminations of revenue and expenses. |
On May 1, 2009, Sterling Savings Bank’s subsidiary, Harbor Financial Services, Inc., which provides certain wealth management services, was renamed Sterling Savings Banc Financial Services, Inc.
| TX5 |
Table of Contents
The following table presents certain financial information regarding Sterling’s segments and provides a reconciliation to Sterling’s consolidated totals as of and for the years ended December 31, 2009, 2008 and 2007 (in thousands):
| As of and for the Year Ended December 31, 2009 | ||||||||||||||||||||||||
| Community Banking |
Residential Construction Lending |
Residential Mortgage Banking |
Commercial Mortgage Banking |
Other and Eliminations |
Total | |||||||||||||||||||
| Interest income |
$ | 538,503 | $ | 7,951 | $ | 29,058 | $ | 22,912 | $ | 923 | $ | 599,347 | ||||||||||||
| Interest expense |
(194,836 | ) | (39,633 | ) | (13,587 | ) | 0 | (7,314 | ) | (255,370 | ) | |||||||||||||
| Net interest income (expense) |
343,667 | (31,682 | ) | 15,471 | 22,912 | (6,391 | ) | 343,977 | ||||||||||||||||
| Provision for losses on loans |
(389,293 | ) | (267,835 | ) | (24,243 | ) | 0 | 0 | (681,371 | ) | ||||||||||||||
| Noninterest income |
77,465 | 304 | 54,771 | 2,891 | (11,617 | ) | 123,814 | |||||||||||||||||
| Noninterest expense |
(309,280 | ) | (7,273 | ) | (39,565 | ) | (8,299 | ) | (5,557 | ) | (369,974 | ) | ||||||||||||
| Goodwill impairment |
(227,558 | ) | 0 | 0 | 0 | 0 | (227,558 | ) | ||||||||||||||||
| Income (loss) before income taxes |
$ | (504,999 | ) | $ | (306,486 | ) | $ | 6,434 | $ | 17,504 | $ | (23,565 | ) | $ | (811,112 | ) | ||||||||
| Total assets |
$ | 9,302,660 | $ | 969,935 | $ | 586,765 | $ | 18,074 | $ | (11 | ) | $ | 10,877,423 | |||||||||||
| As of and for the Year Ended December 31, 2008 | ||||||||||||||||||||||||
| Community Banking |
Residential Construction Lending |
Residential Mortgage Banking |
Commercial Mortgage Banking |
Other and Eliminations |
Total | |||||||||||||||||||
| Interest income |
$ | 565,767 | $ | 99,027 | $ | 30,559 | $ | 18,962 | $ | 747 | $ | 715,062 | ||||||||||||
| Interest expense |
(262,637 | ) | (62,492 | ) | (17,570 | ) | 0 | (12,811 | ) | (355,510 | ) | |||||||||||||
| Net interest income (expense) |
303,130 | 36,535 | 12,989 | 18,962 | (12,064 | ) | 359,552 | |||||||||||||||||
| Provision for losses on loans |
(105,915 | ) | (221,135 | ) | (6,547 | ) | 0 | 0 | (333,597 | ) | ||||||||||||||
| Noninterest income |
70,444 | 3,234 | 23,672 | 3,803 | (9,258 | ) | 91,895 | |||||||||||||||||
| Noninterest expense |
(253,189 | ) | (9,766 | ) | (29,005 | ) | (9,463 | ) | (4,094 | ) | (305,517 | ) | ||||||||||||
| Goodwill impairment |
(192,695 | ) | 0 | (31,070 | ) | 0 | 0 | (223,765 | ) | |||||||||||||||
| Income (loss) before income taxes |
$ | (178,225 | ) | $ | (191,132 | ) | $ | (29,961 | ) | $ | 13,302 | $ | (25,416 | ) | $ | (411,432 | ) | |||||||
| Total assets |
$ | 10,721,836 | $ | 1,526,416 | $ | 517,728 | $ | 14,958 | 9,778 | $ | 12,790,716 | |||||||||||||
| As of and for the Year Ended December 31, 2007 | ||||||||||||||||||||||||
| Community Banking |
Residential Construction Lending |
Residential Mortgage Banking |
Commercial Mortgage Banking |
Other and Eliminations |
Total | |||||||||||||||||||
| Interest income |
$ | 548,815 | $ | 185,090 | $ | 23,863 | $ | 9,000 | $ | 210 | $ | 766,978 | ||||||||||||
| Interest expense |
(274,100 | ) | (104,758 | ) | (14,462 | ) | 0 | (18,298 | ) | (411,618 | ) | |||||||||||||
| Net interest income (expense) |
274,715 | 80,332 | 9,401 | 9,000 | (18,088 | ) | 355,360 | |||||||||||||||||
| Provision for losses on loans |
11,047 | (35,752 | ) | (383 | ) | 0 | 0 | (25,088 | ) | |||||||||||||||
| Noninterest income |
81,663 | 6,945 | 21,012 | 7,496 | (23,710 | ) | 93,406 | |||||||||||||||||
| Noninterest expense |
(230,753 | ) | (10,395 | ) | (30,584 | ) | (10,970 | ) | (2,763 | ) | (285,465 | ) | ||||||||||||
| Income (loss) before income taxes |
$ | 136,672 | $ | 41,130 | $ | (554 | ) | $ | 5,526 | $ | (44,561 | ) | $ | 138,213 | ||||||||||
| Total assets |
$ | 9,999,348 | $ | 1,847,344 | $ | 399,306 | $ | 10,445 | $ | (106,668 | ) | $ | 12,149,775 | |||||||||||
| TX6 |
Table of Contents
Sterling provides both secured and unsecured loans to businesses and individuals. Our focus on superior service and relationship banking incorporates a de-emphasis on transactional lending, especially construction and investor or non-owner occupied commercial real estate lending.
Commercial Lending. Sterling has structured its commercial lending into three groups: Commercial and Corporate Banking, Private Banking and Small Business Administration (“SBA”) Lending.
Sterling’s Commercial and Corporate Banking Group provides a full range of credit products to small- and medium-sized businesses. Credit products include lines of credit, receivable and inventory financing, equipment loans, and term real estate financing for owner-occupied properties. Loans may be fully secured, partially secured or unsecured, based on certain credit criteria. The credit product line for both businesses and individuals includes standardized products as well as customized accommodations.
Sterling’s Private Banking Group provides a full line of financial and credit services to higher-net-worth and higher-income borrowers, including a wide variety of consumer and commercial banking loans. The Private Banking Group also serves the needs of the owners and key employees of the commercial and corporate business customers.
Sterling’s Small Business Administration Group consists of business development officers strategically located in Sterling’s key business markets of Seattle, WA, Portland, OR, Spokane, WA and Santa Rosa, CA. Sterling’s business development officers assist small start-up and existing businesses with their financing, cash management and general business planning needs, primarily by helping them access the Small Business Administration’s guaranteed 7(a) and 504 lending programs. These guaranteed lending programs provide small businesses with critical and flexible funding for establishing a new business, or for the operation, acquisition or expansion of an existing business. From their four primary locations, Sterling’s business development officers support small businesses’ banking requirements throughout Sterling’s Commercial and Retail branch network.
Sterling has established minimum underwriting standards, which delineate criteria for sources of repayment, financial strength and credit enhancements such as guarantees. Typically, the primary source of repayment is recurring cash flow of the borrower or cash flow from the business or project being financed. Depending on the type of loan, underwriting standards include minimum financial requirements, maximum loan-to-collateral value ratios, minimum cash flow coverage of debt service, debt-to-income ratios and minimum liquidity requirements. Exceptions to the minimum underwriting standards may be made depending upon the type of loan and financial strength of the borrower. Exceptions are reported to the appropriate level of authority up to and including the subsidiary banks’ board of directors. Common forms of collateral pledged to secure commercial banking loans include real estate, accounts receivable, inventory, equipment, agricultural crops or livestock and marketable securities. Most loans have maximum terms of one to ten years and loan-to-value ratios in the range of 65% to 80%, based on an analysis of the collateral pledged.
Commercial, corporate and private banking loans generally are backed by collateral that may be difficult to obtain or liquidate following a default, and it is difficult to accurately predict the borrower’s ability to generate future cash flows. These loans, however, typically offer higher yields than residential loans, and variable interest rates. The availability of such loans generally encourages potential depositors to establish full-service banking relationships with Sterling.
Multifamily Residential and Commercial Real Estate Lending. Sterling offers multifamily residential and commercial real estate loans as both construction and permanent loans collateralized by real property. Construction loans on such properties typically have terms of 12 to 24 months and have variable interest rates. Permanent fixed- and adjustable-rate loans on existing properties typically have maturities of three to ten years. Multifamily residential and commercial real estate loans generally involve a higher degree of risk than one- to four-family residential real estate loans, because they typically involve large loan balances to single borrowers or groups of related borrowers. The payment experience on such loans typically is dependent on the successful operation of the real
| TX7 |
Table of Contents
estate project and is subject to certain risks not present in one- to four-family residential mortgage lending. These risks include excessive vacancy rates or inadequate operating cash flows. Construction lending is subject to risks such as construction delays, cost overruns, insufficient values and an inability to obtain permanent financing in a timely manner. Sterling has seen a slowdown in the rate at which newly constructed commercial properties are able to obtain tenants, which has impacted some of its borrowers’ ability to obtain permanent financing. Sterling attempts to reduce its exposure to these risks by limiting loan amounts to the amounts readily accepted in the secondary market, by closely monitoring the construction disbursement process, by investigating the borrowers’ finances and, depending on the circumstances, requiring annual financial statements from the borrowers, requiring operating statements on the properties or acquiring personal guarantees from the borrowers.
One- to Four-Family Residential Lending. Sterling originates fixed- and adjustable-rate residential mortgages (“ARMs”), which have interest rates that adjust annually or every three, five or seven years and are indexed to a variety of market indices, as well as interest only residential mortgages. Sterling focuses its residential lending on traditional amortizing loans for owner occupied homes, second homes and investment properties per guidelines. Sterling also has interest only loan programs available that are underwritten according to the borrower’s ability to make fully amortized payments. To a lesser extent, Sterling originates non-owner occupied residential mortgages. With the slowdown in the real estate market, Sterling has experienced a substantial increase in classified and non-performing loans in its non-owner occupied residential loan portfolio.
Sterling continues to originate conventional and government-insured residential loans for sale into the secondary mortgage market. Within the secondary mortgage market for conventional loans, Sterling sells its residential loans both on a servicing-released and servicing-retained basis to correspondent institutions that include the Federal Home Loan Mortgage Corporation (“FHLMC”) and to the Federal National Mortgage Association (“FNMA”). Sterling endeavors to underwrite residential loans in compliance with these agencies’ underwriting standards. Loans sold into the secondary market are all sold with limited recourse to Sterling, meaning that Sterling may be obligated to repurchase any loans that are not underwritten in accordance with these agencies’ or applicable investor underwriting guidelines. Historically, these repurchases have been very limited. Sterling continues to originate residential loans to be held in its portfolio. The maximum loan to value ratio is generally 80% on portfolio lending products.
Conventional residential mortgage loans are originated for up to 100% of the appraised value or selling price of the mortgaged property, whichever is less. Borrowers must purchase private mortgage insurance from approved third parties so that Sterling’s risk is limited to approximately 80% of the appraised value on most loans with loan-to-value ratios in excess of 80%. Sterling’s residential lending programs are designed to comply with all applicable regulatory requirements. For a discussion of Sterling’s management of interest rate risk (“IRR”) on conventional loans, see “—Secondary Market Activities.”
Sterling originates residential construction loans on presold and spec homes, as well as townhouses and condominiums and provides land, lot, and acquisition and development loans for residential subdivisions. However, in the current economic environment, the number of viable residential construction projects that meet Sterling’s underwriting standards is limited. Construction financing is generally considered to involve a higher degree of risk than long-term financing on improved, occupied real estate. Sterling’s risk of loss on construction loans depends largely upon the accuracy of the initial estimate of the property’s value at completion of construction or development and the estimated cost (including interest) of construction. If the estimate of construction costs proves to be inaccurate, Sterling might have to advance funds beyond the amount originally committed to permit completion of the development and to protect its security position. Sterling also might be confronted, at or prior to maturity of the loan, with a project with insufficient value to ensure full repayment. Sterling’s underwriting, monitoring and disbursement practices with respect to construction financing are intended to ensure that sufficient funds are available to complete construction projects. Sterling has seen a deterioration of the credit quality of its residential construction portfolio as evidenced by the increase
| TX8 |
Table of Contents
in classified and non-performing construction loans. Sterling endeavors to limit its risk through its underwriting procedures by using only approved, qualified appraisers and by dealing only with qualified builders/borrowers. See “—Classified and Non-performing Assets.”
Consumer Lending. Consumer loans and lines of credit are originated directly through Sterling’s retail branches and Private Banking Group, and indirectly through Sterling’s Dealer Banking Department. Sterling finances purchases of consumer goods including automobiles, boats and recreational vehicles, and lines of credit for personal use. Generally, consumer loans are originated for terms ranging from six months to ten years. Interest rates may be either fixed or adjustable based on a contractual formula tied to established external indices. Sterling also makes loans secured by borrowers’ savings accounts and equity loans collateralized by residential real estate. Equity loans may have maturities of up to 20 years.
The following table sets forth information on loan originations for the periods indicated:
| Years Ended December 31, | |||||||||||||||
| 2009 | 2008 | 2007 | |||||||||||||
| Amount | % | Amount | % | Amount | % | ||||||||||
| (Dollars in thousands) | |||||||||||||||
| Mortgage: |
|||||||||||||||
| One- to four-family residential |
$ | 3,047,380 | 76.5 | $ | 1,464,673 | 40.4 | $ | 1,492,026 | 27.2 | ||||||
| Multifamily residential |
82,696 | 2.1 | 170,975 | 4.7 | 35,870 | 0.7 | |||||||||
| Commercial real estate |
176,256 | 4.4 | 326,853 | 9.0 | 163,315 | 3.0 | |||||||||
| Total mortgage loans |
3,306,332 | 83.0 | 1,962,501 | 54.1 | 1,691,211 | 30.9 | |||||||||
| Construction: |
|||||||||||||||
| One- to four-family residential |
32,692 | 0.8 | 383,922 | 10.6 | 1,584,449 | 28.9 | |||||||||
| Multifamily residential |
0 | 0.0 | 25,374 | 0.7 | 118,799 | 2.2 | |||||||||
| Commercial real estate |
31,968 | 0.8 | 192,755 | 5.3 | 488,372 | 8.9 | |||||||||
| Total construction loans |
64,660 | 1.6 | 602,051 | 16.6 | 2,191,620 | 40.0 | |||||||||
| Total mortgage and construction loans |
3,370,992 | 84.6 | 2,564,552 | 70.7 | 3,882,831 | 70.9 | |||||||||
| Commercial and consumer: |
|||||||||||||||
| Commercial banking |
318,544 | 8.0 | 541,978 | 15.0 | 995,732 | 18.2 | |||||||||
| Consumer—direct |
191,789 | 4.8 | 326,763 | 9.0 | 359,338 | 6.6 | |||||||||
| Consumer—indirect |
99,813 | 2.6 | 190,177 | 5.3 | 242,309 | 4.3 | |||||||||
| Total commercial and consumer loans |
610,146 | 15.4 | 1,058,918 | 29.3 | 1,597,379 | 29.1 | |||||||||
| Total loans originated |
$ | 3,981,138 | 100.0 | $ | 3,623,470 | 100.0 | $ | 5,480,210 | 100.0 | ||||||
Construction loan originations were lower for both 2009 and 2008, as compared to 2007, reflecting both Sterling’s strategic efforts to reduce the concentration of these loans in its loan portfolio, and current economic conditions that have caused a decline in demand for these loans.
| TX9 |
Table of Contents
Loan Portfolio Analysis. The following table sets forth the composition of Sterling’s loan portfolio by type of loan at the dates indicated:
| December 31, | ||||||||||||||||||||||||||||||
| 2009 | 2008 | 2007 | 2006 | 2005 | ||||||||||||||||||||||||||
| Amount | % | Amount | % | Amount | % | Amount | % | Amount | % | |||||||||||||||||||||
| (Dollars in thousands) | ||||||||||||||||||||||||||||||
| Mortgage: |
||||||||||||||||||||||||||||||
| One- to four-family residential |
$ | 839,170 | 10.9 | $ | 867,384 | 9.6 | $ | 703,826 | 7.8 | $ | 654,661 | 9.2 | $ | 488,633 | 9.9 | |||||||||||||||
| Multifamily residential |
517,408 | 6.7 | 477,615 | 5.3 | 389,388 | 4.3 | 263,053 | 3.7 | 332,211 | 6.7 | ||||||||||||||||||||
| Commercial real estate |
1,403,560 | 18.2 | 1,364,885 | 15.1 | 1,223,036 | 13.5 | 795,386 | 11.2 | 792,219 | 16.0 | ||||||||||||||||||||
| Total mortgage loans |
2,760,138 | 35.8 | 2,709,884 | 30.0 | 2,316,250 | 25.6 | 1,713,100 | 24.1 | 1,613,063 | 32.6 | ||||||||||||||||||||
| Construction: |
||||||||||||||||||||||||||||||
| One- to four-family residential |
720,964 | 9.4 | 1,455,860 | 16.1 | 1,933,125 | 21.3 | 1,429,772 | 20.1 | 591,362 | 11.9 | ||||||||||||||||||||
| Multifamily residential |
233,501 | 3.0 | 324,818 | 3.6 | 263,873 | 2.9 | 189,819 | 2.7 | 143,272 | 2.9 | ||||||||||||||||||||
| Commercial real estate |
561,643 | 7.3 | 754,017 | 8.4 | 747,913 | 8.2 | 671,291 | 9.4 | 286,868 | 5.8 | ||||||||||||||||||||
| Total construction loans |
1,516,108 | 19.7 | 2,534,695 | 28.1 | 2,944,911 | 32.4 | 2,290,882 | 32.2 | 1,021,502 | 20.6 | ||||||||||||||||||||
| Total mortgage and construction loans |
4,276,246 | 55.5 | 5,244,579 | 58.1 | 5,261,161 | 58.0 | 4,003,982 | 56.3 | 2,634,565 | 53.2 | ||||||||||||||||||||
| Commercial and consumer: |
||||||||||||||||||||||||||||||
| Commercial banking |
2,301,944 | 29.9 | 2,532,158 | 28.1 | 2,639,196 | 29.1 | 2,069,086 | 29.1 | 1,531,079 | 30.9 | ||||||||||||||||||||
| Consumer—direct |
792,957 | 10.3 | 859,222 | 9.5 | 798,519 | 8.8 | 749,626 | 10.5 | 618,528 | 12.5 | ||||||||||||||||||||
| Consumer—indirect |
323,565 | 4.3 | 389,298 | 4.3 | 376,937 | 4.1 | 288,704 | 4.1 | 166,143 | 3.4 | ||||||||||||||||||||
| Total commercial and consumer loans |
3,418,466 | 44.5 | 3,780,678 | 41.9 | 3,814,652 | 42.0 | 3,107,416 | 43.7 | 2,315,750 | 46.8 | ||||||||||||||||||||
| Total loans receivable |
7,694,712 | 100.0 | 9,025,257 | 100.0 | 9,075,813 | 100.0 | 7,111,398 | 100.0 | 4,950,315 | 100.0 | ||||||||||||||||||||
| Deferred fees, net |
(7,070 | ) | (9,798 | ) | (16,480 | ) | (12,308 | ) | (8,916 | ) | ||||||||||||||||||||
| Gross loans receivable |
7,687,642 | 9,015,459 | 9,059,333 | 7,099,090 | 4,941,399 | |||||||||||||||||||||||||
| Allowance for loan losses |
(343,443 | ) | (208,365 | ) | (111,026 | ) | (77,849 | ) | (52,033 | ) | ||||||||||||||||||||
| Loans receivable, net |
$ | 7,344,199 | $ | 8,807,094 | $ | 8,948,307 | $ | 7,021,241 | $ | 4,889,366 | ||||||||||||||||||||
| TX10 |
Table of Contents
Contractual Principal Payments. The following table sets forth the scheduled contractual principal repayments for Sterling’s loan portfolio at December 31, 2009. Demand loans, loans having no stated repayment schedule and no stated maturity, and overdrafts are reported as due in one year or less. Loan balances do not include undisbursed loan proceeds, deferred loan origination costs and fees, or allowances for credit losses.
| Balance Outstanding at December 31, 2009 |
Principal
Payments Contractually Due in Fiscal Years | |||||||||||||||||||||||
| 2010 | 2011-2014 | Thereafter | ||||||||||||||||||||||
| (in thousands) | ||||||||||||||||||||||||
| fixed | variable | fixed | variable | fixed | variable | fixed | variable | |||||||||||||||||
| Mortgage |
$ | 990,193 | $ | 1,769,945 | $ | 84,465 | $ | 368,298 | $ | 308,570 | $ | 674,252 | $ | 597,158 | $ | 727,395 | ||||||||
| Construction: |
||||||||||||||||||||||||
| Residential |
32,322 | 688,642 | 22,591 | 481,317 | 8,924 | 190,136 | 807 | 17,189 | ||||||||||||||||
| Multifamily |
19,465 | 214,036 | 15,095 | 165,980 | 4,370 | 48,056 | 0 | 0 | ||||||||||||||||
| Commercial |
40,096 | 521,547 | 28,301 | 368,124 | 11,664 | 151,723 | 131 | 1,700 | ||||||||||||||||
| Total Construction |
91,883 | 1,424,225 | 65,987 | 1,015,421 | 24,958 | 389,915 | 938 | 18,889 | ||||||||||||||||
| Consumer—direct |
444,374 | 348,583 | 33,200 | 13,501 | 115,519 | 20,599 | 295,655 | 314,483 | ||||||||||||||||
| Consumer—indirect |
323,565 | 0 | 78,870 | 0 | 230,547 | 0 | 14,148 | 0 | ||||||||||||||||
| Commercial banking |
654,368 | 1,647,576 | 218,429 | 691,477 | 268,349 | 545,583 | 167,590 | 410,516 | ||||||||||||||||
| $ | 2,504,383 | $ | 5,190,329 | $ | 480,951 | $ | 2,088,697 | $ | 947,943 | $ | 1,630,349 | $ | 1,075,489 | $ | 1,471,283 | |||||||||
Loan Servicing. Sterling services its own loans, as well as loans owned by others. Loan servicing includes collecting and remitting loan payments, accounting for principal and interest, holding escrow funds for the payment of real estate taxes and insurance premiums, contacting delinquent borrowers and supervising foreclosures in the event of unremedied defaults. For loans serviced for others, Sterling generally receives a fee based on the unpaid principal balance of each loan to compensate for the costs of performing the servicing function.
For residential mortgage loans serviced for other investors, Sterling receives a fee, generally ranging from 5 to 25 basis points of the unpaid principal balance. At December 31, 2009 and 2008, Sterling serviced for itself and for other investors, residential mortgage loans totaling $1.88 billion and $1.29 billion, respectively. Of such mortgage loans, $1.09 billion in 2009 and $501.6 million in 2008 were primarily serviced for FHLMC and FNMA. Sterling’s ability to continue as a seller/servicer for these agencies is dependent upon meeting their qualifications. As a result of Sterling’s capitalization, there can be no assurance that Sterling will be able to continue as a seller/servicer for these agencies.
Sterling receives a fee for servicing commercial and multifamily real estate loans for other investors. This fee generally ranges from 5 to 25 basis points of the unpaid principal balance. At December 31, 2009 and 2008, Sterling serviced for itself and other investors, commercial and multifamily real estate loans totaling $3.45 billion and $3.44 billion, respectively.
Secondary Market Activities. Sterling has developed correspondent relationships with a number of mortgage companies and financial institutions to facilitate the origination and sale of mortgage loans in the secondary market on either a participation or whole loan basis. Substantially all of these loans are secured by real estate. On a limited basis, Sterling has purchased mortgage loans in the secondary market. Agents who present loans to Sterling for purchase are required to provide a processed loan package prior to commitment. Sterling then underwrites the loan in accordance with its established lending standards. During 2009 and 2008, Sterling did not purchase any loans in the secondary market.
In 2009, 74% of Sterling’s sales of residential mortgage loans were sold into the secondary market on a servicing-released basis, while in 2008, nearly all were. Sterling generally receives a fee of approximately 100 to 200 basis points of the principal balance of mortgage loans for releasing the servicing. For sales of loans on a servicing-retained
| TX11 |
Table of Contents
basis, Sterling records a servicing asset of approximately 100 to 142 basis points of the principal balance. At December 31, 2009 and 2008, Sterling had recorded $12.1 million and $5.7 million in servicing rights, respectively. See Note 5 of “Notes to Consolidated Financial Statements.”
Sterling, from time to time, sells participations in certain commercial real estate loans to investors on a servicing-retained basis. During the years ended December 31, 2009, 2008 and 2007, Sterling sold approximately $20.9 million, $15.8 million and $56.0 million in loans under participation agreements, resulting in net gains of $1.6 million, $24,000 and $3.0 million, respectively.
Loan Commitments. Sterling makes written commitments to individual borrowers and mortgage brokers for the purposes of originating and purchasing loans. These loan commitments establish the terms and conditions under which Sterling will fund the loans. Sterling had outstanding commitments to originate or purchase loans, the undisbursed portion of which aggregated $167.9 million and $809.3 million at December 31, 2009 and 2008, respectively. Sterling also had secured and unsecured commercial and personal lines of credit, the undisbursed portion of which was approximately $844.2 million and $1.00 billion at December 31, 2009 and 2008, respectively. See Note 17 of “Notes to Consolidated Financial Statements.”
Derivatives and Hedging. As part of its mortgage banking activities, Sterling issues interest rate lock commitments to prospective borrowers on residential mortgage loan applications. Pricing for the sale of these loans is fixed with various qualified investors under both non-binding (“best-efforts”) and binding (“mandatory”) delivery programs. For mandatory delivery programs, Sterling hedges interest rate risk by entering into offsetting forward sale agreements on mortgage-backed securities (“MBS”) with third parties. Risks inherent in mandatory delivery programs include the risk that if Sterling does not close the loans subject to interest rate lock commitments, it is nevertheless obligated to deliver MBS to the counterparty under the forward sale agreement. Sterling could incur significant costs in acquiring replacement loans or MBS and such costs could have a material adverse effect on mortgage banking operations in future periods. See Note 10 of “Notes to Consolidated Financial Statements.”
Interest rate lock commitments and loan delivery commitments are off balance sheet commitments that are considered to be derivatives. As of December 31, 2009, Sterling had $110.0 million of interest rate lock commitments, $119.7 million of warehouse loans held for sale that were not committed to investors, and held offsetting forward sale agreements on MBS valued at $234.0 million. In addition, Sterling had mandatory delivery commitments to sell mortgage loans to investors valued at $29.5 million as of December 31, 2009. As of December 31, 2008, Sterling had $75.4 million of interest rate lock commitments, $71.8 million of warehouse loans held for sale that were not committed to investors, and held offsetting forward sale agreements on MBS valued at $114.4 million. In addition, Sterling had mandatory delivery commitments to sell mortgage loans to investors valued at $1.4 million as of December 31, 2008. As of December 31, 2009 and December 31, 2008, Sterling had entered into best efforts forward commitments to sell $51.6 million and $71.0 million of mortgage loans, respectively.
In addition, Sterling enters into interest rate swap derivative contracts with customers. The interest rate risk on these contracts is managed by entering into offsetting interest rate swap agreements with various counterparties (“broker-dealers” or “dealers”). The counterparty agreements include certain representations, warranties and covenants, which include terms that allow for an early termination in the event of default. Failure to maintain a well capitalized position is one event that may be considered a default, and counterparties to the derivative instruments could require an early termination settlement or an increase in the collateralization on derivative instruments in net liability positions. During the fourth quarter of 2009, one dealer counterparty terminated three swap positions that had a $4.8 million notional amount. The market values of interest rate swaps fluctuate based upon interest rate movements. At the time of termination, these swaps had a market value of $254,000. The “make whole” provision of the contracts resulted in Sterling reimbursing the counterparty and recording a charge equal to the value of the swaps at termination. As of March 16, 2010, no other counterparties have terminated any positions or requested additional collateral. The aggregate fair value of all derivative instruments with credit risk
| TX12 |
Table of Contents
related contingent features that are in a liability position on December 31, 2009 was $4.3 million for which Sterling had already posted collateral with a market value of $6.1 million. Both customer and dealer related interest rate derivatives are carried at fair value by Sterling.
Classified and Nonperforming Assets. To measure the quality of loans and other real estate owned (“OREO”), Sterling has established guidelines for classifying and determining provisions for anticipated losses. Sterling’s system employs the classification categories of “substandard,” “doubtful” and “loss” for its classified assets. Substandard assets have deficiencies, which give rise to the distinct possibility that Sterling will sustain some loss if the deficiencies are not corrected. Doubtful assets have the same weaknesses as substandard assets, and on the basis of currently existing facts, are also deemed to have a high probability of loss. An asset classified as loss is considered uncollectible and of such little value that it should not be included as an asset of Sterling. Total classified assets increased to $1.65 billion at December 31, 2009, from $984.9 million at December 31, 2008. As a percentage of total assets, classified assets increased to 15.15% at December 31, 2009 from 7.70% at December 31, 2008. The credit quality of Sterling’s residential and commercial construction loans has deteriorated, and delinquencies have increased due to declining market values and weakness in housing sales, as well as slower lease-ups of commercial properties in certain of its markets.
The following table describes classified assets by asset type at the dates indicated:
| December 31, 2009 |
September 30, 2009 |
June 30, 2009 |
March 30, 2009 |
December 31, 2008 | |||||||||||
| (Dollars in thousands) | |||||||||||||||
| Residential real estate |
$ | 128,561 | $ | 74,448 | $ | 62,785 | $ | 31,400 | $ | 34,333 | |||||
| Multifamily real estate |
44,258 | 31,921 | 22,290 | 15,814 | 16,741 | ||||||||||
| Commercial real estate |
154,859 | 81,754 | 62,184 | 41,364 | 37,890 | ||||||||||
| Construction |
|||||||||||||||
| Residential construction |
487,789 | 527,630 | 521,984 | 558,170 | 548,384 | ||||||||||
| Multifamily and commercial construction |
462,088 | 275,817 | 256,192 | 145,629 | 119,348 | ||||||||||
| Total construction |
949,877 | 803,447 | 778,176 | 703,799 | 667,732 | ||||||||||
| Consumer—direct and indirect |
11,996 | 9,016 | 7,908 | 6,816 | 4,556 | ||||||||||
| Commercial banking |
269,521 | 168,790 | 192,207 | 170,678 | 143,748 | ||||||||||
| Total classified loans |
1,559,072 | 1,169,376 | 1,125,550 | 969,871 | 905,000 | ||||||||||
| OREO |
91,478 | 81,361 | 89,721 | 100,512 | 79,875 | ||||||||||
| Total classified assets |
$ | 1,650,550 | $ | 1,250,737 | $ | 1,215,271 | $ | 1,070,383 | $ | 984,875 | |||||
| TX13 |
Table of Contents
The following table provides additional information regarding the classified assets of the largest 30 borrowers as of December 31, 2009, which together constituted 28% of all classified assets at year end:
| Description |
Location |
December 31, 2009 | |||
| (Dollars in thousands) | |||||
| Commercial Construction: 3 loans |
Puget Sound, WA & Other WA | $ | 36,441 | ||
| Multifamily & Commercial Construction: 5 loans |
Puget Sound, WA & Other OR | 35,016 | |||
| Residential Construction: A&D, land, specs and lots: 11 loans |
Puget Sound, WA, OR, CA & UT | 29,831 | |||
| Residential Construction: A&D, land, specs and lots: 53 loans |
Portland, OR & Other WA | 26,622 | |||
| Residential Construction: A&D, land: 2 loans |
Other OR | 22,813 | |||
| Residential Construction and Commercial: 6 loans |
Other OR | 20,096 | |||
| Residential Construction: A&D, land: 3 loans |
Puget Sound, WA | 19,263 | |||
| Commercial Real Estate: 1 loan |
Northern CA | 19,042 | |||
| Residential Construction: A&D, land, specs and lots: 170 loans |
Portland, OR & Vancouver, WA | 18,948 | |||
| Multifamily Construction: 1 loan |
Puget Sound, WA | 18,050 | |||
| Commercial Construction: 2 loans |
Other OR | 17,627 | |||
| Multifamily: 1 loan |
Portland, OR | 16,630 | |||
| Residential Construction: A&D, land, specs and lots: 104 loans |
Puget Sound, WA | 14,000 | |||
| Commercial: 1 loan |
Other OR | 13,000 | |||
| Commercial & residential mix use: 4 loans |
Other WA | 12,862 | |||
| Multifamily & commercial: 3 loans |
Puget Sound, WA | 11,493 | |||
| Multifamily: 1 loan |
Other ID | 10,758 | |||
| Residential Construction: specs & lots: 20 loans |
Puget Sound, WA | 10,615 | |||
| Commercial Construction: 1 loan |
WA & OR | 10,473 | |||
| Commercial Construction: land: 1 loan |
Northern CA | 10,166 | |||
| Multifamily: 1 loan |
Puget Sound, WA | 10,099 | |||
| Residential Construction: specs & lots: 2 loans |
Portland, OR | 9,907 | |||
| Residential Construction: specs & lots: 27 loans |
Other WA | 9,549 | |||
| Residential Construction: specs & lots & Commercial: 9 loans |
Other OR | 9,463 | |||
| Commercial: 1 loan |
Northern CA | 9,375 | |||
| Commercial: 2 loans |
Puget Sound, WA & Other WA | 9,106 | |||
| Commercial: 1 loan |
Puget Sound, WA | 8,801 | |||
| Commercial: 1 loan |
Northern CA | 8,725 | |||
| Commercial: 2 loans |
Northern CA | 8,359 | |||
| Commercial: 1 loan |
Northern CA | 8,190 | |||
| Total—Classified Assets of top 30 borrowers |
$ | 465,320 | |||
| TX14 |
Table of Contents
Since early 2008, Sterling has been adding resources to manage the increased volume of classified assets. The credit administration group focuses on identifying and resolving problem credits before they become classified. When an asset becomes classified, management of the relationship is assumed by Sterling’s special assets department. Sterling actively engages the borrower and guarantor to remedy the situation by requiring current financial information from the borrower(s) and guarantor(s) to determine a course of action. In addition, new collateral values are requested in order for Sterling’s management to perform evaluations for regulatory and decision making purposes and updated title information is obtained to determine the status of encumbrances on the collateral. When possible, Sterling will require the borrower to provide additional collateral or capital. In conjunction with the receipt of additional collateral, Sterling will sometimes modify the terms of the loan. Often the new modified terms of the loan are consistent with terms that Sterling would offer a new borrower. If the modification of terms is considered concessionary, Sterling classifies the loan as a Troubled Debt Restructure and reports it as a nonperforming loan.
Sterling also may consider allowing a borrower to sell the underlying collateral for less than the outstanding balance on the loan if the current collateral evaluation supports the offer price. In such situations, Sterling typically requires the borrower to sign a new note for the resulting deficiency or bring cash to closing. In some situations Sterling releases the collateral only in a sale transaction, preserving its right to seek monetary judgments against the borrowers and guarantors.
If Sterling and a borrower are unable to achieve an acceptable resolution, Sterling may take a deed in lieu of foreclosure or initiate foreclosure on the underlying collateral. Under such circumstances, Sterling also simultaneously evaluates legal action for recovery against the borrowers and guarantors. After obtaining the collateral, Sterling actively works to sell the collateral.
| TX15 |
Table of Contents
Nonperforming assets are a subset of classified assets, and consist of nonaccrual loans, restructured loans and OREO. The following table summarizes the principal balances of nonperforming assets at the dates indicated:
| December 31, | ||||||||||||||||||||
| 2009 | 2008 | 2007 | 2006 | 2005 | ||||||||||||||||
| (Dollars in thousands) | ||||||||||||||||||||
| Past due 90 days |
$ | 0 | $ | 0 | $ | 0 | $ | 0 | $ | 0 | ||||||||||
| Nonaccrual loans |
824,652 | 474,172 | 123,790 | 8,486 | 8,701 | |||||||||||||||
| Restructured loans |
71,279 | 56,618 | 350 | 0 | 1,081 | |||||||||||||||
| Total nonperforming loans |
895,931 | 530,790 | 124,140 | 8,486 | 9,782 | |||||||||||||||
| OREO |
91,478 | 79,875 | 11,075 | 4,052 | 779 | |||||||||||||||
| Total nonperforming assets |
987,409 | 610,665 | 135,215 | 12,538 | 10,561 | |||||||||||||||
| Specific reserves |
(35,334 | ) | (19,535 | ) | (8,678 | ) | (1,379 | ) | (2,159 | ) | ||||||||||
| Net nonperforming assets |
$ | 952,075 | $ | 591,130 | $ | 126,537 | $ | 11,159 | $ | 8,402 | ||||||||||
| Nonperforming loans with charge-offs, gross |
$ | 1,202,660 | $ | 462,511 | $ | 0 | $ | 0 | $ | 0 | ||||||||||
| Charge-offs on nonperforming loans |
(500,183 | ) | (165,906 | ) | 0 | 0 | 0 | |||||||||||||
| Nonperforming loans carried at fair value |
702,477 | 296,605 | 0 | 0 | 0 | |||||||||||||||
| Nonperforming loans with no charge-offs |
193,454 | 234,185 | 124,140 | 8,486 | 9,782 | |||||||||||||||
| Total nonperforming loans |
$ | 895,931 | $ | 530,790 | $ | 124,140 | $ | 8,486 | $ | 9,782 | ||||||||||
| Nonperforming assets to total assets |
9.08 | % | 4.77 | % | 1.11 | % | 0.13 | % | 0.14 | % | ||||||||||
| Nonperforming loans to loans |
11.65 | % | 5.89 | % | 1.37 | % | 0.12 | % | 0.20 | % | ||||||||||
| Nonperforming loans carried at fair value to total nonperforming loans |
78.4 | % | 55.9 | % | N/A | N/A | N/A | |||||||||||||
| Charge-offs to gross nonperforming loans |
41.6 | % | 35.9 | % | N/A | N/A | N/A | |||||||||||||
| Loan loss allowance to nonperforming loans |
38.3 | % | 39.3 | % | 89.4 | % | 917.4 | % | 531.9 | % | ||||||||||
| Loan loss allowance to nonperforming loans excluding loans carried at fair value |
163.5 | % | 89.0 | % | 89.4 | % | 917.4 | % | 531.9 | % | ||||||||||
As of December 31, 2009, Sterling has recognized confirmed losses totaling $500.2 million on collateral dependent nonperforming loans held in its portfolio. These confirmed losses have written down the carrying value of these loans to the appraisal value of their underlying collateral. The loan loss coverage ratio, excluding these loans for which the full loss to date has been charged off, was 163.5% of nonperforming loans at December 31, 2009. Further declines in real estate appraisal values could result in additional losses on these loans. Prior to 2008, Sterling set aside specific reserves for its nonperforming loans, and did not record confirmed losses until foreclosure.
| TX16 |
Table of Contents
The following table describes nonperforming assets by asset type at the dates indicated:
| December 31, | |||||||||||||||
| 2009 | 2008 | 2007 | 2006 | 2005 | |||||||||||
| (Dollars in thousands) | |||||||||||||||
| Residential real estate |
$ | 71,642 | $ | 46,043 | $ | 1,557 | $ | 1,729 | $ | 856 | |||||
| Multifamily real estate |
20,478 | 4,757 | 2,268 | 3,356 | 4,302 | ||||||||||
| Commercial real estate |
69,540 | 7,753 | 1,418 | 1,340 | 2,579 | ||||||||||
| Construction: |
|||||||||||||||
| Residential |
439,478 | 410,338 | 102,373 | 96 | 0 | ||||||||||
| Multifamily |
75,331 | 3,894 | 0 | 0 | 0 | ||||||||||
| Commercial |
167,867 | 70,607 | 3,042 | 0 | 0 | ||||||||||
| Total construction |
682,676 | 484,839 | 105,415 | 96 | 0 | ||||||||||
| Consumer—direct |
5,803 | 5,053 | 1,716 | 1,069 | 821 | ||||||||||
| Consumer—indirect |
806 | 700 | 836 | 154 | 164 | ||||||||||
| Commercial banking |
136,464 | 61,520 | 22,005 | 4,794 | 1,839 | ||||||||||
| Total nonperforming assets |
$ | 987,409 | $ | 610,665 | $ | 135,215 | $ | 12,538 | $ | 10,561 | |||||
Weakness in the overall economy has contributed to increased levels of nonperforming assets. Recent increases in nonperforming assets have been driven by increases in nonperforming construction, commercial real estate, and commercial banking loans.
At the applicable foreclosure date, other real estate owned is recorded at the fair value of the real estate, less the costs to sell the real estate. The carrying value of OREO is regularly evaluated and, if necessary, an allowance is established to reduce the carrying value to net realizable value. The following table sets forth the activity in Sterling’s OREO for the periods indicated:
| Years Ended December 31, | ||||||||||||
| 2009 | 2008 | 2007 | ||||||||||
| (Dollars in thousands) | ||||||||||||
| Balance at beginning of period |
$ | 62,320 | $ | 11,075 | $ | 4,052 | ||||||
| Loan foreclosures and other additions |
201,005 | 124,610 | 11,418 | |||||||||
| Loss at foreclosure |
(44,556 | ) | (43,710 | ) | (3,166 | ) | ||||||
| Improvements and other changes |
1,654 | (1,819 | ) | 119 | ||||||||
| Sales |
(106,130 | ) | (10,208 | ) | (1,348 | ) | ||||||
| Provisions for losses |
(31,021 | ) | (17,628 | ) | 0 | |||||||
| Balance at end of period |
$ | 83,272 | $ | 62,320 | $ | 11,075 | ||||||
Allowance for Credit Losses. Sterling regularly reviews its classified assets for impairment. If a loan is determined to be impaired, Sterling performs a valuation analysis on the loan. Valuation analysis compares the fair value (market value less selling costs, foreclosure costs and projected holding costs), and the book balance (loan principal and accrued interest or carrying value of OREO). For loans that are considered collateral dependent, the difference between the fair value and the book value is charged off as a confirmed loss. For certain non-collateral dependent loans, Sterling establishes
| TX17 |
Table of Contents
a specific reserve for the difference between fair value and book value of these loans, as the loss is not defined as a confirmed loss because it is not based solely on collateral values. Allowances are established and periodically adjusted, if necessary, based on the review of information obtained through on-site inspections, market analysis, appraisals and purchase offers. During the fourth quarter of 2009, primarily as a result of the large decline in real estate values during 2009, Sterling began to record a specific reserve for impaired loans for which an updated valuation analysis has not been completed within the last quarter. The specific reserve is calculated by applying an estimated market adjustment to each loan based on market and property type.
Sterling maintains an allowance for credit losses at a level deemed appropriate by management to adequately provide for probable losses related to specifically identified loans and probable losses in the remaining portfolio, as well as unfunded commitments. The allowance is based upon historical loss experience, loan migration analysis, delinquency trends, portfolio size, concentrations of risk, prevailing and anticipated economic conditions, industry experience, estimated collateral values, management’s assessment of credit risk inherent in the portfolio, specific problem loans and other relevant factors. The portfolio is grouped into standard industry categories for homogeneous loans based on characteristics such as loan type, borrower and collateral. Annual and quarterly loan migration to loss data is used to determine the probability of default. Historically, Sterling had used both one-year and three-year losses to establish the expected loss rate on loans. During the fourth quarter of 2009, as a result of the higher loss rates experienced during 2009, Sterling began using loss experience from the most recent twelve months to estimate the amount that would be lost if a default were to occur, which is termed the loss given default. The probability of default is multiplied by the loss given default to calculate the expected losses for each loan category.
Additions to the allowance, in the form of provisions, are reflected in current operating results, while charge-offs to the allowance are made when a loss is determined to be a confirmed loss. Because the allowance for credit losses is based on estimates, ultimate losses may materially differ from the estimates. See Note 4 of “Notes to Consolidated Financial Statements.”
| TX18 |
Table of Contents
Management believes that the allowance for credit losses is adequate given the composition and risks of the loan portfolios, although there can be no assurance that the allowance will be adequate to cover all contingencies. The following table sets forth information regarding changes in Sterling’s allowance for estimated credit losses for the periods indicated:
| Years Ended December 31, | ||||||||||||||||||||
| 2009 | 2008 | 2007 | 2006 | 2005 | ||||||||||||||||
| (Dollars in thousands) | ||||||||||||||||||||
| Allowance—loans, January 1 |
$ | 208,365 | $ | 111,026 | $ | 77,849 | $ | 52,034 | $ | 47,352 | ||||||||||
| Charge-offs: |
||||||||||||||||||||
| Residential real estate |
(31,401 | ) | (6,187 | ) | (30 | ) | (32 | ) | (37 | ) | ||||||||||
| Multifamily real estate |
(3,510 | ) | (1,806 | ) | 0 | 0 | (3 | ) | ||||||||||||
| Commercial real estate |
(50,733 | ) | (17,023 | ) | (70 | ) | (902 | ) | (2,315 | ) | ||||||||||
| Construction |
(420,539 | ) | (168,471 | ) | (3,430 | ) | (12 | ) | (19 | ) | ||||||||||
| Consumer—direct |
(9,652 | ) | (4,053 | ) | (1,268 | ) | (619 | ) | (1,107 | ) | ||||||||||
| Consumer—indirect |
(5,744 | ) | (5,864 | ) | (1,884 | ) | (823 | ) | (449 | ) | ||||||||||
| Commercial banking |
(45,085 | ) | (19,920 | ) | (1,000 | ) | (2,017 | ) | (5,721 | ) | ||||||||||
| Total charge-offs |
(566,664 | ) | (223,324 | ) | (7,682 | ) | (4,405 | ) | (9,651 | ) | ||||||||||
| Recoveries: |
||||||||||||||||||||
| Residential real estate |
306 | 66 | 5 | 5 | 6 | |||||||||||||||
| Multifamily real estate |
5 | 0 | 0 | 0 | 0 | |||||||||||||||
| Commercial real estate |
348 | 69 | 41 | 157 | 42 | |||||||||||||||
| Construction |
6,803 | 221 | 3 | 20 | 0 | |||||||||||||||
| Consumer—direct |
364 | 272 | 261 | 193 | 238 | |||||||||||||||
| Consumer—indirect |
1,303 | 1,370 | 495 | 310 | 200 | |||||||||||||||
| Commercial banking |
1,875 | 80 | 128 | 68 | 86 | |||||||||||||||
| Total recoveries |
11,004 | 2,078 | 933 | 753 | 572 | |||||||||||||||
| Net charge-offs |
(555,660 | ) | (221,246 | ) | (6,749 | ) | (3,652 | ) | (9,079 | ) | ||||||||||
| Provision |
690,738 | 318,585 | 24,632 | 16,312 | 13,761 | |||||||||||||||
| Acquired |
0 | 0 | 15,294 | 13,155 | 0 | |||||||||||||||
| Allowance—loans, December 31 |
343,443 | 208,365 | 111,026 | 77,849 | 52,034 | |||||||||||||||
| Allowance—unfunded commitments, January 1 |
21,334 | 6,306 | 5,840 | 3,449 | 2,010 | |||||||||||||||
| Provision |
(9,367 | ) | 15,074 | 466 | 2,391 | 1,439 | ||||||||||||||
| Amounts written off |
0 | (46 | ) | 0 | 0 | 0 | ||||||||||||||
| Allowance—unfunded commitments, December 31 |
11,967 | 21,334 | 6,306 | 5,840 | 3,449 | |||||||||||||||
| Balance at end of period |
$ | 355,410 | $ | 229,699 | $ | 117,332 | $ | 83,689 | $ | 55,483 | ||||||||||
| Allowances allocated to specific reserve loans |
$ | 27,129 | $ | 1,980 | $ | 8,678 | $ | 1,379 | $ | 2,159 | ||||||||||
| Ratio of net charge-offs to average loans outstanding during the period |
6.17 | % | 2.37 | % | 0.08 | % | 0.06 | % | 0.20 | % | ||||||||||
| TX19 |
Table of Contents
During 2008 and 2009, Sterling increased its provision for credit losses in response to an increase in the level of classified loans and charge-offs, with higher loss rates related to the decline in collateral values, particularly in the Construction, Commercial Real Estate and Residential Real Estate portfolios.
The following table sets forth the loan loss allowance by category and summarizes the percentage of total loans in each category to total loans:
| December 31, | |||||||||||||||||||||||||
| 2009 | 2008 | 2007 | 2006 | 2005 | |||||||||||||||||||||
| Allowance Amount |
Loans in Category as a Percentage of Total Loans |
Allowance Amount |
Loans in Category as a Percentage of Total Loans |
Allowance Amount |
Loans in Category as a Percentage of Total Loans |
Allowance Amount |
Loans in Category as a Percentage of Total Loans |
Allowance Amount |
Loans in Category as a Percentage of Total Loans | ||||||||||||||||
| (Dollars in thousands) | |||||||||||||||||||||||||
| Residential real estate |
$ | 28,319 | 10.9 | $ | 8,147 | 9.6 | $ | 965 | 7.8 | $ | 1,405 | 9.2 | $ | 1,039 | 9.9 | ||||||||||
| Multifamily real estate |
8,984 | 6.7 | 4,795 | 5.3 | 659 | 4.3 | 671 | 3.7 | 790 | 6.7 | |||||||||||||||
| Commercial real estate |
69,487 | 18.2 | 24,720 | 15.1 | 21,244 | 13.5 | 17,565 | 11.2 | 12,748 | 16.0 | |||||||||||||||
| Construction |
185,222 | 19.7 | 118,279 | 28.1 | 50,109 | 32.4 | 12,098 | 32.2 | 4,566 | 20.6 | |||||||||||||||
| Consumer—direct |
13,544 | 10.3 | 7,207 | 9.5 | 7,274 | 8.8 | 8,205 | 10.5 | 6,795 | 12.5 | |||||||||||||||
| Consumer—indirect |
5,654 | 4.3 | 7,401 | 4.3 | 5,056 | 4.1 | 2,880 | 4.1 | 1,205 | 3.4 | |||||||||||||||
| Commercial banking |
31,945 | 29.9 | 29,019 | 28.1 | 23,830 | 29.1 | 34,209 | 29.1 | 23,626 | 30.9 | |||||||||||||||
| Unallocated |
288 | N/A | 8,797 | N/A | 1,889 | N/A | 816 | N/A | 1,265 | N/A | |||||||||||||||
| $ | 343,443 | 100.0 | $ | 208,365 | 100.0 | $ | 111,026 | 100.0 | $ | 77,849 | 100.0 | $ | 52,034 | 100.0 | |||||||||||
In response to higher charge-offs and loss rates experienced during 2009, Sterling has increased its loan loss allowance on Construction, Commercial Real Estate and Residential Real Estate loans.
| TX20 |
Table of Contents
Investments and Mortgage-Backed Securities
Investments and MBS that management has the positive intent and ability to hold to maturity are classified as held to maturity and carried at amortized cost. At December 31, 2009 and 2008, investments classified as held to maturity were $17.6 million and $175.9 million, respectively. See “MD&A—Critical Accounting Policies—Investments and MBS.”
At December 31, 2009 and 2008, investments and MBS classified as available for sale were $2.16 billion and $2.64 billion, respectively. The carrying value of these investments and MBS at December 31, 2009 includes net unrealized gains of $25.8 million, compared with net unrealized losses of $28.4 million as of December 31, 2008. Fluctuations in prevailing interest rates continue to cause volatility in this component of accumulated comprehensive income and may continue to do so in future periods. See “MD&A—Critical Accounting Policies—Investments and MBS.”
Sterling invests primarily in MBS issued by the Federal Home Mortgage Corporation (“FHLMC”), the Federal National Mortgage Corporation (“FNMA”) and the Government National Mortgage Association (“GNMA”), and has limited investments in other non-agency obligations. Such investments provide Sterling with a relatively liquid source of interest income and collateral, which can be used to secure borrowings. Sterling invests primarily in investment-grade investments and MBS. See “MD&A—Results of Operations—Non-Interest Income and Non-Interest Expense” and Note 2 of “Notes to Consolidated Financial Statements.”
The following table provides the carrying values, contractual maturities and weighted average yields of Sterling’s investment and MBS portfolio at December 31, 2009. Actual maturities may differ from the contractual maturities, because issuers may have the right to call or prepay obligations with or without prepayment penalties.
| Maturity | ||||||||||||||||||||
| Less than One Year |
One to Five Years |
Over Five to Ten Years |
Over Ten Years |
Total | ||||||||||||||||
| (Dollars in thousands) | ||||||||||||||||||||
| Mortgage-backed securities |
||||||||||||||||||||
| Balance |
$ | 175 | $ | 0 | $ | 100,085 | $ | 1,844,729 | $ | 1,944,989 | ||||||||||
| Weighted average yield |
0.00 | % | 0.00 | % | 4.49 | % | 4.47 | % | 4.47 | % | ||||||||||
| Municipal bonds |
||||||||||||||||||||
| Balance |
$ | 203 | $ | 1,154 | $ | 20,505 | $ | 173,420 | $ | 195,282 | ||||||||||
| Weighted average yield (1) |
2.89 | % | 2.60 | % | 5.14 | % | 4.39 | % | 4.46 | % | ||||||||||
| Other |
||||||||||||||||||||
| Balance |
$ | 750 | $ | 0 | $ | 0 | $ | 36,950 | $ | 37,700 | ||||||||||
| Weighted average yield |
0.00 | % | 0.00 | % | 0.00 | % | 1.13 | % | 1.11 | % | ||||||||||
| Total carrying value |
$ | 1,128 | $ | 1,154 | $ | 120,590 | $ | 2,055,099 | $ | 2,177,971 | ||||||||||
| Weighted average yield |
0.52 | % | 2.60 | % | 4.60 | % | 4.40 | % | 4.41 | % | ||||||||||
| (1) | The weighted average yields on municipal bonds reflect the actual yields on the bonds and are not presented on a tax-equivalent basis. |
| TX21 |
Table of Contents
The following table sets forth the carrying values and classifications for financial statement reporting purposes of Sterling’s investment and MBS portfolio at the dates indicated:
| December 31, | ||||||||||||
| 2009 | 2008 | 2007 | ||||||||||
| (Dollars in thousands) | ||||||||||||
| Mortgage-backed securities |
$ | 1,944,989 | $ | 2,420,012 | $ | 1,785,031 | ||||||
| U.S. government and agency obligations |
0 | 0 | 9,994 | |||||||||
| Municipal bonds |
195,282 | 260,873 | 143,063 | |||||||||
| Short term commercial paper |
0 | 99,117 | 0 | |||||||||
| Other |
37,700 | 35,118 | 47,976 | |||||||||
| Total |
$ | 2,177,971 | $ | 2,815,120 | $ | 1,986,064 | ||||||
| Available for sale |
$ | 2,160,325 | $ | 2,639,290 | $ | 1,853,271 | ||||||
| Held to maturity |
17,646 | 175,830 | 132,793 | |||||||||
| Total |
$ | 2,177,971 | $ | 2,815,120 | $ | 1,986,064 | ||||||
| Weighted average yield |
4.41 | % | 5.19 | % | 4.95 | % | ||||||
General. Sterling’s primary sources of funds are: customer deposits; wholesale funds from the Federal Home Loan Bank (“FHLB”) and the Federal Reserve; and the collection of principal and interest primarily from loans, as well as from mortgage backed securities. Additionally, loans are sold into the secondary market in connection with Sterling’s mortgage banking activities. The availability and volume of these funds are influenced significantly by prevailing interest rates and other economic conditions, as well as regulatory statutes. Borrowings may be used on a short-term basis to compensate for reductions in other sources of funds (such as deposit inflows at less than projected levels). Borrowings may also be used on a longer-term basis to support expanded lending activities and to match repricing intervals of assets. See “—Lending Activities” and “—Investments and Mortgage-Backed Securities.”
Deposit Activities. Sterling offers a wide variety of deposit products and related services to businesses, individuals, and public sector entities throughout its primary market areas. Deposit accounts include transaction (checking) accounts, savings accounts, money market demand accounts (“MMDA”), and certificates of deposit (“CDs”) accounts. These deposit products and services are marketed by its 178 depository banking offices and each of its private and commercial banking offices. Sterling offers both interest- and non-interest-bearing checking accounts, MMDA, CDs and savings accounts that earn interest at rates established by management and are based on a competitive market analysis, as well as regulatory guidelines. The method of compounding varies from simple interest credited at maturity to daily compounding, depending on the type of account.
With the exception of certain promotional CDs and variable-rate products, most CDs carry a fixed rate of interest for a defined term from the opening date of the account. Penalties are imposed if principal is withdrawn from most CDs prior to maturity.
Sterling competes with other financial institutions and financial intermediaries in attracting deposits. There is strong competition for transaction, money market and time deposit balances from commercial banks, credit unions and nonbank corporations, such as securities brokerage companies, mutual funds and other diversified companies, some of which have nationwide networks of offices. Much of Sterling’s marketing efforts have been directed toward attracting additional deposit customer relationships and balances. Sterling provides electronic banking products, including debit card, online Internet banking, bill pay, merchant services and treasury
| TX22 |
Table of Contents
management services, which include remote deposit capture. All of these products and services are intended to enhance customer relationships and attract and increase retail deposit balances.
Sterling has 168 automated teller machines (“ATM”). Customers also can access ATMs operated by other financial institutions. Sterling is a member of the Plus System ATM network that allows participating customers to deposit or withdraw funds from transaction accounts, MMDA and savings accounts at numerous locations in the United States and internationally.
Sterling supplements its retail deposit gathering by soliciting funds from public entities and, prior to the SSB Consent Agreement, through the acquisition of brokered deposits. Since Sterling Savings Bank is no longer deemed to be well capitalized, it must comply with limitations on the interest rate that can be paid on retail deposits, and cannot accept or renew brokered deposits. Public funds are generally obtained by competitive bidding among qualifying financial institutions. Public funds were 11% and 10% of deposits at December 31, 2009 and 2008, respectively. Brokered deposits were 14% and 18% of deposits at December 31, 2009 and 2008, respectively. In 2009, certain states increased the collateralization requirements for uninsured public deposits. The increased collateralization requirements required Sterling to pledge additional collateral, which reduced Sterling’s collateral available for liquidity.
The following table presents the average balance outstanding and weighted average interest rate paid for each major category of deposits for the periods indicated:
| Years Ended December 31, | ||||||||||||||||||
| 2009 | 2008 | 2007 | ||||||||||||||||
| Average Balance |
Weighted Average Interest Rate |
Average Balance |
Weighted Average Interest Rate |
Average Balance |
Weighted Average Interest Rate |
|||||||||||||
| (Dollars in thousands) | ||||||||||||||||||
| Transaction accounts: |
||||||||||||||||||
| Interest-bearing |
$ | 844,154 | 0.30 | % | $ | 441,708 | 0.31 | % | $ | 463,337 | 0.55 | % | ||||||
| Noninterest-bearing |
980,021 | 0.00 | 880,224 | 0.00 | 895,729 | 0.00 | ||||||||||||
| Savings and MMDA |
1,758,678 | 0.91 | 2,173,133 | 2.13 | 2,078,984 | 3.45 | ||||||||||||
| Time deposits |
4,718,946 | 3.20 | 4,553,160 | 4.10 | 4,039,152 | 5.04 | ||||||||||||
| $ | 8,301,799 | 2.04 | % | $ | 8,048,225 | 2.91 | % | $ | 7,477,202 | 3.71 | % | |||||||
The following table shows the amounts and remaining maturities of time deposits that had balances of $100,000 or more at December 31, 2009 and 2008:
| December 31, | ||||||
| 2009 | 2008 | |||||
| (Dollars in thousands) | ||||||
| Three months or less |
$ | 374,185 | $ | 535,399 | ||
| After three months through six months |
198,309 | 297,665 | ||||
| After six months through twelve months |
417,420 | 648,334 | ||||
| After twelve months |
600,190 | 253,489 | ||||
| $ | 1,590,104 | $ | 1,734,887 | |||
| TX23 |
Table of Contents
Borrowings. Deposit accounts are Sterling’s primary source of funds. Sterling does, however, use wholesale funds to supplement its funding requirements and to meet deposit withdrawal requirements. These borrowings include advances from the FHLB, reverse repurchase agreements, primary credits and term auction facilities from the Federal Reserve, as well as federal funds purchased. During 2009, these borrowings decreased as Sterling reduced the level of total assets to manage its capital position. See “MD&A—Liquidity and Capital Resources.”
The FHLB of Seattle is part of a system that consists of 12 regional Federal Home Loan Banks that provide credit to financial institutions. As a condition of membership in the FHLB of Seattle, Sterling’s subsidiary banks are required to own stock of the FHLB of Seattle in an amount determined by a formula based upon the larger of their total qualifying mortgages and MBS, or total advances from the FHLB of Seattle. At December 31, 2009, Sterling Savings Bank and Golf Savings Bank held more than the minimum FHLB of Seattle stock ownership requirement.
As members of the FHLB of Seattle, Sterling Savings Bank and Golf Savings Bank can apply for collateralized borrowings using certain loans or securities, provided certain standards related to creditworthiness are met. Each available credit product has its own interest rate and range of maturities. At December 31, 2009, Sterling had advances totaling $1.24 billion from the FHLB of Seattle, which mature from 2010 through 2018. At December 31, 2009, the interest rates ranged from 0.11% to 8.08%. Additionally, as of December 31, 2009, Sterling had $100.2 million of advances from the FHLB of San Francisco, which were assumed in the Northern Empire acquisition. Sterling, as a non member shareholder, does not have access to additional funds from the FHLB of San Francisco. At December 31, 2009 and December 31, 2008, Sterling’s credit lines with the FHLB of Seattle represented a total borrowing capacity of $2.43 billion and $2.92 billion, of which $967.5 million and $1.33 billion was available, respectively. In the first quarter of 2010, Sterling Savings Bank started transitioning from a blanket pledge collateral agreement with the FHLB of Seattle to a custodial agreement. Additionally, Sterling’s future borrowings from the FHLB of Seattle are limited to overnight cash management advances (“CMA”), which automatically rollover each day. Sterling Savings Bank has the ability to increase or decrease the CMA borrowings on a daily basis.
The economic difficulties that have plagued the financial markets during this business cycle had a significant impact on the Federal Home Loan Banks. Given the negative impacts from other-than-temporary impairment (“OTTI”) charges on certain non-agency MBS and the current market uncertainty, both the FHLB of Seattle and the FHLB of San Francisco announced that they would cease paying dividends and would not redeem or repurchase capital stock. Both the FHLB of Seattle and the FHLB of San Francisco also announced that they would monitor their capital levels, the OTTI issue, overall financial performance and developments in the financial markets as a basis for determining the status of dividends and capital stock redemptions or repurchases in future quarters. The FHLB of Seattle, Sterling’s current source of FHLB advances, continues to provide Sterling with a readily available source of liquidity, although there can be no assurance that this will always be the case. See “MD&A—Liquidity and Capital Resources” and Note 9 of “Notes to Consolidated Financial Statements.”
Sterling also borrows funds under reverse repurchase agreements with major broker/dealers and financial entities pursuant to which it sells investments (generally, U.S. agency obligations and MBS) under an agreement to buy them back at a specified price at a later date. These agreements to repurchase are deemed to be borrowings collateralized by the investments and MBS sold. Sterling uses these borrowings to supplement deposit gathering for funding the origination of loans. Sterling had $1.03 billion and $1.09 billion in wholesale and retail reverse repurchase agreements outstanding at December 31, 2009 and 2008, respectively. The use of reverse repurchase agreements may expose Sterling to certain risks not associated with other borrowings, including interest rate risk and the possibility that additional collateral may have to be provided if the market value of the pledged collateral declines. Sterling may be required to repay these borrowings prior to maturity, with penalties, if an event of default has been deemed to have occurred. At December 31, 2009, Sterling was not “well capitalized,” which may trigger an event of default under certain of these borrowings. See
| TX24 |
Table of Contents
“MD&A—Asset and Liability Management,” “MD&A—Liquidity and Capital Resources” and Note 10 of “Notes to Consolidated Financial Statements.”
As of December 31, 2009 and 2008, Sterling also had $16.7 million and $69.0 million, respectively, of funds from the Federal Reserve discount window, which are short-term borrowings. Sterling uses this source of funds to the extent that these funds are more competitive than other sources. In 2008, in an effort to increase liquidity, the Federal Reserve, among other measures, lowered the rate on the funds that are available from its discount window to 25 basis points above the federal funds target rate. In February 2010, the Federal Reserve increased the discount rate, for the first time since June 2006, by 25 basis points to 75 basis points.
The following table sets forth certain information regarding Sterling’s short-term borrowings as of and for the periods indicated:
| Years Ended December 31, | ||||||||||||
| 2009 | 2008 | 2007 | ||||||||||
| (Dollars in thousands) | ||||||||||||
| Maximum amount outstanding at any month-end during the period: |
||||||||||||
| Short-term reverse repurchase agreements and funds purchased |
$ | 60,465 | $ | 118,343 | $ | 288,845 | ||||||
| Short-term advances |
653,000 | 594,614 | 826,045 | |||||||||
| Average amount outstanding during the period: |
||||||||||||
| Short-term reverse repurchase agreements and funds purchased |
$ | 43,027 | $ | 100,924 | $ | 158,852 | ||||||
| Short-term advances |
613,520 | 444,806 | 539,635 | |||||||||
| Weighted average interest rate paid during the period: |
||||||||||||
| Short-term reverse repurchase agreements and funds purchased |
4.09 | % | 1.51 | % | 4.62 | % | ||||||
| Short-term advances |
2.68 | % | 3.76 | % | 5.19 | % | ||||||
| Weighted average interest rate paid at end of period: |
||||||||||||
| Short-term reverse repurchase agreements and funds purchased |
0.50 | % | 2.03 | % | 4.31 | % | ||||||
| Short-term advances |
1.63 | % | 3.87 | % | 4.48 | % | ||||||
The following table sets forth certain information concerning Sterling’s outstanding borrowings for the periods indicated:
| December 31, | ||||||||||||||||||
| 2009 | 2008 | 2007 | ||||||||||||||||
| Amount | % | Amount | % | Amount | % | |||||||||||||
| (Dollars in thousands) | ||||||||||||||||||
| FHLB advances: |
||||||||||||||||||
| Short-term |
$ | 635,182 | 24.1 | $ | 548,819 | 17.5 | $ | 399,617 | 12.7 | |||||||||
| Long-term |
701,985 | 26.6 | 1,177,730 | 37.5 | 1,288,372 | 41.0 | ||||||||||||
| Securities sold subject to reverse repurchase agreements and funds purchased: |
||||||||||||||||||
| Short-term |
49,146 | 1.9 | 163,023 | 5.2 | 288,845 | 9.2 | ||||||||||||
| Long-term |
1,000,000 | 38.0 | 1,000,000 | 31.9 | 890,000 | 28.4 | ||||||||||||
| Trust Preferred Securities |
245,281 | 9.3 | 245,276 | 7.8 | 270,015 | 8.6 | ||||||||||||
| Other |
3,000 | 0.1 | 3,000 | 0.1 | 3,000 | 0.1 | ||||||||||||
| Total borrowings |
$ | 2,634,594 | 100.0 | $ | 3,137,848 | 100.0 | $ | 3,139,849 | 100.0 | |||||||||
| Weighted average interest rate at end of period |
2.68 | % | 3.34 | % | 4.63 | % | ||||||||||||
| TX25 |
Table of Contents
Sterling’s principal operating subsidiaries are Sterling Savings Bank and Golf Savings Bank. Sterling Savings Bank’s principal subsidiary is INTERVEST. Additionally, Sterling and Sterling Savings Bank have the following other wholly owned, direct subsidiaries:
Sterling Financial Corporation.
| (1) | Golf Escrow Corporation was acquired in July 2006 and offers a full range of escrow closing services. |
| (2) | Sterling Capital Trust III (“SCT-III”) was organized in April 2003 as a Delaware business trust. Sterling owns all the common equity of SCT-III. The sole asset of SCT-III is the Junior Subordinated Debentures-III issued by Sterling. See Note 11 of “Notes to Consolidated Financial Statements.” |
| (3) | Sterling Capital Trust IV (“SCT-IV”) was organized in May 2003 as a Delaware business trust. Sterling owns all the common equity of SCT-IV. The sole asset of SCT-IV is the Junior Subordinated Debentures-IV issued by Sterling. See Note 11 of “Notes to Consolidated Financial Statements.” |
| (4) | Sterling Capital Statutory Trust V (“SCT-V”) was organized in May 2003 as a Connecticut business trust. Sterling owns all the common equity of SCT-V. The sole asset of SCT-V is the Junior Subordinated Debentures -V issued by Sterling. See Note 11 of “Notes to Consolidated Financial Statements.” |
| (5) | Sterling Capital Trust VI (“SCT-VI”) was organized in June 2003 as a Delaware business trust. Sterling owns all the common equity of SCT-VI. The sole asset of SCT-VI is the Junior Subordinated Debentures-VI issued by Sterling. See Note 11 of “Notes to Consolidated Financial Statements.” |
| (6) | Sterling Capital Trust VII (“SCT-VII”) was organized in June 2006 as a Delaware business trust. Sterling owns all the common equity of SCT-VII. The sole asset of SCT-VII is the Junior Subordinated Debentures-VII issued by Sterling. See Note 11 of “Notes to Consolidated Financial Statements.” |
| (7) | Sterling Capital Trust VIII (“SCT-VIII”) was organized in September 2006 as a Delaware business trust. Sterling owns all the common equity of SCT-VIII. The sole asset of SCT-VIII is the Junior Subordinated Debentures-VIII issued by Sterling. See Note 11 of “Notes to Consolidated Financial Statements.” |
| (8) | Sterling Capital Trust IX (“SCT-IX”) was organized in July 2006 as a Delaware business trust. Sterling owns all the common equity of SCT-IX. The sole asset of SCT-IX is the Junior Subordinated Debentures-IX issued by Sterling. See Note 11 of “Notes to Consolidated Financial Statements.” |
| (9) | Klamath First Capital Trust I (“KCT-I”) was organized in July 2001 as a Delaware business trust. Sterling owns all the common equity of KCT-I. The sole asset of KCT-I is the Junior Subordinated Debentures-I issued by KFBI and assumed by Sterling. See Note 11 of “Notes to Consolidated Financial Statements.” |
| (10) | Lynnwood Financial Statutory Trust I (“LCT-I”) was organized in March 2004 as a Connecticut business trust. Sterling owns all the common equity of LCT-I. The sole asset of LCT-I is the Junior Subordinated Debentures-I issued by Lynnwood and assumed by Sterling. See Note 11 of “Notes to Consolidated Financial Statements.” |
| (11) | Lynnwood Financial Statutory Trust II (“LCT-II”) was organized in June 2006 as a Delaware business trust. Sterling owns all the common equity of LCT-II. The sole asset of LCT-II is the Junior Subordinated Debentures-II issued by Lynnwood and assumed by Sterling. See Note 11 of “Notes to Consolidated Financial Statements.” |
| (12) | Tri-Cities Mortgage Corporation was organized to engage in real estate development. |
Sterling Savings Bank.
| (1) | Action Mortgage Company was organized to originate residential loans. During 2008, its operations were realigned into the real estate division of Sterling Savings Bank. |
| (2) | The Dime Service Corporation was acquired as part of a merger in February 2004. The corporation was organized to provide |
| TX26 |
Table of Contents
| commercial and consumer insurance products and is currently inactive. |
| (3) | Evergreen Environmental Development Corporation was organized to engage in real estate development and is currently inactive. |
| (4) | Evergreen First Service Corporation owns all of the outstanding capital stock of Sterling Savings Banc Financial Services, Inc. |
| (5) | Sterling Savings Banc Financial Services, Inc., formerly known as Harbor Financial Services, Inc., offers wealth management services. |
| (6) | Fidelity Service Corporation acts as a trustee in the reconveyance of deeds of trust originated by Sterling Savings Bank and Action. |
| (7) | Mason-McDuffie Financial Corporation, a subsidiary of INTERVEST, conducts mortgage banking operations. |
| (8) | Peter W. Wong Associates, Inc. was organized to offer alternative financial services, and is currently inactive. |
| (9) | Source Capital Corporation was acquired in September 2001. The corporation was organized to hold and service loans, and is currently inactive. |
| (10) | Source Capital Leasing Corporation was acquired in September 2001. The corporation was organized to engage in corporate leasing and is currently inactive. |
Sterling faces strong competition, both in attracting deposits and in originating, purchasing and selling loans, from commercial banks, savings and loan associations, mutual savings banks, credit unions and other institutions, many of which have greater resources than Sterling. Sterling also faces strong competition in marketing financial products such as annuities, mutual funds and other financial products and in pursuing acquisition opportunities. Some or all of these competitive businesses operate in Sterling’s market areas.
As of December 31, 2009, Sterling, including its subsidiaries, had 2,641 full-time equivalent employees. Employees are not represented by a collective bargaining unit. Sterling believes it has good relations with its employees.
Environmentally related hazards have become a source of high risk and potentially unlimited liability for financial institutions relative to their loans. Environmentally contaminated properties owned by an institution’s borrowers may result in a drastic reduction in the value of the collateral securing the institution’s loans to such borrowers, high environmental clean-up costs to the borrower affecting its ability to repay the loans, the subordination of any lien in favor of the institution to a state or federal lien securing clean-up costs, and liability to the institution for clean-up costs if it forecloses on the contaminated property or becomes involved in the management of the borrower. To minimize this risk, Sterling may require an environmental examination and report with respect to the property of any borrower or prospective borrower if circumstances affecting the property indicate a potential for contamination, taking into consideration the potential loss to the institution in relation to the burdens to the borrower. This examination must be performed by an engineering firm experienced in environmental risk studies and acceptable to the institution, with the costs of such examinations and reports being the responsibility of the borrower. These costs may be substantial and may deter a prospective borrower from entering into a loan transaction with Sterling. Sterling is not aware of any borrower who is currently subject to any environmental investigation or clean-up proceeding that is likely to have a material adverse effect on the financial condition or results of operations of Sterling.
| TX27 |
Table of Contents
The following is not intended to be a complete discussion but is intended to be a summary of some of the more significant provisions of laws applicable to Sterling and its subsidiaries. This regulatory framework is intended to protect depositors, federal deposit insurance funds and the banking system as a whole, and not to protect security holders. To the extent that the information describes statutory and regulatory provisions, it is qualified in its entirety by reference to those provisions. Further, such statutes, regulations and policies are continually under review by Congress and state legislatures, and federal and state regulatory agencies. A change in statutes, regulations or regulatory policies applicable to Sterling, including changes in interpretation or implementation thereof, could have a material effect on Sterling’s business.
General
Sterling is a bank holding company and as such is subject to comprehensive examination and regulation by the Federal Reserve. Sterling Savings Bank is a Washington State-chartered commercial bank and Golf Savings Bank is a Washington State-chartered savings bank. The deposits of both banks are insured by the FDIC. Sterling Savings Bank and Golf Savings Bank are subject to comprehensive regulation, examination and supervision by the FDIC and the WDFI. Furthermore, certain transactions and savings deposits are subject to regulations and controls promulgated by the Federal Reserve. Sterling’s subsidiaries are also subject to regulation by the applicable federal and state agencies for the states in which they conduct business.
These laws and regulations could restrict Sterling’s ability to diversify into other areas of financial services, acquire depository institutions, and pay dividends on its capital stock. Sterling may also be required to provide financial support to one or more of its subsidiary banks, maintain capital balances in excess of those desired by management, and pay higher deposit insurance premiums as a result of a general deterioration in the financial condition of depository institutions.
Recent Legislative and Regulatory Initiatives to Address Financial and Economic Crises . The U.S. Congress, the U.S. Department of the Treasury (the “Treasury Department”) and the federal banking regulators, including the FDIC, have taken broad action since early September 2008 to address volatility in the U.S. banking system.
In October 2008, the Emergency Economic Stabilization Act of 2008 (“EESA”) was enacted. The EESA authorizes the Treasury Department to purchase from financial institutions and their holding companies up to $700 billion in mortgage loans, mortgage-related securities and certain other financial instruments, including debt and equity securities issued by financial institutions and their holding companies in the Troubled Assets Relief Program (“TARP”). EESA also increased FDIC deposit insurance on most accounts from $100,000 to $250,000 through December 31, 2013. On January 1, 2014, the standard insurance amount will return to $100,000 per depositor for all account categories except IRAs and other certain retirement accounts, which will remain at $250,000 per depositor.
The purpose of TARP is to restore confidence and stability to the U.S. banking system and to encourage financial institutions to increase their lending to customers and to each other. The Treasury Department initially allocated $250 billion towards the TARP Capital Purchase Program (“CPP”). Under the CPP, the Treasury Department purchases debt or equity securities from participating institutions. The TARP also allows for direct purchases or guarantees of troubled assets of financial institutions. Participants in the CPP are subject to executive compensation limits and are encouraged to expand their lending and mortgage loan modifications. On December 5, 2008, Sterling completed the sale of 303,000 shares of preferred stock and issued a warrant to purchase 6,437,677 shares of Sterling’s common stock to the U.S. Department of the Treasury, raising total proceeds of $303 million. In connection with Sterling’s participation in the CPP, certain executive officers of Sterling entered into amended employment agreements with Sterling.
Following a determination that the banking industry faced systemic risk, the FDIC established a Temporary Liquidity Guarantee Program (“TLGP”) on October 14, 2008. The TLGP includes the Transaction Account Guarantee Program (“TAG”), which provides depositors with unlimited coverage for noninterest bearing transaction accounts at participating FDIC
| TX28 |
Table of Contents
insured institutions. Noninterest bearing checking accounts include Demand Deposit Accounts (“DDAs”) and any transaction account that has unlimited withdrawals and that cannot earn interest. Also included are low interest NOW accounts (NOW accounts that cannot earn more than 0.5% interest) and IOLTA accounts. Coverage under the TAG program is in addition to, and separate from, the coverage available under the FDIC’s standard deposit insurance amount.
When the FDIC first introduced the temporary TAG program, it announced an original expiration date of December 31, 2009 and implemented an annual assessment rate of 10 basis points on the balance of each covered account in excess of $250,000. In August 2009, the FDIC announced a voluntary extension of the TAG program for an additional six months, through June 30, 2010, for any insured depository institution then participating in the program. Sterling is participating in this extension. Effective January 1, 2010, the annual assessment rate that applies to participating institutions during the extension period is either 15 basis points, 20 basis points or 25 basis points, depending on the Risk Category assigned to the institution under the FDIC’s risk-based premium system.
Bank Holding Company Regulation
The Fair and Accurate Credit Transactions Act. In December 2003, the Fair and Accurate Credit Transactions Act of 2003 (the “FACT”) was signed into law. The FACT includes many provisions concerning national credit reporting standards and permits consumers, including Sterling’s customers, to opt out of information sharing among affiliated companies for marketing purposes. The FACT also requires financial institutions to provide consumers certain information regarding the consumer’s credit score. Additionally, financial institutions must notify their customers if they report negative information about them to credit bureaus or if the credit terms offered to a customer are materially less favorable than the most favorable terms offered to a substantial portion of customers because of information in the customer’s credit report. The FACT also contains provisions intended to help detect identity theft.
The Sarbanes-Oxley Act. In July 2002, the Sarbanes-Oxley Act of 2002 (“SOX”) was enacted in response to public concerns regarding corporate accountability. The stated goals of SOX are to increase corporate responsibility, to provide for enhanced penalties for accounting and auditing improprieties at publicly traded companies and to protect investors by improving the accuracy and reliability of corporate disclosures pursuant to the securities laws. SOX represents a comprehensive revision of laws affecting corporate governance, accounting obligations and corporate reporting. SOX generally applies to all companies that file or are required to file periodic reports with the Securities and Exchange Commission (“SEC”) under the Securities Exchange Act of 1934, as amended (“Exchange Act”).
SOX includes new disclosure requirements and corporate governance rules, requires the SEC and securities exchanges to adopt extensive additional disclosure, corporate governance and other related rules, and mandates further studies of certain issues by the SEC and the Comptroller General. In particular, SOX establishes: new requirements for audit committees; additional responsibilities regarding financial statements of reporting companies; new standards for auditors and regulation of audits; increased disclosure and reporting obligations for a reporting company and its directors and executive officers; and new civil and criminal penalties for violation of the securities laws. The SEC has enacted rules to implement various of the provisions with respect to, among other matters, disclosure in periodic filings pursuant to the Exchange Act.
The U.S.A. Patriot Act. In December 2001, the Uniting and Strengthening America by Providing Appropriate Tools Required to Intercept and Obstruct Terrorism Act of 2001 (the “Patriot Act”) became effective. The Patriot Act is designed to combat money laundering and terrorist financing while protecting the U.S. financial system. The Patriot Act imposes enhanced policy, record keeping and due diligence requirements on domestic financial institutions. The Patriot Act also amended the Bank Secrecy Act to facilitate access to customer account information by government officials while immunizing banks from liability for releasing such information.
The Gramm-Leach-Bliley Act. In November 1999, the Gramm-Leach-Bliley Act (the “GLBA”) was
| TX29 |
Table of Contents
enacted. The GLBA is also known as the Financial Services Modernization Act due to its sweeping overhaul of the financial services industry. Enactment of the GLBA allows banks, securities firms and insurance companies to affiliate. The GLBA allows financial institutions to act as financial “supermarkets” offering customers “one stop shopping” for bank accounts, insurance policies and securities transactions.
The GLBA, among other things, provides customers with greater financial privacy by requiring financial institutions to safeguard their nonpublic personal information. Financial institutions must advise customers of their policies regarding sharing nonpublic personal information with non-affiliated third parties and allow customers to “opt-out” of such sharing (subject to several exceptions related mainly to processing customer-initiated transactions and compliance with current law).
The Riegle-Neal Interstate Banking and Branching Efficiency Act. The Riegle-Neal Interstate Banking and Branching Efficiency Act of 1994 (the “Interstate Act”) permits nationwide interstate banking and branching under certain circumstances. This legislation generally authorizes interstate branching and relaxes federal law restrictions on interstate banking. Currently, bank holding companies may purchase banks in any state, and states may not prohibit these purchases. Additionally, banks are permitted to merge with banks in other states, as long as the home state of neither merging bank has opted out under the legislation. The Interstate Act requires regulators to consult with community organizations before permitting an interstate institution to close a branch in a low-income area.
Washington enacted “opting in” legislation in accordance with the Interstate Act, allowing banks to engage in interstate merger transactions, subject to certain “aging” requirements. Washington restricts an out-of-state bank from opening de novo branches. However, once an out-of-state bank has acquired a bank within the state, either through merger or acquisition of all or substantially all of the bank’s assets, the out-of-state bank may open additional branches within the state.
The Bank Holding Company Act. As a bank holding company, Sterling is governed by The Bank Holding Company Act of 1956, as amended (the “BHCA”), and is therefore subject to supervision and examination by the Federal Reserve. Sterling files annual reports of operations with the Federal Reserve.
In general, the BHCA limits bank holding company business to owning or controlling banks and engaging in other banking-related activities. Bank holding companies must obtain the Federal Reserve’s approval before they: (1) acquire direct or indirect ownership or control of any voting shares of any bank that results in total ownership or control, directly or indirectly, of more than 5 percent of the voting shares of such bank; (2) merge or consolidate with another bank holding company; or (3) acquire substantially all of the assets of any additional banks. Subject to certain state laws, such as age and contingency restrictions, a bank holding company that is adequately capitalized and adequately managed may acquire the assets of both in-state and out-of-state banks. With certain exceptions, the BHCA prohibits bank holding companies from acquiring direct or indirect ownership or control of voting shares in any company that is not a bank or a bank holding company unless the Federal Reserve determines that the activities of such company are incidental or closely related to the business of banking. If a bank holding company is well-capitalized and meets certain criteria specified by the Federal Reserve, it may engage de novo in certain permissible non-banking activities without prior Federal Reserve approval.
The Change in Bank Control Act . Pursuant to The Change in Bank Control Act of 1978, as amended, a person (or group of persons acting in concert) acquiring “control” of a bank holding company is required to provide the Federal Reserve with 60 days prior written notice of the proposed acquisition. Following receipt of this notice, the Federal Reserve has 60 days within which to issue a notice disapproving the proposed acquisition, but the Federal Reserve may extend this time period for up to another 30 days. An acquisition may be completed before expiration of the disapproval period if the Federal Reserve issues written notice of its intent not to disapprove the transaction. In addition, any “company” must obtain the Federal Reserve’s approval before acquiring 25% (5% if the “company” is a bank holding company) or more of the outstanding shares or otherwise obtaining control over Sterling.
| TX30 |
Table of Contents
The Federal Reserve Act. Sterling and its subsidiaries are deemed affiliates within the meaning of the Federal Reserve Act, and transactions between affiliates are subject to certain restrictions. Accordingly, Sterling and its subsidiaries must comply with Sections 23A and 23B of the Federal Reserve Act. Sections 23A and 23B (1) limit the extent to which a financial institution or its subsidiaries may engage in “covered transactions” with an affiliate, as defined, to an amount equal to 10% of such institution’s capital and surplus and an aggregate limit on all such transactions with all affiliates to an amount equal to 20% of such capital and surplus, and (2) require all transactions with an affiliate, whether or not “covered transactions,” to be on terms substantially the same, or at least as favorable to the institution or subsidiary, as those provided to a non-affiliate. The term “covered transaction” includes the making of loans, purchase of assets, issuance of a guarantee and other similar types of transactions. Section 23A includes a number of exemptions for certain transactions between banks and their affiliates. The most important exemption is for transactions that are between banks where 80 percent or more of each bank’s stock is owned by the same company.
Transactions with Affiliates. Subsidiary banks of a bank holding company are subject to restrictions imposed by the Federal Reserve Act on extensions of credit to the holding company or its subsidiaries, on investments in their securities, and on the use of their securities as collateral for loans to any borrower. These regulations and restrictions may limit Sterling’s ability to obtain funds from its banking subsidiaries for its cash needs, including funds for payment of dividends, interest and operational expenses.
Tying Arrangements. Sterling is prohibited from engaging in certain tie-in arrangements in connection with any extension of credit, sale or lease of property or furnishing of services. For example, with certain exceptions, neither Sterling nor its subsidiaries may condition an extension of credit to a customer on either (1) a requirement that the customer obtain additional services provided by Sterling or (2) an agreement by the customer to refrain from obtaining other services from a competitor.
Support of Subsidiary Banks. Under Federal Reserve policy, Sterling is expected to act as a source of financial and managerial strength to its banking subsidiaries. This means that Sterling is required to commit, as necessary, resources to support Sterling Savings Bank and Golf Savings Bank. Any capital loans a bank holding company makes to its subsidiary banks are subordinate to deposits and to certain other indebtedness of those subsidiary banks.
Federal and State Regulation of Banking Activities
General. The deposits of Sterling Savings Bank and Golf Savings Bank are insured by the FDIC. As a result, they are subject to supervision and regulation by the FDIC as well as the WDFI. These agencies have the authority to prohibit banks from engaging in what they believe constitute unsafe or unsound banking practices.
Community Reinvestment. The Community Reinvestment Act requires that, in connection with examinations of financial institutions within their jurisdiction, the Federal Reserve or the FDIC evaluate the record of the financial institution in meeting the credit needs of its local communities, including low and moderate income neighborhoods, consistent with the safe and sound operation of the institution. These factors are also considered in evaluating mergers, acquisitions and applications to open a branch or facility.
Insider Credit Transactions. Banks are also subject to certain restrictions imposed by the Federal Reserve Act on extensions of credit to executive officers, directors, principal shareholders or any related interests of such persons. Extensions of credit (1) must be made on substantially the same terms, including interest rates and collateral as, and follow credit underwriting procedures that are not less stringent than, those prevailing at the time for comparable transactions with persons not covered above and who are not employees, and (2) must not involve more than the normal risk of repayment or present other unfavorable features. Banks are also subject to certain lending limits and restrictions on overdrafts to insiders. A violation of these restrictions may result in the assessment of substantial civil monetary penalties, the imposition of a cease and desist order, and other regulatory sanctions.
| TX31 |
Table of Contents
Regulation of Management. Federal law: (1) sets forth circumstances under which officers or directors of a bank may be removed by the institution’s federal supervisory agency; (2) places restraints on lending by a bank to its executive officers, directors, principal shareholders, and their related interests; and (3) prohibits management personnel of a bank from serving as a director or in a management position of another financial institution whose assets exceed a specified amount or which has an office within a specified geographic area.
Safety and Soundness Standards . The Federal Deposit Insurance Corporation Act of 1991 requires the FDIC to impose upon banks certain non-capital safety and soundness standards. These standards cover, among other things, internal controls, information systems, internal audit systems, loan documentation, credit underwriting, interest rate exposure, asset growth, compensation and benefits. Additional standards apply to asset quality, earnings and stock valuation. An institution that fails to meet these standards must develop a plan acceptable to its regulators, specifying the steps that the institution will take to meet the standards. Failure to submit or implement such a plan may subject the institution to regulatory sanctions.
Lending Restrictions and Disclosure Requirements. The Federal Reserve has adopted amendments to the Home Ownership and Equity Protection Act of 1994 (“HOEPA”), which expand the protections of HOEPA to cover more transactions and prohibit certain practices deemed harmful to borrowers. If a loan qualifies as a HOEPA loan, certain practices and terms on high-cost mortgages are restricted and require special consumer disclosures. The interest rate trigger on first-time liens used to determine whether a loan qualifies as a HOEPA loan has been lowered from 10% to 8% and the cost of single-premium credit insurance products has been added to the points and fees test. As a result, more of Sterling’s loans are expected to be subject to HOEPA restrictions and disclosure requirements.
The Real Estate Settlement Procedures Act (“RESPA”) requires lenders to provide borrowers with disclosures regarding the nature and cost of real estate settlements. RESPA restricts how and when disclosed fees may change. The Act also prohibits certain abusive practices, such as kickbacks and fee-splitting without providing settlement services. Penalties under the above laws may include fines, reimbursements, and other penalties.
Credit Card Regulation. The Credit Card Accountability Responsibility and Disclosure Act (the “Credit Card Act”) bans retroactive rate increases, requires that bills be due no less than 21 days from the time of mailing, requires that credit card contracts be accessible on the Internet, and allows consumers to opt-in if they choose to use a card issuer’s over-limit protection.
Loan Modifications. The U.S. Department of the Treasury has instituted a Home Affordable Modification Program (“HAMP”) as part of its Making Home Affordable program that is focused on reducing the number of foreclosures and making it easier for customers to refinance loans. The HAMP provides guidelines on loan modifications that are intended to help certain at-risk homeowners avoid foreclosure by reducing monthly mortgage payments and providing incentives to lenders to modify all eligible loans that fall under the guidelines of this program.
Deposit Insurance Assessments. During 2007, the FDIC merged the Bank Insurance Fund (“BIF”) and the Savings Association Insurance Fund (“SAIF”) into a new Deposit Insurance Fund (“DIF”). The DIF and FDIC insure deposits of Sterling Savings Bank and Golf Savings Bank up to the prescribed limits for each depositor. In October 2008, the basic limit on federal deposit insurance coverage of interest bearing transaction accounts increased from $100,000 to $250,000 per depositor under the EESA. In November 2008, the FDIC offered a voluntary expanded insurance program to depository institutions, which provides, without charge to depositors, full guarantee on all non-interest bearing transaction accounts held by any depositor, regardless of dollar amount. Sterling Savings Bank and Golf Savings Bank are participating in this program. The FDIC maintains the DIF by assessing each depository institution an insurance premium. The amount of FDIC assessments paid by a DIF member institution is based on its relative risk of default as measured by a company’s FDIC supervisory rating, and other various measures, such as the level of brokered deposits, unsecured debt, and debt issuer ratings.
| TX32 |
Table of Contents
On February 27, 2009, the FDIC adopted an amended restoration plan for the DIF that was originally established and implemented on October 7, 2008. The plan was further amended on September 29, 2009 and requires the DIF reserve ratio to be 1.15% within eight years of the original restoration plan. On May 22, 2009, the FDIC adopted a final rule imposing a 5 basis point special assessment on each insured depository institution’s assets minus Tier 1 capital as of June 30, 2009. The amount of the special assessment for any institution will not exceed 10 basis points multiplied by the institution’s assessment base for the second quarter of 2009.
The DIF assessment base rate currently ranges from 12 to 45 basis points for institutions that do not trigger factors for brokered deposits and unsecured debt, and higher rates for those that do trigger those risk factors. On September 29, 2009, the FDIC announced plans to maintain assessment rates at their current levels through the end of 2010. In addition, the FDIC adopted a uniform 3 basis point increase in assessment rates effective January 1, 2011. At least semi-annually going forward the FDIC will assess whether to increase or decrease the assessment rate schedule. An increase in the assessment rate could have a material adverse effect on Sterling’s earnings, depending on the amount of the increase. The FDIC is authorized to terminate a depository institution’s deposit insurance upon a finding by the FDIC that the institution’s financial condition is unsafe or unsound, or that the institution has engaged in unsafe or unsound practices, or has violated any applicable rule, regulation, order or condition enacted or imposed by the institution’s regulatory agency. The termination of deposit insurance for Sterling’s subsidiaries, Sterling Savings Bank or Golf Savings Bank, could have a material adverse effect on Sterling’s earnings.
All FDIC-insured depository institutions must pay an annual assessment to provide funds for the payment of interest on bonds issued by the Financing Corporation, a federal corporation chartered under the authority of the Federal Housing Finance Board. The bonds, which are referred to as FICO bonds, were issued to capitalize the Federal Savings and Loan Insurance Corporation. FDIC-insured depository institutions paid between 1.02 cents to 1.14 cents per $100 of DIF-assessable deposits in 2009. The FDIC established the FICO assessment rate effective for the first quarter of 2010 at approximately 1.06 cents annually per $100 of assessable deposits.
Dividend Restrictions. Sterling is a legal entity separate and distinct from its subsidiary banks and other subsidiaries. Its principal source of funds to pay dividends on its common and preferred stock and principal and interest on its debt is dividends from its subsidiaries. Various federal and state statutory provisions and regulations limit the amount of dividends Sterling, Sterling Savings Bank, Golf Savings Bank and certain other subsidiaries may pay without regulatory approval.
Pursuant to the Reserve Bank Agreement, Sterling is prohibited from paying any dividends without the prior written approval of the Reserve Bank. Sterling is also prohibited from directly or indirectly taking dividends, or any other form of payment that would represent a reduction in capital from Sterling Savings Bank or Golf Savings Bank, without the prior written approval of the Reserve Bank.
Federal bank regulatory agencies have the authority to prohibit Sterling Savings Bank and Golf Savings Bank from engaging in unsafe or unsound practices in conducting their business and the payment of dividends, depending on each bank’s financial condition, could be deemed an unsafe or unsound practice. Pursuant to the SSB Consent Agreement, Sterling Savings Bank is prohibited from paying dividends without the prior written consent of the FDIC and the WDFI. The ability of Sterling Savings Bank and Golf Savings Bank to pay dividends in the future will continue to be influenced by bank regulatory policies and capital guidelines.
Pursuant to the terms of Sterling’s participation in the CPP program of the Treasury Department, Sterling is also prohibited from paying dividends on its common stock so long as Sterling’s payments on its preferred stock remain deferred. Sterling is further prohibited from increasing the dividends to be paid to shareholders above the $0.10 per share quarterly dividend paid for the quarter ended September 30, 2008. This restriction on Sterling’s ability to increase its dividends will continue until either Sterling redeems all of the preferred shares sold to the Treasury Department, or December 2011, whichever is earliest.
| TX33 |
Table of Contents
Federal Reserve System. Sterling Savings Bank and Golf Savings Bank are subject to various regulations promulgated by the Federal Reserve, including, among others, Regulation B (Equal Credit Opportunity), Regulation D (Reserves), Regulation E (Electronic Fund Transfers), Regulation Z (Truth in Lending), Regulation CC (Availability of Funds) and Regulation DD (Truth in Savings). Regulation D requires non-interest-bearing reserve maintenance in the form of either vault cash or funds on deposit at the Federal Reserve Bank of San Francisco or another designated depository institution in an amount calculated by formula. The balances maintained to meet the reserve requirements imposed by the Fed may be used to satisfy liquidity requirements. As of December 31, 2009, Sterling Savings Bank and Golf Savings Bank met these requirements.
Federal Taxation. Sterling is subject to federal income taxation under the Internal Revenue Code of 1986, as amended, in the same manner as other corporations. Sterling files consolidated federal income tax returns on the accrual basis. See Note 12 of “Notes to Consolidated Financial Statements.”
State Law and Regulation. Sterling Savings Bank and Golf Savings Bank, as Washington State-chartered institutions, are subject to regulation by the WDFI, which conducts regular examinations to ensure that Sterling Savings Bank’s and Golf Savings Bank’s operations and policies conform with sound industry practice. The liquidity and other requirements set by the WDFI are generally no stricter than the liquidity and other requirements set by the Federal Reserve. State law regulates the amount of credit that can be extended to any one person or marital community and the amount of money that can be invested in any one property. Without the WDFI’s approval, Sterling Savings Bank and Golf Savings Bank currently cannot extend credit to any one person or marital community in an amount greater than 2.5% of Sterling Savings Bank’s or Golf Savings Bank’s total assets. State law also regulates the types of loans Sterling Savings Bank and Golf Savings Bank can make. Without the WDFI’s approval, Sterling Savings Bank and Golf Savings Bank cannot currently invest more than 10% of their total assets in other corporations. Sterling Savings Bank also operates depository branches within the states of Oregon, Idaho, California and Montana and therefore its operations in these states are subject to the supervision of the Oregon Department of Consumer and Business Services, the Idaho Department of Finance, the California Department of Financial Institutions and the Montana Department of Finance, as applicable. Golf Savings Bank’s depository branch is located in the state of Washington. Sterling and its subsidiaries are also required to comply with applicable laws and regulations for activities in Arizona, Utah and Colorado. In addition, Golf Savings Bank is also required to comply with applicable laws and regulations for activities in Oregon, Idaho, Utah and Montana.
Capital Adequacy
Regulatory Capital Guidelines. Federal bank regulatory agencies use capital adequacy guidelines in the examination and regulation of bank holding companies and banks. The guidelines are “risk-based,” meaning that they are to: (i) make capital requirements more sensitive to differences in risk profiles among banks and bank holding companies; (ii) factor off-balance sheet exposure into the assessment of capital adequacy; (iii) minimize disincentives to holding liquid low risk assets; and (iv) achieve greater consistency in the evaluation of the capital adequacy of major banking organizations throughout the world.
Tier I and Tier II Capital. Under the guidelines, an institution’s capital is divided into two broad categories, Tier I capital and Tier II capital. Tier I capital consists, in part, of common qualifying stockholders’ equity, qualifying cumulative perpetual preferred stock, including related surplus, and qualifying trust preferred securities. Tier II capital may consist of the allowance for loan and lease losses, hybrid capital instruments, perpetual preferred stock and related surplus, term subordinated debt and intermediate-term preferred stock, including related surplus, and unrealized holding gains on equity securities. The sum of Tier I capital and Tier II capital represents a banking organization’s total capital. Tier I capital must represent at least 50% of qualifying total capital.
Risk-based Capital Ratios. The adequacy of an institution’s capital is gauged primarily with reference to the institution’s risk-weighted assets.
| TX34 |
Table of Contents
The guidelines assign risk weightings to an institution’s assets in an effort to quantify the relative risk of each asset and to determine the minimum capital required to support that risk. An institution’s risk-weighted assets are then compared with its Tier I capital and total capital to arrive at a Tier I risk-based ratio and a total risk-based ratio, respectively. The guidelines provide that a bank must have a minimum Tier I risk-based ratio of 4% and a minimum total risk-based ratio of 8%.
Leverage Ratio. The guidelines also employ a leverage ratio, which is calculated by dividing Tier I capital by the average total consolidated assets. The principal objective of the leverage ratio is to constrain the maximum degree to which a bank holding company may leverage its equity capital base. It is intended to be used as a supplement to the risk based capital measure. The minimum Tier I leverage ratio is 3% for bank holding companies that have received a risk rating of “1,” the highest possible rating. For all other bank holding companies, including Sterling, the minimum Tier I leverage ratio is 4%.
Prompt Corrective Action. Under the guidelines, a bank is assigned to one of five capital categories depending on its total risk-based capital ratio, Tier I risk-based capital ratio, and leverage ratio, together with certain other subjective and objective factors. The categories range from “well capitalized” to “critically undercapitalized.” Institutions that are “adequately capitalized” or lower may be subject to certain mandatory or discretionary supervisory corrective actions. At December 31, 2009, Sterling maintained a total risk-based capital ratio of 7.9%, a tier 1 risk-based capital ratio of 4.9% and a tier 1 leverage ratio of 3.5%. As a result, Sterling has been categorized as “undercapitalized” and is subject to various restrictions, including restrictions on asset growth, acquisitions, new activities and new branches.
From time to time, Sterling and its senior managers have made and will make forward-looking statements that are not historical facts and that are intended to be covered by the safe harbor for “forward-looking statements” provided by the Private Securities Litigation Reform Act of 1995. These forward-looking statements may include, but are not limited to, statements about Sterling’s plans, objectives, expectations and intentions and other statements contained in this release that are not historical facts and pertain to Sterling’s future operating results. When used in this report, the words “expects,” “anticipates,’’ ‘‘intends,’’ ‘‘plans,’’ ‘‘believes,’’ ‘‘seeks,’’ ‘‘estimates’’ and similar expressions are generally intended to identify forward-looking statements. We make forward-looking statements regarding projected sources of funds, use of proceeds, availability of acquisition and growth opportunities, ability to repay government funds, payment of dividends, adequacy of our allowance for loan and lease losses and provision for loan and lease losses, our real estate portfolio and subsequent charge-offs. Such statements may be contained in this report and in other documents that Sterling files with the Securities and Exchange Commission. Such statements may also be made by Sterling and its senior managers in oral or written presentations to analysts, investors, the media and others.
Actual results may differ materially from the results discussed in these forward-looking statements because such statements are inherently subject to significant assumptions, risks and uncertainties, many of which are difficult to predict and are generally beyond Sterling’s control. These include but are not limited to:
| Ÿ | our ability to successfully implement our alternative strategies for recapitalization; |
| Ÿ | our ability to maintain adequate liquidity; |
| Ÿ | our viability as a going concern |
| Ÿ | our ability to comply with the Reserve Bank Agreement and the SSB Consent Agreement; |
| Ÿ | our ability to attract and retain deposits and loans; |
| Ÿ | demand for financial services in our market areas; |
| Ÿ | competitive market pricing factors; |
| Ÿ | further deterioration in economic conditions that could result in increased loan and lease losses; |
| Ÿ | risks associated with concentrations in real estate-related loans; |
| TX35 |
Table of Contents
| Ÿ | market interest rate volatility; |
| Ÿ | stability of funding sources and continued availability of borrowings; |
| Ÿ | changes in legal or regulatory requirements or the results of regulatory examinations that could restrict growth; |
| Ÿ | our ability to comply with the requirements of regulatory orders issued to us and/or our banking subsidiaries; |
| Ÿ | our ability to recruit and retain key management and staff; |
| Ÿ | risks associated with merger and acquisition integration; |
| Ÿ | continued decline in the market value of the Company; |
| Ÿ | our ability to incur debt on reasonable terms; |
| Ÿ | regulatory limits on our subsidiary banks’ ability to pay dividends to the Company; |
| Ÿ | effectiveness of legislative and regulatory reform of the financial sector; |
| Ÿ | future legislative or administrative changes to the TARP Capital Purchase Program; and |
| Ÿ | the impact of EESA and ARRA and related rules and regulations on Sterling’s business operations and competitiveness, including the impact of executive compensation restrictions, which may affect Sterling’s ability to retain and recruit executives in competition with other firms who do not operate under those restrictions. |
Other factors that could cause actual conditions, events or results to differ significantly from those described in the forward-looking statements may be found under the headings “Risk Factors” and “Management’s Discussion and Analysis of Financial Condition and Results of Operations” below, as updated periodically in Sterling’s filings with the SEC. Unless legally required, Sterling disclaims any obligation to update any forward-looking statements. You should consider any forward-looking statements in light of this explanation, and we caution you about relying on forward-looking statements.
| TX36 |
Table of Contents
Where You Can Find More Information
The periodic reports Sterling files with the SEC are available on Sterling’s website at www.sterlingfinancialcorporation-spokane.com after the reports are filed with the SEC. The SEC maintains a website located at www.sec.gov that also contains this information. The information on Sterling’s website and the SEC’s website is not part of this annual report on Form 10-K. Sterling will provide you with copies of these reports, without charge, upon request made to:
Investor Relations
Sterling Financial Corporation
111 North Wall Street
Spokane, Washington 99201
(509) 458-3711
| TX37 |
Table of Contents
Set forth below and elsewhere in this Annual Report on Form 10-K and in other documents Sterling files with the SEC are risks and uncertainties that could cause actual results to differ materially from the results contemplated by the forward-looking statements contained in this Annual Report on Form 10-K.
We are undercapitalized and face a number of challenges in the near term future.
Sterling faces a number of challenges resulting from current and prior year losses driven by credit quality issues and is categorized as undercapitalized by regulatory guidelines. While Sterling’s new management is in active negotiations with several private equity investors, its stakeholders and its regulators about strategic alternatives, there can be no assurance that any of these alternatives will be implemented in a timely manner that will allow Sterling to recapitalize and grow its business. See “Recent Developments.”
We may fail to raise additional capital, which may result in our filing for bankruptcy and/or our banking subsidiaries entering FDIC receivership, and our Independent Registered Public Accounting Firm has expressed substantial doubt about our ability to continue as a going concern.
There can be no assurance that we will be successful in completing any or all of our current strategic initiatives to raise additional capital and strengthen our balance sheet. If we are unsuccessful, our ongoing financial viability would be in doubt. To reflect this uncertainty, our Independent Registered Public Accounting Firm has added an explanatory paragraph in their audit opinion issued in connection with our year-end financial statements, expressing substantial doubt regarding our ability to continue as a going concern. If we are unable to successfully execute on our strategic initiatives, we expect that we would file for bankruptcy and/or the FDIC would put our subsidiary banks into receivership. See “Recent Developments” and Note 25 of “Notes to Consolidated Financial Statements.”
The uncertainty of our financial viability could result in a loss of access to funding sources, which would have a negative impact on our liquidity and may cause our regulators to place us in receivership before we have implemented our strategic alternatives.
Liquidity is essential to our business. An inability to raise funds through deposits, borrowings, the sale or pledging as collateral of loans and other assets could have a substantial negative effect on our liquidity. Public perception of safety and soundness, as well as the availability of FDIC deposit insurance protection, are important to financial institutions that obtain deposits from retail, commercial and public customers. The uncertainty of our financial viability may be perceived by some customers or prospective customers to offset the protection their deposits receive through the FDIC deposit insurance fund and may negatively impact the decisions of customers who hold deposits in excess of the FDIC insurance limits. There can be no assurance that this continued uncertainty will not negatively impact Sterling’s ability to attract new deposits or that it will not result in additional deposit outflows, both of which could have a material adverse impact on our liquidity. Our liquidity may also be adversely affected if the FDIC’s temporary transaction account guarantee program is not extended. The program is currently scheduled to expire on June 30, 2010.
We incurred significant losses over the last five quarters, and may continue do so in the future, and we can make no assurances as to when we will be profitable.
Cumulatively, since the fourth quarter of 2008, we have incurred a net loss available to common shareholders of $1.21 billion, or a loss of $23.35 per common share, primarily due to a $909.9 million provision for credit losses, a $451.3 million charge for goodwill impairment and the establishment of a $269.0 million deferred tax asset valuation allowance. In light of the current economic environment, significant additional provisions for credit losses may be necessary to supplement the allowance for loan and lease losses in the future. As a result, we may incur significant credit costs throughout 2010, which would continue to have an adverse impact on our financial condition and results of operations and the value of our common
| TX38 |
Table of Contents
stock. Additional credit losses or impairment charges could cause us to incur a net loss in the future and could adversely affect the price of, and market for, our common stock.
Sterling’s stock price has declined and Treasury’s letter requires that capital be raised at no more than $0.20 cents per share, which is likely to impact the price.
Sterling’s stock price has declined substantially, and the requirement in the Treasury letter that capital be raised at no more than $0.20 per share is likely to significantly impact the market price in the near term. In addition, the stock price could be impacted by a variety of factors, including: uncertainty over our financial viability; actual or anticipated variations in quarterly operating results; changes in shareholder dividend policy; recommendations by securities analysts; and news reports relating to trends, concerns and other issues in the financial services industry. Other factors include new technology used or services offered by Sterling’s competitors; operating and stock price performance of other companies that investors deem comparable to us; and changes in government regulations.
General market fluctuations, industry factors and general economic and political conditions and events, such as future terrorist attacks and activities, economic slowdowns or recessions, interest rate changes or credit loss trends, also could cause Sterling’s stock price to decrease regardless of its operating results.
Any recapitalization would have a significant dilutive effect.
Sterling is currently exploring various options for recapitalization, as a part of which it anticipates that it will need to raise at least $650 million in new capital. In connection with its plans for recapitalization, sales of a substantial number of shares of our common stock in the public markets and the availability of those shares would have a significant dilutive effect on the market for Sterling common stock. Under all strategic alternatives under consideration, current shareholders would have no more than a minimal stake in Sterling after recapitalization.
Our banking subsidiary, Sterling Savings Bank, has entered into a consent agreement with the FDIC and the WDFI, and Sterling has entered into a written agreement with the Federal Reserve.
On October 9, 2009, Sterling Savings Bank consented to the issuance of the SSB Consent Agreement by the FDIC and the WDFI. Pursuant to the SSB Consent Agreement, Sterling Savings Bank is required to take certain actions, including: raising additional capital; reducing the number of nonperforming assets; reducing the number of commercial real estate and land development loans; restricting extensions of additional credit to borrowers with classified loans; implementing a liquidity and funds management policy that addresses liquidity needs and reduces reliance on non-core funding sources; restricting cash dividend payments; and complying with interest rate limitations on deposits.
On December 24, 2009, Sterling entered into the Reserve Bank Agreement. This Agreement is intended to enhance Sterling’s ability to act as a source of strength to Sterling Savings Bank and Golf Savings Bank. Substantially all of the requirements of the Reserve Bank Agreement are similar to those imposed on Sterling Savings Bank by the FDIC and the WDFI, including restrictions on the payment of dividends and prohibitions on the purchase or redemption by Sterling of any shares of its stock.
The requirements and restrictions of the SSB Consent Agreement and the Reserve Bank Agreement are judicially enforceable and the failure of Sterling or Sterling Savings Bank to comply with such requirements and restrictions may subject Sterling and Sterling Savings Bank to additional regulatory restrictions including: the imposition of civil monetary penalties; the issuance of directives to increase capital or enter into a strategic transaction, whether by merger or otherwise, with a third party; the appointment of a conservator or receiver for Sterling Savings Bank; the termination of insurance of deposits; the issuance of removal and prohibition orders against institution-affiliated parties; and the enforcement of such actions through injunctions or restraining orders.
| TX39 |
Table of Contents
Sterling has not complied with the deadline established by the FDIC and the WDFI to raise additional capital.
Pursuant to the SSB Consent Agreement, the FDIC and WDFI directed Sterling Savings Bank to increase its Tier 1 capital by at least $300 million by December 15, 2009 and thereafter maintain a Tier 1 leverage ratio of not less than 10%. To date, Sterling Savings Bank has not yet increased its Tier 1 capital and although it is continuing to work closely with its regulators and financial advisors in order to comply with the SSB Consent Agreement, there can be no assurance that Sterling will be successful in this regard. As a result of Sterling’s failure to comply with the SSB Consent Agreement, Sterling’s regulators may decide to impose more severe restrictions upon Sterling, including the appointment of a conservator or receiver for Sterling Savings Bank.
The SSB Consent Agreement limits the types of funding sources on which we may rely and may have a negative impact on our liquidity.
Pursuant to the terms of the SSB Consent Agreement, we may not accept, renew or roll over any brokered deposits, and are required to submit a plan that reduces our reliance on non-core funding sources and reduces our level of brokered deposits. The reduction in the level of brokered deposits, even according to their regular maturity dates, may have a negative impact on our liquidity within the near term. Furthermore, we are now required to provide a higher level of collateral for any funds that we borrow from the Federal Reserve, and we may be required to provide additional collateral to our other funding sources as well. Any additional collateral requirements or limitations on our ability to access additional funding sources are expected to have a negative impact on our liquidity.
We may be deemed to be in default with regard to certain of our borrowing agreements as a result of the receipt of the SSB Consent Agreement and the Reserve Bank Agreement.
Certain borrowing agreements that we have entered into require Sterling to remain well capitalized under regulatory requirements. Under the terms of the SSB Consent Agreement and the Reserve Bank Agreement, Sterling agreed to, among other things, a capital maintenance provision, which by definition, excluded Sterling from well capitalized status. As of December 31, 2009, Sterling has been deemed to be “undercapitalized,” which may trigger an event of default with regard to its reverse repurchase agreements. A declaration of default by the counterparties to these agreements could result in the counterparties requesting an early termination payment, which could subject Sterling to additional costs based on the fair value of the borrowings at the date of the early termination.
Our estimated allowance for losses in our loan portfolio may be inadequate, which would cause our results of operations and financial condition to be adversely affected.
We maintain an allowance for credit losses, which is a reserve established through a provision for credit losses charged as an expense and represents management’s best estimate of incurred losses within our existing portfolio of loans, which has been increasing in light of recent economic conditions. The level of the allowance reflects management’s estimates based upon various assumptions and judgments as to specific credit risks, evaluation of industry concentrations, loan loss experience, current loan portfolio quality, present economic, political and regulatory conditions and unidentified losses inherent in the current loan portfolio. The determination of the appropriate level of the allowance for loan and lease losses inherently involves a high degree of subjectivity and requires management to make significant estimates and judgments regarding current credit risks and future trends, all of which may undergo material changes. If our estimates prove to be incorrect, our allowance for credit losses may not be sufficient to cover losses in our loan portfolio and our expense relating to the additional provision for credit losses could increase substantially. In addition, bank regulatory agencies periodically review the adequacy of our allowance for credit losses as part of their examination process, and may require an increase in the provision for possible credit losses or the recognition of further loan charge-offs. Any such increases in the allowance for credit losses may have a material adverse effect on our results of operations, financial condition and the value of our common stock.
| TX40 |
Table of Contents
We have received a notice of noncompliance from the NASDAQ Stock Market and our common stock may be subject to delisting.
On December 7, 2009, Sterling received a letter from The NASDAQ Stock Market (“NASDAQ”) notifying Sterling that it no longer meets NASDAQ’s continued listing requirement under Listing Rule 5450(a)(1) (the “Bid Price Rule”) because the bid price for its common stock has closed below $1.00 per share for 30 consecutive business days. If compliance with the Bid Price Rule cannot be established prior to June 7, 2010, Sterling’s common stock will be subject to delisting from the NASDAQ Global Select Market. Sterling may, however, be eligible for an additional grace period if it satisfies the initial listing standards (with the exception of the Bid Price Rule) for listing on The NASDAQ Capital Market, and it submits a timely application to NASDAQ to transfer the listing of its common stock to the NASDAQ Capital Market. Sterling is evaluating its options following receipt of the notification and intends to take appropriate actions in order to retain the listing of its common stock on the NASDAQ stock market. There can be no assurance that Sterling will be successful at reestablishing compliance with the Bid Price Rule and a delisting from NASDAQ would have a negative impact on the value and liquidity of our common stock and our ability to access the capital markets.
The effects of the current economic recession have been particularly severe in our primary market areas in the Pacific Northwest and Northern California.
Substantially all of our loans are to businesses and individuals in Washington, Oregon, Idaho, Montana and California. The Pacific Northwest is home to some of the nation’s highest unemployment rates and major employers in Washington, Oregon and Idaho have recently implemented substantial employee layoffs or scaled back growth plans. Severe declines in housing prices and property values have been particularly acute in our primary market areas. The State of California continues to face fiscal challenges, the long-term effects of which on California’s economy cannot be predicted. A further deterioration in the economic conditions or a prolonged delay in economic recovery in our primary market areas could result in the following consequences, any of which could materially and adversely affect our business: collateral for loans made by us, especially real estate, may decline further in value, in turn reducing customers’ borrowing power, and further reducing the value of assets and collateral associated with our existing loans, loan delinquencies may increase; problem assets and foreclosures may increase; demand for our products and services may decrease; and access to low cost or noninterest bearing deposits may decrease.
A large percentage of our loan portfolio is secured by real estate. Continued deterioration in the real estate market or other segments of our loan portfolio would lead to additional losses, which could have a material adverse effect on our business, financial condition and results of operations.
Approximately 74% of our loan portfolio is secured by real estate. The secured loans include construction loans which comprise 20% of our total real estate secured loans. As a result of increased levels of commercial and consumer delinquencies and declining real estate values, we have experienced increasing levels of net charge-offs and provisions for credit losses. Continued increases in commercial and consumer delinquency levels or continued declines in real estate market values would require increased net charge-offs and increases in the provision for loan and lease losses, which could have a material adverse effect on our business, financial condition and results of operations and prospects. Acts of nature, including earthquakes, floods and fires, which may cause uninsured damage and other loss of value to real estate that secures these loans, may also have a negative impact on our financial condition. In addition, we may face risks associated with our real estate lending under various federal, state and local environmental laws that impose certain requirements on the owner or operator of a property.
We have a concentration in higher risk non owner occupied commercial real estate loans.
Approximately 18% of our real estate secured loans are secured by non-owner-occupied commercial real estate. Commercial real estate loans generally involve a higher degree of credit risk than residential mortgage lending due, among other
| TX41 |
Table of Contents
things, to the large amounts loaned to individual borrowers. In addition, unlike residential mortgage loans, commercial real estate loans generally depend on the cash flow from the property to service the debt. Cash flow may be significantly affected by general economic conditions. Losses incurred on loans to a small number of borrowers could have a material adverse impact on our income and financial condition. Also, many of our commercial real estate borrowers have more than one loan outstanding with us. Consequently, an adverse development with respect to one loan or one credit relationship can expose us to a significantly greater risk of loss compared to an adverse development with respect to a one- to four-family residential mortgage loan.
Commercial loans may involve a higher degree of risk.
Sterling’s Commercial Banking Group provides a full range of credit products to small and medium-sized businesses and to individuals, including lines of credit, receivable and inventory financing, equipment loans and owner occupied commercial real estate. At December 31, 2009, approximately 30% of our loan portfolio can be classified as commercial lending. Commercial loans generally involve a higher degree of credit risk than residential mortgage lending due, among other things, to the large amounts loaned to individual borrowers. In addition, unlike residential mortgage loans, commercial loans generally depend on the cash flow from the business to service the debt. Cash flow may be significantly affected by general economic conditions. Losses incurred on loans to a small number of borrowers could have a material adverse impact on our income and financial condition. Also, many of our commercial borrowers have more than one loan outstanding with us. Consequently, an adverse development with respect to one loan or one credit relationship can expose us to a significantly greater risk of loss compared to an adverse development with respect to a one- to four-family residential mortgage loan.
A rapid change in interest rates could make it difficult to maintain our current net interest income spread and could result in reduced earnings.
Our earnings are largely derived from net interest income, which is interest income earned on loans and investments, less interest paid on deposits and other borrowings. Interest rates are highly sensitive to many factors that are beyond the control of our management, including general economic conditions and the policies of various governmental and regulatory authorities. As interest rates change, net interest income is affected. With fixed rate assets (such as fixed rate loans and most investment securities) and liabilities (such as certificates of deposit), the effect on net interest income depends on the cash flows associated with the maturity of the asset or liability. Asset/liability management policies may not be successfully implemented and from time to time our risk position is not balanced. An unanticipated rapid decrease or increase in interest rates could have an adverse effect on the spreads between the interest rates earned on assets and the rates of interest paid on liabilities, and therefore on the level of net interest income. For instance, any rapid increase in interest rates in the future could result in interest expense increasing faster than interest income because of fixed rate loans and longer-term investments. Further, substantially higher interest rates generally reduce loan demand and may result in slower loan growth than previously experienced. See “Management’s Discussion and Analysis of Financial Condition and Results of Operations—Asset and Liability Management”.
Our cost of funds may increase as a result of many factors, which may reduce our profitability.
Our cost of funds may increase because of general economic conditions, unfavorable conditions in the capital markets, changes in interest rates, government intervention and support of competitors, government price controls, and competitive pressures. We have traditionally obtained funds principally through deposits and to a lesser extent, other borrowings, including repurchase agreements. As a general rule, deposits are a cheaper and more stable source of funds than borrowings. Checking and savings account balances and other forms of deposits can decrease when our deposit customers perceive alternative investments, such as the stock market or other non-depository investments, as providing superior expected returns, or seek to spread their deposits over several banks to maximize FDIC insurance coverage. Furthermore, technology and other changes have made it more convenient for bank customers to transfer funds into
| TX42 |
Table of Contents
alternative investments, including products offered by other financial institutions or non-bank service providers. Additional increases in short-term interest rates could increase transfers of deposits to higher yielding deposits. Efforts and initiatives we undertake to retain and increase deposits, including deposit pricing, can increase our costs. When bank customers move money out of bank deposits in favor of alternative investments or into higher yielding deposits, or spread their accounts over several banks, we can lose a relatively inexpensive source of funds, thus, increasing our funding costs.
If, as a result of general economic conditions, market interest rates, competitive pressures, or other factors, our level of deposits decreases relative to our overall banking activities, we may need to rely more heavily on borrowings and/or wholesale funding as a source of funds, and this may negatively impact our net interest margin and subject Sterling to additional liquidity and funding risks.
We may have reduced access to wholesale funding sources.
As a part of our liquidity management, we use a number of funding sources in addition to core deposit growth and repayments and maturities of loans and investments. Our financial flexibility will be severely constrained if we are unable to maintain our access to funding at acceptable interest rates. If we are required to rely more heavily on more expensive funding sources, our revenues may not increase proportionately to cover our costs, and our profitability would be adversely affected. In addition, Sterling Savings Bank may not accept, renew or roll over any brokered deposit unless it has requested and received non-objection from the FDIC and pursuant to the SSB Consent Agreement, must eliminate its reliance on brokered deposits. Sterling Savings Bank also would be required to receive written prior approval from the FDIC as a condition to any issuance of guaranteed debt under the FDIC’s Temporary Liquidity Guarantee Program.
Our banking operations are subject to extensive governmental regulation and further regulatory actions against us may impair our operations or restrict our growth.
We and our subsidiaries are subject to extensive regulation under federal and state laws. These laws and regulations are primarily intended to protect customers, depositors and the Deposit Insurance Fund, rather than shareholders. Sterling Savings Bank is a Washington state-chartered commercial bank and Golf Savings Bank is a Washington state-chartered savings bank, both of which are primarily regulated by the Washington Department of Financial Institutions. Our banking subsidiaries are also subject to the supervision by and the regulations of the FDIC, and the state agencies for the states in which they conduct business. In addition, Sterling is subject to regulation and supervision by the Board of Governors of the Federal Reserve System and the SEC, and subject to the listing standards of the NASDAQ Global Select Market.
Statutes and regulations affecting our business may be changed at any time and the interpretation of these statutes and regulations by examining authorities may also change. Within the last several years, Congress and the President have passed and enacted significant changes to these statutes and regulations. There can be no assurance that such changes to the statutes and regulations or to their interpretation will not adversely affect our business. In addition to governmental supervision and regulation, we are subject to changes in other federal and state laws, including changes in tax laws, which could materially affect the banking industry. We are subject to the rules and regulations of the Federal Reserve, the FDIC and the WDFI. The regulators may continue to limit our activities or growth, and may impose monetary penalties, which could severely limit or end our operations. Banking laws and regulations change from time to time. Bank regulations can hinder our ability to compete with financial services companies that are not regulated in the same manner or are less regulated.
Bank regulatory authorities have the authority to bring enforcement actions against banks and bank holding companies for unsafe or unsound practices in the conduct of their businesses or for violations of any law, rule or regulation, any condition imposed in writing by the appropriate bank regulatory agency or any written agreement with the authority. As discussed above, Sterling Savings Bank consented to the issuance of the SSB Consent Agreement and Sterling has entered into a written agreement with the Federal Reserve. These and other regulatory actions may have a material
| TX43 |
Table of Contents
adverse effect on our ability to operate our bank subsidiaries and execute our recapitalization strategies.
Difficult market conditions have adversely affected and may continue to have an adverse effect on our industry.
The capital and credit markets have been experiencing unprecedented volatility and disruption for more than two years. Dramatic declines in the housing market over the past two years, with falling home prices and increasing foreclosures, unemployment and under-employment, have had a negative impact on the performance of mortgage loans and have resulted in significant write-downs of asset values by financial institutions, including government-sponsored entities as well as major commercial and investment banks. These write-downs have caused many financial institutions to seek additional capital, to merge with larger and stronger institutions and, in some cases, to fail. Reflecting concern about the stability of the financial markets generally and the strength of counterparties, many lenders and institutional investors have reduced or ceased providing funding to borrowers, including to other financial institutions. This market turmoil and tightening of credit have led to an increased level of commercial and consumer delinquencies, lack of consumer confidence, increased market volatility and widespread reduction of business activity generally. The resulting economic pressure on consumers and lack of confidence in the financial markets has adversely affected our business, financial condition and results of operations. We do not expect that the difficult conditions in the financial markets are likely to improve in the near future. A worsening of these conditions would likely exacerbate the adverse effects of these difficult market conditions on us and others in the financial institutions industry. In particular, we may face the following risks in connection with these events:
| Ÿ | We expect to face increased regulation of our industry. Compliance with such regulation may increase our costs and limit our ability to pursue business opportunities. |
| Ÿ | Our ability to assess the creditworthiness of our customers may be impaired if the models and approaches we use to select, manage, and underwrite our customers become less predictive of future behaviors. |
| Ÿ | The process we use to estimate losses inherent in our loan portfolio requires difficult, subjective, and complex judgments, including forecasts of economic conditions and how these economic predictions might impair the ability of our borrowers to repay their loans, which may no longer be capable of accurate estimation and may, in turn, have a negative impact on the reliability of the process. |
| Ÿ | We will be required to pay significantly higher FDIC premiums because market developments have significantly depleted the insurance fund of the FDIC and reduced the ratio of reserves to insured deposits. |
| Ÿ | There may be additional downward pressure on our stock price. |
| Ÿ | Our ability to engage in routine funding transactions could be adversely affected by the actions and commercial soundness of other financial institutions and government sponsored entities. |
| Ÿ | We may face increased competition due to intensified consolidation of the financial services industry. |
If current levels of market disruption and volatility continue or worsen, there can be no assurance that we will not experience an adverse effect, which may be material, on our ability to access capital and on our business, financial condition and results of operations.
Sterling has deferred regularly scheduled interest payments on its outstanding junior subordinated notes relating to its trust preferred securities (collectively, the “TruPS”) and may be deemed to be in default on the TruPS if payment is not made prior to the end of the deferral period.
During the third quarter of 2009, Sterling began deferring regularly scheduled interest payments on its outstanding junior subordinated notes relating to its TruPS. Under the terms of the junior subordinated notes and the trust documents, Sterling is allowed to defer payments of interest on
| TX44 |
Table of Contents
the notes for up to 20 consecutive quarterly periods without default. During the deferral period, the respective trusts will likewise suspend the declaration and payment of dividends on the trust preferred securities. Also during the deferral period, Sterling generally may not pay cash dividends on or repurchase its common stock or preferred stock, including the preferred stock issued by Sterling to the U.S. Treasury under the TARP Capital Purchase Program. If Sterling fails to bring the deferred payments current prior to the end of the deferral period, then Sterling may be deemed to be in default under the terms of the notes and subject to various penalties, including seizure of the collateral that secures the TruPS notes.
Sterling may be required to bring its deferred TruPS payments current in order repurchase some or all of its outstanding TruPS obligations and/or may be unable to complete its tender offer for the TruPS.
In February 2010, Sterling commenced a tender offer to the holders of Sterling’s TruPS, seeking to repurchase the TruPS at a significant discount to the principal amount of the TruPS. Sterling’s tender offer is conditioned on receipt of consent from the holders of the TruPS sufficient to approve the proposed transactions, including the removal or waiver of covenants that prohibit Sterling from purchasing any series of TruPS while other series of TruPS are in deferral. If some holders of the TruPS accept the offer but the amendments described above are not approved with respect to one or more series of TruPS, then subject to approval by banking regulators, Sterling may be required to pay the accrued interest due under the indentures underlying those series of TruPS in order to address restrictions on repurchases during interest deferral periods. There can be no assurance that Sterling’s regulators will permit such a payment, nor can there be any assurance that the payment of accrued payments or the failure of Sterling to successfully complete the tender offer for the TruPS will not have a material adverse effect on Sterling’s capital position.
Sterling may realize losses on its investment securities in future periods if management decides not to hold the investments to recovery, there is a change in management’s or the rating agencies’ assessment of credit risk on individual securities, or a change in regulatory or accounting requirements.
As of December 31, 2009, Sterling held positions in classes of securities considered impaired because their fair value was less than their amortized cost basis. These securities included a single-issuer trust preferred security with an amortized cost of $24.7 million compared with an $18.8 million market value, and private label collateralized mortgage obligations with an aggregate amortized cost of $163.3 million compared with a $155.2 million market value. All are stress-tested monthly for both credit quality and collateral strength, and are investment grade according to at least one rating agency. Subsequent to December 31, 2009, S&P downgraded one of these securities below investment grade, while Moody’s maintained its investment grade rating on the same security. At December 31, 2009, this security had an amortized cost of $17.4 million and a market value of $15.3 million. Although Sterling has no intent to sell the securities and it is not more likely than not that Sterling will be required to sell the securities before their anticipated recovery, there is no assurance that events may not occur where Sterling would choose to or may be required to sell the securities. If Sterling chooses to or is required to sell these investments before a recovery of the entire cost basis of the securities, then Sterling may recognize a loss on the securities.
As a bank holding company that conducts substantially all of our operations through our banking subsidiaries, Sterling Savings Bank and Golf Savings Bank, our ability to pay dividends, repurchase our shares or to repay our indebtedness depends upon liquid assets held by the holding company and the results of operations of our subsidiaries.
Sterling is a separate and distinct legal entity from our subsidiaries and it receives substantially all of its revenue from dividends paid from our banking subsidiaries. There are legal limitations on the extent to which our banking subsidiaries may extend
| TX45 |
Table of Contents
credit, pay dividends or otherwise supply funds to, or engage in transactions with, us. Our continued inability to receive dividends from our banking subsidiaries would adversely affect our business, financial condition, results of operations and prospects.
Our net income depends primarily upon our banking subsidiaries’ net interest income, which is the income that remains after deducting from total income generated by earning assets the expense attributable to the acquisition of the funds required to support earning assets (primarily interest paid on deposits). The amount of interest income is dependent on many factors including the volume of earning assets, the general level of interest rates, the dynamics of changes in interest rates and the levels of nonperforming loans. All of those factors affect our banking subsidiaries’ ability to pay dividends to the holding company.
Various statutory provisions restrict the amount of dividends our banking subsidiaries can pay to us without regulatory approval. Our banking subsidiaries may not pay cash dividends if that payment could reduce the amount of its capital below that necessary to meet the “adequately capitalized” level in accordance with regulatory capital requirements. It is also possible that, depending upon the financial condition of our banking subsidiaries and other factors, regulatory authorities could assert that payment of dividends or other payments, including payments to us, is an unsafe or unsound practice. Under Washington law, our banking subsidiaries may make a distribution, including payment of dividends, only if, after giving effect to the distribution, in the judgment of the board of directors: (a) the corporation would be able to pay its debts as they become due in the usual course of business; and (b) the corporation’s total assets would at least equal the sum of its total liabilities plus, unless the articles of incorporation permit otherwise, the amount that would be needed if the corporation were to be dissolved at the time of the distribution to satisfy the preferential rights upon dissolution of shareholders whose preferential rights are superior to those receiving the distribution. Under the SSB Consent Agreement, Sterling Savings Bank is currently required to obtain the prior written consent of the FDIC and the WDFI before paying any cash dividend or any other form of payment or distribution representing a reduction of capital. Under our written agreement with the Reserve Bank, Sterling is required to obtain Reserve Bank approval before taking dividends from Sterling Savings Bank or Golf Savings Bank.
Emergency measures designed to stabilize the U.S. financial markets are beginning to wind down.
Since mid-2008, a host of government actions have been implemented in response to the financial crisis and the recession. Some of the programs are beginning to expire and the impact of the wind-down of these programs on the financial sector and on the nascent economic recovery is unknown. As government support schemes are cancelled, changed or withdrawn, there is a possibility that Sterling, in common with other financial institutions, may have insufficient access to, or incur higher costs associated with, funding alternatives, which could have a material adverse effect on Sterling’s business, financial condition, results of operations and prospects. In particular, the termination of the TAG program on June 30, 2010 could adversely affect us, especially in light of the concerns about our financial viability. In addition, a stall in the economic recovery or continuation or worsening of current financial market conditions could exacerbate these effects.
We are currently precluded from making any dividend payments on our common stock.
On August 19, 2009, Sterling announced the deferral of dividend payments on the Series A Preferred Stock and we are therefore currently restricted from paying dividends on our common stock. Failure to pay dividends on the Series A Preferrred Stock for six dividend periods would trigger preferred shareholder board appointment rights. Even if we were to bring our preferred dividend payments current, as long as the Series A Preferred Stock is outstanding, our payment of common stock dividends would be limited to $0.10 per common share, the amount we paid prior to October 14, 2008, unless Treasury were to consent to a higher amount. We are also currently prohibited from paying any dividends pursuant to the SSB Consent Agreement from the FDIC and the Reserve Bank Agreement. There can be no assurance as to when or if we will be able to pay dividends on our common stock.
| TX46 |
Table of Contents
Because of our participation in TARP, we are subject to restrictions on compensation paid to our executives.
Pursuant to the terms of the TARP CPP, we adopted certain standards for executive compensation and corporate governance for the period during which the U.S. Treasury holds an investment in us. These standards generally apply to our five most highly compensated senior executive officers, including our Chief Executive Officer and Chief Financial Officer, and certain of these restrictions also apply to our ten most highly compensated senior executives. The standards include, among other things:
| Ÿ | ensuring that incentive compensation for senior executives does not encourage unnecessary and excessive risks that threaten the value of the financial institution; |
| Ÿ | a required clawback of any bonus or incentive compensation paid to a senior executive officer or one of the next twenty most highly compensated employees based on statements of earnings, gains or other criteria that are later proven to be materially inaccurate; |
| Ÿ | a prohibition on making golden parachute payments to senior executive officers; |
| Ÿ | an agreement not to deduct for tax purposes annual compensation in excess of $500,000 for each senior executive officer; and |
| Ÿ | limitations on bonuses and incentive compensation. |
In particular, the change to the deductibility limit on executive compensation may increase the overall cost of our compensation programs in future periods and may make it more difficult to attract suitable candidates to serve as executive officers.
Sterling may not be able to replace key members of management or attract and retain qualified relationship managers in the future.
Sterling depends on the services of existing management to carry out its business and investment strategies. In order for Sterling to implement its strategy to emphasize relationship banking, it will need to continue to attract and retain additional management and other qualified staff. Competition for such personnel is significant in Sterling’s geographic market areas. The loss of the services of any management personnel, or the inability to recruit and retain qualified personnel in the future, could have an adverse effect on our results of operations, financial conditions and prospects.
Because of our participation in TARP, we are subject to restrictions on our ability to repurchase our shares.
Because of our participation in TARP, our ability to repurchase our shares is restricted. The U.S. Treasury’s consent generally is required for us to make any stock repurchase until the third anniversary of the investment by the U.S. Treasury unless all of the Series A Preferred Stock has been redeemed or transferred. Further, common, junior preferred or pari passu preferred shares may not be repurchased if we are in arrears on the Series A Preferred Stock dividends. On August 19, 2009, Sterling announced the deferral of dividend payments on the Series A Preferred Stock and we are therefore currently restricted from repurchasing our shares.
The financial services industry is subject to extensive regulation.
The financial services industry is subject to extensive regulation, which is undergoing major changes. As a financial institution, Sterling is subject to laws, regulations, administrative actions and policies that govern financial institutions in each location in which it operates. In 2009, as many emergency government programs slowed or wound down, global regulatory and legislative focus generally moved to a second phase of broader reform and a restructuring of financial institution regulation. Legislators and regulators in the United States are currently considering a wide range of proposals that, if enacted, could result in major changes to the way banking operations are regulated. Some of these major changes may take effect as early as 2010, and could materially impact the profitability of our business, the value of assets we hold or the collateral available for our loans, require changes to business practices or force us to
| TX47 |
Table of Contents
discontinue businesses and expose us to additional costs, taxes, liabilities, enforcement actions and reputational risk.
Certain reform proposals under consideration could result in Sterling becoming subject to stricter capital requirements and leverage limits, and could also affect the scope, coverage, or calculation of capital, all of which could require us to reduce business levels or to raise capital, including in ways that may adversely impact our creditors. In addition, we anticipate the enactment of certain reform proposals under consideration that would introduce stricter substantive standards, oversight and enforcement of rules governing consumer financial products and services, with particular emphasis on retail extensions of credit and other consumer-directed financial products or services including an impact on mortgage modifications and foreclosures.
The financial services industry is highly competitive.
We face pricing competition for loans and deposits. We also face competition with respect to customer convenience, product lines, accessibility of service and service capabilities. Our most direct competition comes from other banks, brokerages, mortgage companies and savings institutions. We also face competition from credit unions, government-sponsored enterprises, mutual fund companies, insurance companies and other non-bank businesses. A number of these banks and other financial institutions are significantly larger than we are and have substantially greater access to capital and other resources, as well as larger lending limits and branch systems, and offer a wider array of banking services. Many of our non-bank competitors are not subject to the same extensive regulations that govern us. As a result, these non-bank competitors have advantages over us in providing certain services. This significant competition in attracting and retaining deposits and making loans as well as in providing other financial services throughout our market area may have an adverse impact on future earnings and growth.
The value of the securities in our investment securities portfolio may be negatively affected by continued disruptions in securities markets.
The market for some of the investment securities held in our portfolio has become extremely volatile over the past two years. Volatile market conditions may detrimentally affect the value of these securities, such as through reduced valuations due to the perception of heightened credit and liquidity risks. There can be no assurance that the declines in market value associated with these disruptions will not result in other-than-temporary or permanent impairments of these assets, which would lead to accounting charges that could have a material adverse effect on our net income and capital levels.
A substantial decline in the value of our FHLB common stock may result in an other-than-temporary impairment charge.
We own common stock of the FHLB in order to qualify for membership in the FHLB system, which enables us to borrow funds under the FHLB advance program. The carrying value of our FHLB common stock was approximately $100.7 million as of December 31, 2009, the majority of which was with the FHLB of Seattle. The FHLB Seattle has experienced losses from credit-related charges associated with projected losses on their investments in private-label mortgage-backed securities, and is currently unable to repurchase or redeem capital stock or to pay dividends. Consequently, for this and other reasons, there is a risk that our investment in common stock of the FHLB could be deemed other than temporarily impaired at some time in the future, which would adversely affect our earnings and the value of, or market for, our common stock.
Current and future increases in FDIC insurance premiums, including the FDIC special assessment imposed on all FDIC-insured institutions, will decrease our earnings.
In May 2009, the FDIC announced that it had voted to levy a special assessment on insured institutions in order to facilitate the rebuilding of the Deposit Insurance Fund. The assessment is equal to five basis points of Sterling’s total assets minus Tier 1 capital as of June 30, 2009. This represents a charge of approximately $5.6 million, which was included in noninterest expense during the second quarter of 2009. On September 29, 2009, the FDIC voted to adopt an increase in the risk-based assessment rate effective beginning January 1, 2011, by three-basis points. The FDIC will continue to assess the need for
| TX48 |
Table of Contents
changes to the assessment rates at least semi-annually. Any such future increases in assessments will decrease our earnings and could have a material adverse effect on the value of, or market for, our common stock.
Our business is highly reliant on technology and our ability to manage the operational risks associated with technology.
We depend on internal and outsourced technology to support all aspects of our business operations. Interruption or failure of these systems creates a risk of business loss such as civil fines or damage claims from privacy breaches and adverse customer experience. Risk management programs are expensive to maintain and will not protect Sterling from all risks associated with maintaining the security of customer information, proprietary data, external and internal intrusions, disaster recovery and failures in the controls used by vendors.
Changes in accounting standards may have a material impact on how we report our financial condition and results of operations.
Our accounting policies and methods are fundamental to how we record and report our financial condition and results of operations. From time to time the Financial Accounting Standards Board (“FASB”) changes the financial accounting and reporting standards that govern the preparation of our financial statements. These changes can be difficult to predict and can have a material impact on how we record and report our financial condition and results of operations. In some cases, we could be required to apply a new or revised standard retroactively, resulting in a restatement of prior period financial statements.
We may be required to repurchase mortgage loans in some circumstances, which could harm our liquidity, results of operations and financial condition.
When we sell mortgage loans, whether as whole loans or pursuant to a securitization, we are required to make customary representations and warranties to the purchaser about the mortgage loans and the manner in which they were originated. Our whole loan sale agreements require us to repurchase or substitute mortgage loans in the event we breach any of these representations or warranties. In addition, we may be required to repurchase mortgage loans as a result of borrower fraud or in the event of early payment default of the borrower on a mortgage loan. Likewise, we are required to repurchase or substitute mortgage loans if we breach a representation or warranty in connection with our securitizations. The remedies available to us against the originating broker or correspondent may not be as broad as the remedies available to a purchaser of mortgage loans against us, and we face the further risk that the originating broker or correspondent may not have the financial capacity to perform remedies that otherwise may be available to us. Therefore, if a purchaser enforces its remedies against us, we may not be able to recover our losses from the originating broker or correspondent. If repurchase and indemnity demands increase, our liquidity, results of operations and financial condition will be adversely affected.
Sterling operations could be interrupted if its third-party service providers experience difficulty, terminate their services or fail to comply with banking regulations.
Sterling depends, and will continue to depend, to a significant extent, on a number of relationships with third-party service providers. Specifically, Sterling receives core systems processing, essential web hosting and other Internet systems and deposit and other processing services from third-party service providers. If these third-party service providers experience difficulties or terminate their services and Sterling is unable to replace them with other service providers, its operations could be interrupted. If an interruption were to continue for a significant period of time, business, financial condition and results of operations could be materially adversely affected.
Sterling’s internal control systems could fail to detect certain events.
Sterling is subject to certain operations risks, including but not limited to data processing system failures and errors and customer or employee fraud. Sterling maintains a system of internal controls to mitigate against such occurrences and maintain insurance coverage for such risks, but should such an event occur that is not prevented or detected by
| TX49 |
Table of Contents
Sterling’s internal controls, uninsured or in excess of applicable insurance limits, it could have a significant adverse impact on its business, financial condition or results of operations.
The network and computer systems on which Sterling depends could fail or experience a security breach.
Sterling’s computer systems could be vulnerable to unforeseen problems. Because Sterling conducts part of its business over the Internet and outsources several critical functions to third parties, operations will depend on the ability, as well as that of third-party service providers, to protect computer systems and network infrastructure against damage from fire, power loss, telecommunications failure, physical break-ins or similar catastrophic events. Any damage or failure that causes interruptions in operations could have a material adverse effect on business, financial condition and results of operations.
In addition, a significant barrier to online financial transactions is the secure transmission of confidential information over public networks. Sterling’s Internet banking system relies on encryption and authentication technology to provide the security and authentication necessary to effect secure transmission of confidential information. Advances in computer capabilities, new discoveries in the field of cryptography or other developments could result in a compromise or breach of the algorithms its third-party service providers use to protect customer transaction data. If any such compromise of security were to occur, it could have a material adverse effect on Sterling’s business, financial condition and results of operations.
Sterling could be held responsible for environmental liabilities of properties acquired through foreclosure.
If Sterling is forced to foreclose on a defaulted mortgage loan to recover its investment, it may be subject to environmental liabilities related to the underlying real property. Hazardous substances or wastes, contaminants, pollutants or sources thereof may be discovered on properties during its ownership or after a sale to a third party. The amount of environmental liability could exceed the value of real property. There can be no assurance that Sterling would not be fully liable for the entire cost of any removal and clean-up on an acquired property, that the cost of removal and clean-up would not exceed the value of the property, or that costs could be recovered from any third party. In addition, Sterling may find it difficult or impossible to sell the property prior to or following any environmental remediation.
We are currently subject to certain pending shareholder litigation and may be subject to similar claims in the future.
A securities class action lawsuit has been filed against Sterling and certain of our current and former officers alleging that the defendants violated sections 10(b) and 20(a) of the Securities Exchange Act of 1934 and SEC Rule 10b-5 by making false and misleading statements concerning our business and financial results. A shareholder derivative suit also has been filed against certain of our current and former officers and directors, and Sterling as a nominal defendant, alleging breaches of fiduciary duty, waste of corporate assets, and unjust enrichment. Class actions also have been filed against Sterling and certain of our current and former officers and directors alleging violations of the Employee Retirement Income Security Act of 1974, as amended (“ERISA”), by breaching their fiduciary duties to participants in the Sterling Savings Bank Employee Savings and Investment Plan and Trust. These lawsuits are all premised on similar allegations that: 1) the defendants failed to adequately disclose the extent of Sterling’s delinquent commercial real estate, construction and land development loans, properly record losses for impaired loans, properly reserve for loan losses, and properly account for our goodwill and deferred tax assets, thereby causing Sterling’s stock price to be artificially inflated during the purported class period; or 2) failed to prevent Sterling from issuing improper financial statements, maintain a sufficient allowance for loan and lease losses, and establish effective credit risk management and oversight mechanisms. It is possible that additional suits will be filed with respect to these same matters and also naming Sterling and/or our current and former officers and directors.
We cannot predict the outcome of any of these lawsuits. These lawsuits could divert the attention and resources of our management and cause Sterling to incur significant expenses for legal fees and
| TX50 |
Table of Contents
costs, including those associated with Sterling’s advancement of fees and costs on behalf of our current and former officers and directors. Since the legal responsibility and financial impact with respect to these lawsuits and claims, if any, cannot currently be ascertained, we have not established any reserves for any potential liability relating to the lawsuits. An unfavorable outcome in these lawsuits could result in the payment of substantial damages in connection with a settlement or judgment and have a material adverse effect on our business, financial condition, results of operations or cash flows.
Item 1B. Unresolved Staff Comments
Not applicable.
Sterling owns the building in which its headquarters are located in Spokane, Washington. As of December 31, 2009, Sterling also owned 101 of its 178 depository banking offices, while leasing the remainder of the properties. These facilities are located throughout Sterling’s banking network, primarily in the Pacific Northwest. Additionally, Sterling operates 37 non-depository loan production offices throughout the western United States, the majority of which are leased. See Note 6 of “Notes to Consolidated Financial Statements.”
| TX51 |
Table of Contents
Securities Class Action Litigation
On December 11, 2009, a putative securities class action complaint was filed in the United States District Court for the Eastern District of Washington against Sterling and certain of our current and former officers. The complaint alleges that the defendants violated sections 10(b) and 20(a) of the Securities Exchange Act of 1934 and SEC Rule 10b-5 by making false and misleading statements concerning our business and financial results. The complaint alleges that defendants failed to disclose the extent of Sterling’s delinquent commercial real estate, construction and land loans, properly record losses for impaired loans, properly reserve for loan losses, and properly account for our goodwill and deferred tax assets. The complaint seeks, on behalf of persons who purchased our common stock during the period from July 23, 2008 to January 13, 2009, damages of an unspecified amount and attorneys’ fees and costs. Failure by Sterling to obtain a favorable resolution of the claims set forth in the complaint could have a material adverse effect on our business, results of operations and financial condition. Currently, the amount of such material adverse effect cannot be reasonably estimated.
ERISA Class Action Litigation
On January 20 and 22, 2010, two putative class action complaints were filed in the United States District Court for the Eastern District of Washington against Sterling and certain of our current and former officers and directors. The complaints allege that defendants violated sections 404 and 405 of the Employee Retirement Income Security Act of 1974, as amended (“ERISA”), by breaching their fiduciary duties to participants in the Sterling Savings Bank Employee Savings and Investment Plan and Trust (the “Plan”). The complaints allege that defendants breached their fiduciary duties from July 23, 2008 to the date the complaints were filed by investing Plan assets in Sterling’s securities when defendants knew or should have known that the price of Sterling’s securities were inflated because Sterling had failed to disclose the extent of Sterling’s delinquent commercial real estate, construction and land loans, properly record losses for impaired loans, properly reserve for loan losses, and properly account for our goodwill and deferred tax assets. The complaints seek damages of an unspecified amount and attorneys’ fees and costs. Failure by Sterling to obtain a favorable resolution of the claims set forth in the complaints could have a material adverse effect on our business, results of operations and financial condition. Currently, the amount of such material adverse effect cannot be reasonably estimated.
Derivative Class Action Litigation
On February 10, 2010, a stockholder derivative action was filed in the Superior Court for Spokane County, Washington, allegedly on behalf of and for the benefit of Sterling, against certain of our current and former officers and directors. The complaint alleges, among other claims, breach of fiduciary duty, waste of corporate assets, and unjust enrichment. The complaint names Sterling as a nominal defendant. The complaint seeks unspecified damages, restitution, disgorgement of profits, equitable and injunctive relief, attorneys’ fees, costs, and expenses. The complaint alleges that the individual defendants failed to prevent Sterling from issuing improper financial statements, maintain a sufficient allowance for loan and lease losses, and establish effective credit risk management and oversight mechanisms regarding Sterling’s commercial real estate, construction and land development loans, losses and reserves recorded for impaired loans, and accounting for goodwill and deferred tax assets. Because the complaint is derivative in nature, it does not seek monetary damages from Sterling. However, Sterling may be required throughout the pendency of the action to advance the legal fees and costs incurred by the individual defendants and to incur other financial obligations, which could have a material adverse effect on our business, results of operations and financial condition. Currently, the amount of such material adverse effect cannot be reasonably estimated.
| TX52 |
Table of Contents
| PART II |
Item 5. Market for Registrant’s Common Equity, Related Stockholder Matters and Issuer Purchases of Equity Securities
Stock Market and Dividend Information
Sterling’s common stock is listed on The NASDAQ Global Select Market under the symbol “STSA.” On December 7, 2009, Sterling received a letter from The NASDAQ Stock Market (“NASDAQ”) notifying Sterling that it no longer meets NASDAQ’s continued listing requirement under Listing Rule 5450(a)(1) (the “Bid Price Rule”) because the bid price for its common stock has closed below $1.00 per share for 30 consecutive business days. If compliance with the Bid Price Rule cannot be established prior to June 7, 2010, Sterling’s common stock will be subject to delisting from the NASDAQ Global Select Market. Sterling may, however, be eligible for an additional grace period if it satisfies the initial listing standards (with the exception of the Bid Price Rule) for listing on The NASDAQ Capital Market, and it submits a timely application to NASDAQ to transfer the listing of its common stock to the NASDAQ Capital Market. Sterling is evaluating its options following receipt of the notification and intends to take appropriate actions in order to retain the listing of its common stock on the NASDAQ stock market. There can be no assurance that Sterling will be successful at reestablishing compliance with the Bid Price Rule and a delisting from NASDAQ would have a negative impact on the value and liquidity of our common stock.
As of January 31, 2010, Sterling’s common stock was held by 2,069 shareholders of record. The following table sets forth certain per share information for Sterling’s common stock for the periods indicated:
| 2009 Quarters Ended | ||||||||||||
| December 31 | September 30 | June 30 | March 31 | |||||||||
| Dividends declared per common share |
$ | 0.000 | $ | 0.000 | $ | 0.000 | $ | 0.000 | ||||
| Dividends paid per common share |
0.000 | 0.000 | 0.000 | 0.000 | ||||||||
| Market price per share: |
||||||||||||
| High |
1.92 | 3.44 | 5.00 | 8.87 | ||||||||
| Low |
0.53 | 1.97 | 2.14 | 1.00 | ||||||||
| Quarter end |
0.62 | 2.00 | 2.91 | 2.07 | ||||||||
| 2008 Quarters Ended | ||||||||||||
| December 31 | September 30 | June 30 | March 31 | |||||||||
| Dividends declared per common share |
$ | 0.000 | $ | 0.100 | $ | 0.100 | $ | 0.100 | ||||
| Dividends paid per common share |
0.100 | 0.100 | 0.100 | 0.095 | ||||||||
| Market price per share: |
||||||||||||
| High |
15.00 | 17.50 | 16.59 | 19.72 | ||||||||
| Low |
3.50 | 2.36 | 4.02 | 12.21 | ||||||||
| Quarter end |
8.80 | 14.50 | 4.14 | 15.61 | ||||||||
The board of directors of Sterling from time to time evaluates the payment of cash dividends. The timing and amount of any future dividends will depend upon earnings, cash and capital requirements, the financial condition of Sterling and its subsidiaries, applicable government regulations and other factors deemed relevant by Sterling’s board of directors. Pursuant to the SSB Consent Agreement and the written agreement with the Reserve Bank, Sterling is not to pay cash dividends or make any other payments or distributions representing a reduction of Sterling Savings Bank capital without the prior written consent from its regulators. Pursuant to the terms of Sterling’s participation in the CPP program of the U.S. Department of the Treasury (“Treasury”), Sterling is also prohibited from paying dividends on its common
| TX53 |
Table of Contents
stock so long as Sterling’s payments on its preferred stock remain deferred. Sterling is further prohibited from increasing the dividends to be paid to shareholders above the $0.10 per share quarterly dividend paid for the quarter ended September 30, 2008. This restriction on Sterling’s ability to increase its dividends will continue until either Sterling redeems all of the preferred shares sold to Treasury, or December 2011, whichever is earliest.
Performance Graph
The following graph compares our cumulative total stockholder return since December 31, 2004 with the Russell 2000 Index and the SNL NASDAQ Bank Index. The graph assumes that the value of the investment in our common stock and each index (including reinvestment of dividends) was $100.00 on December 31, 2004.
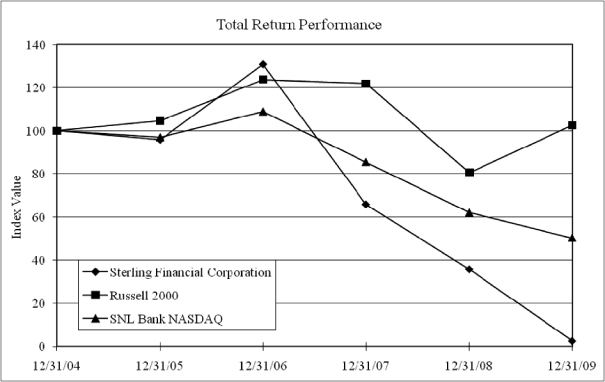
| TX54 |
Table of Contents
Item 6. Selected Financial Data
The following selected financial data is derived from Sterling’s audited financial statements. Comparability among particular amounts may be affected by past acquisitions:
| Years Ended December 31, | ||||||||||||||||||||
| 2009 | 2008 | 2007 | 2006 | 2005 | ||||||||||||||||
| (Dollars in thousands, except per share amounts) | ||||||||||||||||||||
| Income Statement Data: |
||||||||||||||||||||
| Interest income |
$ | 599,347 | $ | 715,062 | $ | 766,978 | $ | 550,855 | $ | 387,811 | ||||||||||
| Interest expense |
(255,370 | ) | (355,510 | ) | (411,618 | ) | (286,943 | ) | (171,276 | ) | ||||||||||
| Net interest income |
343,977 | 359,552 | 355,360 | 263,912 | 216,535 | |||||||||||||||
| Provision for credit losses |
(681,371 | ) | (333,597 | ) | (25,088 | ) | (18,703 | ) | (15,200 | ) | ||||||||||
| Net interest income after provision for credit losses |
(337,394 | ) | 25,955 | 330,272 | 245,209 | 201,335 | ||||||||||||||
| Non-interest income |
123,814 | 91,895 | 93,406 | 69,164 | 59,092 | |||||||||||||||
| Non-interest expenses |
(369,974 | ) | (305,517 | ) | (285,465 | ) | (206,197 | ) | (169,804 | ) | ||||||||||
| Goodwill impairment |
(227,558 | ) | (223,765 | ) | 0 | 0 | 0 | |||||||||||||
| Total non-interest expenses |
(597,532 | ) | (529,282 | ) | (285,465 | ) | (206,197 | ) | (169,804 | ) | ||||||||||
| Income before income taxes |
(811,112 | ) | (411,432 | ) | 138,213 | 108,176 | 90,623 | |||||||||||||
| Income tax benefit (provision) |
(26,982 | ) | 75,898 | (44,924 | ) | (34,230 | ) | (29,404 | ) | |||||||||||
| Net income (loss) |
(838,094 | ) | (335,534 | ) | 93,289 | 73,946 | 61,219 | |||||||||||||
| Preferred stock dividend |
(17,369 | ) | (1,208 | ) | 0 | 0 | 0 | |||||||||||||
| Net income (loss) applicable to common shareholders |
$ | (855,463 | ) | $ | (336,742 | ) | $ | 93,289 | $ | 73,946 | $ | 61,219 | ||||||||
| Earnings per common share: |
||||||||||||||||||||
| Basic |
$ | (16.48 | ) | $ | (6.51 | ) | $ | 1.87 | $ | 2.03 | $ | 1.77 | ||||||||
| Diluted |
(16.48 | ) | (6.51 | ) | 1.86 | 2.01 | 1.75 | |||||||||||||
| Dividends declared per common share |
$ | 0.000 | $ | 0.300 | $ | 0.350 | $ | 0.270 | $ | 0.105 | ||||||||||
| Weighted average shares outstanding: |
||||||||||||||||||||
| Basic |
51,922,275 | 51,721,671 | 49,786,349 | 36,423,095 | 34,633,952 | |||||||||||||||
| Diluted |
51,922,275 | 51,721,671 | 50,217,515 | 36,841,866 | 35,035,029 | |||||||||||||||
| Other Data: |
||||||||||||||||||||
| Book value per common share |
$ | 0.56 | $ | 16.29 | $ | 23.04 | $ | 18.63 | $ | 14.54 | ||||||||||
| Tangible book value per common share |
$ | 0.14 | $ | 11.41 | $ | 13.61 | $ | 12.07 | $ | 10.80 | ||||||||||
| Return on assets |
-6.81 | % | -2.65 | % | 0.83 | % | 0.88 | % | 0.87 | % | ||||||||||
| Return on common equity |
-129.8 | % | -28.8 | % | 8.6 | % | 13.0 | % | 12.4 | % | ||||||||||
| Shareholders’ equity to total assets |
3.0 | % | 8.9 | % | 9.8 | % | 8.0 | % | 6.7 | % | ||||||||||
| Operating efficiency |
127.7 | % | 117.2 | % | 63.6 | % | 61.9 | % | 61.6 | % | ||||||||||
| Tax equivalent net interest margin |
2.92 | % | 3.08 | % | 3.42 | % | 3.33 | % | 3.30 | % | ||||||||||
| Nonperforming assets to total assets |
9.08 | % | 4.77 | % | 1.11 | % | 0.13 | % | 0.14 | % | ||||||||||
| Employees (full-time equivalents) |
2,641 | 2,481 | 2,571 | 2,405 | 1,789 | |||||||||||||||
| Depository branches |
178 | 178 | 178 | 166 | 140 | |||||||||||||||
| TX55 |
Table of Contents
Item 6. Selected Financial Data (continued)
| December 31, | ||||||||||||||||||||
| 2009 | 2008 | 2007 | 2006 | 2005 | ||||||||||||||||
| (Dollars in thousands) | ||||||||||||||||||||
| Balance Sheet Data: |
||||||||||||||||||||
| Total assets |
$ | 10,877,423 | $ | 12,790,716 | $ | 12,149,775 | $ | 9,834,492 | $ | 7,562,377 | ||||||||||
| Loans receivable, net |
7,344,199 | 8,807,094 | 8,948,307 | 7,021,241 | 4,889,366 | |||||||||||||||
| Mortgage-backed securities |
1,944,989 | 2,420,012 | 1,785,031 | 1,687,672 | 1,960,582 | |||||||||||||||
| Investments |
232,982 | 395,108 | 201,033 | 134,077 | 91,331 | |||||||||||||||
| Deposits |
7,775,190 | 8,350,407 | 7,677,772 | 6,746,028 | 4,806,301 | |||||||||||||||
| FHLB advances |
1,337,167 | 1,726,549 | 1,687,989 | 1,308,617 | 1,443,462 | |||||||||||||||
| Reverse repurchase agreements and funds purchased |
1,049,146 | 1,163,023 | 1,178,845 | 616,354 | 611,676 | |||||||||||||||
| Other borrowings |
248,281 | 248,276 | 273,015 | 240,226 | 110,688 | |||||||||||||||
| Shareholders’ equity |
323,249 | 1,141,036 | 1,185,330 | 783,416 | 506,685 | |||||||||||||||
| Capital Ratios (1): |
||||||||||||||||||||
| Tier 1 leverage (to average assets) |
||||||||||||||||||||
| Sterling |
3.5 | % | 9.2 | % | 8.7 | % | 8.7 | % | 7.4 | % | ||||||||||
| Sterling Savings Bank |
4.2 | % | 8.3 | % | 8.5 | % | 8.6 | % | 7.2 | % | ||||||||||
| Golf Savings Bank |
11.2 | % | 12.6 | % | 7.3 | % | 6.9 | % | N/A | |||||||||||
| Tier I (to risk-weighted assets) |
||||||||||||||||||||
| Sterling |
4.9 | % | 11.7 | % | 10.1 | % | 10.0 | % | 9.5 | % | ||||||||||
| Sterling Savings Bank |
5.9 | % | 10.6 | % | 9.8 | % | 9.7 | % | 9.2 | % | ||||||||||
| Golf Savings Bank |
17.8 | % | 17.8 | % | 10.2 | % | 10.9 | % | N/A | |||||||||||
| Total (to risk-weighted assets) |
||||||||||||||||||||
| Sterling |
7.9 | % | 13.0 | % | 11.3 | % | 11.1 | % | 10.5 | % | ||||||||||
| Sterling Savings Bank |
7.3 | % | 11.8 | % | 11.0 | % | 10.8 | % | 10.2 | % | ||||||||||
| Golf Savings Bank |
19.0 | % | 19.1 | % | 10.8 | % | 11.6 | % | N/A | |||||||||||
| (1) | Golf Savings Bank’s capital ratios have not been disclosed for periods prior to Sterling’s acquisition of Golf Savings Bank in July 2006. |
| TX56 |
Table of Contents
Item 7. Management’s Discussion and Analysis of Financial Condition and Results of Operations
The following discussion and analysis should be read in conjunction with the Consolidated Financial Statements and Notes thereto presented elsewhere in this report. This report contains forward-looking statements within the meaning of the Private Securities Litigation Reform Act of 1995. For a discussion of the risks and uncertainties inherent in such statements, see “Business—Forward-Looking Statements” and “Risk Factors.”
Executive Summary and Highlights
Sterling’s earnings per share and performance ratios for 2009 have continued to be impacted by the major disruption in the housing market and downturn in the economy. For the year ended December 31, 2009, Sterling recorded a loss of $855.5 million, or $16.48 per common share, reflecting a $681.4 million provision for credit losses, non-cash charges of $227.6 million to reflect impairment of Sterling’s goodwill, and a $269.0 million valuation allowance against its deferred tax asset. Sterling faces a number of challenges resulting from current and prior year losses, driven by credit quality issues, and is categorized as being undercapitalized by regulatory guidelines. In the fourth quarter of 2009, Sterling Savings Bank entered into a Stipulation and Consent to the Issuance of an Order to Cease and Desist (the “SSB Consent Agreement”) with the Federal Deposit Insurance Corporation (“FDIC”) and the Washington State Department of Financial Institutions (“WDFI”). Under the terms of the agreement, Sterling Savings Bank has agreed to, among other things, raise capital of at least $300 million, and maintain a Tier 1 leverage ratio of not less than 10%. The agreement set a deadline of December 15, 2009 for meeting these capital requirements, which Sterling was not able to meet. During the fourth quarter, Sterling and the Federal Reserve Bank of San Francisco (the “Reserve Bank”) entered into a written agreement (the “Reserve Bank Agreement”) to enhance Sterling’s ability to act as a source of strength to Sterling Savings Bank and Golf Savings Bank. Substantially all of the requirements of the Reserve Bank Agreement are similar to those imposed on Sterling Savings Bank by the FDIC. Sterling Savings Bank has failed to increase its Tier 1 capital to the levels required by the SSB Consent Agreement and does not comply with certain of the requirements of the Reserve Bank Agreement and the SSB Consent Agreement. The uncertainty around Sterling’s ability to comply with these agreements has raised substantial doubts about Sterling’s ability to continue as a going concern. For a discussion of the strategic alternatives designed to put Sterling on a sound financial footing and allow it to recapitalize and grow its business, see “Business—Recent Developments.”, “—Risk Factors,” “—Forward-Looking Statements,” “Regulation—Federal and State Regulation of Banking Activities” and Note 25 of “Notes to Consolidated Financial Statements.”
| Ÿ | Allowance for credit losses was 4.62% of loans, compared with 2.55% at December 31, 2008, reflecting the continuing efforts to recognize and address nonperforming loans. |
| Ÿ | Transaction account balances grew 50%, while the number of accounts was up 5%. |
| Ÿ | Liquidity, as measured by the net loans-to-deposits ratio, improved 11 percentage points during 2009 to 94%. |
| Ÿ | Deposit funding costs were lowered 87 basis points year over year. |
| Ÿ | Non-interest income increased 35% over last year to $123.8 million. |
| Ÿ | Mortgage banking income rose 71% over last year to $47.3 million. |
| Ÿ | Total risk-based capital ratio was 7.9% at December 31, 2009. |
The accounting and reporting policies of Sterling conform to generally accepted accounting principles (“GAAP”) and to general practices within the banking industry. The preparation of the financial statements in accordance with GAAP requires management to make estimates and assumptions
| TX57 |
Table of Contents
that affect the amounts reported in the financial statements and accompanying notes. Actual results could differ from those estimates. Sterling’s management has identified the accounting policies described below as those that, due to the judgments, estimates and assumptions inherent in those policies are critical to an understanding of Sterling’s Consolidated Financial Statements and MD&A.
Income Recognition. Sterling recognizes interest income by methods that conform to general accounting practices within the banking industry. In the event management believes collection of all or a portion of contractual interest on a loan has become doubtful, which generally occurs when the loan is 90 days past due or when Sterling restructures a troubled loan, Sterling discontinues the accrual of interest, and any previously accrued interest recognized in income deemed uncollectible is reversed. Interest received on nonperforming loans is included in income only if principal recovery is reasonably assured. A nonperforming loan is restored to accrual status when it is brought current, has performed in accordance with contractual terms for a reasonable period of time, generally at least six months, and the collectability of the total contractual principal and interest is no longer in doubt.
Allowance for Credit Losses. The allowance for credit losses is composed of the allowance for loan losses and the reserve for unfunded credit commitments. In general, determining the amount of the allowance requires significant judgment and the use of estimates by management. Sterling maintains an allowance for credit losses to absorb probable losses in the loan portfolio based on a quarterly analysis of the portfolio and expected future losses. This analysis is designed to determine an appropriate level and allocation of the allowance for losses among loan types by considering factors affecting loan losses, including specific and confirmed losses, levels and trends in classified and nonperforming loans, historical loan loss experience, loan migration analysis, current national and local economic conditions, volume, growth and composition of the portfolio, regulatory guidance and other relevant factors. Management monitors the loan portfolio to evaluate the adequacy of the allowance. The allowance can increase or decrease each quarter based upon the results of management’s analysis.
The portfolio is grouped into standard industry categories for homogeneous loans based on characteristics such as loan type, borrower and collateral. Annual and quarterly loan migration to loss data is used to determine the probability of default. Historically, Sterling had used both one-year and three-year losses to establish the expected loss rate on loans. During the fourth quarter of 2009, as a result of the higher loss rates experienced during 2009, Sterling began using losses from the most recent twelve months to estimate the amount that would be lost if a default were to occur, which is termed the loss given default. The probability of default is multiplied by the loss given default to calculate the expected losses for each loan category.
Individual loan reviews are based upon specific quantitative and qualitative criteria, including the size of the loan, loan quality ratings, value of collateral, repayment ability of borrowers, and historical experience factors. The historical experience factors utilized and allowances for homogeneous loans (such as residential mortgage loans, consumer loans, etc.) are collectively evaluated based upon historical loss experience, loan migration analysis, trends in losses and delinquencies, growth of loans in particular markets, and known changes in economic conditions in each particular lending market.
A loan is considered impaired when, based on current information and events, it is probable Sterling will be unable to collect the scheduled payments of principal and interest when due according to the contractual terms of the loan agreement. Factors considered by management in determining impairment include payment status, collateral value and the probability of collecting scheduled principal and interest payments when due. Loans that experience insignificant payment delays and payment shortfalls generally are not classified as impaired. Management determines the significance of payment delays and payment shortfalls on a case-by-case basis, taking into consideration all of the circumstances surrounding the loan and the borrower, including the length of delay, the reasons for the delay, the borrower’s prior payment record and the amount of the shortfall in relation to the principal and interest owed. Impairment is measured on a loan-by-loan basis by either the present value of expected future cash
| TX58 |
Table of Contents
flows discounted at the loan’s effective interest rate, the loan’s obtainable market price or the fair value of collateral if the loan is collateral dependent.
The fair value of the underlying collateral for real estate loans, which may or may not be collateral dependent, is determined by using appraisals from qualified external sources. For commercial properties and residential development loans, the external appraisals are reviewed by qualified internal appraisal staff to ensure compliance with appropriate standards and technical accuracy. Updated appraisals are ordered in accordance with regulatory provisions for extensions or restructurings of commercial or residential real estate construction and permanent loans that have not performed within the terms of the original loan. Updated appraisals are also ordered for loans that have not been restructured, but that have stale valuation information, generally defined in the current market as information older than six months, and deteriorating credit quality that warrants classification as substandard.
The timing of obtaining appraisals may vary, depending on the nature and complexity of the property being evaluated and the general breadth of appraisal activity in the marketplace, but generally it is within 30 to 90 days of recognition of substandard status, following determination of collateral dependency, or in connection with a loan’s maturity or a negotiation that may result in the restructuring or extension of a real estate secured loan. Delays in timing may occur to comply with actions such as a bankruptcy filing or provisions of an SBA guarantee.
Estimates of fair value may be used for substandard collateral dependent loans at quarter end if external appraisals are not expected to be completed in time for determining quarter end results or to update values between appraisal dates that reflect updated values based on recent sales activity of comparable inventory or pending property sales of the subject collateral. During the fourth quarter of 2009, as a result of the large decline in real estate values during 2009, Sterling began to record a specific reserve for impaired loans for which an updated valuation analysis has not been completed within the last quarter. The specific reserve is calculated by applying an estimated fair value adjustment to each loan based on market and property type. Estimates of value are not used to raise a value; however, estimates may be used to recognize deterioration of market values in quarters between appraisal updates. The judgment with respect to recognition of any provision or related charge-off for a confirmed loss also takes into consideration whether the loan is collateral dependent or whether it is supported by sources of repayment or cash flow beyond the collateral that is being valued. For loans that are deemed to be collateral dependent, the amount of charge-offs is determined in relation to the collateral’s appraised value. For loans that are not deemed to be collateral dependent, the amount of charge-offs may differ from the collateral’s appraised value because there is additional support for the loan, such as cash flow from other sources.
While management uses available information to provide for loan losses, the ultimate collectability of a substantial portion of the loan portfolio and the need for future additions to the allowance will be influenced by changes in economic conditions and other relevant factors. The current slowdown in economic activity and further declines in real estate values could continue to adversely affect cash flows for both commercial and individual borrowers, and as a result Sterling could experience further increases in nonperforming assets, delinquencies and losses on loans. There can be no assurance that the allowance for credit losses will be adequate to cover all losses, but management believes the allowance for credit losses was adequate at December 31, 2009.
Investments and MBS . Assets in the investment and MBS portfolios are initially recorded at cost, which includes any premiums and discounts. Sterling amortizes premiums and discounts as an adjustment to interest income over the estimated life of the security. The cost of investment securities sold, and any resulting gain or loss, is based on the specific identification method. Sterling’s MBS are primarily in agency securities, with limited investments in non-agency obligations. The majority of the municipal bonds that Sterling holds are all general obligation, spread throughout Sterling’s footprint. Sterling does not invest in collateralized debt obligations or similar exotic structured investment products.
| TX59 |
Table of Contents
The loans underlying Sterling’s MBS are subject to the prepayment of principal of the underlying loans. The rate at which prepayments are expected to occur in future periods impacts the amount of premium to be amortized in the current period. If prepayments in a future period are higher or lower than expected, then Sterling will need to amortize a larger or smaller amount of premium to interest income in that future period.
Management determines the appropriate classification of investment securities at the time of purchase. Held-to-maturity securities are those securities that Sterling has the positive intent and ability to hold to maturity and are recorded at amortized cost. Available-for-sale securities are those securities that would be available to be sold in the future in response to Sterling’s liquidity needs, changes in market interest rates, and asset-liability management strategies, among other factors. Available-for-sale securities are reported at fair value, with unrealized holding gains and losses reported in shareholders’ equity as a separate component of other comprehensive income, net of applicable deferred income taxes.
Management evaluates investment securities for other than temporary declines in fair value on a quarterly basis. If the fair value of investment securities falls below their amortized cost and the decline is deemed to be other than temporary, the securities will be written down to current market value, resulting in a loss. There were no investment securities that management identified to be other than-temporarily impaired for the year ended December 31, 2009, because the decline in fair value of certain classes of securities was attributable to temporary disruptions of credit markets and the related impact on securities within those classes, not deteriorating credit quality of specific securities. Sterling holds positions in classes of securities negatively impacted by temporary credit market disruptions, including a single-issuer trust preferred security, and private label collateralized mortgage obligations. As of December 31, 2009, the trust preferred security is rated A1 by Moody’s and has an amortized cost of $24.7 million compared with an $18.8 million market value, or an unrealized loss of $5.9 million. As of December 31, 2009, the private label collateralized mortgage obligations had an aggregate amortized cost of $163.3 million compared with a $155.2 million market value, or an unrealized loss of $8.1 million. All are stress-tested monthly for both credit quality and collateral strength, and are investment grade according to at least one rating agency. Subsequent to December 31, 2009, S&P downgraded one of these securities below investment grade, while Moody’s maintained its investment grade rating on the same security. At December 31, 2009, this security had an amortized cost of $17.4 million and a market value of $15.3 million. The years of issuance, or vintage, for these nonagency MBS ranges from 2003 to 2005. As of December 31, 2009, Sterling expects the return of all principal and interest on all securities within the portfolios pursuant to the contractual terms, has the ability and intent to hold these investments, has no intent to sell securities that are deemed to have a market value impairment, nor does Sterling believe it is more likely than not that it would be required to sell these investments before a recovery in market price occurs, or until maturity. Realized losses could occur in future periods due to a change in management’s intent to hold the investments to recovery, a change in management’s assessment of credit risk, or a change in regulatory or accounting requirements.
During the fourth quarter of 2009, Sterling reclassified its held-to-maturity municipal bond portfolio to available-for-sale. The portfolio’s amortized book value of $149.5 million was approximately equivalent to its market value at the time of transfer. The reclassification reflected a change in Sterling’s intended holding period due to capital, liquidity and risk management objectives, the geographic distribution of the municipalities as compared to Sterling’s footprint, as well as a decrease in the relative attractiveness of these securities when being assessed on a pre-tax basis. See Note 2 of “Notes to Consolidated Financial Statements.”
Fair Value of Financial Instruments. Sterling’s available-for-sale securities portfolio totaled $2.16 billion and $2.64 billion as of December 31, 2009 and 2008, respectively, and were the majority of Sterling’s financial instruments that are carried at fair value. These securities are valued using a pricing service’s matrix technique based on quoted prices for similar instruments, which Sterling validates with non-binding broker quotes, in depth collateral analysis and cash flow stress testing.
| TX60 |
Table of Contents
Loans held for sale are also carried at fair value in order to match changes in the value of the loans with the value of the economic hedges on the loans without having to apply complex hedge accounting. The fair value of loans held for sale is determined based upon an analysis of investor quoted pricing inputs.
Goodwill and Other Intangible Assets. Goodwill represents the difference between the value of consideration paid and the fair value of the net assets received in a business combination. Sterling records impairment losses as charges to noninterest expense and adjustments to the carrying value of goodwill. Goodwill is tested for impairment on an annual basis, or more frequently as events occur, or as current circumstances and conditions warrant. The analysis compares the fair value of each of the reporting units, including goodwill, to the respective carrying amounts. If the carrying amount of the reporting unit, including goodwill, exceeds the fair value of that reporting unit, then further testing for goodwill impairment is performed.
During the fourth quarter of 2008, due to reduced expectations for near term profitability, and the protracted decline in Sterling’s stock price and market capitalization, Sterling determined that impairment had occurred, and at that time wrote off $223.8 million of its goodwill. On October 9, 2009, Sterling Savings Bank entered into the SSB Consent Agreement with the FDIC and the WDFI. Sterling considered the SSB Consent Agreement to be a triggering event that required Sterling to test its goodwill for impairment as of September 30, 2009.
In order to determine the fair value of its Community Banking segment, Sterling employed three valuation approaches: the Control Premium approach, the Comparable Transactions approach and the Discounted Cash Flow approach. The Control Premium approach used Sterling’s trading multiples of price-to-earnings, price-to-book value and price-to-tangible book value to estimate the Community Banking segment’s value as if it were publicly traded, with the Community Banking segment’s public equivalent value then adjusted upwards for an appropriate premium to reflect an acquisition of control. The Comparable Transactions approach reflected pricing ratios paid by third parties acquiring control of banking companies with similar characteristics in recent periods, and these multiples were used to develop a range of fair values for acquiring control of the Bank. The Discounted Cash Flow approach determined fair value based on the present value of assumed dividends over a five-year period, assuming the Community Banking segment were to remain independent, plus the present value of a terminal value determined based on assumed acquisition pricing for the Community Banking segment at the end of the fifth year. Due to the inability to project future earnings with reasonable certainty, no value was assigned to the Discounted Cash Flow approach. The values derived from the Control Premium approach and the Comparable Transaction approach were considered within the hierarchy prescribed by fair value accounting standards to determine the fair value of the reporting unit. The comparison of the fair value of the reporting unit to its carrying value indicated that potential impairment existed. This was a result of the SSB Consent Agreement, uncertain near term earnings prospects, and the recent decline in Sterling’s stock price and market capitalization. Sterling then performed the second step of goodwill impairment testing to determine how much, if any, impairment existed. In Step 2, Sterling assigned a fair value to all of the assets and liabilities of the reporting unit as if it had been acquired in a business combination. The Step 2 analysis indicated that the implied fair value of the goodwill was less than the carrying value of goodwill. As a result of this analysis, Sterling recorded a goodwill impairment charge of $227.6 million, reducing the balance of goodwill to zero, as compared to the December 31, 2008 balance of $227.6 million.
As of December 31, 2009, Sterling had other intangible assets related to acquired depository relationships of $21.8 million, compared with $26.7 million as of December 31, 2008. Other intangible assets are periodically assessed for impairment when certain triggering events occur that indicate the possibility of impairment. Recent triggering events that resulted in the goodwill impairment charges did not indicate impairment in regards to these core deposit intangibles.
Loan Purchases. In accordance with accounting standards, loans are recorded at fair value if, when they are acquired, they show evidence of deterioration in terms of credit quality, and a loss is deemed likely to occur. Fair value is defined as the present value of future cash flows, including interest
| TX61 |
Table of Contents
income, to be recognized over the life of the loan. These standards prohibit the carryover of an allowance for loan loss on certain acquired loans within its scope that are considered in the future cash flow assessment. Sterling considers this guidance when entering into applicable transactions.
Other Real Estate Owned. Prior to foreclosure, Sterling considers all viable alternatives, checks with the proper authorities to ensure the existence of a valid and recorded lien on the property and determines the current market value of the collateral.
Property and other assets acquired through foreclosure of defaulted mortgage or other collateralized loans are carried at fair value, less estimated costs to sell the property and other assets. The fair value of OREO is generally determined using as is or disposition values from appraisals obtained by independent appraisers.
An allowance for losses on real estate and other assets owned is designed to include amounts for estimated losses as a result of impairment in value of the real property after repossession. Sterling reviews its real estate owned for impairment in value at least quarterly or whenever events or circumstances indicate that the carrying value of the property or other assets may not be recoverable. In performing the review, if the fair value, less selling costs, is less than its carrying value, an impairment loss is recognized as a charge to operating expenses.
Income Taxes. Sterling estimates income taxes payable based on the amount it expects to owe various tax authorities. Taxes are discussed in more detail in Note 12 of Notes to Consolidated Financial Statements. Accrued income taxes represent the net estimated amount due to, or to be received from, taxing authorities. In estimating accrued income taxes, Sterling assesses the relative merits and risks of the appropriate tax treatment of transactions, taking into account the applicable statutory, judicial and regulatory guidance in the context of Sterling’s tax position. Sterling also considers recent audits and examinations, as well as its historical experience in making such estimates. Although Sterling uses available information to record income taxes, underlying estimates and assumptions can change over time as a result of unanticipated events or circumstances.
Sterling uses an estimate of future earnings, and an evaluation of its loss carryback ability and tax planning strategies to determine whether or not the benefit of its net deferred tax asset will be realized. During 2009, Sterling determined that the negative evidence associated with the three year cumulative loss for the period ending December 31, 2009, the recent SSB Consent Agreement entered into with its regulators, and continued credit deterioration in its loan portfolio outweighed the positive evidence in regards to whether or not Sterling would be able to generate taxable income in the near term, and a valuation allowance was established against its deferred tax asset, with the allowance totaling $269.0 million as of December 31, 2009. Sterling will not be able to recognize the tax benefits on future losses until it can show that it is more likely than not that it will generate enough taxable income in future periods to realize the benefits of its deferred tax asset and loss carryforwards. As of December 31, 2009, Sterling has recorded a $49.8 million income tax receivable, which represents amounts that can be realized through loss carrybacks to prior tax years and refunds of estimated tax payments. As of December 31, 2009, Sterling had a net deferred tax liability of $8.4 million, compared with a net deferred tax asset of $90.1 million as of December 31, 2008.
The most significant component of earnings for a financial institution typically is net interest income, which is the difference between interest income, primarily from loan, MBS and investment securities portfolios, and interest expense, primarily on deposits and borrowings. Net interest margin refers to net interest income divided by total average interest-earning assets and is influenced by the level and relative mix of interest-earning assets and interest-bearing liabilities. Net interest spread refers to the difference between the yield on interest-earning assets and the rate paid on interest-bearing liabilities.
| TX62 |
Table of Contents
The following table sets forth, on a tax equivalent basis, information with regard to Sterling’s net interest income, net interest spread and net interest margin:
| Years Ended December 31, | |||||||||||||||||||||||||||
| 2009 | 2008 | 2007 | |||||||||||||||||||||||||
| Average Balance |
Income/ Expense |
Average Yield/ Rate (1) |
Average Balance |
Income/ Expense |
Average Yield/ Rate (1) |
Average Balance |
Income/ Expense |
Average Yield/ Rate (1) |
|||||||||||||||||||
| (Dollars in thousands) | |||||||||||||||||||||||||||
| ASSETS: |
|||||||||||||||||||||||||||
| Loans: |
|||||||||||||||||||||||||||
| Mortgage |
$ | 5,321,761 | $ | 266,150 | 5.00 | % | $ | 5,501,102 | $ | 350,718 | 6.38 | % | $ | 4,994,656 | $ | 401,084 | 8.03 | % | |||||||||
| Commercial and consumer |
3,685,058 | 213,828 | 5.80 | % | 3,850,263 | 249,020 | 6.47 | % | 3,568,815 | 279,422 | 7.83 | % | |||||||||||||||
| Total loans |
9,006,819 | 479,978 | 5.33 | % | 9,351,365 | 599,738 | 6.41 | % | 8,563,471 | 680,506 | 7.95 | % | |||||||||||||||
| Mortgage-backed securities |
2,310,582 | 108,513 | 4.70 | % | 2,051,882 | 102,863 | 5.01 | % | 1,655,371 | 79,266 | 4.79 | % | |||||||||||||||
| Investments and cash equivalents |
631,044 | 15,647 | 2.48 | % | 423,368 | 16,660 | 3.94 | % | 270,384 | 10,302 | 3.81 | % | |||||||||||||||
| Total interest-earning assets |
11,948,445 | 604,138 | 5.06 | % | 11,826,615 | 719,261 | 6.08 | % | 10,489,226 | 770,074 | 7.34 | % | |||||||||||||||
| Noninterest-earning assets (2) |
357,766 | 841,147 | 778,201 | ||||||||||||||||||||||||
| Total average assets |
$ | 12,306,211 | $ | 12,667,762 | $ | 11,267,427 | |||||||||||||||||||||
| LIABILITIES and EQUITY: |
|||||||||||||||||||||||||||
| Deposits: |
|||||||||||||||||||||||||||
| Transaction |
$ | 1,824,175 | 2,534 | 0.14 | % | $ | 1,321,932 | 1,372 | 0.10 | % | $ | 1,359,066 | 2,543 | 0.19 | % | ||||||||||||
| Savings and MMDA |
1,758,678 | 15,941 | 0.91 | % | 2,173,133 | 46,231 | 2.13 | % | 2,078,984 | 71,665 | 3.45 | % | |||||||||||||||
| Time deposits |
4,718,946 | 150,786 | 3.20 | % | 4,553,160 | 186,734 | 4.10 | % | 4,039,152 | 203,406 | 5.04 | % | |||||||||||||||
| Total deposits |
8,301,799 | 169,261 | 2.04 | % | 8,048,225 | 234,337 | 2.91 | % | 7,477,202 | 277,614 | 3.71 | % | |||||||||||||||
| Borrowings |
2,893,477 | 86,109 | 2.98 | % | 3,292,287 | 121,173 | 3.68 | % | 2,604,764 | 134,004 | 5.14 | % | |||||||||||||||
| Total interest-bearing liabilities |
11,195,276 | 255,370 | 2.28 | % | 11,340,512 | 355,510 | 3.13 | % | 10,081,966 | 411,618 | 4.08 | % | |||||||||||||||
| Noninterest-bearing liabilities |
158,666 | 136,082 | 101,044 | ||||||||||||||||||||||||
| Total average liabilities |
11,353,942 | 11,476,594 | 10,183,010 | ||||||||||||||||||||||||
| Total average shareholders’ equity |
952,269 | 1,191,168 | 1,084,417 | ||||||||||||||||||||||||
| Total average liabilities and equity |
$ | 12,306,211 | $ | 12,667,762 | $ | 11,267,427 | |||||||||||||||||||||
| Tax equivalent net interest spread |
$ | 348,768 | 2.78 | % | $ | 363,751 | 2.95 | % | $ | 358,456 | 3.26 | % | |||||||||||||||
| Tax equivalent net interest margin |
2.92 | % | 3.08 | % | 3.42 | % | |||||||||||||||||||||
| Ratio of average interest-earning assets to average interest-bearing liabilities |
106.73 | % | 104.29 | % | 104.04 | % | |||||||||||||||||||||
| TX63 |
Table of Contents
| (1) | The yield information for the available-for-sale portfolio does not give effect to changes in fair value that are reflected as a component of shareholders’ equity. |
| (2) | The decline in the average balance of noninterest earning assets during 2009 was mainly a result of the goodwill impairment. |
Changes in Sterling’s net interest income are a function of changes in both rates and volumes of interest-earning assets and interest-bearing liabilities. Volume refers to the dollar level of interest-earning assets and interest-bearing liabilities. The following table presents the composition of the change in net interest income, on a tax equivalent basis, for the periods presented. Interest income from municipal loans and bonds is presented gross of applicable tax savings. For each category of interest-earning assets and interest-bearing liabilities, the following table provides information on changes attributable to:
| Ÿ | Volume—changes in volume multiplied by comparative period rate; |
| Ÿ | Rate—changes in rate multiplied by comparative period volume; and |
| Ÿ | Rate/volume—changes in rate multiplied by changes in volume. |
| December 31, 2009 | December 31, 2008 | ||||||||||||||||||||||||||||||
| Increase (Decrease) Due to: | Increase (Decrease) Due to: | ||||||||||||||||||||||||||||||
| Volume | Rate | Rate/ Volume |
Total | Volume | Rate | Rate/ Volume |
Total | ||||||||||||||||||||||||
| (Dollars in thousands) | |||||||||||||||||||||||||||||||
| Interest income: |
|||||||||||||||||||||||||||||||
| Loans: |
|||||||||||||||||||||||||||||||
| Mortgage |
$ | (2,649 | ) | $ | (19,334 | ) | $ | (62,587 | ) | $ | (84,570 | ) | $ | 40,669 | $ | (82,654 | ) | $ | (8,381 | ) | $ | (50,366 | ) | ||||||||
| Commercial and consumer |
(2,740 | ) | (5,258 | ) | (27,188 | ) | (35,186 | ) | 22,036 | (48,605 | ) | (3,833 | ) | (30,402 | ) | ||||||||||||||||
| Total loans |
(5,389 | ) | (24,592 | ) | (89,775 | ) | (119,756 | ) | 62,705 | (131,259 | ) | (12,214 | ) | (80,768 | ) | ||||||||||||||||
| Mortgage-backed securities |
3,269 | (1,638 | ) | 4,020 | 5,651 | 18,986 | 3,720 | 892 | 23,598 | ||||||||||||||||||||||
| Investment and cash equivalents |
1,212 | (840 | ) | (1,385 | ) | (1,013 | ) | 5,828 | 339 | 192 | 6,359 | ||||||||||||||||||||
| Total interest income |
(908 | ) | (27,070 | ) | (87,140 | ) | (115,118 | ) | 87,519 | (127,200 | ) | (11,130 | ) | (50,811 | ) | ||||||||||||||||
| Interest expense: |
|||||||||||||||||||||||||||||||
| Deposits |
(2,239 | ) | (16,496 | ) | (46,340 | ) | (65,075 | ) | 29,061 | (66,320 | ) | (6,016 | ) | (43,275 | ) | ||||||||||||||||
| Borrowings |
(4,538 | ) | (4,932 | ) | (25,595 | ) | (35,065 | ) | 35,370 | (38,135 | ) | (10,066 | ) | (12,831 | ) | ||||||||||||||||
| Total interest expense |
(6,777 | ) | (21,428 | ) | (71,935 | ) | (100,140 | ) | 64,431 | (104,455 | ) | (16,082 | ) | (56,106 | ) | ||||||||||||||||
| Changes in net interest income on a tax equivalent basis |
$ | 5,869 | $ | (5,642 | ) | $ | (15,205 | ) | $ | (14,978 | ) | $ | 23,088 | $ | (22,745 | ) | $ | 4,952 | $ | 5,295 | |||||||||||
2009 versus 2008
Net Interest Income.
During the years ended December 31, 2009 and 2008, net interest income was $344.0 million and $359.6 million, respectively, with the 4% decrease attributable to the decline in interest income on loans being greater than the drop in funding costs. The lower level of interest income on loans was from the increase in nonperforming assets, and a reduction in loan balances due to lower portfolio originations and higher chargeoffs. Sterling increased its loan originations during 2009, the majority of which were sold into the secondary market through Sterling’s mortgage banking segment.
| TX64 |
Table of Contents
During the years ended December 31, 2009 and 2008, net interest margin was 2.92% and 3.08%, respectively. Net interest margin has also been negatively affected by the increase in nonperforming assets. When loans reach nonperforming status, the reversal and cessation of accruing interest has an immediate negative impact on net interest margin.
Provision for Credit Losses. Management’s policy is to establish valuation allowances for estimated losses by charging corresponding provisions against income. The evaluation of the adequacy of specific and general valuation allowances is an ongoing process. This process includes information derived from many factors, including historical loss trends, trends in classified assets, trends in delinquent and nonaccrual loans, trends in portfolio volume, diversification as to type of loan, size of individual credit exposure, current and anticipated economic conditions, loan policies, collection policies and effectiveness, quality of credit personnel, effectiveness of policies, procedures and practices, and recent loss experience of peer banking institutions.
Sterling recorded provisions for credit losses of $681.4 million and $333.6 million for the years ended December 31, 2009 and 2008, respectively. Sterling has increased its provision for credit losses in response to an increase in the level of classified loans, particularly in the multifamily and commercial construction, commercial real estate and commercial banking portfolios, and increases in loss rates from reduced appraisal values.
The following table summarizes the allowance for credit losses activity for the periods indicated:
| Years Ended December 31, | ||||||||
| 2009 | 2008 | |||||||
| (Dollars in thousands) | ||||||||
| Allowance—loans, January 1 |
$ | 208,365 | $ | 111,026 | ||||
| Provision |
690,738 | 318,585 | ||||||
| Charge-offs |
(566,664 | ) | (223,324 | ) | ||||
| Recoveries |
11,004 | 2,078 | ||||||
| Allowance—loans, December 31 |
343,443 | 208,365 | ||||||
| Allowance—unfunded commitments, January 1 |
21,334 | 6,306 | ||||||
| Provision |
(9,367 | ) | 15,074 | |||||
| Charge-offs |
0 | (46 | ) | |||||
| Allowance—unfunded commitments, December 31 |
11,967 | 21,334 | ||||||
| Total credit allowance |
$ | 355,410 | $ | 229,699 | ||||
| Loan loss allowance to total loans |
4.47 | % | 2.31 | % | ||||
| Total credit allowance to total loans |
4.62 | % | 2.55 | % | ||||
| TX65 |
Table of Contents
At December 31, 2009, Sterling’s total classified assets were 15.2% of total assets, compared with 7.7% of total assets at December 31, 2008. The following table describes classified assets by asset type as of the dates indicated:
| December 31, 2009 |
September 30, 2009 |
June 30, 2009 |
March 30, 2009 |
December 31, 2008 | |||||||||||
| (Dollars in thousands) | |||||||||||||||
| Residential real estate |
$ | 128,561 | $ | 74,448 | $ | 62,785 | $ | 31,400 | $ | 34,333 | |||||
| Multifamily real estate |
44,258 | 31,921 | 22,290 | 15,814 | 16,741 | ||||||||||
| Commercial real estate |
154,859 | 81,754 | 62,184 | 41,364 | 37,890 | ||||||||||
| Construction |
|||||||||||||||
| Residential construction |
487,789 | 527,630 | 521,984 | 558,170 | 548,384 | ||||||||||
| Multifamily and commercial construction |
462,088 | 275,817 | 256,192 | 145,629 | 119,348 | ||||||||||
| Total construction |
949,877 | 803,447 | 778,176 | 703,799 | 667,732 | ||||||||||
| Consumer—direct and indirect |
11,996 | 9,016 | 7,908 | 6,816 | 4,556 | ||||||||||
| Commercial banking |
269,521 | 168,790 | 192,207 | 170,678 | 143,748 | ||||||||||
| Total classified loans |
1,559,072 | 1,169,376 | 1,125,550 | 969,871 | 905,000 | ||||||||||
| OREO |
91,478 | 81,361 | 89,721 | 100,512 | 79,875 | ||||||||||
| Total classified assets |
$ | 1,650,550 | $ | 1,250,737 | $ | 1,215,271 | $ | 1,070,383 | $ | 984,875 | |||||
At December 31, 2009, 57% of classified assets are related to construction, with the commercial loan portfolio being the next largest contributor. The following table summarizes the principal balances of nonperforming assets at the dates indicated:
| December 31, | ||||||||
| 2009 | 2008 | |||||||
| (Dollars in thousands) | ||||||||
| Past due 90 days |
$ | 0 | $ | 0 | ||||
| Nonaccrual loans |
824,652 | 474,172 | ||||||
| Restructured loans |
71,279 | 56,618 | ||||||
| Total nonperforming loans |
895,931 | 530,790 | ||||||
| OREO |
91,478 | 79,875 | ||||||
| Total nonperforming assets |
987,409 | 610,665 | ||||||
| Specific reserves |
(35,334 | ) | (19,535 | ) | ||||
| Net nonperforming assets |
$ | 952,075 | $ | 591,130 | ||||
| TX66 |
Table of Contents
The specific reserve at December 31, 2009 and 2008 included $8.2 million and $17.6 million, respectively, that was related to OREO. The following table presents nonperforming assets by type, and also by market for Sterling’s nonperforming construction assets:
| December 31, 2009 |
September 30, 2009 |
June 30, 2009 |
March 31, 2009 |
December 31, 2008 |
||||||||||||||||
| (Dollars in thousands) | ||||||||||||||||||||
| Construction—residential |
||||||||||||||||||||
| Puget Sound |
$ | 154,369 | $ | 134,730 | $ | 129,248 | $ | 83,711 | $ | 73,878 | ||||||||||
| Portland, OR |
114,628 | 124,849 | 121,037 | 118,524 | 117,350 | |||||||||||||||
| Bend, OR |
29,344 | 22,926 | 29,474 | 26,114 | 22,136 | |||||||||||||||
| N. California |
20,535 | 6,016 | 2,644 | 2,812 | 3,558 | |||||||||||||||
| Vancouver, WA |
23,332 | 15,504 | 20,447 | 23,945 | 14,486 | |||||||||||||||
| Boise, ID |
21,659 | 23,550 | 27,270 | 37,921 | 23,356 | |||||||||||||||
| Southern California |
8,893 | 37,777 | 42,960 | 64,818 | 67,824 | |||||||||||||||
| Utah |
4,451 | 5,244 | 20,230 | 26,823 | 29,586 | |||||||||||||||
| Other |
62,267 | 71,057 | 73,940 | 68,715 | 58,164 | |||||||||||||||
| Total residential construction |
439,478 | 441,653 | 467,250 | 453,383 | 410,338 | |||||||||||||||
| Construction—commercial |
||||||||||||||||||||
| N. California |
47,044 | 15,741 | 50,379 | 53,247 | 58,748 | |||||||||||||||
| S. California |
38,003 | 18,375 | 20,613 | 20,613 | 7,636 | |||||||||||||||
| Puget Sound |
22,045 | 19,864 | 25,981 | 2,958 | 3,500 | |||||||||||||||
| Other |
60,775 | 73,326 | 3,374 | 1,270 | 723 | |||||||||||||||
| Total construction—commercial |
167,867 | 127,306 | 100,347 | 78,088 | 70,607 | |||||||||||||||
| Construction—multi-family |
||||||||||||||||||||
| Puget Sound |
27,195 | 21,724 | 2,715 | 0 | 0 | |||||||||||||||
| Portland, OR |
15,497 | 5,690 | 0 | 0 | 0 | |||||||||||||||
| Other |
32,639 | 0 | 24,658 | 800 | 3,894 | |||||||||||||||
| Total construction—multi-family |
75,331 | 27,414 | 27,373 | 800 | 3,894 | |||||||||||||||
| Construction—total |
682,676 | 596,373 | 594,970 | 532,271 | 484,839 | |||||||||||||||
| Commercial banking |
136,464 | 100,370 | 86,117 | 56,118 | 61,520 | |||||||||||||||
| Residential real estate |
71,642 | 68,045 | 61,761 | 50,420 | 46,043 | |||||||||||||||
| Commercial real estate |
69,540 | 44,225 | 26,947 | 19,256 | 7,753 | |||||||||||||||
| Multi-family real estate |
20,478 | 13,474 | 10,898 | 6,020 | 4,757 | |||||||||||||||
| Consumer |
6,609 | 6,403 | 6,761 | 5,866 | 5,753 | |||||||||||||||
| Total gross nonperforming assets |
987,409 | 828,890 | 787,454 | 669,951 | 610,665 | |||||||||||||||
| Specific reserves |
(35,334 | ) | (9,898 | ) | (24,554 | ) | (16,970 | ) | (19,535 | ) | ||||||||||
| Total net nonperforming assets |
$ | 952,075 | $ | 818,992 | $ | 762,900 | $ | 652,981 | $ | 591,130 | ||||||||||
| TX67 |
Table of Contents
During 2009, the rate of decline in the asset quality of commercial and multifamily real estate secured for both permanent and construction financing accelerated, while the rate of decline for the residential portfolio slowed.
Non-Interest Income. Non-interest income was as follows for the years presented:
| Years Ended December 31, |
||||||||
| 2009 | 2008 | |||||||
| (Dollars in thousands) | ||||||||
| Fees and service charges |
$ | 58,326 | $ | 59,867 | ||||
| Mortgage banking operations |
47,298 | 27,651 | ||||||
| Gains on sales of securities |
13,467 | 409 | ||||||
| Bank-owned life insurance |
6,954 | 5,286 | ||||||
| Loan servicing fees |
2,378 | 431 | ||||||
| Other non-interest expense |
(4,609 | ) | (1,749 | ) | ||||
| Total non-interest income |
$ | 123,814 | $ | 91,895 | ||||
The increase in non-interest income was driven by income from mortgage banking operations, and gains on the sale of securities. The mortgage banking segment experienced growth in both the number of originations and the amount of revenue, driven by lower interest rates and recent programs designed to spur lending consistent with the U.S. Department of the Treasury’s Capital Purchase Program. During 2009, Golf Savings Bank made significant gains in its share of mortgage originations for both new home purchases and refinancings in the states of Washington, Oregon and Idaho. Favorable market conditions provided the opportunity to realize gains within the securities portfolio during 2009. The decrease in fees and service charges was a result of lower loan related fees, including prepayment penalties. In 2008, fees and service charges income benefited from higher financial services commissions reflecting more non-deposit product transactions and higher real estate exchange fees.
The following table summarizes certain information about Sterling’s residential and commercial mortgage banking activities for the years indicated:
| As of and for the Years Ended December 31, | ||||||
| 2009 | 2008 | |||||
| (Dollars in millions) | ||||||
| Originations of residential mortgage loans |
$ | 3,047.4 | $ | 1,464.7 | ||
| Originations of commercial real estate loans |
176.3 | 326.9 | ||||
| Sales of residential loans |
2,795.3 | 1,315.6 | ||||
| Sales of commercial real estate loans |
35.7 | 15.8 | ||||
| Principal balances of residential loans serviced for others |
1,090.2 | 501.6 | ||||
| Principal balances of commercial real estate loans serviced for others |
1,598.2 | 1,680.4 | ||||
| TX68 |
Table of Contents
Non-Interest Expenses. Non-interest expenses were as follows for the years presented:
| Years Ended December 31, | ||||||
| 2009 | 2008 | |||||
| (Dollars in thousands) | ||||||
| Employee compensation and benefits |
$ | 165,254 | $ | 159,133 | ||
| OREO operations |
48,041 | 19,787 | ||||
| Occupancy and equipment |
40,637 | 40,245 | ||||
| Insurance |
30,585 | 7,372 | ||||
| Data processing |
20,779 | 21,118 | ||||
| Legal and accounting |
17,412 | 6,979 | ||||
| Depreciation |
14,041 | 14,023 | ||||
| Advertising |
12,069 | 11,748 | ||||
| Travel and entertainment |
5,161 | 6,977 | ||||
| Amortization of core deposit intangibles |
4,898 | 4,901 | ||||
| Merger and acquisition costs |
0 | 200 | ||||
| Other |
11,097 | 13,034 | ||||
| Total expense before impairment charge |
369,974 | 305,517 | ||||
| Goodwill impairment |
227,558 | 223,765 | ||||
| Total |
$ | 597,532 | $ | 529,282 | ||
In addition to the goodwill impairment charges during 2009 and 2008, non-interest expenses increased mainly due to a 143% increase in OREO costs to $48.0 million, and a 315% increase in insurance to $30.6 million, $29.4 million of which was related to FDIC deposit coverage. The elevation in OREO costs reflects losses from the impairment in values of the properties subsequent to repossession, and expenses associated with Sterling’s efforts to resolve problem accounts through foreclosure and liquidation.
Income Tax Provision.
Sterling recorded a federal and state income tax provision of $27.0 million for the year ended December 31, 2009, and a benefit of $75.9 million for the year ended December 31, 2008. The effective tax rates were 3% and (18%) for 2009 and 2008, respectively. During 2009, Sterling determined that the negative evidence associated with the three-year cumulative loss for the period ending December 31, 2009, the recent SSB Consent Agreement entered into with its regulators, and continued credit deterioration in its loan portfolio outweighed the positive evidence in regards to whether or not Sterling would be able to generate taxable income in the near term, and a valuation allowance was established against its deferred tax asset, with the allowance totaling $269.0 million as of December 31, 2009. Sterling will not be able to recognize the tax benefits on future losses until it can show that it is more likely than not that it will generate enough taxable income in future periods to realize the benefits of its deferred tax asset and loss carryforwards.
2008 versus 2007
Net Interest Income. During the years ended December 31, 2008 and 2007, net interest income was $359.6 million and $355.4 million, respectively, with the 1% increase attributable to growth in average loan balances. The growth rate in loans slowed during 2008, and turned negative in the second half of the year, reflecting a lower level of originations and an increased provision for loan losses in response to the general economic decline and specific loan portfolio deterioration.
During the years ended December 31, 2008 and 2007, net interest margin was 3.08% and 3.42%, respectively. Net interest income and net interest
| TX69 |
Table of Contents
margin have been negatively affected by the increase in nonperforming assets, and the decline in the prime rate. Sterling has been “asset sensitive” during recent periods, with a higher level of interest earning assets that were subject to re-pricing faster in the short term than deposits and borrowings. Additionally, when loans reach nonperforming status, the reversal and cessation of accruing interest has an immediate negative impact on net interest margin. Reversal of $28.6 million in accrued interest income on nonperforming loans lowered net interest margin by 24 basis points compared with a decline of 4 basis points, or $4.3 million, for 2007.
Provision for Credit Losses. Sterling recorded provisions for credit losses of $333.6 million and $25.1 million for the years ended December 31, 2008 and 2007, respectively. Sterling increased its provision for credit losses in response to an increase in the level of classified loans, particularly in the residential construction portfolio, and an assessment of the other relevant factors mentioned previously. During the fourth quarter of 2008, the appraisal values of real estate reflected significant declines, and Sterling modified its methods of estimating the fair value of impaired loans.
The following table summarizes the allowance for credit losses activity for the periods indicated:
| Years Ended December 31, | ||||||||
| 2008 | 2007 | |||||||
| (Dollars in thousands) | ||||||||
| Allowance—loans, January 1 |
$ | 111,026 | $ | 77,849 | ||||
| Acquired |
0 | 15,294 | ||||||
| Provision |
318,585 | 24,632 | ||||||
| Charge-offs |
(223,324 | ) | (7,682 | ) | ||||
| Recoveries |
2,078 | 933 | ||||||
| Allowance—loans, December 31 |
208,365 | 111,026 | ||||||
| Allowance—unfunded commitments, January 1 |
6,306 | 5,840 | ||||||
| Provision |
15,074 | 466 | ||||||
| Charge-offs |
(46 | ) | 0 | |||||
| Allowance—unfunded commitments, December 31 |
21,334 | 6,306 | ||||||
| Total credit allowance |
$ | 229,699 | $ | 117,332 | ||||
| Loan loss allowance to total loans |
2.31 | % | 1.23 | % | ||||
| Total credit allowance to total loans |
2.55 | % | 1.30 | % | ||||
Sterling modified its methodology for estimating the fair value of loans being tested for impairment during the fourth quarter of 2008. The fair value is now determined excluding the potential cash flows from certain guarantors. To the extent that these guarantors are able to provide repayments, a recovery would be recorded upon receipt. In addition to the higher credit provision recorded during the fourth quarter of 2008, in many cases, Sterling re-assessed the accounting for real estate loans treated as collateral dependent. As a result, Sterling now considers any impairment on a collateral-dependent loan to be a confirmed loss and charges off the impairment amount when the impairment is identified, rather than establishing a specific allowance on impaired collateral-dependent loans that would have been charged off when foreclosure was probable. As a result of this change, the specific loss allowance was reduced by approximately $163.9 million and is now reflected as part of net charge-offs.
During 2007, Sterling acquired an allowance for losses on loans as a result of the Northern Empire acquisition, since these acquired loans were determined to not have exhibited a deterioration in credit quality since origination.
| TX70 |
Table of Contents
Nonperforming assets, a subset of classified assets that includes nonperforming loans and real estate owned, were 4.77% of total assets at December 31, 2008, compared with 1.11% of total assets at December 31, 2007. At December 31, 2008, the delinquency ratio for loans 60 days or more past due was 4.86% of total loans compared with 1.23% of total loans at December 31, 2007. Sterling, like many other financial institutions, has experienced deterioration in the credit quality of residential construction loans and increases in delinquencies due to declining market values and weakness in housing sales in certain of its markets.
At December 31, 2008, Sterling’s total classified assets were 7.70% of total assets, compared with 1.93% of total assets at December 31, 2007. The following table describes classified assets by asset type as of the dates indicated:
| December 31, 2008 |
September 30, 2008 |
June 30, 2008 |
March 30, 2008 |
December 31, 2007 | |||||||||||
| (Dollars in thousands) | |||||||||||||||
| Residential real estate |
$ | 34,333 | $ | 36,863 | $ | 21,848 | $ | 5,021 | $ | 711 | |||||
| Multifamily real estate |
16,741 | 7,313 | 2,289 | 470 | 248 | ||||||||||
| Commercial real estate |
37,890 | 14,931 | 6,390 | 6,277 | 3,224 | ||||||||||
| Construction |
|||||||||||||||
| Residential construction |
548,384 | 405,753 | 309,556 | 255,473 | 117,424 | ||||||||||
| Multifamily and commercial construction |
119,348 | 17,109 | 19,042 | 15,182 | 3,566 | ||||||||||
| Total construction |
667,732 | 422,862 | 328,598 | 270,655 | 120,990 | ||||||||||
| Consumer—direct and indirect |
4,556 | 4,489 | 3,994 | 2,949 | 2,627 | ||||||||||
| Commercial banking |
143,748 | 130,250 | 111,344 | 104,394 | 95,461 | ||||||||||
| Total classified loans |
905,000 | 616,708 | 474,463 | 389,766 | 223,261 | ||||||||||
| OREO |
79,875 | 54,795 | 22,998 | 13,027 | 11,075 | ||||||||||
| Total classified assets |
$ | 984,875 | $ | 671,503 | $ | 497,461 | $ | 402,793 | $ | 234,336 | |||||
At December 31, 2008, 74% of classified assets were related to construction, the majority of which was residential construction. The commercial construction and commercial banking loan portfolio were also affected by the downturn in the housing market. The following table summarizes the principal balances of nonperforming assets at the dates indicated:
| December 31, | ||||||||
| 2008 | 2007 | |||||||
| (Dollars in thousands) | ||||||||
| Past due 90 days |
$ | 0 | $ | 0 | ||||
| Nonaccrual loans |
474,172 | 123,790 | ||||||
| Restructured loans |
56,618 | 350 | ||||||
| Total nonperforming loans |
530,790 | 124,140 | ||||||
| OREO |
79,875 | 11,075 | ||||||
| Total nonperforming assets |
610,665 | 135,215 | ||||||
| Specific reserves |
(19,535 | ) | (8,678 | ) | ||||
| Net nonperforming assets |
$ | 591,130 | $ | 126,537 | ||||
| TX71 |
Table of Contents
Past due 90 days represents loans that are 90 days or more delinquent in regards to interest or principal, and that Sterling is still accruing interest on. The allowance for losses on OREO is included in the specific reserve, and totaled $17.6 million at December 31, 2008. The following table describes nonperforming assets by asset type at the dates indicated. The following table describes nonperforming assets by asset type at the dates indicated:
| December 31, | ||||||
| 2008 | 2007 | |||||
| (Dollars in thousands) | ||||||
| Residential real estate |
$ | 46,043 | $ | 1,557 | ||
| Multifamily real estate |
4,757 | 2,268 | ||||
| Commercial real estate |
7,753 | 1,418 | ||||
| Construction: |
||||||
| Residential |
410,338 | 102,373 | ||||
| Multifamily |
3,894 | 0 | ||||
| Commercial |
70,607 | 3,042 | ||||
| Total construction |
484,839 | 105,415 | ||||
| Consumer—direct |
5,053 | 1,716 | ||||
| Consumer—indirect |
700 | 836 | ||||
| Commercial banking |
61,520 | 22,005 | ||||
| Total nonperforming assets |
$ | 610,665 | $ | 135,215 | ||
Nonperforming assets presented above are gross of their applicable specific loan loss reserve. The following presents residential construction nonperforming assets by geographical market over the periods indicated:
| December 31, 2008 |
September 30, 2008 |
June 30, 2008 |
March 31, 2008 |
December 31, 2007 |
||||||||||||||||
| (Dollars in thousands) | ||||||||||||||||||||
| Residential construction |
||||||||||||||||||||
| Portland, OR |
$ | 117,350 | $ | 92,599 | $ | 46,101 | $ | 7,567 | $ | 501 | ||||||||||
| Boise, ID |
23,356 | 41,046 | 34,939 | 37,338 | 32,728 | |||||||||||||||
| Utah |
29,586 | 38,143 | 36,179 | 15,372 | 3,603 | |||||||||||||||
| Puget Sound |
73,878 | 38,128 | 30,986 | 23,356 | 12,442 | |||||||||||||||
| Southern California |
67,824 | 32,322 | 40,085 | 28,032 | 23,614 | |||||||||||||||
| Bend, OR |
22,136 | 22,793 | 19,695 | 20,927 | 18,500 | |||||||||||||||
| Vancouver, WA |
14,486 | 19,704 | 19,854 | 19,943 | 2,103 | |||||||||||||||
| Other |
61,722 | 32,047 | 13,061 | 15,985 | 7,309 | |||||||||||||||
| Total residential construction |
410,338 | 316,782 | 240,900 | 168,520 | 100,800 | |||||||||||||||
| Commercial and multifamily construction |
74,501 | 21,609 | 12,270 | 9,756 | 3,042 | |||||||||||||||
| Other loan categories |
125,826 | 98,318 | 50,230 | 44,808 | 31,373 | |||||||||||||||
| Total gross nonperforming assets |
610,665 | 436,709 | 303,400 | 223,084 | 135,215 | |||||||||||||||
| Specific reserves |
(19,535 | ) | (37,554 | ) | (40,597 | ) | (19,084 | ) | (8,678 | ) | ||||||||||
| Total net nonperforming assets |
$ | 591,130 | $ | 399,155 | $ | 262,803 | $ | 204,000 | $ | 126,537 | ||||||||||
| TX72 |
Table of Contents
Nonperforming construction loans made up 79% of non-performing assets at the end of 2008. Residential construction non-performing assets rose $309.5 million during 2008, reflecting the worsening economic conditions, continued stress on real estate values, and credit stress on borrowers. Residential construction nonperforming assets increased to $117.4 million in the Portland market as credit trends worsened due to the decline in the value of residential properties. The increase in nonperforming residential construction assets in Southern California was driven by larger acquisition and development projects. The Puget Sound market experienced one of the largest dollar increases in nonperforming residential construction assets but as a percentage of outstanding loans was performing better than Sterling’s overall residential construction portfolio. Growth in commercial construction nonperforming assets reflected a slowdown in lease-ups, especially in the northern California market, which has affected borrowers’ cash flows and ability to meet debt service requirements. The increase in commercial banking was primarily related to business customers that serve the housing industry. The increase in the residential portfolio primarily relates to non-owner occupied loans and reflects slower lease-up of rental units.
Non-Interest Income. Non-interest income was as follows for the years presented:
| Years Ended December 31, | ||||||||
| 2008 | 2007 | |||||||
| (Dollars in thousands) | ||||||||
| Fees and service charges |
$ | 59,867 | $ | 55,978 | ||||
| Mortgage banking operations |
27,651 | 32,649 | ||||||
| Bank-owned life insurance |
5,286 | 6,500 | ||||||
| Loan servicing fees |
431 | 1,442 | ||||||
| Gains on sales of securities |
409 | 5 | ||||||
| Gain (charge) related to early repayment of debt |
0 | (2,324 | ) | |||||
| Other non-interest expense |
(1,749 | ) | (844 | ) | ||||
| Total non-interest income |
$ | 91,895 | $ | 93,406 | ||||
Fees and service charge income increased 7% over 2007, reflecting increases in analyzed account fees, loan-related fees, transaction fees and fees from Sterling’s Balance Shield program. The total number of transaction accounts increased 1% over 2007. Income from mortgage banking declined 15% over 2007 from a decrease in loan brokered fee income and lower gains on nonresidential loan sales.
The following table summarizes certain information about Sterling’s residential and commercial mortgage banking activities for the years indicated:
| As of and for the Years Ended December 31, | ||||||
| 2008 | 2007 | |||||
| (Dollars in millions) | ||||||
| Originations of residential mortgage loans |
$ | 1,464.7 | $ | 1,492.0 | ||
| Originations of commercial real estate loans |
326.9 | 163.3 | ||||
| Sales of residential loans |
1,315.6 | 1,294.9 | ||||
| Sales of commercial real estate loans |
15.8 | 56.0 | ||||
| Principal balances of residential loans serviced for others |
501.6 | 598.5 | ||||
| Principal balances of commercial real estate loans serviced for others |
1,680.4 | 1,683.0 | ||||
| TX73 |
Table of Contents
Non-Interest Expenses. Non-interest expenses were as follows for the years presented:
| Years Ended December 31, | |||||||
| 2008 | 2007 | ||||||
| (Dollars in thousands) | |||||||
| Employee compensation and benefits |
$ | 159,133 | $ | 158,483 | |||
| Occupancy and equipment |
40,245 | 40,731 | |||||
| Data processing |
21,118 | 18,109 | |||||
| OREO operations |
19,787 | (72 | ) | ||||
| Depreciation |
14,023 | 13,498 | |||||
| Advertising |
11,748 | 12,898 | |||||
| Insurance |
7,372 | 3,778 | |||||
| Legal and accounting |
6,979 | 8,716 | |||||
| Travel and entertainment |
6,977 | 7,676 | |||||
| Amortization of core deposit intangibles |
4,901 | 4,718 | |||||
| Merger and acquisition costs |
200 | 2,833 | |||||
| Other |
13,034 | 14,097 | |||||
| Total expense before impairment charge |
305,517 | 285,465 | |||||
| Goodwill impairment |
223,765 | 0 | |||||
| Total |
$ | 529,282 | $ | 285,465 | |||
Included in non-interest expense during 2008 was a charge for goodwill impairment of $223.8 million. Excluding the goodwill impairment, non-interest expenses increased as compared to 2007, mostly due to an increase in OREO costs. Reflecting updated appraisals of OREO, Sterling recognized a write-down within OREO operations of $17.6 million for 2008. Despite overall company growth and increases in FDIC deposit insurance premiums, before the goodwill and OREO charges, noninterest expenses were relatively unchanged as compared to 2007. This was achieved by improving operating efficiencies, maintaining tight control of overhead expenses and the decision not to pay executive cash bonus compensation for 2008. The number of full-time equivalent employees at year end decreased by 90 to 2,481 from 2,571 at the end of 2007. The increase in FDIC deposit insurance premiums reflects the rise in the level of basic insurance deposit coverage to $250,000 and Sterling’s participation in the Transaction and Debt Guarantee programs.
Income Tax Provision. Sterling recorded a federal and state income tax benefit of $75.9 million for the year ended December 31, 2008, and a provision of $44.9 million for the year ended December 31, 2007. The effective tax rates for these periods were (18%) and 33%, respectively. The decrease in the effective tax rate is primarily due to the recording of the goodwill impairment charge during 2008 which is not deductible for taxes. Also affecting the 2007 tax rate was a reduction in the allowance for uncertain tax positions. During 2008, the statute of limitations expired on the 2004 tax period. As of December 31, 2008, Sterling believed that it was more likely than not that it will be able to fully realize its deferred tax asset and therefore did not record a valuation allowance.
Assets. At December 31, 2009, Sterling’s assets were $10.88 billion, down $1.91 billion from $12.79 billion at December 31, 2008, with decreases in the loan and securities portfolios, goodwill and deferred tax assets, outweighing growth in cash.
Investments and MBS. Sterling’s investment and MBS portfolio at December 31, 2009 was $2.18 billion, a decrease of $637.1 million from the December 31, 2008 balance of $2.82 billion, due to principal repayments, maturities and sales exceeding purchases. Sales of municipal bonds, MBS and collateralized mortgage obligations (“CMOs”) during 2009 provided Sterling with additional liquidity,
| TX74 |
Table of Contents
captured gains in market value, and helped reduce interest rate risk by reducing the level of securities with higher prepayment risk. On December 31, 2009, the investment and MBS portfolio had an unrealized gain of $25.8 million versus an unrealized loss of $28.4 million at December 31, 2008.
Loans Receivable. At December 31, 2009, net loans receivable were $7.34 billion, compared with $8.81 billion at December 31, 2008. The contraction in Sterling’s loan portfolio reflects charge-offs, Sterling’s goal of reducing construction loans as a percent of its total loan portfolio, and a lessening of demand for credit in the current economy. At the end of 2009, residential construction loans represented 9% of Sterling’s loan portfolio, compared with 16% at the end of 2008. Over the last year, residential construction loans decreased by $734.9 million to $721.0 million at December 31, 2009.
The following table sets forth the composition of Sterling’s loan portfolio as of the dates indicated. Loan balances exclude deferred loan origination costs and fees, and allowances for loan losses:
| December 31, 2009 | December 31, 2008 | |||||||||||||
| Amount | % | Amount | % | |||||||||||
| (Dollars in thousands) | ||||||||||||||
| Residential real estate |
$ | 839,170 | 11 | % | $ | 867,384 | 10 | % | ||||||
| Multifamily real estate |
517,408 | 7 | 477,615 | 5 | ||||||||||
| Commercial real estate |
1,403,560 | 18 | 1,364,885 | 15 | ||||||||||
| Construction: |
||||||||||||||
| Residential |
720,964 | 9 | 1,455,860 | 16 | ||||||||||
| Multifamily |
233,501 | 3 | 324,818 | 4 | ||||||||||
| Commercial |
561,643 | 7 | 754,017 | 8 | ||||||||||
| Total Construction |
1,516,108 | 19 | 2,534,695 | 28 | ||||||||||
| Consumer—direct |
792,957 | 10 | 859,222 | 10 | ||||||||||
| Consumer—indirect |
323,565 | 4 | 389,298 | 4 | ||||||||||
| Commercial banking |
2,301,944 | 31 | 2,532,158 | 28 | ||||||||||
| Gross loans receivable |
7,694,712 | 100 | % | 9,025,257 | 100 | % | ||||||||
| Net deferred origination fees |
(7,070 | ) | (9,798 | ) | ||||||||||
| Allowance for losses on loans |
(343,443 | ) | (208,365 | ) | ||||||||||
| Loans receivable, net |
$ | 7,344,199 | $ | 8,807,094 | ||||||||||
| TX75 |
Table of Contents
The following table sets forth Sterling’s loan originations for the periods indicated:
| Years Ended December 31, | |||||||||
| 2009 | 2008 | 2007 | |||||||
| Residential real estate |
$ | 3,047,380 | $ | 1,464,673 | $ | 1,492,026 | |||
| Multifamily real estate |
82,696 | 170,975 | 35,870 | ||||||
| Commercial real estate |
176,256 | 326,853 | 163,315 | ||||||
| Construction: |
|||||||||
| Residential |
32,692 | 383,922 | 1,584,449 | ||||||
| Multifamily |
0 | 25,374 | 118,799 | ||||||
| Commercial |
31,968 | 192,755 | 488,372 | ||||||
| Total construction |
64,660 | 602,051 | 2,191,620 | ||||||
| Consumer—direct |
191,789 | 326,763 | 359,338 | ||||||
| Consumer—indirect |
99,813 | 190,177 | 242,309 | ||||||
| Commercial banking |
318,544 | 541,978 | 995,732 | ||||||
| Total loans originated |
$ | 3,981,138 | $ | 3,623,470 | $ | 5,480,210 | |||
Stimulated by historically low mortgage rates and new initiatives to provide affordable housing, residential mortgage originations climbed over 100% from the same period a year ago. This sequential increase reflects Sterling’s effort, since December 2008, to expand and enhance lending initiatives to support and restore economic growth and development in the communities it serves with capital raised through the U.S. Department of the Treasury’s Capital Purchase Program. Sterling’s new lending initiatives focus on funding affordable housing, small business loans and financing programs to support business growth. The decrease in construction loan originations reflects Sterling’s goal of reducing construction loans as a percent of its total loan portfolio.
Deposits. The following table sets forth the composition of Sterling’s deposits at the dates indicated:
| December 31, 2009 | December 31, 2008 | |||||||||||
| Amount | % | Amount | % | |||||||||
| (Dollars in thousands) | ||||||||||||
| Interest-bearing transaction |
$ | 1,014,032 | 13.0 | $ | 449,060 | 5.4 | ||||||
| Noninterest-bearing transaction |
1,001,771 | 12.9 | 897,198 | 10.7 | ||||||||
| Savings and MMDA |
1,577,900 | 20.3 | 2,113,425 | 25.3 | ||||||||
| Time deposits—brokered |
1,079,997 | 13.9 | 1,480,569 | 17.7 | ||||||||
| Time deposits—retail |
3,101,490 | 39.9 | 3,410,155 | 40.9 | ||||||||
| Total deposits |
$ | 7,775,190 | 100.0 | $ | 8,350,407 | 100.0 | ||||||
| Annualized cost of deposits |
2.04 | % | 2.91 | % | ||||||||
During 2009, there was a shift of uninsured savings and money market account balances to FDIC insured interest bearing transaction accounts. This was related to changes in the collateralization requirements associated with uninsured public funds deposits and Sterling’s participation in the FDIC voluntary expanded insurance program, which provides, without charge to depositors, full guarantee on non-interest bearing and certain interest-bearing transaction accounts held by any depositor, regardless of dollar amount. Total deposits declined since December 31, 2008, mostly as a result of a reduction in brokered deposits by $400.6 million. As a result of the SSB Consent
| TX76 |
Table of Contents
Agreement, Sterling Savings Bank is currently precluded from accepting additional brokered deposits, or renewing existing brokered deposits. Of the $1.08 billion balance of brokered deposits held as of December 31, 2009, $842.4 million mature in less than one year. Regular payments on loans and MBS, as well as increases in retail deposits and sales of MBS and other investment securities, currently
provide Sterling with sufficient liquidity to meet its payment obligations on the brokered deposits as they mature.
Borrowings. Deposit accounts are Sterling’s primary source of funds. Sterling does, however, rely upon advances from the Federal Home Loan Bank (“FHLB”), reverse repurchase agreements and other borrowings to fund assets and meet deposit withdrawal requirements. During 2009, these borrowings decreased a total of $503.3 million, consistent with Sterling’s strategy of reducing total assets to manage its capital position.
Asset and Liability Management
The results of operations for financial institutions have been and may continue to be materially and adversely affected by changes in prevailing economic conditions, including changes in interest rates, declines in real estate market values and the monetary and fiscal policies of the federal government. The mismatch between maturities, interest rate sensitivities and prepayment characteristics of assets and liabilities, and the changes in each of these attributes under different interest rate scenarios results in interest-rate risk.
Sterling, like most financial institutions, has material interest-rate risk exposure to changes in both short-term and long-term interest rates as well as variable interest rate indices. Sterling’s results of operations are largely dependent upon its net interest income and its ability to manage its interest rate risk.
Sterling’s Asset/Liability Committee (“ALCO”) manages Sterling’s interest-rate risk based on cash flow modeling, interest rate projections and other factors within policies and practices approved by the subsidiary banks’ boards of directors. The principal objective of Sterling’s asset and liability management activities is to provide maximum levels of net interest income while maintaining acceptable levels of interest-rate risk and liquidity risk while facilitating Sterling’s funding needs. ALCO manages this process at both the subsidiary and consolidated levels. ALCO measures interest rate risk exposure through three primary measurements: management of the relationship between its interest bearing assets and its interest bearing liabilities, interest rate shock simulations of net interest income, and economic value of equity (“EVE”) simulation.
The difference between a financial institution’s interest rate sensitive assets (i.e., assets that will mature or reprice within a specific time period) and interest rate sensitive liabilities (i.e. liabilities that will mature or reprice within a specific time period) is commonly referred to as its “interest rate sensitivity gap” (“GAP”). An institution having more interest rate sensitive assets than interest rate sensitive liabilities within a given time period is said to be “asset sensitive,” which generally means that if interest rates increase (other things being equal), a company’s net interest income will increase and if interest rates decrease (other things being equal), its net interest income will decrease. The opposite is true for an institution that is liability sensitive. As of December 31, 2009, Sterling was “asset sensitive,” under the selected “most likely” interest rate scenario. The “most likely” interest rate scenario is an interest rate forecast provided by IHS Global Insight predicting likely future interest rate behavior based on their assessment of current economic conditions, patterns and projections. The most likely interest rate scenario applied in Sterling’s gap analysis forecasts the prime interest rate rising 25 basis points after one year and 175 basis points after two years. This interest rate scenario results in the Treasury yield curve flattening over a two-year period primarily from faster increases in short term interest rates relative to the rate of increase in longer term interest rates.
The following table sets forth the estimated maturity/repricing and the resulting gap between Sterling’s interest-earning assets and interest-bearing liabilities at December 31, 2009. The estimated maturity/repricing amounts reflect contractual maturities and amortizations, assumed loan prepayments based upon Sterling’s historical experience, estimates from secondary market sources such as FHLMC or FNMA and estimated
| TX77 |
Table of Contents
regular non-maturity deposit decay rates (the rate of withdrawals or transfers to higher-yielding products). Management believes these assumptions and estimates are reasonable, but there can be no assurance in this regard or that action undertaken to mitigate interest rate risk will have the desired effect. The classification of mortgage loans, investments and MBS is based upon regulatory reporting formats and, therefore, may not be consistent with the financial information contained elsewhere in this report on Form 10-K. While the GAP measurement has some limitations, including no assumptions regarding future asset or liability production and a static interest rate assumption (large changes may occur related to those items), the GAP represents the net asset or liability sensitivity at a point in time. A GAP measure could be significantly affected by external factors such as loan prepayments that occur faster or slower than assumed, early withdrawals of deposits, changes in the correlation of various interest-bearing instruments, competition or a rise or decline in interest rates.
| Maturity or Repricing | ||||||||||||||||||||||||
| 0 to 3 Months |
Over 3 Months to 1 Year |
Over 1 Year to 3 Years |
Over 3 Years to 5 Years |
Over 5 Years |
Total | |||||||||||||||||||
| (Dollars in thousands) | ||||||||||||||||||||||||
| Interest-earning assets: (1) |
||||||||||||||||||||||||
| Variable-rate residential and commercial |
||||||||||||||||||||||||
| ARMs, balloons, and construction |
$ | 1,470,746 | $ | 1,054,803 | $ | 1,169,630 | $ | 180,442 | $ | 30,853 | $ | 3,906,474 | ||||||||||||
| Fixed-rate residential and commercial mortgage loans and MBS |
315,354 | 693,213 | 791,957 | 432,563 | 481,507 | 2,714,594 | ||||||||||||||||||
| Loans held for sale |
190,412 | 0 | 0 | 0 | 0 | 190,412 | ||||||||||||||||||
| Consumer |
410,520 | 165,884 | 298,866 | 85,792 | 150,168 | 1,111,230 | ||||||||||||||||||
| Commercial |
1,000,321 | 518,067 | 601,951 | 190,748 | 66,479 | 2,377,566 | ||||||||||||||||||
| Total loans and MBS |
3,387,353 | 2,431,967 | 2,862,404 | 889,545 | 729,007 | 10,300,276 | ||||||||||||||||||
| Investments and interest-earning cash |
431,954 | 201 | 4,045 | 301 | 234,111 | 670,612 | ||||||||||||||||||
| Total interest-earning assets |
3,819,307 | 2,432,168 | 2,866,449 | 889,846 | 963,118 | 10,970,888 | ||||||||||||||||||
| Cash on hand and in banks |
0 | 0 | 0 | 0 | 142,621 | 142,621 | ||||||||||||||||||
| Other noninterest-earning assets |
17,055 | (250,880 | ) | (167,254 | ) | 0 | 164,993 | (236,086 | ) | |||||||||||||||
| Total assets |
$ | 3,836,362 | $ | 2,181,288 | $ | 2,699,195 | $ | 889,846 | $ | 1,270,732 | $ | 10,877,423 | ||||||||||||
| Interest-bearing liabilities: |
||||||||||||||||||||||||
| Deposits: |
||||||||||||||||||||||||
| Time deposits |
$ | 1,031,674 | $ | 1,702,094 | $ | 1,130,285 | $ | 266,963 | $ | 50,471 | $ | 4,181,487 | ||||||||||||
| Checking accounts |
565,184 | 15,495 | 0 | 0 | 1,435,124 | 2,015,803 | ||||||||||||||||||
| Savings |
867,899 | 0 | 0 | 0 | 710,001 | 1,577,900 | ||||||||||||||||||
| Total deposits |
2,464,757 | 1,717,589 | 1,130,285 | 266,963 | 2,195,596 | 7,775,190 | ||||||||||||||||||
| FHLB advances |
765,000 | 230,071 | 260,348 | 60,368 | 21,380 | 1,337,167 | ||||||||||||||||||
| Repurchase agreements and funds purchased |
199,146 | 50,000 | 750,000 | 50,000 | 0 | 1,049,146 | ||||||||||||||||||
| Other borrowings |
248,281 | 0 | 0 | 0 | 0 | 248,281 | ||||||||||||||||||
| Total interest-bearing liabilities |
3,677,184 | 1,997,660 | 2,140,633 | 377,331 | 2,216,976 | 10,409,784 | ||||||||||||||||||
| Noninterest-bearing liabilities |
0 | 0 | 0 | 0 | 144,390 | 144,390 | ||||||||||||||||||
| Shareholders’ equity |
0 | 0 | 0 | 0 | 323,249 | 323,249 | ||||||||||||||||||
| Total liabilities and shareholders’ equity |
$ | 3,677,184 | $ | 1,997,660 | $ | 2,140,633 | $ | 377,331 | $ | 2,684,615 | $ | 10,877,423 | ||||||||||||
| Net gap |
$ | 159,178 | $ | 183,628 | $ | 558,562 | $ | 512,515 | $ | (1,413,883 | ) | $ | 0 | |||||||||||
| Cumulative gap |
$ | 159,178 | $ | 342,806 | $ | 901,368 | $ | 1,413,883 | $ | 0 | $ | 0 | ||||||||||||
| Cumulative gap to total assets |
1.46 | % | 3.15 | % | 8.29 | % | 13.00 | % | 0.00 | % | 0.00 | % | ||||||||||||
| (1) | Loan balances are presented gross of applicable confirmed losses. |
| TX78 |
Table of Contents
ALCO uses interest rate shock simulations of net interest income to measure the effect of changes in interest rates on the net interest income for Sterling over a 12 month period. This simulation consists of measuring the change in net interest income over the next 12 months from a base case scenario, from which rates are shocked, in a parallel fashion, up and down. The base case uses the assumption of the existing balance sheet and existing interest rates to simulate the base line of net interest income over the next 12 months. The simulation requires numerous assumptions, including relative levels of market interest rates, instantaneous and parallel shifts in the yield curve, loan prepayments and reactions of depositors to changes in interest rates, and should not be relied upon as being indicative of actual or future results. Results can differ from the most likely rate scenario due to the amount and timing of interest rate movements, which can impact the rate of prepayments, as well as other variables in the model. The analysis does not contemplate actions Sterling may undertake in response to changes in interest rates and market conditions. The results of this simulation as of December 31, 2009 and 2008 are included in the following table:
| December 31, | ||||||
| Change in Interest Rate in Basis |
2009 | 2008 | ||||
| % Change in NII |
% Change in NII |
|||||
| +200 |
(5.1 | ) | 3.6 | |||
| +100 |
(0.3 | ) | 2.2 | |||
| Static |
0.0 | 0.0 | ||||
| -100 |
N/A | (1) | N/A | (1) | ||
| -200 |
N/A | (1) | N/A | (1) | ||
| (1) | Results are not meaningful in a low interest rate environment. |
ALCO uses EVE simulation analysis to measure risk in the balance sheet that might not be taken into account in the net interest income simulation analysis. Whereas net interest income simulation highlights exposure over a relatively short time period of 12 months, EVE simulation analysis incorporates all cash flows over the estimated remaining life of all balance sheet positions. The EVE simulation analysis of the balance sheet, at a point in time, is defined as the discounted present value of asset cash flows minus the discounted value of liability cash flows. The discount rates that are used represent an assumption for the current market rates of each group of assets and liabilities. The difference between the present value of the asset and liability represents the EVE. As with net interest income, this is used as the base line to measure the change in EVE, from which interest rates are shocked, in a parallel fashion, up and down. As with the net interest income simulation model, EVE simulation analysis is based on key assumptions about the timing and variability of balance sheet cash flows. However, because the simulation represents much longer time periods, inaccuracy of assumptions may increase the variability of outcomes within the simulation. It also does not take into account actions management may undertake in response to anticipated changes in interest rates. The results of this simulation at December 31, 2009 and 2008 are included in the following table. The December 31, 2009 results indicate that in the presence of an immediate 200 basis point parallel rate shock, the economic value of Sterling would decline by 16.5% as Sterling’s loans and mortgage-backed securities would decline more in value than its deposits and wholesale borrowings:
| At December 31, | ||||||
| 2009 | 2008 | |||||
| Change in Interest Rate in |
% Change in EVE |
% Change in EVE |
||||
| +200 |
(16.5 | ) | (3.8 | ) | ||
| +100 |
(0.1 | ) | (2.7 | ) | ||
| Static |
0.0 | 0.0 | ||||
| -100 |
N/A | (1) | N/A | (1) | ||
| -200 |
N/A | (1) | N/A | (1) | ||
| (1) | Results are not meaningful in a low interest rate environment. |
As of December 31, 2009, Sterling has customer-related interest rate swap derivatives outstanding. As of December 31, 2009, Sterling has not entered into any other derivative transactions as part of managing its interest rate risk. However, Sterling continues to consider derivatives, including non-customer related interest rate swaps, caps and floors as viable alternatives in the asset and liability management process.
Liquidity and Capital Resources
Sterling’s primary sources of funds are: customer deposits; wholesale funds from commercial banks, the FHLB, and the Federal Reserve; the collection of
| TX79 |
Table of Contents
principal and interest primarily from loans, as well as from mortgage backed securities; and the sale of loans into the secondary market in connection with Sterling’s mortgage banking activities. Sterling Savings Bank and Golf Savings Bank actively manage their liquidity in an effort to maintain an adequate margin over the level necessary to support funding of loans and deposit withdrawals. Liquidity may vary from time to time, depending on economic conditions, deposit fluctuations, loan funding needs and regulatory sanctions.
Sterling uses wholesale funds to supplement deposit gathering for funding the origination of loans or purchasing assets such as MBS and investment securities. These borrowings include advances from the FHLB, reverse repurchase agreements, primary and secondary credits and term auction facilities from the Federal Reserve, and federal funds purchased. Sterling had access to $2.45 billion and $3.23 billion of additional liquidity from all sources as of December 31, 2009 and December 31, 2008, respectively. In 2009, certain states increased the collateralization requirements for uninsured public funds. The increased collateralization requirements required that Sterling pledge additional collateral, which reduced Sterling’s collateral available for liquidity. Sterling Savings Bank and Golf Savings Bank have credit lines with FHLB of Seattle that provide for borrowings up to a percentage of each of their total assets, subject to collateralization requirements. At December 31, 2009 and December 31, 2008, these credit lines represented a total borrowing capacity of $2.43 billion and $2.92 billion, of which $967.5 million and $1.33 billion was available, respectively. In the first quarter of 2010, Sterling Savings Bank started transitioning from a blanket pledge collateral agreement with the FHLB of Seattle to a custodial agreement. Additionally, Sterling’s future borrowings from the FHLB of Seattle are limited to overnight cash management advances (“CMA”), which automatically rollover each day. Sterling Savings Bank has the ability to increase or decrease the CMA borrowings on a daily basis. The restriction from accepting additional brokered deposits, or renewing existing brokered deposits, pursuant to the SSB Consent Agreement, has not had a material adverse effect on Sterling’s liquidity. At December 31, 2009 and December 31, 2008, Sterling had $1.03 billion and $1.09 billion in outstanding borrowings under reverse repurchase agreements, respectively. Sterling had unpledged securities available for additional secured borrowings of approximately $682.1 million and $548.9 million as of December 31, 2009 and December 31, 2008, respectively.
Reverse repurchase agreements allow Sterling to sell investments (generally U.S. agency securities and MBS) under an agreement to buy them back at a specified price at a later date. These agreements to repurchase are deemed to be borrowings collateralized by the investments and MBS sold. The use of reverse repurchase agreements may expose Sterling to certain risks not associated with other borrowings, including interest rate risk and the possibility that additional collateral may have to be provided if the market value of the pledged collateral declines. The terms of certain of Sterling’s borrowings and reverse repurchase agreements that Sterling has entered into, impose various requirements on Sterling, including the requirement to remain well capitalized. As a result of the SSB Consent Agreement and being undercapitalized, Sterling could be required to repay prior to their maturity up to $1.00 billion of reverse repurchase agreements. As of December 31, 2009, if these borrowings had been terminated, the settlement costs would have been approximately $80 million. The market value of the collateral securing these borrowings was $1.15 billion as of December 31, 2009. This collateral, if sold, may result in securities gains that could mitigate the settlement costs. Should these actions occur, Sterling’s interest costs would be reduced and these actions may improve its Tier 1 leverage capital ratio in the future, although there can be no assurance that these improvements will occur. At December 31, 2009, Sterling also had $3.0 million of borrowings in the form of a subordinated debenture. While the debenture remains in place in accordance with its original terms, it bears a default rate of interest of 7.75% since Sterling has defaulted on certain covenants regarding regulatory actions.
As of December 31, 2009 and December 31, 2008, Sterling also had $16.7 million and $69.0 million, respectively, of discount window borrowings, which are short term borrowings from the Federal Reserve. Through the Federal Reserve’s 12th District Bank, Sterling Savings Bank participates in the Borrower in Custody Program which allows Sterling Savings Bank to borrow against certain pledged loans on an overnight basis. Golf Savings Bank can borrow under
| TX80 |
Table of Contents
the Borrower in Custody Program for terms ranging from overnight to 90 days. Golf Savings Bank is also eligible to participate in the Term Auction Facility which allows Golf Savings Bank to bid on funds to be borrowed for terms of 28 to 84 days. As a result of the SSB Consent Agreement, Sterling is required to provide a higher level of collateral for any funds that Sterling borrows from the Federal Reserve or its other funding sources. Any additional collateral requirements or limitations on Sterling’s ability to access additional funding sources are expected to have a negative impact on Sterling’s liquidity.
On December 5, 2008, Sterling completed the sale of 303,000 shares of preferred stock and issued a warrant to purchase 6,437,677 shares of Sterling’s common stock to the U.S. Department of the Treasury, raising total proceeds of $303 million. The $303 million in proceeds are treated as Tier 1 capital. The 303,000 shares of Fixed Rate Cumulative Perpetual Preferred Stock, Series A (the “Preferred Shares”), issued by Sterling will pay a cumulative compounding dividend of 5% per year for the first five years and will reset to a rate of 9% per year after five years. During the third quarter 2009, Sterling elected to defer the payment of dividends on this cumulative preferred stock. Under the terms of the preferred stock, failure to pay dividends for six dividend periods, whether or not consecutive, would cause the authorized number of directors constituting Sterling’s board of directors to be automatically increased by two and the holders of the preferred stock, together with the holders of any outstanding parity stock with like voting rights, will be entitled to elect the two additional members of Sterling’s board of directors. Subject to approval by Sterling’s banking regulators, the Preferred Shares may be redeemed by Sterling at their issue price, plus all accrued and unpaid dividends. In addition to the Preferred Shares, the Treasury Department received a warrant with a ten year exercise period to purchase 6,437,677 shares of Sterling common stock at an exercise price of $7.06 per share. The initial value allocated to the preferred stock was $292 million, with the remaining $11 million attributed to the warrant. The allocation was based on the relative fair value for the preferred stock and the warrant, respectively, to the total fair value of the combined preferred stock and warrant. The fair value of the preferred stock was estimated using a discounted cash flow methodology at an assumed market equivalent rate of 12%, with 20 quarterly payments over a five year period. The fair value of the warrant was estimated using the Black-Scholes option pricing model, with assumptions of 50% volatility, a risk-free rate of 2.68%, a yield of 6.53% and an estimated life of 10 years. The value attributed to the warrant is being accreted as a discount on the preferred stock using the effective interest method over five years.
Sterling, on a parent company-only basis, had cash of approximately $24.3 million and $86.2 million at December 31, 2009 and December 31, 2008, respectively. Sterling received cash dividends from Sterling Savings Bank of $9.7 million and $28.6 million during the year ended December 31, 2009 and 2008, respectively, and from Golf Savings Bank of $606,000 and $0 for the same respective periods. Sterling Savings Bank’s and Golf Savings Bank’s ability to pay dividends is generally limited by their earnings, financial condition, capital requirements, and applicable regulatory requirements. As of December 31, 2009, Sterling’s subsidiary banks were not paying dividends to Sterling.
Sterling has had the ability to secure additional capital through the capital markets, including the issuance of capital securities (“Trust Preferred Securities”) to investors. The proceeds from the sale of the Trust Preferred Securities are used to purchase junior subordinated deferrable interest debentures (“Junior Subordinated Debentures”) issued by Sterling. During the third quarter of 2009, Sterling elected to defer payments of interest on the Junior Subordinated Debentures. Sterling is permitted to defer these payments for up to 20
consecutive quarterly periods without triggering an event of default. Subsequent to year end, Sterling announced that it expects to commence cash offers to redeem its trust preferred borrowings at a discount to par. Consummation of the repurchase is conditioned upon Sterling receiving net proceeds from an equity offering, sale of assets or other transaction sufficient to repurchase the Trust Preferred Securities, as well as the approval, to the extent required, by Sterling’s banking regulators.
The availability and cost of capital are partially dependent on Sterling’s credit ratings. In May 2009, citing “elevated levels of nonperforming loans, recent poor operating performance and the prospect for continued losses for the remainder of 2009,” Fitch Ratings (“Fitch”) downgraded Sterling’s credit ratings, changing the outlook to negative from
| TX81 |
Table of Contents
watch negative, and its individual rating to D from C. In August, Fitch further downgraded Sterling to D/E from D upon announcement by Sterling of its election to defer interest payments on its trust preferred borrowings and dividends on its preferred stock issued to the U.S. Treasury Department under the Capital Purchase Program.
The SSB Consent Agreement requires Sterling to raise at least $300 million of capital and thereafter maintain a Tier 1 leverage ratio of not less than 10% by December 15, 2009. Sterling continues to work closely and cooperatively with its regulators and its financial advisors in this process. There can be no assurance, however, that Sterling will continue to be able to access the capital markets either now or in the future.
Off-Balance Sheet Arrangements and Aggregate Contractual Obligations
The following table represents Sterling’s on-and-off-balance sheet aggregate contractual obligations to make future payments as of December 31, 2009:
| Payments Due by Period | ||||||||||||||||||
| Total | Less than 1 year |
1 to 3 years | Over 3 to 5 years |
More than 5 years |
Indeterminate Maturity | |||||||||||||
| (Dollars in thousands) | ||||||||||||||||||
| Deposits (1) |
$ | 7,775,190 | $ | 2,731,121 | $ | 1,132,932 | $ | 266,963 | $ | 50,471 | $ | 3,593,703 | ||||||
| Borrowings (1) |
2,634,594 | 684,328 | 696,398 | 224,368 | 1,029,500 | 0 | ||||||||||||
| Operating leases |
82,840 | 14,625 | 24,593 | 16,023 | 27,599 | 0 | ||||||||||||
| Purchase obligations (2) |
19,196 | 15,113 | 3,535 | 548 | 0 | 0 | ||||||||||||
| Other long-term liabilities (3) |
33,608 | 1,210 | 2,781 | 3,118 | 26,499 | 0 | ||||||||||||
| Total |
$ | 10,545,428 | $ | 3,446,397 | $ | 1,860,239 | $ | 511,020 | $ | 1,134,069 | $ | 3,593,703 | ||||||
| (1) | Excludes interest payments. Deposits with indeterminate maturities are composed of transaction, savings and MMDA accounts. See Notes 8 – 11 of “Notes to Consolidated Financial Statements.” |
| (2) | Excludes recurring accounts payable amounts due in the first quarter of 2010. |
| (3) | Includes amounts associated with retirement and benefit plans and other compensation arrangements. The amounts represent the total future potential payouts assuming all current participants become fully vested in their respective plans or arrangements. See Note 18 of “Notes to Consolidated Financial Statements.” |
Sterling, in the conduct of ordinary business operations routinely enters into contracts that may require payment for services to be provided in the future and may also contain penalty clauses for the early termination of the contracts. Sterling is also party to financial instruments with off-balance sheet risk in the normal course of business to meet the financing needs of its customers. These financial instruments include commitments to extend credit and standby letters of credit. As of December 31, 2009 and 2008, commitments to extend credit totaled $1.01 billion and $1.75 billion, respectively, and letters of credit totaled $28.6 million and $51.3 million, respectively. As of December 31, 2009 and 2008, the balance of the credit loss provision for these unfunded commitments totaled $12.0 million and $21.3 million, respectively. As of December 31, 2009, Sterling had committed to invest a total of $13.7 million in limited partnerships for the development of low-income housing. As of December 31, 2009, the remaining unfunded liability of these commitments was $5.1 million. The fund invests in a series of low-income projects throughout the western United States. Sterling receives tax deductions and tax credits from these partnerships, which Sterling anticipates will yield a positive return on investment, but anticipates that the partnership interests will have no value at the end of the fifteen-year term. The partnership interests are amortized over the life of the tax credits.
| TX82 |
Table of Contents
As part of its mortgage banking activities, Sterling issues interest rate lock commitments to prospective borrowers on residential mortgage loan applications. Pricing for the sale of these loans is fixed with various qualified investors under both non-binding (“best-efforts”) and binding (“mandatory”) delivery programs. For mandatory delivery programs, Sterling hedges interest rate risk by entering into offsetting forward sale agreements on MBS with third parties. Risks inherent in mandatory delivery programs include the risk that if Sterling does not close the loans subject to interest rate lock commitments, it is nevertheless obligated to deliver MBS to the counterparty under the forward sale agreement. Sterling could incur significant costs in acquiring replacement loans or MBS and such costs could have a material adverse effect on mortgage banking operations in future periods. See Note 10 of “Notes to Consolidated Financial Statements.”
Interest rate lock commitments and loan delivery commitments are off balance sheet commitments that are considered to be derivatives. As of December 31, 2009, Sterling had $110.0 million of interest rate lock commitments, $119.7 million of warehouse loans held for sale that were not committed to investors, and held offsetting forward sale agreements on MBS valued at $234.0 million. In addition, Sterling had mandatory delivery commitments to sell mortgage loans to investors valued at $29.5 million as of December 31, 2009. As of December 31, 2008, Sterling had $75.4 million of interest rate lock commitments, $71.8 million of warehouse loans held for sale that were not committed to investors, and held offsetting forward sale agreements on MBS valued at $114.4 million. In addition, Sterling had mandatory delivery commitments to sell mortgage loans to investors valued at $1.4 million as of December 31, 2008. As of December 31, 2009 and December 31, 2008, Sterling had entered into best efforts forward commitments to sell $51.6 million and $71.0 million of mortgage loans, respectively.
Sterling enters into interest rate swap derivative contracts with customers. The interest rate risk on these contracts is managed by entering into offsetting interest rate swap agreements with various counterparties (“broker-dealers” or “dealers”). The counterparty agreements include certain representations, warranties and covenants, which include terms that allow for an early termination in the event of default. Failure to maintain a well capitalized position is one event that may be considered a default, and counterparties to the derivative instruments could require an early termination settlement or an increase in the collateralization on derivative instruments in net liability positions. The aggregate fair value of all derivative instruments with credit risk related contingent features that are in a liability position on December 31, 2009 was $4.3 million for which Sterling has posted collateral with a market value of $6.1 million in the normal course of business. Both customer and dealer related interest rate derivatives are carried at fair value by Sterling.
Sterling’s total shareholders’ equity was $323.2 million at December 31, 2009, compared with $1.14 billion at December 31, 2008, with the decrease due to the net loss recorded for the year ended December 31, 2009, primarily from the provision for credit losses, the deferred tax asset valuation allowance, and the goodwill impairment. Shareholders’ equity was 2.97% of total assets at December 31, 2009, compared with 8.92% at December 31, 2008. At December 31, 2009, Sterling had a net unrealized gain of $25.8 million on investment securities and MBS classified as available for sale, as compared to a net unrealized loss of $28.4 million as of December 31, 2008. Fluctuations in prevailing interest rates are expected to cause volatility in this component of accumulated comprehensive income or loss in shareholders’ equity.
Sterling has outstanding various series of Trust Preferred Securities issued to investors. The Trust Preferred Securities are treated as debt of Sterling and qualify as Tier 1 capital, subject to certain limitations. For a complete description, see “—Liquidity and Capital Resources” and Note 11 of “Notes to Consolidated Financial Statements.”
Sterling, Sterling Savings Bank and Golf Savings Bank are required by applicable regulations to maintain certain minimum capital levels. At December 31, 2009, Sterling was not “adequately capitalized.” Under the terms of the SSB Consent Agreement and the Reserve Bank Agreement, Sterling has agreed to, among other things, raise capital, and maintain a Tier 1 leverage ratio of not
| TX83 |
Table of Contents
less than 10%. Sterling is working closely with its financial advisors and regulators to comply with the SSB Consent Agreement and the Reserve Bank Agreement.
On October 9, 2009, Sterling Savings Bank agreed to enter into the SSB Consent Agreement with the FDIC and the WDFI. Among other things, under the terms of the Consent Agreement, Sterling Savings Bank has agreed to: have and retain qualified management, and notify the FDIC and the WDFI of any changes in Sterling Savings Bank’s Board of Directors or senior executive officers at least 30 days before the change is intended to be effective; assure the on-going participation of Sterling Savings Bank’s Board of Directors in Sterling Savings Bank’s affairs; increase Sterling Savings Bank’s Tier 1 capital by at least $300 million by December 15, 2009 and thereafter maintain a Tier 1 leverage ratio of not less than 10%; present a written capital plan to meet and maintain the capital requirements of the SSB Consent Agreement; not pay cash dividends without the prior written consent of the FDIC and the WDFI; review, and revise if necessary, and remedy any deficiency in Sterling Savings Bank’s allowance for loan and lease losses; develop written plans to reduce the number of nonperforming assets, reduce the number of commercial real estate and acquisition, land development and construction loans, prohibit extensions of additional credit to borrowers with existing classified credits, improve Sterling Savings Bank’s profitability and risk profile; implement a written liquidity and funds management policy that addresses liquidity needs and contingency funding and reduces reliance on non-core funding sources; comply with the interest rate limitations on solicitation and acceptance of brokered deposits and submit a written plan to eliminate reliance on brokered deposits; and provide quarterly written progress reports to the FDIC and the WDFI. The Consent Agreement will remain in effect until modified or terminated by the FDIC and the WDFI.
Sterling and Sterling Savings Bank have taken the following steps to comply with the provisions of the SSB Consent Agreement: Sterling has retained qualified management and obtained Reserve Bank approval before appointing any directors and senior executive officers, has increased its Board’s participation in the affairs of Sterling Savings Bank and the frequency of meetings, and has complied with restrictions on severance payments and indemnification restrictions for existing and departed officers and directors. Sterling Savings Bank has met deadlines to develop and submit to the FDIC Regional Director and the WDFI Director of Banks written and board approved strategic plans for: improving profitability and risk profile and sustaining earnings, reducing its brokered deposits, and systematically reducing the amount of loans or other extensions of credit, directly or indirectly, to or for the benefit of, any borrowers in the “commercial real estate” concentration, with particular emphasis on those borrowers in the “Acquisition, Land Development, and Construction” lending area. Sterling Saving Bank has implemented and submitted to the FDIC Regional Director and the WDFI Director of Banks a Liquidity and Funds Management Policy and both Sterling Savings Bank and the FDIC and WDFI continue to monitor liquidity on a daily and monthly basis. Sterling Savings Bank continues to comply with deposit pricing restrictions and the national rate standards. Sterling Savings Bank has not increased tier 1 capital by the required amount nor maintained a leverage ratio equal to or greater than 10.0%; however, Sterling Savings Bank has notified the FDIC Regional Director and WDFI Director of Banks as required, has submitted a capital plan and a contingency funding plan, has fully funded the allowance for loan and lease losses, and provided status updates as required.
On December 24, 2009, Sterling agreed to enter into the Reserve Bank Agreement with the Reserve Bank. Substantially all of the requirements of the Reserve Bank Agreement are similar to those already imposed on Sterling Savings Bank by the FDIC. The Reserve Bank Agreement is designed to enhance Sterling’s ability to act as a source of strength to its wholly owned subsidiaries, Sterling Savings Bank and Golf Savings Bank, and requires that Sterling obtain Reserve Bank approval before paying dividends, taking dividends from the subsidiary banks, making payments on subordinated debt or trust preferred securities, incurring debt, or purchasing or redeeming Sterling stock. The Reserve Bank Agreement also requires Sterling to submit a risk management plan, a capital plan, cash flow projections and progress reports, to obtain Reserve Bank approval before appointing new directors or senior executive officers and to comply with certain
| TX84 |
Table of Contents
payment restrictions on golden parachute payments and indemnification restrictions.
Sterling has taken the following steps to comply with the requirements of the Reserve Bank Agreement: Sterling has obtained Reserve Bank approval before appointing senior executive officers, has increased its Board’s participation in the affairs of Sterling and the frequency of meetings, and has complied with restrictions on severance payments and indemnification restrictions for existing and departed officers and directors. Sterling has met deadlines to develop and submit to the Reserve Bank written and Board-approved plans to: strengthen risk management, maintain sufficient capital on a consolidated basis, ensure sufficient contingency funding and a system to measure and monitor liquidity, and to ensure sources and uses of cash for debt service, operating expenses, and other purposes.
In the fourth quarter of 2008, following mediation, Sterling settled on the amount of damages owed to Sterling and fully resolved its goodwill lawsuit against the U.S. government for its breach of contract related to past acquisitions of failed savings institutions. Sterling was paid $1.8 million in January 2009. Sterling is satisfied that it prevailed in the litigation, which now is fully concluded.
Recent Accounting Pronouncements
In June 2009, the Financial Accounting Standards Board (“FASB”) issued FAS 168, “The FASB Accounting Standards Codification and the Hierarchy of Generally Accepted Accounting Principles—replacement of FAS 162” (the “Codification”). The Codification supersedes all existing accounting and reporting standards other than the rules of the Securities and Exchange Commission (the “SEC”). Updates to the Codification are being issued as Accounting Standards Updates, which will also provide background information about the guidance, and provide the basis for conclusions on changes in the Codification. The Codification became effective for Sterling for the interim period ending September 30, 2009, and did not have a material impact on its consolidated financial statements.
In December 2007, the FASB updated the standard on business combinations, establishing principles and requirements for how the acquirer: 1) recognizes and measures in its financial statements the identifiable assets acquired, the liabilities assumed, and any non-controlling interest in the acquiree; 2) recognizes and measures the goodwill acquired in the business combination or a gain from a bargain purchase; 3) determines what information to disclose to enable users of the financial statements to evaluate the nature and financial effects of the business combination. Depending on the level of future acquisitions, this accounting standard may have a material effect on Sterling, mainly in regards to the valuation of loans, and the treatment for acquisition costs.
In February 2008, the FASB issued a staff position on transfers of financial assets and repurchase financing transactions. For linked transactions, a transferor and transferee shall not separately account for a transfer of a financial asset and a related repurchase financing unless (a) the two transactions have a valid and distinct business or economic purpose for being entered into separately and (b) the repurchase financing does not result in the initial transferor regaining control over the financial asset. This guidance was effective for Sterling as of January 1, 2009, and did not have a material impact on its consolidated financial statements.
In March 2008, the FASB issued a standard on disclosure requirements for derivative instruments and hedging activities. This section of the Codification requires enhanced disclosures about how and why an entity uses derivative instruments, how derivative instruments and related hedged items are accounted for, and how derivative instruments and related hedged items affect an entity’s financial position, financial performance, and cash flows. This guidance was effective for Sterling as of January 1, 2009, and did not have a material effect on its consolidated financial statements.
In June 2008, the FASB issued a staff position on determining whether instruments granted in share-based payment transactions are participating securities. The guidance clarifies that all outstanding unvested share-based payment awards that contain non-forfeitable rights to dividends are
| TX85 |
Table of Contents
participating securities and are required to be included in computing basic and diluted earnings per share under the two-class method. This guidance was effective for Sterling as of January 1, 2009, and did not have a material impact on its consolidated financial statements.
In April 2009, the FASB issued staff positions on the recognition and presentation of Other-Than-Temporary Impairment (“OTTI”), determining fair value when the volume and level of activity for the asset or liability have significantly decreased and identifying transactions that are not orderly, and interim disclosures about fair value of financial instruments. For debt securities, the guidance differentiates credit driven and market driven OTTI. Only the portion of the impairment loss representing credit losses would be recognized in earnings as an OTTI. The balance of the impairment loss would be recognized as a charge to other comprehensive income. A non-credit related OTTI charge to other comprehensive income for securities classified as held to maturity will be amortized from accumulated other comprehensive income back to the security over the securities remaining life. Financial statement presentation will require segregation of accumulated comprehensive income for non-credit OTTI charges on held to maturity and available for sale securities from other components of accumulated comprehensive income. Additional guidance was included for the determination of whether a market for an asset is not active and when a price for a transaction is not distressed. Previously required annual disclosures have been extended to interim periods. This guidance was effective for Sterling as of June 30, 2009. See Notes 2 and 13.
In May 2009, the FASB issued guidance on subsequent events that standardizes accounting for and disclosures of events that occur after the balance sheet date but before financial statements are issued or are available to be issued. In February 2010, the FASB amended its guidance on subsequent events. As a SEC filer, Sterling is required to evaluate subsequent events through the date its financial statements are issued. These initial rules became effective for Sterling during its interim period ending after June 15, 2009, and revisions incorporated into this filing, and did not have a material impact on its consolidated financial statements.
In June 2009, the FASB issued standards on accounting for transfers of financial assets, removing the concept of qualifying special-purpose entities as an accounting criteria that had provided an exception to consolidation, and provided additional guidance on requirements for consolidation. This guidance is effective for Sterling on January 1, 2010, and is not expected to have a material impact on its consolidated financial statements.
In August 2009, the FASB issued an update to the codification that provided additional guidance on the measurement of liabilities at fair value. This guidance was effective for Sterling as of September 30, 2009, and did not have a material impact on its consolidated financial statements.
Effects of Inflation and Changing Prices
A financial institution has an asset and liability structure that is interest-rate sensitive. As a holder of monetary assets and liabilities, an institution’s performance may be significantly influenced by changes in interest rates. Although changes in the prices of goods and services do not necessarily move in the same direction as interest rates, increases in inflation generally have resulted in increased interest rates, which may have an adverse effect on Sterling’s business.
Item 7A. Quantitative and Qualitative Disclosures About Market Risk
For a discussion of Sterling’s market risk, see “MD&A—Asset and Liability Management.”
Item 8. Financial Statements and Supplementary Data
The required information is contained on pages F-1 through F-51 of this Form 10-K.
Item 9. Changes in and Disagreements with Accountants on Accounting and Financial Disclosure
There were no disagreements with Sterling’s independent accountants on accounting and financial disclosures.
| TX86 |
Table of Contents
Item 9A. Controls and Procedures
Sterling’s management, with the participation of Sterling’s principal executive officer and principal financial officer, has evaluated the effectiveness of Sterling’s disclosure controls and procedures (as such term is defined in Rules 13a-15(e) and 15d-15(e) under the Exchange Act) as of the end of the period covered by this report. Based on such evaluation, Sterling’s principal executive officer and principal financial officer have concluded that, as of the end of such period, Sterling’s disclosure controls and procedures are effective in recording, processing, summarizing and reporting, on a timely basis, information required to be disclosed by Sterling in the reports that it files or submits under the Exchange Act.
There were no changes in internal control over financial reporting (as defined in Exchange Act Rules 13a-15(f) and 15d-15(f)), during our fourth fiscal quarter that has materially affected, or is reasonably likely to materially affect, our internal control over financial reporting.
Management’s Report on Internal Control Over Financial Reporting
Sterling’s management, including the principal executive officer and principal financial officer, is responsible for establishing and maintaining adequate internal control over financial reporting, as such term is defined in Exchange Act Rules 13a-15(f). Under the supervision and with the participation of Sterling’s management, Sterling conducted an evaluation of the effectiveness of its internal control over financial reporting based on the framework described in Internal Control—Integrated Framework issued by the Committee of Sponsoring Organizations of the Treadway Commission (the “COSO Criteria”). Based on management’s evaluation under the COSO Criteria, Sterling’s management has concluded that Sterling’s internal control over financial reporting was effective as of December 31, 2009.
The effectiveness of Sterling’s internal control over financial reporting as of December 31, 2009 has been attested to by BDO Seidman, LLP, the independent registered public accounting firm that audited the financial statements included in Sterling’s annual report on Form 10-K, as stated in their report which is included herein.
| TX87 |
Table of Contents
Report of Independent Registered Public Accounting Firm
Board of Directors and Shareholders
Sterling Financial Corporation
Spokane, Washington
We have audited Sterling Financial Corporation’s internal control over financial reporting as of December 31, 2009, based on criteria established in Internal Control—Integrated Framework issued by the Committee of Sponsoring Organizations of the Treadway Commission (the COSO criteria). Sterling Financial Corporation’s management is responsible for maintaining effective internal control over financial reporting and for its assessment of the effectiveness of internal control over financial reporting, included in the accompanying Management’s Report on Internal Control Over Financial Reporting. Our responsibility is to express an opinion on the company’s internal control over financial reporting based on our audit.
We conducted our audit in accordance with the standards of the Public Company Accounting Oversight Board (United States). Those standards require that we plan and perform the audit to obtain reasonable assurance about whether effective internal control over financial reporting was maintained in all material respects. Our audit included obtaining an understanding of internal control over financial reporting, assessing the risk that a material weakness exists, and testing and evaluating the design and operating effectiveness of internal control based on the assessed risk. Our audit also included performing such other procedures as we considered necessary in the circumstances. We believe that our audit provides a reasonable basis for our opinion.
A company’s internal control over financial reporting is a process designed to provide reasonable assurance regarding the reliability of financial reporting and the preparation of financial statements for external purposes in accordance with generally accepted accounting principles. A company’s internal control over financial reporting includes those policies and procedures that (1) pertain to the maintenance of records that, in reasonable detail, accurately and fairly reflect the transactions and dispositions of the assets of the company; (2) provide reasonable assurance that transactions are recorded as necessary to permit preparation of financial statements in accordance with generally accepted accounting principles, and that receipts and expenditures of the company are being made only in accordance with authorizations of management and directors of the company; and (3) provide reasonable assurance regarding prevention or timely detection of unauthorized acquisition, use, or disposition of the company’s assets that could have a material effect on the financial statements.
Because of its inherent limitations, internal control over financial reporting may not prevent or detect misstatements. Also, projections of any evaluation of effectiveness to future periods are subject to the risk that controls may become inadequate because of changes in conditions, or that the degree of compliance with the policies or procedures may deteriorate.
In our opinion, Sterling Financial Corporation maintained, in all material respects, effective internal control over financial reporting as of December 31, 2009, based on the COSO criteria.
We also have audited, in accordance with the standards of the Public Company Accounting Oversight Board (United States), the consolidated balance sheets of Sterling Financial Corporation as of December 31, 2009 and 2008, and the related consolidated statements of income (loss) and comprehensive income (loss), changes in shareholders’ equity, and cash flows for each of the three years in the period ended December 31, 2009, and our report dated March 16, 2010, expressed an unqualified opinion thereon.
BDO Seidman, LLP
Spokane, Washington
March 16, 2010
| TX88 |
Table of Contents
None.
| PART III |
Item 10. Directors, Executive Officers and Corporate Governance
In response to this Item, the information set forth in Sterling’s Proxy Statement for its 2010 annual meeting of shareholders, under the headings “Board of Directors of Sterling Financial Corporation,” “Executive Officers,” and “Section 16(a) Beneficial Ownership Reporting Compliance” is incorporated herein by reference.
Information concerning Sterling’s Audit Committee and the Audit Committee’s financial expert is set forth under the caption “Information Concerning the Board of Directors and Its Committees—Committees of the Board of Directors” in Sterling’s Proxy Statement and is incorporated herein by reference.
Sterling has adopted a Code of Ethics that applies to all Sterling employees and directors, including Sterling’s senior financial officers. The Code of Ethics is publicly available on Sterling’s website at www.sterlingfinancialcorporation-spokane.com.
Item 11. Executive Compensation
In response to this Item, the information set forth in the Proxy Statement under the headings “Executive Compensation,” “Personnel Committee Report,” and “Personnel Committee Interlocks and Insider Participation” is incorporated herein by reference.
Item 12. Security Ownership of Certain Beneficial Owners and Management and Related Stockholder Matters
In response to this Item, the information set forth in the Proxy Statement under the headings “Security Ownership of Management and Certain Beneficial Owners” and “Equity Compensation Plan Information” is incorporated herein by reference.
Item 13. Certain Relationships and Related Transactions, and Director Independence
In response to this Item, the information set forth in the Proxy Statement under the headings “Interests of Directors, Officers and Others in Certain Transactions” and “Corporate Governance—Affirmative Determinations Regarding Director Independence” is incorporated herein by reference.
Item 14. Principal Accounting Fees and Services
In response to this Item, the information set forth in the Proxy Statement under the headings “Ratification of Appointment of Independent Registered Public Accounting Firm,” “Audit Committee Report,” “Independent Public Accounting Firm’s Fees,” and “Pre-Approval of Audit and Non-Audit Services” is incorporated herein by reference.
| TX89 |
Table of Contents
| PART IV |
Item 15. Exhibits, Financial Statement Schedules
| (a) | Documents which are filed as a part of this report: |
| 1. | Financial Statements: The required financial statements are contained in pages F-1 through F-51 of this Form 10-K. |
| 2. | Financial Statement Schedules: Financial statement schedules have been omitted as they are not applicable or the information is included in the Consolidated Financial Statements. |
| 3. | Exhibits: The exhibits filed as part of this report and the exhibits incorporated herein by reference are listed in the Exhibit Index at page E-1. |
| (b) | See (a)(3) above for all exhibits filed herewith. |
| (c) | All schedules are omitted as the required information is not applicable or the information is presented in the Consolidated Financial Statements or related notes. |
| TX90 |
Table of Contents
Pursuant to the requirements of Section 13 or 15(d) of the Securities Exchange Act of 1934, as amended, the registrant has duly caused this report to be signed on its behalf by the undersigned, thereunto duly authorized.
STERLING FINANCIAL CORPORATION
| /s/ J. Gregory Seibly J. Gregory Seibly |
President and Chief Executive Officer | March 16, 2010 |
Pursuant to the requirements of the Securities Exchange Act of 1934, as amended, this report has been signed below by the following persons on behalf of the registrant and in the capacities and on the dates indicated.
| /s/ J. Gregory Seibly J. Gregory Seibly |
President and Chief Executive Officer | March 16, 2010 | ||
| /s/ Daniel G. Byrne Daniel G. Byrne |
Executive Vice President, Assistant Secretary, and Principal Financial Officer | March 16, 2010 | ||
| /s/ Robert G. Butterfield Robert G. Butterfield |
Senior Vice President, Controller and Principal Accounting Officer | March 16, 2010 | ||
| /s/ Katherine K. Anderson Katherine K. Anderson |
Director | March 16, 2010 | ||
| /s/ Ned M. Barnes Ned M. Barnes |
Director | March 16, 2010 | ||
|
Rodney W. Barnett |
Director | |||
| /s/ Thomas H. Boone Thomas H. Boone |
Director | March 16, 2010 | ||
| /s/ Ellen R.M. Boyer Ellen R.M. Boyer |
Director | March 16, 2010 | ||
| /s/ William L. Eisenhart William L. Eisenhart |
Chairman of the Board | March 16, 2010 | ||
| /s/ James P. Fugate James P. Fugate |
Director | March 16, 2010 | ||
| /s/ Kermit K. Houser Kermit K. Houser |
Director | March 16, 2010 | ||
| /s/ Robert D. Larrabee Robert D. Larrabee |
Director | March 16, 2010 | ||
| TX91 |
Table of Contents
| /s/ Michael F. Reuling Michael F. Reuling |
Director | March 16, 2010 | ||
| /s/ Dianne E. Spires Dianne E. Spires |
Director | March 16, 2010 | ||
| /s/ William W. Zuppe William W. Zuppe |
Director | March 16, 2010 | ||
| TX92 |
Table of Contents
| Exhibit No. |
Exhibit Index | |
| 3.1 | Restated Articles of Incorporation of Sterling. Filed as Exhibit 4.1 to Sterling’s Amendment No. 1 to the Registration Statement on Form S-3 dated May 8, 2009 and incorporated by reference herein. | |
| 3.2 | Articles of Amendment to the Restated Articles of Incorporation of Sterling. Filed as Exhibit 4.2 to Sterling’s Amendment No. 1 to the Registration Statement on Form S-3 dated September 21, 2009 and incorporated by reference herein. | |
| 3.3 | Amended and Restated Bylaws of Sterling. Filed as Exhibit 4.3 to Sterling’s Registration Statement on Form S-3 dated January 6, 2009 and incorporated by reference herein. | |
| 4.1 | Reference is made to Exhibits 3.1, 3.2 and 3.3. | |
| 4.2 | Form of Common Stock Certificate. Filed as Exhibit 4.3 to Sterling’s Registration Statement on Form S-3 dated July 20, 2009 and incorporated by reference herein. | |
| 4.3 | Form of Series A Preferred Stock Certificate. Filed as Exhibit 4.6 to Sterling’s Registration Statement on Form S-3 dated January 6, 2009 and incorporated by reference herein. | |
| 4.4 | Form of Warrant to purchase shares of Sterling common stock, dated December 5, 2008 and issued to the United States Department of the Treasury. Filed as Exhibit 4.2 to Sterling’s current report on Form 8-K dated December 8, 2008 and incorporated by reference herein. | |
| 4.5 | Sterling has outstanding certain long-term debt. None of such debt exceeds ten percent of Sterling’s total assets; therefore, copies of the constituent instruments defining the rights of the holders of such debt are not included as exhibits. Copies of instruments with respect to such long-term debt will be furnished to the Securities and Exchange Commission upon request. | |
| 10.1 | Letter Agreement, dated December 5, 2008, between Sterling and the United States Department of the Treasury. Filed as Exhibit 10.1 to Sterling’s current report on Form 8-K dated December 8, 2008 and incorporated by reference herein. | |
| 10.2 | Warrant to purchase shares of Sterling common stock, dated December 5, 2008 and issued to the United States Department of the Treasury. Filed as Exhibit 4.2 to Sterling’s current report on Form 8-K dated December 8, 2008 and incorporated by reference herein. | |
| 10.3 | Employment Agreement by and between Sterling and J. Gregory Seibly, entered into on August 28, 2008. Filed as Exhibit 10.7 to Sterling’s annual report on Form 10-K dated March 6, 2009 and incorporated by reference herein. | |
| 10.4 | Amended and Restated Employment Agreement by and between Sterling and Daniel G. Byrne. Filed as Exhibit 10.3 to Sterling’s current report on Form 8-K dated August 11, 2008 and incorporated by reference herein. | |
| 10.5 | Employment Agreement by and between Sterling and Donn C. Costa, entered into on February 12, 2006. Filed as Exhibit 10.6 to Sterling’s annual report on Form 10-K dated March 6, 2009 and incorporated by reference herein. | |
| 10.6 | Form of First Amendment to the Amended and Restated Employment Agreement by and between Sterling and Daniel G. Byrne, Donn C. Costa, and J. Gregory Seibly, entered into on December 4, 2008. Filed as exhibit 10.2 to Sterling’s current report on Form 8-K dated December 8, 2008 and incorporated by reference herein. | |
| 10.7 | Sterling Financial Corporation 1998 Long-Term Incentive Plan. Filed herewith. | |
| 10.8 | Form of Sterling Financial Corporation Amended and Restated Deferred Compensation Plan, effective July 1, 1999. Filed herewith. | |
| E-EXIND1 |
Table of Contents
| Exhibit No. |
Exhibit Index | |
| 10.9 | Sterling Financial Corporation 2001 Long-Term Incentive Plan. Filed herewith. | |
| 10.10 | Sterling Financial Corporation 2003 Long-Term Incentive Plan. Filed herewith. | |
| 10.11 | Sterling Savings Bank Deferred Compensation Plan, effective date April 1, 2006. Filed as Exhibit 10.6 to Sterling’s Annual Report on Form 10-K dated February 28, 2007 and incorporated by reference herein. | |
| 10.12 | Form of Sterling Financial Corporation and Sterling Savings Bank Supplemental Executive Retirement Plan. Filed herewith. | |
| 12.1 | Statement regarding Computation of Return on Average Common Shareholders’ Equity. Filed herewith. | |
| 12.2 | Statement regarding Computation of Return on Average Assets. Filed herewith. | |
| 12.3 | Statement of Ratio of Earnings to Fixed Charges and Preferred Dividends. Filed herewith. | |
| 21.1 | List of Subsidiaries of Sterling. Filed herewith. | |
| 23.1 | Consent of BDO Seidman, LLP. Filed herewith. | |
| 31.1 | Certification of Principal Executive Officer pursuant to Section 302 of the Sarbanes-Oxley Act of 2002. Filed herewith. | |
| 31.2 | Certification of Principal Financial Officer pursuant to Section 302 of the Sarbanes-Oxley Act of 2002. Filed herewith. | |
| 32.1 | Certification of Principal Executive Officer pursuant to 18 U.S.C. Section 1350, as adopted pursuant to Section 906 of the Sarbanes-Oxley Act of 2002. Furnished herewith. | |
| 32.2 | Certification of Principal Financial Officer pursuant to 18 U.S.C. Section 1350, as adopted pursuant to Section 906 of the Sarbanes-Oxley Act of 2002. Furnished herewith. | |
| 99.1 | Certification of Principal Executive Officer pursuant to Section 111(b)(4) of the Emergency Economic Stabilization Act of 2008. Filed herewith. | |
| 99.2 | Certification of Principal Financial Officer pursuant to Section 111(b)(4) of the Emergency Economic Stabilization Act of 2008. Filed herewith. | |
| E-EXIND2 |
Table of Contents
Report of Independent Registered Public Accounting Firm
Board of Directors and Shareholders
Sterling Financial Corporation
Spokane, Washington
We have audited the accompanying consolidated balance sheets of Sterling Financial Corporation as of December 31, 2009 and 2008, and the related consolidated statements of income (loss) and comprehensive income (loss), changes in shareholders’ equity, and cash flows for each of the three years in the period ended December 31, 2009. These financial statements are the responsibility of the Company’s management. Our responsibility is to express an opinion on these financial statements based on our audits.
We conducted our audits in accordance with the standards of the Public Company Accounting Oversight Board (United States). Those standards require that we plan and perform the audit to obtain reasonable assurance about whether the financial statements are free of material misstatement. An audit includes examining, on a test basis, evidence supporting the amounts and disclosures in the financial statements, assessing the accounting principles used and significant estimates made by management, as well as evaluating the overall financial statement presentation. We believe that our audits provide a reasonable basis for our opinion.
In our opinion, the consolidated financial statements referred to above present fairly, in all material respects, the financial position of Sterling Financial Corporation at December 31, 2009 and 2008, and the results of its operations and its cash flows for each of the three years in the period ended December 31, 2009, in conformity with accounting principles generally accepted in the United States of America.
The accompanying financial statements have been prepared assuming that the Company will continue as a going concern. As discussed in Note 25 to the financial statements, the Company has suffered significant net losses during 2009 and 2008, a decline in regulatory capital to support operations, and regulatory issues that raise substantial doubt about its ability to continue as a going concern. Management’s plans in regard to these matters are also described in Note 25. The financial statements do not include any adjustments that might result from the outcome of this uncertainty.
We also have audited, in accordance with the standards of the Public Company Accounting Oversight Board (United States), Sterling Financial Corporation’s internal control over financial reporting as of December 31, 2009, based on criteria established in Internal Control—Integrated Framework issued by the Committee of Sponsoring Organizations of the Treadway Commission (COSO) and our report dated March 16, 2010 expressed an unqualified opinion thereon.
BDO Seidman, LLP
Spokane, Washington
March 16, 2010
| F-FIN1 |
Table of Contents
Sterling Financial Corporation
Consolidated Balance Sheets
December 31, 2009 and 2008
(Dollars in thousands)
| 2009 | 2008 | |||||||
| ASSETS: |
||||||||
| Cash and cash equivalents: |
||||||||
| Interest bearing |
$ | 424,008 | $ | 171 | ||||
| Noninterest bearing |
140,775 | 138,631 | ||||||
| Total cash and cash equivalents |
564,783 | 138,802 | ||||||
| Restricted cash |
8,223 | 1,493 | ||||||
| Investments and mortgage-backed securities (“MBS”): |
||||||||
| Available for sale |
2,160,325 | 2,639,290 | ||||||
| Held to maturity |
17,646 | 175,830 | ||||||
| Loans receivable, net |
7,344,199 | 8,807,094 | ||||||
| Loans held for sale (at fair value: $189,185 and $112,191) |
190,412 | 112,777 | ||||||
| Accrued interest receivable |
43,869 | 57,306 | ||||||
| Other real estate owned, net (“OREO”) |
83,272 | 62,320 | ||||||
| Office properties and equipment, net |
92,037 | 93,195 | ||||||
| Bank-owned life insurance (“BOLI”) |
164,743 | 157,236 | ||||||
| Goodwill |
0 | 227,558 | ||||||
| Other intangible assets |
21,827 | 26,725 | ||||||
| Mortgage servicing rights, net |
12,062 | 5,706 | ||||||
| Prepaid expenses and other assets, net |
174,025 | 285,384 | ||||||
| Total assets |
$ | 10,877,423 | $ | 12,790,716 | ||||
| LIABILITIES: |
||||||||
| Deposits |
$ | 7,775,190 | $ | 8,350,407 | ||||
| Advances from Federal Home Loan Bank (“FHLB”) |
1,337,167 | 1,726,549 | ||||||
| Securities sold subject to repurchase agreements and funds purchased |
1,049,146 | 1,163,023 | ||||||
| Other borrowings |
248,281 | 248,276 | ||||||
| Cashiers checks issued and payable |
6,443 | 8,762 | ||||||
| Borrowers’ reserves for taxes and insurance |
2,283 | 1,987 | ||||||
| Accrued interest payable |
22,245 | 41,631 | ||||||
| Accrued expenses and other liabilities |
113,419 | 109,045 | ||||||
| Total liabilities |
10,554,174 | 11,649,680 | ||||||
| Commitments and contingencies |
||||||||
| SHAREHOLDERS’ EQUITY: |
||||||||
| Preferred stock, $1 par value; $1,000 stated value; 10,000,000 shares
authorized; |
294,136 | 291,964 | ||||||
| Common stock, $1 par value; 750,000,000 shares authorized; 52,211,090
and |
52,211 | 52,134 | ||||||
| Additional paid-in capital |
910,663 | 909,386 | ||||||
| Accumulated other comprehensive income (loss): |
||||||||
| Unrealized gains (losses) on investments and MBS available-for-sale, net of deferred income taxes of $(9,518) and $10,690 |
16,284 | (17,866 | ) | |||||
| Accumulated deficit |
(950,045 | ) | (94,582 | ) | ||||
| Total shareholders’ equity |
323,249 | 1,141,036 | ||||||
| Total liabilities and shareholders’ equity |
$ | 10,877,423 | $ | 12,790,716 | ||||
See accompanying summary of significant accounting policies and notes to consolidated financial statements.
| F-FIN2 |
Table of Contents
Sterling Financial Corporation
Consolidated Statements of Income (Loss)
For the Years Ended December 31, 2009, 2008 and 2007
(Dollars in thousands, except per share amounts)
| 2009 | 2008 | 2007 | ||||||||||
| Interest income: |
||||||||||||
| Loans |
$ | 479,436 | $ | 599,192 | $ | 679,991 | ||||||
| MBS |
108,513 | 102,863 | 79,266 | |||||||||
| Investments and cash equivalents |
11,398 | 13,007 | 7,721 | |||||||||
| Total interest income |
599,347 | 715,062 | 766,978 | |||||||||
| Interest expense: |
||||||||||||
| Deposits |
169,261 | 234,337 | 277,614 | |||||||||
| Short-term borrowings |
16,476 | 20,820 | 29,956 | |||||||||
| Long-term borrowings |
69,633 | 100,353 | 104,048 | |||||||||
| Total interest expense |
255,370 | 355,510 | 411,618 | |||||||||
| Net interest income |
343,977 | 359,552 | 355,360 | |||||||||
| Provision for credit losses |
(681,371 | ) | (333,597 | ) | (25,088 | ) | ||||||
| Net interest income after provision for credit losses |
(337,394 | ) | 25,955 | 330,272 | ||||||||
| Non-interest income: |
||||||||||||
| Fees and service charges |
58,326 | 59,867 | 55,978 | |||||||||
| Mortgage banking operations |
47,298 | 27,651 | 32,649 | |||||||||
| Loan servicing fees |
2,378 | 431 | 1,442 | |||||||||
| BOLI |
6,954 | 5,286 | 6,500 | |||||||||
| Gains on sales of securities |
13,467 | 409 | 5 | |||||||||
| Gain (charge) related to early repayment of debt |
0 | 0 | (2,324 | ) | ||||||||
| Other non-interest expense |
(4,609 | ) | (1,749 | ) | (844 | ) | ||||||
| Total non-interest income |
123,814 | 91,895 | 93,406 | |||||||||
| Non-interest expenses before impairment charge |
369,974 | 305,517 | 285,465 | |||||||||
| Goodwill impairment |
227,558 | 223,765 | 0 | |||||||||
| Non-interest expenses |
597,532 | 529,282 | 285,465 | |||||||||
| Income (loss) before income taxes |
(811,112 | ) | (411,432 | ) | 138,213 | |||||||
| Income tax benefit (provision) |
||||||||||||
| Current |
51,266 | 16,638 | (53,777 | ) | ||||||||
| Deferred |
(78,248 | ) | 59,260 | 8,853 | ||||||||
| Total tax benefit (provision) |
(26,982 | ) | 75,898 | (44,924 | ) | |||||||
| Net income (loss) |
(838,094 | ) | (335,534 | ) | 93,289 | |||||||
| Preferred stock dividends and accretion |
(17,369 | ) | (1,208 | ) | 0 | |||||||
| Net income (loss) applicable to common shareholders |
$ | (855,463 | ) | $ | (336,742 | ) | $ | 93,289 | ||||
| Earnings (loss) per share—basic |
$ | (16.48 | ) | $ | (6.51 | ) | $ | 1.87 | ||||
| Earnings (loss) per share—diluted |
$ | (16.48 | ) | $ | (6.51 | ) | $ | 1.86 | ||||
| Weighted average shares outstanding—basic |
51,922,275 | 51,721,671 | 49,786,349 | |||||||||
| Weighted average shares outstanding—diluted |
51,922,275 | 51,721,671 | 50,217,515 | |||||||||
See accompanying summary of significant accounting policies and notes to consolidated financial statements.
| F-FIN3 |
Table of Contents
Sterling Financial Corporation
Consolidated Statements of Comprehensive Income (Loss)
For the Years Ended December 31, 2009, 2008 and 2007
(Dollars in thousands)
| 2009 | 2008 | 2007 | ||||||||||
| Net income (loss) |
$ | (838,094 | ) | $ | (335,534 | ) | $ | 93,289 | ||||
| Other comprehensive income (loss): |
||||||||||||
| Change in unrealized gains or losses on investments and MBS available for sale, net of reclassification adjustments |
54,358 | (71 | ) | 24,397 | ||||||||
| Less deferred income tax benefit (provision) |
(20,208 | ) | 172 | (9,014 | ) | |||||||
| Net other comprehensive income |
34,150 | 101 | 15,383 | |||||||||
| Comprehensive income (loss) |
$ | (803,944 | ) | $ | (335,433 | ) | $ | 108,672 | ||||
See accompanying summary of significant accounting policies and notes to consolidated financial statements.
| F-FIN4 |
Table of Contents
Sterling Financial Corporation
Consolidated Statements of Changes in Shareholders’ Equity
For the Years Ended December 31, 2009, 2008 and 2007
(Dollars in thousands)
| Preferred Stock | Common Stock | Additional Paid-In Capital |
Accumulated Other Comprehensive Income (Loss) |
Retained Earnings (Deficit) |
Total Shareholders’ Equity |
|||||||||||||||||||||
| Shares | Amount | Shares | Amount | |||||||||||||||||||||||
| Balance, January 1, 2007 |
0 | $ | 0 | 42,042,740 | $ | 42,043 | $ | 590,218 | $ | (33,350 | ) | $ | 184,505 | $ | 783,416 | |||||||||||
| Shares issued upon exercise of stock options |
318,130 | 318 | 3,274 | 3,592 | ||||||||||||||||||||||
| Shares issued for business combinations |
8,926,819 | 8,927 | 294,137 | 303,064 | ||||||||||||||||||||||
| Shares issued for 401(k) match and direct stock purchases |
83,772 | 83 | 2,146 | 2,229 | ||||||||||||||||||||||
| Change in unrealized gain or loss on investments and MBS available for sale, net of income tax |
15,383 | 15,383 | ||||||||||||||||||||||||
| Cash common dividends declared |
(17,981 | ) | (17,981 | ) | ||||||||||||||||||||||
| Equity based compensation |
85,000 | 85 | 1,319 | 1,404 | ||||||||||||||||||||||
| Tax benefit of stock options |
934 | 934 | ||||||||||||||||||||||||
| Net income |
93,289 | 93,289 | ||||||||||||||||||||||||
| Balance, December 31, 2007 |
0 | 0 | 51,456,461 | 51,456 | 892,028 | (17,967 | ) | 259,813 | 1,185,330 | |||||||||||||||||
| Adoption of BOLI EITF 06-4 |
(2,055 | ) | (2,055 | ) | ||||||||||||||||||||||
| Shares issued for capital purchase program |
303,000 | 291,809 | 11,191 | 303,000 | ||||||||||||||||||||||
| Accretion of preferred stock |
155 | (155 | ) | 0 | ||||||||||||||||||||||
| Shares issued upon exercise of stock options |
237,078 | 237 | 1,153 | 1,390 | ||||||||||||||||||||||
| Shares issued for 401(k) match and direct stock purchases |
213,787 | 214 | 1,801 | 2,015 | ||||||||||||||||||||||
| Change in unrealized gain or loss on investments and MBS available for sale, net of income tax |
101 | 101 | ||||||||||||||||||||||||
| Cash common dividends declared |
(15,599 | ) | (15,599 | ) | ||||||||||||||||||||||
| Cash preferred dividends declared |
(1,052 | ) | (1,052 | ) | ||||||||||||||||||||||
| Equity based compensation |
226,704 | 227 | 2,360 | 2,587 | ||||||||||||||||||||||
| Tax benefit of stock options |
853 | 853 | ||||||||||||||||||||||||
| Net loss |
(335,534 | ) | (335,534 | ) | ||||||||||||||||||||||
| Balance, December 31, 2008 |
303,000 | 291,964 | 52,134,030 | 52,134 | 909,386 | (17,866 | ) | (94,582 | ) | 1,141,036 | ||||||||||||||||
| Accretion of preferred stock |
2,172 | (2,172 | ) | 0 | ||||||||||||||||||||||
| Shares issued for direct stock purchases |
13,560 | 14 | 7 | 21 | ||||||||||||||||||||||
| Change in unrealized gain or loss on investments and MBS available for sale, net of income tax |
34,150 | 34,150 | ||||||||||||||||||||||||
| Cash preferred dividends declared |
(15,197 | ) | (15,197 | ) | ||||||||||||||||||||||
| Equity based compensation |
63,500 | 63 | 2,074 | 2,137 | ||||||||||||||||||||||
| Tax benefit of stock options |
(804 | ) | (804 | ) | ||||||||||||||||||||||
| Net loss |
(838,094 | ) | (838,094 | ) | ||||||||||||||||||||||
| Balance, December 31, 2009 |
303,000 | $ | 294,136 | 52,211,090 | $ | 52,211 | $ | 910,663 | $ | 16,284 | $ | (950,045 | ) | $ | 323,249 | |||||||||||
See accompanying summary of significant accounting policies and notes to consolidated financial statements.
| F-FIN5 |
Table of Contents
Sterling Financial Corporation
Consolidated Statements of Cash Flows
For the Years Ended December 31, 2009, 2008 and 2007
(Dollars in thousands)
| 2009 | 2008 | 2007 | ||||||||||
| Cash flows from operating activities: |
||||||||||||
| Net income (loss) |
$ | (838,094 | ) | $ | (335,534 | ) | $ | 93,289 | ||||
| Adjustments to reconcile net income to net cash provided by operating activities: |
||||||||||||
| Provisions for credit losses and real estate owned |
712,392 | 351,225 | 25,088 | |||||||||
| Goodwill impairment |
227,558 | 223,765 | 0 | |||||||||
| Deferred tax asset valuation allowance |
269,000 | 0 | 0 | |||||||||
| Accretion of deferred gains on sale of buildings |
(804 | ) | (804 | ) | (826 | ) | ||||||
| Net gain on sales of loans, investments and MBS |
(64,060 | ) | (20,306 | ) | (20,413 | ) | ||||||
| Stock based compensation |
2,137 | 2,587 | 1,404 | |||||||||
| Excess tax benefit from stock based compensation |
804 | (853 | ) | (934 | ) | |||||||
| Stock issuances relating to 401(k) match and direct stock purchases |
21 | 2,015 | 2,229 | |||||||||
| Loss on sale of OREO |
46,049 | 0 | 0 | |||||||||
| Other gains and losses |
4,205 | 5,648 | 4,170 | |||||||||
| Loss (gain) related to early repayment of debt |
0 | 0 | 2,324 | |||||||||
| Increase in cash surrender value of BOLI |
(6,954 | ) | (5,130 | ) | (6,500 | ) | ||||||
| Depreciation and amortization |
33,616 | 23,019 | 24,674 | |||||||||
| Deferred income tax (provision) benefit |
(190,752 | ) | 59,260 | 8,853 | ||||||||
| Change in: |
||||||||||||
| Accrued interest receivable |
13,437 | 6,343 | (1,090 | ) | ||||||||
| Prepaid expenses and other assets |
4,341 | (191,488 | ) | (15,104 | ) | |||||||
| Cashiers checks issued and payable |
(2,319 | ) | 7,998 | (22,079 | ) | |||||||
| Accrued interest payable |
(19,386 | ) | 1,422 | (3,951 | ) | |||||||
| Accrued expenses and other liabilities |
(3,286 | ) | 7,544 | 14,497 | ||||||||
| Proceeds from sales of loans originated for sale |
2,705,675 | 1,113,370 | 1,258,621 | |||||||||
| Loans originated for sale |
(2,656,039 | ) | (1,093,064 | ) | (1,241,934 | ) | ||||||
| Net cash provided by operating activities |
237,541 | 157,017 | 122,318 | |||||||||
| Cash flows from investing activities: |
||||||||||||
| Change in restricted cash |
(6,730 | ) | (393 | ) | 50 | |||||||
| Loans funded and purchased |
(2,109,418 | ) | (3,848,603 | ) | (4,876,317 | ) | ||||||
| Loan principal received |
2,561,729 | 3,517,430 | 4,073,897 | |||||||||
| Proceeds from sales of portfolio loans |
51,869 | 0 | 112,676 | |||||||||
| Purchase of investments securities |
(693,990 | ) | (1,315,867 | ) | (109,940 | ) | ||||||
| Proceeds from maturities of investments securities |
764,156 | 1,115,269 | 45,198 | |||||||||
| Proceeds from sales of investments securities |
98,617 | 0 | 7,208 | |||||||||
| Net change in cash and cash equivalents from acquisitions |
0 | 0 | 92,419 | |||||||||
| Purchase of BOLI |
0 | 0 | (2,257 | ) | ||||||||
| Purchase of mortgage-backed securities |
(851,543 | ) | (912,433 | ) | (305,009 | ) | ||||||
| Principal payments on MBS |
798,632 | 276,916 | 230,770 | |||||||||
| Proceeds from sales of MBS |
572,863 | 0 | 0 | |||||||||
| Purchase of office properties and equipment |
(15,138 | ) | (13,980 | ) | (14,671 | ) | ||||||
| Sale of office properties and equipment |
14 | (24 | ) | 5,467 | ||||||||
| Improvements and other changes to real estate owned |
(1,993 | ) | 1,820 | (119 | ) | |||||||
| Proceeds from sales of real estate owned |
104,637 | 10,208 | 1,348 | |||||||||
| Net cash provided by (used in) investing activities |
1,273,705 | (1,169,657 | ) | (739,280 | ) | |||||||
See accompanying summary of significant accounting policies and notes to consolidated financial statements.
| F-FIN6 |
Table of Contents
Sterling Financial Corporation
Consolidated Statements of Cash Flows, Continued
For the Years Ended December 31, 2009, 2008 and 2007
(Dollars in thousands)
| 2009 | 2008 | 2007 | ||||||||||
| Cash flows from financing activities: |
||||||||||||
| Net change in transaction and savings deposits |
$ | 115,008 | $ | (113,771 | ) | $ | 96,120 | |||||
| Proceeds from issuance of time deposits |
2,880,826 | 5,173,702 | 3,998,803 | |||||||||
| Payments for maturing time deposits |
(3,754,059 | ) | (4,612,075 | ) | (4,420,908 | ) | ||||||
| Interest credited to deposits |
183,008 | 224,779 | 263,075 | |||||||||
| Advances from FHLB Seattle |
220,000 | 781,906 | 2,246,244 | |||||||||
| Repayment of advances from FHLB Seattle |
(608,930 | ) | (742,733 | ) | (2,133,187 | ) | ||||||
| Net change in securities sold subject to repurchase agreements and funds purchased |
(113,877 | ) | (15,822 | ) | 562,491 | |||||||
| Proceeds from other borrowings |
0 | 0 | 69,392 | |||||||||
| Repayment of other borrowings |
0 | (24,000 | ) | (36,855 | ) | |||||||
| Proceeds from issuance of preferred stock and common stock warrants |
0 | 303,000 | 0 | |||||||||
| Proceeds from stock sales |
0 | 1,390 | 3,592 | |||||||||
| Excess tax benefit from stock based compensation |
(804 | ) | 853 | 934 | ||||||||
| Cash dividends paid to shareholders |
(6,733 | ) | (20,487 | ) | (16,243 | ) | ||||||
| Other |
296 | 222 | (583 | ) | ||||||||
| Net cash (used in) provided by financing activities |
(1,085,265 | ) | 956,964 | 632,875 | ||||||||
| Net change in cash and cash equivalents |
425,981 | (55,676 | ) | 15,913 | ||||||||
| Cash and cash equivalents, beginning of year |
138,802 | 194,478 | 178,565 | |||||||||
| Cash and cash equivalents, end of year |
$ | 564,783 | $ | 138,802 | $ | 194,478 | ||||||
| Supplemental disclosures: |
||||||||||||
| Cash paid (refunded) during the period for: |
||||||||||||
| Interest |
$ | 274,756 | $ | 354,088 | $ | 411,272 | ||||||
| Income taxes |
(69,718 | ) | 17,039 | 52,729 | ||||||||
| Noncash financing and investing activities: |
||||||||||||
| Loans converted into real estate owned |
200,666 | 124,610 | 8,252 | |||||||||
| Common stock issued for business combinations |
0 | 0 | 303,064 | |||||||||
| Common stock cash dividend accrued |
0 | 0 | 4,889 | |||||||||
| Deferred gains on sales of branches |
0 | 0 | 804 | |||||||||
| Preferred stock cash dividend accrued |
9,563 | 1,052 | 0 | |||||||||
See accompanying summary of significant accounting policies and notes to consolidated financial statements.
| F-FIN7 |
Table of Contents
NOTES TO CONSOLIDATED FINANCIAL STATEMENTS
1. SUMMARY OF SIGNIFICANT ACCOUNTING POLICIES:
Business
Sterling Financial Corporation (“Sterling”) is a bank holding company, organized under the laws of Washington State in 1992. The principal operating subsidiaries of Sterling are Sterling Savings Bank and Golf Savings Bank. Sterling Savings Bank, headquartered in Spokane, Washington, commenced operations in 1983 as a Washington State-chartered federally insured stock savings and loan association, and in 2005 converted to a commercial bank. Sterling Savings Bank offers commercial banking products and services, mortgage lending, construction financing and investment products to individuals, small business, commercial organization and corporations. The main focus of Golf Savings Bank, a Washington State-chartered savings bank acquired by Sterling in July 2006, is the origination and sale of residential mortgage loans.
Sterling provides personalized, quality financial services and banking products to its customers consistent with its “Hometown Helpful” philosophy. Sterling believes that its dedication to personalized service and relationship banking has enabled it to grow both its retail deposit base and its lending portfolio in the western United States. The strategy centers on bringing the full product suite of a large regional institution to customers with the personalized service of a local community bank, and providing knowledgeable bankers, fair pricing, convenience, and competitive products and services. With $10.88 billion in total assets as of December 31, 2009, Sterling originates loans and attracts Federal Deposit Insurance Corporation (“FDIC”) insured and uninsured deposits from the general public through 178 depository banking offices located in Washington, Oregon, California, Idaho and Montana. In addition, Sterling originates loans through Golf Savings Bank and Sterling Savings Bank residential loan production offices, and through INTERVEST commercial real estate lending offices throughout the western United States. Sterling also markets fixed income and equity products, mutual funds, fixed and variable annuities and other financial products through wealth management representatives located throughout Sterling’s financial service center network.
In the fourth quarter of 2009, Sterling Savings Bank entered into a Stipulation and Consent to the Issuance of an Order to Cease and Desist (the “SSB Consent Agreement”) with the Federal Deposit Insurance Corporation (“FDIC”) and the WDFI. Under the terms of the agreement, Sterling Savings Bank has agreed to, among other things, raise capital of at least $300 million, and maintain a Tier 1 leverage ratio of not less than 10%. During the fourth quarter, Sterling and the Federal Reserve Bank of San Francisco (the “Reserve Bank”) entered into a written agreement (the “Reserve Bank Agreement”) to enhance Sterling’s ability to act as a source of strength to Sterling Savings Bank and Golf Savings Bank. Substantially all of the requirements of the Reserve Bank Agreement are similar to those imposed on Sterling Savings Bank by the FDIC.
Sterling’s revenues are derived primarily from interest earned on loans and mortgage-backed securities (“MBS”), fees and service charges, and mortgage banking operations. Sterling’s operating results for 2009 have continued to be impacted by the major disruption in the housing market and downturn in the economy. For the year ended December 31, 2009, Sterling recorded a loss of $855.5 million, or $16.48 per common share, reflecting a $681.4 million provision for credit losses compared with $333.6 million for 2008, and recorded non-cash charges of $227.6 million to reflect impairment of Sterling’s goodwill, and $269.0 million to establish a valuation allowance against its deferred tax asset. During the third quarter of 2009, Sterling announced that, as part of its ongoing strategy to manage through the current economic cycle, it deferred regularly scheduled interest payments on its outstanding junior subordinated notes relating to its trust preferred securities. Sterling also announced the deferral of quarterly cash dividend payments on its $303 million in preferred stock. Sterling is allowed to defer payments of interest on the junior subordinated notes for up to 20 consecutive quarterly periods without default.
| F-FIN8 |
Table of Contents
Principles of Consolidation
The accompanying consolidated financial statements include the accounts of Sterling and its directly and indirectly wholly owned subsidiaries. All significant intercompany accounts and transactions have been eliminated in consolidation.
Estimates
The preparation of financial statements in accordance with accounting principles generally accepted in the United States of America requires the use of estimates and assumptions that affect the reported amounts of assets and liabilities, disclosure of contingent assets and liabilities known to exist as of the date the financial statements are published and the reported amounts of revenues and expenses during the reporting period. Uncertainties with respect to such estimates and assumptions are inherent in the preparation of Sterling’s consolidated financial statements; accordingly, it is possible that the actual results could differ from these estimates and assumptions, which could have a material effect on the reported amounts of Sterling’s consolidated financial position and results of operations.
Cash and Cash Equivalents
Cash equivalents include investments with a remaining maturity of three months or less at the date of purchase. Cash and cash equivalents are deposited with other banks and financial institutions in amounts that may at times exceed the federal insurance limit. Sterling evaluates the credit quality of these banks and financial institutions to mitigate its credit risk.
Restricted cash consists of noninterest bearing deposits maintained as a reserve at the Federal Reserve Bank, and cash collateral balances with correspondent banks.
Sterling occasionally purchases securities under agreements with other institutions to resell the same or similar securities. The amounts advanced under these agreements represent short-term loans and are reflected as interest bearing cash equivalents in the consolidated balance sheet. The securities underlying the agreements are comprised of mutual fund shares that are primarily invested in U.S. government securities.
Investments and MBS
Sterling classifies debt and equity investments and MBS as follows:
| Ÿ | Available for Sale. Debt and equity investments and MBS that are not classified as trading securities or held to maturity are classified as available for sale and are carried at fair value. These securities are valued using a pricing service’s matrix technique based on quoted prices for similar instruments, which Sterling validates with non-binding broker quotes, in depth collateral analysis and cash flow stress testing. Unrealized gains and losses are reported, net of deferred income taxes, as a component of accumulated other comprehensive income or loss in shareholders’ equity until realized. |
| Ÿ | Held to Maturity. These are investments that management of Sterling has the intent and ability to hold until maturity. As of December 31, 2009, held to maturity securities are composed of equity tax credits that are carried at par, and amortized over the life of the credits. |
Premiums and discounts are amortized using the effective yield method over the estimated remaining term of the underlying security. Realized gains and losses on sales of investments and MBS are recognized in the statement of income in the period sold using the specific identification method. FHLB stock is carried at cost, and included in other assets.
Declines in the fair value of securities below their amortized cost that are other than temporary are reflected in earnings or other comprehensive income, as appropriate. For those debt securities whose fair value is less than their amortized cost basis, we consider our intent to sell the securities, whether it is more likely than not that we will be required to sell the securities before recovery, and whether or not we expect to recover our entire amortized cost basis in the investment. In making this assessment, considerations will include whether the issue is a government or government sponsored security, and whether or not rating downgrades have occurred.
| F-FIN9 |
Table of Contents
Loans Receivable
Loans receivable that management of Sterling has the intent and ability to -hold for the foreseeable future or until maturity or pay-off are reported at their outstanding principal balance net of unamortized origination and commitment fees, direct loan origination costs and an allowance for losses.
Interest income is recognized over the term of loans based on their unpaid principal balance. The accrual of interest on nonperforming loans is discontinued when, in management’s opinion, a borrower may be unable to make payments as they become due, which generally occurs when a loan is 90 days past due. When interest accrual is discontinued, all unpaid accrued interest is reversed. The interest payments received on these loans is accounted for on the cash basis or cost recovery method, until qualifying for a return to an accrual status. Loans return to an accrual status when all principal and interest is brought current, and future payments are reasonably assured.
A troubled debt restructuring occurs when, due to a borrower’s financial difficulties, Sterling grants a concession that it would not otherwise consider. The concession can take the form of an interest rate or principal reduction or an extension of payments of principal or interest, or both. Restructured loans performing in accordance with their new terms are not included in non-accrual loans unless there is uncertainty as to the ultimate collection of principal or interest.
Allowance for Credit Losses
The allowance for credit losses is composed of the allowance for loan losses and the reserve for unfunded credit commitments. In general, determining the amount of the allowance requires significant judgment and the use of estimates by management. Sterling maintains an allowance for credit losses to absorb probable losses in the loan portfolio based on a quarterly analysis of the portfolio and expected future losses. This analysis is designed to determine an appropriate level and allocation of the allowance for losses among loan types by considering factors affecting loan losses, including specific and confirmed losses, levels and trends in classified and nonperforming loans, historical loan loss experience, loan migration analysis, current national and local economic conditions, volume, growth and composition of the portfolio, regulatory guidance and other relevant factors. Management monitors the loan portfolio to evaluate the adequacy of the allowance. The allowance can increase or decrease each quarter based upon the results of management’s analysis.
The portfolio is grouped into standard industry categories for homogeneous loans based on characteristics such as loan type, borrower and collateral. Annual and quarterly loan migration to loss data is used to determine the probability of default. Historically, Sterling had used both one-year and three-year loss history to establish the expected loss rate on loans. Due to the higher loss rates experienced during 2009, Sterling began during the fourth quarter of 2009 using losses from the most recent twelve months to estimate the amount that would be lost if a default were to occur, which is termed the loss given default. The probability of default is multiplied by the loss given default to calculate the expected losses for each loan category.
Individual loan reviews are based upon specific quantitative and qualitative criteria, including the size of the loan, loan quality ratings, value of collateral, repayment ability of borrowers, and historical experience factors. The historical experience factors utilized and allowances for homogeneous loans (such as residential mortgage loans, consumer loans, etc.) are collectively evaluated based upon historical loss experience, loan migration analysis, trends in losses and delinquencies, growth of loans in particular markets, and known changes in economic conditions in each particular lending market.
A loan is considered impaired when, based on current information and events, it is probable we will be unable to collect the scheduled payments of principal and interest when due according to the contractual terms of the loan agreement. Factors considered by management in determining impairment include payment status, collateral value and the probability of collecting scheduled principal and interest payments when due. Loans that experience insignificant payment delays and payment shortfalls generally are not classified as impaired. Management determines the significance
| F-FIN10 |
Table of Contents
of payment delays and payment shortfalls on a case-by-case basis, taking into consideration all of the circumstances surrounding the loan and the borrower, including the length of delay, the reasons for the delay, the borrower’s prior payment record and the amount of the shortfall in relation to the principal and interest owed. Impairment is measured on a loan-by-loan basis by either the present value of expected future cash flows discounted at the loan’s effective interest rate, the loan’s obtainable market price or the fair value of collateral if the loan is collateral dependent.
The fair value of the underlying collateral for real estate loans, which may or may not be collateral dependent, is determined by using appraisals from qualified external sources. For commercial properties and residential development loans, the external appraisals are reviewed by qualified internal appraisal staff to ensure compliance with appropriate standards and technical accuracy. Updated appraisals are ordered in accordance with regulatory provisions for extensions or restructurings of commercial or residential real estate construction and permanent loans that have not performed within the terms of the original loan. Updated appraisals are also ordered for loans that have not been restructured, but that have stale valuation information, generally defined in the current market as information older than six months, and deteriorating credit quality that warrants classification as substandard.
The timing of obtaining appraisals may vary, depending on the nature and complexity of the property being evaluated and the general breadth of appraisal activity in the marketplace, but generally it is within 30 to 90 days of recognition of substandard status, following determination of collateral dependency, or in connection with a loan’s maturity or a negotiation that may result in the restructuring or extension of a real estate secured loan. Delays in timing may occur to comply with actions such as a bankruptcy filing or provisions of an SBA guarantee.
Estimates of fair value may be used for substandard collateral dependent loans at quarter end if external appraisals are not expected to be completed in time for determining quarter end results or to update values between appraisal dates that reflect updated values based on recent sales activity of comparable inventory or pending property sales of the subject collateral. As a result of the large decline in real estate values during 2009, Sterling began during the fourth quarter of 2009 to record a specific reserve for impaired loans for which an updated valuation analysis has not been completed within the last quarter. The specific reserve is calculated by applying an estimated fair value adjustment to each loan based on market and property type. Estimates of value are not used to raise a value; however, estimates may be used to recognize deterioration of market values in quarters between appraisal updates. The judgment with respect to recognition of any provision or related charge-off for a confirmed loss also takes into consideration whether the loan is collateral dependent or whether it is supported by sources of repayment or cash flow beyond the collateral that is being valued. For loans that are deemed to be collateral dependent, the amount of charge-offs is determined in relation to the collateral’s appraised value. For loans that are not deemed to be collateral dependent, the amount of charge-offs may differ from the collateral’s appraised value because there is additional support for the loan, such as cash flow from other sources.
Sterling maintains a reserve for probable losses on unfunded loan commitments. The reserve is established based upon current economic conditions, one year historical losses and expected disbursement levels.
While management uses available information to provide for loan losses, the ultimate collectability of a substantial portion of the loan portfolio and the need for future additions to the allowance will be influenced by changes in economic conditions and other relevant factors. The current slowdown in economic activity and further declines in real estate values could continue to adversely affect cash flows for both commercial and individual borrowers, and as a result Sterling could experience further increases in nonperforming assets, delinquencies and losses on loans. There can be no assurance that the allowance for credit losses will be adequate to cover all losses.
Loans Held for Sale
Any loan that management determines will not be held to maturity is classified as held for sale. The majority of loans held for sale are carried at fair
| F-FIN11 |
Table of Contents
value in order to match changes in the value of the loans with the value of the economic hedges on the loans without having to apply complex hedge accounting. The fair value of loans held for sale is determined based upon an analysis of investor quoted pricing inputs. A small portion of Sterling’s held for sale portfolio is reported at the lower of amortized cost or market value, as the fair value of certain loan types cannot be efficiently estimated.
Loan Origination and Commitment Fees
Loan origination fees, net of direct origination costs, are deferred and recognized as interest income using the effective yield method. If the related loan is sold, the remaining net amount, which is part of the basis of the loan, is considered in determining the gain or loss on sale.
Loan commitment fees are deferred until the expiration of the commitment period unless management believes there is a remote likelihood that the underlying commitment will be exercised, in which case the fees are amortized to fee income using the straight-line method over the commitment period. If a loan commitment is exercised, the deferred commitment fee is accounted for in the same manner as a loan origination fee. Deferred commitment fees associated with expired commitments are recognized as fee income.
Office Properties and Equipment
Office properties and equipment are carried at cost less accumulated depreciation and amortization. Depreciation and amortization are computed using the straight-line method over the lesser of the estimated useful lives or the related lease terms of the assets. Expenditures for new properties and equipment and major renewals or betterments are capitalized. Expenditures for repairs and maintenance are charged to expense as incurred. Upon sale or retirement, the cost and related accumulated depreciation are removed from the respective property or equipment accounts, and the resulting gains or losses are reflected in operations.
Other Real Estate Owned
Assets acquired through or in lieu of foreclosure are initially recorded at fair value, net of selling costs, which becomes the new cost basis for the asset. Subsequent to taking possession, other real estate owned is carried at the lower of cost or fair value less estimated selling costs. Development and improvement costs relating to the property are capitalized to the extent they are deemed to be recoverable. The carrying value of the property is periodically evaluated by management and, if necessary, allowances are established to reduce the carrying value to net realizable value.
Goodwill and Other Intangible Assets
Goodwill represents the difference between the value of consideration paid and the fair value of the net assets received in a business combination. Sterling records impairment losses as charges to noninterest expense and adjustments to the carrying value of goodwill. Goodwill is tested for impairment on an annual basis, or more frequently as events occur, or as current circumstances and conditions warrant. The analysis compares the fair value of each of the reporting units, including goodwill, to the respective carrying amounts. If the carrying amount of the reporting unit, including goodwill, exceeds the fair value of that reporting unit, then further testing for goodwill impairment is performed. During the year ended December 31, 2009, goodwill was determined to be fully impaired, and as such, had a zero carrying value at the balance sheet date. Other intangible assets are comprised of core deposit intangibles, and are amortized over the estimated useful life of the deposit relationship, which is generally 8 to 10 years. Other intangible assets are periodically assessed for impairment when certain triggering events occur that indicate the possibility of impairment. Recent triggering events that resulted in the goodwill impairment charges, did not indicate an impairment in regards to these core deposit intangibles. See Note 7.
Mortgage Banking Operations
Sterling, mainly through Golf Savings Bank, originates and sells loans. Sterling recognizes a gain or loss on these loan sale transactions, which include a component reflecting the differential between the contractual interest rate of the loan and the interest rate to be received by the investor. The present value of the estimated future profit for servicing the loans, together with the normal
| F-FIN12 |
Table of Contents
servicing fee rate and changes in the fair value of any derivatives, is also taken into account in determining the amount of gain or loss on the sale of loans. The fair value of mortgage servicing rights is recorded as an asset, with their value estimated using a discounted cash flow methodology to arrive at the present value of future expected earnings from the servicing of the loans. Model inputs include prepayment speeds, market interest rates, contractual interest rates on the loans being serviced, and the amount of other fee income generated over the servicing contract. Mortgage servicing rights are amortized in proportion to, and over the estimated period of the servicing revenues, with impairment recognized to the extent the carrying value exceeds subsequent fair value estimates.
Transfers of Financial Assets
Sterling’s sales of commercial loan participations and residential real estate loans are considered transfers of financial assets. These transfers are accounted for as sales when control over the asset has been surrendered, which is deemed to have occurred when: an asset does not have any claims to it by the transferor or their creditors, including in bankruptcy or other receivership situations; the transferee obtains the unconditional right to pledge or exchange the asset; or the transfer does not include a repurchase provision. Commercial loan participations during 2009, 2008 and 2007 were immaterial for Sterling, while cash received from the sale of residential real estate loans from mortgage banking operations totaled $2.71 billion, $1.11 billion and $1.26 billion for 2009, 2008 and 2007, respectively.
Income Taxes
Sterling accounts for income taxes using the liability method, which requires that deferred tax assets and liabilities be determined based on the temporary differences between the financial statement carrying amounts and the tax basis of assets and liabilities, and the tax attributes using enacted tax rates in effect in the years in which the temporary differences are expected to reverse. During 2009, Sterling determined that the negative evidence associated with the three year cumulative loss for the period ending December 31, 2009, the recent SSB Consent Agreement entered into with its regulators, and continued credit deterioration in its loan portfolio outweighed the positive evidence in regards to whether or not Sterling would be able to generate taxable income in the near term, and a valuation allowance was established against its deferred tax asset, with the allowance totaling $269.0 million as of December 31, 2009.
Earnings (Loss) Per Share
Earnings (loss) per share—basic is computed by dividing net income or loss available to common shareholders by the weighted average number of shares outstanding during the period. Earnings (loss) per share—diluted is computed by dividing net income or loss available to common shareholders by the weighted average number of shares outstanding, increased by the additional shares that would have been outstanding if all potentially dilutive and contingently issuable shares had been issued. The Codification requires a two-class method of computing earnings per share for entities that have participating securities such as Sterling’s unvested restricted shares. Application of the two-class method resulted in the material equivalent earnings per share as the treasury method.
Stock-Based Compensation
Stock options issued as compensation are recorded as an expense at their estimated grant date fair value. The Black-Scholes option pricing model is used to estimate the fair value of stock options granted, while the value of restricted stock awards are recorded using the grant date market closing price of Sterling’s common stock. See Note 13 for further discussion, including Black-Scholes model input assumptions.
Comprehensive Income (Loss)
Comprehensive income (loss) consists of net income (loss) and other comprehensive income (loss). Other comprehensive income (loss) is comprised of unrealized gains and losses on available for sale securities, and is a separate component of shareholders’ equity. Sterling reports and displays comprehensive income and its components (revenues, expenses, gains and losses) in a full set
| F-FIN13 |
Table of Contents
of general-purpose financial statements. Reclassification adjustments, representing the net (gains) losses on available-for-sale securities that were realized during the period, net of related deferred income taxes, were as follows:
| Amount | ||||
| (Dollars in thousands) |
||||
| Year ended December 31, 2009 |
$ | 8,484 | ||
| Year ended December 31, 2008 |
0 | |||
| Year ended December 31, 2007 |
(3 | ) | ||
These (gains) losses had previously been included in other comprehensive income as unrealized (gains) losses on investments and MBS available for sale.
Hedging Activities
As part of its mortgage banking activities, Sterling issues interest rate lock commitments to prospective borrowers on residential mortgage loan applications. Pricing for the sale of these loans is fixed with various qualified investors under both non-binding (“best-efforts”) and binding (“mandatory”) delivery programs. For mandatory delivery programs, Sterling hedges interest rate risk by entering into offsetting forward sale agreements on MBS with third parties. Risks inherent in mandatory delivery programs include the risk that if Sterling does not close the loans subject to interest rate lock commitments, it is nevertheless obligated to deliver MBS to the counterparty under the forward sale agreement. Sterling could incur significant costs in acquiring replacement loans or MBS and such costs could have a material adverse effect on mortgage banking operations in future periods.
Interest rate lock commitments and loan delivery commitments are off balance sheet commitments that are considered to be derivatives. As of December 31, 2009, Sterling had $110.0 million of interest rate lock commitments, $119.7 million of warehouse loans held for sale that were not committed to investors, and held offsetting forward sale agreements on MBS valued at $234.0 million. In addition, Sterling had mandatory delivery commitments to sell mortgage loans to investors valued at $29.5 million as of December 31, 2009. As of December 31, 2008, Sterling had $75.4 million of interest rate lock commitments, $71.8 million of warehouse loans held for sale that were not committed to investors, and held offsetting forward sale agreements on MBS valued at $114.4 million. In addition, Sterling had mandatory delivery commitments to sell mortgage loans to investors valued at $1.4 million as of December 31, 2008. As of December 31, 2009 and December 31, 2008, Sterling had entered into best efforts forward commitments to sell $51.6 million and $71.0 million of mortgage loans, respectively.
Sterling enters into interest rate swap derivative contracts with customers. The interest rate risk on these contracts is managed by entering into offsetting interest rate swap agreements with various counterparties (“broker-dealers” or “dealers”). The counterparty agreements include certain representations, warranties and covenants, which include terms that allow for an early termination in the event of default. Failure to maintain a well capitalized position is one event that may be considered a default, and counterparties to the derivative instruments could require an early termination settlement or an increase in the collateralization on derivative instruments in net liability positions. The aggregate fair value of all derivative instruments with credit risk related contingent features that are in a liability position on December 31, 2009 was $4.3 million for which Sterling has posted collateral with a market value of $6.1 million in the normal course of business. Both customer and dealer related interest rate derivatives are carried at fair value by Sterling.
Reclassifications
Certain amounts in prior period financial statements have been reclassified to conform to the current year’s presentation. These reclassifications had no effect on retained earnings or net income as previously reported. During 2009, gains and losses from OREO operations were reclassified from noninterest income to noninterest expense.
Recent Accounting Pronouncements
In June 2009, the Financial Accounting Standards Board (“FASB”) issued FAS 168, “The FASB Accounting Standards Codification and the Hierarchy of Generally Accepted Accounting Principles—replacement of FAS 162” (the “Codification”). The Codification supersedes all existing accounting and reporting standards other than the rules of the Securities and Exchange Commission (the “SEC”).
| F-FIN14 |
Table of Contents
Updates to the Codification are being issued as Accounting Standards Updates, which will also provide background information about the guidance, and provide the basis for conclusions on changes in the Codification. The Codification became effective for Sterling for the interim period ending September 30, 2009, and did not have a material impact on its consolidated financial statements.
In December 2007, the FASB revised the standard on business combinations, establishing principles and requirements for how the acquirer: 1) recognizes and measures in its financial statements the identifiable assets acquired, the liabilities assumed, and any non-controlling interest in the acquiree; 2) recognizes and measures the goodwill acquired in the business combination or a gain from a bargain purchase; 3) determines what information to disclose to enable users of the financial statements to evaluate the nature and financial effects of the business combination. Depending on the level of future acquisitions, this accounting standard may have a material effect on Sterling, mainly in regards to the valuation of loans, and the treatment for acquisition costs.
In February 2008, the FASB issued a staff position on transfers of financial assets and repurchase financing transactions. For linked transactions, a transferor and transferee shall not separately account for a transfer of a financial asset and a related repurchase financing unless (a) the two transactions have a valid and distinct business or economic purpose for being entered into separately and (b) the repurchase financing does not result in the initial transferor regaining control over the financial asset. This guidance was effective for Sterling as of January 1, 2009, and did not have a material impact on its consolidated financial statements.
In March 2008, the FASB issued a standard on disclosure requirements for derivative instruments and hedging activities. This section of the Codification requires enhanced disclosures about how and why an entity uses derivative instruments, how derivative instruments and related hedged items are accounted for, and how derivative instruments and related hedged items affect an entity’s financial position, financial performance, and cash flows. This guidance was effective for Sterling as of January 1, 2009, and did not have a material effect on its consolidated financial statements.
In June 2008, the FASB issued a staff position on determining whether instruments granted in share-based payment transactions are participating securities. The guidance clarifies that all outstanding unvested share-based payment awards that contain non-forfeitable rights to dividends are participating securities and are required to be included in computing basic and diluted earnings per share under the two-class method. This guidance was effective for Sterling as of January 1, 2009, and did not have a material impact on its consolidated financial statements.
In April 2009, the FASB issued staff positions on the recognition and presentation of Other-Than-Temporary Impairment (“OTTI”), determining fair value when the volume and level of activity for the asset or liability have significantly decreased and identifying transactions that are not orderly, and interim disclosures about fair value of financial instruments. For debt securities, the guidance differentiates credit driven and market driven OTTI. Only the portion of the impairment loss representing credit losses would be recognized in earnings as an OTTI. The balance of the impairment loss would be recognized as a charge to other comprehensive income. A non-credit related OTTI charge to other comprehensive income for securities classified as held to maturity will be amortized from accumulated other comprehensive income back to the security over the securities remaining life. Financial statement presentation will require segregation of accumulated comprehensive income for non-credit OTTI charges on held to maturity and available for sale securities from other components of accumulated comprehensive income. Additional guidance was included for the determination of whether a market for an asset is not active and when a price for a transaction is not distressed. Previously required annual disclosures have been extended to interim periods. This guidance was effective for Sterling as of June 30, 2009. See Notes 2 and 13.
In May 2009, the FASB issued guidance on subsequent events that standardizes accounting for and disclosures of events that occur after the balance sheet date but before financial statements are issued or are available to be issued. In February 2010, the FASB amended its guidance on subsequent events. As a SEC filer, Sterling is required to evaluate subsequent events through the date its financial statements are issued. These initial rules
| F-FIN15 |
Table of Contents
became effective for Sterling during its interim period ending after June 15, 2009, and revisions incorporated into this filing, and did not have a material impact on its consolidated financial statements.
In June 2009, the FASB issued standards on accounting for transfers of financial assets, removing the concept of qualifying special-purpose entities as an accounting criteria that had provided an exception to consolidation, and provided additional guidance on requirements for consolidation. This guidance is effective for Sterling on January 1, 2010, and is not expected to have a material impact on its consolidated financial statements.
In August 2009, the FASB issued an update to the codification that provided additional guidance on the measurement of liabilities at fair value. This guidance was effective for Sterling as of September 30, 2009, and did not have a material impact on its consolidated financial statements.
| F-FIN16 |
Table of Contents
2. INVESTMENTS AND MBS:
The carrying and fair values of investments and MBS are summarized as follows:
| Amortized Cost |
Gross Unrealized Gains |
Gross Unrealized Losses |
Fair Value | ||||||||||
| (Dollars in thousands) | |||||||||||||
| December 31, 2009 |
|||||||||||||
| Available for sale |
|||||||||||||
| MBS |
$ | 1,912,736 | $ | 44,579 | $ | (12,326 | ) | $ | 1,944,989 | ||||
| Municipal bonds |
195,807 | 3,500 | (4,025 | ) | 195,282 | ||||||||
| Other |
25,979 | 0 | (5,925 | ) | 20,054 | ||||||||
| Total |
$ | 2,134,522 | $ | 48,079 | $ | (22,276 | ) | $ | 2,160,325 | ||||
| Held to maturity |
|||||||||||||
| Tax credits |
$ | 17,646 | $ | 0 | $ | 0 | $ | 17,646 | |||||
| Total |
$ | 17,646 | $ | 0 | $ | 0 | $ | 17,646 | |||||
| December 31, 2008 |
|||||||||||||
| Available for sale |
|||||||||||||
| MBS |
$ | 2,441,908 | $ | 27,659 | $ | (49,555 | ) | $ | 2,420,012 | ||||
| Municipal bonds |
100,878 | 7,751 | (2,723 | ) | 105,906 | ||||||||
| Short term commercial paper |
99,117 | 0 | 0 | 99,117 | |||||||||
| Other |
25,920 | 0 | (11,665 | ) | 14,255 | ||||||||
| Total |
$ | 2,667,823 | $ | 35,410 | $ | (63,943 | ) | $ | 2,639,290 | ||||
| Held to maturity |
|||||||||||||
| Municipal bonds |
$ | 154,967 | $ | 1,117 | $ | (5,541 | ) | $ | 150,543 | ||||
| Tax credits |
20,863 | 0 | 0 | 20,863 | |||||||||
| Total |
$ | 175,830 | $ | 1,117 | $ | (5,541 | ) | $ | 171,406 | ||||
Tax credit investments are in low income housing partnerships. Other available for sale securities were primarily comprised of a trust preferred security at both December 31, 2009 and 2008. At December 31, 2009 and 2008, accrued interest on investments and MBS was $9.9 million and $14.4 million, respectively. During the fourth quarter of 2009, Sterling reclassified its held to maturity municipal bond portfolio to available for sale. The portfolio’s amortized book value of $149.5 million had unrealized gains of $2.2 million and unrealized losses of $2.3 million at the time of transfer. The reclassification reflected a change in Sterling’s intended holding period due to capital, liquidity and risk management objectives, the geographic distribution of the municipalities as compared to Sterling’s footprint, as well as a decrease in the relative attractiveness of these securities when being assessed on a pre-tax basis.
During the years ended December 31, 2009, 2008 and 2007, Sterling sold available-for-sale investments and MBS which resulted in the following (in thousands):
| Proceeds from Sales |
Gross Realized Gains |
Gross Realized Losses | |||||||
| (Dollars in thousands) | |||||||||
| Year ended December 31, 2009 |
$ | 671,480 | $ | 24,729 | $ | 11,262 | |||
| Year ended December 31, 2008 |
0 | 0 | 0 | ||||||
| Year ended December 31, 2007 |
7,208 | 6 | 2 | ||||||
| F-FIN17 |
Table of Contents
During the fourth quarter of 2009, Sterling sold three private label collateralized mortgage obligations at a loss of $8.2 million. The decision to sell these securities was based upon credit quality deterioration during the fourth quarter. The change in credit quality was reflected in stress testing completed by Sterling, as well as downgrades by rating agencies. The following table summarizes Sterling’s investments and MBS that had a market value below their amortized cost basis as of December 31, 2009 and 2008, grouped by the amount of time these securities have been in this unrealized loss position:
| Less than 12 months | 12 months or longer | Total | |||||||||||||||||||
| Market Value |
Unrealized Losses |
Market Value |
Unrealized Losses |
Market Value |
Unrealized Losses |
||||||||||||||||
| (Dollars in thousands) | |||||||||||||||||||||
| December 31, 2009 |
|||||||||||||||||||||
| Municipal bonds |
$ | 13,758 | $ | (317 | ) | $ | 45,729 | $ | (3,708 | ) | $ | 59,487 | $ | (4,025 | ) | ||||||
| MBS |
190,004 | (4,039 | ) | 115,266 | (8,287 | ) | 305,270 | (12,326 | ) | ||||||||||||
| Other |
0 | 0 | 18,791 | (5,925 | ) | 18,791 | (5,925 | ) | |||||||||||||
| Total |
$ | 203,762 | $ | (4,356 | ) | $ | 179,786 | $ | (17,920 | ) | $ | 383,548 | $ | (22,276 | ) | ||||||
| December 31, 2008 |
|||||||||||||||||||||
| Municipal bonds |
$ | 37,682 | $ | (2,003 | ) | $ | 66,223 | $ | (6,261 | ) | $ | 103,905 | $ | (8,264 | ) | ||||||
| MBS |
243,401 | (4,905 | ) | 499,950 | (44,650 | ) | 743,351 | (49,555 | ) | ||||||||||||
| Short term commercial paper |
99,117 | 0 | 0 | 0 | 99,117 | 0 | |||||||||||||||
| Other |
1 | (3 | ) | 12,948 | (11,662 | ) | 12,949 | (11,665 | ) | ||||||||||||
| Total |
$ | 380,201 | $ | (6,911 | ) | $ | 579,121 | $ | (62,573 | ) | $ | 959,322 | $ | (69,484 | ) | ||||||
At December 31, 2009, the amortized cost and fair value of available-for-sale and held-to-maturity debt securities, by contractual maturity (in thousands), are shown below. Expected or actual maturities may differ from contractual maturities because issuers may have the right to call or prepay obligations with or without call or prepayment penalties.
| Held-to-maturity | Available-for-sale | |||||||||||
| Amortized Cost | Fair Value | Amortized Cost | Fair Value | |||||||||
| (Dollars in thousands) | ||||||||||||
| Due within one year |
$ | 750 | $ | 750 | $ | 377 | $ | 378 | ||||
| Due after one year through five years |
0 | 0 | 1,131 | 1,154 | ||||||||
| Due after five years through ten years |
0 | 0 | 119,433 | 120,590 | ||||||||
| Due after ten years |
16,896 | 16,896 | 2,013,581 | 2,038,203 | ||||||||
| Total |
$ | 17,646 | $ | 17,646 | $ | 2,134,522 | $ | 2,160,325 | ||||
Management evaluates investment securities for other than temporary declines in fair value on a quarterly basis. If the fair value of investment securities falls below their amortized cost and the decline is deemed to be other than temporary, the securities will be written down to current market value, resulting in a loss. There were no investment securities that management identified to be other than-temporarily impaired for the year ended December 31, 2009, because the decline in fair value of certain classes of securities was attributable to temporary disruptions of credit markets and the related impact on securities within those classes, not deteriorating credit quality of specific securities. Sterling holds positions in classes of securities negatively impacted by temporary credit market disruptions, including a single-issuer trust preferred security, and private label collateralized mortgage obligations. As of December 31, 2009, the trust preferred security is rated A1 by Moody’s and
| F-FIN18 |
Table of Contents
has an amortized cost of $24.7 million compared to an $18.8 million market value, or an unrealized loss of $5.9 million. As of December 31, 2009, the private label collateralized mortgage obligations had an aggregate amortized cost of $163.3 million compared to a $155.2 million market value, or an unrealized loss of $8.1 million. All are stress-tested monthly for both credit quality and collateral strength, and are investment grade according to at least one rating agency. Subsequent to December 31, 2009, S&P downgraded one of these securities below investment grade, while Moody’s maintained its investment grade rating on the same security. At December 31, 2009, this security had an amortized cost of $17.4 million and a market value of $15.3 million. The vintage, or years of issuance, for these nonagency MBS ranges from 2003 to 2005. As of December 31, 2009, Sterling expects the return of all principal and interest on all securities within the portfolios pursuant to the contractual terms, has the ability and intent to hold these investments, has no intent to sell securities that are deemed to have a market value impairment, nor does Sterling believe it is more likely than not that it would be required to sell these investments before a recovery in market price occurs, or until maturity. Realized losses could occur in future periods due to a change in management’s intent to hold the investments to recovery, a change in management’s assessment of credit risk, or a change in regulatory or accounting requirements.
At December 31, 2009 and 2008, U.S. government and agency obligations and MBS with an aggregate fair value of $93.9 million and $274.3 million, respectively, were pledged as collateral for the treasury tax and loan account in accordance with Federal Reserve Board regulations or for wholesale public funds deposits in accordance with Washington, Oregon, California, and Montana state laws and regulations. Additionally, Sterling periodically utilizes MBS as collateral for reverse repurchase agreements and other borrowing transactions. See Note 10.
3. LOANS RECEIVABLE:
The components of loans receivable are as follows:
| December 31, | ||||||||
| 2009 | 2008 | |||||||
| (Dollars in thousands) | ||||||||
| Residential real estate |
$ | 839,170 | $ | 867,384 | ||||
| Multifamily real estate |
517,408 | 477,615 | ||||||
| Commercial real estate |
1,403,560 | 1,364,885 | ||||||
| Construction: |
||||||||
| Residential |
720,964 | 1,455,860 | ||||||
| Multifamily |
233,501 | 324,818 | ||||||
| Commercial |
561,643 | 754,017 | ||||||
| Total construction |
1,516,108 | 2,534,695 | ||||||
| Consumer—direct |
792,957 | 859,222 | ||||||
| Consumer—indirect |
323,565 | 389,298 | ||||||
| Commercial banking |
2,301,944 | 2,532,158 | ||||||
| Total loans receivable |
7,694,712 | 9,025,257 | ||||||
| Deferred loan fees, net |
(7,070 | ) | (9,798 | ) | ||||
| Gross loans receivable |
7,687,642 | 9,015,459 | ||||||
| Allowance for losses on loans |
(343,443 | ) | (208,365 | ) | ||||
| Net loans receivable |
$ | 7,344,199 | $ | 8,807,094 | ||||
| F-FIN19 |
Table of Contents
At December 31, 2009, construction and commercial real estate loans accounted for 20% and 18% respectively of Sterling’s loan portfolio, or a combined 38% of the portfolio, compared with December 31, 2008, when construction and commercial real estate loans accounted for 28% and 15%, respectively of Sterling’s loan portfolio, or a combined 43% of the portfolio. Net accrued interest on loans receivable was approximately $33.9 million and $42.9 million at December 31, 2009 and 2008, respectively. The majority of Sterling’s loans have been made throughout the western United States, with concentrations in Seattle, Washington and Portland, Oregon. The value of real estate properties in the western United States has been affected by the crisis in the housing market and recent recessionary economic conditions, as it has in other parts of the country. Gross loans pledged as collateral with the FHLB and the Federal Reserve as part of their lending arrangements with Sterling totaled $4.41 billion and $5.14 billion as of December 31, 2009 and 2008, respectively.
The following table sets forth the scheduled contractual principal repayments for Sterling’s loan portfolio at December 31, 2009. Demand loans, loans having no stated repayment schedule and no stated maturity, and overdrafts are reported as due in one year or less. Loan balances do not include undisbursed loan proceeds, deferred loan origination costs and fees, or allowances for credit losses.
| Balance Outstanding at December 31, 2009 |
Principal
Payments Contractually Due in Fiscal Years | |||||||||||||||||||||||
| 2010 | 2011-2014 | Thereafter | ||||||||||||||||||||||
| (Dollars in thousands) | ||||||||||||||||||||||||
| fixed | variable | fixed | variable | fixed | variable | fixed | variable | |||||||||||||||||
| Mortgage |
$ | 990,193 | $ | 1,769,945 | $ | 84,465 | $ | 368,298 | $ | 308,570 | $ | 674,252 | $ | 597,158 | $ | 727,395 | ||||||||
| Construction: |
||||||||||||||||||||||||
| Residential |
32,322 | 688,642 | 22,591 | 481,317 | 8,924 | 190,136 | 807 | 17,189 | ||||||||||||||||
| Multifamily |
19,465 | 214,036 | 15,095 | 165,980 | 4,370 | 48,056 | 0 | 0 | ||||||||||||||||
| Commercial |
40,096 | 521,547 | 28,301 | 368,124 | 11,664 | 151,723 | 131 | 1,700 | ||||||||||||||||
| Total Construction |
91,883 | 1,424,225 | 65,987 | 1,015,421 | 24,958 | 389,915 | 938 | 18,889 | ||||||||||||||||
| Consumer—direct |
444,374 | 348,583 | 33,200 | 13,501 | 115,519 | 20,599 | 295,655 | 314,483 | ||||||||||||||||
| Consumer—indirect |
323,565 | 0 | 78,870 | 0 | 230,547 | 0 | 14,148 | 0 | ||||||||||||||||
| Commercial banking |
654,368 | 1,647,576 | 218,429 | 691,477 | 268,349 | 545,583 | 167,590 | 410,516 | ||||||||||||||||
| $ | 2,504,383 | $ | 5,190,329 | $ | 480,951 | $ | 2,088,697 | $ | 947,943 | $ | 1,630,349 | $ | 1,075,489 | $ | 1,471,283 | |||||||||
Sterling originates both variable and fixed-rate loans. The variable-rate loans have interest rate adjustment limitations and are typically indexed to the prime rate, one-year or five-year Treasury Department index, or periodic fixed-rate LIBOR swap curve. Future market factors may affect the correlation between the interest rates Sterling pays on deposits and other funding sources and the rate received on these loans.
| F-FIN20 |
Table of Contents
4. ALLOWANCES FOR CREDIT LOSSES AND OREO:
The following is an analysis of the changes in the allowances for credit losses:
| Years Ended December 31, | ||||||||||||
| 2009 | 2008 | 2007 | ||||||||||
| (Dollar in thousands) | ||||||||||||
| Allowance for credit losses |
||||||||||||
| Allowance—loans, January 1 |
$ | 208,365 | $ | 111,026 | $ | 77,849 | ||||||
| Allowance for losses on loans acquired |
0 | 0 | 15,294 | |||||||||
| Provision |
690,738 | 318,585 | 24,632 | |||||||||
| Charge-offs |
(566,664 | ) | (223,324 | ) | (7,682 | ) | ||||||
| Recoveries |
11,004 | 2,078 | 933 | |||||||||
| Allowance—loans, December 31 |
343,443 | 208,365 | 111,026 | |||||||||
| Allowance—unfunded commitments, January 1 |
21,334 | 6,306 | 5,840 | |||||||||
| Provision |
(9,367 | ) | 15,074 | 466 | ||||||||
| Charge-offs |
0 | (46 | ) | 0 | ||||||||
| Allowance—unfunded commitments, December 31 |
11,967 | 21,334 | 6,306 | |||||||||
| Total credit allowance |
$ | 355,410 | $ | 229,699 | $ | 117,332 | ||||||
The following is a summary of loans that are not performing in accordance with their original contractual terms (in thousands):
| December 31, | ||||||
| 2009 | 2008 | |||||
| (Dollar in thousands) | ||||||
| Non-accrual loans |
$ | 824,652 | $ | 474,172 | ||
| Restructured loans |
71,279 | 56,618 | ||||
| Total nonperforming loans |
$ | 895,931 | $ | 530,790 | ||
Sterling considers its nonperforming loans to be impaired loans. Sterling did not have any loans that were 90 days past due and still accruing interest, as of both December 31, 2009 and 2008. Weakness in the overall economy has contributed to increased levels of nonperforming loans. Recent increases in nonperforming loans have been driven by increases in nonperforming commercial construction, commercial real estate, and commercial banking loans. During 2009, commercial construction had the largest increase in nonperforming loans, which was due to slower lease-up rates, which cause delays in the stabilization of the property and the borrower’s ability to obtain permanent financing. Cumulatively, Sterling has written down its nonperforming loans by $500.2 million as of December 31, 2009, compared with write-downs of $163.9 million as of December 31, 2008. In addition, Sterling had $27.1 million specific reserve on its nonperforming loans as of December 31, 2009, compared with $2.0 million as of December 31, 2008.
Interest income of $5.1 million, $1.3 million and $1.5 million, was recorded during the years ended December 31, 2009, 2008 and 2007, respectively, in connection with such loans. For loans on non-accrual status at year end, additional gross interest income of $45.9 million, $24.1 million and $4.5 million, would have been recorded during the years ended December 31, 2009, 2008 and 2007, respectively, if non-accrual and restructured loans had been current in accordance with their original contractual terms. The average balance of nonperforming loans during the years ended December 31, 2009, 2008 and 2007 was $688.3 million, $305.6 million and $38.8 million, respectively.
A troubled debt restructuring occurs when, due to a borrower’s financial difficulties, Sterling grants a concession that it would not otherwise consider. The concession can take the form of an interest rate or principal reduction or an extension of payments of principal or interest, or both. Restructured loans performing in accordance with their new terms are not included in non-accrual loans unless there is uncertainty as to the ultimate collection of principal or interest.
| F-FIN21 |
Table of Contents
OREO is recorded at fair value, less estimated selling expenses, at foreclosure. The carrying value of OREO is regularly evaluated and, if necessary, an allowance is established to reduce the carrying value to net realizable value. Changes in the carrying value of OREO and related allowance are as follows for the periods presented:
| Years Ended December 31, | ||||||||||||
| 2009 | 2008 | 2007 | ||||||||||
| (Dollars in thousands) | ||||||||||||
| OREO, January 1 |
$ | 62,320 | $ | 11,075 | $ | 4,052 | ||||||
| Loan foreclosures and other additions |
201,005 | 124,610 | 11,418 | |||||||||
| Loss at foreclosure |
(44,556 | ) | (43,710 | ) | (3,166 | ) | ||||||
| Improvements and other changes |
1,654 | (1,819 | ) | 119 | ||||||||
| Sales |
(106,130 | ) | (10,208 | ) | (1,348 | ) | ||||||
| Provisions for losses |
(31,021 | ) | (17,628 | ) | 0 | |||||||
| OREO, December 31 |
$ | 83,272 | $ | 62,320 | $ | 11,075 | ||||||
| Allowance, January 1 |
$ | 17,555 | $ | 0 | $ | 0 | ||||||
| Provision |
31,021 | 17,628 | 0 | |||||||||
| Charge-offs |
(40,372 | ) | (73 | ) | 0 | |||||||
| Allowance, December 31 |
$ | 8,204 | $ | 17,555 | $ | 0 | ||||||
5. LOAN SERVICING:
Loans serviced for others are not included in the consolidated balance sheets. The unpaid principal balances of these loans as of the dates indicated are summarized as follows:
| December 31, | |||||||||
| 2009 | 2008 | 2007 | |||||||
| (Dollars in thousands) | |||||||||
| Residential |
$ | 1,090,197 | $ | 501,570 | $ | 598,462 | |||
| Commercial real estate |
1,598,227 | 1,680,445 | 1,683,029 | ||||||
| Commercial banking |
105,747 | 99,533 | 117,678 | ||||||
| Consumer |
0 | 0 | 9 | ||||||
| Total |
$ | 2,794,171 | $ | 2,281,548 | $ | 2,399,178 | |||
| F-FIN22 |
Table of Contents
The following is an analysis of the changes in mortgage servicing rights and related allowance:
| Years Ended December 31, | ||||||||||||
| 2009 | 2008 | 2007 | ||||||||||
| (Dollars in thousands) | ||||||||||||
| Mortgage servicing rights, January 1 |
$ | 5,706 | $ | 9,042 | $ | 7,335 | ||||||
| Originated servicing |
8,860 | 163 | 1,912 | |||||||||
| Amortization |
(2,370 | ) | (2,015 | ) | (2,057 | ) | ||||||
| Acquired |
0 | 0 | 2,464 | |||||||||
| Adjustment to fair value |
(134 | ) | (1,484 | ) | (612 | ) | ||||||
| Mortgage servicing rights, December 31 |
$ | 12,062 | $ | 5,706 | $ | 9,042 | ||||||
| Allowance, January 1 |
$ | 2,096 | $ | 612 | $ | 0 | ||||||
| Additions |
1,228 | 2,192 | 612 | |||||||||
| Recoveries |
(1,093 | ) | (708 | ) | 0 | |||||||
| Writedowns |
0 | 0 | 0 | |||||||||
| Allowance, December 31 |
$ | 2,231 | $ | 2,096 | $ | 612 | ||||||
Sterling has sold participations in certain commercial real estate loans to investors on a servicing retained basis. During the years ended December 31, 2009, 2008 and 2007, Sterling sold approximately $20.9 million, $15.8 million and $56.0 million in commercial real estate loans under participation agreements, resulting in net gains of $1.6 million, $24,000 and $3.0 million, respectively. Sterling also sells residential loans into the secondary market, with 74% on a servicing released basis during 2009, and nearly all of which were on a servicing released basis during 2008 and 2007. During the years ended December 31, 2009, 2008 and 2007, Sterling sold approximately $2.80 billion, $1.32 billion and $1.29 billion in residential real estate loans, resulting in net gains of $49.5 million, $20.2 million and $18.0 million, respectively.
6. OFFICE PROPERTIES AND EQUIPMENT:
The components of office properties and equipment are as follows:
| December 31, | Estimated Useful Life | |||||||||
| 2009 | 2008 | |||||||||
| (Dollars in thousands) | ||||||||||
| Buildings and improvements |
$ | 57,096 | $ | 56,507 | 20-40 years | |||||
| Furniture, fixtures, equipment and computer software |
81,371 | 82,254 | 3-10 years | |||||||
| Leasehold improvements |
19,207 | 18,116 | 5-20 years | |||||||
| Automobiles |
116 | 116 | 3-5 years | |||||||
| 157,790 | 156,993 | |||||||||
| Less accumulated depreciation and amortization |
(77,432 | ) | (75,477 | ) | ||||||
| 80,358 | 81,516 | |||||||||
| Land |
11,679 | 11,679 | ||||||||
| Total office properties and equipment |
$ | 92,037 | $ | 93,195 | ||||||
| F-FIN23 |
Table of Contents
7. GOODWILL AND OTHER INTANGIBLE ASSETS:
The changes in the carrying value of goodwill for the years ended December 31, 2009 and 2008 are as follows (in thousands):
| Total | Community Banking |
Residential Mortgage Banking |
||||||||||
| (Dollars in thousands) | ||||||||||||
| Balance as of January 1, 2008 |
$ | 453,136 | $ | 422,066 | $ | 31,070 | ||||||
| Adjustments |
(1,813 | ) | (1,813 | ) | 0 | |||||||
| Impairments |
(223,765 | ) | (192,695 | ) | (31,070 | ) | ||||||
| Balance at December 31, 2008 |
227,558 | 227,558 | 0 | |||||||||
| Adjustments |
0 | 0 | 0 | |||||||||
| Impairments |
(227,558 | ) | (227,558 | ) | 0 | |||||||
| Balance as of December 31, 2009 |
$ | 0 | $ | 0 | $ | 0 | ||||||
During the fourth quarter of 2008, due to reduced expectations for near term profitability, and the protracted decline in Sterling’s stock price and market capitalization, Sterling determined that impairment had occurred, and at that time wrote off $223.8 million of its goodwill. On October 9, 2009, Sterling Savings Bank entered into the SSB Consent Agreement with the FDIC and the WDFI. Sterling considered the SSB Consent Agreement to be a triggering event that required Sterling to test its goodwill for impairment as of September 30, 2009.
In order to determine the fair value of its Community Banking segment, Sterling employed three valuation approaches: the Control Premium approach, the Comparable Transactions approach and the Discounted Cash Flow approach. The Control Premium approach used Sterling’s trading multiples of price-to-earnings, price-to-book value and price-to-tangible book value to estimate the Community Banking segment’s value as if it were publicly traded, with the Community Banking segment’s public equivalent value then adjusted upwards for an appropriate premium to reflect an acquisition of control. The Comparable Transactions approach reflected pricing ratios paid by third parties acquiring control of banking companies with similar characteristics in recent periods, and these multiples were used to develop a range of fair values for acquiring control of the Bank. The Discounted Cash Flow approach determined fair value based on the present value of assumed dividends over a five year period, assuming the Community Banking segment were to remain independent, plus the present value of a terminal value determined based on assumed acquisition pricing for the Community Banking segment at the end of the fifth year. Due to the inability to project future earnings with reasonable certainty, no value was assigned to the Discounted Cash Flow approach. The values derived from the Control Premium approach and the Comparable Transaction approach were considered within the hierarchy prescribed by fair value accounting standards to determine the fair value of the reporting unit. The comparison of the fair value of the reporting unit to its carrying value indicated that potential impairment existed. This was a result of the SSB Consent Agreement, uncertain near term earnings prospects, and the recent decline in Sterling’s stock price and market capitalization. Sterling then performed the second step of goodwill impairment testing to determine how much, if any, impairment existed. In Step 2, Sterling assigned a fair value to all of the assets and liabilities of the reporting unit as if it had been acquired in a business combination. The Step 2 analysis indicated that the implied fair value of the goodwill was less than the carrying value of goodwill. As a result of this analysis, Sterling recorded a goodwill impairment charge of $227.6 million, reducing the balance of goodwill to zero, as compared to the December 31, 2008 balance of $227.6 million.
| F-FIN24 |
Table of Contents
The carrying value of core deposit intangibles at December 31, 2009 and 2008 are as follows:
| December 31, | ||||||||
| 2009 | 2008 | |||||||
| (Dollars in thousands) | ||||||||
| Gross carrying value |
$ | 43,446 | $ | 43,446 | ||||
| Accumulated amortization |
(21,619 | ) | (16,721 | ) | ||||
| Net carrying value |
$ | 21,827 | $ | 26,725 | ||||
The values of the core deposit intangibles are amortized over the estimated useful life of the deposit relationship, which is generally 8 to 10 years. Core deposit intangible amortization expense was $4.9 million for both 2009 and 2008, and for 2007 was $4.7 million. The triggering events described above relating to the goodwill impairment charges were also triggering events for impairment evaluation of these other intangible assets. The analysis did not indicate impairment in regard to these core deposit intangibles.
Core deposit intangible amortization expense over the next five years is projected as follows:
| Year Ending December 31, |
Amount | ||
| (Dollars in thousands) | |||
| 2010 |
$ | 4,897 | |
| 2011 |
4,787 | ||
| 2012 |
4,777 | ||
| 2013 |
4,777 | ||
| 2014 |
2,589 | ||
8. DEPOSITS:
The following table sets forth the composition of Sterling’s deposits at the dates indicated:
| December 31, 2009 | December 31, 2008 | |||||||||||
| Amount | % | Amount | % | |||||||||
| (Dollars in thousands) | ||||||||||||
| Interest-bearing transaction |
$ | 1,014,032 | 13.0 | $ | 449,060 | 5.4 | ||||||
| Noninterest-bearing transaction |
1,001,771 | 12.9 | 897,198 | 10.7 | ||||||||
| Savings and MMDA |
1,577,900 | 20.3 | 2,113,425 | 25.3 | ||||||||
| Time deposits—brokered |
1,079,997 | 13.9 | 1,480,569 | 17.7 | ||||||||
| Time deposits—retail |
3,101,490 | 39.9 | 3,410,155 | 40.9 | ||||||||
| Total deposits |
$ | 7,775,190 | 100.0 | $ | 8,350,407 | 100.0 | ||||||
| Annualized cost of deposits |
2.04 | % | 2.91 | % | ||||||||
During 2009, there was a shift of uninsured savings and money market account balances to FDIC insured interest bearing transaction accounts. This was related to changes in the collateralization requirements associated with uninsured public funds deposits and Sterling’s participation in the FDIC voluntary expanded insurance program, which provides, without charge to depositors, full guarantee on noninterest bearing and certain interest-bearing transaction accounts held by any depositor, regardless of dollar amount. Total deposits declined since December 31, 2008, mostly as a result of a reduction in brokered deposits by $400.6 million. As a result of the SSB Consent Agreement, Sterling Savings Bank is currently precluded from accepting additional brokered deposits, or renewing existing brokered deposits. Of the $1.08 billion balance of brokered deposits held as of December 31, 2009, $842.4 million mature in less than one year. Regular payments on loans and MBS, as well as increases in retail deposits and sales of MBS and other investment securities currently provide Sterling with sufficient liquidity to meet its payment obligations on brokered deposits as they mature.
| F-FIN25 |
Table of Contents
At December 31, 2009, the scheduled maturities of time deposit accounts are as follows:
| Amount | Weighted Average Interest Rate |
|||||
| (Dollars in thousands) | ||||||
| Due within 1 year |
$ | 2,731,121 | 2.27 | % | ||
| Due in 1 to 2 years |
933,133 | 2.12 | ||||
| Due in 2 to 3 years |
199,799 | 3.92 | ||||
| Due in 3 to 4 years |
168,138 | 3.96 | ||||
| Due in 4 to 5 years |
98,825 | 3.38 | ||||
| Due after 5 years |
50,471 | 4.24 | ||||
| $ | 4,181,487 | 2.43 | % | |||
At December 31, 2009 and 2008, the remaining maturities of time deposit accounts with a minimum balance of $100,000 were as follows:
| December 31, | ||||||
| 2009 | 2008 | |||||
| (Dollars in thousands) | ||||||
| Three months or less |
$ | 374,185 | $ | 535,399 | ||
| After three months through six months |
198,309 | 297,665 | ||||
| After six months through twelve months |
417,420 | 648,334 | ||||
| After twelve months |
600,190 | 253,489 | ||||
| $ | 1,590,104 | $ | 1,734,887 | |||
The components of interest expense associated with deposits are as follows:
| Years Ended December 31, | |||||||||
| 2009 | 2008 | 2007 | |||||||
| (Dollars in thousands) | |||||||||
| Transaction accounts |
$ | 2,534 | $ | 1,346 | $ | 2,543 | |||
| Savings and MMDA |
15,941 | 46,254 | 71,665 | ||||||
| Time deposits |
150,786 | 186,737 | 203,406 | ||||||
| $ | 169,261 | $ | 234,337 | $ | 277,614 | ||||
| F-FIN26 |
Table of Contents
9. ADVANCES FROM FEDERAL HOME LOAN BANK:
Sterling Savings Bank and Golf Savings Bank have credit lines with FHLB of Seattle that allow them to borrow funds up to a percentage of each of their total assets, subject to collateralization requirements. Certain loans and securities are used as collateral for these borrowings. At December 31, 2009 and 2008, these credit lines represented a total borrowing capacity of $2.43 billion and $2.92 billion, of which $967.5 million and $1.33 billion was available, respectively. In the first quarter of 2010, Sterling Savings Bank started transitioning from a blanket pledge collateral agreement with the FHLB of Seattle to a custodial agreement. Additionally, Sterling’s future borrowings from the FHLB of Seattle are limited to overnight cash management advances (“CMA”), which automatically rollover each day. Sterling Savings Bank has the ability to increase or decrease the CMA borrowings on a daily basis. The advances from FHLB at December 31, 2009 and 2008 are repayable as follows:
| December 31, 2009 | December 31, 2008 | |||||||||||
| Amount | Weighted Average Interest Rate |
Amount | Weighted Average Interest Rate |
|||||||||
| (Dollars in thousands) | ||||||||||||
| Due within 1 year |
$ | 635,182 | 1.57 | % | $ | 548,819 | 3.74 | % | ||||
| Due in 1 to 2 years |
66,398 | 3.85 | 490,435 | 2.28 | ||||||||
| Due in 2 to 3 years |
480,000 | 1.53 | 66,459 | 3.85 | ||||||||
| Due in 3 to 4 years |
119,368 | 3.29 | 470,000 | 2.82 | ||||||||
| Due in 4 to 5 years |
5,000 | 3.12 | 119,462 | 3.37 | ||||||||
| Due after 5 years |
31,219 | 4.40 | 31,374 | 4.42 | ||||||||
| $ | 1,337,167 | 1.89 | % | $ | 1,726,549 | 3.07 | % | |||||
Included in the balance of FHLB borrowings at both December 31, 2009 and 2008 were advances from the FHLB of San Francisco of $100.2 million and $133.2 million, respectively. These were assumed in the 2008 Northern Empire acquisition. Sterling does not anticipate additional new advances from this source.
Only member institutions have access to funds from the Federal Home Loan Banks. As a condition of membership, Sterling is required to hold FHLB stock. As of December 31, 2009 and 2008, Sterling held $100.7 million and $99.7 million, respectively, of FHLB stock which is recorded as a component of other assets. Both the FHLB of Seattle and the FHLB of San Francisco announced that they would no longer pay dividends or redeem or repurchase capital stock. Each FHLB continues to monitor its capital and other relevant financial measures as a basis for determining a resumption of dividends and capital stock repurchases at some later date.
10. SECURITIES SOLD SUBJECT TO REPURCHASE AGREEMENTS AND FUNDS PURCHASED:
Sterling sells securities under agreements to repurchase the same or similar securities (“reverse repurchase agreements”). Fixed-coupon reverse repurchase agreements are treated as financings, and the obligations to repurchase securities sold are reflected as a liability on the consolidated balance sheet. The dollar amount of securities underlying the agreements remains in the applicable asset accounts. The MBS underlying these agreements are held by Sterling, but the title has been transferred to the counter parties to the agreements. The risk of default under such agreements is limited by the financial strength of these broker/dealers and the level of borrowings relative to the market value of pledged securities. Sterling may be required to repay these borrowings prior to maturity, with penalties, if an event of default has been deemed to have occurred, which may be deemed to have occurred as a result of the SSB Consent Agreement. As of December 31, 2009, Sterling has been categorized as “undercapitalized,” which may trigger an event of default under certain of these borrowings. At
| F-FIN27 |
Table of Contents
December 31, 2009 and 2008, under the reverse repurchase agreements, Sterling has pledged as collateral $1.31 billion and $1.23 billion, respectively, of investments and MBS. The average balances of reverse repurchase agreements were $1.04 billion and $1.13 billion during the years ended December 31, 2009 and 2008, respectively. The maximum amount outstanding at any month end during these same periods was $1.06 billion and $1.16 billion, respectively. Sterling also had funds purchased from the Federal Reserve discount window, which totaled $16.7 million at December 31, 2009, and $69.0 million at December 31, 2008.
At December 31, 2009 and 2008, borrowings under reverse repurchase agreements and funds purchased are contractually repayable as follows. Actual repayments may vary due to default and call provisions:
| December 31, 2009 | December 31, 2008 | |||||||||||
| Amount | Weighted Average Interest Rate |
Amount | Weighted Average Interest Rate |
|||||||||
| (Dollars in thousands) | ||||||||||||
| Due within 1 yr |
$ | 49,146 | 0.50 | % | $ | 163,023 | 1.38 | % | ||||
| Due within 2 yrs |
0 | 0.00 | 0 | 0.00 | ||||||||
| Due within 3 yrs |
150,000 | 4.19 | 0 | 0.00 | ||||||||
| Due within 4 yrs |
100,000 | 3.00 | 150,000 | 4.19 | ||||||||
| Due within 5 yrs |
0 | 0.00 | 100,000 | 3.00 | ||||||||
| Thereafter |
750,000 | 3.86 | 750,000 | 3.88 | ||||||||
| $ | 1,049,146 | 3.72 | % | $ | 1,163,023 | 3.50 | % | |||||
11. OTHER BORROWINGS:
The components of other borrowings are as follows:
| December 31, | ||||||
| 2009 | 2008 | |||||
| (Dollars in thousands) | ||||||
| Junior Subordinated Debentures |
$ | 245,281 | $ | 245,276 | ||
| Other |
3,000 | 3,000 | ||||
| Total other borrowings |
$ | 248,281 | $ | 248,276 | ||
Sterling has raised capital through the formation of trust subsidiaries (“Capital Trusts”), which issue capital securities (“Trust Preferred Securities”) to investors. The Capital Trusts are business trusts in which Sterling owns all of the common equity. The proceeds from the sale of the Trust Preferred Securities are used to purchase junior subordinated deferrable interest debentures (“Junior Subordinated Debentures”) issued by Sterling. Sterling’s obligations under the Junior Subordinated Debentures and related documents, taken together, constitute a full and unconditional guarantee by Sterling of the Capital Trusts’ obligations under the Trust Preferred Securities. The Trust Preferred Securities are treated as debt of Sterling. The Junior Subordinated Debentures and related Trust Preferred Securities generally mature 30 years after issuance and are redeemable at the option of Sterling under certain conditions, including, with respect to certain of the Trust Preferred Securities, payment of call premiums. During the third quarter of 2009, Sterling elected to defer regularly scheduled interest payments on these securities. Sterling is allowed to defer payments of interest on the junior subordinated notes for up to 20 consecutive quarterly periods without triggering an event of default.
| F-FIN28 |
Table of Contents
Details of the Trust Preferred Securities are as follows:
| Subsidiary Issuer |
Issue Date | Maturity Date |
Call Date | Rate at December 31, 2009 |
Amount (in Thousands) | |||||||||
| Sterling Capital Trust IX |
July 2007 | Oct 2037 | N/A | Floating | 1.68 | % | $ | 46,392 | ||||||
| Sterling Capital Trust VIII |
Sept 2006 | Sept 2036 | N/A | Floating | 1.88 | 51,547 | ||||||||
| Sterling Capital Trust VII |
June 2006 | June 2036 | N/A | Floating | 1.78 | 56,702 | ||||||||
| Lynnwood Capital Trust II |
June 2005 | June 2035 | June 2010 | Floating | 2.05 | 10,310 | ||||||||
| Sterling Capital Trust VI |
June 2003 | Sept 2033 | Sept 2008 | Floating | 3.45 | 10,310 | ||||||||
| Sterling Capital Statutory Trust V |
May 2003 | May 2033 | June 2008 | Floating | 3.50 | 20,619 | ||||||||
| Sterling Capital Trust IV |
May 2003 | May 2033 | May 2008 | Floating | 3.42 | 10,310 | ||||||||
| Sterling Capital Trust III |
April 2003 | April 2033 | April 2008 | Floating | 3.53 | 14,433 | ||||||||
| Lynnwood Capital Trust I |
Mar 2003 | Mar 2033 | Mar 2007 | Floating | 3.40 | 9,460 | ||||||||
| Klamath First Capital Trust I |
July 2001 | July 2031 | June 2006 | Floating | 4.68 | 15,198 | ||||||||
| 2.43 | %* | $ | 245,281 | |||||||||||
| * | Weighted average rate |
In February 2010, Sterling commenced cash offers to redeem its trust preferred borrowings at $0.20 of par. Consummation of the repurchase is conditioned upon Sterling receiving net proceeds from an equity offering, sale of assets or other transaction sufficient to repurchase the Trust Preferred Securities, as well as the approval, to the extent required, by Sterling’s banking regulators. Sterling’s offer to redeem the Trust Preferred Securities expires on March 23, 2010 for $120 million of par amount, and on March 31, 2010 for $118 million of par amount, with both dates being extendable. There can be no assurance that the repurchase will be completed.
12. INCOME TAXES:
The components of income tax expense (benefit) included in the consolidated statements of income were as follows:
| Years Ended December 31, | ||||||||||||
| 2009 | 2008 | 2007 | ||||||||||
| (Dollars in thousands) | ||||||||||||
| Current income taxes: |
||||||||||||
| Federal |
$ | (50,958 | ) | $ | (13,378 | ) | $ | 51,395 | ||||
| State |
(308 | ) | (3,260 | ) | 2,382 | |||||||
| Total current income taxes |
(51,266 | ) | (16,638 | ) | 53,777 | |||||||
| Deferred income taxes: |
||||||||||||
| Federal |
74,002 | (53,666 | ) | (8,033 | ) | |||||||
| State |
4,246 | (5,594 | ) | (820 | ) | |||||||
| Total deferred income taxes |
78,248 | (59,260 | ) | (8,853 | ) | |||||||
| Total income tax expense |
$ | 26,982 | $ | (75,898 | ) | $ | 44,924 | |||||
| F-FIN29 |
Table of Contents
The tax effects of the principal temporary differences giving rise to deferred tax assets and liabilities were as follows:
| December 31, | ||||||||||||
| 2009 | 2008 | |||||||||||
| Assets | Liabilities | Assets | Liabilities | |||||||||
| (Dollars in thousands) | ||||||||||||
| Allowance for losses on loans |
$ | 135,097 | $ | 0 | $ | 91,196 | $ | 0 | ||||
| Net operating loss carryforward |
135,956 | 0 | 3,185 | 0 | ||||||||
| Deferred compensation |
11,281 | 0 | 10,739 | 0 | ||||||||
| Purchase accounting discounts |
8,831 | 0 | 11,575 | 0 | ||||||||
| Nonaccrual loans |
2,799 | 0 | 2,452 | 0 | ||||||||
| FHLB Seattle dividends |
0 | 16,665 | 0 | 16,665 | ||||||||
| Unrealized losses on available-for-sale securities |
0 | 9,564 | 10,690 | 0 | ||||||||
| Deferred loan fees |
0 | 6,766 | 0 | 6,453 | ||||||||
| Mortgage servicing rights |
0 | 3,923 | 0 | 1,525 | ||||||||
| Purchase accounting premiums |
0 | 2,797 | 0 | 20,171 | ||||||||
| Fair value |
0 | 1,064 | 0 | 1,235 | ||||||||
| Prepaid expenses |
0 | 763 | 0 | 1,113 | ||||||||
| Office properties and equipment |
0 | 548 | 504 | 0 | ||||||||
| Other |
8,729 | 0 | 6,927 | 0 | ||||||||
| $ | 302,693 | $ | 42,090 | $ | 137,268 | $ | 47,162 | |||||
Sterling uses an estimate of future earnings, and an evaluation of its loss carryback ability and tax planning strategies to determine whether or not the benefit of its net deferred tax asset will be realized. At December 31, 2009, Sterling assessed whether it was more likely than not that it would realize the benefits of its deferred tax asset. Sterling determined that the negative evidence associated with a projected three year cumulative loss, the recent SSB Consent Agreement entered into with its regulators, and continued credit deterioration in its loan portfolio outweighed the positive evidence. Therefore, Sterling established a valuation allowance of $269.0 million against its deferred tax asset. A rollforward of the allowance is as follows:
| 2009 | ||||
| (Dollars in thousands) | ||||
| Balance, January 1 |
$ | 0 | ||
| Reserve |
(269,000 | ) | ||
| Recoveries |
0 | |||
| Balance, December 31 |
$ | (269,000 | ) | |
| F-FIN30 |
Table of Contents
The following table summarizes the calculation of Sterling’s effective tax rates for the periods presented:
| Years Ended December 31, | |||||||||||||||||||||
| 2009 | 2008 | 2007 | |||||||||||||||||||
| Amount | % | Amount | % | Amount | % | ||||||||||||||||
| (Dollars in thousands) | |||||||||||||||||||||
| Income tax provision at the federal statutory rate |
$ | (283,889 | ) | 35.0 | % | $ | (144,001 | ) | 35.0 | % | $ | 48,374 | 35.0 | % | |||||||
| Tax effect of: |
|||||||||||||||||||||
| Deferred tax valuation allowance |
269,000 | (33.2 | ) | 0 | 0.0 | 0 | 0.0 | ||||||||||||||
| Goodwill impairment |
64,219 | (7.9 | ) | 78,318 | (19.0 | ) | 0 | 0.0 | |||||||||||||
| State taxes, net of federal benefit |
(16,383 | ) | 2.0 | (5,755 | ) | 1.4 | 1,210 | 0.9 | |||||||||||||
| Tax-exempt interest |
(3,026 | ) | 0.4 | (1,832 | ) | 0.4 | (1,539 | ) | (1.1 | ) | |||||||||||
| Bank owned life insurance |
(2,434 | ) | 0.3 | (2,298 | ) | 0.6 | (2,203 | ) | (1.6 | ) | |||||||||||
| Tax credits |
(2,221 | ) | 0.3 | (1,912 | ) | 0.4 | (1,388 | ) | (1.0 | ) | |||||||||||
| Other, net |
1,716 | (0.2 | ) | 1,582 | (0.4 | ) | 470 | 0.3 | |||||||||||||
| $ | 26,982 | -3.3 | % | $ | (75,898 | ) | 18.4 | % | $ | 44,924 | 32.5 | % | |||||||||
The following is a reconciliation of the beginning and ending amount of unrecognized tax benefits for the periods presented:
| 2009 | 2008 | 2007 | ||||||||||
| (Dollars in thousands) | ||||||||||||
| Balance at January 1 |
$ | 4,622 | $ | 1,786 | $ | 1,553 | ||||||
| Additions—current year tax positions |
5,227 | 3,529 | 193 | |||||||||
| Additions—prior year tax positions |
41 | 517 | 455 | |||||||||
| Reductions—statue of limitations |
(3,225 | ) | (1,210 | ) | (415 | ) | ||||||
| Balance at December 31 |
$ | 6,665 | $ | 4,622 | $ | 1,786 | ||||||
Included in income tax expense for the years ended December 31, 2009 and 2008 were potential penalties and interest associated with potential estimate variances in the amount of $114,000 and $308,000 respectively. At December 31, 2009 and 2008, the accrued balance for these potential penalties and interest totaled $507,000 and $393,000, respectively. Sterling’s tax positions for the years 2006 through 2009 remain subject to review by the Internal Revenue Service. Sterling’s uncertain tax position at December 31, 2009 includes $5.1 million of temporary differences, an undetermined portion of which is expected to reverse within the next twelve months. As of December 31, 2009 and December 31, 2008, $1.5 million and $1.4 million of the uncertain tax positions represented permanent differences.
| F-FIN31 |
Table of Contents
13. STOCK BASED COMPENSATION:
Stock option transactions are summarized as follows:
| 2009 | 2008 | 2007 | ||||||||||||||||
| Number | Weighted Average Exercise Price |
Number | Weighted Average Exercise Price |
Number | Weighted Average Exercise Price | |||||||||||||
| Balance, January 1 |
1,977,968 | $ | 22.41 | 2,067,401 | $ | 21.13 | 1,485,661 | $ | 19.72 | |||||||||
| Granted |
183,500 | 1.85 | 255,000 | 17.69 | 340,000 | 32.37 | ||||||||||||
| Exercised |
0 | 0.00 | (237,078 | ) | 5.86 | (319,849 | ) | 11.42 | ||||||||||
| Acquisitions |
0 | 0.00 | 0 | 0.00 | 573,212 | 12.67 | ||||||||||||
| Cancelled/expired |
(268,586 | ) | 18.00 | (107,355 | ) | 22.78 | (11,623 | ) | 18.74 | |||||||||
| Balance, December 31 |
1,892,882 | $ | 21.04 | 1,977,968 | $ | 22.41 | 2,067,401 | $ | 21.13 | |||||||||
| Exercisable |
1,397,632 | $ | 22.78 | 1,498,468 | $ | 21.60 | 1,728,401 | $ | 18.93 | |||||||||
At December 31, 2009, the weighted average remaining contractual life and the aggregate intrinsic value of stock options outstanding was 2.9 years and $0, respectively, and of stock options exercisable was 2.4 years and $0, respectively, and at December 31, 2008, were 4.3 years and $0, respectively, and 4.0 years and $0, respectively. As of December 31, 2009, a total of 1,574,035 shares remained available for grant under Sterling’s 2001, 2003 and 2007 Long-Term Incentive Plans. The stock options granted under these plans have terms of four, six, eight or ten years. The stock options and restricted shares granted during 2009 have vesting schedules ranging from two to four years. During the years ended December 31, 2009, 2008 and 2007, the intrinsic value of options exercised was $0, $2.5 million and $6.2 million, respectively, and fair value of options granted was $193,000, $1.1 million, and $3.4 million, respectively. The Black-Scholes option-pricing model was used in estimating the fair value of option grants. The weighted average assumptions used were:
| Years Ended December 31, | ||||||
| 2009 | 2008 | 2007 | ||||
| Expected volatility |
72% | 30% – 56% | 26% – 29% | |||
| Expected lives (in years) |
4.4 | 4.3 | 4.7 – 6.0 | |||
| Expected dividend yield |
0.00% | 0% – 3.32% | 0.90% – 1.47% | |||
| Risk free interest rates |
2.07% | 2.84% – 3.11% | 4.65% – 4.80% | |||
Cancellations and forfeitures are not model inputs, but do affect the amount of expense that is recognized. During 2009, a total of 465,086 stock options and shares of restricted stock were forfeited. Forfeitures during 2009 were mostly as a result of departures by members of executive management.
| F-FIN32 |
Table of Contents
The following table summarizes information about Sterling’s plans at December 31, 2009:
| Range of Exercise Prices |
Options Outstanding | Options Exercisable | ||||||||||
| Number Outstanding |
Weighted Average Remaining Contractual Life |
Weighted Average Exercise Price |
Number Exercisable |
Weighted Average Exercise Price | ||||||||
| $ 1.85 - $ 4.00 |
178,500 | 5.2 years | $ | 1.85 | 0 | $ | 0 | |||||
| $ 4.00 - $ 8.01 |
45,450 | 0.5 years | 6.02 | 45,450 | 6.02 | |||||||
| $ 8.01 - $ 12.02 |
147,719 | 0.9 years | 9.33 | 146,969 | 9.34 | |||||||
| $ 12.02 - $ 16.03 |
12,785 | 4.9 years | 14.57 | 10,535 | 15.11 | |||||||
| $ 16.03 - $ 20.04 |
401,750 | 3.0 years | 18.42 | 230,000 | 18.89 | |||||||
| $ 20.04 - $ 24.01 |
170,012 | 4.1 years | 22.73 | 170,012 | 22.73 | |||||||
| $ 24.01 - $ 28.02 |
634,200 | 2.1 years | 26.06 | 619,200 | 26.10 | |||||||
| $ 28.02 - $ 33.17 |
302,466 | 3.8 years | 32.64 | 175,466 | 32.26 | |||||||
| 1,892,882 | 1,397,632 | |||||||||||
The following is a summary of restricted stock activity for the periods presented:
| 2009 | 2008 | 2007 | |||||||||||||||
| Number | Weighted Average Price |
Number | Weighted Average Price |
Number | Weighted Average Price | ||||||||||||
| Balance, January 1 |
284,750 | $ | 20.17 | 85,000 | $ | 33.17 | 0 | $ | 0.00 | ||||||||
| Granted |
260,000 | 1.85 | 222,000 | 16.42 | 85,000 | 33.17 | |||||||||||
| Vested |
(86,500 | ) | 19.81 | (21,250 | ) | 33.17 | 0 | 0.00 | |||||||||
| Cancelled |
(196,500 | ) | 10.42 | (1,000 | ) | 17.79 | 0 | 0.00 | |||||||||
| Outstanding, December 31 |
261,750 | $ | 9.40 | 284,750 | $ | 20.17 | 85,000 | 33.17 | |||||||||
Stock based compensation expense recognized during the periods presented was as follows:
| Years Ended | |||||||||
| 2009 | 2008 | 2007 | |||||||
| (Dollars in thousands) | |||||||||
| Stock based compensation expense: |
|||||||||
| Stock options |
$ | 1,001 | $ | 1,088 | $ | 763 | |||
| Restricted stock |
1,136 | 1,443 | 646 | ||||||
| Total |
$ | 2,137 | $ | 2,531 | $ | 1,409 | |||
As of December 31, 2009, unrecognized equity compensation expense totaled $3.1 million, as the underlying outstanding awards had not yet been earned. This amount will be recognized over a weighted average period of 1.84 years.
| F-FIN33 |
Table of Contents
14. SHAREHOLDERS’ EQUITY:
On December 5, 2008, Sterling completed the sale of 303,000 shares of preferred stock and issued a warrant to purchase 6,437,677 shares of Sterling’s common stock to the U.S. Department of the Treasury, raising total proceeds of $303 million. The preferred stock bears a coupon of 5% for five years, and 9% thereafter. The warrant has a ten-year life and an exercise price of $7.06 per share. The initial value allocated to the preferred stock was $292 million, with the remaining $11 million attributed to the warrant. The allocation was based on the relative fair value for the preferred stock and the warrant, respectively, to the total fair value of the combined preferred stock and warrant. The fair value of the preferred stock was estimated using a discounted cash flow methodology at an assumed market equivalent rate of 12%, with 20 quarterly payments over a five-year period. The fair value of the warrant was estimated using the Black-Scholes option pricing model, with assumptions of 50% volatility, a risk-free rate of 2.68%, a yield of 6.53% and an estimated life of 10 years. The value attributed to the warrant is being accreted as a discount on the preferred stock using the effective interest method over five years. During the third quarter 2009, Sterling elected to defer the payment of dividends on this cumulative preferred stock. Under the terms of the preferred stock, failure to pay dividends for six dividend periods, whether or not consecutive, would cause the authorized number of directors constituting Sterling’s board of directors to be automatically increased by two, and the holders of the preferred stock, together with the holders of any outstanding parity stock with like voting rights, would be entitled to elect the two additional members of Sterling’s board of directors.
The board of directors of Sterling from time to time evaluates the payment of cash dividends. The timing and amount of any future dividends will depend upon earnings, cash and capital requirements, the financial condition of Sterling and its subsidiaries, applicable government regulations and other factors deemed relevant by Sterling’s board of directors. Pursuant to the SSB Order, Sterling is not to pay cash dividends or make any other payments or distributions representing a reduction of Sterling Savings Bank capital without the prior written consent from its regulators. Pursuant to the terms of Sterling’s participation in the CPP program of the Treasury Department, Sterling is prohibited from increasing the dividends to be paid to shareholders above the $0.10 per share quarterly dividend paid for the quarter ended September 30, 2008. This restriction on Sterling’s ability to pay dividends will continue until either Sterling redeems all of the preferred shares sold to the Treasury Department, or December 2011, whichever is earliest.
As demonstrated by the December 2008 issuance, the Sterling board of directors has the authority to issue preferred stock of Sterling in one or more series and to fix the rights, privileges, preferences and restrictions granted to or imposed upon any unissued shares of preferred stock, without further vote or action by the common shareholders.
| F-FIN34 |
Table of Contents
15. EARNINGS (LOSS) PER SHARE:
The following table presents a reconciliation of the numerators and denominators used in the basic and diluted earnings (loss) per share computations, which includes the number of antidilutive securities that were not included in the dilutive earnings per share computations. These antidilutive securities occur when options outstanding held an option price greater than the average market price for the period.
| For the Year Ended December 31, 2009 | ||||||||||
| Net Income (Loss) Available to Common Shareholders |
Weighted Average Shares |
Per Share Amount |
||||||||
| (Dollars in thousands, except per share amounts) | ||||||||||
| Earnings (loss) per common share—basic |
$ | (855,463 | ) | 51,922,275 | $ | (16.48 | ) | |||
| Effect of dilutive securities: |
||||||||||
| Common stock options and restricted shares |
0 | 0 | 0.00 | |||||||
| Common stock warrants |
0 | 0 | 0.00 | |||||||
| Earnings (loss) per common share—diluted |
$ | (855,463 | ) | 51,922,275 | $ | (16.48 | ) | |||
| Antidilutive options not included in diluted earnings per share: |
||||||||||
| Common stock options |
1,990,135 | |||||||||
| Common stock warrant |
6,437,677 | |||||||||
| Restricted shares |
196,150 | |||||||||
| Total antidilutive |
8,623,962 | |||||||||
| For the Year Ended December 31, 2008 | ||||||||||
| Net Income (Loss) Available to Common Shareholders |
Weighted Average Shares |
Per Share Amount |
||||||||
| Earnings (loss) per common share—basic |
$ | (336,742 | ) | 51,721,671 | $ | (6.51 | ) | |||
| Effect of dilutive securities: |
||||||||||
| Common stock options and restricted shares |
0 | 0 | 0.00 | |||||||
| Common stock warrants |
0 | 0 | 0.00 | |||||||
| Earnings (loss) per common share—diluted |
$ | (336,742 | ) | 51,721,671 | $ | (6.51 | ) | |||
| Antidilutive options not included in diluted earnings per share: |
||||||||||
| Common stock options |
1,762,551 | |||||||||
| Common stock warrant |
156,729 | |||||||||
| Restricted shares |
246,107 | |||||||||
| Total antidilutive |
2,165,387 | |||||||||
| For the Year Ended December 31, 2007 | |||||||||
| Net Income Available to Common Shareholders |
Weighted Average Shares |
Per Share Amount |
|||||||
| Earnings per common share—basic |
$ | 93,289 | 49,786,349 | $ | 1.87 | ||||
| Effect of dilutive securities: |
|||||||||
| Common stock options |
0 | 431,166 | (0.01 | ) | |||||
| Earnings per common share—diluted |
$ | 93,289 | 50,217,515 | $ | 1.86 | ||||
| Antidilutive options not included in diluted earnings per share: |
|||||||||
| Common stock options |
330,318 | ||||||||
| F-FIN35 |
Table of Contents
16. REGULATORY CAPITAL:
Sterling, Sterling Savings Bank and Golf Savings Bank are required by applicable regulations to maintain certain minimum capital levels. Under the guidelines, a bank is assigned to one of five capital categories depending on its total risk-based capital ratio, Tier I risk-based capital ratio, and leverage ratio, together with certain other subjective and objective factors. The categories range from “well capitalized” to “critically undercapitalized.” Institutions that are “adequately capitalized” or lower may be subject to certain mandatory or discretionary supervisory corrective actions. At December 31, 2009, Sterling was categorized as “undercapitalized.” As a result, Sterling is subject to various restrictions, including restrictions on asset growth, acquisitions, new activities and new branches. Under the SSB Consent Agreement, Sterling Savings Bank’s regulators have directed Sterling Savings Bank to increase its overall capital levels and, in particular, are requiring Sterling Savings Bank to increase its Tier 1 leverage ratio to 10.0%. Sterling’s strategy to increase its capital position may include a restructuring of its capital and liability structure, the sale of equity securities through public or private offerings, and the sale of certain assets. The following table sets forth their respective capital positions for the periods presented.
| Minimum Capital Requirements |
Well-Capitalized Requirements |
Actual | ||||||||||||||||
| Amount | Ratio | Amount | Ratio | Amount | Ratio | |||||||||||||
| (Dollars in thousands) | ||||||||||||||||||
| As of December 31, 2009: |
||||||||||||||||||
| Tier 1 leverage (to average assets) |
||||||||||||||||||
| Sterling |
$ | 457,034 | 4.0 | % | $ | 571,292 | 5.0 | % | $ | 394,836 | 3.5 | % | ||||||
| Sterling Savings Bank |
434,458 | 4.0 | 543,073 | 5.0 | 458,260 | 4.2 | ||||||||||||
| Golf Savings Bank |
22,085 | 4.0 | 27,606 | 5.0 | 61,824 | 11.2 | ||||||||||||
| Tier I (to risk-weighted assets) |
||||||||||||||||||
| Sterling |
323,678 | 4.0 | 485,517 | 6.0 | 394,836 | 4.9 | ||||||||||||
| Sterling Savings Bank |
309,546 | 4.0 | 464,319 | 6.0 | 458,260 | 5.9 | ||||||||||||
| Golf Savings Bank |
13,932 | 4.0 | 20,897 | 6.0 | 61,824 | 17.8 | ||||||||||||
| Total (to risk-weighted assets) |
||||||||||||||||||
| Sterling |
647,356 | 8.0 | 809,196 | 10.0 | 637,803 | 7.9 | ||||||||||||
| Sterling Savings Bank |
619,091 | 8.0 | 773,864 | 10.0 | 561,083 | 7.3 | ||||||||||||
| Golf Savings Bank |
27,863 | 8.0 | 34,829 | 10.0 | 66,227 | 19.0 | ||||||||||||
| As of December 31, 2008: |
||||||||||||||||||
| Tier 1 leverage (to average assets) |
||||||||||||||||||
| Sterling |
$ | 499,498 | 4.0 | % | $ | 624,375 | 5.0 | % | $ | 1,153,604 | 9.2 | % | ||||||
| Sterling Savings Bank |
488,550 | 4.0 | 610,687 | 5.0 | 1,007,643 | 8.3 | ||||||||||||
| Golf Savings Bank |
18,576 | 4.0 | 23,220 | 5.0 | 58,332 | 12.6 | ||||||||||||
| Tier I (to risk-weighted assets) |
||||||||||||||||||
| Sterling |
394,655 | 4.0 | 591,982 | 6.0 | 1,153,604 | 11.7 | ||||||||||||
| Sterling Savings Bank |
382,087 | 4.0 | 573,130 | 6.0 | 1,007,643 | 10.6 | ||||||||||||
| Golf Savings Bank |
13,086 | 4.0 | 19,629 | 6.0 | 58,332 | 17.8 | ||||||||||||
| Total (to risk-weighted assets) |
||||||||||||||||||
| Sterling |
789,309 | 8.0 | 986,637 | 10.0 | 1,281,247 | 13.0 | ||||||||||||
| Sterling Savings Bank |
764,173 | 8.0 | 955,217 | 10.0 | 1,131,320 | 11.8 | ||||||||||||
| Golf Savings Bank |
26,172 | 8.0 | 32,715 | 10.0 | 62,458 | 19.1 | ||||||||||||
| F-FIN36 |
Table of Contents
17. COMMITMENTS AND CONTINGENCIES:
Sterling is a party to financial instruments with off-balance sheet risk in the normal course of business to meet the financing needs of its customers. These financial instruments include commitments to originate and purchase loans, provide funds under existing lines of credit, and include forward loan sale agreements to mortgage brokers. Commitments, which are disbursed subject to certain limitations, extend over various periods of time, with the majority of funds being disbursed within a twelve-month period. The undisbursed balances and other commitments as of the dates indicated are summarized as follows:
| December 31, | ||||||
| 2009 | 2008 | |||||
| (Dollars in thousands) | ||||||
| Undisbursed loan funds—construction loans |
$ | 167,906 | $ | 753,817 | ||
| Undisbursed lines of credit—commercial loans |
523,681 | 679,898 | ||||
| Undisbursed lines of credit—consumer loans |
320,535 | 320,220 | ||||
| Firm commitments to purchase loans |
0 | 55,478 | ||||
| Firm commitments to sell loans |
199,823 | 157,344 | ||||
As of December 31, 2009 and 2008, the balance of the credit loss provision for these unfunded commitments totaled $12.0 million and $21.3 million, respectively. As of December 31, 2009 and 2008, Sterling had approximately $28.6 million and $51.3 million of commercial and standby letters of credit outstanding, respectively. During the years ended December 31, 2009 and 2008, Sterling collected approximately $604,000 and $391,000 in fees from these off-balance sheet arrangements.
As of December 31, 2009, Sterling had committed to invest a total of $13.7 million in limited partnerships for the development of low-income housing. As of December 31, 2009, the remaining unfunded liability of these commitments was $5.1 million. The fund invests in a series of low-income projects throughout the western United States. Sterling receives tax deductions and tax credits from these partnerships, which Sterling anticipates will yield a positive return on investment, but anticipates that the partnership interests will have no value at the end of the fifteen-year term. The partnership interests are amortized over the life of the tax credits.
Future minimum rental commitments as of December 31, 2009, under non-cancelable operating leases with initial or remaining terms of more than one year, are as follows:
| Year Ending December 31, |
Amount | ||
| (Dollars in thousands) | |||
| 2010 |
$ | 14,625 | |
| 2011 |
13,499 | ||
| 2012 |
11,094 | ||
| 2013 |
8,831 | ||
| 2014 |
7,192 | ||
| Thereafter |
27,599 | ||
| $ | 82,840 | ||
Rent expense recorded for the years ended December 31, 2009, 2008 and 2007 was $15.8 million, $15.4 million and $15.2 million, respectively.
Securities Class Action Litigation
On December 11, 2009, a putative securities class action complaint was filed in the United States District Court for the Eastern District of Washington against Sterling and certain of our current and former officers. The complaint alleges that the defendants violated sections 10(b) and 20(a) of the Securities Exchange Act of 1934 and SEC Rule 10b-5 by making false and misleading statements concerning our business and financial results. The
| F-FIN37 |
Table of Contents
complaint alleges that defendants failed to disclose the extent of Sterling’s delinquent commercial real estate, construction and land loans, properly record losses for impaired loans, properly reserve for loan losses, and properly account for our goodwill and deferred tax assets. The complaint seeks, on behalf of persons who purchased our common stock during the period from July 23, 2008 to January 13, 2009, damages of an unspecified amount and attorneys’ fees and costs. Sterling intends to vigorously defend itself against these claims. Failure by Sterling to obtain a favorable resolution of the claims set forth in the complaint could have a material adverse effect on our business, results of operations and financial condition. Currently, the amount of such material adverse effect cannot be reasonably estimated.
ERISA Class Action Litigation
On January 20 and 22, 2010, two putative class action complaints were filed in the United States District Court for the Eastern District of Washington against us and certain of our current and former officers and directors. The complaints allege that defendants violated sections 404 and 405 of the Employee Retirement Income Security Act of 1974, as amended (“ERISA”), by breaching their fiduciary duties to participants in the Sterling Savings Bank Employee Savings and Investment Plan and Trust (the “Plan”). The complaints allege that defendants breached their fiduciary duties from July 23, 2008 to the date the complaints were filed by investing Plan assets in Sterling’s securities when defendants knew or should have known that the price of Sterling’s securities was inflated because Sterling had failed to disclose the extent of Sterling’s delinquent commercial real estate, construction and land loans, properly record losses for impaired loans, properly reserve for loan losses, and properly account for our goodwill and deferred tax assets. The complaints seek damages of an unspecified amount and attorneys’ fees and costs. Sterling intends to vigorously defend itself against these claims. Failure by Sterling to obtain a favorable resolution of the claims set forth in the complaints could have a material adverse effect on our business, results of operations and financial condition. Currently, the amount of such material adverse effect cannot be reasonably estimated.
Derivative Class Action Litigation
On February 10, 2010, a shareholder derivative action was filed in the Superior Court for Spokane County, Washington, allegedly on behalf of and for the benefit of Sterling, against certain of our current and former officers and directors. The complaint alleges, among other claims, breach of fiduciary duty, waste of corporate assets, and unjust enrichment. The complaint names Sterling as a nominal defendant. The complaint seeks unspecified damages, restitution, disgorgement of profits, equitable and injunctive relief, attorneys’ fees, costs, and expenses. The complaint alleges that the individual defendants failed to prevent Sterling from issuing improper financial statements, maintain a sufficient allowance for loan and lease losses, and establish effective credit risk management and oversight mechanisms regarding Sterling’s commercial real estate, construction and land development loans, losses and reserves recorded for impaired loans, and accounting for goodwill and deferred tax assets. Because the complaint is derivative in nature, it does not seek monetary damages from Sterling. However, Sterling may be required throughout the pendency of the action to advance the legal fees and costs incurred by the individual defendants and to incur other financial obligations, which could have a material adverse effect on our business, results of operations and financial condition. Currently, the amount of such material adverse effect cannot be reasonably estimated.
18. BENEFIT PLANS:
Sterling maintains an employee savings plan under Section 401(k) of the Internal Revenue Code (the “401(k) Plan”). Substantially all employees are eligible to participate in the 401(k) Plan subject to certain requirements. Under the 401(k) Plan, employees may elect to contribute up to 10% of their salary, and Sterling will make a matching contribution equal to 35% of the employee’s contribution. All matching contributions are made exclusively in the form of Sterling common stock. Each employee may make a supplemental contribution of an additional 65% of their salary. All
| F-FIN38 |
Table of Contents
employee contributions vest immediately and, if applicable, employer contributions vest over the employee’s first three years of employment. Employees have the option of investing their contributions among selected mutual funds and Sterling common stock. During the years ended December 31, 2009, 2008 and 2007, Sterling contributed approximately $2.7 million, $2.8 million and $2.5 million, respectively, to the 401(k) Plan.
Since 1984, Sterling has maintained a nonqualified Deferred Compensation Plan. The Deferred Compensation Plan component of the overall compensation plan is intended to link compensation to the long-term performance of Sterling and to provide a strong incentive for increasing shareholder value. As of December 31, 2009, there were three participants in the Deferred Compensation Plan. The Deferred Compensation Plan was replaced with a Supplemental Executive Retirement Plan in 2003, and the Board has decided not to make any further contributions to the Deferred Compensation Plan. All amounts in a participant’s account become 100% vested upon a change of control; when the participant attains normal retirement age; when the employment of the participant terminates due to death or disability; or upon termination of the Deferred Compensation Plan. Prior to such an event, amounts in a participant’s account vest at the rate of 10% per year of service, provided that such vesting shall reach 100% when the participant reaches the age of 60. Payment may be in a lump sum or in installments as determined by the Board, and installments may be accelerated by the Board. Payment must be commenced within one year of the termination of the participant’s employment with Sterling. Sterling had $11,000, $15,000 and $27,000 in expense related to this plan for the years ending December 31, 2009, 2008 and 2007, respectively.
Since 2002, Sterling has maintained a Supplemental Executive Retirement Plan (the “SERP”). The SERP is a nonqualified, unfunded plan that is designed to provide retirement benefits for certain key employees of Sterling. Depending on their classification under the SERP, for 10 to 15 years, beginning at normal retirement age, participants will receive from 40%-60% of their base salary amount as of January 1, 2002. Retirement benefits vest at the rate of 10% per year of service. Except for participants who have completed 25 years of service, benefits are reduced for early retirement. Retirement benefits become 100% vested if, within two years of a change of control of Sterling Savings Bank, either the SERP or the participant’s employment are terminated. Sterling maintains and administers three additional SERPs from past acquisitions. These SERPs are all nonqualified, unfunded plans that were designed to provide retirement benefits for certain key employees and directors of the acquired companies. All amounts and benefits were established and accrued at acquisition either by previous service or change of control clauses. Sterling continues to administer these benefit plans, as necessary. Sterling had $326,000, $940,000, and $1.1 million for the years ended December 31, 2009, 2008 and 2007 in expenses related to these SERPs. As of December 31, 2009 and 2008, Sterling had $19.3 and $18.7 million, respectively, accrued as future obligations associated with these SERPs.
In 2006, Sterling adopted a new nonqualified Deferred Compensation Plan. The Deferred Compensation Plan is designed to retain and attract key employees. Plan participation is limited to Directors and a select group of management or highly compensated employees as determined by the Plan Committee. As of December 31, 2009, there were 67 participants in the Deferred Compensation Plan. Under the plan, participants may contribute up to 75% of their base salary and up to 100% of commissions, bonus and director fees. The deferred amounts are credited to the participants’ accounts, which do not hold assets but are maintained for record-keeping-purposes. The amounts deferred under the Plan are credited based on the return of measurement funds selected by the participants. The measurement funds are designed to mirror the performance of mutual funds selected by the Plan Committee. All participant contributions vest immediately. Each year, based on a written agreement or at its sole discretion, Sterling may contribute amounts to all, some or none of the participants. The vesting of the Sterling contributions is determined based on a written agreement between the participant and Sterling or based on a vesting schedule determined by the Plan Committee. Within 60 days after the later of the first business day of the plan year following the plan year in which the participant retires, or the last day of the six month period immediately following the date on which the participant retires, the participant’s account will be distributed either in a
| F-FIN39 |
Table of Contents
lump sum or installments up to 15 years as elected by the participant. Within 60 days after the Plan Committee is notified of the participants’ death or the participant becomes disabled, the participants account will be distributed in a lump sum. Within 60 days after the last day of the six month period immediately following the date on which employment terminates, the participant’s account will be distributed in a lump sum payment. Participants may elect to receive a scheduled distribution with certain exclusions. Sterling had $33,000, $184,000 and $64,000 of net expenses related to this plan for the years ended December 31, 2009, 2008 and 2007, respectively. As of December 31, 2009 and 2008, Sterling had accrued $5.0 million and $4.1 million, respectively to reflect the anticipated liability.
19. NONINTEREST EXPENSES:
The components of total noninterest expenses are as follows:
| Years Ended December 31, | ||||||||||
| 2009 | 2008 | 2007 | ||||||||
| (Dollars in thousands) | ||||||||||
| Employee compensation and benefits |
$ | 165,254 | $ | 159,133 | $ | 158,483 | ||||
| Occupancy and equipment |
40,637 | 40,245 | 40,731 | |||||||
| OREO operations |
48,041 | 19,787 | (72 | ) | ||||||
| Insurance |
30,585 | 7,372 | 3,778 | |||||||
| Data processing |
20,779 | 21,118 | 18,109 | |||||||
| Depreciation |
14,041 | 14,023 | 13,498 | |||||||
| Advertising |
12,069 | 11,748 | 12,898 | |||||||
| Legal and accounting |
17,412 | 6,979 | 8,716 | |||||||
| Travel and entertainment |
5,161 | 6,977 | 7,676 | |||||||
| Amortization of core deposit intangibles |
4,898 | 4,901 | 4,718 | |||||||
| Merger and acquisition costs |
0 | 200 | 2,833 | |||||||
| Other |
11,097 | 13,034 | 14,097 | |||||||
| Total expense before impairment charge |
369,974 | 305,517 | 285,465 | |||||||
| Goodwill impairment |
227,558 | 223,765 | 0 | |||||||
| $ | 597,532 | $ | 529,282 | $ | 285,465 | |||||
In addition to the goodwill impairment charges during 2009 and 2008, noninterest expenses increased mainly due to OREO costs and an increase in Federal Deposit Insurance Corporation (“FDIC”) deposit insurance premiums. The elevation in OREO costs reflects losses from the impairment in values of the properties subsequent to repossession, and expenses associated with Sterling’s efforts to resolve problem accounts through foreclosure and liquidation.
20. SEGMENT INFORMATION:
For purposes of measuring and reporting financial results, Sterling is divided into five business segments:
| Ÿ | The Community Banking segment provides traditional banking and wealth management services through the retail and commercial banking groups of Sterling’s subsidiary, Sterling Savings Bank. |
| Ÿ | The Residential Construction Lending segment has historically originated and serviced loans through the real estate division of Sterling’s subsidiary, Sterling Savings Bank. Activity in |
| F-FIN40 |
Table of Contents
| this segment has been curtailed, and realigned with an emphasis on credit resolution. |
| Ÿ | The Residential Mortgage Banking segment originates and sells servicing-retained and servicing-released residential loans through loan production offices of Sterling’s subsidiary, Golf Savings Bank. |
| Ÿ | The Commercial Mortgage Banking segment originates, sells and services commercial real estate loans and participation interests in commercial real estate loans through offices in the western region of the United States primarily through Sterling Savings Bank’s subsidiary INTERVEST. |
| Ÿ | The Other and Eliminations segment represents the parent company expenses and intercompany eliminations of revenue and expenses. |
On May 1, 2009, Sterling Savings Bank’s subsidiary, Harbor Financial Services, Inc., which provides certain wealth management services, was renamed Sterling Savings Banc Financial Services, Inc.
The following table presents certain financial information regarding Sterling’s segments and provides a reconciliation to Sterling’s consolidated totals as of and for the years ended December 31, 2009, 2008 and 2007 (in thousands):
| As of and for the Year Ended December 31, 2009 | ||||||||||||||||||||||||
| Community Banking |
Residential Construction Lending |
Residential Mortgage Banking |
Commercial Mortgage Banking |
Other and Eliminations |
Total | |||||||||||||||||||
| Interest income |
$ | 538,503 | $ | 7,951 | $ | 29,058 | $ | 22,912 | $ | 923 | $ | 599,347 | ||||||||||||
| Interest expense |
(194,836 | ) | (39,633 | ) | (13,587 | ) | 0 | (7,314 | ) | (255,370 | ) | |||||||||||||
| Net interest income (expense) |
343,667 | (31,682 | ) | 15,471 | 22,912 | (6,391 | ) | 343,977 | ||||||||||||||||
| Provision for losses on loans |
(389,293 | ) | (267,835 | ) | (24,243 | ) | 0 | 0 | (681,371 | ) | ||||||||||||||
| Noninterest income |
77,465 | 304 | 54,771 | 2,891 | (11,617 | ) | 123,814 | |||||||||||||||||
| Noninterest expense |
(309,280 | ) | (7,273 | ) | (39,565 | ) | (8,299 | ) | (5,557 | ) | (369,974 | ) | ||||||||||||
| Goodwill impairment |
(227,558 | ) | 0 | 0 | 0 | 0 | (227,558 | ) | ||||||||||||||||
| Income (loss) before income taxes |
$ | (504,999 | ) | $ | (306,486 | ) | $ | 6,434 | $ | 17,504 | $ | (23,565 | ) | $ | (811,112 | ) | ||||||||
| Total assets |
$ | 9,302,660 | $ | 969,935 | $ | 586,765 | $ | 18,074 | $ | (11 | ) | $ | 10,877,423 | |||||||||||
| As of and for the Year Ended December 31, 2008 | ||||||||||||||||||||||||
| Community Banking |
Residential Construction Lending |
Residential Mortgage Banking |
Commercial Mortgage Banking |
Other and Eliminations |
Total | |||||||||||||||||||
| Interest income |
$ | 565,767 | $ | 99,027 | $ | 30,559 | $ | 18,962 | $ | 747 | $ | 715,062 | ||||||||||||
| Interest expense |
(262,637 | ) | (62,492 | ) | (17,570 | ) | 0 | (12,811 | ) | (355,510 | ) | |||||||||||||
| Net interest income (expense) |
303,130 | 36,535 | 12,989 | 18,962 | (12,064 | ) | 359,552 | |||||||||||||||||
| Provision for losses on loans |
(105,915 | ) | (221,135 | ) | (6,547 | ) | 0 | 0 | (333,597 | ) | ||||||||||||||
| Noninterest income |
70,444 | 3,234 | 23,672 | 3,803 | (9,258 | ) | 91,895 | |||||||||||||||||
| Noninterest expense |
(253,189 | ) | (9,766 | ) | (29,005 | ) | (9,463 | ) | (4,094 | ) | (305,517 | ) | ||||||||||||
| Goodwill impairment |
(192,695 | ) | 0 | (31,070 | ) | 0 | 0 | (223,765 | ) | |||||||||||||||
| Income (loss) before income taxes |
$ | (178,225 | ) | $ | (191,132 | ) | $ | (29,961 | ) | $ | 13,302 | $ | (25,416 | ) | $ | (411,432 | ) | |||||||
| Total assets |
$ | 10,721,836 | $ | 1,526,416 | $ | 517,728 | $ | 14,958 | $ | 9,778 | $ | 12,790,716 | ||||||||||||
| F-FIN41 |
Table of Contents
| As of and for the Year Ended December 31, 2007 | ||||||||||||||||||||||||
| Community Banking |
Residential Construction Lending |
Residential Mortgage Banking |
Commercial Mortgage Banking |
Other and Eliminations |
Total | |||||||||||||||||||
| Interest income |
$ | 548,815 | $ | 185,090 | $ | 23,863 | $ | 9,000 | $ | 210 | $ | 766,978 | ||||||||||||
| Interest expense |
(274,100 | ) | (104,758 | ) | (14,462 | ) | 0 | (18,298 | ) | (411,618 | ) | |||||||||||||
| Net interest income (expense) |
274,715 | 80,332 | 9,401 | 9,000 | (18,088 | ) | 355,360 | |||||||||||||||||
| Provision for losses on loans |
11,047 | (35,752 | ) | (383 | ) | 0 | 0 | (25,088 | ) | |||||||||||||||
| Noninterest income |
81,663 | 6,945 | 21,012 | 7,496 | (23,710 | ) | 93,406 | |||||||||||||||||
| Noninterest expense |
(230,753 | ) | (10,395 | ) | (30,584 | ) | (10,970 | ) | (2,763 | ) | (285,465 | ) | ||||||||||||
| Income (loss) before income taxes |
$ | 136,672 | $ | 41,130 | $ | (554 | ) | $ | 5,526 | $ | (44,561 | ) | $ | 138,213 | ||||||||||
| Total assets |
$ | 9,999,348 | $ | 1,847,344 | $ | 399,306 | $ | 10,445 | $ | (106,668 | ) | $ | 12,149,775 | |||||||||||
21. QUARTERLY FINANCIAL DATA (UNAUDITED):
The following tables present Sterling’s condensed operations on a quarterly basis for the years ended December 31, 2009 and 2008:
| 2009 Quarters Ended | ||||||||||||||||
| March 31 | June 30 | September 30 | December 31 | |||||||||||||
| (Dollars in thousands, except per share amounts) | ||||||||||||||||
| Interest income |
$ | 160,131 | $ | 154,519 | $ | 148,768 | $ | 135,929 | ||||||||
| Interest expense |
(71,783 | ) | (66,900 | ) | (61,709 | ) | (54,978 | ) | ||||||||
| Net interest income |
88,348 | 87,619 | 87,059 | 80,951 | ||||||||||||
| Provision for credit losses |
(65,865 | ) | (79,744 | ) | (195,505 | ) | (340,257 | ) | ||||||||
| Net interest income after provision |
22,483 | 7,875 | (108,446 | ) | (259,306 | ) | ||||||||||
| Non interest income |
36,626 | 31,692 | 27,431 | 28,065 | ||||||||||||
| Non interest expenses before impairment charge |
(79,988 | ) | (105,149 | ) | (90,367 | ) | (94,470 | ) | ||||||||
| Goodwill impairment |
0 | 0 | (227,558 | ) | 0 | |||||||||||
| Non interest expenses |
(79,988 | ) | (105,149 | ) | (317,925 | ) | (94,470 | ) | ||||||||
| Income before income taxes |
(20,879 | ) | (65,582 | ) | (398,940 | ) | (325,711 | ) | ||||||||
| Income tax (provision) benefit |
436 | 36,049 | (60,467 | ) | (3,000 | ) | ||||||||||
| Net income (loss) |
(20,443 | ) | (29,533 | ) | (459,407 | ) | (328,711 | ) | ||||||||
| Preferred stock dividend |
(4,347 | ) | (4,347 | ) | (4,318 | ) | (4,357 | ) | ||||||||
| Net income (loss) applicable to common shareholders |
$ | (24,790 | ) | $ | (33,880 | ) | $ | (463,725 | ) | $ | (333,068 | ) | ||||
| Earnings per share—basic |
$ | (0.48 | ) | $ | (0.65 | ) | $ | (8.93 | ) | $ | (6.41 | ) | ||||
| Earnings per share—diluted |
$ | (0.48 | ) | $ | (0.65 | ) | $ | (8.93 | ) | $ | (6.41 | ) | ||||
| Weighted average shares outstanding—basic |
51,896,149 | 51,922,407 | 51,922,871 | 51,947,107 | ||||||||||||
| Weighted average shares outstanding—diluted |
51,896,149 | 51,922,407 | 51,922,871 | 51,947,107 | ||||||||||||
| F-FIN42 |
Table of Contents
| 2008 Quarters Ended | ||||||||||||||||
| March 31 | June 30 | September 30 | December 31 | |||||||||||||
| Interest income |
$ | 188,983 | $ | 180,642 | $ | 176,327 | $ | 169,110 | ||||||||
| Interest expense |
(96,896 | ) | (86,523 | ) | (86,319 | ) | (85,772 | ) | ||||||||
| Net interest income |
92,087 | 94,119 | 90,008 | 83,338 | ||||||||||||
| Provision for credit losses |
(37,143 | ) | (30,987 | ) | (36,950 | ) | (228,517 | ) | ||||||||
| Net interest income after provision |
54,944 | 63,132 | 53,058 | (145,179 | ) | |||||||||||
| Non interest income |
21,268 | 25,736 | 22,917 | 21,974 | ||||||||||||
| Non interest expenses before impairment charge |
(72,213 | ) | (72,685 | ) | (71,418 | ) | (89,201 | ) | ||||||||
| Goodwill impairment |
0 | 0 | 0 | (223,765 | ) | |||||||||||
| Non interest expenses |
(72,213 | ) | (72,685 | ) | (71,418 | ) | (312,966 | ) | ||||||||
| Income before income taxes |
3,999 | 16,183 | 4,557 | (436,171 | ) | |||||||||||
| Income tax provision |
(1,123 | ) | (4,508 | ) | 441 | 81,088 | ||||||||||
| Net income (loss) |
2,876 | 11,675 | 4,998 | (355,083 | ) | |||||||||||
| Preferred stock dividend |
0 | 0 | 0 | (1,208 | ) | |||||||||||
| Net income (loss) applicable to common shareholders |
$ | 2,876 | $ | 11,675 | $ | 4,998 | $ | (356,291 | ) | |||||||
| Earnings per share—basic |
$ | 0.06 | $ | 0.23 | $ | 0.10 | $ | (6.87 | ) | |||||||
| Earnings per share—diluted |
$ | 0.06 | $ | 0.23 | $ | 0.10 | $ | (6.87 | ) | |||||||
| Weighted average shares outstanding—basic |
51,526,332 | 51,687,600 | 51,821,446 | 51,848,814 | ||||||||||||
| Weighted average shares outstanding—diluted |
51,786,038 | 51,883,549 | 52,006,215 | 51,848,814 | ||||||||||||
| F-FIN43 |
Table of Contents
22. FAIR VALUES OF FINANCIAL INSTRUMENTS:
Fair value estimates are determined as of a specific date using quoted market prices, where available, or various assumptions and estimates. As the assumptions underlying these estimates change, the fair value of the financial instruments will change. The use of assumptions and various valuation techniques, as well as the absence of secondary markets for certain financial instruments, will likely reduce the comparability of fair value disclosures between financial institutions. Accordingly, the aggregate fair value amounts presented do not represent and should not be construed to represent the full underlying value of Sterling.
The carrying and fair values of financial instruments as of the periods indicated, were as follows. Other assets are comprised of FHLB stock and derivatives, while other liabilities are comprised of derivatives.
| December 31, | ||||||||||||
| 2009 | 2008 | |||||||||||
| Carrying Amount |
Fair Value | Carrying Amount |
Fair Value | |||||||||
| (Dollars in thousands) | ||||||||||||
| Financial assets: |
||||||||||||
| Cash and cash equivalents |
$ | 573,006 | $ | 573,006 | $ | 140,295 | $ | 140,295 | ||||
| Investments and MBS: |
||||||||||||
| Available for sale |
2,160,325 | 2,160,325 | 2,639,290 | 2,639,290 | ||||||||
| Held to maturity |
17,646 | 17,646 | 175,830 | 171,406 | ||||||||
| Loans held for sale |
190,412 | 190,412 | 112,777 | 112,777 | ||||||||
| Loans receivable, net |
7,344,199 | 7,309,894 | 8,807,094 | 8,944,214 | ||||||||
| Accrued interest receivable |
43,869 | 43,869 | 57,306 | 57,306 | ||||||||
| Other assets |
108,502 | 108,502 | 109,777 | 109,777 | ||||||||
| Financial liabilities: |
||||||||||||
| Non-maturity deposits |
3,593,703 | 3,331,416 | 3,459,683 | 3,237,036 | ||||||||
| Deposits with stated maturities |
4,181,487 | 4,241,141 | 4,890,724 | 4,990,484 | ||||||||
| Borrowings |
2,634,594 | 2,581,832 | 3,137,848 | 3,251,560 | ||||||||
| Accrued interest payable |
22,245 | 22,245 | 41,631 | 41,631 | ||||||||
| Other liabilities |
4,319 | 4,319 | 7,460 | 7,460 | ||||||||
Companies have the option of carrying financial assets and liabilities at fair value, which can be implemented on all or individually selected financial instruments. Effective January 1, 2008, Sterling made this fair value election on newly originated loans held for sale under mandatory delivery programs. After analyzing the effects of carrying held for sale loans at fair value, Sterling elected to apply fair value accounting to all newly originated held for sale loans effective April 1, 2008. The fair value election was made to match changes in the value of these loans with the value of their economic hedges. Loan origination fees, costs and servicing rights, which were previously deferred on these loans, are now recognized as part of the loan value at origination. There was no transition adjustment upon adoption.
The framework for defining and measuring fair value requires that one of three valuation methods be used to determine fair market value: the market approach, the income approach or the cost approach. To increase consistency and comparability in fair value measurements and related disclosures, the standard also creates a fair value hierarchy to prioritize the inputs to these valuation methods into the following three levels:
| Ÿ | Level 1 inputs are a select class of observable inputs, based upon the quoted prices for |
| F-FIN44 |
Table of Contents
| identical instruments in active markets that are accessible as of the measurement date, and are to be used whenever available. |
| Ÿ | Level 2 inputs are other types of observable inputs, such as quoted prices for similar instruments in active markets; quoted prices for identical or similar instruments in markets that are inactive; or other inputs that are observable or can be derived from or supported by observable market data. Level 2 inputs are to be used whenever Level 1 inputs are not available. |
| Ÿ | Level 3 inputs are significantly unobservable, reflecting the reporting entity’s own assumptions regarding what market participants would assume when pricing a financial instrument. Level 3 inputs are to only be used when Level 1 and Level 2 inputs are unavailable. |
Assets and Liabilities Measured at Fair Value on a Recurring Basis. The following presents Sterling’s financial instruments that are measured at fair value on a recurring basis:
| Total | Level 1 | Level 2 | Level 3 | |||||||||
| (Dollars in thousands) | ||||||||||||
| Balance, December 31, 2009: |
||||||||||||
| Investment securities available-for-sale |
||||||||||||
| MBS |
$ | 1,944,989 | $ | 0 | $ | 1,944,989 | $ | 0 | ||||
| Municipal bonds |
195,282 | 0 | 195,282 | 0 | ||||||||
| Other |
20,054 | 0 | 20,054 | 0 | ||||||||
| Total investment securities available-for-sale |
2,160,325 | 0 | 2,160,325 | 0 | ||||||||
| Loans held for sale |
190,412 | 0 | 190,412 | 0 | ||||||||
| Other assets—derivatives |
7,820 | 0 | 3,273 | 4,547 | ||||||||
| Total assets |
$ | 2,358,557 | $ | 0 | $ | 2,354,010 | $ | 4,547 | ||||
| Other liabilities—derivatives |
$ | 4,319 | $ | 0 | $ | 0 | $ | 4,319 | ||||
| Balance, December 31, 2008: |
||||||||||||
| Investment securities available-for-sale |
||||||||||||
| MBS |
$ | 2,420,012 | $ | 0 | $ | 2,420,012 | $ | 0 | ||||
| Municipal bonds |
105,906 | 0 | 105,906 | 0 | ||||||||
| Short term commercial paper |
99,117 | 0 | 99,117 | 0 | ||||||||
| Other |
14,255 | 0 | 14,255 | 0 | ||||||||
| Total investment securities available-for-sale |
2,639,290 | 0 | 2,639,290 | 0 | ||||||||
| Loans held for sale |
112,191 | 0 | 112,191 | 0 | ||||||||
| Other assets—derivatives |
10,085 | 0 | 2,625 | 7,460 | ||||||||
| Total assets |
$ | 2,761,566 | $ | 0 | $ | 2,754,106 | $ | 7,460 | ||||
| Other liabilities—derivatives |
$ | 7,709 | $ | 0 | $ | 249 | $ | 7,460 | ||||
| F-FIN45 |
Table of Contents
The following table provides a reconciliation of interest rate swaps measured at fair value using significant unobservable or Level 3 inputs on a recurring basis during the year ended December 31, 2009. Gains and losses on these interest rate swaps are included in earnings as interest income or expense.
| Beginning Balance |
Change included in earnings |
Ending Balance | ||||||||
| 2009 |
(Dollars in thousands) | |||||||||
| Other assets—derivatives |
$ | 7,460 | $ | (2,913 | ) | $ | 4,547 | |||
| Other liabilities—derivatives |
$ | 7,460 | $ | (3,141 | ) | $ | 4,319 | |||
Level 2 derivatives represent mortgage banking interest rate lock and loan delivery commitments, while level 3 derivatives represent interest rate swaps, with market values for these instruments being a function of the interest rate and term of the underlying. Changes in the fair value of available-for-sale securities are recorded on the balance sheet under accumulated-other-comprehensive income, while gains and losses from sales are recognized as income. The difference between the aggregate fair value and the aggregate unpaid principal balance of loans held for sale that are carried at fair value were included in earnings as follows:
| Years Ended December 31, | ||||||
| 2009 | 2008 | |||||
| (Dollars in thousands) | ||||||
| Mortgage banking operations |
$ | 2,040 | $ | 3,354 | ||
Assets and Liabilities Measured at Fair Value on a Non-recurring Basis. Sterling may be required, from time to time, to measure certain other financial assets at fair value on a non-recurring basis from application of lower of cost or market (“LOCOM”) accounting or write-downs of individual assets. The following table presents the carrying value for these financial assets as of the dates indicated:
| December 31, 2009 | ||||||||||||||||
| Total Carrying Value |
Level 1 | Level 2 | Level 3 | Losses During the Year |
||||||||||||
| (Dollars in thousands) | ||||||||||||||||
| Loans |
$ | 702,477 | $ | $ | $ | 702,477 | $ | (434,499 | ) | |||||||
| OREO |
78,302 | 78,302 | (31,909 | ) | ||||||||||||
| Goodwill |
0 | 0 | (227,558 | ) | ||||||||||||
| Mortgage servicing rights |
12,062 | 12,062 | (134 | ) | ||||||||||||
| December 31, 2008 | ||||||||||||||||
| Total Carrying Value |
Level 1 | Level 2 | Level 3 | Losses During the Year |
||||||||||||
| (Dollars in thousands) | ||||||||||||||||
| Loans |
$ | 296,605 | $ | $ | $ | 296,605 | $ | (165,921 | ) | |||||||
| OREO |
61,024 | 61,024 | (58,604 | ) | ||||||||||||
| Goodwill |
227,558 | 227,558 | (223,765 | ) | ||||||||||||
| Mortgage servicing rights |
5,706 | 5,706 | (1,326 | ) | ||||||||||||
| F-FIN46 |
Table of Contents
The loans disclosed above represent the carrying value of impaired loans at period end. Mortgage servicing rights were written down mainly due to an acceleration of mortgage prepayments. Sterling carries its mortgage servicing rights at LOCOM, and as such, they are measured at fair value on a non-recurring basis. OREO represents the carrying value after write-downs taken at foreclosure that were charged to the loan loss allowance, as well as specific reserves established subsequent to foreclosure due to updated appraisals. Goodwill is presented at fair value, net of impairment charges.
The methods and assumptions used to estimate the fair values of each class of financial instruments are as follows:
Cash and Cash Equivalents
The carrying value of cash and cash equivalents approximates fair value due to the relatively short-term nature of these instruments.
Investments and MBS
The fair value of investments and MBS has been valued using a matrix pricing technique based on quoted prices for similar instruments, which Sterling validates with non-binding broker quotes, in depth collateral analysis and cash flow stress testing.
Loans Held for Sale
Sterling has elected to carry loans held for sale at fair value. The fair values are based on investor quotes in the secondary market based upon the fair value of options and commitments to sell or issue mortgage loans. On January 1, 2008, Sterling began recording certain loans held for sale at fair value. Effective January 1, 2008, Sterling elected to apply fair value accounting rules to newly originated loans held for sale under mandatory delivery programs. After analyzing the effects of carrying held for sale loans at fair value, Sterling elected to apply fair value accounting to all newly originated held for sale loans effective April 1, 2008. The fair value election was made to match changes in the value of these loans with the value of their economic hedges. Loan origination fees, costs and servicing rights, which were previously deferred on these loans, are now recognized as part of the loan value at origination. There was no transition adjustment upon adoption. As of December 31, 2009 and December 31, 2008, Sterling had $1.3 million and $585,000, respectively, of loans held for sale that were being reported at the lower of amortized cost or market value.
Loans Receivable
The fair value of performing loans is estimated by discounting the cash flows using interest rates that consider the current credit and interest rate risk inherent in the loans and current economic and lending conditions. The fair value of nonperforming loans is estimated by discounting management’s current estimate of future cash flows using a rate estimated to be commensurate with the risks involved. The fair value of nonperforming collateral dependent loans is estimated based upon the value of the underlying collateral. In addition, to reflect current market conditions, a liquidity discount has been applied against the portfolio.
Mortgage Servicing Rights
The fair value of mortgage servicing rights is estimated using a discounted cash flow methodology to arrive at the present value of future expected earnings from the servicing of the loans. Model inputs include prepayment speeds, market interest rates, contractual interest rates on the loans being serviced, and the amount of other fee income generated over the servicing contract.
OREO
The fair value of OREO is estimated using third party appraisals, subject to updates to reflect comparable market transactions, with appraisals ordered for “as is” or “disposal value.”
Deposits
The fair values of deposits subject to immediate withdrawal such as interest and noninterest bearing checking, regular savings, and money market deposit accounts, are equal to the amounts payable on demand at the reporting date, net of a core deposit intangible. Fair values for time deposits are estimated by discounting future cash flows using interest rates currently offered on time deposits with similar remaining maturities.
| F-FIN47 |
Table of Contents
Borrowings
The carrying amounts of short-term borrowings under repurchase agreements, federal funds purchased, short-term FHLB advances and other short-term borrowings approximate their fair values due to the relatively short period of time between the origination of the instruments and the expected payment dates on the instruments. The fair value of advances under lines of credit approximates their carrying value because such advances bear variable rates of interest. The fair value of long-term FHLB advances and other long-term borrowings is estimated using discounted cash flow analyses based on Sterling’s current incremental borrowing rates for similar types of borrowing arrangements with similar remaining terms.
23. RELATED-PARTY TRANSACTIONS:
One of Sterling Savings Bank’s directors is a principal in a law firm that provides legal services to Sterling. During the years ended December 31, 2009, 2008 and 2007, Sterling incurred legal fees of approximately $7.2 million, $3.9 million and $6.9 million, respectively, related to services provided by this firm.
At December 31, 2009 and 2008, loans outstanding to directors and executive officers were $45.2 million and $78.9 million, respectively. Related party loans and deposits are transacted as part of Sterling’s normal course of business, and are not subject to preferential terms or conditions.
During the year, the balance of loans outstanding to directors and executive officers changed as described in the following table. Reclassifications are due to changes in directors and executive officers.
| 2009 | 2008 | |||||||
| (Dollars in thousands) | ||||||||
| Balance, January 1 |
$ | 78,850 | $ | 71,008 | ||||
| New |
381 | 33,883 | ||||||
| Repayments |
(8,275 | ) | (2,952 | ) | ||||
| Reclassifications |
(25,708 | ) | (23,089 | ) | ||||
| Balance, December 31 |
$ | 45,248 | $ | 78,850 | ||||
| F-FIN48 |
Table of Contents
24. PARENT COMPANY-ONLY FINANCIAL INFORMATION:
The following Sterling Financial Corporation parent company-only financial information should be read in conjunction with the other notes to consolidated financial statements. The accounting policies for the parent company-only financial statements are the same as those used in the presentation of the consolidated financial statements other than the parent company-only financial statements account for the parent company’s investments in its subsidiaries under the equity method.
| Condensed Balance Sheets |
December 31, | |||||
| 2009 | 2008 | |||||
| (Dollars in thousands) | ||||||
| Assets: |
||||||
| Cash and cash equivalents |
$ | 24,340 | $ | 86,176 | ||
| Investments in subsidiaries: |
||||||
| Sterling Savings Bank |
488,720 | 1,158,606 | ||||
| Golf Savings Bank |
62,574 | 58,845 | ||||
| Golf Escrow Company |
200 | 610 | ||||
| Tri-Cities Mortgage Company |
32 | 32 | ||||
| Capital Trust Subsidiaries |
7,366 | 7,276 | ||||
| Receivable from subsidiaries |
101 | 48 | ||||
| Available for sale investments |
19 | 25 | ||||
| Other assets |
60,235 | 80,743 | ||||
| Total assets |
$ | 643,587 | $ | 1,392,361 | ||
| Liabilities and Shareholders’ Equity: |
||||||
| Accrued expenses payable |
$ | 19,181 | $ | 4,430 | ||
| Junior Subordinated Debentures |
245,281 | 245,276 | ||||
| Due to affiliates |
55,876 | 1,619 | ||||
| Shareholders’ equity |
323,249 | 1,141,036 | ||||
| Total liabilities and shareholders’ equity |
$ | 643,587 | $ | 1,392,361 | ||
| F-FIN49 |
Table of Contents
| Years Ended December 31, | ||||||||||||
| 2009 | 2008 | 2007 | ||||||||||
| (Dollars in thousands) | ||||||||||||
| Condensed Statements of Income |
||||||||||||
| Interest income |
$ | 439 | $ | 782 | $ | 1,625 | ||||||
| Interest expense |
(7,754 | ) | (13,729 | ) | (20,455 | ) | ||||||
| Net interest expense |
(7,315 | ) | (12,947 | ) | (18,830 | ) | ||||||
| Equity in net earnings of subsidiary |
(826,048 | ) | (324,807 | ) | 106,790 | |||||||
| Noninterest expenses |
(5,223 | ) | (4,081 | ) | (3,997 | ) | ||||||
| Income before income taxes |
(838,586 | ) | (341,835 | ) | 83,963 | |||||||
| Income tax benefit |
492 | 6,301 | 9,326 | |||||||||
| Net income (loss) |
$ | (838,094 | ) | $ | (335,534 | ) | $ | 93,289 | ||||
| Condensed Statements of Cash Flows |
||||||||||||
| Cash flows from operating activities: |
||||||||||||
| Net income |
$ | (838,094 | ) | $ | (335,534 | ) | $ | 93,289 | ||||
| Adjustments to reconcile net income to net cash used in operating activities |
830,146 | 317,138 | (110,835 | ) | ||||||||
| Net cash used in operating activities |
(7,948 | ) | (18,396 | ) | (17,546 | ) | ||||||
| Cash flows from investing activities: |
||||||||||||
| Investments in subsidiaries, net |
(60,000 | ) | (237,000 | ) | (8,000 | ) | ||||||
| Repayment of advances to subsidiaries |
3,376 | 8,862 | 4,817 | |||||||||
| Dividends from subsidiary |
10,273 | 38,294 | 30,923 | |||||||||
| Cash flows from acquisitions |
0 | 0 | (17,873 | ) | ||||||||
| Net cash provided by (used in) investing activities |
(46,351 | ) | (189,844 | ) | 9,867 | |||||||
| Cash flows from financing activities: |
||||||||||||
| Proceeds from other borrowings |
0 | 0 | 45,000 | |||||||||
| Repayment of other borrowings |
0 | (24,000 | ) | (13,000 | ) | |||||||
| Proceeds from issuances of preferred stock and common stock warrant |
0 | 303,000 | 0 | |||||||||
| Proceeds from stock sales |
0 | 1,390 | 4,526 | |||||||||
| Excess tax benefit from stock based compensation |
(804 | ) | 853 | 0 | ||||||||
| Dividends paid |
(6,733 | ) | (20,487 | ) | (16,243 | ) | ||||||
| Other |
0 | 0 | 0 | |||||||||
| Net cash provided by (used in) financing activities |
(7,537 | ) | 260,756 | 20,283 | ||||||||
| Net change in cash and cash equivalents |
(61,836 | ) | 52,516 | 12,604 | ||||||||
| Cash and cash equivalents, beginning of year |
86,176 | 33,660 | 21,056 | |||||||||
| Cash and cash equivalents, end of year |
$ | 24,340 | $ | 86,176 | $ | 33,660 | ||||||
| F-FIN50 |
Table of Contents
25. GOING CONCERN:
The accompanying consolidated financial statements are presented assuming Sterling will continue as a going concern. Sterling currently faces a number of challenges including; current and prior year losses driven by credit quality issues, being categorized as undercapitalized, and meeting the regulatory requirements of the Reserve Bank Agreement and the SSB Consent Agreement. The Reserve Bank Agreement is designed to enhance Sterling’s ability to act as a source of strength to its wholly owned subsidiaries, Sterling Savings Bank and Golf Savings Bank. Pursuant to the SSB Consent Agreement, the FDIC and WDFI directed Sterling Savings Bank to increase its Tier 1 capital by at least $300 million by December 15, 2009, and thereafter maintain a Tier 1 leverage ratio of not less than 10%.
Sterling is working with its advisors to increase capital to a level which will allow Sterling to comply with the SSB Consent Agreement and the Reserve Bank Agreement. Sterling’s strategy is expected to include a restructuring of its capital and liabilities that may include repurchasing outstanding trust preferred securities (the “TruPS”) and /or converting its preferred equity securities to common stock. In February 2010, offers were extended by Sterling to the holders of the TruPS to purchase the securities at a discount to the principal amount outstanding. The aggregate principal amount of Sterling’s outstanding TruPS is currently $238 million. Other options that Sterling is reviewing in connection with a realignment of its capital structure may include the sale of equity securities through public or private offerings and the sale of certain assets. Sterling’s goal is to achieve and maintain a Tier 1 leverage capital ratio that exceeds 10%, although there can be no assurance that Sterling will be successful in this regard.
To date, Sterling Savings Bank has not yet increased its Tier 1 capital to the levels required by the SSB Consent Agreement. As a result of Sterling’s failure to comply with the SSB Consent Agreement and Sterling’s current capital ratios, Sterling’s regulators may decide to impose more severe restrictions upon Sterling, including the appointment of a conservator or receiver for Sterling Savings Bank. The uncertainty around Sterling’s ability to comply with the requirements of the SSB Consent Agreement and the Federal Reserve Agreement raise substantial doubts about Sterling’s ability to continue as a going concern. The accompanying consolidated financial statements do not include any adjustments that might result related to these uncertainties.
26. SUBSEQUENT EVENT:
In February 2010, Sterling commenced cash offers to redeem its trust preferred borrowings at $0.20 of par. Consummation of the repurchase is conditioned upon Sterling receiving net proceeds from an equity offering, sale of assets or other transaction sufficient to repurchase the Trust Preferred Securities, as well as the approval, to the extent required, by Sterling’s banking regulators. Sterling’s offer to redeem the Trust Preferred Securities expires on March 23, 2010 for $120 million of par amount, and on March 31, 2010 for $118 million of par amount, with both dates being extendable. There can be no assurance that the repurchase will be completed. As part of it Capital Recovery plan, Sterling requested and on March 10, 2010, received a letter from the U.S. Department of the Treasury (“Treasury”) expressing conditional support for a plan to convert the Sterling preferred stock that Treasury holds into Sterling common stock. In its letter, Treasury set forth several conditions for its approval of the conversion of Treasury-owned securities to common equity: Sterling must execute a definitive agreement for that conversion with Treasury; must obtain the consent for the redemption of Sterling’s TruPS by a substantial portion of the holders of those securities; and must raise at least $650 million of additional capital through the issuance of new common equity at not greater than 20 cents per share.
In addition, Sterling has received several non-binding proposals from private equity firms, and has entered into a non-binding letter of intent with one of these firms to provide additional capital to recapitalize Sterling. There can be no assurance that any of these efforts will be successful.
| F-FIN51 |