Attached files
| file | filename |
|---|---|
| 8-K - FORM 8-K - PTC INC. | form8k.htm |
| EX-99.1 - PRESS RELEASE - PTC INC. | pressrel.htm |
Q1 FISCAL 2013 PREPARED REMARKS
Technology and market leadership, margin growth, commitment to long-term targets
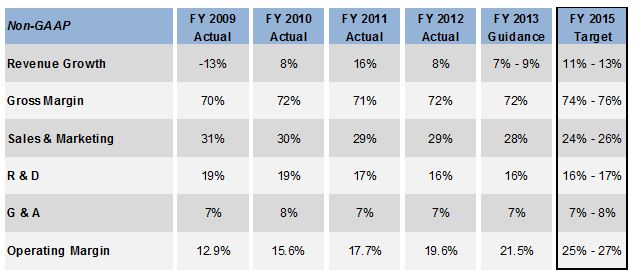
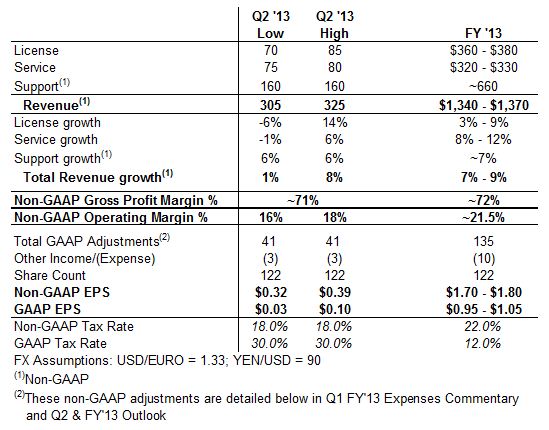
Our long-term financial goal is simple: We intend to deliver non-GAAP operating margin expansion over the next three years, reaching the 25% to 27% range in FY’15. We plan to achieve this goal through a combination of revenue growth from a broad set of software solutions spanning our customers’ entire product “lifecycle” and cost efficiencies within our operating model. The table below illustrates these goals. Given the continued slowdown within the global manufacturing industry (for reference see http://investor.ptc.com), which impacted license revenue results over the last four quarters, we believe it is prudent to provide guidance that reflects a moderated revenue growth scenario for FY’13. We are targeting FY’13 non-GAAP revenues of approximately $1,340 to $1,370 million and non-GAAP EPS of $1.70 to $1.80. However, we believe that as the economic backdrop improves into FY’14 as we expect, we will be well positioned to achieve our target growth rates.
|
1)
|
Our Q1 non-GAAP EPS of $0.36 (up 6% year over year on a constant currency basis) exceeded the high-end of our guidance due to stronger than anticipated license performance of Servigistics, better than planned services margins, and continued focus on cost efficiency as part of our commitment to margin expansion. There was no material impact to Q1 non-GAAP EPS from currency effects relative to guidance.
|
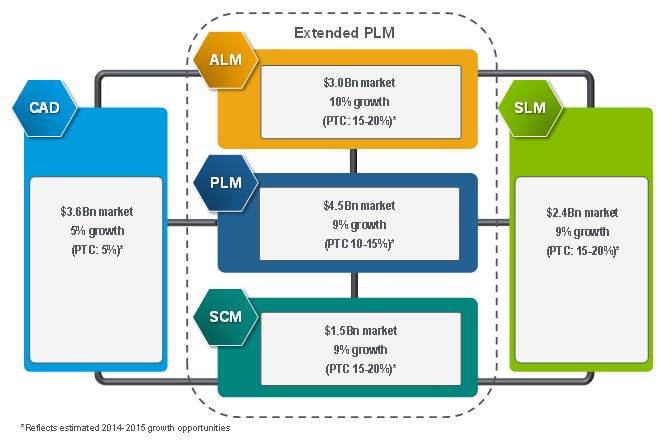
The company is focused on the following five markets: Computer Aided Design (CAD), Product Lifecycle Management (PLM), Application Lifecycle Management (ALM), Supply Chain Management (SCM), and Services Lifecycle Management (SLM). We characterize the markets we participate in with the graphic below. The graphic depicts PTC’s addressable market with market size and growth estimates from industry analysts. Industry analysts estimate that four of these five markets will grow at a 9-10% CAGR from 2009 to 2014, with the more mature CAD market growing approximately 5% over the same time frame. We also include our view of PTC’s growth rates within these markets which are predicated on an improving global macroeconomic environment and our ability to outperform market growth rates due to superior competitive positioning.
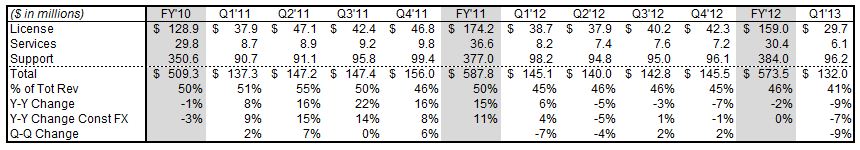
Beginning this quarter, we are providing additional revenue disclosure that we believe provides valuable insight into how our business is performing within the markets we serve. Along with line of business, geographic and large deal metrics, we are reporting revenue in three solution areas: CAD, SLM and “Extended PLM”, which encompasses our PLM, ALM and SCM businesses. Each of these solution areas serves a market with unique secular and cyclical dynamics, growth rates, and “buyers” within our customer base.
Revenue from product families is mapped to the following areas:
|
·
|
CAD: PTC Creo® and PTC Mathcad®
|
|
·
|
Extended PLM: PTC Windchill® and PTC Integrity TM
|
|
·
|
SLM: PTC Arbortext® and PTC Servigistics®
|
Non-GAAP Supplemental Information
We provide non-GAAP supplemental information to our GAAP information. PTC's reasons for providing this information are described at the end of this document. A reconciliation to the corresponding GAAP revenue amounts is provided in the revenue tables affected by the adjustment.
Maintenance Re-branded as PTC Global Support
Beginning in January of 2013, PTC launched a series of enhanced support offerings to drive increased value to our customers and as part of the launch re-branded our Maintenance business as “PTC Global Support”, which will be referred to as “Support” in our financial reporting going forward.
Q1 FY’13 - Key Points
|
1)
|
Our Q1 non-GAAP EPS of $0.36 (up 6% year over year on a constant currency basis) exceeded the high-end of our guidance due to stronger than anticipated license performance of Servigistics, better than planned services margins, and continued focus on cost efficiency as part of our commitment to margin expansion. There was no material impact to Q1 non-GAAP EPS from currency effects relative to guidance.
|
|
2)
|
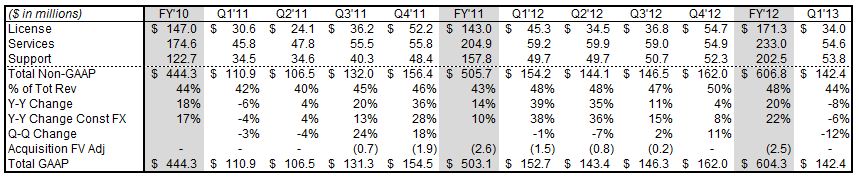
Total non-GAAP revenue for Q1 was $321.3 million, flat year over year (up 2% on a constant currency basis) compared to a very strong performance in Q1’12, and was at the mid-point of our guidance range. Servigistics delivered solid Q1 results with total non-GAAP revenue of $26.9 million.
|
|
3)
|
License revenue of $79.2 million was at the mid-point of our Q1 guidance range and was down 11% year over year (down 10% on a constant currency basis) compared to very strong performance in the year-ago period. Total license revenue, including $9.6 million from Servigistics, was solid in the Americas, Pacific Rim and Japan, however our organic license growth was impacted by the soft macroeconomic environment in Europe. Q1 results included one mega deal (license revenue of greater than $5 million).
|
|
4)
|
We delivered non-GAAP support revenue of $165.3 million, in line with our guidance, up 7% year over year and up 9% on a constant currency basis. Results included $8.1 million in non-GAAP support revenue from Servigistics.
|
|
5)
|
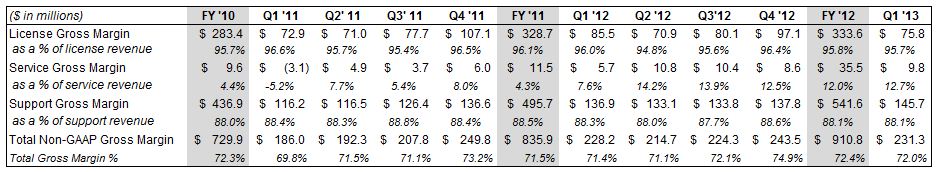
Services revenue of $76.8 million (up 2% year over year, 3% on a constant currency basis) was slightly above our guidance. Results included $9.2 million in revenue from Servigistics. Importantly, our initiatives to enhance services margins continued to yield positive results, with non-GAAP services gross margins of 12.7% for the quarter.
|
|
6)
|
We had 27 large deals (>$1M in license and services revenue recognized in the quarter) that contributed $61.8 million in revenue, a 10% decrease in revenue year over year, reflecting smaller deal sizes in the current macroeconomic environment.
|
|
7)
|
We ended the quarter with 348 quota-carrying sales representatives, which was flat YoY and as anticipated down by 10 reps vs. Q4’12 following final integration of the ALM sales team into PTC’s global sales organization. Given the growth in sales capacity we achieved over the past two years and continued concern about the global macroeconomic environment, our focus is on improving the productivity of the increased capacity we now have.
|
|
8)
|
We ended Q1’13 with $248 million of cash down from $490 million at the end of Q4’12, reflecting in part $222 million to finance the Servigistics acquisition and $16 million for stock repurchases.
|
Servigistics Establishes PTC as Clear Market Leader in SLM
On October 2, 2012, PTC completed the acquisition of Servigistics, Inc., developer of an innovative suite of service lifecycle management (SLM) software solutions. We believe the combination of the two companies firmly establishes PTC's market leadership in SLM with the deepest domain expertise, broadest customer base, and largest market share in the industry. With over 27,000 customers worldwide, PTC has long been known for its world-class technology solutions that transform the way companies create products. By adding Servigistics, PTC is now fully able to help global manufacturers transform the way they service those same products. From a technology perspective, PTC's SLM solution portfolio is now unparalleled in the industry, covering: PTC Technical Information, PTC Service Parts Information, PTC Service Knowledge Management, PTC Warranty and Contract Management, PTC Service Parts Management, PTC Field Service Management, PTC Service Parts Pricing, and PTC Service Network Visibility. Results of Servigistics have been included in our results of operations beginning on the acquisition date. Results for Q1 ’13 included $26.9 million of non-GAAP revenue ($25.3 million on a GAAP basis) related to Servigistics. References to organic revenue in the discussion that follows exclude Servigistics revenue.
Q2 AND FY’13 OUTLOOK: Targets reflect commitment to margin expansion
In providing guidance for Q2 and FY’13, we are weighing company specific factors such as our pipeline of opportunities and our support and services base as well as external considerations, including the macroeconomic environment (which continued to impact customer spending in Q1’13), currency, and visibility into customer spending patterns. We are now targeting FY’13 non-GAAP revenue of $1,340 to $1,370 million, including a wider license revenue guidance range and a $10 million reduction to our previous services revenue guidance. Our FY’13 guidance now assumes Servigistics will contribute at least $80 million in non-GAAP revenue, up from our previous guidance of $60 to $70 million. We are maintaining our FY’13 non-GAAP EPS guidance of $1.70 to $1.80. Our non-GAAP gross margin target for FY’13 has increased by 100 bps reflecting continued improvements in our services business.
REVENUE TRENDS
Year over year changes in revenue on a constant currency (FX) basis in the tables that follow compare actual reported results converted into U.S. dollars based on the corresponding prior year’s foreign currency exchange rates to reported results for the comparable prior year period.
LICENSE: Results pressured by large license deal activity
License sales generate the highest gross margins, which are approximately 96%. License revenue historically has tended to represent 28% to 33% of our total revenue in any given quarter, with Q4 generally being our strongest quarter.
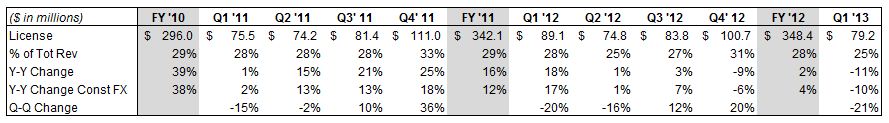
Q1 License revenue of $79.2 million was down 11% year over year (10% on a constant currency basis), in line with our guidance range of $75 million to $85 million, reflecting growth in the Americas, Japan and the Pacific Rim, with year-over-year growth of 5%, 15% and 9%, respectively, offset by weak results in Europe with a year-over-year decline of 36% (34% on a constant currency basis) due to in part strong performance in Q1’12. Servigistics delivered strong results in Q1 (which had historically been the company’s seasonally strong fiscal fourth quarter) with license revenue of $9.6 million.
Organic license revenue was down 22% (21% on a constant currency basis) due primarily to lower large deal activity in Europe and Japan concentrated in our PLM and CAD markets. However, we had strong double-digit organic license performance in SLM and ALM – two of our emerging growth markets.
Looking forward to Q2 we are expecting license revenue of $70 to $85 million; for FY’13, we are expecting total license revenue of $360 to $380 million, an increase of 3% to 9% year over year.
LARGE DEAL ACTIVITY:
Large deal activity is a significant growth driver and has historically tended to generate 20% to 25% of our total revenue in any given quarter, with Q4 typically at the high end of the range. Large deal activity is driven primarily by direct sales teams. We define “large deals” as recognizing more than $1 million of license and service revenue from a customer during a quarter. License revenue typically comprises approximately 50% of the total large deal revenue each quarter.
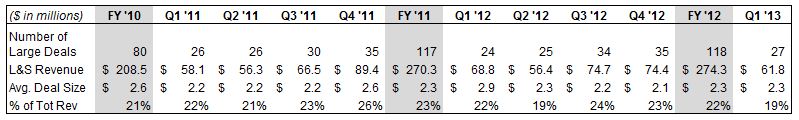
In Q1 we had 27 large deals totaling $61.8 million. 12 of these customers were in the Americas, 9 were in Europe and 6 were in Asia. Large deal license revenue was 45% of total large deal revenue in Q1’13, below the low end of the typical range due to continued weakness in the economic environment in Europe. Despite the macroeconomic environment, we continue to have a strong pipeline of large deals that we are working on worldwide, though the timing of closing large deals is being impacted by the economy. We are winning competitive deals with large global companies and are actively engaged in a substantial number of competitive opportunities with other large global companies. For example, in Q1 we won a competitive displacement of the legacy PLM provider at Brazilian-based Embraer, one of the world’s largest aircraft manufacturers. Embraer chose PTC as its partner of record for its entire global aircraft development program – commercial, executive and defense.
SALES CAPACITY TRENDS:
A key part of our long-term growth strategy last year was to increase the number of quota-carrying sales reps as we penetrate adjacent market opportunities (i.e. ALM, SLM, and SCM) within our existing customer base and target new customers. Given the significant growth in sales capacity we achieved over the past two years (up 27%, half of which was organic) and concerns over the macroeconomic outlook, our focus is on improving the productivity of the increased capacity we now have. We ended the quarter with 348 quota-carrying reps, consistent with the number at the end of Q1’12. As expected, the number of primary quota carrying sales reps decreased QoQ following the completion of the ALM sales integration, as many of the ALM reps moved into specialist roles allowing us to better leverage the scale of the core PTC distribution capacity. Similarly, new sales reps that joined PTC through the Servigistics acquisition have been integrated into our existing SLM sales teams.

SERVICES: Margin improvement and partner ecosystem traction
Our services business provides significant value to our customers, helping them re-engineer their global product development business processes and implement our solutions - and providing them with training on our software. Services revenue has historically tended to represent 20% to 25% of our total revenues in any given quarter.
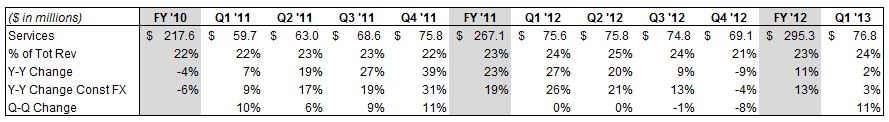
Q1 Services revenue of $76.8 million was up 2% year over year (3% on a constant currency basis). On an organic basis, services revenue was down 11% (down 9% on a constant currency basis). Our organic consulting services revenue, which primarily supports PTC Windchill implementations, was down 13% year over year. We are having considerable success with our partner ecosystem, which saw bookings growth of over 70% on a year over year basis. Our training business, which typically represents about 15% of our total services revenue, was up 6% year over year (6% on an organic basis). We delivered solid, non-GAAP services gross margin of 12.7% in Q1’13 (up 5.1 percentage points from the Q1’12 non-GAAP services gross margin of 7.6%).
Looking forward to Q2, we are expecting services revenue to be up approximately 2% on a year-over-year basis. For FY’13 we are now expecting services revenue to grow approximately 10% year over year (vs. our previous guidance of approximately 13%) with organic growth rates consistent with Q2’12. Our lower anticipated Services revenue reflects the traction we are gaining with our Service partner ecosystem and lower anticipated license revenue. We expect our non-GAAP services margins to be approximately 13% in FY’13, an increase of 100 basis points over our previous guidance due to solid execution on our margin improvement
initiatives. We remain committed to achieving non-GAAP services margins of approximately 15% by FY’15 and reducing our mix of direct services through the expansion of our services ecosystem and delivery of solutions that fundamentally require less services.
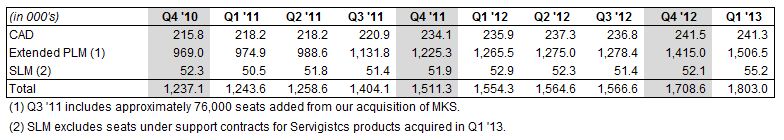
SUPPORT: More than 1.8 million active seats
Our support business is an important barometer of customer satisfaction with our solutions. It is also a strong source of recurring revenue for PTC. Support gross margins are approximately 88% on a non-GAAP basis. Support revenue has historically tended to represent 45% to 50% of our total revenues in any given quarter, with Q4 usually being at the low end as a percent of total revenue due to historically strong performance of license sales in that quarter.
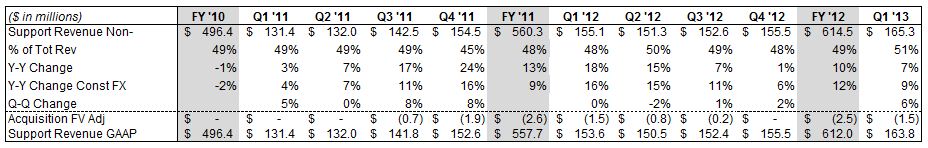
Q1 non-GAAP support revenue of $165.3 million was up 7% year over year (up 9% on a constant currency basis), reflecting strong execution and the impact of Servigistics. On an organic basis, support revenue was up 1% year over year (4% on a constant currency basis).
Looking forward to Q2, we are expecting non-GAAP support revenue to increase approximately 6% on a year-over-year basis, although decrease QoQ due to the normal seasonality of Support contract renewals. For FY’13 we are expecting approximately 7% non-GAAP support revenue growth on a year-over-year basis.
Active Support Seats
REVENUE BY SOLUTION
The following tables provide license, services and support revenue for each of our solution areas. Results include combined revenue from direct sales and our channel.
CAD:
CAD revenue in Q1 was down 9% (down 7% on a constant currency basis) compared with the year ago period primarily due to lower license revenue in Europe. Our year over year European results reflect continued weak economic conditions that are impacting customer buying behavior and the strong Q1’12 performance that included a CAD mega deal. License revenue in the Americas and Pacific Rim experienced modest growth year over year, while Japan delivered double-digit year-over-year growth.
CAD channel revenue, which represents approximately 40% of total CAD revenue, was flat year-over-year, reflecting modest growth in Americas, Pacific Rim and Japan offset by soft results in Europe.
Extended PLM:
In Q1 Extended PLM revenue, which includes our PLM, ALM and SCM solutions was down 8% year over year (down 6% on a constant currency basis), reflecting very strong performance in the year ago period, and soft license revenue in PLM contrasted with solid performance in ALM. We attribute the softness in PLM results to the lower number of large license transactions in this quarter, which are being impacted by macro headwinds in the global manufacturing industry. As evidenced by the strategic Q1 win with Embraer, one of the world’s largest aircraft manufacturers, we remain confident in our competitive positioning in PLM and growth prospects as macroeconomic conditions improve.
SLM:
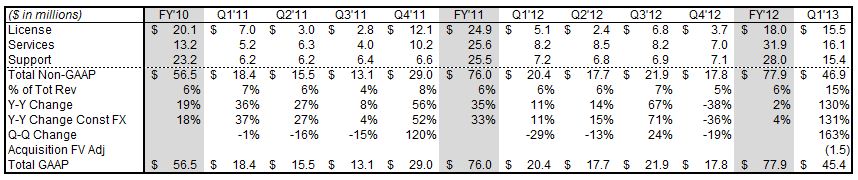
Q1 SLM license revenue included 16% organic, constant currency growth and strong performance from Servigistics, which delivered $9.6 million in license revenue. Including Servigistics, license revenue performance was strongest in the Americas and Europe and notably was driven by healthy large deal activity, supporting our view that the SLM market may be less economically sensitive than our CAD and Extended PLM markets.
REVENUE BY REGION
Americas:
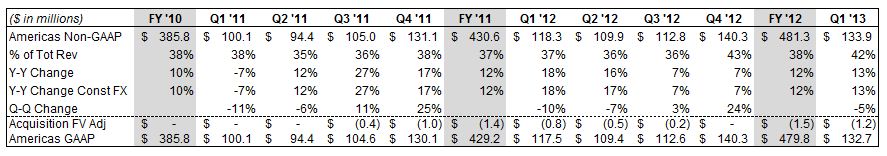
Americas non-GAAP revenue in Q1 of $133.9 million was up 13% year over year due to strong services revenue growth. Q1 license revenue in the Americas was up 5% year over year, driven by strong results for ALM, solid results in our organic SLM business and our strong performance of Servigistics. Organic license revenue and total non-GAAP revenue were down 11% and 3%, respectively, due to pressure on large deals in PLM and CAD. While the macroeconomic environment remains soft in the Americas, our pipeline continues to build and we are optimistic about the outlook for this region.
Europe:
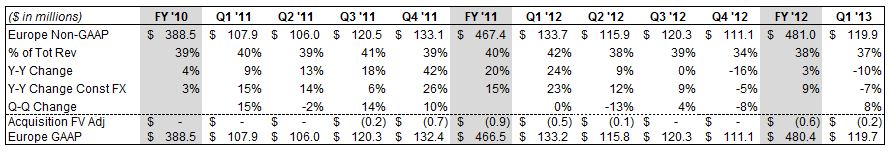
Europe non-GAAP revenue was $119.9 million in Q1, down 10% year over year and down 7% on a constant currency basis. Q1 license revenue in Europe was down 36% year over year and down 34% on a constant currency basis. Organic license revenue and total non-GAAP revenue were down 44% and 14%, respectively. We were expecting a decline in Europe on a year-over-year basis, given strong comparative results in Q1’12, however results were further impacted by the weakening manufacturing sector in Europe that impacted the closure of large deals in PLM and CAD during the quarter. Given the uncertain macroeconomic environment in Europe, we are currently expecting only moderate growth in the region for FY’13.
Japan:
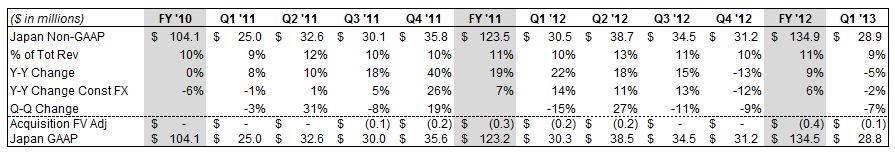
Japan non-GAAP revenue was $28.9 million in Q1, down 5% (down 2% on a constant currency basis) year over year. Q1 license revenue in Japan was up 15% (up 19% on a constant currency basis) compared with last year. Organic license revenue and total revenue were both down 12%. Similar to Europe, we experienced delays in
closing large license transactions in Japan during Q1, however based on the significant growth in sales capacity and our strong pipeline in the region, we are expecting growth to improve in FY’13.
Pacific Rim:
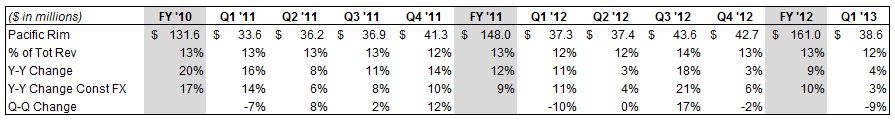
Pacific Rim revenue was $38.6 million in Q1, up 4% (3% on a constant currency basis) compared with last year. Q1 license revenue in the Pac Rim was up 9% compared with last year (up 8% on a constant currency basis). Organic license revenue and total revenue were up 7% and 2%, respectively. China, which represents a significant portion of our Pac Rim revenue, increased 5% compared to Q1’12. Given the momentum we experienced in the Pac Rim in FY’12 and solid pipeline, we are expecting another solid year of performance in FY’13 in this region.
CURRENCY IMPACT ON RESULTS COMPARED TO THE YEAR AGO PERIOD
Because we have a global business, with Europe and Asia historically representing approximately 65% of our revenue, our results are impacted by currency fluctuations. On a constant currency basis, our non-GAAP revenue was up 2% year over year, down 6% on an organic constant currency basis. Currency fluctuations unfavorably impacted Q1 non-GAAP revenue by $5.7 million and favorably impacted Q1 GAAP and non-GAAP expenses by $4.6 million and $4.0 million, respectively, compared to Q1’12 currency rates.
Looking forward, the guidance we are providing assumes exchange rates of approximately 1.33 USD / EURO and 90 YEN / USD. Our actual simple average Q1 ’13 Fx rate was $1.29 USD / EURO. We do not forecast currency movements; rather we provide detailed constant currency commentary. Currency can significantly impact our results. For example, in FY’12, currency was a headwind for PTC and negatively impacted non-GAAP revenue by $25 million and favorably impacted GAAP and non-GAAP expenses by $19 million and $18 million, respectively. In FY ’11 and FY’10 currency was a tailwind for us when compared to the prior year: non-GAAP revenue was positively impacted by $37 million and $15 million, respectively, and non-GAAP expenses were negatively impacted by $21 million and $10 million, respectively.
As a simple rule of thumb, based on current revenue and expense levels, a $0.10 move on the USD / EURO exchange rate will impact annualized revenue by approximately $35 to $40 million and EPS by approximately $0.08 to $0.10. Given the recent appreciation in the YEN / USD exchange rate, we also note that a 10 YEN move versus the USD will impact annualized revenue by approximately $13 to $17 million and expenses by approximately $6 to $8 million.
Q1 FY’13 EXPENSES COMMENTARY AND Q2 & FY’13 OUTLOOK
We initiated cost actions in Q1’13 and Q2’13 as part of our commitment to improve our operating efficiencies and to further our commitment to enhance long-term profitability. In total, these restructurings will result in cash expenditures of approximately $30 million during fiscal year 2013, primarily attributable to severance costs. We
expect the restructuring to be substantially completed in the second fiscal quarter of 2013, with the full impact of the expense reductions being realized in the third fiscal quarter of 2013. Once completed, these cost actions are expected to reduce our operating expenses by approximately $9 million per quarter, and are a component of our plan to achieve non-GAAP EPS of $1.70 to $1.80 for fiscal year 2013.
Q1 non-GAAP results exclude $11.9 million of stock-based compensation expense, $11.3 million of acquisition- related intangible asset amortization, $15.4 million of restructuring charges, and $4.6 million of acquisition-related costs. The Q1 non-GAAP results include a tax rate of 22% and 121.8 million diluted shares outstanding. The Q1 GAAP results include a tax benefit of $33 million associated with the purchase accounting for the Servigistics acquisition and 121.8 million diluted shares outstanding.
Q2’13 non-GAAP guidance excludes the following estimated expenses and their tax effects:
|
·
|
Approximately $12 million of expense related to stock-based compensation
|
|
·
|
Approximately $15 million of restructuring charges
|
|
·
|
Approximately $1 million of a fair value deferred support revenue adjustment
|
|
·
|
Approximately $11 million of acquisition-related intangible asset amortization expense
|
|
·
|
Approximately $2 million of acquisition-related expenses
|
FY’13 non-GAAP guidance excludes the following full-year estimated expenses and their tax effects, as well as any one-time tax items:
|
·
|
Approximately $30 million of restructuring charges
|
|
·
|
Approximately $3 million of a fair value deferred support revenue adjustment
|
|
·
|
Approximately $50 million of expense related to stock-based compensation
|
|
·
|
Approximately $45 million of acquisition-related intangible asset amortization expense
|
|
·
|
Approximately $7 million of acquisition-related expenses
|
NON-GAAP GROSS MARGINS
NON-GAAP OPERATING MARGINS
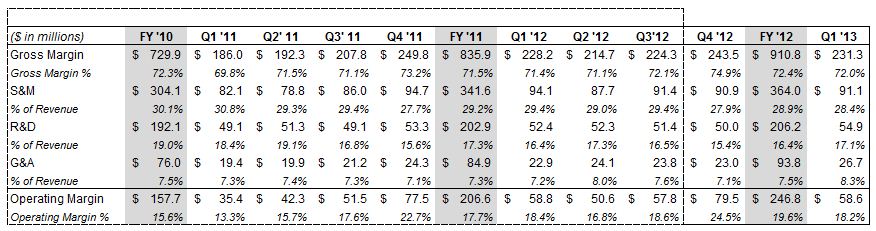
Our Q1’13 non-GAAP gross margin was $231 million, or 72.0%, compared to $228 million, or 71.4% in the year ago period due primarily to higher services margins. Q1’13 GAAP gross margin was $223 million, or 69.6%, compared to $220 million, or 69.1% in Q1’12.
Our Q1’13 non-GAAP operating expenses were $173 million ($209 million on a GAAP basis), up from $169 million in Q1’12 ($188 million on a GAAP basis), reflecting the Servigistics acquisition, offset by continued discipline on organic operating expenses.
From an operating performance perspective, we achieved 18.2% non-GAAP operating margin (18.4% on a constant currency basis) in Q1’13, compared to 18.4% in Q1’12. GAAP operating margin was 4.3% (4.6% on a constant currency basis) for Q1’13 compared to 10.2% in Q1’12.
Looking forward, we are expecting Q2‘13 non-GAAP gross margins of 71% and non-GAAP operating margin of approximately 16% to 18%. While we expect a portion of our recent restructuring activity to benefit Q2 non-GAAP expenses, these benefits will largely be offset by planed seasonally higher payroll taxes, higher marketing program spend and higher sales commissions.
For FY ‘13, we are now expecting non-GAAP gross margin of approximately 72% (vs. our previous guidance of 71%), with non-GAAP services margin of approximately 13% (vs. our previous guidance of 12%), non-GAAP operating margins of approximately 21.5%, and GAAP operating margin of approximately 11%.
Over the longer-term we intend to increase our non-GAAP operating margin to the 25% to 27% range primarily through increased efficiency in our global sales organization, improved non-GAAP gross margin (74% to 76% range) due to improved non-GAAP services margin and more favorable revenue mix.
We made significant investments in R&D during FY’09 and FY’10 that have helped us achieve a technology leadership position and have driven substantial revenue growth. While we expect to continue to increase our R&D investments, our R&D expenditures are now back to more normalized historical levels, which we believe to be appropriate over the longer term. In FY’11 and FY’12 we invested in sales capacity to capitalize on our technology leadership position, drive long term revenue growth and create further operating leverage opportunities over time. Looking forward, we expect to continue to increase our sales and marketing investments, while having sales and marketing as a percentage of revenue to continue to decrease as productivity improves over the coming years.
TAX RATE
Our Q1 non-GAAP tax rate was 22%. Our GAAP tax was a benefit of $24 million in Q1 in part reflecting a one-time non-cash tax benefit of $33 million associated with purchase accounting for the Servigistics acquisition.
Looking forward, the Q2 guidance assumes a non-GAAP tax rate of 18% associated with the recent retroactive extension of the federal R&D tax credit and a GAAP tax rate of 30%. The FY’13 target now assumes a non-GAAP tax rate of 22% (vs. our previous guidance of 23%) and a GAAP tax rate of 12%.
STOCK-BASED COMPENSATION
Expenses related to stock-based compensation were 3.7% of non-GAAP revenue in Q1 ’13, compared to 4.2% of non-GAAP revenue in Q1’12. Over time, we expect that stock-based compensation as a percentage of non-GAAP revenue will trend down annually, ultimately reaching a sustainable long-term target of 3%.
SHARE COUNT / SHARE REPURCHASE
We had 121.8 million fully diluted weighted average shares outstanding for Q1. Our Board has authorized us to repurchase up to $100 million worth of our shares in the period October 1, 2012 through September 30, 2013. We repurchased $16 million worth of shares in Q1.
Looking forward, we expect to have approximately 122 million fully diluted shares outstanding for Q2 ’13 and for the full fiscal year. We intend to repurchase $19 million worth of shares in Q2’13. Our goal is to repurchase stock to offset dilution.
BALANCE SHEET: Solid cash position
CASH / CASH FLOW FROM OPERATIONS
For Q1’13, our cash balance was $248 million, down from $490 million at the end of Q4’12, primarily due to $222 million paid to acquire Servigistics on October 2, 2012. We generated $14 million from operations in Q1. Uses of cash in the quarter included capital expenditures of $7 million.
DSO
We continue to have strong DSOs of 63 days in Q1’13 compared to 61 days in Q4’12 and 63 days in Q1’12.
OUTSTANDING DEBT
At the end of Q1’13, the balance outstanding under our $450 million credit facility was $368 million, $230 million of which was borrowed in Q4 ’12 to finance our acquisition of Servigistics. We expect to repay $60 million of the balance outstanding under our credit facility in Q2 ’13.
MISCELLANEOUS COMMENTS
HEADCOUNT
Total headcount was 6,126 at the end of Q1, including approximately 400 heads added in connection with our acquisition of Servigistics, compared to 5,897 at the end of Q4. Headcount at the end of Q1’12 was 6,110.
M&A
We view M&A primarily as a strategic vehicle to further enhance our product portfolio and growth opportunity. We intend to remain opportunistic as it relates to M&A. The majority of our M&A opportunities have comprised small, strategic technology tuck-ins, although we consider and have completed larger transactions, including MKS in Q3’11 and Servigistics, Inc. in Q1’13. We continue to evaluate strategic acquisition opportunities of varying size as they arise. Our forecasted financial, cash and debt positions set forth herein are exclusive of the effects of any M&A that we may complete.
Other Information
As previously disclosed, we have been investigating payments and expenses by certain business partners and employees in China that raise questions of compliance with laws, including the Foreign Corrupt Practices Act, and/or compliance with our business policies. In connection with this matter, we have terminated certain employees and business partners in China, which may have an adverse impact on our level of sales in China until replacements for those employees and business partners are in place and productive. Revenue from China has historically represented 6% to 7% of our total revenue. We have voluntarily disclosed the results of our investigation and associated remedial actions to the United States Department of Justice and the Securities and Exchange Commission and are continuing to provide additional information as requested by those agencies with respect to this matter. Resolution of this matter could include fines or other sanctions but we are unable to estimate an amount, if any.
Important Information About Non-GAAP References
PTC provides non-GAAP supplemental information to its financial results. Non-GAAP revenue, operating expenses, margin and EPS exclude a fair value adjustment related to acquired deferred support revenue from MKS and Servigistics, stock-based compensation expense, gain on a litigation resolution, foreign currency transaction losses related to our acquisition of MKS and a litigation resolution, amortization of acquired intangible assets, acquisition-related expenses, restructuring charges, and the related tax effects of the preceding items and any one-time tax items. Constant currency measures are calculated by multiplying results by the exchange rates in effect for the comparable periods in the prior year and assumes no change in tax rates. We use these non-GAAP measures, and we believe that they assist our investors, to make period-to-period comparisons of our operational performance because they provide a view of our operating results without items that are not, in our view, indicative of our core operating results. We believe that these non-GAAP measures help illustrate underlying trends in our business, and we use the measures to establish budgets and operational goals, communicated internally and externally, for managing our business and evaluating our performance. We believe that providing non-GAAP measures affords investors a view of our operating results that may be more easily compared to the results of peer companies. In addition, compensation of our executives is based in part on the performance of our business based on these non-GAAP measures. However, non-GAAP information should not be construed as an alternative to GAAP information as the items excluded from the non-GAAP measures often have a material impact on PTC’s financial results. Management uses, and investors should consider, non-GAAP measures in conjunction with our GAAP results.
Forward-Looking Statements
Statements in these prepared remarks that are not historic facts, including statements about our second quarter and full fiscal 2013, and other future financial and growth expectations, anticipated tax rates, the expected impact of our planned strategic investments on our future success, expected market growth rates and the long-term prospects for PTC, are forward-looking statements that involve risks and uncertainties that could cause actual results to differ materially from those projected. These risks include the possibility that customers may not purchase our solutions when or at the rates we expect, the possibility that our pipeline of opportunities may not generate the revenue we expect, the possibility that we will be unable to achieve planned services margins and operating margin improvements, the possibility foreign currency exchange rates may vary from our expectations and thereby affect our reported revenue and expense, the possibility that we may not achieve the license, services or support growth rates that we expect, which could result in a different mix of revenue between license, service and support and could impact our EPS results, the possibility the increases in sales capacity may not generate the additional sales pipeline and revenue that we expect, the possibility that our strategic investments and restructurings may not have the effects or generate the revenue growth or operating margin improvements we expect, the possibility that we may be unable to attain or maintain a technology leadership position or that any such leadership position may not generate the revenue we expect, and the possibility that we may be unable to achieve our profitability targets with lower license revenue. In addition, our assumptions concerning our future GAAP and non-GAAP effective income tax rates are based on estimates and other factors that could change, including the geographic mix of our revenue, expenses and profits and loans and cash repatriations from foreign subsidiaries. Other risks and uncertainties that could cause actual results to differ materially from those projected are detailed from time to time in reports we file with the Securities and Exchange Commission, including our Annual Report on Form 10-K and our Quarterly Reports on Form 10-Q.
|
PARAMETRIC TECHNOLOGY CORPORATION
|
|
NON-GAAP FINANCIAL MEASURES AND RECONCILIATIONS (UNAUDITED)
|
|
(in thousands)
|
|
GAAP MARGINS
|
|||||||||||||||||||||||||||||||||||||
|
FY '10
|
Q1 '11
|
Q2 '11
|
Q3 '11
|
Q4 '11
|
FY '11
|
||||||||||||||||||||||||||||||||
|
Revenue
|
$ | 1,010,049 | $ | 266,552 | $ | 269,189 | $ | 291,783 | $ | 339,425 | $ | 1,166,949 | |||||||||||||||||||||||||
|
Cost of license revenue
|
31,047 | 5,954 | 6,558 | 7,617 | 8,663 | 28,792 | |||||||||||||||||||||||||||||||
|
Cost of service revenue
|
213,462 | 64,131 | 59,179 | 66,148 | 71,192 | 260,650 | |||||||||||||||||||||||||||||||
|
Cost of support revenue
|
63,186 | 15,976 | 16,034 | 16,644 | 18,672 | 67,326 | |||||||||||||||||||||||||||||||
|
Gross Margin
|
$ | 702,354 | 69.5 | % | $ | 180,491 | 67.7 | % | $ | 187,418 | 69.6 | % | $ | 201,374 | 69.0 | % | $ | 240,898 | 71.0 | % | $ | 810,181 | 69.4 | % | |||||||||||||
|
Sales & marketing
|
$ | 317,532 | 31.4 | % | $ | 84,521 | 31.7 | % | $ | 81,163 | 30.2 | % | $ | 89,106 | 30.5 | % | $ | 98,261 | 28.9 | % | $ | 353,051 | 30.3 | % | |||||||||||||
|
Research & development
|
201,567 | 20.0 | % | 51,522 | 19.3 | % | 53,051 | 19.7 | % | 51,103 | 17.5 | % | 55,730 | 16.4 | % | 211,406 | 18.1 | % | |||||||||||||||||||
|
General & administrative
|
92,875 | 9.2 | % | 23,484 | 8.8 | % | 24,712 | 9.2 | % | 31,882 | 10.9 | % | 30,213 | 8.9 | % | 110,291 | 9.5 | % | |||||||||||||||||||
|
Amortization of acquired intangible assets
|
15,605 | 1.5 | % | 3,854 | 1.4 | % | 4,266 | 1.6 | % | 4,753 | 1.6 | % | 5,446 | 1.6 | % | 18,319 | 1.6 | % | |||||||||||||||||||
|
Restructuring charge
|
- | 0.0 | % | - | 0.0 | % | - | 0.0 | % | - | 0.0 | % | - | 0.0 | % | - | 0.0 | % | |||||||||||||||||||
|
Operating Expenses
|
$ | 627,579 | 62.1 | % | $ | 163,381 | 61.3 | % | $ | 163,192 | 60.6 | % | $ | 176,844 | 60.6 | % | $ | 189,650 | 55.9 | % | $ | 693,067 | 59.4 | % | |||||||||||||
|
GAAP Operating Margin
|
$ | 74,775 | 7.4 | % | $ | 17,110 | 6.4 | % | $ | 24,226 | 9.0 | % | $ | 24,530 | 8.4 | % | $ | 51,248 | 15.1 | % | $ | 117,114 | 10.0 | % | |||||||||||||
|
ADJUSTMENTS TO DERIVE NON-GAAP MEASURES
|
|||||||||||||||||||||||||||||||||||||
|
FY '10
|
Q1 '11
|
Q2 '11
|
Q3 '11
|
Q4 '11
|
FY '11
|
||||||||||||||||||||||||||||||||
|
Revenue:
|
|||||||||||||||||||||||||||||||||||||
|
Fair value of deferred revenue
|
$ | - | 0.0 | % | $ | - | 0.0 | % | $ | - | 0.0 | % | $ | 693 | 0.2 | % | $ | 1,913 | 0.6 | % | $ | 2,606 | 0.2 | % | |||||||||||||
|
Cost of license revenue:
|
|||||||||||||||||||||||||||||||||||||
|
Acquired intangible amortization
|
18,367 | 1.8 | % | 3,363 | 1.3 | % | 3,339 | 1.2 | % | 3,895 | 1.3 | % | 4,796 | 1.4 | % | 15,393 | 1.3 | % | |||||||||||||||||||
|
Stock-based compensation
|
24 | 0.0 | % | 3 | 0.0 | % | 3 | 0.0 | % | 4 | 0.0 | % | 5 | 0.0 | % | 15 | 0.0 | % | |||||||||||||||||||
|
Cost of service revenue:
|
|||||||||||||||||||||||||||||||||||||
|
Stock-based compensation
|
5,459 | 0.5 | % | 1,356 | 0.5 | % | 1,016 | 0.4 | % | 1,227 | 0.4 | % | 1,412 | 0.4 | % | 5,011 | 0.4 | % | |||||||||||||||||||
|
Cost of support revenue:
|
|||||||||||||||||||||||||||||||||||||
|
Stock-based compensation
|
3,663 | 0.4 | % | 781 | 0.3 | % | 567 | 0.2 | % | 630 | 0.2 | % | 743 | 0.2 | % | 2,721 | 0.2 | % | |||||||||||||||||||
|
Sales & marketing:
|
|||||||||||||||||||||||||||||||||||||
|
Stock-based compensation
|
13,432 | 1.3 | % | 2,429 | 0.9 | % | 2,350 | 0.9 | % | 3,062 | 1.0 | % | 3,587 | 1.1 | % | 11,428 | 1.0 | % | |||||||||||||||||||
|
Research & development:
|
|||||||||||||||||||||||||||||||||||||
|
Stock-based compensation
|
9,480 | 0.9 | % | 2,393 | 0.9 | % | 1,749 | 0.6 | % | 2,010 | 0.7 | % | 2,395 | 0.7 | % | 8,547 | 0.7 | % | |||||||||||||||||||
|
General & administrative:
|
|||||||||||||||||||||||||||||||||||||
|
Stock-based compensation
|
16,853 | 1.7 | % | 4,065 | 1.5 | % | 4,186 | 1.6 | % | 4,627 | 1.6 | % | 4,802 | 1.4 | % | 17,680 | 1.5 | % | |||||||||||||||||||
|
Acquisition-related costs
|
- | 0.0 | % | - | 0.0 | % | 608 | 0.2 | % | 6,041 | 2.1 | % | 1,112 | 0.3 | % | 7,761 | 0.7 | % | |||||||||||||||||||
|
Amortization of acquired intangible assets
|
15,605 | 1.5 | % | 3,854 | 1.4 | % | 4,266 | 1.6 | % | 4,753 | 1.6 | % | 5,446 | 1.6 | % | 18,319 | 1.6 | % | |||||||||||||||||||
|
Restructuring charge
|
- | 0.0 | % | - | 0.0 | % | - | 0.0 | % | - | 0.0 | % | - | 0.0 | % | - | 0.0 | % | |||||||||||||||||||
|
Non-GAAP adjustments
|
$ | 82,883 | 8.2 | % | $ | 18,244 | 6.8 | % | $ | 18,084 | 6.7 | % | $ | 26,942 | 9.2 | % | $ | 26,211 | 7.7 | % | $ | 89,481 | 7.7 | % | |||||||||||||
|
NON-GAAP MARGINS
|
|||||||||||||||||||||||||||||||||||||
|
FY '10
|
Q1 '11
|
Q2 '11
|
Q3 '11
|
Q4 '11
|
FY '11
|
||||||||||||||||||||||||||||||||
|
Revenue
|
$ | 1,010,049 | $ | 266,552 | $ | 269,189 | $ | 292,476 | $ | 341,338 | $ | 1,169,555 | |||||||||||||||||||||||||
|
Cost of license revenue
|
12,656 | 2,588 | 3,216 | 3,718 | 3,862 | 13,384 | |||||||||||||||||||||||||||||||
|
Cost of service revenue
|
208,003 | 62,775 | 58,163 | 64,921 | 69,780 | 255,639 | |||||||||||||||||||||||||||||||
|
Cost of support revenue
|
59,523 | 15,195 | 15,467 | 16,014 | 17,929 | 64,605 | |||||||||||||||||||||||||||||||
|
Gross Margin
|
$ | 729,867 | 72.3 | % | $ | 185,994 | 69.8 | % | $ | 192,343 | 71.5 | % | $ | 207,823 | 71.1 | % | $ | 249,767 | 73.2 | % | $ | 835,927 | 71.5 | % | |||||||||||||
|
Sales & marketing
|
$ | 304,100 | 30.1 | % | $ | 82,092 | 30.8 | % | $ | 78,813 | 29.3 | % | $ | 86,044 | 29.4 | % | $ | 94,674 | 27.7 | % | $ | 341,623 | 29.2 | % | |||||||||||||
|
Research & development
|
192,087 | 19.0 | % | 49,129 | 18.4 | % | 51,302 | 19.1 | % | 49,093 | 16.8 | % | 53,335 | 15.6 | % | 202,859 | 17.3 | % | |||||||||||||||||||
|
General & administrative
|
76,022 | 7.5 | % | 19,419 | 7.3 | % | 19,918 | 7.4 | % | 21,214 | 7.3 | % | 24,299 | 7.1 | % | 84,850 | 7.3 | % | |||||||||||||||||||
|
Amortization of acquired intangible assets
|
- | 0.0 | % | - | 0.0 | % | - | 0.0 | % | - | 0.0 | % | - | 0.0 | % | - | 0.0 | % | |||||||||||||||||||
|
Restructuring charge
|
- | 0.0 | % | - | 0.0 | % | - | 0.0 | % | - | 0.0 | % | - | 0.0 | % | - | 0.0 | % | |||||||||||||||||||
|
Operating Expenses
|
$ | 572,209 | 56.7 | % | $ | 150,640 | 56.5 | % | $ | 150,033 | 55.7 | % | $ | 156,351 | 53.5 | % | $ | 172,308 | 50.5 | % | $ | 629,332 | 53.8 | % | |||||||||||||
|
Non-GAAP Operating Margin
|
$ | 157,658 | 15.6 | % | $ | 35,354 | 13.3 | % | $ | 42,310 | 15.7 | % | $ | 51,472 | 17.6 | % | $ | 77,459 | 22.7 | % | $ | 206,595 | 17.7 | % | |||||||||||||
|
PARAMETRIC TECHNOLOGY CORPORATION
|
|
NON-GAAP FINANCIAL MEASURES AND RECONCILIATIONS (UNAUDITED)
|
|
(in thousands)
|
|
GAAP MARGINS
|
|||||||||||||||||||||||||||||||||||||
|
Q1 '12
|
Q2 '12
|
Q3 '12
|
Q4 '12
|
FY '12
|
Q1 '13
|
||||||||||||||||||||||||||||||||
|
Revenue
|
$ | 318,276 | $ | 301,125 | $ | 310,983 | $ | 325,295 | $ | 1,255,679 | $ | 319,751 | |||||||||||||||||||||||||
|
Cost of license revenue
|
7,659 | 7,824 | 7,634 | 7,478 | 30,595 | 8,012 | |||||||||||||||||||||||||||||||
|
Cost of service revenue
|
71,450 | 66,366 | 65,689 | 61,977 | 265,482 | 68,592 | |||||||||||||||||||||||||||||||
|
Cost of support revenue
|
19,110 | 19,026 | 19,531 | 18,384 | 76,051 | 20,468 | |||||||||||||||||||||||||||||||
|
Gross Margin
|
$ | 220,057 | 69.1 | % | $ | 207,909 | 69.0 | % | $ | 218,129 | 70.1 | % | $ | 237,456 | 73.0 | % | $ | 883,551 | 70.4 | % | $ | 222,679 | 69.6 | % | |||||||||||||
|
Sales & marketing
|
$ | 97,778 | 30.7 | % | $ | 90,962 | 30.2 | % | $ | 94,706 | 30.5 | % | $ | 94,350 | 29.0 | % | $ | 377,796 | 30.1 | % | $ | 93,549 | 29.3 | % | |||||||||||||
|
Research & development
|
54,993 | 17.3 | % | 54,576 | 18.1 | % | 53,260 | 17.1 | % | 52,131 | 16.0 | % | 214,960 | 17.1 | % | 57,429 | 18.0 | % | |||||||||||||||||||
|
General & administrative
|
29,572 | 9.3 | % | 29,534 | 9.8 | % | 29,851 | 9.6 | % | 28,511 | 8.8 | % | 117,468 | 9.4 | % | 35,817 | 11.2 | % | |||||||||||||||||||
|
Amortization of acquired intangible assets
|
5,209 | 1.6 | % | 5,132 | 1.7 | % | 5,103 | 1.6 | % | 4,859 | 1.5 | % | 20,303 | 1.6 | % | 6,623 | 2.1 | % | |||||||||||||||||||
|
Restructuring charge
|
- | 0.0 | % | 20,802 | 6.9 | % | 4,126 | 1.3 | % | - | 0.0 | % | 24,928 | 2.0 | % | 15,402 | 4.8 | % | |||||||||||||||||||
|
Operating Expenses
|
$ | 187,552 | 58.9 | % | $ | 201,006 | 66.8 | % | $ | 187,046 | 60.1 | % | $ | 179,851 | 55.3 | % | $ | 755,455 | 60.2 | % | $ | 208,820 | 65.3 | % | |||||||||||||
|
GAAP Operating Margin
|
$ | 32,505 | 10.2 | % | $ | 6,903 | 2.3 | % | $ | 31,083 | 10.0 | % | $ | 57,605 | 17.7 | % | $ | 128,096 | 10.2 | % | $ | 13,859 | 4.3 | % | |||||||||||||
|
ADJUSTMENTS TO DERIVE NON-GAAP MEASURES
|
|||||||||||||||||||||||||||||||||||||
|
Q1 '12
|
Q2 '12
|
Q3 '12
|
Q4 '12
|
FY '12
|
Q1 '13
|
||||||||||||||||||||||||||||||||
|
Revenue:
|
|||||||||||||||||||||||||||||||||||||
|
Fair value of deferred revenue
|
$ | 1,522 | 0.5 | % | $ | 736 | 0.2 | % | $ | 227 | 0.1 | % | $ | - | 0.0 | % | $ | 2,485 | 0.2 | % | $ | 1,554 | 0.5 | % | |||||||||||||
|
Cost of license revenue:
|
|||||||||||||||||||||||||||||||||||||
|
Acquired intangible amortization
|
4,103 | 1.3 | % | 3,931 | 1.3 | % | 3,933 | 1.3 | % | 3,852 | 1.2 | % | 15,819 | 1.3 | % | 4,639 | 1.5 | % | |||||||||||||||||||
|
Stock-based compensation
|
5 | 0.0 | % | 7 | 0.0 | % | 4 | 0.0 | % | 6 | 0.0 | % | 22 | 0.0 | % | 5 | 0.0 | % | |||||||||||||||||||
|
Cost of service revenue:
|
|||||||||||||||||||||||||||||||||||||
|
Stock-based compensation
|
1,563 | 0.5 | % | 1,358 | 0.5 | % | 1,314 | 0.4 | % | 1,447 | 0.4 | % | 5,682 | 0.5 | % | 1,612 | 0.5 | % | |||||||||||||||||||
|
Cost of support revenue:
|
|||||||||||||||||||||||||||||||||||||
|
Stock-based compensation
|
950 | 0.3 | % | 813 | 0.3 | % | 736 | 0.2 | % | 735 | 0.2 | % | 3,234 | 0.3 | % | 826 | 0.3 | % | |||||||||||||||||||
|
Sales & marketing:
|
|||||||||||||||||||||||||||||||||||||
|
Stock-based compensation
|
3,728 | 1.2 | % | 3,306 | 1.1 | % | 3,334 | 1.1 | % | 3,441 | 1.1 | % | 13,809 | 1.1 | % | 2,458 | 0.8 | % | |||||||||||||||||||
|
Research & development:
|
|||||||||||||||||||||||||||||||||||||
|
Stock-based compensation
|
2,549 | 0.8 | % | 2,240 | 0.7 | % | 1,886 | 0.6 | % | 2,086 | 0.6 | % | 8,761 | 0.7 | % | 2,512 | 0.8 | % | |||||||||||||||||||
|
General & administrative:
|
|||||||||||||||||||||||||||||||||||||
|
Stock-based compensation
|
4,587 | 1.4 | % | 4,968 | 1.6 | % | 6,057 | 1.9 | % | 4,185 | 1.3 | % | 19,797 | 1.6 | % | 4,480 | 1.4 | % | |||||||||||||||||||
|
Acquisition-related costs
|
2,068 | 0.6 | % | 444 | 0.1 | % | - | 0.0 | % | 1,321 | 0.4 | % | 3,833 | 0.3 | % | 4,599 | 1.4 | % | |||||||||||||||||||
|
Amortization of acquired intangible assets
|
5,209 | 1.6 | % | 5,132 | 1.7 | % | 5,103 | 1.6 | % | 4,859 | 1.5 | % | 20,303 | 1.6 | % | 6,623 | 2.1 | % | |||||||||||||||||||
|
Restructuring charge
|
- | 0.0 | % | 20,802 | 6.9 | % | 4,126 | 1.3 | % | - | 0.0 | % | 24,928 | 2.0 | % | 15,402 | 4.8 | % | |||||||||||||||||||
|
Non-GAAP adjustments
|
$ | 26,284 | 8.3 | % | $ | 43,737 | 14.5 | % | $ | 26,720 | 8.6 | % | $ | 21,932 | 6.7 | % | $ | 118,673 | 9.5 | % | $ | 44,710 | 14.0 | % | |||||||||||||
|
NON-GAAP MARGINS
|
|||||||||||||||||||||||||||||||||||||
|
Q1 '12
|
Q2 '12
|
Q3 '12
|
Q4 '12
|
FY '12
|
Q1 '13
|
||||||||||||||||||||||||||||||||
|
Revenue
|
$ | 319,798 | $ | 301,861 | $ | 311,210 | $ | 325,295 | $ | 1,258,164 | $ | 321,305 | |||||||||||||||||||||||||
|
Cost of license revenue
|
3,551 | 3,886 | 3,697 | 3,620 | 14,754 | 3,368 | |||||||||||||||||||||||||||||||
|
Cost of service revenue
|
69,887 | 65,008 | 64,375 | 60,530 | 259,800 | 66,980 | |||||||||||||||||||||||||||||||
|
Cost of support revenue
|
18,160 | 18,213 | 18,795 | 17,649 | 72,817 | 19,642 | |||||||||||||||||||||||||||||||
|
Gross Margin
|
$ | 228,200 | 71.4 | % | $ | 214,754 | 71.1 | % | $ | 224,343 | 72.1 | % | $ | 243,496 | 74.9 | % | $ | 910,793 | 72.4 | % | $ | 231,315 | 72.0 | % | |||||||||||||
|
Sales & marketing
|
$ | 94,050 | 29.4 | % | $ | 87,656 | 29.0 | % | $ | 91,372 | 29.4 | % | $ | 90,909 | 27.9 | % | $ | 363,987 | 28.9 | % | $ | 91,091 | 28.4 | % | |||||||||||||
|
Research & development
|
52,444 | 16.4 | % | 52,336 | 17.3 | % | 51,374 | 16.5 | % | 50,045 | 15.4 | % | 206,199 | 16.4 | % | 54,917 | 17.1 | % | |||||||||||||||||||
|
General & administrative
|
22,917 | 7.2 | % | 24,122 | 8.0 | % | 23,794 | 7.6 | % | 23,005 | 7.1 | % | 93,838 | 7.5 | % | 26,738 | 8.3 | % | |||||||||||||||||||
|
Amortization of acquired intangible assets
|
- | 0.0 | % | - | 0.0 | % | - | 0.0 | % | - | 0.0 | % | - | 0.0 | % | - | 0.0 | % | |||||||||||||||||||
|
Restructuring charge
|
- | 0.0 | % | - | 0.0 | % | - | 0.0 | % | - | 0.0 | % | - | 0.0 | % | - | 0.0 | % | |||||||||||||||||||
|
Operating Expenses
|
$ | 169,411 | 53.0 | % | $ | 164,114 | 54.4 | % | $ | 166,540 | 53.5 | % | $ | 163,959 | 50.4 | % | $ | 664,024 | 52.8 | % | $ | 172,746 | 53.8 | % | |||||||||||||
|
Non-GAAP Operating Margin
|
$ | 58,789 | 18.4 | % | $ | 50,640 | 16.8 | % | $ | 57,803 | 18.6 | % | $ | 79,537 | 24.5 | % | $ | 246,769 | 19.6 | % | $ | 58,569 | 18.2 | % | |||||||||||||
|
PARAMETRIC TECHNOLOGY CORPORATION
|
||||||||||||
|
NON-GAAP FINANCIAL MEASURES AND RECONCILIATIONS (UNAUDITED)
|
||||||||||||
|
(in thousands, except per share data)
|
||||||||||||
|
Three Months Ended
|
||||||||||||
|
December 29,
|
December 31,
|
|||||||||||
|
2012
|
2011
|
|||||||||||
|
GAAP revenue
|
$ | 319,751 | $ | 318,276 | ||||||||
|
Fair value of acquired company's
|
||||||||||||
|
deferred maintenance revenue
|
1,554 | 1,522 | ||||||||||
|
Non-GAAP revenue
|
$ | 321,305 | $ | 319,798 | ||||||||
|
GAAP gross margin
|
$ | 222,679 | $ | 220,057 | ||||||||
|
Fair value of acquired company's
|
||||||||||||
|
deferred maintenance revenue
|
1,554 | 1,522 | ||||||||||
|
Stock-based compensation
|
2,443 | 2,518 | ||||||||||
|
Amortization of acquired intangible assets
|
||||||||||||
|
included in cost of license revenue
|
4,639 | 4,103 | ||||||||||
|
Non-GAAP gross margin
|
$ | 231,315 | $ | 228,200 | ||||||||
|
GAAP operating income
|
$ | 13,859 | $ | 32,505 | ||||||||
|
Fair value of acquired company's
|
||||||||||||
|
deferred maintenance revenue
|
1,554 | 1,522 | ||||||||||
|
Stock-based compensation
|
11,893 | 13,382 | ||||||||||
|
Amortization of acquired intangible assets
|
||||||||||||
|
included in cost of license revenue
|
4,639 | 4,103 | ||||||||||
|
Amortization of acquired intangible assets
|
6,623 | 5,209 | ||||||||||
|
Acquisition-related charges included in
|
||||||||||||
|
general and administrative expenses
|
4,599 | 2,068 | ||||||||||
|
Restructuring charges
|
15,402 | - | ||||||||||
|
Non-GAAP operating income (1)
|
$ | 58,569 | $ | 58,789 | ||||||||
|
GAAP net income
|
$ | 35,811 | $ | 22,123 | ||||||||
|
Fair value of acquired company's
|
||||||||||||
|
deferred maintenance revenue
|
1,554 | 1,522 | ||||||||||
|
Stock-based compensation
|
11,893 | 13,382 | ||||||||||
|
Amortization of acquired intangible assets
|
||||||||||||
|
included in cost of license revenue
|
4,639 | 4,103 | ||||||||||
|
Amortization of acquired intangible assets
|
6,623 | 5,209 | ||||||||||
|
Acquisition-related charges included in
|
||||||||||||
|
general and administrative expenses
|
4,599 | 2,068 | ||||||||||
|
Restructuring charges
|
15,402 | - | ||||||||||
|
Non-operating foreign currency transaction losses (2)
|
- | 761 | ||||||||||
|
Income tax adjustments (3)
|
(36,400 | ) | (6,678 | ) | ||||||||
|
Non-GAAP net income
|
$ | 44,121 | $ | 42,490 | ||||||||
|
GAAP diluted earnings per share
|
$ | 0.29 | $ | 0.18 | ||||||||
|
Fair value of deferred maintenance revenue
|
0.01 | 0.01 | ||||||||||
|
Stock-based compensation
|
0.10 | 0.11 | ||||||||||
|
Amortization of acquired intangibles
|
0.09 | 0.08 | ||||||||||
|
Acquisition-related charges
|
0.04 | 0.02 | ||||||||||
|
Restructuring charges and other
|
0.13 | 0.01 | ||||||||||
|
Income tax adjustments
|
(0.30 | ) | (0.06 | ) | ||||||||
|
Non-GAAP diluted earnings per share
|
$ | 0.36 | $ | 0.35 | ||||||||
| (1 | ) |
Operating margin impact of non-GAAP adjustments:
|
||||||||||
|
Three Months Ended
|
||||||||||||
|
December 29,
|
December 31,
|
|||||||||||
| 2012 | 2011 | |||||||||||
|
GAAP operating margin
|
4.3 | % | 10.2 | % | ||||||||
|
Fair value of deferred maintenance revenue
|
0.5 | % | 0.5 | % | ||||||||
|
Stock-based compensation
|
3.7 | % | 4.2 | % | ||||||||
|
Amortization of acquired intangibles
|
3.5 | % | 2.9 | % | ||||||||
|
Acquisition-related charges
|
1.4 | % | 0.6 | % | ||||||||
|
Restructuring charges
|
4.8 | % | 0.0 | % | ||||||||
|
Non-GAAP operating margin
|
18.2 | % | 18.4 | % | ||||||||
| (2 | ) |
In the first quarter of 2012 we recorded $0.8 million of foreign currency transaction losses related to legal entity mergers completed during the quarter.
|
||||||||||
| (3 | ) |
Reflects the tax effects of non-GAAP adjustments for the first quarter of 2013 and 2012, which are calculated by applying the applicable tax rate by jurisdiction to the non-GAAP adjustments listed above, as well as one-time non-cash GAAP charges. In the fourth quarter of 2012, a valuation allowance was established against our U.S. net deferred tax assets. As the U.S. is profitable on a non-GAAP basis, the 2013 non-GAAP tax provision is being calculated assuming there is no U.S. valuation allowance and as a result an income tax benefit of $6.2 million is included in the first quarter of 2013. The first quarter of 2013 also includes a one-time non-cash tax benefit of $32.6 million related to the release of a portion of the valuation allowance as a result of deferred tax liabilities established in accounting for the acquisition of Servigistics. In the first quarter of 2012, the tax effects exclude one-time non-cash GAAP charges net, of $1.4 million related to the impact from a reduction in the statutory tax rate in Japan on deferred tax assets from a litigation settlement.
|
||||||||||