Attached files
| file | filename |
|---|---|
| 8-K - 8-K - ASSOCIATED BANC-CORP | d467465d8k.htm |
| EX-99.1 - EX-99.1 - ASSOCIATED BANC-CORP | d467465dex991.htm |
 Associated Banc-Corp
4Q 2012 Earnings Presentation
January 17, 2013
EXHIBIT 99.2 |
 Forward-Looking Statements
1
Statements made in this presentation which are not purely historical are
forward-looking statements, as defined in the Private Securities
Litigation Reform Act of 1995. This includes any statements regarding
management’s plans, objectives, or goals for future operations,
products
or
services,
and
forecasts
of
its
revenues,
earnings,
or
other
measures of performance.
Such forward-looking statements may be identified by the
use of words such as “believe”, “expect”,
“anticipate”, “plan”, “estimate”, “should”, “will”,
“intend”, “outlook”, or similar expressions.
Forward-looking statements are based on
current management expectations and, by their nature, are subject to risks and
uncertainties. Actual results may differ materially from those contained in
the forward- looking statements.
Factors which may cause actual results to differ materially from
those contained in such forward-looking statements include those identified in
the company’s
most
recent
Form
10-K
and
subsequent
SEC
filings.
Such
factors
are
incorporated herein by reference.
Important
note
regarding
forward-looking
statements: |
 Fourth Quarter 2012 Highlights
•
Net income available to common shareholders of $45 million or $0.26 per
share •
Return on Tier 1 common equity of 9.6%, compared to 9.0% a year ago
2
Solid Results Driven by Fundamental Strength in Core Businesses
Net Income
&
ROT1CE
Loan Growth
Net Interest Income
&
Net Interest Margin
•
Total loans of $15.4 billion were up $445 million, or 3% from the third
quarter –
Total commercial loan balances grew by $426 million, or 5% from the prior
quarter •
Net interest income increased by $6 million from the third quarter to $161
million –
Net interest margin of 3.32%
Capital
•
Increased quarterly dividend to $0.08/share
•
Repurchased $30 million of stock during the fourth quarter
•
Capital ratios remain very strong with a Tier 1 common equity ratio of
11.58% Deposit Growth
•
Average deposits increased by $1.0 billion, or 7% QoQ
–
Period-end noninterest-bearing deposits grew by $439 million, or 10%
QoQ |
 •
Defended the margin despite interest rate headwinds
–
Full year NIM of 3.30%
–
Deposit rates & interest-bearing liability costs managed lower throughout
the year 2012 Full Year Recap
3
•
Credit quality continued to improve at a steady pace
–
Nonaccruals down 29% YoY
•
Total loans up $1.4 billion, or 10% YoY to $15.4 billion
Execution of Growth Initiatives & Delivering Shareholder Value
•
Redeemed all outstanding Trust Preferred Securities
•
Increased the dividend twice during 2012 ($0.01 to $0.05 to $0.08)
•
Repurchased
$60
million
of
stock
during
2012;
$30
million
(2Q12)
&
$30
million
(4Q12)
•
FY 2012 earnings of $174 million or $1.00/share
–
Compared to $115 million in FY 2011 or $0.66/share
•
FY 2012 ROT1CE of 9.5% compared to 6.7% for FY 2011
Net Income
&
ROT1CE
Loan Growth
Credit
Capital
Net Interest Margin |
 4
2011 –
A Year of
Transition
•
Repaid TARP
•
OCC MOU terminated
•
Began executing on
our strategic initiatives
for growth
•
FY 2012 earnings up
51%
•
Loan balances up 10%
YoY
•
Defended the margin
•
Credit quality continued
to improve
•
Increased dividend
twice; $.01 -
$.05 -
$.08
•
$60 million of shares
repurchased
•
7% increase in
TBV/share
2012 –
Execution of
Growth Initiatives
2013 –
Growing the
Franchise &
Creating Long-Term
Shareholder Value
•
Continued focus on
organic growth
opportunities
•
Defending NIM
compression in low-
rate environment
•
Strong focus on
efficiency & expense
management
•
Disciplined focus on
deploying capital to
drive long-term
shareholder value
Executing on Strategic Plan
–
Loans +11% YoY
–
Improving retail
footprint
–
Investing in
Commercial Deposit
& Treasury
Management
Solutions |
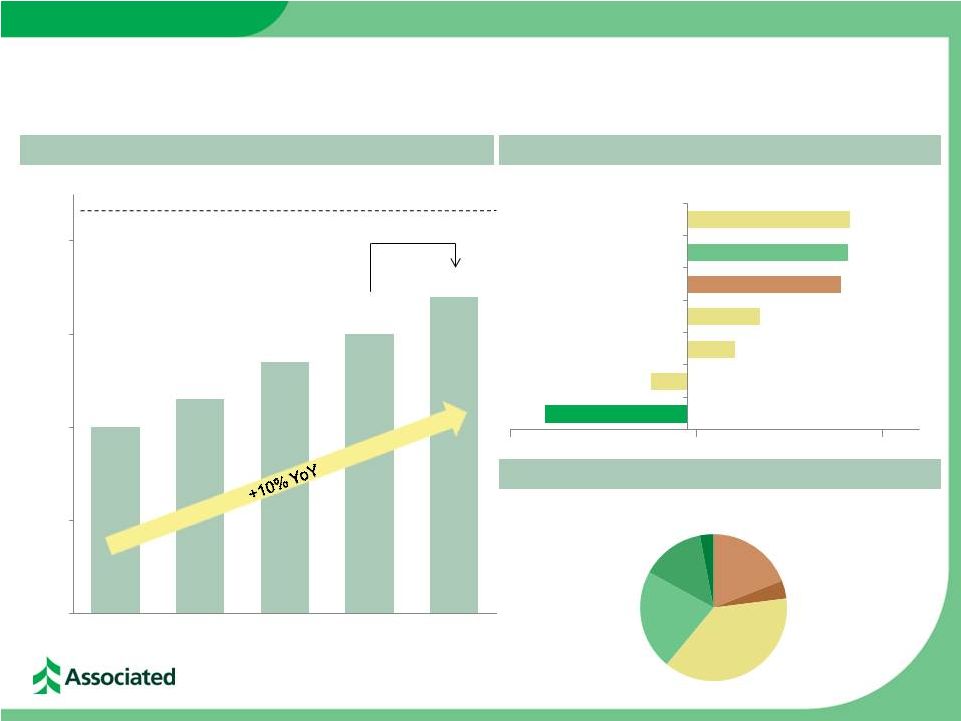 Loan
Portfolio Growth and Composition 5
Total Loans of $15.4 billion at December 31, 2012
4Q 2012 Net Loan Growth of $445 million
Total Loans ($ in billions)
+3% QoQ
Peak Loans (4Q 2008) $16.3 billion
Loan
Mix
–
4Q
2012
($ balances in millions)
Home Equity & Installment
Commercial Real Estate
Residential Mortgage
Power & Utilities
Oil & Gas
Mortgage Warehouse
General Commercial Loans
$14.0
$14.3
$14.7
$15.0
$15.4
$12.0
$13.0
$14.0
$15.0
$16.0
4Q 2011
1Q 2012
2Q 2012
3Q 2012
4Q 2012
CRE Investor
19%
Construction
4%
Commercial
& Business
Lending
38%
Res Mtg
22%
Home Equity
14%
Installment
3%
($153)
($39)
$50
$77
$164
$172
$174 |
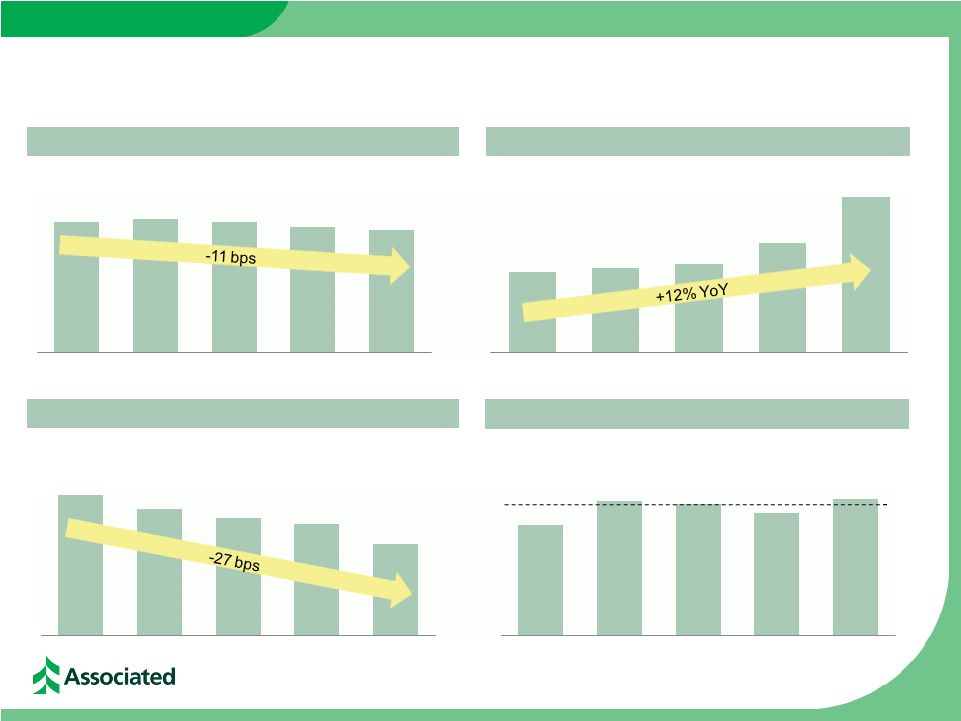 Managing the Cost of Funds & Margin
6
Yield on Interest-earning Assets
Cost of Interest-bearing Liabilities
Average Deposits
FY2012:
3.30%
Net Interest Margin
($ balances in billions)
3.81%
3.85%
3.80%
3.73%
3.70%
4Q 2011
1Q 2012
2Q 2012
3Q 2012
4Q 2012
$14.9
$15.0
$15.1
$15.6
$16.7
4Q 2011
1Q 2012
2Q 2012
3Q 2012
4Q 2012
0.78%
0.70%
0.65%
0.62%
0.51%
4Q 2011
1Q 2012
2Q 2012
3Q 2012
4Q 2012
3.21%
3.31%
3.30%
3.26%
3.32%
4Q 2011
1Q 2012
2Q 2012
3Q 2012
4Q 2012 |
 Continued Improvement in Credit Quality Indicators
7
($ in millions)
4Q 2011
1Q 2012
2Q 2012
3Q 2012
4Q 2012
Potential problem loans
$ 566
$ 480
$ 410
$ 404
$ 361
Nonaccruals
$ 357
$ 327
$ 318
$ 278
$ 253
Provision for loan losses
$ 1
$ 0
$ 0
$ 0
$ 3
Net charge offs
$ 23
$ 22
$ 24
$ 18
$ 21
ALLL/Total loans
2.70%
2.50%
2.26%
2.11%
1.93%
ALLL/Nonaccruals
105.99%
108.93%
104.65%
113.29%
117.61%
NPA/Assets
1.82%
1.65%
1.62%
1.38%
1.22%
Nonaccruals/Loans
2.54%
2.29%
2.16%
1.86%
1.64%
NCOs / Avg Loans
0.64%
0.61%
0.65%
0.47%
0.55% |
 Strong Capital Profile & Improving Earnings
8
Tier 1 Common Equity Ratio
Net
Income
Available
to
Common
&
ROT1CE
Net Income
($ in millions)
Return on Tier 1
Common Equity
•
Current capital levels are well in excess of
“well-capitalized”
regulatory benchmarks
–
Existing capital levels are already above
proposed Basel III capital levels
12.24%
12.49%
12.04%
12.01%
11.58%
4Q 2011
1Q 2012
2Q 2012
3Q 2012
4Q 2012
$40
$41
$42
$45
$45
9.0%
9.2%
9.3%
9.7%
9.6%
0.00%
2.50%
5.00%
7.50%
10.00%
12.50%
$0
$10
$20
$30
$40
$50
4Q 2011
1Q 2012
2Q 2012
3Q 2012
4Q 2012 |
 9
2013 Full Year Outlook
Growing the Franchise & Creating Long-Term Shareholder Value
Loan Growth
Deposit Growth
Fee Income
NIM
•
High single digit FY loan growth,
with seasonally low 1Q 2013
•
Continued disciplined deposit
pricing
•
Sustained focus on treasury
management solutions to drive
growth in commercial deposits
•
Modest compression over the
course of the year
•
$500 million of relatively high
cost FHLB advances maturing
during 1H 2013
•
Modest improvement in core fee-
based revenues with lower net
mortgage banking revenues
Expenses
Footprint
Credit
Capital
•
Flat year-over-year
•
Reduced regulatory costs offset by
continued franchise investments
•
Continuing to invest in our
branches while optimizing our
network
•
Consolidating in downtown
Green Bay and Chicago loop
•
Continuing improvement in credit
trends
•
Provision expense to increase
based on new loan growth in 2013
•
Disciplined focus on
deploying capital to drive
long-term shareholder value |