Attached files
| file | filename |
|---|---|
| 8-K - 8-K - SELECT MEDICAL HOLDINGS CORP | a13-2206_28k.htm |
Exhibit 99.1
|
|
31st Annual J.P. Morgan Healthcare Conference January 7, 2013 |
|
|
This presentation may contain forward-looking statements based on current management expectations. Numerous factors, including those related to market conditions and those detailed from time-to-time in the Company’s filings with the Securities and Exchange Commission, may cause results to differ materially from those anticipated in the forward-looking statements. Many of the factors that will determine the Company’s future results are beyond the ability of the Company to control or predict. These statements are subject to risks and uncertainties and, therefore, actual results may differ materially. Readers should not place undue reliance on forward-looking statements, which reflect management’s views only as of the date hereof. The Company undertakes no obligation to revise or update any forward-looking statements, or to make any other forward-looking statements, whether as a result of new information, future events or otherwise. All references to “Select” used throughout this presentation refer to Select Medical Holdings Corporation and its subsidiaries. Forward-Looking Statements |
|
|
111 LTAC Hospitals 110 owned - 4,629 beds 1 managed Hospitals in 28 states 965 Outpatient Rehab Clinics in 32 states and the District of Columbia $2.9 Billion Net Revenue LTM Q3 ‘12 $401 Million Adjusted EBITDA LTM Q3 ‘121 29,750 Employees in the United States 12 Inpatient Rehab Facilities (IRF) 7 Consolidated - 545 beds 5 Non-consolidated - 264 beds 4 managed units Facilities in 5 states 513 Contract Therapy locations in 30 states and the District of Columbia Note: Statistics as of September 30, 2012 Select Medical Today Specialty Hospitals Segment Outpatient Rehabilitation Segment 1 See slide 37 for non-GAAP reconciliation |
|
|
2012 Accomplishments Strong results YTD September Revenue growth of 5.8% Adjusted EPS growth of 33.9% (excludes loss on debt and tax effect in 2011 and 2012) Acquired two rehab hospitals in the Baylor joint venture Completed $275M debt refinancing in Q3 Special Cash Dividend of $1.50/share paid Dec. 12, 2012 |
|
|
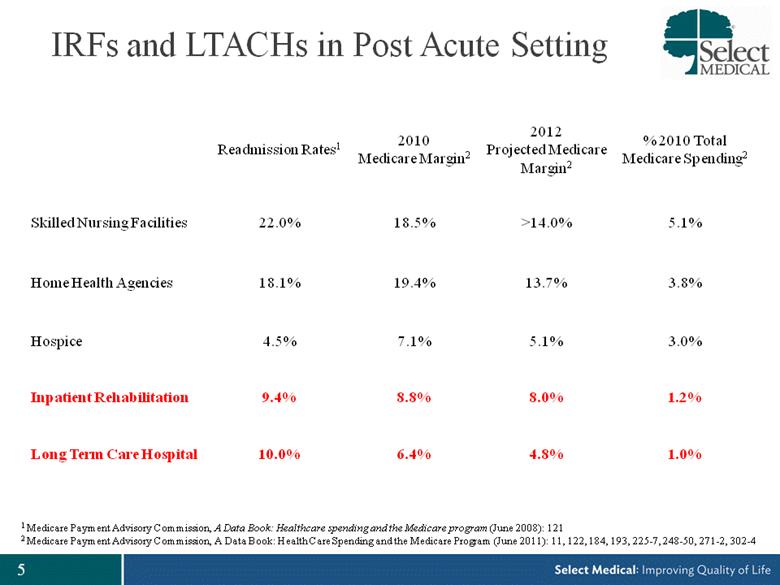
IRFs and LTACHs in Post Acute Setting Readmission Rates1 2010 Medicare Margin2 2012 Projected Medicare Margin2 % 2010 Total Medicare Spending2 Skilled Nursing Facilities 22.0% 18.5% >14.0% 5.1% Home Health Agencies 18.1% 19.4% 13.7% 3.8% Hospice 4.5% 7.1% 5.1% 3.0% Inpatient Rehabilitation 9.4% 8.8% 8.0% 1.2% Long Term Care Hospital 10.0% 6.4% 4.8% 1.0% 1 Medicare Payment Advisory Commission, A Data Book: Healthcare spending and the Medicare program (June 2008): 121 2 Medicare Payment Advisory Commission, A Data Book: Health Care Spending and the Medicare Program (June 2011): 11, 122, 184, 193, 225-7, 248-50, 271-2, 302-4 |
|
|
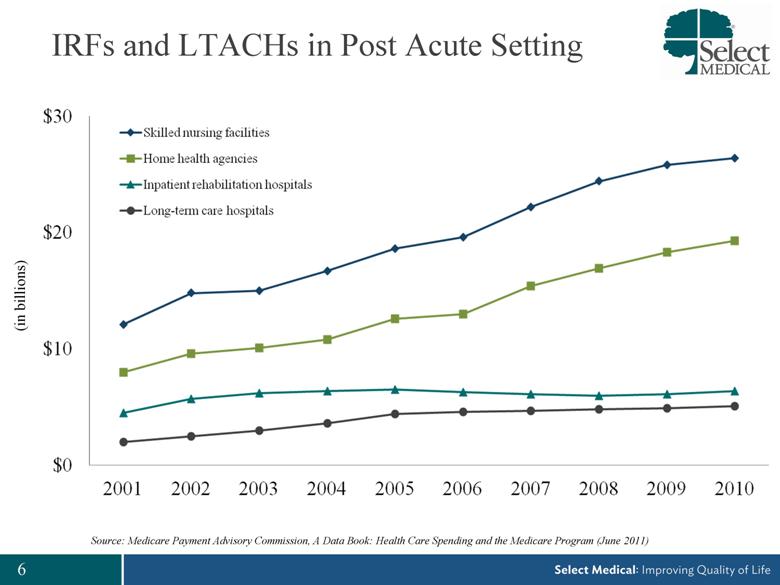
IRFs and LTACHs in Post Acute Setting Source: Medicare Payment Advisory Commission, A Data Book: Health Care Spending and the Medicare Program (June 2011) (in billions) |
|
|
Balanced Payor Mix Specialty Payor Mix Outpatient Payor Mix Overall Payor Mix 90% Commercial Payors and Other 10% Medicare/ Medicaid 64% Medicare/ Medicaid 36% Commercial Payors and Other Note: LTM September 30, 2012 58.5% 55.0% 50.3% 48.3% 49.0% 49.7% 51.5% 50.3% 41.5% 45.0% 49.7% 51.7% 51.0% 50.3% 48.5% 49.7% 2005 2006 2007 2008 2009 2010 2011 LTM Q3'12 Medicare/Medicaid Commercial Payors and Other |
|
|
DC 3 1 2 1 1 5 77 2 3 9 5 1 5 5 15 2 11 5 3 1 4 3 1 1 10 3 2 1 1 3 3 22 10 66 41 4 2 74 14 3 1 1 17 10 3 6 2 23 2 167 4 41 23 4 2 62 13 142 41 1 5 13 14 2 100 36 20 4 9 58 1 22 25 4 6 7 17 10 34 25 21 14 1 9 1 11 15 2 1 2 2 1 1 4 1 8 1 112 Significant Scale and Breadth LTACH 110 Owned Hospitals 1 Managed Hospital 28 States Inpatient Rehab 7 Consolidated 5 Non-consolidated 4 Managed Units 5 States Outpatient Rehab 858 Owned Clinics 39 Non-consol. Clinics 68 Managed Clinics 32 States and D.C. Contract Therapy 513 Locations 30 States and D.C. *As of September 30, 2012 |
|
|
Specialty Hospitals Long Term Acute Care |
|
|
LTACH Overview Major provider of LTACH services in U.S. 111 hospitals 79 are hospital-in-hospital (2,759 beds) 31 are freestanding (1,870 beds) 1 managed freestanding hospital Ownership of freestanding LTACHs 18 owned 13 leased |
|
|
Closed September 1, 2010 – Purchase Price $210.0M Regency 2009 Audit 2011 LTM Q3 ‘12 Net Revenue $ 375M $ 340M $ 345M Adjusted EBITDA $ 28M $ 46M $ 58M Adjusted EBITDA Margin 7.5% 13.5% 16.9% Purchase multiple EBITDA 7.5x 4.6x 3.6x Regency Acquisition (23 LTACHs) |
|
|
MMSEA 2007 – expired December 2012 CMS Final Rule FY 2013 Net Market Basket update of 1.7% Three Year Phase-In of BNA (1.266% per year) One year extension of 25% Rule at current levels Expiration of moratorium on new LTACHs at 12/29/12 Budget Sequestration cuts? LTACH Regulatory Environment |
|
|
Specialty Hospitals Inpatient Rehabilitation |
|
|
Wholly Owned Hospitals Kessler Institute (3 hospitals) – New Jersey West Gables Rehabilitation – Miami, FL Consolidated Joint Ventures Penn State Hershey Rehabilitation – Hershey, PA SSM Rehabilitation (2 hospitals and 1 managed unit) – St. Louis, MO Non-Consolidating Joint Ventures Baylor Institute of Rehabilitation (4 hospitals and 3 managed units) – Dallas, TX Select Rehabilitation – Denton, TX Rehabilitation Hospitals |
|
|
Rehabilitation Overview Founded in 1948 Largest licensed rehab hospital in U.S. (three campuses) 20 consecutive years U.S. News & World Report best hospital One of eight rehabilitation centers in U.S. to have Model System designation for both traumatic brain injury and spinal cord injury #1 Rehabilitation Institute of Chicago, Chicago, IL #2 Kessler Institute for Rehabilitation, West Orange, NJ #3 TIRR Memorial Hermann, Houston, TX #4 University of Washington Medical Center, Seattle, WA #5 Spaulding Rehabilitation Hospital, Boston, MA #6 Mayo Clinic, Rochester, MN #7 Craig Hospital, Englewood, CO #8 Rusk Institute, NYU Langone Medical Center, New York, NY #9 Moss Rehab-Albert Einstein, Elkins Park, PA #10 Shepherd Center, Atlanta, GA Kessler Overview U.S. News & World Report Best Rehabilitation Hospital Rankings 2012-2013 |
|
|
Rehab JV Overview 2 inpatient hospitals 1 managed inpatient rehab unit 33 outpatient locations 15 contract therapy locations 3 occupational health clinics 3 day institute clinics 4 inpatient hospitals 3 managed inpatient rehab units 37 outpatient locations 1 contract therapy location 54 bed rehab hospital |
|
|
Inpatient Rehab Regulatory Environment CMS Final Rule FY 2013 Net Market basket increase of 1.9% Budget Sequestration cuts? |
|
|
Outpatient Rehabilitation Outpatient Rehab Clinics |
|
|
Outpatient Rehab Clinics Outpatient Rehab Facilities (Number of Facilities) ≃ 965 Source: Company public filings and websites as of September 30, 2012. 26 183 423 700 |
|
|
Outpatient Rehab—Philadelphia/South Jersey 123 locations |
|
|
Outpatient Rehab—North Jersey 84 locations |
|
|
Outpatient Rehab—St. Louis, MO 39 locations |
|
|
Outpatient Rehab—Dallas/Ft. Worth 37 locations |
|
|
Outpatient Rehabilitation Contract Therapy |
|
|
Contract Services 513 contracts in 30 states and the District of Columbia LTM Q3 ‘12 Net Revenue of $192.9M Organic growth only |
|
|
Outpatient Rehab Regulatory Environment Commercial - Stable Medicare MPPR changes to therapy payments (effective April 2013) 25% reductions increased to 50% reductions to practice expense component for 2nd and subsequent codes Contract Therapy rates |
|
|
Minority Investments Haven Health Inpatient Psychiatric hospital company Allevant Rural Hospital Management Services (Mayo Clinic JV) Amplion Alarm alert technology company naviHealth Post acute managed care company U.S. Physiatry Physician practice management company |
|
|
Financial Overview |

|
|
$2,390 $2,240 $2,153 Note: In Millions CAGR 8.5% CAGR 11.1% $307 $330 $270 Net Revenue Adjusted EBITDA $2,805 $386 Net Revenue and Adjusted EBITDA Trends $2,926 $401 2008 2009 2010 2011 LTM Q3 '12 Specialty Outpatient Other 2008 2009 2010 2011 LTM Q3 '12 Specialty Outpatient |
|
|
Key Financial Metrics Pricing and Volume Trends Specialty Hospital Revenue per Patient Day1 / Admissions Outpatient Rehab Revenue per Visit2 / Visits (Admissions in Thousands) (Visits in Thousands) 1 Net revenue per patient day is calculated by dividing specialty hospital direct patient service revenues by the total number of patient days 2 Net revenue per visit is calculated by dividing outpatient rehabilitation clinic revenue by the total number of visits. For purposes of this computation, outpatient rehabilitation clinic revenue does not include managed clinic or contract services revenue $102 $102 $101 $103 $103 4,534 4,502 4,567 4,470 4,536 40 60 80 100 120 140 2008 2009 2010 2011 LTM Q3 '12 $1,444 $1,495 $1,474 $1,497 $1,522 41 43 46 55 55 2008 2009 2010 2011 LTM Q3 '12 |

|
|
Annual Capital Expenditures ($ in millions) 2008 2009 2010 2011 LTM Q3 '12 Maintenance Development $52 $46 $57 $58 $59 |
|
|
Free Cash Flow Free Cash Flow1 ($ in millions) Note: Free Cash Flow calculated as Net Cash Provided by Operating Activities less Purchases of Property and Equipment Intense Focus on Free Cash Flow Generation 1 See slide 37 for non-GAAP reconciliation $51 $108 $93 $171 $208 2008 2009 2010 2011 LTM Q3 '12 |
|
|
As of 12/31/08 As of 12/31/09 As of 12/31/10 As of 12/31/11 As of 9/30/12 Cash and Equivalents $ 64 $ 84 $ 4 $ 12 $ 50 Revolving Credit Facility ($300mm) 150 0 25 40 0 Term Loan B 657 483 482 838 1,099 Other Debt 5 6 6 5 6 Total Senior Debt 811 489 513 883 1,105 Sr. Sub. Notes due 2015 658 612 612 345 70 Total Op. Co. Debt $ 1,469 $ 1,101 $ 1,125 $ 1,228 $ 1,175 Op. Co. Net Debt / Adjusted EBITDA1 5.2x 3.1x 3.7x 3.2x 2.8x Sr. Floating Rate Notes due 2015 (Hold Co.) 175 167 167 167 167 Sr. Sub. Notes due 2015 (Hold Co.) 136 137 139 0 0 Total Debt $ 1,780 $ 1,405 $ 1,431 $ 1,395 $ 1,342 Total Net Debt / Adjusted EBITDA1 6.4x 4.0x 4.6x 3.6x 3.2x 1 See slide 37 for non-GAAP reconciliation ($ in millions) Capitalization Details |
|
|
2013 Financial Guidance Net Revenue $ 2,950M - $ 3,050M Adjusted EBITDA $ 400M - $ 415M EPS, Adjusted $ 0.98 - $ 1.04 |
|
|
Questions |

|
|
Appendix: Additional Materials |
|
|
Non-GAAP Reconciliation 2008 2009 2010 2011 YTD ’11 YTD ’12 LTM Q3 ‘12 Net Income $ 25 $ 79 $ 82 $ 113 $ 75 $ 112 $ 150 (+) Income tax 26 37 42 71 57 72 86 (+/-) Equity in losses/(earnings) of unconsolidated subsidiaries - - 1 (3) (1) (6) (8) (+/-) Other expense / (income) - 1 (1) - - - - (+) Interest expense, net 146 132 112 99 75 72 96 (-/+) (Gain) / Loss on debt retirement (1) (13) - 31 31 6 6 (+) Depreciation and Amortization 72 71 69 71 52 47 66 (+) Stock Based Compensation 2 23 2 4 3 4 5 Adjusted EBITDA $ 270 $ 330 $ 307 $ 386 $ 292 $ 307 $ 401 Net Cash Provided by Operating Activities $ 107 $ 166 $ 145 $ 217 $ 144 $ 194 $ 267 (-) Purchase of Property and Equipment 56 58 52 46 32 45 59 Free Cash Flow $ 51 $ 108 $ 93 $ 171 $ 112 $ 149 $ 208 ($ in millions) |
|
|
[LOGO] |