Attached files
| file | filename |
|---|---|
| EX-99.2 - TRANSCRIPT OF THE PRESENTATION - TIDEWATER INC | d407780dex992.htm |
| 8-K - FORM 8-K - TIDEWATER INC | d407780d8k.htm |
 Quinn P. Fanning
Executive Vice President and CFO
BARCLAYS CAPITAL 2012
BARCLAYS CAPITAL 2012
CEO ENERGY-POWER CONFERENCE
CEO ENERGY-POWER CONFERENCE
Joseph M. Bennett
Executive Vice President and
Chief Investor Relations Officer
Jeffrey M. Platt
President and CEO
Exhibit 99.1
September 6, 2012
September 6, 2012 |
 2
2
Phone:
504.568.1010
•
Fax:
504.566.4580
In accordance with the safe harbor provisions of the Private Securities Litigation
Reform Act of 1995, the Company notes that certain statements set forth in this
presentation provide other than historical information and are forward looking. The
actual achievement of any forecasted results, or the unfolding of future economic or
business developments in a way anticipated or projected by the Company, involve
numerous risks and uncertainties that may cause the Company’s actual performance
to be materially different from that stated or implied in the forward-looking
statement. Among those risks and uncertainties, many of which are beyond the
control of the Company, include, without limitation, volatility in worldwide energy
demand and oil and gas prices; fleet additions by competitors and industry
overcapacity; changes in capital spending in the energy industry for offshore
exploration, field development and production; changing customer demands for
vessel specifications, which may make some of our older vessels technologically
obsolete for certain customer projects or in certain markets; uncertainty of global
financial market conditions and difficulty in accessing credit or capital; acts of
terrorism and piracy; significant weather conditions; unsettled political conditions,
war, civil unrest and governmental actions, such as expropriation, especially in
higher political risk countries where we operate; foreign currency fluctuations; labor
changes proposed by international conventions; increased regulatory burdens and
oversight; and enforcement of laws related to the environment, labor and foreign
corrupt practices. Readers should consider all of these risk factors as well as other
information contained in this report.
•
Email:connect@tdw.com
Web:www.tdw.com
FORWARD-LOOKING STATEMENTS |
 3
•
Culture of safety & operating excellence
•
“The Tide is Turning”–
improved working rig count is
positively impacting deepwater and jackup support
vessels globally
•
History of earnings growth and solid returns
•
Unmatched scale and scope of operations
•
World’s largest and newest fleet provides basis for
continued earnings growth
•
Strong balance sheet allows us to continue to act upon
available opportunities
KEY TAKEAWAYS |
 0.00
0.10
0.20
0.30
0.40
0.50
0.60
0.70
0.80
2002
2003
2004
2005
2006
2007
2008
2009
2010
2011
CALENDAR YEARS
TOTAL RECORDABLE INCIDENT RATES
TIDEWATER
DOW CHEMICAL
CHEVRON
EXXON/MOBIL
SAFETY RECORD RIVALS
LEADING COMPANIES
4 |
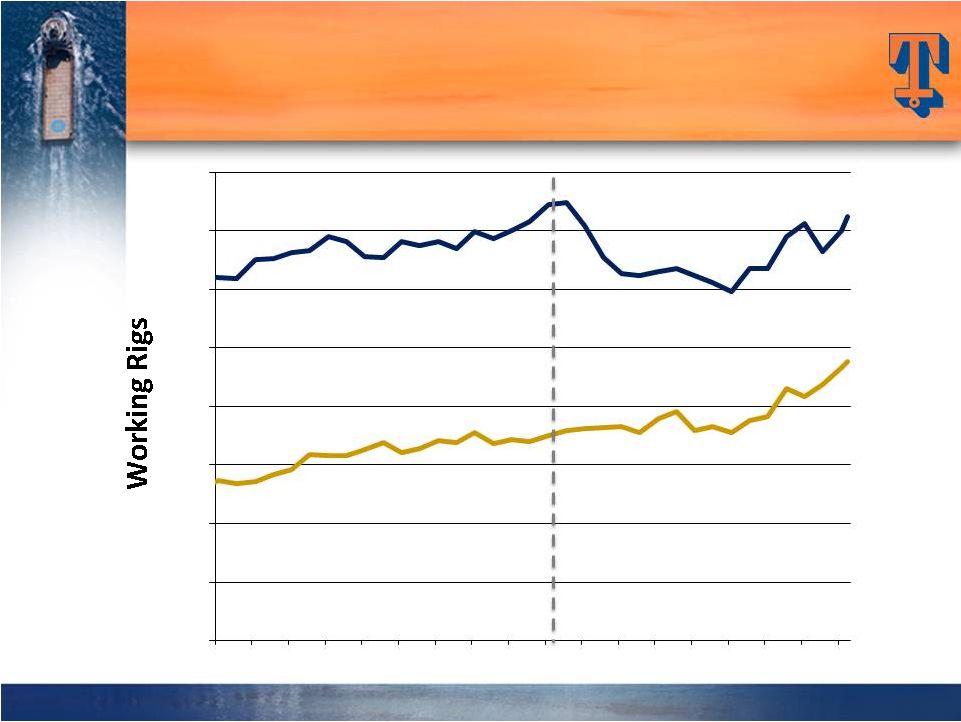 5
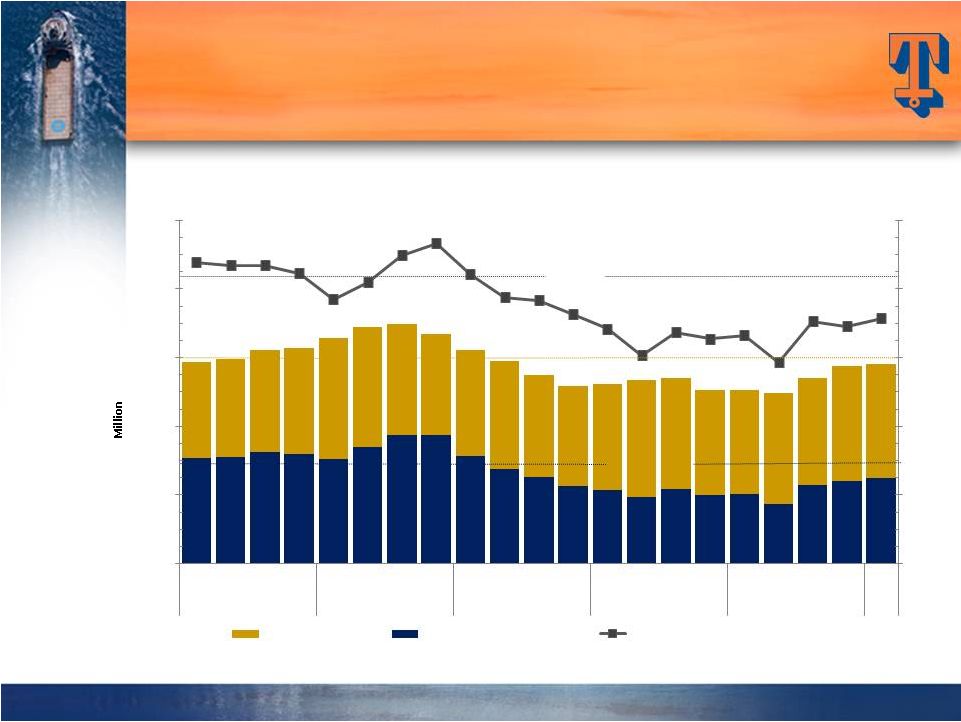
WORKING OFFSHORE RIG TRENDS
Floaters
Jackups
Prior peak (summer 2008)
Source: ODS-Petrodata
0
50
100
150
200
250
300
350
400
1/04
7/04
1/05
7/05
1/06
7/06
1/07
7/07
1/08
7/08
1/09
7/09
1/10
7/10
1/11
7/11
1/12
7/12
5 |
 6
Source: ODS-Petrodata and Tidewater
July 2008
(Peak)
Jan. 2011
(Trough)
August
2012
Working Rigs
603
538
649
Rigs Under
Construction
186
118
188
OSV Global
Population
2,033
2,599
2,788
OSV’s Under
Construction
736
367
428
OSV/Rig Ratio
3.37
4.83
4.30
DRIVERS OF OUR BUSINESS
“Peak to Present”
6 |
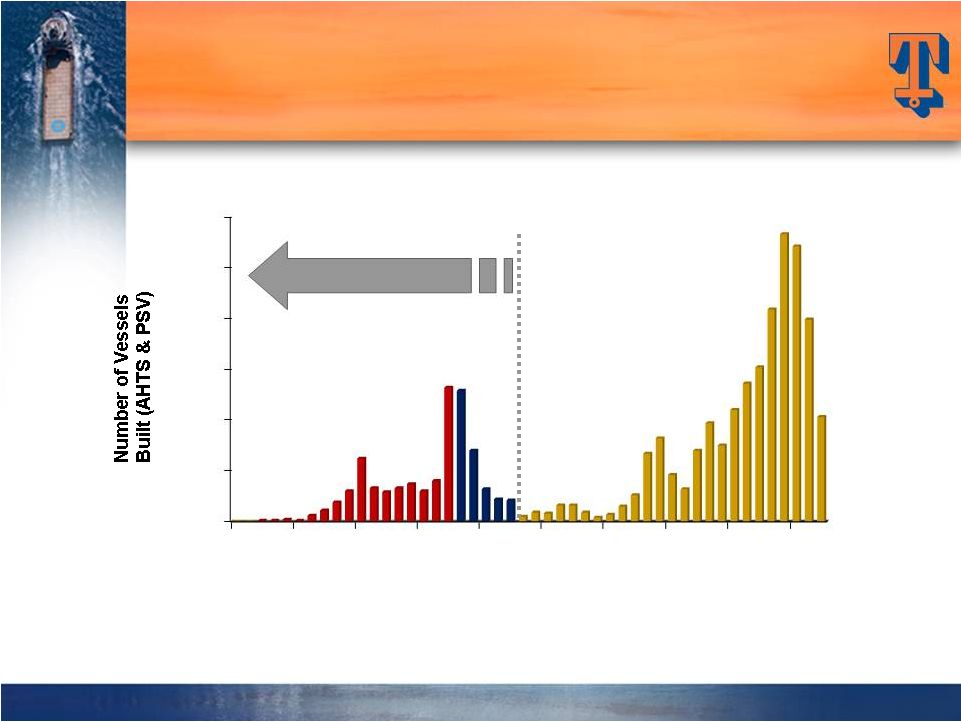 7
Source: ODS-Petrodata and Tidewater
As of August 2012, there are approximately 428 additional AHTS and
PSV’s (~15% of the global fleet) under construction.
Vessels > 25 years old today
0
50
100
150
200
250
300
1965
1970
1975
1980
1985
1990
1995
2000
2005
2010
7
THE WORLDWIDE OSV FLEET –
RETIREMENTS
EXPECTED TO EXCEED NEW DELIVERIES
(Includes AHTS and PSV’s only) Estimated as of August 2012
Global fleet estimated at 2,788 vessels, including 467 vessels
that are 30+
yrs
old
(17%),
and
another
274
vessels
that
are
25-29
yrs
old
(10%) |
 8
Source: ODS-Petrodata and Tidewater
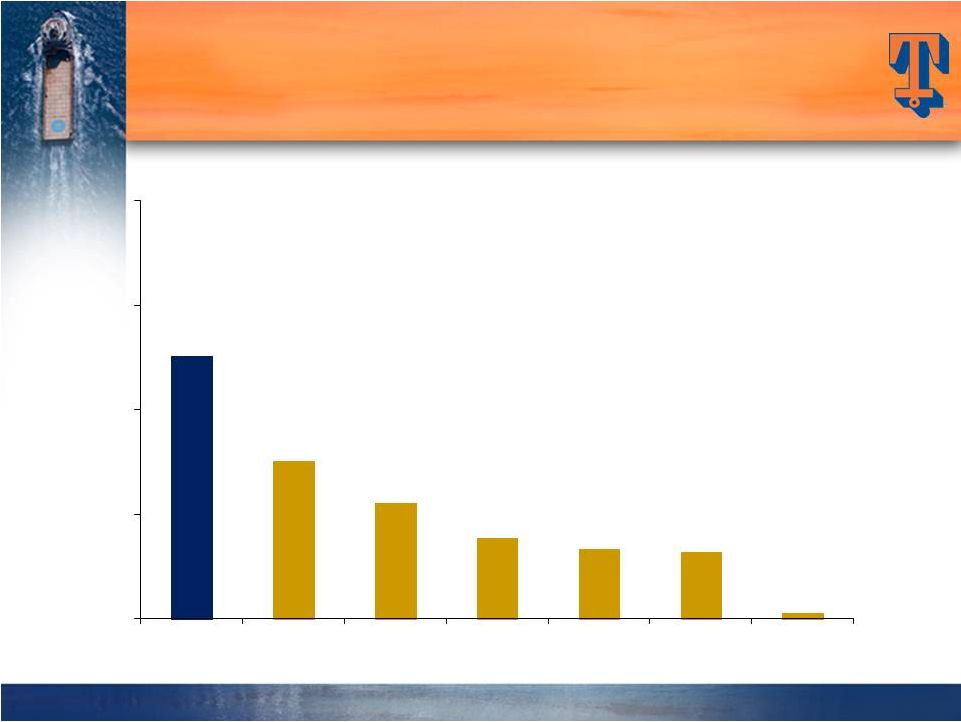
Tidewater
Competitor #2
Competitor #3
Competitor #4
Competitor # 5
Competitor #1
Avg.
All Others (2,066 total
vessels for
350+ owners)
Tidewater
AHTS
and
PSV
fleet
includes
168
vessel
additions
since
2000
252
151
111
77
67
64
5
0
100
200
300
400
8
VESSEL POPULATION BY OWNER
(AHTS
and
PSV’s
only)
–
Estimated
as
of
August
2012 |
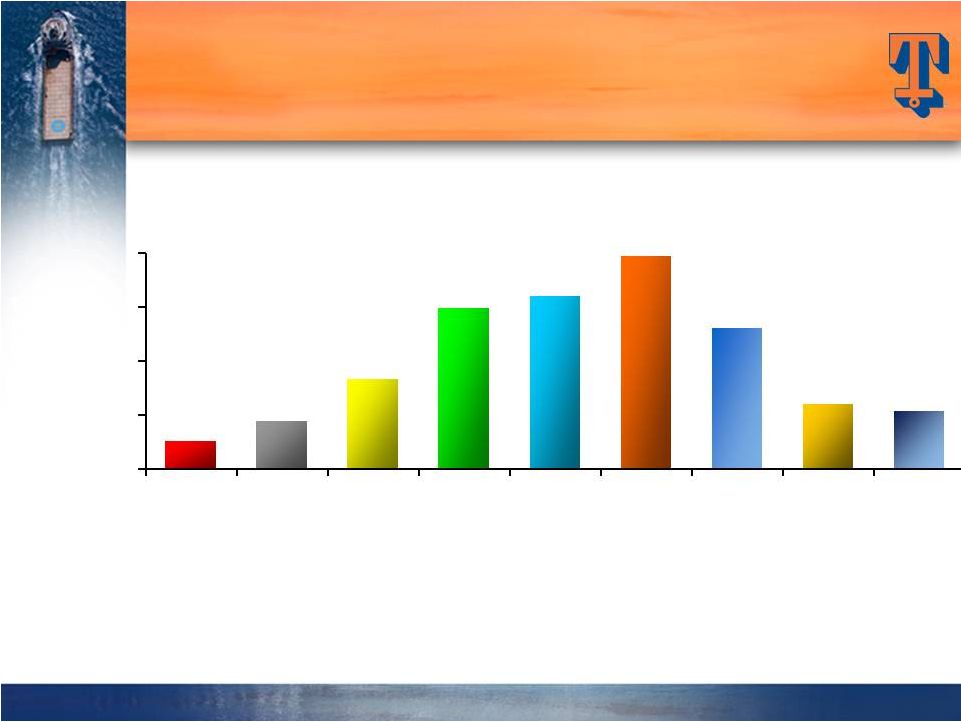 9
**
EPS in Fiscal 2004 is exclusive of the $.30 per share after tax impairment charge.
EPS in Fiscal 2006 is exclusive of the $.74 per share after tax gain from the
sale of six KMAR vessels. EPS in Fiscal 2007 is exclusive of $.37 per share of after
tax gains from the sale of 14 offshore tugs. EPS in Fiscal 2010 is
exclusive of $.66 per share Venezuelan provision, a $.70 per share tax benefit
related to favorable resolution of tax litigation and a $0.22 per share charge for
the proposed settlement with the SEC of the company’s FCPA matter. EPS in Fiscal
2011 is exclusive of total $0.21 per share charges for settlements with DOJ
and Government of Nigeria for FCPA matters, a $0.08 per share charge related to participation in a multi-company U.K.-based pension plan and a $0.06
per share impairment charge related to certain vessels. EPS in Fiscal 2012 is
exclusive of $0.43 per share goodwill impairment charge. Adjusted Return
On Avg. Equity
4.3% 7.2% 12.4%
18.9%
18.3%
19.5%
11.4% 5.0%
4.3%
HISTORY OF EARNINGS GROWTH
AND SOLID THROUGH-CYCLE RETURNS
$1.03
$1.78
$3.33
$5.94
$6.39
$7.89
$5.20
$2.40
$2.13
$0.00
$2.00
$4.00
$6.00
$8.00
Fiscal
2004
Fiscal
2005
Fiscal
2006
Fiscal
2007
Fiscal
2008
Fiscal
2009
Fiscal
2010
Fiscal
2011
Fiscal
2012
9
Adjusted EPS**
Adjusted EPS** |
 10
GLOBAL STRENGTH
Unique global footprint; 50+ years of Int’l experience
Unmatched scale and scope of operations
Strength of International business compliments U.S.
activity
Secular growth
Longer contracts
Better utilization
Higher day rates
Solid customer base of NOC’s and IOC’s
10 |
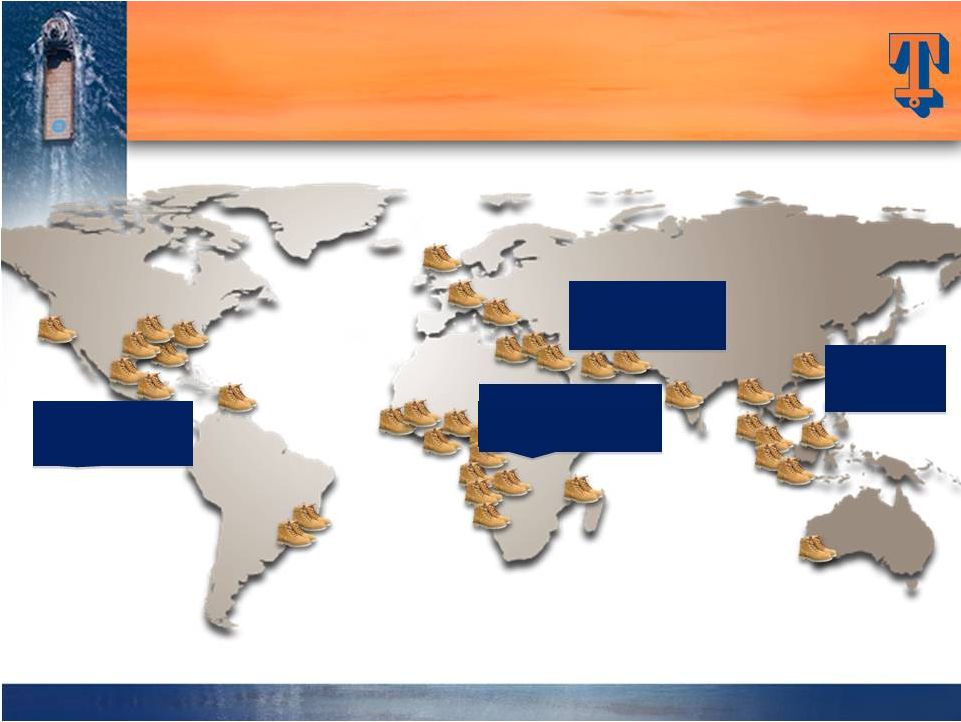 Americas
63(24%)
SS Africa/Europe
129(50%)
MENA
35(14%)
Asia/Pac
31(12%)
OUR GLOBAL FOOTPRINT
OUR GLOBAL FOOTPRINT
Vessel Distribution by Region
Vessel Distribution by Region
(excludes stacked vessels –
(excludes stacked vessels –
as of 6/30/12)
as of 6/30/12)
11
In 1Q FY 2013, ~6% of vessels/revenue was generated in U.S. GOM; however, 36 total
active U.S.-flagged vessels provide good optionality to a recovery in the U.S. GOM. |
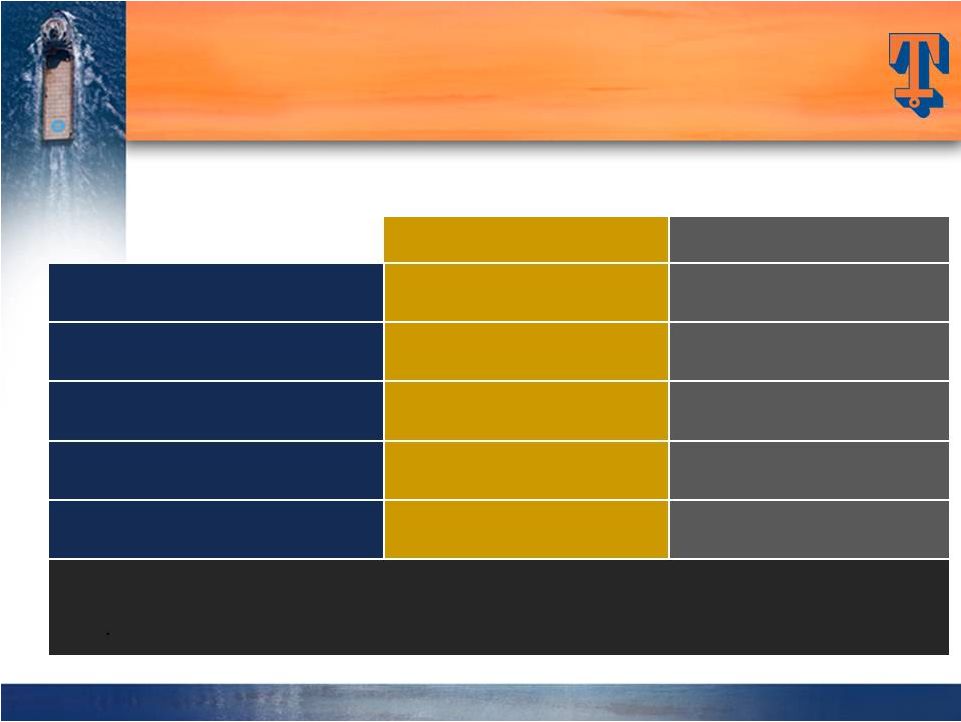 12
At 6/30/12, 218 new vessels were in our fleet with ~5.7 year average age
(1)
$3,709m (90%) funded through 6/30/12
THE LARGEST MODERN OSV FLEET
THE LARGEST MODERN OSV FLEET
IN THE INDUSTRY….
IN THE INDUSTRY….
(2)
Includes one Deepwater PSV, 6 Deepwater AHTS and 16 Other vessels disposed of
subsequent to acquiring the vessels.
12
Vessel Commitments
Jan. ’00 –
June ‘12
Vessel Count
Estimated Cost
Deepwater
PSVs
77
$1,835m
Deepwater
AHTSs
17
$497m
Towing Supply/Supply
102
$1,489m
Other
71
$301m
TOTALS:
267
(2)
$4,122m
(1) |
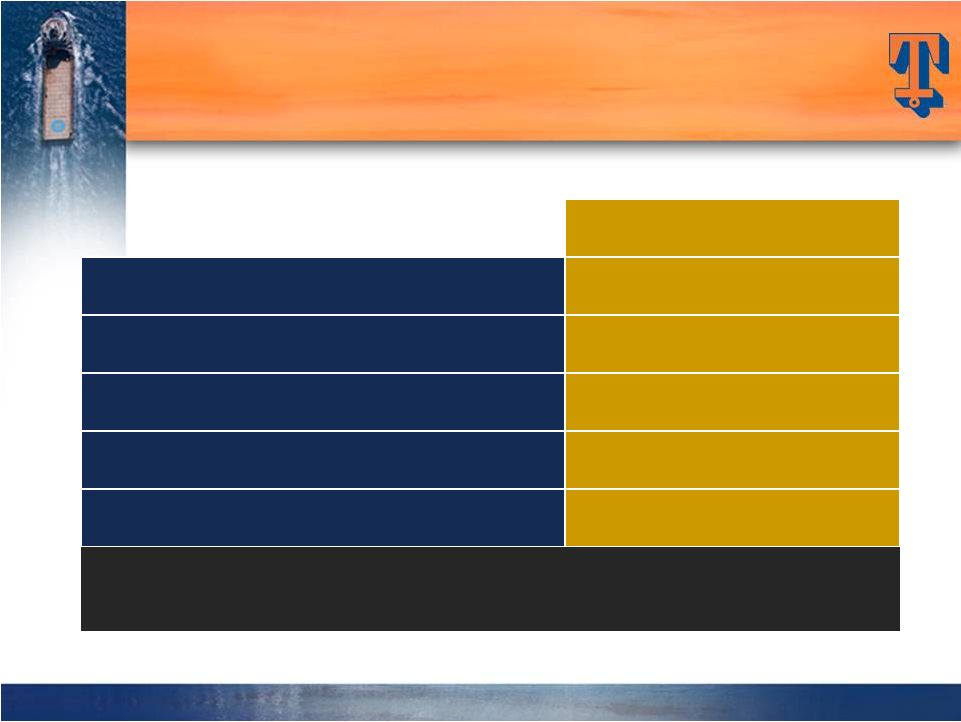 13
Count
Deepwater PSVs
20
Deepwater AHTSs
-
Towing Supply/Supply
1
Other
5
Total
26
Vessels Under Construction*
As
of
June
30,
2012
* Includes
2
new
vessel
purchase
commitments
at
6/30/12
CAPX of $173m remaining in FY ‘13, $103m in FY ‘14 and $137m in FY
’15. …. AND MORE TO COME
…. AND MORE TO COME
13
Estimated delivery schedule – 10 remaining in FY ‘13, 10 in FY ‘14 and 2
thereafter. |
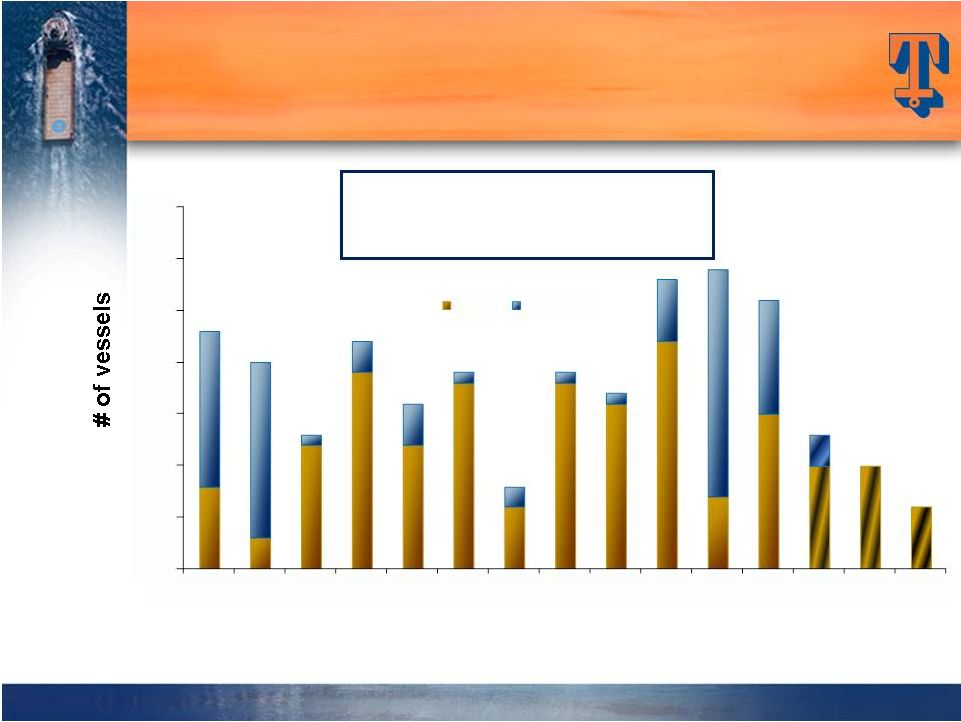 Fiscal Year
Actual vessel deliveries through 6/30/12; estimated vessel deliveries based on
commitments to build or acquire as of 6/30/12
THROUGH-CYCLE, EVA-BASED INVESTMENT;
THROUGH-CYCLE, EVA-BASED INVESTMENT;
BALANCE BETWEEN “BUY”
BALANCE BETWEEN “BUY”
and “BUILD”
and “BUILD”
Through 6/30/12, vessel
commitments include 267 vessels
with a capital cost of $4.1 billion
14
0
5
10
15
20
25
30
35
2001
2002
2003
2004
2005
2006
2007
2008
2009
2010
2011
2012
2013
2014
2015
Built
Acquired |
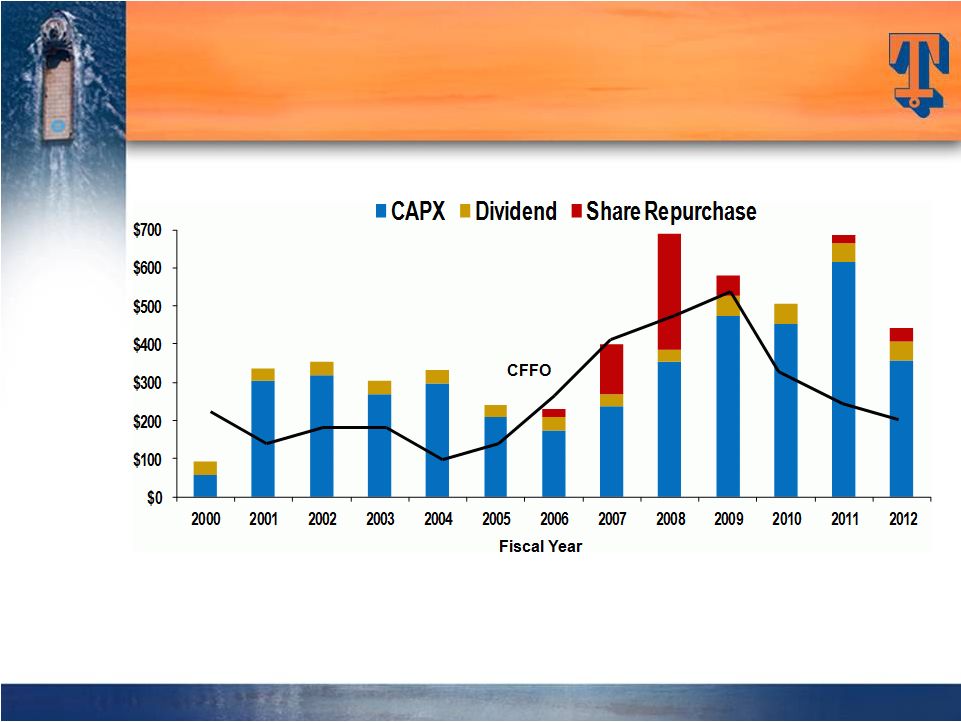 15
Over
a
13-year
period,
Tidewater
has
invested
$4.1
billion
in
CapEx($3.6
billion
in
the
“new”
fleet),
and paid out ~$1 billion through dividends and share repurchases. Over the
same period, CFFO and proceeds from dispositions were $3.6 billion and $732
million, respectively FLEET RENEWAL & EXPANSION
FLEET RENEWAL & EXPANSION
FUNDED BY CFFO THROUGH FISCAL 2012
FUNDED BY CFFO THROUGH FISCAL 2012
15
$ in millions |
 16
As of June 30, 2012
Cash & Cash Equivalents
$241 million
Total Debt
$950 million
Shareholders Equity
$2,486 million
Net Debt / Net Capitalization
22%
Total Debt / Capitalization
28%
~$700 million of available liquidity as of 6/30/12, including $450 million of unused
capacity under committed bank credit facilities.
STRONG FINANCIAL POSITION PROVIDES
STRONG FINANCIAL POSITION PROVIDES
STRATEGIC OPTIONALITY
STRATEGIC OPTIONALITY
16 |
 17
Total Revenue and Margin
Total Revenue and Margin
Fiscal 2008 -
Fiscal 2008 -
2013
2013
Prior peak period (FY2009)
averaged quarterly revenue of
$339M, quarter
Prior peak period (FY2009)
averaged quarterly revenue of
$339M,
operating
margin
of
$174M
at
51.3%
Note:
Vessel
operating
margin
is
defined
as
vessel
revenue
less
vessel
operating
expenses
52.7%
46.2%
55.9%
46.0%
36.3%
39.3%
35.1%
42.9%
$
$100
$200
$300
$400
$500
Q1
Q2
Q3
Q4
Q1
Q2
Q3
Q4
Q1
Q2
Q3
Q4
Q1
Q2
Q3
Q4
Q1
Q2
Q3
Q4
Q1
FY08
FY09
FY10
FY11
FY12
FY13
Vessel Revenue ($)
Vessel Operating Margin ($)
Vessel Operating Margin (%)
$300 million
$150 million
50.0%
17 |
 18
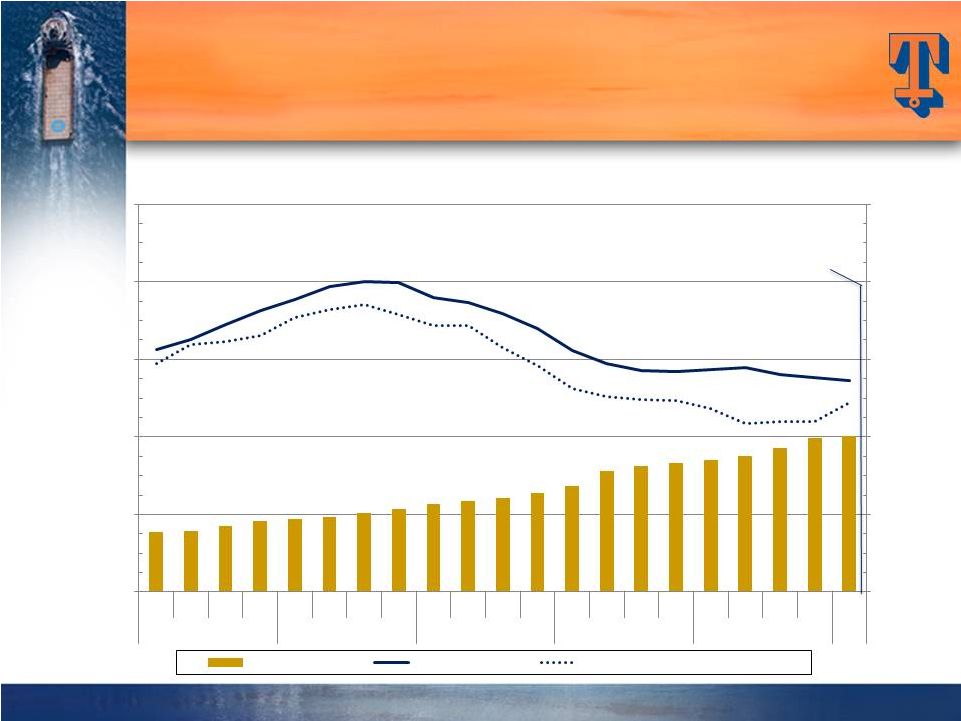
New Vessel Trends by Vessel Type
Deepwater PSVs
$104 million, or 36%, of Vessel Revenue in Q1 Fiscal 2013
22
23
24
25
25
25
25
27
29
32
34
38
40
43
44
45
47
49
51
54
55
40
80
120
160
200
240
$0
$10,000
$20,000
$30,000
$40,000
$50,000
$60,000
Q1
Q2
Q3
Q4
Q1
Q2
Q3
Q4
Q1
Q2
Q3
Q4
Q1
Q2
Q3
Q4
Q1
Q2
Q3
Q4
Q1
FY08
FY09
FY10
FY11
FY12
FY13
Average Day Rate, Adjusted Average Day Rate, and Average Fleet Size
Average Fleet Size
Average Day Rate
Utilization-Adjusted Average Day Rate
Q1 Fiscal 2013
Avg Day Rate: $24,062
Utilization: 85.9%
-
18 |
 19
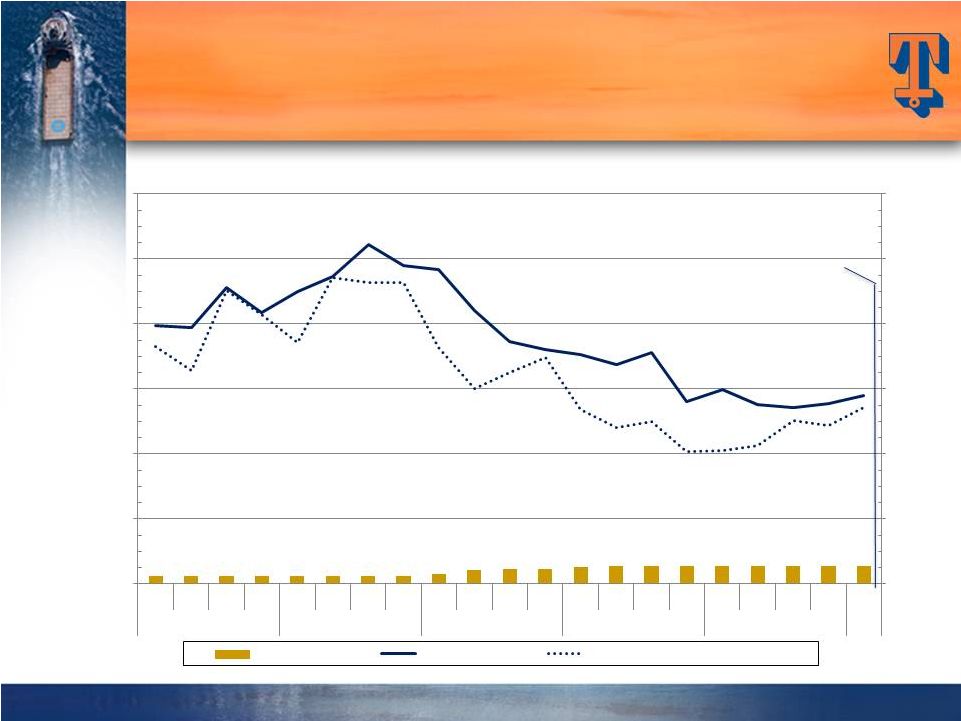
New Vessel Trends by Vessel Type
New Vessel Trends by Vessel Type
Deepwater AHTS
Deepwater AHTS
$27 million, or 9%, of Vessel Revenue in Q1 Fiscal 2013
Q1 Fiscal 2013
Avg Day Rate: $28,908
Utilization: 93.7%
5
5
5
5
5
5
5
5
6
8
9
9
11
11
11
11
11
11
11
11
11
-
40
80
120
160
200
240
$0
$10,000
$20,000
$30,000
$40,000
$50,000
$60,000
Q1
Q2
Q3
Q4
Q1
Q2
Q3
Q4
Q1
Q2
Q3
Q4
Q1
Q2
Q3
Q4
Q1
Q2
Q3
Q4
Q1
FY08
FY09
FY10
FY11
FY12
FY13
Average Day Rate, Adjusted Average Day Rate, and Average Fleet Size
Average Fleet Size
Average Day Rate
Utilization-Adjusted Average Day Rate
19 |
 20
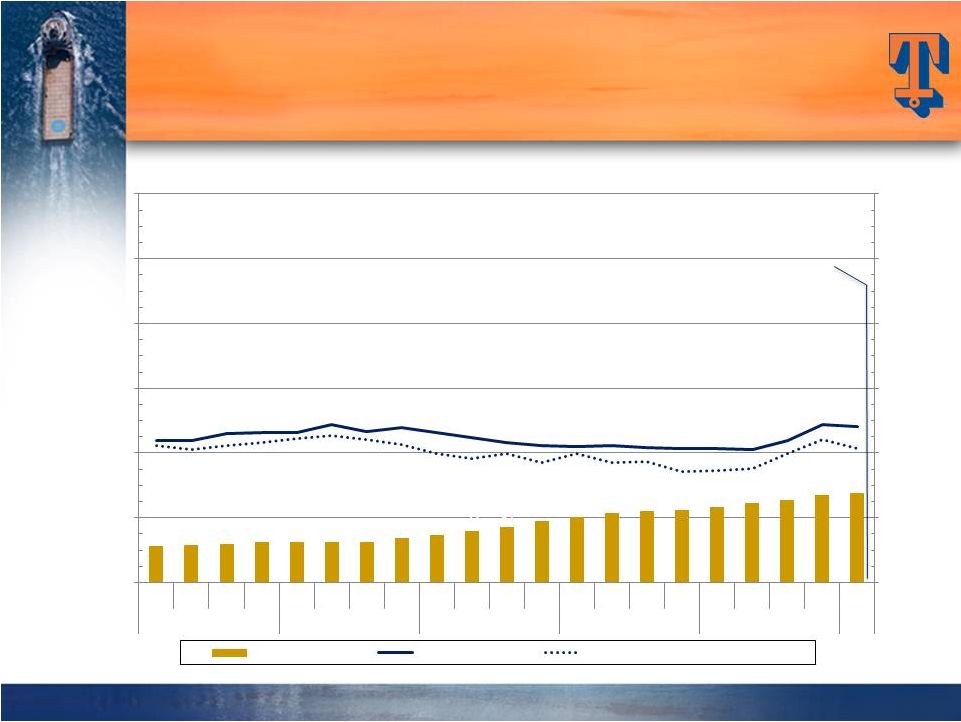
New Vessel Trends by Vessel Type
New Vessel Trends by Vessel Type
Towing Supply/Supply Vessels
Towing Supply/Supply Vessels
$112 million, or 39%, of Vessel Revenue in Q1 Fiscal 2013
Q1 Fiscal 2013
Avg Day Rate: $13,663
Utilization: 89.3%
39
40
43
46
47
49
51
53
57
59
61
63
68
78
81
83
85
88
93
99
101
-
50
100
150
200
250
$0
$5,000
$10,000
$15,000
$20,000
$25,000
Q1
Q2
Q3
Q4
Q1
Q2
Q3
Q4
Q1
Q2
Q3
Q4
Q1
Q2
Q3
Q4
Q1
Q2
Q3
Q4
Q1
FY08
FY09
FY10
FY11
FY12
FY13
Average Day Rate, Adjusted Average Day Rate, and Average Fleet Size
Average Fleet Size
Average Day Rate
Utilization-Adjusted Average Day Rate |
 21
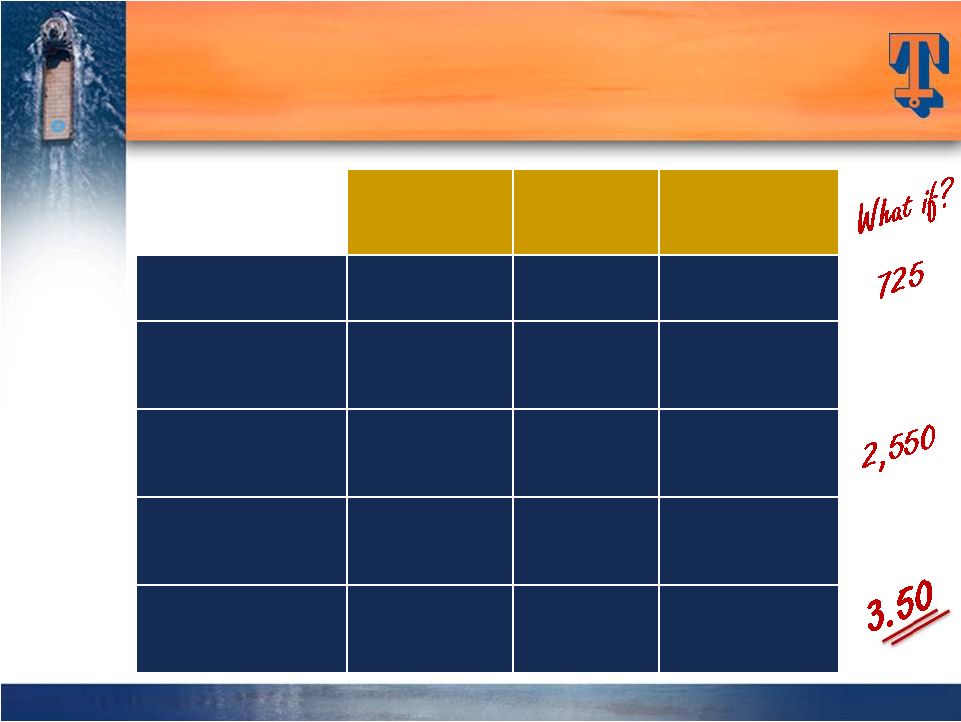
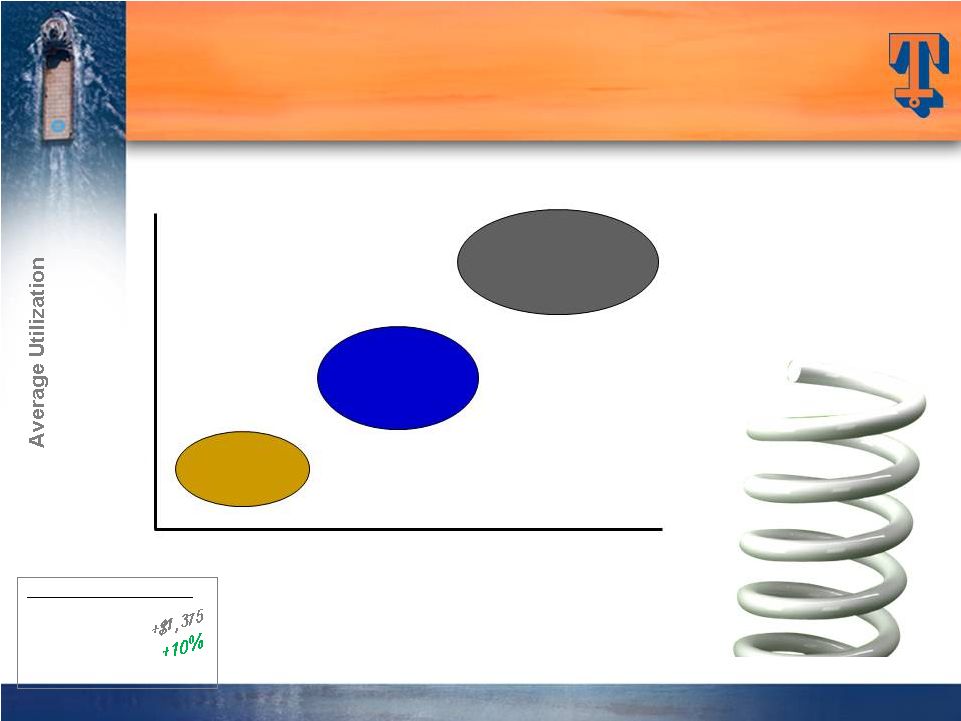
POTENTIAL FOR FUTURE
POTENTIAL FOR FUTURE
EARNINGS ACCELERATION
EARNINGS ACCELERATION
Average Day rates
$15,466*
$17,013
(+ 10%)
$18,714
(+ 10%)
86.2%*
86.2%
90.0%
264
vessel
assumption
(218
current
new
vessels
+
26
under
construction
+
20
additional
new
vessels
next
year).
* 6/30/12 quarterly actual stats
This info is not meant to be a
prediction of future earnings
performance, but simply an
indication of earning sensitivities
resulting from future fleet
additions and reductions and
varying operating assumptions
Actual Avg Qtrly Day rates
6/30/11 $14,091
6/30/12 $15,466
21
~$400M+
EBITDA
+$525M
EBITDA
~$9.00
EPS
+$725M
EBITDA
~$5.50
EPS
~$3.50
EPS |
 Quinn P. Fanning
Executive Vice President and CFO
BARCLAYS CAPITAL 2012
BARCLAYS CAPITAL 2012
CEO ENERGY-POWER CONFERENCE
CEO ENERGY-POWER CONFERENCE
Joseph M. Bennett
Executive Vice President and
Chief Investor Relations Officer
Jeffrey M. Platt
President and CEO
September 6, 2012
September 6, 2012 |
 APPENDIX
23 |
 24
$ in Millions, Except Per Share Data
RECENT FINANCIAL RESULTS
RECENT FINANCIAL RESULTS
REFLECT A TURNING TIDE
REFLECT A TURNING TIDE
24
Quarter Ended
6/30/12
6/30/11
Revenues
$294
$255
Net Earnings
$33
$25
EPS
$0.65
$0.48
Net Cash from Operations
$69
$27
Capital Expenditures
$77
$70 |
 25
Vessel Revenue ($)
Average Fleet Count
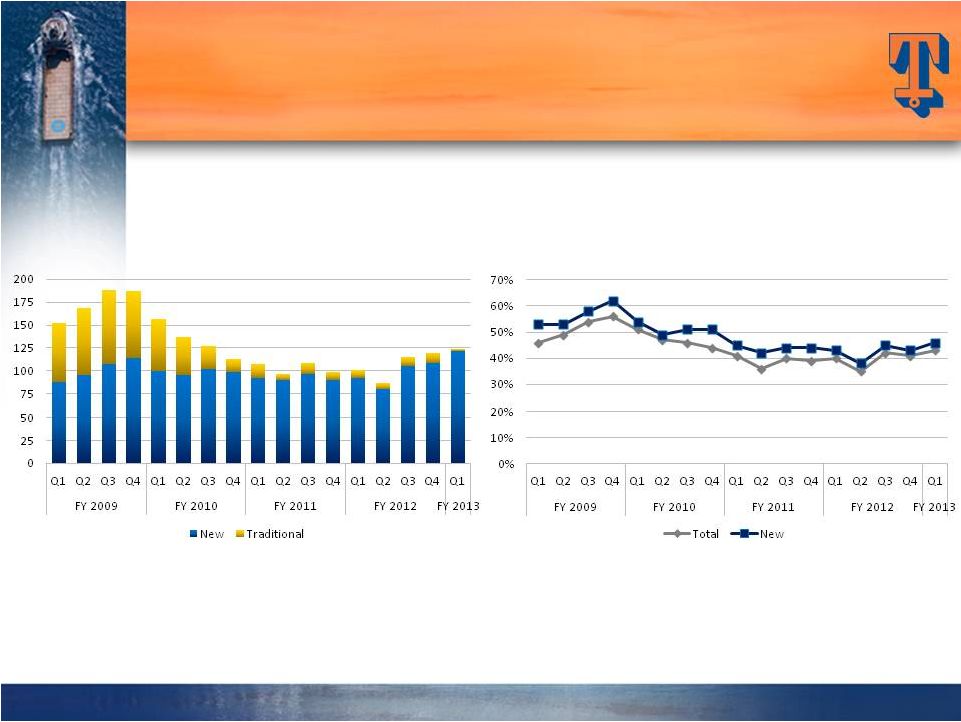
NEW FLEET DRIVING RESULTS
NEW FLEET DRIVING RESULTS
217
Average
New
Vessels
in
Q1
2013
$290
million
Vessel
Revenue
in
Q1
2013
(91% from New Vessels)
25
0
50
100
150
200
250
300
350
400
450
Q1
Q2
Q3
Q4
Q1
Q2
Q3
Q4
Q1
Q2
Q3
Q4
Q1
Q2
Q3
Q4
Q1
FY 2009
FY 2010
FY 2011
FY 2012
FY 2013
New
Traditional
Stacked
0
50
100
150
200
250
300
350
400
450
Q1
Q2
Q3
Q4
Q1
Q2
Q3
Q4
Q1
Q2
Q3
Q4
Q1
Q2
Q3
Q4
Q1
FY 2009
FY 2010
FY 2011
FY 2012
FY 2013
New
Traditional |
 26
Vessel Cash Operating Margin ($)
Vessel Cash Operating Margin (%)
CYCLICAL UPTURN
CYCLICAL UPTURN
SHOULD DRIVE MARGIN EXPANSION
SHOULD DRIVE MARGIN EXPANSION
$124
million
Vessel
Margin
in
Q1
FY2013 (98% from New Vessels)
Q1
FY2013
Vessel
Margin:
43%
26 |
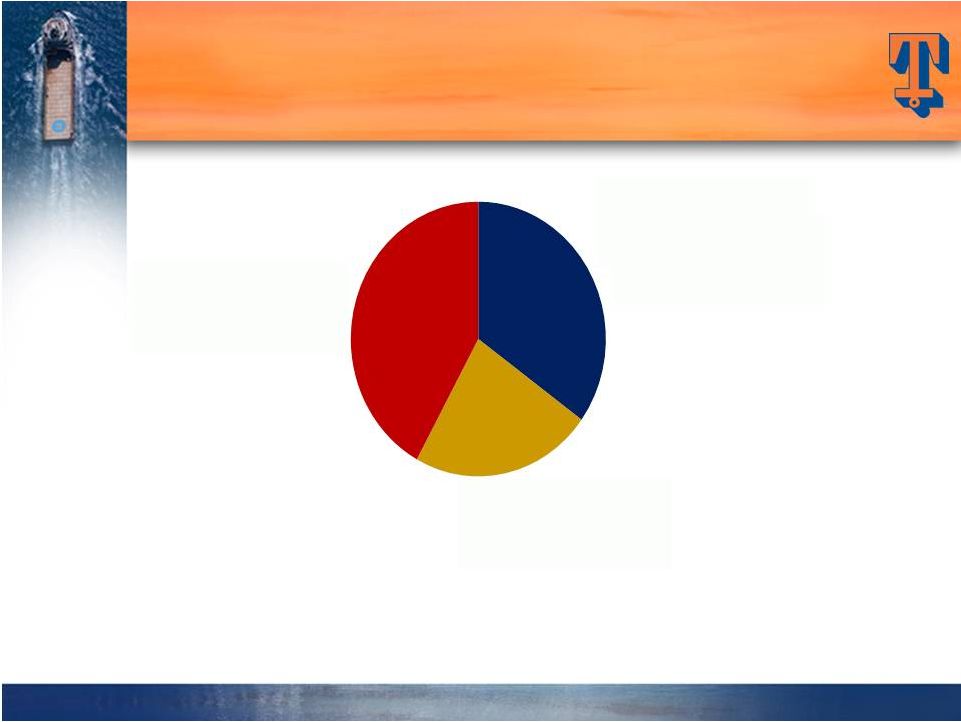 CURRENT REVENUE MIX
Quality of Customer Base
Quality of Customer Base
Our top 10 customers in Fiscal 2012 (4 Super Majors,
3 NOC’s and 3 IOC’s) accounted for 59% of our revenue
27
Super Majors
35%
NOC's
23%
Others
42% |
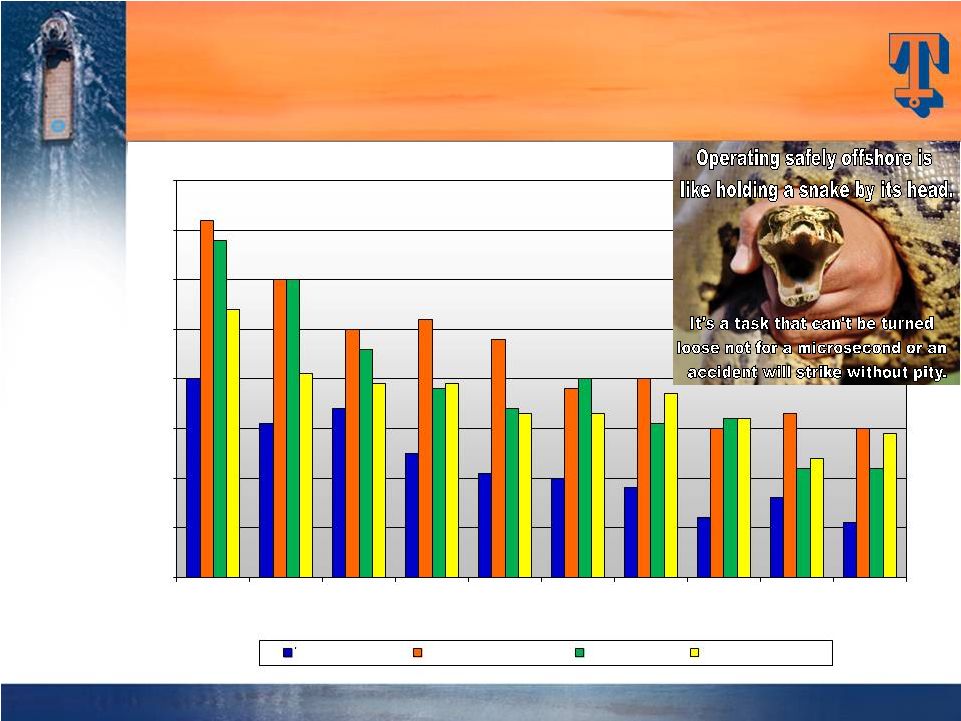
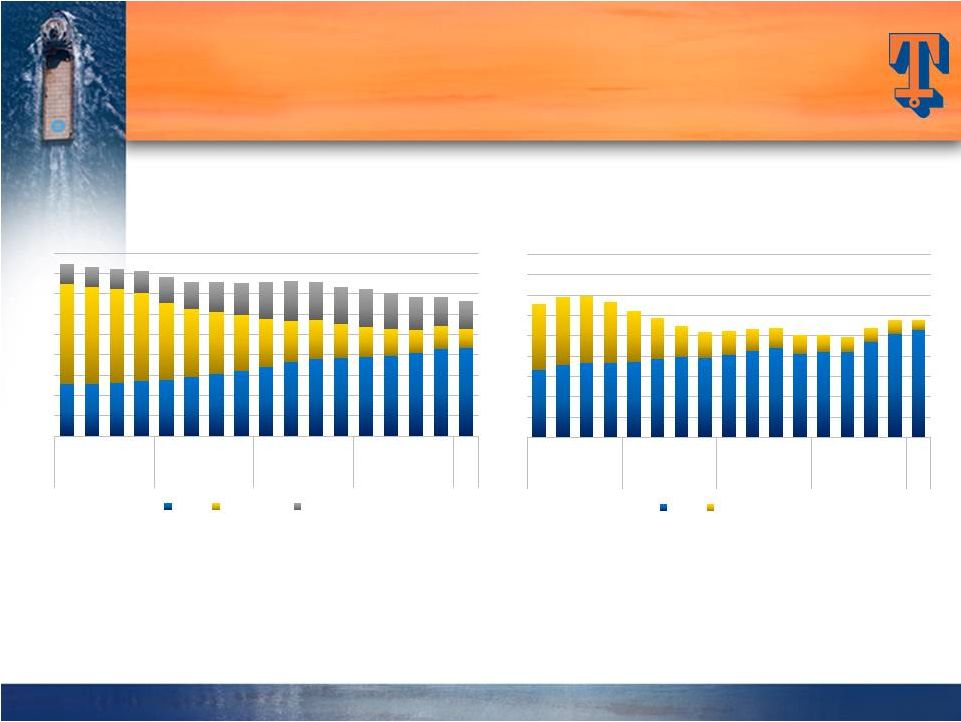
 Other Operators
Top 10 Customers
75
285
128
Other Operators
Top 10 customers
114
Tidewater’s top 10 customers contract ~21% of the working worldwide
jackup fleet and ~53% of the working worldwide floater fleet
Floater Rigs
(242 Working Rigs)
Source: ODS-Petrodata and Tidewater
RIGS CONTRACTED BY OUR
RIGS CONTRACTED BY OUR
TOP 10 CUSTOMERS
TOP 10 CUSTOMERS
(Estimated as of August 2012)
(Estimated as of August 2012)
Jackups
(360 Working Rigs)
28 |
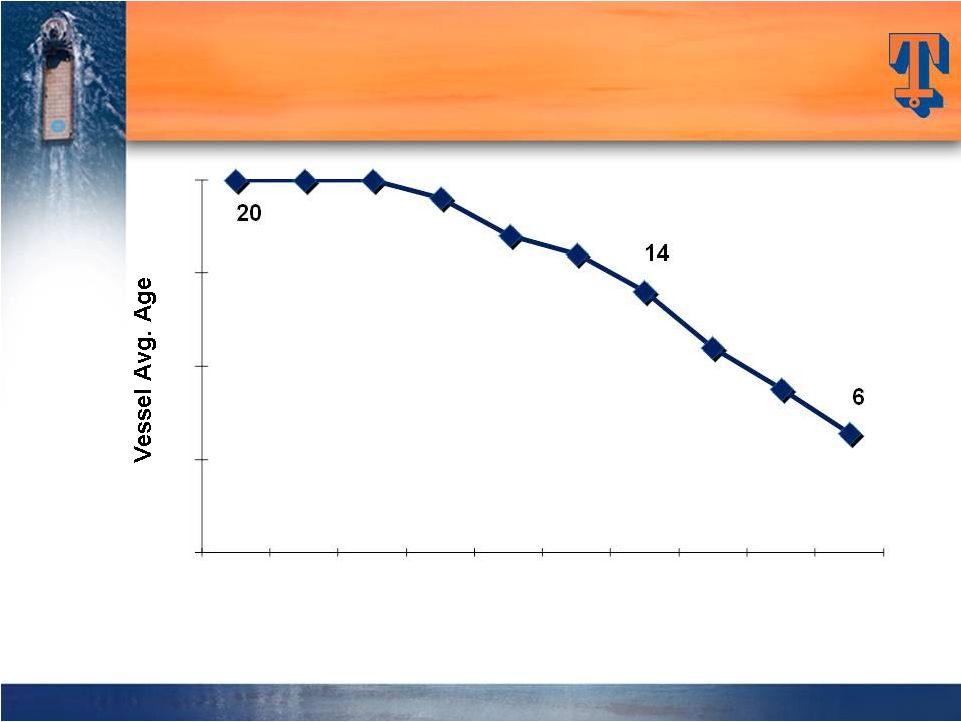 29
SIGNIFICANT AVERAGE
SIGNIFICANT AVERAGE
AGE IMPROVEMENT
AGE IMPROVEMENT
Assumptions: 1)
Average
45
vessel
disposals
per
year
in
future
(versus
an
average
of
50+
vessel
dispositions
per
year
over
last
3
years).
2)
Includes
26
vessels
under
construction
(based
on
current
estimated
delivery
schedule),
plus
additional
newbuilds/acquisitions
of
~20
vessels
per
year
(approximately
$500
million
in
new
capital
commitments
per
year).
Tidewater is not committed to spending $500 million annually, but we use this
assumption in estimating average fleet age in the future.
29
0
5
10
15
20
3/31/06
3/31/07
3/31/08
12/31/08
12/31/09
12/31/10
12/31/11
12/31/12
12/31/13
12/31/14 |
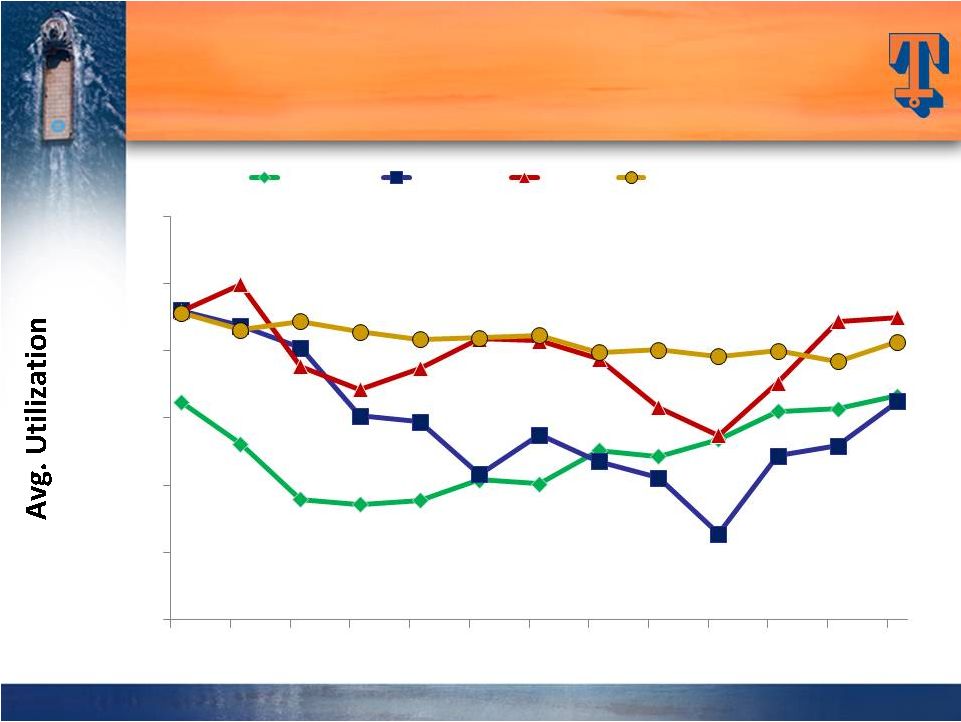 30
VESSEL UTILIZATION BY SEGMENT
VESSEL UTILIZATION BY SEGMENT
30%
40%
50%
60%
70%
80%
90%
6/09
9/09
12/09
3/10
6/10
9/10
12/10
3/11
6/11
9/11
12/11
3/12
6/12
Americas
Asia/Pac
MENA
Sub Sah Africa
30 |
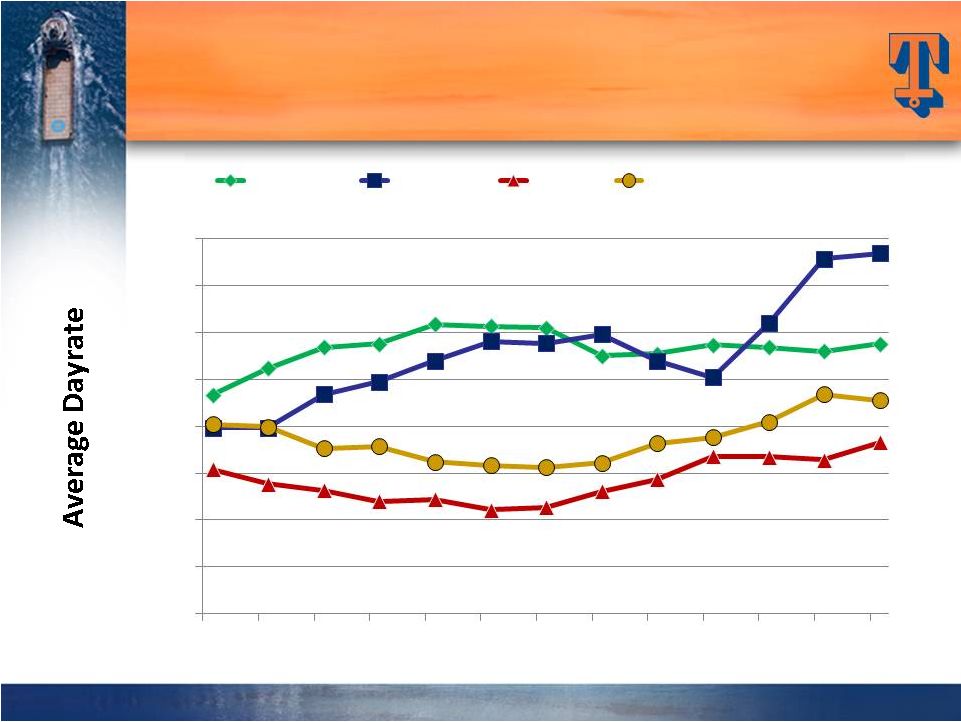 31
VESSEL DAYRATES BY SEGMENT
VESSEL DAYRATES BY SEGMENT
31
$4,000
$6,000
$8,000
$10,000
$12,000
$14,000
$16,000
$18,000
$20,000
6/09
9/09
12/09
3/10
6/10
9/10
12/10
3/11
6/11
9/11
12/11
3/12
6/12
Americas
Asia/Pac
MENA
Sub Sah Africa |
 FINANCIAL STRATEGY FOCUSED
ON CREATING LONG-TERM
ON CREATING LONG-TERM
SHAREHOLDER VALUE
SHAREHOLDER VALUE
Maintain
Maintain
Financial Strength
Financial Strength
EVA-Based Investments
EVA-Based Investments
On Through-cycle Basis
On Through-cycle Basis
Deliver Results
Deliver Results
32 |