Attached files
| file | filename |
|---|---|
| 8-K - FORM 8-K - INDEPENDENT BANK CORP | d406431d8k.htm |
 September 5, 2012
Christopher Oddleifson
President & Chief Executive Officer
Denis K. Sheahan
Chief Financial Officer
Exhibit 99.1 |
 •
Main Sub:
Rockland Trust
•
Market:
Eastern Massachusetts
•
Loans:
$4.0 B
•
Deposits:
$4.1 B
•
$AUA:
$2.0 B
•
Market Cap:
$0.6 M
•
NASDAQ:
INDB
Who We Are
2 |
 •
Strong fundamentals driving solid performance
•
Robust growth from new and existing customers
•
Expanding footprint into attractive markets
•
Aggressively promoting brand and new products
•
Investing for growth in high priority businesses
•
Disciplined risk management culture
•
Strong tangible and regulatory capital
Key Messages
3 |
 Company Footprint*
4
Source: SNL Financial; Deposit/Market Share data as of June 30, 2011 including
pending transactions. (Includes Credit Unions) * Proforma to include the
pending acquisition of Central Bancorp. % of INDB Dep.
Rank
2011
1
16.7%
42%
Rank
2011
7
3.6%
17%
Rank
2011
4
10.2%
15%
Rank
2011
9
5.2%
13%
Rank
2011
23
1.0%
12%
Rank
2011
44
0.3%
1%
Barnstable County (Cape Cod)
Market Share
Plymouth County
Bristol County
Worcester County
Middlesex County
Norfolk County
78 Branches*
Commercial Lending
and Investment
Management Center |
 •
Excellent loan and core deposit growth
•
Expanded breadth and depth of commercial franchise
•
Households grew by 7% in 1H12
•
Investment Management growth: Rev.
8% in 1H12
•
All capital ratios and TBV rose in past 12 months
•
Fitch upgrade and affirming of long-term issuer rating
•
New Market Tax Credits Award
(4 time)
•
Multiple 3 party recognition of excellence
Recent
Accomplishments
5
th
rd |
 Strong Fundamentals
Driving Performance
6
•
Excellent loan growth
•
Core dep. up to 84%
•
Growing wealth mgmt.
•
Solid asset quality vs. peers
•
Strong capital
•
Core ROA near 1%
Diluted EPS
$1.43
$1.90
$2.12 $1.02 $0.99
+13%
+44%
* Loan fraud amounting to $4.0 million pre-tax
23.8
Operating Earnings
($ Mil.) |
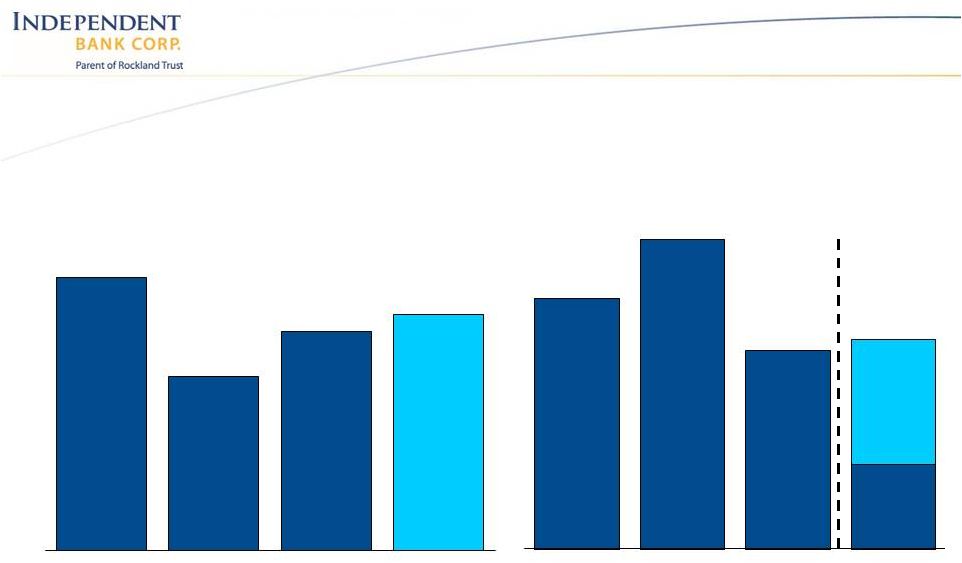
 Robust Core Business Generation
($ Mil.)
7
+11% CAGR
+8% CAGR
6/12 vs.
6/11
6/12 vs.
3/12
7%
13% annualized
23%
22% annualized
Comm’l Loan
$ Bal.
Home Equity
$ Bal.
Comm’l Loan Originations
Consumer Loan Originations
(Resi’s & Home Eq.) |
 Strong Commercial and
Industrial Loan Growth
($
Bal.-mil.)
8
Yr. end
+27.0% CAGR
(24.6% ex acquisitions)
Adding High Quality Corporate Customers |
 Attractive Balance Sheet Profile
(2Q12)
Very Focused On Containing Deposit Costs Shift
Towards Higher Yielding Assets TOTAL DEPOSITS
$4.1 B
AVG. COST: 0.28%
EARNING ASSETS
$4.7 B
Sec./ST Inv.
14%
Resi Mtges
9%
Home Eq
17%
Other
1%
Comm'l Loans
59%
Demand
Deposits
26%
Money
Market
20%
Savings/Now
38%
CD's
16% |
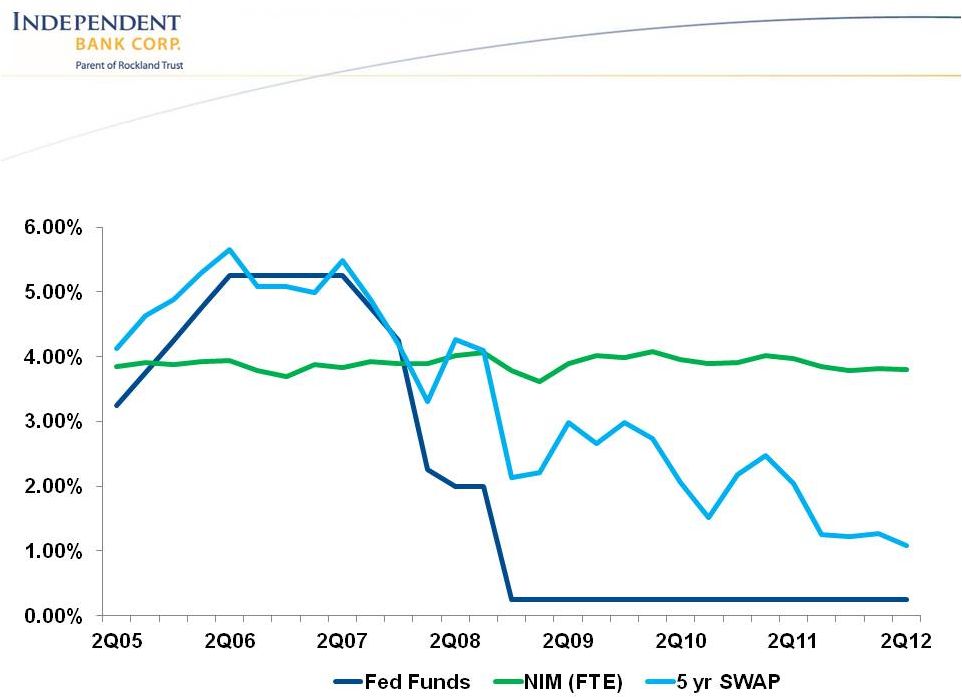 Net Interest Margin
Fairly steady over various rate cycles
Current low rate environment adding pressure
10 |
 Investment Management –
High Priority Growth Business
11
•
Growing source of fee revenues
•
Strong feeder business from bank
•
Expanded investment offerings
•
Professionally managed
$ mil.
2006
2Q12
Assets
under
Admin.
816
$
+
145%
2,001
$
Revenues
6.1
$
+
121%
13.5
$
(2011)
7.4
$
(1H12) |
 Asset Quality –
Well Managed
NPL/Loan %
1.07%
0.65%
0.76% 0.79% Peers
3.31%* Loss Rate
38bp
43bp
26bp 52bp
Peers 69bp*
Yr. end
* Source: FFIEC Peer Group 2; $3-10 Billion in Assets, March 31, 2012
Incl. 90 days + overdue
10.0
36.2
23.1
29.0
31.3
2009
2010
2011
2Q12
NPL’s
($
Mil.)
12.0
14.8
9.5
4.0
customer
fraud
6.0
2009
2010
2011
1H12
Net Chargeoffs
($
Mil.) |
 Strong Loan Loss Reserves
13
Reflects Ben
Franklin loans
acquired at FV
0.00%
0.20%
0.40%
0.60%
0.80%
1.00%
1.20%
1.40%
1.60%
Reserves/Loans
Net Chargeoffs/Avg.
Loans (annualized)
Reserves a Healthy Multiple of Loss Rate |
 Strong Capital
14
(1)
Includes tax deductibility of certain goodwill
•
Strong internal capital generation
•
No external capital raising
•
No dividend cuts
(Year end)
Tier 1 Leverage %
Tangible Common %
(1)
Tangible Book Value
(1) |
 Attentive to Shareholder Returns
15
Cash Dividends Per Share |
 Business Opportunities
•
Expanded Commercial Presence
(Providence, Waltham)
•
Asset-Based Lending
•
Marketing
•
Mobile Banking
•
Image ATMs
Investing for Future Growth
16 |
 Sustaining Business Momentum
17
Business Line
Focal Points
•
Expand Market Presence
•
Grow C&I Client Base
•
Expand Specialty Products, e.g. ABL
•
Continue to Drive Household Growth
•
Expand Electronic Banking Platform
•
Optimize Branch Network
•
Capitalize on Strong Market Demographics
•
Target COI Opportunity
•
Continue Strong Branch/Commercial Referrals
•
Continue Aggressive H.E. Marketing
Commercial
Retail Delivery
Investment Management
Home Equity |
 Rockland Trust is the #1 ranked
New England bank in Customer
Satisfaction!
18 |
 •
Attractive financial return
–
Highly accretive to earnings: +7% in 2013
–
IRR of 15.4%
–
Modest dilution to TBV and TCE/TA with short earn-back period
•
Significantly increases footprint in eastern Middlesex County, a
natural market extension with attractive demographics
–
Part
of
the
Boston
MSA
–
the
10
th
largest
MSA
by
population
in
the
U.S.
1
–
Largest population of any county in New England (~1.5 million) and third
highest
median
household
income
(~$78K)
1
•
Introduction of INDB operating model will provide:
–
Significant opportunity for improved efficiencies
–
Attractive platform for broader INDB product lines
Central Bancorp. (CEBK) Acquisition
Strategic Rationale
1
Source: SNL Financial
Source: SNL Financial; U.S. Bureau of Economic Analysis
19 |
 Investment
Management
Commercial
Banking
Retail/
Consumer
•
$2 Bil. AUA
•
Wealth/Institutional
•
Sophisticated Products
•
Expanded presence
•
Knowledgeable bankers
Central Bancorp. Customer Base
Capitalizing on Rockland Trust Brand
•
Top-rated customer
satisfaction
•
Electronic banking
•
Home equity
INDB
Winning
Businesses
–
Major
Opportunities
20 |
 Building Franchise Value
All Acquisitions Immediately Accretive
Deal Value: $40MM
12% Core Dep. Premium**
Fleet
Divest.
Aug ‘00
$336mm Deposits
$135mm Loans
16 Branches
Deal Value: $37MM
11% Core Dep. Premium**
Falmouth
Bancorp
Jul ‘04
$158mm Assets
$137mm Deposits
4 Branches
Deal Value: $105MM
17% Core Dep. Premium**
Slade’s Ferry
Bancorp
Mar ‘08
$610mm Assets
$409mm Deposits
9 Branches
Deal Value: $84.5MM
2% Core Dep. Premium**
Benjamin
Franklin Bancorp.
Apr ‘09
$998mm Assets
$653mm Deposits
11 Branches
Deal Value: $54.8MM
8% Core Dep. Premium**
Central
Bancorp.
4Q12*
$521mm Assets
$333mm Deposits
10 Branches
Disciplined Acquisitions
* Estimated closing
** Incl. CD’s <$100k |
 2012 Outlook –
Key Expectations
Loan Growth
+6 – 7%
Led by commercial and home equity
Deposits
+5 – 6%
Continued core deposit growth
Net Chargeoffs
$15 – 17 MM
Provision $16 – 18 MM
1H margin of 3.81%
Lower over 2H
Non-Interest Inc.
Flattish
Invest. mgmt.
, Mort. rev.
NIE
+ 2 – 3%
Selective growth investing
Tax Rate
27.5%
vs. 27% in 2010
Net Int. Margin
FY: Mid 3.70s%
22 |
 •
High quality franchise in attractive markets
•
Strong on-the-ground business volumes
•
Operating platform that can be leveraged further
•
Investing for growth in competitive strengths
•
Balance sheet equipped to deal with uncertainty
•
Grounded management team
•
Aligned
with
shareholders
–
insider
ownership
7%
•
Positioned to grow, build, and acquire to drive long-
term value creation
INDB –
Investment Merits
23 |
 NASDAQ Ticker: INDB
www.rocklandtrust.com
Denis Sheahan -
CFO
Shareholder Relations:
Jennifer Kingston (781) 878-6100
Statements contained in this presentation that are not historical facts are
“forward-looking statements”
that are subject to risks and uncertainties which could cause actual results to
differ materially from those currently anticipated due to a number of
factors, which include, but are not limited to, factors discussed in
documents filed by the Company with the Securities and Exchange Commission
from time to time. |
 Appendix |
 •
Central, founded in 1915, is a $521
million asset bank headquartered in
the affluent Middlesex County
suburb of Boston, MA
•
Central operates 10 branches
across Middlesex County with top 10
deposit market share in each city
¹
•
Stock symbol: CEBK
•
Financial Profile:
–
Loans: $421mm
–
Deposits: $333mm
–
Tang. Comm. Equity: $33mm
–
LTM Net Income: $1.0mm
–
Cost of Deposits: 0.52%
–
NIM: 3.35%
–
Efficiency Ratio: 89.6%
–
LTM Net Chargeoffs: 0.23%
–
NPAs / Assets: 1.88%²
Note: Financial data as of December 31, 2011 or as of three months ended December
31, 2011, annualized Central full service branches located in Somerville
(1), Woburn (2), Arlington (1), Melrose (1), Burlington (1), Chestnut Hill
(1), Medford (1), and Malden (1); limited service high school branch in
Woburn (1) Overview of Central Bancorp
INDB (67)
CEBK (10)
(1)
Source: SNL Financial
(2)
Management December 31, 2011 Financial Statements, excluding
TDR’s |
 •
7%
E.P.S.
accretive
in
2013,
7
–
8%
thereafter¹
•
IRR of 15.4%
•
5.8% TBV dilution and short earn-back period of 4.75 years
•
Strong pro forma capital levels at close with TCE / TA earn-back
period of 2.25 years
•
TCE / TA:
6.5%
•
Adjusted TCE / TA²:
•
Tier 1 Leverage:
8.0%
•
Tier 1 Capital:
10.4%
•
Total Risk Based Capital:
12.3%
Attractive Financial Transaction
(1)
Based on analyst consensus estimates
(2)
Pro
forma
to
include
the
tax
deductibility
of
goodwill
–
non-GAAP
measure
•
No additional capital raise
6.8% |
 Loan Mix
Note: GAAP financial data as of June 30, 2012
($ in thousands)
Commercial & Industrial
$705,433
17.7%
$780
0.2%
$706,213
15.8%
Multifamily & CRE
1,912,563
48.0%
154,090
31.4%
2,066,653
46.3%
1-4 Family Residential
389,053
9.8%
323,897
66.1%
712,950
15.9%
Consumer & Other
973,740
24.5%
11,065
2.3%
984,805
22.0%
Total Loans
$3,980,789
100.0%
$489,832
100.0%
$4,470,621
100.0%
MRQ Yield on Loans
INDB
Combined
Central
4.46%
4.52%
4.47% |
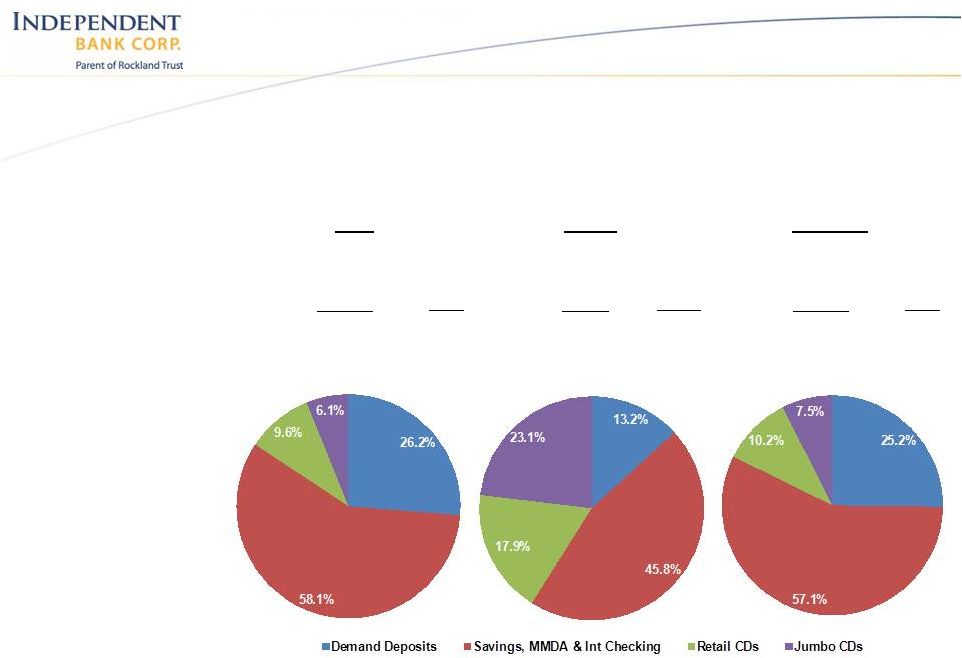 Deposit Mix
Note: GAAP financial data as of June 30, 2012
($ in thousands)
Demand Deposits
$1,070,279
26.2%
$47,039
13.2%
$1,117,318
25.2%
Savings, MMDA & Int Checking
2,368,319
58.1%
163,403
45.8%
2,531,722
57.1%
Retail CDs
390,242
9.6%
63,980
17.9%
454,222
10.2%
Jumbo CDs
249,293
6.1%
82,478
23.1%
331,771
7.5%
Total Deposits
$4,078,133
100.0%
$356,900
100.0%
$4,435,033
100.0%
MRQ Cost of deposits
0.27%
0.52%
0.29%
INDB
Central
Combined |