Attached files
| file | filename |
|---|---|
| 8-K - 8-K - BON TON STORES INC | a12-19764_18k.htm |
Exhibit 99.1
|
|
GOLDMAN SACHS Nineteenth Annual Global Retailing Conference September 2012 |
|
|
2 Safe Harbor Certain information included in this presentation contains statements that are forward-looking within the meaning of the Private Securities Litigation Reform Act of 1995. Such forward-looking statements, which may be identified by words such as “may,” “could,” “will,” “plan,” “expect,” “anticipate,” “estimate,” “project,” “intend” or other similar expressions, involve important risks and uncertainties that could significantly affect results in the future and, accordingly, such results may differ from those expressed in any forward-looking statements made by or on behalf of the Company. Factors that could cause such differences include, but are not limited to, risks related to retail businesses generally; a significant and prolonged deterioration of general economic conditions which could negatively impact the Company, including the potential write-down of the current valuation of intangible assets and deferred taxes; risks related to the agreement governing the Company’s proprietary credit card program; potential increase in pension obligations; consumer spending patterns, debt levels, and the availability and cost of consumer credit; additional competition from existing and new competitors; inflation; deflation; changes in the costs of fuel and other energy and transportation costs; weather conditions that could negatively impact sales; uncertainties associated with expanding or remodeling existing stores; the ability to attract and retain qualified management; the dependence upon relationships with vendors and their factors; a data security breach or system failure; the ability to reduce or control SG&A expenses, including initiatives to reduce expenses and improve efficiency; operational disruptions; unsuccessful marketing initiatives; the failure to successfully implement our key strategies, including initiatives to improve our merchandising, marketing and operations; adverse outcomes in litigation; the incurrence of unplanned capital expenditures; the ability to obtain financing for working capital, capital expenditures and general corporate purpose; the impact of new regulatory requirements including the Credit Card Accountability Responsibility and Disclosure Act of 2009 and the Health Care Reform Act; the inability or limitations on the Company’s ability to favorably adjust the valuation allowance on deferred tax assets; and the financial condition of mall operators. Additional factors that could cause the Company’s actual results to differ from those contained in these forward-looking statements are discussed in greater detail under Item 1A of the Company’s Form 10-K filed with the Securities and Exchange Commission. This information may not be republished or otherwise distributed without the prior consent of The Bon-Ton Stores, Inc. This presentation was prepared primarily from public documents that were available as of September 4, 2012. The Company assumes no obligation to update the information in this presentation. |
|
|
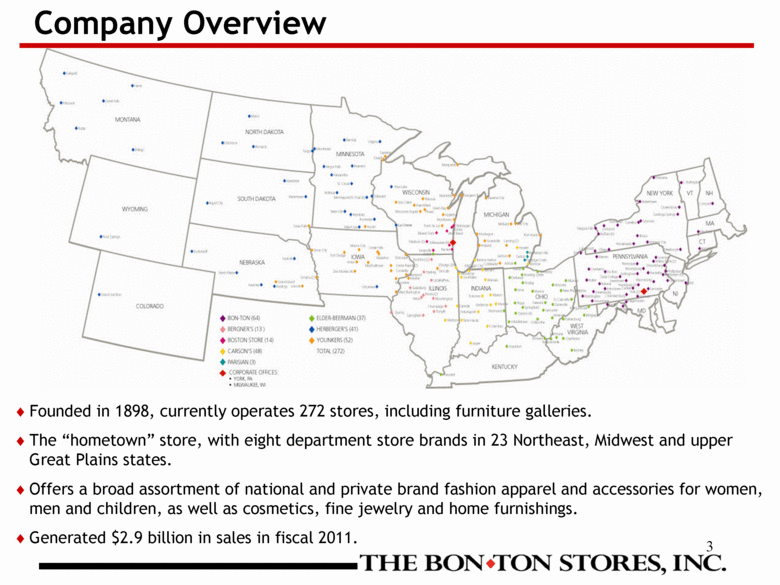
3 Company Overview Founded in 1898, currently operates 272 stores, including furniture galleries. The “hometown” store, with eight department store brands in 23 Northeast, Midwest and upper Great Plains states. Offers a broad assortment of national and private brand fashion apparel and accessories for women, men and children, as well as cosmetics, fine jewelry and home furnishings. Generated $2.9 billion in sales in fiscal 2011. |
|
|
4 Vision The dominant, omni-channel retailer in the small to mid-size communities we serve, offering fashion merchandise for the family and home at compelling prices |
|
|
5 Goal $3+ billion in revenues and a 10% EBITDA margin |
|
|
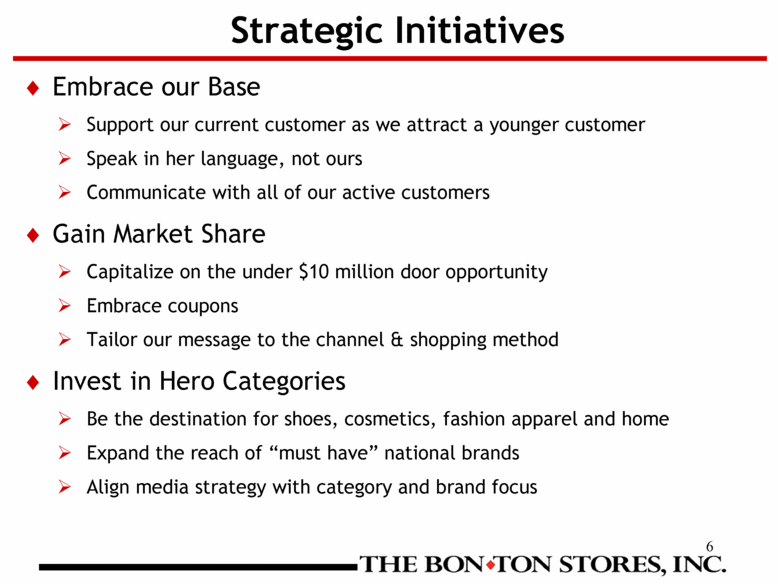
6 Strategic Initiatives Embrace our Base Support our current customer as we attract a younger customer Speak in her language, not ours Communicate with all of our active customers Gain Market Share Capitalize on the under $10 million door opportunity Embrace coupons Tailor our message to the channel & shopping method Invest in Hero Categories Be the destination for shoes, cosmetics, fashion apparel and home Expand the reach of “must have” national brands Align media strategy with category and brand focus |
|
|
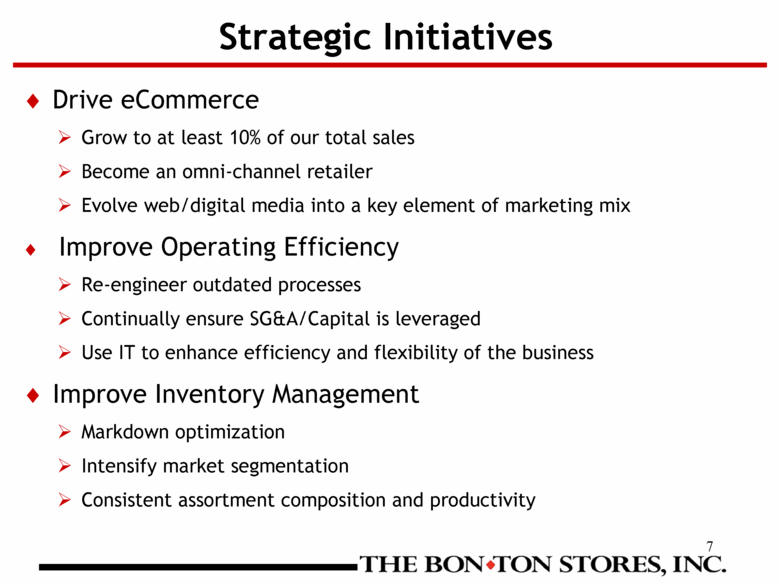
7 Strategic Initiatives Drive eCommerce Grow to at least 10% of our total sales Become an omni-channel retailer Evolve web/digital media into a key element of marketing mix Improve Operating Efficiency Re-engineer outdated processes Continually ensure SG&A/Capital is leveraged Use IT to enhance efficiency and flexibility of the business Improve Inventory Management Markdown optimization Intensify market segmentation Consistent assortment composition and productivity |
|
|
8 Financials |
|
|
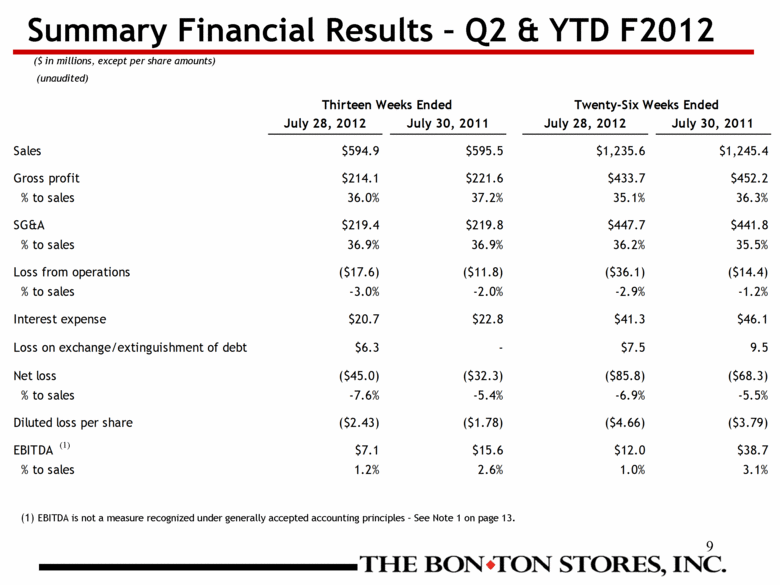
9 Summary Financial Results – Q2 & YTD F2012 ($ in millions, except per share amounts) (unaudited) Thirteen Weeks Ended Twenty-Six Weeks Ended July 28, 2012 July 30, 2011 July 28, 2012 July 30, 2011 Sales $594.9 $595.5 $1,235.6 $1,245.4 Gross profit $214.1 $221.6 $433.7 $452.2 % to sales 36.0% 37.2% 35.1% 36.3% SG&A $219.4 $219.8 $447.7 $441.8 % to sales 36.9% 36.9% 36.2% 35.5% Loss from operations ($17.6) ($11.8) ($36.1) ($14.4) % to sales -3.0% -2.0% -2.9% -1.2% Interest expense $20.7 $22.8 $41.3 $46.1 Loss on exchange/extinguishment of debt $6.3 - $7.5 9.5 Net loss ($45.0) ($32.3) ($85.8) ($68.3) % to sales -7.6% -5.4% -6.9% -5.5% Diluted loss per share ($2.43) ($1.78) ($4.66) ($3.79) EBITDA (1) $7.1 $15.6 $12.0 $38.7 % to sales 1.2% 2.6% 1.0% 3.1% (1) EBITDA is not a measure recognized under generally accepted accounting principles – See Note 1 on page 13. |
|
|
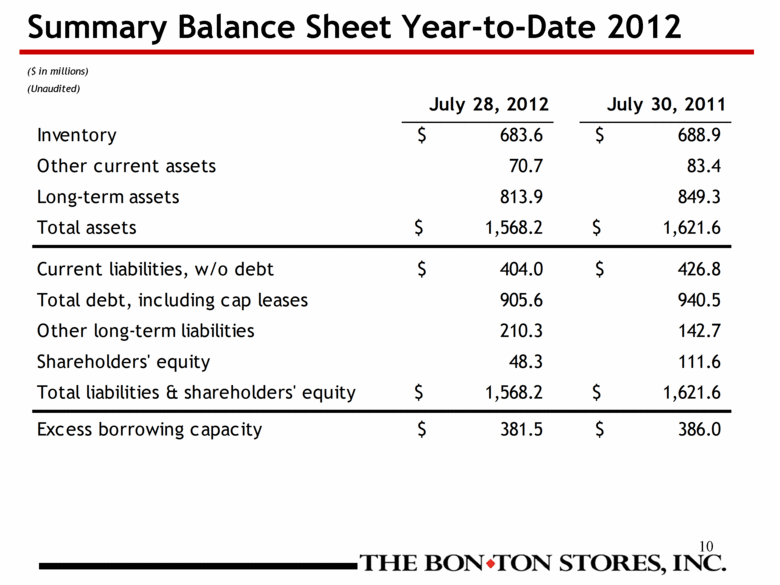
10 Summary Balance Sheet Year-to-Date 2012 ($ in millions) (Unaudited) July 28, 2012 July 30, 2011 Inventory $ 683.6 $ 688.9 Other current assets 70.7 83.4 Long-term assets 813.9 849.3 Total assets $ 1,568.2 $ 1,621.6 Current liabilities, w/o debt $ 404.0 $ 426.8 Total debt, including cap leases 905.6 940.5 Other long-term liabilities 210.3 142.7 Shareholders' equity 48.3 111.6 Total liabilities & shareholders' equity $ 1,568.2 $ 1,621.6 Excess borrowing capacity $ 381.5 $ 386.0 |
|
|
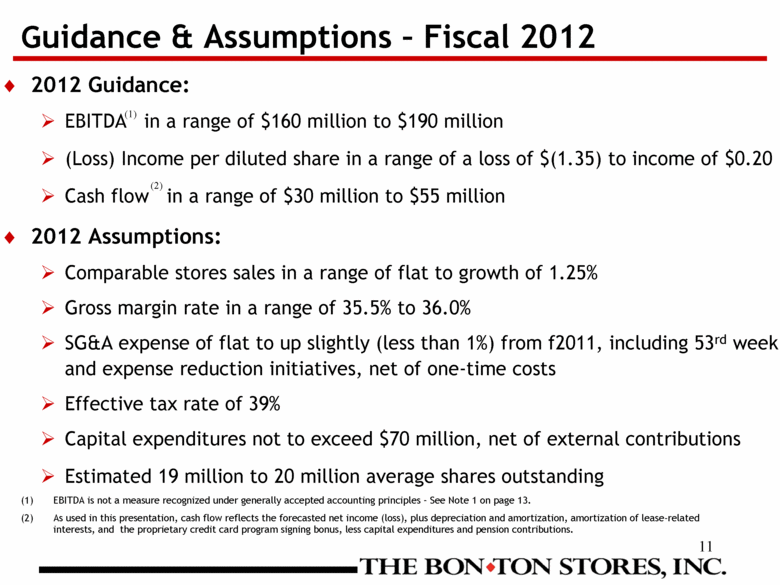
11 Guidance & Assumptions – Fiscal 2012 2012 Guidance: EBITDA (1) in a range of $160 million to $190 million (Loss) Income per diluted share in a range of a loss of $(1.35) to income of $0.20 Cash flow (2) in a range of $30 million to $55 million 2012 Assumptions: Comparable stores sales in a range of flat to growth of 1.25% Gross margin rate in a range of 35.5% to 36.0% SG&A expense of flat to up slightly (less than 1%) from f2011, including 53rd week and expense reduction initiatives, net of one-time costs Effective tax rate of 39% Capital expenditures not to exceed $70 million, net of external contributions Estimated 19 million to 20 million average shares outstanding (1) EBITDA is not a measure recognized under generally accepted accounting principles – See Note 1 on page 13. As used in this presentation, cash flow reflects the forecasted net income (loss), plus depreciation and amortization, amortization of lease-related interests, and the proprietary credit card program signing bonus, less capital expenditures and pension contributions. (2) |
|
|
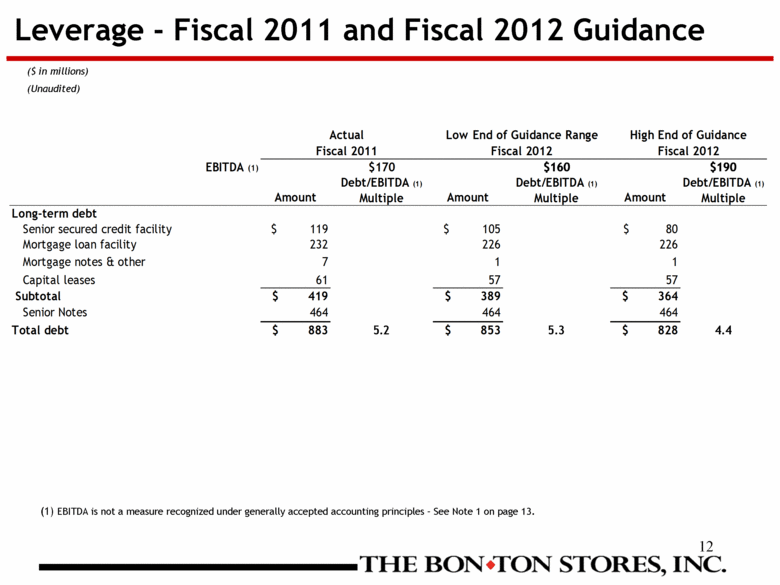
12 Leverage - Fiscal 2011 and Fiscal 2012 Guidance (1) EBITDA is not a measure recognized under generally accepted accounting principles – See Note 1 on page 13. ($ in millions) (Unaudited) Actual Low End of Guidance Range High End of Guidance Fiscal 2011 Fiscal 2012 Fiscal 2012 EBITDA (1) $170 $160 $190 Debt/EBITDA (1) Debt/EBITDA (1) Debt/EBITDA (1) Amount Multiple Amount Multiple Amount Multiple Long-term debt Senior secured credit facility $ 119 $ 105 $ 80 Mortgage loan facility 232 226 226 Mortgage notes & other 7 1 1 Capital leases 61 57 57 Subtotal $ 419 $ 389 $ 364 Senior Notes 464 464 464 Total debt $ 883 5.2 $ 853 5.3 $ 828 4.4 |
|
|
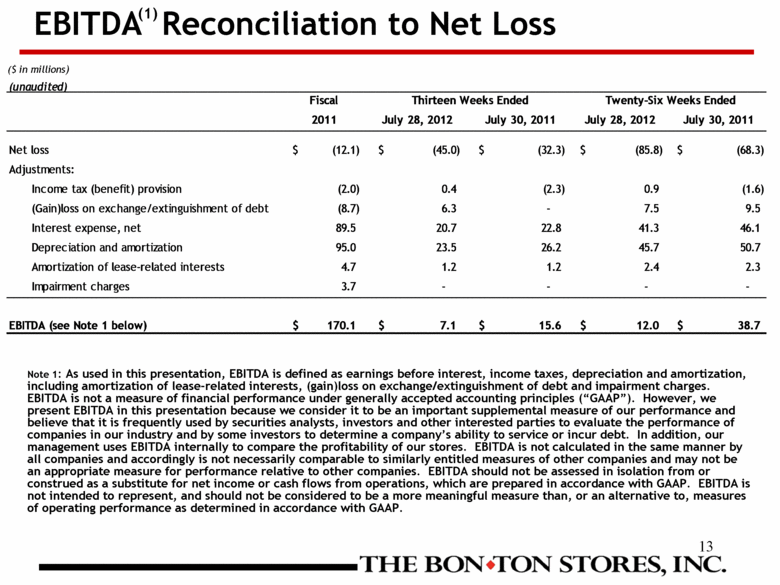
13 EBITDA Reconciliation to Net Loss Note 1: As used in this presentation, EBITDA is defined as earnings before interest, income taxes, depreciation and amortization, including amortization of lease-related interests, (gain)loss on exchange/extinguishment of debt and impairment charges. EBITDA is not a measure of financial performance under generally accepted accounting principles (“GAAP”). However, we present EBITDA in this presentation because we consider it to be an important supplemental measure of our performance and believe that it is frequently used by securities analysts, investors and other interested parties to evaluate the performance of companies in our industry and by some investors to determine a company’s ability to service or incur debt. In addition, our management uses EBITDA internally to compare the profitability of our stores. EBITDA is not calculated in the same manner by all companies and accordingly is not necessarily comparable to similarly entitled measures of other companies and may not be an appropriate measure for performance relative to other companies. EBITDA should not be assessed in isolation from or construed as a substitute for net income or cash flows from operations, which are prepared in accordance with GAAP. EBITDA is not intended to represent, and should not be considered to be a more meaningful measure than, or an alternative to, measures of operating performance as determined in accordance with GAAP. (1) ($ in millions) (unaudited) Fiscal Thirteen Weeks Ended Twenty-Six Weeks Ended 2011 July 28, 2012 July 30, 2011 July 28, 2012 July 30, 2011 Net loss $ (12.1) $ (45.0) $ (32.3) $ (85.8) $ (68.3) Adjustments: Income tax (benefit) provision (2.0) 0.4 (2.3) 0.9 (1.6) (Gain)loss on exchange/extinguishment of debt (8.7) 6.3 - 7.5 9.5 Interest expense, net 89.5 20.7 22.8 41.3 46.1 Depreciation and amortization 95.0 23.5 26.2 45.7 50.7 Amortization of lease-related interests 4.7 1.2 1.2 2.4 2.3 Impairment charges 3.7 - - - - EBITDA (see Note 1 below) $ 170.1 $ 7.1 $ 15.6 $ 12.0 $ 38.7 |


