UNITED STATES SECURITIES AND
EXCHANGE COMMISSION
Washington, D.C.
20549
Form 10-K
ANNUAL REPORT
PURSUANT TO SECTION 13 or 15(d)
OF THE SECURITIES EXCHANGE ACT OF 1934
| |
|
|
|
For the Fiscal Year Ended
|
|
Commission File Number
|
|
January 30, 2010
|
|
0-19517
|
2801 East Market Street
York, Pennsylvania 17402
(717) 757-7660
www.bonton.com
| |
|
|
|
Incorporated in Pennsylvania
|
|
IRS
No. 23-2835229
|
Securities registered pursuant to Section 12(b) of the
Act:
| |
|
|
|
Title of Each Class
|
|
Name of Each Exchange on Which
Registered
|
|
|
|
Common Stock, $.01 par value
|
|
The NASDAQ Global Select Stock Market
|
Securities
registered pursuant to Section 12(g) of the Act:
None
Indicate by check mark if the registrant is a well-known
seasoned issuer, as defined in Rule 405 of the Securities
Act. Yes o No þ
Indicate by check mark if the registrant is not required to file
reports pursuant to Section 13 or Section 15(d) of the
Act. Yes o No þ
Indicate by check mark whether the registrant (1) has filed
all reports required to be filed by Section 13 or 15(d) of
the Securities Exchange Act of 1934 during the preceding
12 months (or for such shorter period that the registrant
was required to file such reports), and (2) has been
subject to such filing requirements for the past
90 days. Yes þ No o
Indicate by check mark whether the registrant has submitted
electronically and posted on its corporate website, if any,
every Interactive Data File required to be submitted and posted
pursuant to Rule 405 of
Regulation S-T
(§ 229.405 of this chapter) during the preceding
12 months (or for such shorter period that the registrant
was required to submit and post such
files). Yes o No o
Indicate by check mark if disclosure of delinquent filers
pursuant to Item 405 of
Regulation S-K
is not contained herein, and will not be contained, to the best
of registrant’s knowledge, in definitive proxy or
information statements incorporated by reference in
Part III of this
Form 10-K
or any amendment to this
Form 10-K. þ
Indicate by check mark whether the registrant is a large
accelerated filer, an accelerated filer, a non-accelerated
filer, or a smaller reporting company. See the definitions of
“large accelerated filer,” “accelerated
filer” and “smaller reporting company” in Rule
12b-2 of the Exchange Act. (Check one):
|
|
|
|
| Large accelerated
filer o
|
Accelerated
filer o
|
Non-accelerated
filer þ
|
Smaller reporting
company o
|
(Do not check if a smaller reporting company)
Indicate by check mark whether the registrant is a shell company
(as defined in
Rule 12b-2
of the Exchange
Act). Yes o No þ
The aggregate market value of the voting stock held by
non-affiliates of the registrant was approximately
$40.5 million as of the last business day of the
registrant’s most recently completed second fiscal quarter.
For purposes of this calculation only, the registrant has
excluded all shares held in the treasury or that may be deemed
to be beneficially owned by executive officers and directors of
the registrant. By doing so, the registrant does not concede
that such persons are affiliates for purposes of the federal
securities laws.
As of March 26, 2010, there were 15,578,327 shares of
Common Stock, $.01 par value, and 2,951,490 shares of
Class A Common Stock, $.01 par value, outstanding.
DOCUMENTS
INCORPORATED BY REFERENCE
Portions of the definitive proxy statement for the 2010 Annual
Meeting of Shareholders (the “Proxy Statement”) are
incorporated by reference in Part III to the extent
described in Part III.
The Bon-Ton Stores, Inc. operates on a fiscal year,
consisting of the 52 or 53 week period ending on the
Saturday nearer January 31 of the following calendar year.
References to “2009,” “2008” and
“2007” represent the 2009 fiscal year ended
January 30, 2010, the 2008 fiscal year ended
January 31, 2009 and the 2007 fiscal year ended
February 2, 2008, respectively. References to
“2010” represent the 2010 fiscal year ending
January 29, 2011.
References to “the Company,” “we,”
“us,” and “our” refer to The Bon-Ton Stores,
Inc. and its subsidiaries.
PART I
Overview
The Company was founded in 1898 and is one of the largest
regional department store operators in the United States,
offering a broad assortment of brand-name fashion apparel and
accessories for women, men and children as well as cosmetics,
home furnishings and other goods. We currently operate 278
stores in mid-size and metropolitan markets in 23 Northeastern,
Midwestern and upper Great Plains states under the Bon-Ton,
Bergner’s, Boston Store, Carson Pirie Scott, Elder-Beerman,
Herberger’s and Younkers nameplates and, in the Detroit,
Michigan area, under the Parisian nameplate, encompassing a
total of approximately 26 million square feet.
Industry
Overview
We compete in the department store segment of the
U.S. retail industry. Department stores have historically
dominated apparel and accessories retailing, occupying a
cornerstone in the U.S. retail landscape for more than
100 years. Over time, department stores have evolved from
single-unit,
family-owned, urban locations to regional and national chains
serving communities of all sizes. Today, we operate in a highly
competitive, highly fragmented and rapidly changing environment
as the department store industry continues to evolve in response
to consolidation among merchandise vendors as well as the
evolution of competitive retail formats — mass
merchandisers, national chain retailers, specialty retailers and
online retailers.
Our operating results and performance, and that of our
competitors, depend significantly on economic conditions and
their impact on consumer spending. During 2009, the economic
downturn that began in 2008 continued, resulting in an extremely
adverse environment for the retail industry, including the
department store sector. We believe the economic factors
included volatility in the capital markets, with limited or no
access to credit for many companies and consumers. These credit
market conditions, the general downturn in the U.S. economy
and weakening consumer sentiment contributed to the continued
significant reduction in consumer spending as compared with 2007
and prior years.
Merchandise
Merchandise
Assortment
Our stores offer a broad assortment of quality fashion apparel
and accessories for women, men and children, as well as
cosmetics, home furnishings and other goods at moderate and
better price points. Our comprehensive merchandise assortment
includes nationally distributed brands at competitive prices and
unique products at compelling values through our private brands.
We further
1
differentiate our merchandise assortment with exclusive products
from nationally distributed brands. The following table
illustrates our net sales by product category for the last three
years:
| |
|
|
|
|
|
|
|
|
|
|
|
|
|
Merchandise Category
|
|
2009
|
|
|
2008
|
|
|
2007
|
|
|
|
|
|
|
|
Women’s Apparel
|
|
|
25.7
|
%
|
|
|
25.6
|
%
|
|
|
26.2
|
%
|
|
Home
|
|
|
16.8
|
|
|
|
17.6
|
|
|
|
17.8
|
|
|
Cosmetics
|
|
|
13.2
|
|
|
|
13.1
|
|
|
|
12.6
|
|
|
Men’s Apparel
|
|
|
12.3
|
|
|
|
12.8
|
|
|
|
13.1
|
|
|
Accessories
|
|
|
8.9
|
|
|
|
8.0
|
|
|
|
7.9
|
|
|
Footwear
|
|
|
8.2
|
|
|
|
8.1
|
|
|
|
8.0
|
|
|
Children’s Apparel
|
|
|
7.2
|
|
|
|
6.9
|
|
|
|
6.4
|
|
|
Intimate Apparel
|
|
|
4.3
|
|
|
|
4.3
|
|
|
|
4.2
|
|
|
Juniors’ Apparel
|
|
|
3.4
|
|
|
|
3.6
|
|
|
|
3.8
|
|
|
|
|
|
|
|
|
|
|
|
|
|
|
|
|
|
|
Total
|
|
|
100.0
|
%
|
|
|
100.0
|
%
|
|
|
100.0
|
%
|
|
|
Nationally
Distributed Brands
Our nationally distributed brand assortment includes many of the
most well-known and popular labels in the apparel, accessories,
footwear, cosmetics and home furnishings industries such as
Børn, Calvin Klein, Carters, Clarks, Clinique, Columbia,
Estée Lauder, Fossil, Izod, Jessica Simpson, Jones New
York, Lancôme, Levis, Nine West and Polo. We believe these
brands enable us to position our stores as headquarters for
fashion, offering both newness and wardrobe staples at
competitive prices. We believe that we maintain excellent
relationships with our merchandise vendors, working
collaboratively to select the most compelling assortments for
our customers.
Private
Brands
Our exclusive private brands complement our offerings of
nationally distributed brands and are a key component of our
overall merchandising strategy. Our private brand portfolio
includes popular brands such as Laura Ashley, Victor by Victor
Alfaro, Ruff Hewn, Relativity, Studio Works, Breckenridge, Karen
Neuberger Home, Consensus, Kenneth Roberts and Cuddle Bear. By
providing exclusive fashion products at price points that are
more attractive than nationally distributed brand alternatives,
our private brand program creates value for our customers and
increases our brand exclusiveness, competitive differentiation
and customer loyalty. Our private brand program also presents
the opportunity to increase our overall gross margin by virtue
of the more efficient cost structure inherent in the design and
sourcing of in-house brands.
Vendor
Relationships and Sourcing
Our highly experienced team of buyers has developed
long-standing and strong relationships with many of the leading
vendors in the marketplace. Our scale, geographic footprint and
market leadership make us an important distribution channel for
leading merchandise vendors to reach their target consumers. We
believe that our status as a key account to many of our vendors
serves to strengthen our ability to negotiate for merchandise
exclusive to our stores as well as better pricing terms. We
monitor and evaluate the sales and profitability performance of
each vendor and adjust our purchasing decisions based upon the
results of this analysis.
Consistent with industry practice, we receive allowances from
certain of our vendors in support of the merchandise sold to us
that was marked down or that did not allow us to achieve certain
margins upon sale to our customers. Additionally, we receive
advertising allowances and reimbursement of certain payroll
expenses from some of our vendors, which primarily represent
reimbursements of specific, incremental and identifiable costs
incurred to promote and sell the vendors’ merchandise.
2
Marketing and
Customer Service
We are committed to providing our customers with a satisfying
shopping experience by offering trend-right fashions,
differentiated product, value and convenience. Critical elements
of our customer service approach are:
|
|
|
| |
•
|
marketing programs designed to promote customer awareness of our
fashion, quality and value;
|
| |
| |
•
|
customer targeting strategies that foster and strengthen
long-term relationships;
|
| |
| |
•
|
frequent shopper promotions for our proprietary credit card
holders; and
|
| |
| |
•
|
knowledgeable, friendly and well-trained sales associates.
|
Marketing
Our strategic marketing initiatives develop and enhance our
brand equity and support our position as a leading shopping
destination among our target customers. We conduct a
multi-faceted marketing program, including newspaper
advertisements and inserts, broadcast advertisements, direct
mail and in-store events. We use a combination of
(i) advertising and sales promotion activities to reach and
build brand image and traffic and (ii) customer-specific
communications and purchase incentives to drive customer
spending and loyalty. Both types of marketing efforts focus
primarily on our target customer of women between the ages of 35
and 60 with annual household incomes of $55,000 to $125,000,
with the intention of increasing visit frequency and purchases
per visit. Additionally, our marketing activities attract a
broader audience, including juniors, seniors and men. We seek to
attract new customers and to maintain customer loyalty by
actively communicating with our customers through the execution
of targeted marketing facilitated by sophisticated customer
relationship management capabilities.
Effective communication includes showcasing our “hometown
store” tradition. We are focused on important,
cause-related efforts and events to enhance our connection with
the communities in which we operate and with the customers we
serve. These strategic initiatives garner favorable publicity,
drive traffic and generate incremental sales. Additionally,
these efforts serve to differentiate us from our competitors.
We maintain an active calendar of in-store events to promote our
sales efforts. These events include appearances by well-known
designers and personalities, trunk shows, fashion shows and
cosmetic makeovers from leading makeup artists.
Proprietary
Credit Card
Evidencing our customer satisfaction and loyalty is the high
penetration rate of our proprietary credit card program that is
administered by HSBC Bank Nevada, N.A. (“HSBC”). We
have over 4.1 million active proprietary credit card
holders.
Our proprietary credit card loyalty program is designed to
cultivate long-term relationships with our customers. The
loyalty program offers rewards and privileges to all members
meeting annual earned points requirements. Our targeted loyalty
program focuses on our most active customers and includes
marketing features such as advanced sales notices and extra
savings events. Included in our five-year strategic plan is the
objective to increase proprietary credit card penetration as a
driver of total sales growth. To achieve this goal, we
implemented a new proprietary credit card loyalty program called
“Your Rewards” in August 2008. Your Rewards expands
the customer savings element of our previous programs and
provides greater shopping flexibility and customer rewards.
3
Customer
Service
We maintain a sales force of knowledgeable and well-trained
sales associates to deliver excellent service to our customers.
Sales associates are trained in the areas of customer service,
selling skills and product knowledge. We employ a two-tiered
strategy to achieve effective customer service. In selected
areas, we offer
one-on-one
selling with dedicated associates to assist customers with
merchandise selections. Our customers also appreciate the
convenience of self-service formats in many departments and
efficient service centers to expedite their purchases. Our new
associates receive computer-based training for an effective,
efficient and uniform training experience. We actively monitor
and analyze, through our scheduling program, the service levels
in our stores in order to maximize sales associate productivity
and store profitability.
Competition
The retail industry is highly competitive and fragmented. We
face competition for customers from traditional department store
operators such as Belk, Inc., Dillard’s, Inc., Macy’s,
Inc., Boscov’s Department Store LLC and Von Maur Inc.;
national chain retailers such as J. C. Penney Company, Inc.,
Kohl’s Corporation and Sears Holdings Corporation; mass
merchandisers such as Target Corporation and Wal-Mart Stores,
Inc.; specialty stores; and catalogue and online retailers. In
addition, we face competition for suitable store locations from
other department stores, national chain retailers, mass
merchandisers and other large-format retailers. In a number of
our markets, we compete for customers with national department
store chains which offer a similar mix of branded merchandise as
we do. In other markets, we face potential competition from
national chains that, to date, have not entered such markets and
from national chains that have stores in our markets but
currently do not carry similar branded goods. In all markets, we
generally compete for customers with stores offering
moderately-priced goods. Many of our competitors have
substantially greater financial and other resources than we do,
and many of those competitors have significantly less debt than
we do and may thus have greater flexibility to respond to
changes in our industry.
We believe that we compare favorably with our competitors with
respect to quality, depth and breadth of merchandise, prices for
comparable quality merchandise, customer service and store
environment. We also believe our knowledge of and focus on small
to mid-size markets, developed over our many years of operation,
give us an advantage in these markets that cannot be readily
duplicated. In markets in which we face traditional department
store competition, we believe that we compete effectively.
Trademarks and
Trade Names
We own or license various trademarks and trade names, including
our store nameplates and private brands. We believe our
trademarks and trade names are important and that the loss of
certain of our trademarks or trade names, particularly our store
nameplates, could have a material adverse effect on us. We are
not aware of any claims of infringement or other challenges to
our right to use our trademarks in the United States that would
have a material adverse effect on our consolidated financial
position, results of operations or liquidity.
Information
Technology and Systems
During 2009, we continued our investment in technology
infrastructure equipment and software. Our initiatives focused
on (1) updating systems and business processes with
emphasis on customer service, (2) accelerating the growth
of our ecommerce business, (3) improving associate
productivity, and (4) reducing operating costs. Advanced
warehouse management and order fulfillment systems were
implemented at the Company’s three merchandise distribution
centers, increasing supply chain visibility, improving
productivity and reducing operating costs. We completed the
implementation of labor scheduling and automated store signing
systems, and completed upgrades to our merchandising, private
brand and sales promotion systems. In 2009, additional
4
stores were updated with an advanced
point-of-sale
system; we expect to install this advanced
point-of-sale
system in the remaining stores prior to the 2010 holiday selling
season. A merchandise returns management system was implemented
in 204 stores, reducing fraudulent return activity and providing
additional insight into customer return behavior. The Company
completed the upgrade and consolidation of its
telecommunications network, improving capacity, incorporating
advanced cellular backup communications capability and reducing
overall costs. We continued our investments in security systems
and maintained our compliance certification with Payment Card
Industry (PCI) Data Security Standards for the protection of
customer information.
Inventory
Management
Our merchandising function is centralized, with a staff of
buyers and a planning and allocation team who have
responsibility for determining the merchandise assortment,
quantities to be purchased and allocation of merchandise to each
store.
We primarily operate on a pre-distribution model through which
we allocate merchandise on our initial purchase orders to each
store. This merchandise is shipped from our vendors to our
distribution facilities for delivery to designated stores. We
then have the ability to direct replenishment merchandise to the
stores that demonstrate the highest customer demand. This
reactive distribution technique helps minimize excess inventory
and affords us timely and accurate replenishment.
We utilize electronic data interchange (EDI) technology with
most vendors, which is designed to move merchandise onto the
selling floor quickly and cost-effectively by allowing vendors
to deliver merchandise pre-labeled for individual store
locations. In addition, we utilize high-speed automated conveyor
systems in our distribution facilities to scan bar coded labels
on incoming cartons of merchandise and direct cartons to the
proper processing areas. Most of our merchandise is unloaded in
the receiving area and immediately “cross-docked” to
the shipping dock for delivery to the stores. Certain processing
areas are staffed with personnel equipped with hand-held radio
frequency terminals that can scan a vendor’s bar code and
transmit the necessary information to a computer to record
merchandise on hand. We utilize third-party carriers to
distribute our merchandise to our stores.
The majority of our merchandise is held in our stores. We
closely monitor the inventory levels and assortments in our
stores to facilitate reorder and replenishment decisions,
satisfy customer demand and maximize sales. Our business follows
a seasonal pattern; merchandise inventories fluctuate with
seasonal variations, reaching their highest level in October or
November in advance of the holiday season.
We have a customer return policy allowing customers to return
merchandise with proper documentation. A reserve is provided in
our consolidated statements of operations for estimated
merchandise returns, based on historical returns experience, and
is reflected as an adjustment to sales and costs of merchandise
sold.
Seasonality
Our business, like that of most retailers, is subject to
seasonal fluctuations, with the major portion of sales and
income realized during the second half of each year, which
includes the holiday season. Due to the fixed nature of certain
costs, our selling, general and administrative
(“SG&A”) expenses are typically higher as a
percentage of net sales during the first half of each year.
Because of the seasonality of our business, results for any
quarter are not necessarily indicative of the results that may
be achieved for a full year. In addition, quarterly results of
operations depend upon the timing and amount of revenues and
costs associated with the opening, closing and remodeling of
existing stores.
5
Capital
Investments
We make capital investments to support our long-term business
goals and objectives. We invest capital in new and existing
stores, distribution and support facilities, and information
technology.
In 2010, we expect capital expenditures to total approximately
$50 million, net of approximately $7 million of
landlord contributions. As part of our focus on continually
improving our store base, capital will be employed for remodels
of certain stores and on-going store upgrades. We are focused on
maintaining the quality of our stores and our brand equity while
prudently limiting expenditures in response to current economic
conditions. In 2010, we do not plan to open any new stores.
We believe capital investments for information technology are
necessary to support our business strategies. We are continually
upgrading our information systems to improve efficiency and
productivity. Included in the 2010 capital budget are
expenditures for numerous information technology projects, most
notably efforts to implement an advanced
point-of-sale
system in all of our stores.
Associates
As of March 26, 2010, we had approximately
27,600 full-time and part-time associates. We employ
additional part-time associates during peak selling periods. We
believe that our relationship with our associates is good.
Available
Information
Our annual report on
Form 10-K,
quarterly reports on
Form 10-Q,
current reports on
Form 8-K
and amendments to those reports are available without charge on
our website, www.bonton.com, as soon as reasonably practicable
after they are filed electronically with the Securities and
Exchange Commission (“SEC”).
We also make available on our website, free of charge, the
following documents:
|
|
|
| |
•
|
Audit Committee Charter
|
| |
| |
•
|
Human Resources and Compensation Committee Charter
|
| |
| |
•
|
Governance and Nominating Committee Charter
|
| |
| |
•
|
Code of Ethical Standards and Business Practices
|
6
Executive
Officers
The following table sets forth certain information regarding our
executive officers as of March 26, 2010:
| |
|
|
|
|
|
|
|
NAME
|
|
AGE
|
|
POSITION
|
|
|
|
|
|
Tim Grumbacher
|
|
|
70
|
|
|
Executive Chairman of the Board of Directors
|
|
Byron L. Bergren
|
|
|
63
|
|
|
President and Chief Executive Officer and Director
|
|
Anthony J. Buccina
|
|
|
59
|
|
|
Vice Chairman, President — Merchandising
|
|
Stephen R. Byers
|
|
|
56
|
|
|
Vice Chairman — Stores, Visual, Construction, Real
Estate, Distribution & Logistics, Loss Prevention
|
|
Dennis R. Clouser
|
|
|
57
|
|
|
Executive Vice President — Human Resources, Corporate
Procurement & Operations and Information Services
|
|
Keith E. Plowman
|
|
|
52
|
|
|
Executive Vice President — Finance; Chief Financial
Officer and Principal Accounting Officer
|
|
Barbara J. Schrantz
|
|
|
51
|
|
|
Executive Vice President — Sales Promotion and
Marketing
|
Mr. Grumbacher has been Executive Chairman of the
Board of Directors since February 2005. He served as Chairman of
the Board of Directors from August 1991 to February 2005. He was
Chief Executive Officer from 1985 to 1995 and from June 2000 to
August 2004. From 1977 to 1989 he was President.
Mr. Bergren has been President and Chief Executive
Officer since August 2004. He joined the Company in November
2003 in conjunction with our acquisition of The Elder-Beerman
Stores Corp. (“Elder-Beerman”), and served as Vice
Chairman and President and Chief Executive Officer of
Elder-Beerman from February 2002 through August 2004.
Mr. Buccina was appointed Vice Chairman,
President — Merchandising in June 2006. He joined the
Company in April 2006 in conjunction with our acquisition of the
142 stores which comprised the Northern Department Store Group
(“NDSG”) from Saks Incorporated, serving as President
and Chief Merchandising Officer of NDSG from April 2006 to June
2006. Prior to that time, he had served as President —
Head Merchant of NDSG for more than five years.
Mr. Byers was appointed to his current position in
February 2008. He served as Vice Chairman — Stores,
Operations, Private Brand, Planning & Allocation from
October 2006 to February 2008, and as Executive Vice
President — Stores and Visual Merchandising from April
2006 to October 2006. Prior to that time, he had served as
Executive Vice President of Stores and Visual Merchandising of
NDSG since August 2004.
Mr. Clouser has been Executive Vice
President — Human Resources since April 2006, and
assumed additional responsibilities for Corporate Procurement,
Corporate Operations and Information Services in February 2008.
He served as Senior Vice President — Human Resources
from February 2005 to April 2006 and Vice President —
Employment and Training from April 2004 to February 2005.
Mr. Plowman has been Executive Vice
President — Finance since April 2006, Chief Financial
Officer since May 2005 and Principal Accounting Officer since
June 2003.
Ms. Schrantz has been Executive Vice
President — Sales Promotion and Marketing since March
2009. Prior to that, she served as Executive Vice
President — Stores and Visual since March 2008. She
served as Senior Vice President — Merchandise Planning
and Internet Marketing from September 2006 to February 2008, and
as Senior Vice President — Product Development and
Private Brand from September 2005 to August 2006. Before joining
the Company, Ms. Schrantz held
7
various merchandising posts of increasing responsibility,
including Senior Vice President/General Merchandise Manager, at
the 53-store Proffitts/McRae’s division of Saks
Incorporated for more than five years.
Cautionary
Statements Relating to Forward-Looking Information
We have made, in this Annual Report on
Form 10-K,
forward-looking statements relating to developments, results,
conditions or other events we expect or anticipate will occur.
These statements may relate to revenues, earnings, store
openings, business strategy, general economic conditions, market
conditions and the competitive environment. The words
“believe,” “may,” “might,”
“will,” “estimate,” “intend,”
“expect,” “anticipate,” “plan” and
similar expressions as they relate to the Company, or future or
conditional verbs, such as “will,” “should,”
“would,” “may” and “could,” are
intended to identify forward-looking statements under the
Private Securities Litigation Reform Act of 1995.
Forward-looking statements are based on management’s
then-current views and assumptions and we undertake no
obligation to update them. Forward-looking statements are
subject to risks and uncertainties, and actual results may
differ materially from those projected. The reader is cautioned
not to place undue reliance on any such forward-looking
statements.
An investment in our securities carries certain risks. Investors
should carefully consider the risks described below and other
risks which may be disclosed in our filings with the SEC before
investing in our securities.
There can be no
assurance that our liquidity will not be adversely affected by
changes in the financial markets and global economy.
Historically, we have generated cash flow from operating
activities and used supplemental borrowings under our credit
facility to provide the liquidity we need to operate our
business. The downturn in the global economy and the recent
distress in the financial markets have resulted in extreme
volatility in the capital markets and diminished liquidity and
credit availability. The tightening of credit markets could make
it more difficult for us to access funds, to refinance our
existing indebtedness, to enter into agreements for new
indebtedness or to obtain funding through the issuance of
securities and could potentially increase our borrowing costs.
If such conditions were to persist, we would seek alternative
sources of liquidity, but there can be no assurance that we
would be successful in obtaining such additional liquidity. As a
result, we may not be able to meet our obligations as they
become due.
General economic
conditions could have an adverse effect on our financial
condition and results of operations.
Consumer spending habits, including spending for the merchandise
that we sell, are affected by, among other things, prevailing
economic conditions, levels of employment, salaries and wage
rates, prevailing interest rates and credit terms, housing
costs, energy costs, income tax rates and policies, inflation,
consumer confidence and consumer perception of economic
conditions. In addition, consumer purchasing patterns may be
influenced by consumers’ disposable income, credit
availability and debt levels. A continued or incremental
slowdown in the United States’ economy or an uncertain
economic outlook could adversely affect consumer spending
habits, resulting in lower net sales and profits, including the
potential write-down of the current valuation of long-lived
assets, intangible assets and deferred tax assets.
Our vendors, landlords, lenders and other business partners
could also be adversely affected by difficult economic
conditions. This, in turn, could impact us through increasing
the risk of bankruptcy of our vendors, landlords, lenders and
business partners, increasing the cost of goods, creating a void
in product, reducing access to liquid funds or credit,
increasing the cost of credit or other impacts which we are
unable to fully anticipate.
8
We conduct our
operations in a highly competitive retail environment which
could have an adverse effect on our business, financial
condition and results of operations.
We compete with other department stores and many other
retailers, including store-based, mail-order and internet
retailers. Many of our competitors have financial and marketing
resources that greatly exceed ours. The principal competitive
factors in our business are price, quality and selection of
merchandise, reputation, store location, advertising and
customer service. We cannot ensure that we will be able to
compete successfully against existing or future competitors, or
that prolonged periods of deep discount pricing by our
competitors during periods of weak consumer confidence or
economic instability will not have a material adverse effect on
our business. Our expansion into new markets served by our
competitors and the entry of new competitors into, or expansion
of existing competitors in, our markets could have a material
adverse effect on our business, financial condition and results
of operations.
Failure to
maintain key vendor and factor relationships may adversely
affect our business, financial condition and results of
operations.
Our business is dependent to a significant degree upon close
relationships with our vendors and their factors and our ability
to purchase brand name merchandise at competitive prices and
terms. The loss of key vendor and factor support could have a
material adverse effect on our business. There can be no
assurance that we will be able to acquire brand name merchandise
at competitive prices or on competitive terms in the future. For
example, certain merchandise that is high profile and in high
demand may be allocated by vendors based upon the vendors’
internal criteria, which are beyond our control.
In addition, given the weak global markets, vendors and factors
may seek assurances to protect against non-payment of amounts
due them. If we experience declining operating performance, and
if we experience severe liquidity challenges, vendors and
factors may demand that we accelerate our payment for their
products. These demands could have a significant adverse impact
on our operating cash flow and result in a severe diminishment
of our liquidity. Under such circumstances, borrowings under our
existing credit facility could reach maximum levels, in which
case we would take actions to obtain additional liquidity.
However, there can be no assurance that we would be successful
in obtaining such additional liquidity. As a result, we may not
be able to meet our obligations as they become due. In addition,
if our vendors are unable to access liquidity or become
insolvent, they could be unable to supply us with product or
continue with their support of our advertising and promotional
programs. Any such disruptions could negatively impact our
ability to acquire merchandise or obtain vendor allowances in
support of our advertising and promotional programs, which in
turn could have a material adverse impact on our business,
operating results, financial condition or cash flow.
Our substantial
debt could adversely affect our financial condition.
As of January 30, 2010, we had total debt of approximately
$1.0 billion, which is subject to restrictions and
financial covenants. This could have important consequences to
our investors. For example, it could:
|
|
|
| |
•
|
increase our vulnerability to general adverse economic and
industry conditions;
|
| |
| |
•
|
limit our ability to borrow money or sell equity to fund future
working capital requirements, capital expenditures, debt service
requirements and other general corporate requirements;
|
| |
| |
•
|
require us to dedicate a substantial portion of our cash flow
from operations to payments on our debt, thereby reducing our
ability to use our cash flow for other purposes, including
capital expenditures;
|
9
|
|
|
| |
•
|
limit our flexibility in planning for, or reacting to, changes
in our business and the retail industry;
|
| |
| |
•
|
make it more difficult for us to meet our debt service
obligations in the event there is a substantial increase in
interest rates because the debt under our senior secured credit
facility and term loan bear interest at fluctuating rates;
|
| |
| |
•
|
restrict our ability to make certain types of investments, pay
dividends, or sell all of our assets or merge or consolidate
with another company; and
|
| |
| |
•
|
place us at a competitive disadvantage compared with our
competitors that have less debt.
|
Our ability to service our debt depends upon, among other
things, our ability to replenish inventory at competitive prices
and terms, generate sales and maintain our stores. If we do not
generate sufficient cash from our operations to service our debt
obligations, we will need to take one or more actions, including
refinancing our debt, obtaining additional financing, selling
assets, obtaining additional equity capital, or reducing or
delaying capital expenditures. We cannot be certain that our
cash flow will be sufficient to allow us to pay the principal
and interest on our debt and meet our other obligations. Debt
under our senior secured credit facility and term loan bear
interest at a floating rate, a portion of which is offset by
fixed-rate swap derivatives. Accordingly, changes in prevailing
interest rates may affect our ability to meet our debt service
obligations. A higher interest rate on our debt would adversely
affect our operating results. If we are unable to meet our debt
service obligations or if we default under our credit
facilities, our lenders could elect to declare all borrowings
outstanding, together with accumulated and unpaid interest and
other fees, immediately due and payable, which would have a
material adverse effect on our business, financial condition and
results of operations.
Our discretion in
some matters is limited by the restrictions contained in our
senior secured credit facility, term loan and mortgage loan
facility agreements and in the indenture that governs our senior
unsecured notes, and any default on our senior secured credit
facility, term loan, mortgage loan facility or the indenture
that governs the senior unsecured notes could harm our business,
profitability and growth prospects.
The agreements that govern our senior secured credit facility,
term loan and mortgage loan facility, and the indenture that
governs our senior unsecured notes, contain a number of
covenants that limit the discretion of our management with
respect to certain business matters and may impair our ability
to respond to changing business and economic conditions. The
senior secured credit facility, the term loan, the mortgage loan
facility and the indenture, among other things, restrict our
ability to:
|
|
|
| |
•
|
incur additional debt or issue guarantees of debt;
|
| |
| |
•
|
sell preferred stock;
|
| |
| |
•
|
create liens;
|
| |
| |
•
|
make restricted payments (including the payment of dividends or
the repurchase of our common stock);
|
| |
| |
•
|
make certain types of investments;
|
| |
| |
•
|
sell stock in our restricted subsidiaries;
|
| |
| |
•
|
pay dividends or make payments from subsidiaries;
|
| |
| |
•
|
enter into transactions with affiliates; and
|
| |
| |
•
|
sell all or substantially all of our assets or merge or
consolidate with another company.
|
10
Our senior secured credit facility and term loan contain a
financial covenant that requires the minimum excess availability
under the senior secured credit facility be at least
$75.0 million at all times. Our ability to borrow funds for
any purpose depends on our satisfying this requirement.
If we fail to comply with the financial covenant or the other
restrictions contained in our senior secured credit facility,
term loan, mortgage loan facility or the indenture that governs
our senior unsecured notes, an event of default would occur. An
event of default could result in the acceleration of our debt
due to the cross-default provisions within our debt agreements.
If the debt is accelerated, we would not have, and may not be
able to obtain, sufficient funds to repay our debt, which could
have a material adverse effect on our business, financial
condition and results of operations.
Changes in the
terms of our proprietary credit card program, including as a
result of the CARD Act, could have an adverse effect on our
operations.
Our proprietary credit card program is operated, under
agreement, by HSBC. HSBC issues our proprietary credit cards to
our customers and we receive a percentage of the net credit
sales thereunder. The inability or unwillingness of HSBC to
provide support for our proprietary credit card program under
similar terms or conditions as exist today may result in a
decrease in credit card sales to our customers and a loss of
revenues attributable to payments from HSBC. In addition, if our
agreement with HSBC is terminated under circumstances in which
we are unable to quickly and adequately contract with a
comparable replacement vendor, our customers who have accounts
under our proprietary credit card program will be unable to use
their cards. This would likely result in a decrease in sales to
such customers, a loss of the revenues attributable to the
payments from HSBC and an adverse effect on customer goodwill,
any or all of which could have a material adverse effect on our
business and results of operations.
The Credit Card Accountability Responsibility and Disclosure Act
of 2009 (the “CARD Act”) mandates fundamental changes
to many credit card business practices, including marketing,
underwriting, pricing and billing. At this time, it is difficult
to assess the impact of the provisions of the CARD Act on our
agreement with HSBC. The changes could make it more difficult
for HSBC to extend credit to our customers and collect payments,
which could have a material adverse effect on our results of
operations.
Our pension costs
could increase at a higher than anticipated rate.
Significant changes in interest rates, decreases in the fair
value of plan assets and investment losses on plan assets have
affected and could further affect the funded status of our plans
and could increase future funding requirements of the pension
plans. A significant increase in future funding requirements
could have a negative impact on our cash flow, financial
condition and results of operations.
While we are not required to make any mandatory contributions to
the defined benefit pension plan in 2010, the funded status of
this plan and the related cost reflected in our financial
statements are affected by various factors that are subject to
an inherent degree of uncertainty, particularly in the current
economic environment. Under the Pension Protection Act of 2006,
losses of asset values may necessitate increased funding of the
defined benefit pension plan in the future to meet minimum
federal government requirements. Downward pressure on the asset
values of the defined benefit pension plan may require us to
fund obligations earlier than we forecasted, which would have a
negative impact on cash flows from operations.
We may not be
able to accurately predict customer-based trends and effectively
manage our inventory levels, which could reduce our revenues and
adversely affect our business, financial condition and results
of operations.
It is difficult to predict what and how much merchandise
consumers will want. A substantial part of our business is
dependent on our ability to make correct trend decisions.
Failure to accurately
11
predict constantly changing consumer tastes, spending patterns
and other lifestyle decisions, particularly given the long lead
times for ordering much of our merchandise, could adversely
affect our long-term relationships with our customers. Our
managers focus on inventory levels and balance these levels with
inventory plans and reviews of trends; however, if our
inventories become too large, we may have to “mark
down” or decrease our sales prices, and we may be required
to sell a significant amount of unsold inventory at discounted
prices or even below cost.
An inability to
find qualified domestic and international vendors and
fluctuations in the exchange rate with countries in which our
international vendors are located could adversely affect our
business.
The products we sell are sourced from a wide variety of domestic
and international vendors. Our ability to find qualified vendors
and source products in a timely and cost-effective manner,
including obtaining vendor allowances in support of our
advertising and promotional programs, represents a significant
challenge. The availability of products and the ultimate costs
of buying and selling these products, including advertising and
promotional costs, are not completely within our control and
could increase our merchandise and operating costs.
Additionally, costs and other factors specific to imported
merchandise, such as trade restrictions, tariffs, currency
exchange rates and transport capacity and costs, are beyond our
control and could restrict the availability of imported
merchandise or significantly increase the costs of our
merchandise and adversely affect our business, financial
condition and results of operations.
Conditions in,
and the United States’ relationship with, the countries
where we source our merchandise could adversely affect our
business.
A majority of our merchandise is manufactured outside of the
United States. Political instability or other events resulting
in the disruption of trade from the countries where our
merchandise is manufactured or the imposition of additional
regulations relating to, or duties upon, the merchandise we
import could cause significant delays or interruptions in the
supply of our merchandise or increase our costs. If we are
forced to source merchandise from other countries, those goods
may be more expensive than, or of inferior quality to, the
merchandise we now sell. If we are unable to adequately replace
the merchandise we currently source with merchandise produced
elsewhere, our business, financial condition and results of
operations could be adversely affected.
Our business is
seasonal.
Our business is subject to seasonal influences, with a major
portion of sales and income historically realized during the
second half of the fiscal year, which includes the holiday
season. This seasonality causes our operating results to vary
considerably from quarter to quarter and could have a material
adverse impact on the market price of our common stock. We must
carry a significant amount of inventory, especially before the
peak selling periods. If we are not successful in selling our
inventory, especially during our peak selling periods, we may be
forced to rely on markdowns, vendor support or promotional sales
to dispose of the inventory or we may not be able to sell the
inventory at all, which could have a material adverse effect on
our business, financial condition and results of operations.
Weather
conditions could adversely affect our results of
operations.
Because a significant portion of our business is apparel sales
and subject to weather conditions in our markets, our operating
results may be unexpectedly and adversely affected by inclement
weather. Frequent or unusually heavy snow, ice or rain storms
might make it difficult for our customers to travel to our
stores and thereby reduce our sales and profitability. Extended
periods of unseasonable temperatures in our markets, potentially
during our peak seasons, could render a portion of our inventory
incompatible with those unseasonable conditions, reduce sales
and adversely affect our business.
12
Our business
could be significantly disrupted if we cannot retain or replace
members of our management team.
Our success depends to a significant degree upon the continued
contributions of our executive officers and other key personnel,
both individually and as a group. Our future performance will be
substantially dependent on our ability to retain or replace our
executive officers and key personnel and our inability to retain
or replace our executive officers and key personnel could
prevent us from executing our business strategy.
The ownership and
leasing of significant amounts of real estate expose us to
possible liabilities.
We currently own or lease 278 stores, which subjects us to the
risks associated with owning and leasing real estate. In
particular, because of changes in the investment climate for
real estate, the value of a property could decrease, and its
operating costs could increase. Store leases generally require
us to pay a fixed minimum rent and a variable amount based on a
percentage of sales at that location. These leases generally do
not allow for termination prior to the end of the lease term
without economic consequences. If a store is not profitable and
we make the decision to close it, we may remain committed to
perform certain obligations under the lease, including the
payment of rent, for the balance of the lease term. In addition,
as each of the leases expires, we may be unable to negotiate
renewals, either on commercially acceptable terms or at all,
which could cause us to close stores in desirable locations. If
an existing owned store is not profitable and we make the
decision to close it, we may be required to record an impairment
charge
and/or exit
costs associated with the closing of that store. In addition,
lease or other obligations may restrict our right to cease
operations of an unprofitable owned or leased store, which may
cause us to continue to operate the location at a loss. A
decline in real estate values could also have an adverse effect
on our borrowing availability under our senior secured credit
facility.
Current store
locations may become less desirable, and desirable new locations
may not be available for a reasonable price, if at
all.
The success of any store depends substantially upon its
location. There can be no assurance that current locations will
continue to be desirable as demographic patterns change.
Neighborhood or economic conditions where stores are located
could decline in the future, resulting in potentially reduced
sales in those locations. In addition, if we cannot obtain
desirable new locations our sales will suffer or if we cannot
obtain these locations at reasonable prices our cost structure
will increase.
The declining
financial condition of some shopping mall operators could
adversely impact our stores.
Many shopping mall operators have been severely impacted by the
global economic downturn. As the great majority of our stores
are located in malls, we are dependent upon the continued
popularity of malls as a shopping destination for our customers.
The continuation of the economic slowdown in the United States
could impact shopping mall operators’ financial ability to
develop new shopping malls and properly maintain existing
shopping malls, which could adversely affect our sales. In
addition, the consolidation of ownership of shopping malls
through the merger or acquisition of large shopping mall
operators may give landlords increased leverage in lease
negotiations and adversely affect our ability to control our
lease costs.
Risks associated
with our private brands could adversely affect our
business.
We offer our customers quality products at competitive prices
marketed under our private brands. We expect to continue to grow
our private label offerings and have invested in our development
and procurement resources and marketing efforts related to these
exclusive brand offerings. The expansion of our private brand
offerings subjects us to certain additional risks. These
include, among others, risks related to: our failure to comply
with government and industry safety standards;
13
mandatory or voluntary product recalls related to our private
brand offerings; our ability to successfully protect our
proprietary rights in our exclusive offerings; and risks
associated with overseas sourcing and manufacturing. In
addition, damage to the reputation of our private brand trade
names may generate negative customer sentiment. Our failure to
adequately address some or all of these risks could have a
material adverse effect on our business, results of operations
and financial condition.
Our business
could be significantly disrupted and burdened with additional
costs if our associates unionize.
While we believe our relationship with our associates is good,
we cannot be assured that we will not become the subject of
unionization campaigns similar to those faced by our
competitors. The potential for unionization could increase if
the U.S. Congress passes proposed legislation called the
Employee Free Choice Act in which unions can organize based on
card check authorization rather than by secret ballot election.
This proposed legislation also provides for third-party
arbitration of collective bargaining agreements. If some or all
of our workforce were to become unionized and collective
bargaining agreement terms were significantly different from our
current compensation arrangements or work practices, it could
have a material adverse effect on our business, financial
condition and results of operations.
New legal
requirements could make our business operations more
costly.
Our results of operations could be adversely affected by new
legal requirements, including the newly enacted U.S. health
care law and potential global and domestic greenhouse gas
emission requirements and other environmental legislation and
regulations. The financial impact of these new legal
requirements cannot be determined with certainty. New laws or
regulations may result in increased direct costs to us for
compliance or may cause our vendors to raise prices to us
because of increased compliance costs or reduced availability of
raw materials.
Failure to
successfully maintain and update information technology systems
and enhance existing systems may adversely affect our
business.
To keep pace with changing technology, we must continuously
provide for the design and implementation of new information
technology systems and enhancements of our existing systems. Any
failure to adequately maintain and update the information
technology systems supporting our sales operations or inventory
control could prevent us from processing and delivering
merchandise, which could adversely affect our business,
financial condition and results of operations.
A security breach
that results in the unauthorized disclosure of Company, employee
or customer information could adversely affect our business,
reputation and financial condition.
The protection of customer, employee, and Company data is
critical to us. The regulatory environment surrounding
information security and privacy is increasingly demanding, with
the frequent imposition of new and constantly changing
requirements. In addition, customers have an expectation that we
will adequately protect their personal information. Although we
have appropriate security measures in place, our facilities and
systems, and those of our third-party service providers, could
be vulnerable to security breaches, acts of vandalism, computer
viruses, misplaced or lost data, programming
and/or human
errors or other similar events. A significant breach of
customer, employee or Company data could damage our reputation
and result in lost sales, fines or lawsuits.
14
Tim Grumbacher
has voting control over matters submitted to a vote of the
shareholders, and he may take actions that conflict with the
interests of our other shareholders and holders of our debt
securities.
Collectively, Tim Grumbacher, trusts for the benefit of
Mr. Grumbacher’s grandchildren and The Grumbacher
Family Foundation beneficially own shares of our outstanding
common stock (which is entitled to one vote per share) and
shares of our Class A common stock (which is entitled to
ten votes per share) representing, in the aggregate, more than
50% of the votes eligible to be cast by shareholders in the
election of directors and generally. Accordingly,
Mr. Grumbacher has the power to control all matters
requiring the approval of our shareholders, including the
election of directors and the approval of mergers and other
significant corporate transactions. The interests of
Mr. Grumbacher and certain other stockholders may conflict
with the interests of our other shareholders and holders of our
debt securities.
In addition to
Mr. Grumbacher’s voting control, certain provisions of
our charter documents and Pennsylvania law could discourage
potential acquisition proposals and could deter, delay or
prevent a change in control of the Company that our other
shareholders consider favorable and could depress the market
value of our common stock.
Certain provisions of our articles of incorporation and by-laws,
as well as provisions of the Pennsylvania Business Corporation
Law, could have the effect of deterring takeovers or delaying or
preventing changes in control or management of the Company that
our shareholders consider favorable and could depress the market
value of our common stock.
Subchapter F of Chapter 25 of the Pennsylvania Business
Corporation Law of 1988, which is applicable to us, may have an
anti-takeover effect and may delay, defer or prevent a tender
offer or takeover attempt that a shareholder might consider in
his or her best interest. In general, Subchapter F could delay
for five years and impose conditions upon “business
combinations” between an “interested shareholder”
and us, unless prior approval by our Board of Directors is
given. The term “business combination” is defined
broadly to include various merger, consolidation, division,
exchange or sale transactions, including transactions using our
assets for refinancing purposes. An “interested
shareholder,” in general, would be a beneficial owner of
shares entitling that person to cast at least 20% of the votes
that all shareholders would be entitled to cast in an election
of directors.
Our stock price
has been and may continue to be volatile.
The market price of our common stock has been and may continue
to be volatile and may be significantly affected by:
|
|
|
| |
•
|
actual or anticipated fluctuations in our operating results;
|
| |
| |
•
|
announcements of new services by us or our competitors;
|
| |
| |
•
|
developments with respect to conditions and trends in our
industry;
|
| |
| |
•
|
governmental regulation;
|
| |
| |
•
|
general market conditions, particularly periods of
decline; and
|
| |
| |
•
|
other factors, many of which are beyond our control.
|
|
|
|
Item 1B.
|
Unresolved Staff
Comments
|
None.
We currently operate 278 stores in 23 states, encompassing
approximately 26 million square feet. We own 32 stores,
have ground leases on eight stores, and lease 238 stores.
15
We operate under eight nameplates, as follows:
| |
|
|
|
|
|
|
|
Nameplate
|
|
Stores
|
|
States
|
|
|
|
|
|
Bon-Ton
|
|
|
69
|
|
|
Connecticut, Maryland, Massachusetts, New Hampshire, New Jersey,
New York, Pennsylvania, Vermont, West Virginia
|
|
Elder-Beerman
|
|
|
56
|
|
|
Illinois, Indiana, Kentucky, Michigan, Ohio, West Virginia,
Wisconsin
|
|
Younkers
|
|
|
49
|
|
|
Illinois, Iowa, Michigan, Minnesota, Nebraska, South Dakota,
Wisconsin
|
|
Herberger’s
|
|
|
40
|
|
|
Colorado, Iowa, Minnesota, Montana, Nebraska, North Dakota,
South Dakota, Wisconsin, Wyoming
|
|
Carson Pirie Scott
|
|
|
34
|
|
|
Illinois, Indiana
|
|
Boston Store
|
|
|
14
|
|
|
Wisconsin
|
|
Bergner’s
|
|
|
13
|
|
|
Illinois
|
|
Parisian
|
|
|
3
|
|
|
Michigan
|
Our corporate headquarters are located in York, Pennsylvania
where the majority of our administrative and sales support
functions reside and in Milwaukee, Wisconsin where our
merchandising and marketing functions are located. We own a
distribution center located in Rockford, Illinois, and we lease
two distribution centers located in Allentown, Pennsylvania and
Fairborn, Ohio. We have a furniture warehouse attached to each
of our Naperville, Illinois and Dayton, Ohio stores.
|
|
|
Item 3.
|
Legal
Proceedings
|
We are party to legal proceedings and claims that arise during
the ordinary course of business. In the opinion of management,
the ultimate outcome of any such litigation and claims will not
have a material adverse effect on the Company’s financial
condition, results of operations or liquidity.
PART II
|
|
|
Item 5.
|
Market for the
Registrant’s Common Equity, Related Stockholder Matters and
Issuer Purchases of Equity Securities
|
Our common stock is traded on The NASDAQ Global Select Stock
Market (symbol: BONT). There is no established public trading
market for our Class A common stock. The Class A
common stock is convertible on a
share-for-share
basis into common stock at the option of the holder. The
following table sets forth the high and low sales price of our
common stock for the periods indicated as furnished by NASDAQ:
| |
|
|
|
|
|
|
|
|
|
|
|
|
|
|
|
|
|
|
|
2009
|
|
|
2008
|
|
|
|
|
High
|
|
|
Low
|
|
|
High
|
|
|
Low
|
|
|
|
|
|
|
|
1st Quarter
|
|
$
|
3.25
|
|
|
$
|
1.00
|
|
|
$
|
10.50
|
|
|
$
|
4.85
|
|
|
2nd Quarter
|
|
|
5.11
|
|
|
|
2.30
|
|
|
|
10.11
|
|
|
|
4.57
|
|
|
3rd Quarter
|
|
|
9.62
|
|
|
|
3.47
|
|
|
|
6.28
|
|
|
|
1.52
|
|
|
4th Quarter
|
|
|
14.47
|
|
|
|
8.15
|
|
|
|
2.49
|
|
|
|
0.76
|
|
On March 26, 2010, we had 247 shareholders of record
of common stock and four shareholders of record of Class A
common stock.
Pursuant to our senior secured credit facility agreement, as
amended December 4, 2009, any dividends paid may not exceed
$5.0 million in any year or $20.0 million during the
term of the agreement, which expires June 4, 2013; however,
additional dividends may be paid subject to
16
meeting other requirements. Pursuant to our term loan agreement
dated November 18, 2009, any dividends paid may not exceed
$5.75 million in any year or $23.0 million during the
term of the agreement, which expires November 18, 2013;
however, additional dividends may be paid subject to meeting
other requirements. In addition, pursuant to the indenture that
governs our senior unsecured notes, any dividends paid may not
exceed $0.24 per share in any year. No dividends were declared
in 2009. We paid $0.05 per share on Class A common stock
and common stock in the first three quarters of 2008. The
dividend of $0.05 per share on Class A common stock and
common stock declared in the fourth quarter of 2008 was paid in
the first quarter of 2009. While a dividend was not declared at
its last meeting on March 15, 2010, our Board of Directors
may consider dividends in subsequent periods as it deems
appropriate.
17
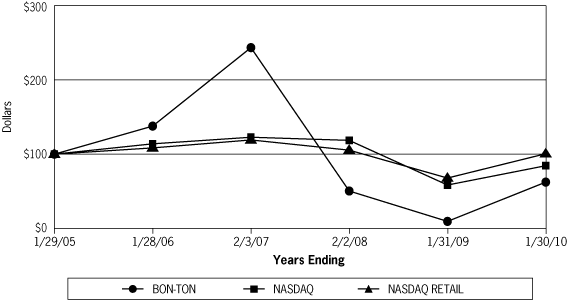
STOCK PERFORMANCE
GRAPH
The following graph compares the yearly percentage change in the
cumulative total shareholder return on the Company’s common
stock from January 29, 2005 through January 30, 2010,
and the cumulative total return on the Center for Research in
Security Prices Total Return Index for The NASDAQ Stock Market
(U.S. Companies) and the NASDAQ Retail Trade Stocks Index
during such period. The comparison assumes $100 was invested on
January 29, 2005 in the Company’s common stock and in
each of the foregoing indices and assumes the reinvestment of
any dividends.
| |
|
|
|
|
|
|
|
|
|
|
|
|
|
|
|
|
|
|
DATE
|
|
|
NASDAQ
|
|
|
NASDAQ RETAIL
|
|
|
BON-TON
|
|
|
1/29/05
|
|
|
|
|
100.00
|
|
|
|
|
100.00
|
|
|
|
|
100.00
|
|
|
|
1/28/06
|
|
|
|
|
113.92
|
|
|
|
|
108.43
|
|
|
|
|
137.79
|
|
|
|
2/3/07
|
|
|
|
|
122.80
|
|
|
|
|
119.14
|
|
|
|
|
243.53
|
|
|
|
2/2/08
|
|
|
|
|
118.58
|
|
|
|
|
105.40
|
|
|
|
|
50.35
|
|
|
|
1/31/09
|
|
|
|
|
58.40
|
|
|
|
|
67.81
|
|
|
|
|
9.41
|
|
|
|
1/30/10
|
|
|
|
|
84.43
|
|
|
|
|
100.58
|
|
|
|
|
62.32
|
|
|
|
|
|
|
|
|
|
|
|
|
|
|
|
|
|
|
|
|
18
|
|
|
Item 6.
|
Selected
Financial Data
|
| |
|
|
|
|
|
|
|
|
|
|
|
|
|
|
|
|
|
|
|
|
|
|
|
|
|
|
|
|
|
|
|
|
|
|
|
|
|
|
|
|
|
|
|
2009
|
|
|
2008
|
|
|
2007
|
|
|
2006
|
|
|
2005
|
|
|
|
|
|
|
|
(In thousands except share, per share, comparable stores data
and number of stores)
|
|
|
Statement of Operations Data (1) (2) (3):
|
|
|
|
|
%
|
|
|
|
|
|
%
|
|
|
|
|
|
%
|
|
|
|
|
|
%
|
|
|
|
|
|
%
|
|
|
|
|
|
|
|
|
|
|
|
|
|
|
|
|
|
|
|
|
|
|
|
|
|
|
|
|
|
|
|
|
|
|
|
|
|
|
|
|
|
|
|
|
|
|
|
|
|
Net sales
|
|
$
|
2,959,824
|
|
|
|
100.0
|
|
|
$
|
3,129,967
|
|
|
|
100.0
|
|
|
$
|
3,365,912
|
|
|
|
100.0
|
|
|
$
|
3,362,279
|
|
|
|
100.0
|
|
|
$
|
1,287,170
|
|
|
|
100.0
|
|
|
|
|
|
|
|
|
|
|
|
|
|
|
|
|
|
|
|
|
|
|
|
|
|
|
|
|
|
|
|
|
|
|
|
|
|
|
|
|
|
|
|
|
Other income
|
|
|
75,113
|
|
|
|
2.5
|
|
|
|
95,448
|
|
|
|
3.0
|
|
|
|
102,657
|
|
|
|
3.0
|
|
|
|
93,531
|
|
|
|
2.8
|
|
|
|
20,425
|
|
|
|
1.6
|
|
|
|
|
|
|
|
|
|
|
|
|
|
|
|
|
|
|
|
|
|
|
|
|
|
|
|
|
|
|
|
|
|
|
|
|
|
|
|
|
|
|
|
|
Gross profit
|
|
|
1,097,632
|
|
|
|
37.1
|
|
|
|
1,095,007
|
|
|
|
35.0
|
|
|
|
1,215,781
|
|
|
|
36.1
|
|
|
|
1,243,517
|
|
|
|
37.0
|
|
|
|
464,999
|
|
|
|
36.1
|
|
|
|
|
|
|
|
|
|
|
|
|
|
|
|
|
|
|
|
|
|
|
|
|
|
|
|
|
|
|
|
|
|
|
|
|
|
|
|
|
|
|
|
|
Selling, general and administrative expenses
|
|
|
963,639
|
|
|
|
32.6
|
|
|
|
1,033,525
|
|
|
|
33.0
|
|
|
|
1,066,663
|
|
|
|
31.7
|
|
|
|
1,056,472
|
|
|
|
31.4
|
|
|
|
407,145
|
|
|
|
31.6
|
|
|
|
|
|
|
|
|
|
|
|
|
|
|
|
|
|
|
|
|
|
|
|
|
|
|
|
|
|
|
|
|
|
|
|
|
|
|
|
|
|
|
|
|
Depreciation and amortization
|
|
|
111,635
|
|
|
|
3.8
|
|
|
|
117,382
|
|
|
|
3.8
|
|
|
|
117,055
|
|
|
|
3.5
|
|
|
|
100,266
|
|
|
|
3.0
|
|
|
|
27,245
|
|
|
|
2.1
|
|
|
|
|
|
|
|
|
|
|
|
|
|
|
|
|
|
|
|
|
|
|
|
|
|
|
|
|
|
|
|
|
|
|
|
|
|
|
|
|
|
|
|
|
Amortization of lease-related interests
|
|
|
4,866
|
|
|
|
0.2
|
|
|
|
4,866
|
|
|
|
0.2
|
|
|
|
4,978
|
|
|
|
0.1
|
|
|
|
3,720
|
|
|
|
0.1
|
|
|
|
839
|
|
|
|
0.1
|
|
|
|
|
|
|
|
|
|
|
|
|
|
|
|
|
|
|
|
|
|
|
|
|
|
|
|
|
|
|
|
|
|
|
|
|
|
|
|
|
|
|
|
|
Goodwill impairment
|
|
|
—
|
|
|
|
—
|
|
|
|
17,767
|
|
|
|
0.6
|
|
|
|
—
|
|
|
|
—
|
|
|
|
—
|
|
|
|
—
|
|
|
|
—
|
|
|
|
—
|
|
|
|
|
|
|
|
|
|
|
|
|
|
|
|
|
|
|
|
|
|
|
|
|
|
|
|
|
|
|
|
|
|
|
|
|
|
|
|
|
|
|
|
|
Other impairment charges
|
|
|
5,883
|
|
|
|
0.2
|
|
|
|
25,905
|
|
|
|
0.8
|
|
|
|
4,070
|
|
|
|
0.1
|
|
|
|
2,923
|
|
|
|
0.1
|
|
|
|
—
|
|
|
|
—
|
|
|
|
|
|
|
|
|
|
|
|
|
|
|
|
|
|
|
|
|
|
|
|
|
|
|
|
|
|
|
|
|
|
|
|
|
|
|
|
|
|
|
|
|
Income (loss) from operations
|
|
|
86,722
|
|
|
|
2.9
|
|
|
|
(8,990
|
)
|
|
|
(0.3
|
)
|
|
|
125,672
|
|
|
|
3.7
|
|
|
|
173,667
|
|
|
|
5.2
|
|
|
|
50,195
|
|
|
|
3.9
|
|
|
|
|
|
|
|
|
|
|
|
|
|
|
|
|
|
|
|
|
|
|
|
|
|
|
|
|
|
|
|
|
|
|
|
|
|
|
|
|
|
|
|
|
Interest expense, net
|
|
|
98,808
|
|
|
|
3.3
|
|
|
|
97,847
|
|
|
|
3.1
|
|
|
|
108,165
|
|
|
|
3.2
|
|
|
|
107,143
|
|
|
|
3.2
|
|
|
|
12,052
|
|
|
|
0.9
|
|
|
|
|
|
|
|
|
|
|
|
|
|
|
|
|
|
|
|
|
|
|
|
|
|
|
|
|
|
|
|
|
|
|
|
|
|
|
|
|
|
|
|
|
(Loss) income before taxes
|
|
|
(12,086
|
)
|
|
|
(0.4
|
)
|
|
|
(106,837
|
)
|
|
|
(3.4
|
)
|
|
|
17,507
|
|
|
|
0.5
|
|
|
|
66,524
|
|
|
|
2.0
|
|
|
|
38,143
|
|
|
|
3.0
|
|
|
|
|
|
|
|
|
|
|
|
|
|
|
|
|
|
|
|
|
|
|
|
|
|
|
|
|
|
|
|
|
|
|
|
|
|
|
|
|
|
|
|
|
Income tax (benefit) provision(4)
|
|
|
(8,031
|
)
|
|
|
(0.3
|
)
|
|
|
63,093
|
|
|
|
2.0
|
|
|
|
5,945
|
|
|
|
0.2
|
|
|
|
19,641
|
|
|
|
0.6
|
|
|
|
12,129
|
|
|
|
0.9
|
|
|
|
|
|
|
|
|
|
|
|
|
|
|
|
|
|
|
|
|
|
|
|
|
|
|
|
|
|
|
|
|
|
|
|
|
|
|
|
|
|
|
|
|
Net (loss) income
|
|
|
(4,055
|
)
|
|
|
(0.1
|
)
|
|
|
(169,930
|
)
|
|
|
(5.4
|
)
|
|
|
11,562
|
|
|
|
0.3
|
|
|
|
46,883
|
|
|
|
1.4
|
|
|
|
26,014
|
|
|
|
2.0
|
|
|
|
|
|
|
|
|
|
|
|
|
|
|
|
|
|
|
|
|
|
|
|
|
|
|
|
|
|
|
|
|
|
|
|
|
|
|
|
|
|
|
|
|
Per share amounts -
|
|
|
|
|
|
|
|
|
|
|
|
|
|
|
|
|
|
|
|
|
|
|
|
|
|
|
|
|
|
|
|
|
|
|
|
|
|
|
|
|
|
|
|
|
|
|
|
|
|
|
|
|
|
|
|
|
|
|
|
|
|
|
|
|
|
|
|
|
|
|
|
|
|
|
|
|
|
|
|
|
|
|
|
Basic:
|
|
|
|
|
|
|
|
|
|
|
|
|
|
|
|
|
|
|
|
|
|
|
|
|
|
|
|
|
|
|
|
|
|
|
|
|
|
|
|
|
|
|
|
|
|
|
|
|
|
|
|
|
|
|
|
|
|
|
|
|
|
|
|
|
|
|
|
|
|
|
|
|
|
|
|
|
|
|
|
|
|
|
|
Net (loss) income
|
|
$
|
(0.24
|
)
|
|
|
|
|
|
$
|
(10.12
|
)
|
|
|
|
|
|
$
|
0.67
|
|
|
|
|
|
|
$
|
2.75
|
|
|
|
|
|
|
$
|
1.56
|
|
|
|
|
|
|
|
|
|
|
|
|
|
|
|
|
|
|
|
|
|
|
|
|
|
|
|
|
|
|
|
|
|
|
|
|
|
|
|
|
|
|
|
|
|
|
|
|
Diluted:
|
|
|
|
|
|
|
|
|
|
|
|
|
|
|
|
|
|
|
|
|
|
|
|
|
|
|
|
|
|
|
|
|
|
|
|
|
|
|
|
|
|
|
|
|
|
|
|
|
|
|
|
|
|
|
|
|
|
|
|
|
|
|
|
|
|
|
|
|
|
|
|
|
|
|
|
|
|
|
|
|
|
|
|
Net (loss) income
|
|
$
|
(0.24
|
)
|
|
|
|
|
|
$
|
(10.12
|
)
|
|
|
|
|
|
$
|
0.67
|
|
|
|
|
|
|
$
|
2.73
|
|
|
|
|
|
|
$
|
1.54
|
|
|
|
|
|
|
|
|
|
|
|
|
|
|
|
|
|
|
|
|
|
|
|
|
|
|
|
|
|
|
|
|
|
|
|
|
|
|
|
|
|
|
|
|
|
|
|
|
Cash dividends declared per share
|
|
$
|
—
|
|
|
|
|
|
|
$
|
0.20
|
|
|
|
|
|
|
$
|
0.20
|
|
|
|
|
|
|
$
|
0.10
|
|
|
|
|
|
|
$
|
0.10
|
|
|
|
|
|
|
|
|
|
|
|
|
|
|
|
|
|
|
|
|
|
|
|
|
|
|
|
|
|
|
|
|
|
|
|
|
|
|
|
|
|
|
|
|
|
|
|
|
Balance Sheet Data (at end of period)(3):
|
|
|
|
|
|
|
|
|
|
|
|
|
|
|
|
|
|
|
|
|
|
|
|
|
|
|
|
|
|
|
|
|
|
|
|
|
|
|
|
|
|
|
|
|
|
|
|
|
|
|
|
|
|
|
|
|
|
|
|
|
|
|
|
|
|
|
|
|
|
|
|
|
|
|
|
|
|
|
|
|
|
|
|
|
|
|
|
Working capital
|
|
$
|
365,933
|
|
|
|
|
|
|
$
|
424,437
|
|
|
|
|
|
|
$
|
426,451
|
|
|
|
|
|
|
$
|
402,414
|
|
|
|
|
|
|
$
|
143,119
|
|
|
|
|
|
|
|
|
|
|
|
|
|
|
|
|
|
|
|
|
|
|
|
|
|
|
|
|
|
|
|
|
|
|
|
|
|
|
|
|
|
|
|
|
|
|
|
|
Total assets
|
|
|
1,722,007
|
|
|
|
|
|
|
|
1,821,321
|
|
|
|
|
|
|
|
2,067,631
|
|
|
|
|
|
|
|
2,134,799
|
|
|
|
|
|
|
|
561,343
|
|
|
|
|
|
|
|
|
|
|
|
|
|
|
|
|
|
|
|
|
|
|
|
|
|
|
|
|
|
|
|
|
|
|
|
|
|
|
|
|
|
|
|
|
|
|
|
|
Long-term debt, including capital
leases
|
|
|
1,016,720
|
|
|
|
|
|
|
|
1,148,768
|
|
|
|
|
|
|
|
1,147,058
|
|
|
|
|
|
|
|
1,189,625
|
|
|
|
|
|
|
|
42,515
|
|
|
|
|
|
|
|
|
|
|
|
|
|
|
|
|
|
|
|
|
|
|
|
|
|
|
|
|
|
|
|
|
|
|
|
|
|
|
|
|
|
|
|
|
|
|
|
|
Shareholders’ equity
|
|
|
141,756
|
|
|
|
|
|
|
|
134,177
|
|
|
|
|
|
|
|
363,061
|
|
|
|
|
|
|
|
346,396
|
|
|
|
|
|
|
|
292,094
|
|
|
|
|
|
|
|
|
|
|
|
|
|
|
|
|
|
|
|
|
|
|
|
|
|
|
|
|
|
|
|
|
|
|
|
|
|
|
|
|
|
|
|
|
|
|
|
|
Selected Operating Data:
|
|
|
|
|
|
|
|
|
|
|
|
|
|
|
|
|
|
|
|
|
|
|
|
|
|
|
|
|
|
|
|
|
|
|
|
|
|
|
|
|
|
|
|
|
|
|
|
|
|
|
|
|
|
|
|
|
|
|
|
|
|
|
|
|
|
|
|
|
|
|
|
|
|
|
|
|
|
|
|
|
|
|
|
|
|
|
|
Total sales change
|
|
|
(5.4
|
)%
|
|
|
|
|
|
|
(7.0
|
)%
|
|
|
|
|
|
|
0.1
|
%
|
|
|
|
|
|
|
161.0
|
%
|
|
|
|
|
|
|
(1.8
|
)%
|
|
|
|
|
|
|
|
|
|
|
|
|
|
|
|
|
|
|
|
|
|
|
|
|
|
|
|
|
|
|
|
|
|
|
|
|
|
|
|
|
|
|
|
|
|
|
|
Comparable stores sales change(5)
|
|
|
(5.4
|
)%
|
|
|
|
|
|
|
(7.4
|
)%
|
|
|
|
|
|
|
(6.5
|
)%
|
|
|
|
|
|
|
(2.7
|
)%
|
|
|
|
|
|
|
(1.6
|
)%
|
|
|
|
|
|
|
|
|
|
|
|
|
|
|
|
|
|
|
|
|
|
|
|
|
|
|
|
|
|
|
|
|
|
|
|
|
|
|
|
|
|
|
|
|
|
|
|
Comparable stores data(5):
|
|
|
|
|
|
|
|
|
|
|
|
|
|
|
|
|
|
|
|
|
|
|
|
|
|
|
|
|
|
|
|
|
|
|
|
|
|
|
|
|
|
|
|
|
|
|
|
|
|
|
|
|
|
|
|
|
|
|
|
|
|
|
|
|
|
|
|
|
|
|
|
|
|
|
|
|
|
|
|
|
|
|
|
Sales per selling square foot
|
|
$
|
135
|
|
|
|
|
|
|
$
|
141
|
|
|
|
|
|
|
$
|
117
|
|
|
|
|
|
|
$
|
125
|
|
|
|
|
|
|
$
|
128
|
|
|
|
|
|
|
|
|
|
|
|
|
|
|
|
|
|
|
|
|
|
|
|
|
|
|
|
|
|
|
|
|
|
|
|
|
|
|
|
|
|
|
|
|
|
|
|
|
Selling square footage
|
|
|
21,763,000
|
|
|
|
|
|
|
|
21,829,000
|
|
|
|
|
|
|
|
9,478,000
|
|
|
|
|
|
|
|
9,819,000
|
|
|
|
|
|
|
|
10,069,000
|
|
|
|
|
|
|
|
|
|
|
|
|
|
|
|
|
|
|
|
|
|
|
|
|
|
|
|
|
|
|
|
|
|
|
|
|
|
|
|
|
|
|
|
|
|
|
|
|
Capital expenditures
|
|
$
|
32,346
|
|
|
|
|
|
|
$
|
84,810
|
|
|
|
|
|
|
$
|
109,659
|
|
|
|
|
|
|
$
|
95,209
|
|
|
|
|
|
|
$
|
28,159
|
|
|
|
|
|
|
|
|
|
|
|
|
|
|
|
|
|
|
|
|
|
|
|
|
|
|
|
|
|
|
|
|
|
|
|
|
|
|
|
|
|
|
|
|
|
|
|
|
Number of stores:
|
|
|
|
|
|
|
|
|
|
|
|
|
|
|
|
|
|
|
|
|
|
|
|
|
|
|
|
|
|
|
|
|
|
|
|
|
|
|
|
|
|
|
|
|
|
|
|
|
|
|
|
|
|
|
|
|
|
|
|
|
|
|
|
|
|
|
|
|
|
|
|
|
|
|
|
|
|
|
|
|
|
|
|
Beginning of year
|
|
|
281
|
|
|
|
|
|
|
|
280
|
|
|
|
|
|
|
|
283
|
|
|
|
|
|
|
|
137
|
|
|
|
|
|
|
|
141
|
|
|
|
|
|
|
|
|
|
|
|
|
|
|
|
|
|
|
|
|
|
|
|
|
|
|
|
|
|
|
|
|
|
|
|
|
|
|
|
|
|
|
|
|
|
|
|
|
Additions(6)
|
|
|
—
|
|
|
|
|
|
|
|
2
|
|
|
|
|
|
|
|
2
|
|
|
|
|
|
|
|
147
|
|
|
|
|
|
|
|
—
|
|
|
|
|
|
|
|
|
|
|
|
|
|
|
|
|
|
|
|
|
|
|
|
|
|
|
|
|
|
|
|
|
|
|
|
|
|
|
|
|
|
|
|
|
|
|
|
|
Closings
|
|
|
(3
|
)
|
|
|
|
|
|
|
(1
|
)
|
|
|
|
|
|
|
(5
|
)
|
|
|
|
|
|
|
(1
|
)
|
|
|
|
|
|
|
(4
|
)
|
|
|
|
|
|
|
|
|
|
|
|
|
|
|
|
|
|
|
|
|
|
|
|
|
|
|
|
|
|
|
|
|
|
|
|
|
|
|
|
|
|
|
|
|
|
|
|
End of year
|
|
|
278
|
|
|
|
|
|
|
|
281
|
|
|
|
|
|
|
|
280
|
|
|
|
|
|
|
|
283
|
|
|
|
|
|
|
|
137
|
|
|
|
|
|
|
|
|
|
(1)
|
|
2006 includes operations of NDSG
for the period from March 5, 2006 through February 3,
2007.
|
| |
|
(2)
|
|
2006 reflects the 53 weeks
ended February 3, 2007. All other periods presented include
52 weeks.
|
| |
|
(3)
|
|
Certain prior year balances have
been reclassified to conform to the current year presentation.
These reclassifications did not impact the Company’s net
income for any of the years presented.
|
| |
|
(4)
|
|
2009 reflects an income tax benefit
adjustment of $6,340 related to a deferred tax asset valuation
allowance release associated with implementation of tax
carry-back provisions available under legislation enacted in
2009, partially offset by certain other valuation allowance
increases; 2008 reflects an increase to the provision of
$108,495 for a charge relating to a deferred tax valuation
allowance and a decrease to the provision of $7,038 resulting
from a
statute-of-limitations
expiration.
|
| |
|
(5)
|
|
Comparable stores data (sales
change, sales per selling square foot and selling square
footage) reflects stores open for the entire current and prior
fiscal year. 2007 and prior years’ comparable stores data
do not include NDSG.
|
| |
|
(6)
|
|
Includes the addition of 142 stores
pursuant to the acquisition of NDSG and four stores from Belk,
Inc. during 2006.
|
19
|
|
|
Item 7.
|
Management’s
Discussion and Analysis of Financial Condition and Results of
Operations
|
Overview
General
We compete in the department store segment of the
U.S. retail industry. Founded in 1898, the Company is one
of the largest regional department store operators, offering a
broad assortment of brand-name fashion apparel and accessories
for women, men and children as well as cosmetics, home
furnishings and other goods. We currently operate 278 stores in
23 states in the Northeast, Midwest and upper Great Plains
under the Bon-Ton, Bergner’s, Boston Store, Carson Pirie
Scott, Elder-Beerman, Herberger’s and Younkers nameplates
and, in the Detroit, Michigan area, under the Parisian
nameplate, encompassing a total of approximately 26 million
square feet. The Company had net sales of $3.0 billion in
2009.
Economic Factors
and Company Performance
Since September 2008, the U.S. economy has experienced,
among other things, significant increases in unemployment,
flat-to-falling
consumer income levels, a tightening of credit availability and
general reduction in household wealth. The challenging credit
markets and economic weakness and uncertainty have led to a
substantial deterioration in consumer confidence and, we
believe, consumer spending, impacting us as well as most other
companies in our industry.
During 2009, in light of the macroeconomic decline that
adversely impacted our sales, we continued to focus on adjusting
our cost structure and improving liquidity. We implemented
inventory management and cost-reduction initiatives to
appropriately size our business and improve our financial
performance; benefits realized from these measures included
increased gross profit dollars and decreased SG&A expenses.
Our improved performance contributed to increased cash flows
from operations, which enabled us to significantly reduce our
debt.
We are cautiously optimistic about the economic environment for
2010. We will continue to focus on sales and marketing
initiatives to positively impact our sales performance,
particularly when economic conditions improve, as well as
assessing options to further reduce our cost structure.
Assumptions in our 2010 projections include:
|
|
|
| |
•
|
a comparable store sales performance ranging from flat to a 2.0%
increase;
|
| |
| |
•
|
a gross margin rate of 37.1%, consistent with the 2009 rate;
|
| |
| |
•
|
a reduction of $20.0 million to $25.0 million in our
SG&A expenses; and
|
| |
| |
•
|
an effective tax rate of 0%.
|
New and Amended
Credit Facilities
In an effort to provide the Company with increased liquidity to
support our growth, on November 18, 2009, we entered into a
$75.0 million Second Lien Term Loan Credit Facility (the
“Term Loan Facility”), which will mature on
November 18, 2013. Proceeds from the transaction were used
to increase liquidity by paying a portion of the outstanding
borrowings under our Loan and Security Agreement (the “2006
Revolving Credit Facility”) and to pay related fees and
expenses. See “Liquidity and Capital Resources,”
below, and Note 9 in the Notes to Consolidated Financial
Statements for further discussion.
On December 4, 2009, we entered into a $675.0 million
3.5-year senior secured Amended and Restated Loan and Security
Agreement (the “Amended Revolving Credit Facility”),
which will expire on June 4, 2013. The Amended Revolving
Credit Facility replaced our existing $800.0 million
asset-based 2006 Revolving Credit Facility, which was scheduled
to mature on March 6, 2011. The proceeds of the Amended
Revolving Credit Facility were used to pay the outstanding
balance under
20
the 2006 Revolving Credit Facility and will be used for other
general corporate purposes. See “Liquidity and Capital
Resources,” below, and Note 9 in the Notes to
Consolidated Financial Statements for further discussion.
Results of
Operations
The following table summarizes changes in our selected operating
indicators, illustrating the relationship of various income and
expense items to net sales for each year presented (components
may not add or subtract to totals because of rounding):
| |
|
|
|
|
|
|
|
|
|
|
|
|
|
|
|
Percent of Net Sales
|
|
|
|
|
2009
|
|
|
2008
|
|
|
2007
|
|
|
|
|
|
|
|
Net sales
|
|
|
100.0
|
%
|
|
|
100.0
|
%
|
|
|
100.0
|
%
|
|
|
|
Other income
|
|
|
2.5
|
|
|
|
3.0
|
|
|
|
3.0
|
|
|
|
|
|
|
|
102.5
|
|
|
|
103.0
|
|
|
|
103.0
|
|
|
|
|
Costs and expenses:
|
|
|
|
|
|
|
|
|
|
|
|
|
|
Costs of merchandise sold
|
|
|
62.9
|
|
|
|
65.0
|
|
|
|
63.9
|
|
|
Selling, general and administrative
|
|
|
32.6
|
|
|
|
33.0
|
|
|
|
31.7
|
|
|
Depreciation and amortization
|
|
|
3.8
|
|
|
|
3.8
|
|
|
|
3.5
|
|
|
Amortization of lease-related interests
|
|
|
0.2
|
|
|
|
0.2
|
|
|
|
0.1
|
|
|
Goodwill impairment
|
|
|
—
|
|
|
|
0.6
|
|
|
|
—
|
|
|
Other impairment charges
|
|
|
0.2
|
|
|
|
0.8
|
|
|
|
0.1
|
|
|
|
|
Income (loss) from operations
|
|
|
2.9
|
|
|
|
(0.3
|
)
|
|
|
3.7
|
|
|
Interest expense, net
|
|
|
3.3
|
|
|
|
3.1
|
|
|
|
3.2
|
|
|
|
|
(Loss) income before income taxes
|
|
|
(0.4
|
)
|
|
|
(3.4
|
)
|
|
|
0.5
|
|
|
Income tax (benefit) provision
|
|
|
(0.3
|
)
|
|
|
2.0
|
|
|
|
0.2
|
|
|
|
|
Net (loss) income
|
|
|
(0.1
|
)%
|
|
|
(5.4
|
)%
|
|
|
0.3
|
%
|
|
|
2009 Compared
with 2008
Net sales: Net sales in 2009 were
$2,959.8 million, a decrease of 5.4% from
$3,130.0 million in 2008. Comparable store sales decreased
5.4% from the prior year. We believe sales were depressed
throughout the year primarily due to wavering consumer
confidence and numerous economic factors that negatively
impacted consumers’ discretionary spending. Additionally,
due to inventory management efforts, there was significantly
less clearance inventory throughout 2009 compared with the prior
year, further challenging sales.
The best performing merchandise categories in the period were
Moderate Sportswear (included in Women’s Apparel) and
Accessories. Sales in Moderate Sportswear have benefited from
what we believe is a shift in our customers’ spending
patterns in response to the economic situation in 2009 as our
moderate offerings provide the value our customers are seeking.
Sales increases in Accessories also reflect favorable customer
response to trend-right, value-priced private brand and branded
product. Similar success in sales of moderate goods was achieved
throughout all families of business.
The poor performances of Better Sportswear (included in
Women’s Apparel) and Furniture (included in Home) also
suggest our customers are spending their limited discretionary
dollars on more moderately-priced merchandise. Better Sportswear
was the most difficult business in
21
Women’s Apparel in 2009, as economic conditions and the
loss of several key branded vendors challenged sales. Furniture
sales continue to be adversely impacted by the difficult housing
market and continued deterioration in consumer spending for
bigger ticket items.
Other income: Other income, which includes
income from revenues received under our credit card program
agreement with HSBC, leased departments and other customer
revenues, was $75.1 million, or 2.5% of net sales, in 2009
as compared with $95.4 million, or 3.0% of net sales, in
2008. The decrease was primarily due to reduced sales volume and
reduced income associated with our proprietary credit card
program. Proprietary credit card income decreased as a result of
lower sales volume as well as an amendment to the credit card
program agreement with HSBC. Other income was reduced by
$9.0 million in 2009 pursuant to the amended agreement with
HSBC which revises the compensation the Company receives for
certain types of credit sales and provides that the Company and
HSBC will share certain losses associated with the credit card
program. See Note 19 in the Notes to Consolidated Financial
Statements.
Costs and expenses: Despite the decrease in
sales volume, we effectively managed our inventory throughout
the year such that gross margin dollars increased
$2.6 million to $1,097.6 million in 2009, compared
with $1,095.0 million in 2008. The increase in gross margin
dollars reflects an improvement in the gross margin rate of
210 basis points, primarily due to a reduction in the net
markdown rate. Gross margin as a percentage of sales increased
to 37.1% in the current year from 35.0% in the prior year.
SG&A expense decreased $69.9 million to
$963.6 million in 2009 as compared with
$1,033.5 million in 2008, reflecting the successful
execution of our cost savings initiatives. The decrease
primarily resulted from expense reductions in payroll and
advertising in response to our sales trend. The expense rate in
2009 decreased 50 basis points to 32.6% of net sales,
compared with 33.0% in 2008.
Depreciation and amortization expense and amortization of
lease-related interests decreased $5.7 million, to
$116.5 million in 2009 from $122.2 million in 2008,
primarily due to the reduced asset base resulting from
significant asset impairment charges recorded in the fourth
quarter of 2008 and reduced capital expenditures.
In the second quarter of 2008, we recorded a non-cash charge of
$17.8 million to fully impair our goodwill. See
Notes 1 and 3 in the Notes to Consolidated Financial
Statements.
In 2009, we recorded $5.7 million of non-cash asset
impairment charges which resulted in a reduction in the carrying
amount of certain store and distribution center properties. We
recorded charges of $17.9 million for similar asset
impairments in 2008. See Notes 1 and 2 in the Notes to
Consolidated Financial Statements.
In 2009, we recorded non-cash impairment charges of
$0.2 million related to the reduction in the value of two
indefinite-lived private label brand names. In 2008, we recorded
impairment charges of $8.1 million related to the reduction
in the value of four indefinite-lived trade names and two
indefinite-lived private label brand names. See Notes 1 and
3 in the Notes to Consolidated Financial Statements.
Income (loss) from operations: Income from
operations in 2009 was $86.7 million, or 2.9% of net sales,
as compared with a loss from operations of $(9.0) million,
or (0.3)% of net sales, in 2008.
Interest expense, net: Net interest expense in
2009 was $98.8 million, or 3.3% of net sales, as compared
with $97.8 million, or 3.1% of net sales, in 2008. The
$1.0 million increase primarily reflects interest expense
associated with interest rate swaps and the new term loan,
deferred fees as a result of the amended and new credit
facilities and the ineffectiveness of the interest rate swaps,
partially offset by decreased borrowing levels and reduced
interest rates in the first three quarters of 2009.
22
Income tax (benefit) provision: An income tax
benefit of $(8.0) million was recorded in 2009, primarily
due to deferred tax asset valuation allowance releases
associated with implementation of the carry-back provisions of
The Worker, Homeownership, and Business Assistance Act of
2009. This compares favorably with an income tax provision
of $63.1 million in 2008. The 2008 income tax provision
includes an unfavorable $108.5 million tax expense
adjustment in the fourth quarter of 2008 pursuant to
establishment of an additional valuation allowance against our
deferred tax assets and a favorable $7.0 million tax
benefit adjustment in the third quarter of 2008 related to
expiration of certain exposures.
Net loss: The net loss in 2009 was
$4.1 million, or 0.1% of net sales, as compared with a net
loss of $169.9 million, or 5.4% of net sales, in 2008.
2008 Compared
with 2007
Net sales: Net sales in 2008 decreased 7.0% to
$3,130.0 million from $3,365.9 million in 2007.
Comparable store sales decreased 7.4% from the prior year. We
believe the comparable store sales decline reflects a confluence
of factors that created an adverse economic environment
throughout the year, particularly the last quarter of 2008,
which weakened consumer sentiment and pressured spending.
The best performing merchandise category in the period was
Children’s Apparel. Sales increases in this category
primarily reflect expanded and improved product selection in
branded playwear and outerwear. The poorest performing
categories in the period were Furniture (included in Home) and
Moderate Sportswear and Dresses (both included in Women’s
Apparel). Furniture sales were impacted by the difficult housing
market in new construction and existing home sales, and
continued deterioration in consumer spending for more expensive
items. Moderate Sportswear and Dresses have been impacted by the
challenging economic environment, which has resulted in reduced
consumer spending on discretionary items. Sales in Moderate
Sportswear were also affected by the decision made in 2007 by
certain of our key vendors to exit the moderate sportswear
business. It was not until the fall of 2008 that we began
receiving merchandise from new, replacement vendors.
Other income: Other income, which includes
income from revenues received under our credit card program
agreement with HSBC, leased departments and other customer
revenues, was $95.4 million, or 3.0% of net sales, in 2008
as compared with $102.7 million, or 3.0% of net sales, in
2007. The decrease primarily reflects reduced sales volume in
2008.
Costs and expenses: Gross margin dollars in
2008 were $1,095.0 million as compared with
$1,215.8 million in 2007, a decrease of
$120.8 million. The decrease in gross margin dollars
reflects the reduced sales volume and a decrease in the gross
margin rate. Gross margin as a percentage of sales decreased
110 basis points to 35.0% in 2008 from 36.1% in 2007. The
decrease in the gross margin rate primarily reflects an
increased net markdown rate in response to the challenging
economic environment.
SG&A expense in 2008 was $1,033.5 million as compared
with $1,066.7 million in 2007, a decrease of
$33.1 million. The decrease primarily resulted from expense
reductions in payroll, benefits and advertising in response to
our sales trend. Other expense reductions were due to increased
efficiencies in operations and 2007 store closing expenses.
Despite the expense savings, the expense rate in 2008 increased
130 basis points to 33.0% of net sales, compared with 31.7%
in 2007, due to the reduced sales volume.
In 2008, depreciation and amortization expense and amortization
of lease-related interests increased $0.2 million, to
$122.2 million, from $122.0 million in 2007.
We recorded a non-cash goodwill impairment charge of
$17.8 million in the second quarter of 2008. Based upon our
review, the fair value of our single reporting unit, estimated
using a combination of our common stock trading value as of the
end of the second quarter of 2008, a
23
discounted cash flow analysis and other generally accepted
valuation methodologies, was less than the carrying amount.
There was no such charge in 2007. See Notes 1 and 3 in the
Notes to Consolidated Financial Statements.
In the fourth quarter of 2008, we recorded $17.9 million of
non-cash asset impairment charges which resulted in a reduction
in the carrying amount of certain store properties. We recorded
charges of $2.7 million for asset impairments in 2007. See
Notes 1 and 2 in the Notes to Consolidated Financial
Statements.
In the fourth quarter of 2008, a review was completed of the
value of certain intangible assets. As a result of our
assessment, we recorded non-cash asset impairment charges of
$8.1 million related to the reduction in the value of four
indefinite-lived trade names and two indefinite-lived private
label brand names. In 2007, we recorded impairment charges of
$1.3 million related to the reduction in the value of two
indefinite-lived private label brand names. See Notes 1 and
3 in the Notes to Consolidated Financial Statements.
(Loss) income from operations: The loss from
operations in 2008 was $(9.0) million, or (0.3)% of net
sales, as compared with income from operations of
$125.7 million, or 3.7% of net sales, in 2007.
Interest expense, net: Net interest expense in
2008 was $97.8 million, or 3.1% of net sales, as compared
with $108.2 million, or 3.2% of net sales, in 2007. The
$10.3 million decrease primarily reflects decreased
borrowing levels and reduced interest rates in 2008 and
$1.0 million of expense incurred for the early
extinguishment of debt in 2007.
Income tax provision: The income tax provision
reflects an effective tax rate of (59.1)% in 2008, compared with
34.0% in 2007. The 2008 income tax provision includes an
unfavorable $108.5 million tax expense adjustment in the
fourth quarter of 2008 pursuant to establishment of an
additional valuation allowance against our deferred tax assets
and a favorable $7.0 million tax benefit adjustment in the
third quarter of 2008 related to expiration of certain exposures.
Net (loss) income: Net loss in 2008 was
$(169.9) million, or (5.4)% of net sales, as compared with
net income of $11.6 million, or 0.3% of net sales, in 2007.
Liquidity and
Capital Resources
At January 30, 2010, we had $18.9 million in cash and
cash equivalents and $358.2 million available under our
Amended Revolving Credit Facility (before taking into account
the minimum borrowing availability of $75.0 million). We
generated significant operating cash flow in 2009, allowing us
to reduce our debt by $128.3 million, or 11.1%, and invest
in business initiatives.
In anticipation of economic uncertainty in 2010, we will
continue our focus on effective cash management and maintaining
a strong balance sheet with ample liquidity. We have identified
further opportunities for expense reductions and will continue
to control inventory levels in order to benefit our working
capital needs. We anticipate these actions will positively
impact our 2010 cash flow.
Typically, cash flows from operations are impacted by consumer
confidence, weather in the geographic markets served by the
Company, and economic and competitive conditions existing in the
retail industry; a downturn in any single factor or a
combination of factors could have a material adverse impact upon
our ability to generate sufficient cash flows to operate our
business. While the current economic uncertainty affects our
assessment of short-term liquidity, we consider our resources
(cash flows from operations supplemented by borrowings under the
credit facility) adequate to satisfy our 2010 cash needs. While
there can be no assurances, management believes there should be
sufficient liquidity to cover our short-term funding needs.
24
The following table summarizes material measures of our
liquidity and capital resources:
| |
|
|
|
|
|
|
|
|
|
|
|
|
|
|
|
January 30,
|
|
|
January 31,
|
|
|
February 2,
|
|
|
(Dollars in millions)
|
|
2010
|
|
|
2009
|
|
|
2008
|
|
|
|
|
|
|
|
Working capital
|
|
$
|
365.9
|
|
|
$
|
424.4
|
|
|
$
|
426.5
|
|
|
Current ratio
|
|
|
1.91:1
|
|
|
|
2.13:1
|
|
|
|
1.96:1
|
|
|
Debt to total capitalization(1)
|
|
|
0.88:1
|
|
|
|
0.90:1
|
|
|
|
0.76:1
|
|
|
Unused availability under lines of credit(2)
|
|
$
|
358.2
|
|
|
$
|
268.7
|
|
|
$
|
351.0
|
|
|
|
|
|
(1) |
|
Debt includes obligations under capital leases. Total
capitalization includes shareholders’ equity and debt. |
| |
|
(2) |
|
Subject to a minimum borrowing availability covenant of
$75.0 million. |
Our primary sources of working capital are cash flows from
operations and borrowings under our revolving credit facility.
Our business follows a seasonal pattern; working capital
fluctuates with seasonal variations, reaching its highest level
in October or November to fund the purchase of merchandise
inventories prior to the holiday season. The seasonality of our
business historically provides greatest cash flow from
operations during the holiday season, with fourth fiscal quarter
net sales generating the strongest profits of our fiscal year.
As holiday sales significantly reduce inventory levels, this
reduction, combined with net income, historically provides us
with strong cash flow from operations at the end of our fiscal
year.
Decreases in working capital and the current ratio in 2009, as
compared with 2008, largely reflect a prior year federal income
tax receivable of $32.7 million included within prepaid
expenses and other current assets as well as current year
increases in accounts payable (as a result of the timing of
merchandise receipts) and accrued payroll and benefits (due to
2009 accruals for performance incentives and company matching
retirement contributions). The decrease in debt to total
capitalization reflects cash flow generated in 2009 utilized to
reduce debt levels. The increase in unused availability under
lines of credit as compared with the prior year primarily
reflects decreases in direct borrowings and letters of credit.
Borrowings under our revolving credit facility have decreased
due to our improved operating performance, reduced capital
expenditures and the impact of the Term Loan Facility entered
into in 2009, which enabled us to increase liquidity by paying a
portion of the outstanding borrowings under the 2006 Revolving
Credit Facility.
Working capital levels decreased minimally between 2008 and
2007. The increase in the current ratio in 2008, as compared
with 2007, primarily reflects proportionately larger decreases
in current liabilities as compared with current assets,
principally due to reduced accrued liabilities relating to
benefits. The increase in debt to total capitalization is
largely due to the significant decrease in shareholders’
equity in 2008, the result of the net loss for the period and a
decline in the funded status of the Company’s defined
benefit pension plans. The decrease in unused availability under
lines of credit as compared with 2007 reflects decreased
availability primarily due to reduced inventory levels and
increased documentary letters of credit to support the
purchasing of inventory.
Cash provided by (used in) our operating, investing and
financing activities is summarized as follows:
| |
|
|
|
|
|
|
|
|
|
|
|
|
|
(Dollars in millions)
|
|
2009
|
|
|
2008
|
|
|
2007
|
|
|
|
|
|
|
|
Operating activities
|
|
$
|
194.0
|
|
|
$
|
94.2
|
|
|
$
|
135.6
|
|
|
Investing activities
|
|
|
(32.2
|
)
|
|
|
(84.5
|
)
|
|
|
(106.9
|
)
|
|
Financing activities
|
|
|
(162.6
|
)
|
|
|
(11.3
|
)
|
|
|
(32.1
|
)
|
The increase in net cash provided by operating activities in
2009, as compared with 2008, primarily reflects improvement in
our business performance, resulting in the significant reduction
to the current year loss, partially offset by decreased non-cash
charges. Additionally, analysis of working
25
capital changes in the periods is impacted by the current year
cash receipt of a prior year $32.7 million income tax
receivable. The decrease in net cash provided by operating
activities in 2008, as compared with 2007, largely reflects a
decrease in business performance, resulting in the 2008 loss
(compared with 2007 income), partially offset by increased
non-cash charges such as depreciation and amortization;
impairment charges for long-lived assets, intangible assets and
goodwill; and the increase in the valuation allowance against
deferred tax assets.
We invested $32.3 million, $84.8 million and
$109.7 million in capital expenditures (not reduced by
landlord contributions) in 2009, 2008 and 2007, respectively.
These investments were for the opening, expanding and remodeling
of stores and investments in information technology. In 2009 and
2008, we significantly reduced our capital expenditures in
response to economic conditions. In light of the continued
uncertainty about the extent or continuation of these
conditions, we remain focused on limiting capital expenditures
to those projects that are either necessary for business
operations or have an attractive expected rate of return. We
expect capital expenditures to total approximately
$50 million (net of approximately $7 million of
landlord contributions) in 2010. Continued investment in
information technology represents a significant portion of our
planned capital expenditures.
The increase in net cash used in financing activities in 2009,
as compared with 2008, primarily reflects utilization of cash
flow to reduce debt in 2009. The decrease in net cash used in
financing activities in 2008, as compared with 2007, primarily
reflects net payments made to reduce debt in 2007, the result of
increased operating cash flows in that year.
Credit
Arrangements
On December 4, 2009, The Bon-Ton Department Stores, Inc.
and The Elder-Beerman Stores Corp. as borrowers (the
“Borrowers”), and the Company and certain other
subsidiaries as obligors (together with the Borrowers and the
Company, the “Obligors”) entered into an Amended
Revolving Credit Facility with Bank of America, N.A., as Agent,
and certain financial institutions as lenders that amends and
restates the 2006 Revolving Credit Facility entered into on
March 6, 2006, and provides for a revolving credit facility
of $675.0 million expiring June 4, 2013. All
borrowings under the Amended Revolving Credit Facility are
limited by amounts available pursuant to a borrowing base
calculation, which is based on percentages of eligible
inventory, real estate and credit card receivables, in each case
subject to reductions for applicable reserves. The terms of the
Amended Revolving Credit Facility are substantially based on the
terms of the 2006 Revolving Credit Facility. The Borrowers are
jointly and severally liable for all of the obligations incurred
under the Amended Revolving Credit Facility and the other loan
documents, which obligations are guaranteed on a joint and
several basis by the Company, the other Obligors and all future
domestic subsidiaries of the Obligors (subject to certain
exceptions). The proceeds of the Amended Revolving Credit
Facility were used to pay the outstanding balance under the 2006
Revolving Credit Facility and will be used for other general
corporate purposes. Commitments for loans under the Amended
Revolving Credit Facility are in two tranches: Tranche A
revolving commitments of $625.0 million (which includes a
$150.0 million subline for letters of credit and
$75.0 million for swing line loans) and
Tranche A-1
revolving commitments of $50.0 million. The Amended
Revolving Credit Facility provides that the Borrowers may make
requests to increase the Tranche A revolving commitments up
to $800.0 million in the aggregate upon the satisfaction of
certain conditions, provided that the lenders are under no
obligation to provide any such increases. On December 31,
2010, the
Tranche A-1
revolving commitments will be reduced by $20.0 million and
such amount will be reallocated to the Tranche A revolving
commitments. Borrowings under the Amended Revolving Credit
Facility will be at either (A) Adjusted LIBOR (based on the
highest of (i) the British Bankers Association LIBOR Rate
based on an interest period selected by the Borrowers,
(ii) the British Bankers Association LIBOR Rate based on an
interest period of three months and (iii) 1.25%) plus the
applicable margin or (B) a base rate (based on the highest
of (i) the Federal Funds Rate plus 0.5%, (ii) the Bank
of America prime rate, and (iii) Adjusted LIBOR based on an
interest period of one month plus 1.0%) plus the applicable
margin.
26
The applicable margin is based upon the excess availability
under the Amended Revolving Credit Facility. The Borrowers are
required to pay a commitment fee to the lenders for unused
commitments at a rate of 0.5% to 1.0% per annum, based upon the
unused portion of the total commitment under the Amended
Revolving Credit Facility. The Amended Revolving Credit Facility
is secured by a first priority security position on
substantially all of the current and future assets of the
Borrowers and the other Obligors, including, but not limited to,
inventory, general intangibles, trademarks, equipment, certain
real estate and proceeds from any of the foregoing, subject to
certain exceptions and liens. The financial covenant contained
in the Amended Revolving Credit Facility requires that the
minimum excess availability be at least $75.0 million at
all times. Other covenants continue the requirements of the 2006
Revolving Credit Facility (with the exception that the
limitation on capital expenditures no longer applies) and
require that the Obligors provide the lenders with certain
financial statements, forecasts and other reports and borrowing
base certificates. In addition, there are certain limitations,
including limitations on any debt the Obligors may have in
addition to the existing debt, and the terms of that debt;
acquisitions, joint ventures and investments; mergers and
consolidations; dispositions of property; dividends by the
Obligors or their subsidiaries (dividends paid may not exceed
$5.0 million in any year or $20.0 million during the
term of the agreement; however, additional dividends may be paid
subject to meeting other requirements); transactions with
affiliates; changes in the business or corporate structure of
the Obligors or their subsidiaries; prepaying, redeeming or
repurchasing certain debt; changes in accounting policies or
reporting practices; and speculative transactions. The Amended
Revolving Credit Facility also provides that it is a condition
precedent to borrowing that no event has occurred that could
reasonably be expected to have a material adverse effect, as
defined in the agreement, on the Company. If we fail to comply
with the financial covenant or the other restrictions contained
in the Amended Revolving Credit Facility, Term Loan Facility,
mortgage loan facility or the indenture that governs our senior
unsecured notes, an event of default would occur. An event of
default could result in the acceleration of our debt due to the
cross-default provisions within the debt agreements. As of
January 30, 2010, we had borrowings of $120.4 million,
with $358.2 million of borrowing availability (before
taking into account the minimum borrowing availability covenant
of $75.0 million) and
letter-of-credit
commitments of $18.1 million. The borrowing base
calculation under the Amended Revolving Credit Facility contains
an inventory advance rate subject to periodic review at the
lenders’ discretion.
On November 18, 2009, The Bon-Ton Department Stores, Inc.
and The Elder-Beerman Stores Corp. as Borrowers, and the Company
and certain other subsidiaries as Obligors entered into a Term
Loan Facility with Sankaty Advisors, LLC; GB Merchant Partners,
LLC and GA Capital, LLC as Agents that provides for
$75.0 million of term loans expiring November 18,
2013. The terms of the Term Loan Facility are primarily based on
the terms of the Company’s Amended Revolving Credit
Facility. The Borrowers and other Obligors under the Term Loan
Facility will be jointly and severally liable for all of the
obligations incurred under the Term Loan Facility. The proceeds
of the Term Loan Facility were used to pay part of the
outstanding balance under the 2006 Revolving Credit Facility and
will be used for other general corporate purposes. Borrowings
under the Term Loan Facility will be at either (A) Adjusted
LIBOR (based on the highest of (i) the British Bankers
Association LIBOR Rate for the two business days prior to the
borrowing, (ii) the British Bankers Association LIBOR Rate
based on an interest period of three months and
(iii) 3.00%) plus the applicable margin or (B) a base
rate (based on the highest of (i) the Federal Funds Rate
plus 0.5%, (ii) the Bank of America prime rate,
(iii) Adjusted LIBOR based on an interest period of one
month and (iv) 3.0%) plus the applicable margin. The
applicable margin is 12.75%. The Term Loan Facility is secured
by a second priority security position on substantially all of
the current and future assets of the Borrowers and the other
Obligors, including, but not limited to, inventory, general
intangibles, trademarks, equipment, certain real estate and
proceeds from any of the foregoing, subject to certain
exceptions and liens. The financial covenant contained in the
Term Loan Facility requires that the minimum excess availability
under the Amended Revolving Credit Facility be at least
$75.0 million at all times. Other covenants substantially
mirror the requirements of the Amended Revolving Credit
Facility. Dividends paid may
27
not exceed $5.75 million in any year or $23.0 million
during the term of the agreement; however, additional dividends
may be paid subject to meeting other requirements.
Aside from planned capital expenditures, our primary cash
requirements will be to service debt and finance working capital
increases during peak selling seasons.
There were no cash dividends declared in 2009. Our Board of
Directors may consider dividends in subsequent periods as it
deems appropriate.
Contractual
Obligations and Commitments
The following tables reflect our contractual obligations and
commitments as of January 30, 2010:
Contractual
Obligations
| |
|
|
|
|
|
|
|
|
|
|
|
|
|
|
|
|
|
|
|
|
|
|
|
Payment due by period
|
|
|
(Dollars in thousands)
|
|
Total
|
|
|
Within 1 Year
|
|
|
1-3 Years
|
|
|
3-5 Years
|
|
|
After 5 Years
|
|
|
|
|
|
|
|
Long-term debt(1)
|
|
$
|
1,285,993
|
|
|
$
|
75,900
|
|
|
$
|
149,700
|
|
|
$
|
828,997
|
|
|
$
|
231,396
|
|
|
Capital leases(1)
|
|
|
111,091
|
|
|
|
10,169
|
|
|
|
18,422
|
|
|
|
15,000
|
|
|
|
67,500
|
|
|
Service agreements
|
|
|
12,138
|
|
|
|
5,461
|
|
|
|
5,731
|
|
|
|
946
|
|
|
|
—
|
|
|
Operating leases
|
|
|
534,131
|
|
|
|
95,303
|
|
|
|
162,391
|
|
|
|
117,835
|
|
|
|
158,602
|
|
|
Private Brand agreements
|
|
|
26,280
|
|
|
|
11,355
|
|
|
|
12,839
|
|
|
|
2,086
|
|
|
|
—
|
|
|
|
|
Totals
|
|
$
|
1,969,633
|
|
|
$
|
198,188
|
|
|
$
|
349,083
|
|
|
$
|
964,864
|
|
|
$
|
457,498
|
|
|
|
|
|
|
|
(1) |
|
Includes interest, except for interest under long-term debt
obligations where such interest is calculated on a variable
basis. Debt within the “3-5 Years” category
includes $120.4 million in variable rate debt under the
Amended Revolving Credit Facility, which is scheduled to expire
in June 2013, and $75.0 million in variable rate debt under
the Term Loan Facility, which becomes due in November 2013. |
In addition, we expect to make cash contributions to our
supplementary pension plans and the postretirement medical and
life insurance benefit plan in the amount of $1.7 million,
$1.6 million, $1.6 million, $1.5 million and
$1.3 million in 2010, 2011, 2012, 2013 and 2014,
respectively, and $5.2 million in the aggregate for the
five years thereafter.
We do not anticipate making a contribution to the defined
benefit pension plan in 2010. Funding requirements will depend
on changes in the discount rate, the actual performance of plan
assets, and the impact of The Pension Protection Act of 2006.
Note 8 in the Notes to Consolidated Financial Statements
provides a more complete description of our benefit plans.
28
Commitments
| |
|
|
|
|
|
|
|
|
|
|
|
|
|
|
|
|
|
|
|
|
|
|
|
Amount of expiration per period
|
|
|
(Dollars in thousands)
|
|
Total
|
|
|
Within 1 Year
|
|
|
1-3 Years
|
|
|
3-5 Years
|
|
|
After 5 Years
|
|
|
|
|
|
|
|
Documentary letters of credit
|
|
$
|
6,801
|
|
|
$
|
6,801
|
|
|
$
|
—
|
|
|
$
|
—
|
|
|
$
|
—
|
|
|
Standby letters of credit
|
|
|
11,267
|
|
|
|
11,267
|
|
|
|
—
|
|
|
|
—
|
|
|
|
—
|
|
|
Surety bonds
|
|
|
500
|
|
|
|
500
|
|
|
|
—
|
|
|
|
—
|
|
|
|
—
|
|
|
|
|
Totals
|
|
$
|
18,568
|
|
|
$
|
18,568
|
|
|
$
|
—
|
|
|
$
|
—
|
|
|
$
|
—
|
|
|
|
Documentary letters of credit are primarily issued to support
the purchasing of merchandise, which includes our private brand
goods. Standby letters of credit are primarily issued as
collateral for obligations related to general liability and
workers’ compensation insurance and to support the
purchasing of merchandise. Surety bonds are for potential
obligations related to workers’ compensation.
In the ordinary course of business, we enter into arrangements
with vendors to purchase merchandise up to twelve months in
advance of expected delivery. These purchase orders do not
contain any significant termination payments or other penalties
if cancelled.
Critical
Accounting Policies
Our discussion and analysis of financial condition and results
of operations are based upon the Consolidated Financial
Statements, which have been prepared in accordance with
U.S. generally accepted accounting principles. Preparation
of these financial statements required us to make estimates and
judgments that affected reported amounts of assets and
liabilities, revenues and expenses, and related disclosure of
contingent assets and liabilities at the date of our financial
statements. On an ongoing basis, we evaluate our estimates,
including those related to merchandise returns, bad debts,
inventories, goodwill, intangible assets, income taxes,
financings, contingencies, insurance reserves, and litigation.
We base our estimates on historical experience and on various
other assumptions that we believe to be reasonable under the
circumstances, the results of which form the basis for making
judgments about the carrying values of assets and liabilities
that are not readily apparent from other sources. Actual results
may differ from these estimates under different assumptions or
conditions.
Critical accounting policies are defined as those that are
reflective of significant judgments and uncertainties, and could
potentially lead to materially different results under different
assumptions and conditions. We believe our critical accounting
policies are as described below. For a discussion of the
application of these and other accounting policies, see the
Notes to Consolidated Financial Statements.
Inventory
Valuation
Inventories are stated at the lower of cost or market with cost
determined by the retail inventory method. Under the retail
inventory method, the valuation of inventories at cost and the
resulting gross margin is derived by applying a calculated
cost-to-retail
ratio to the retail value of inventories. The retail inventory
method is an averaging method that is widely used in the retail
industry. Use of the retail inventory method will result in
valuing inventories at the lower of cost or market if markdowns
are taken timely as a reduction of the retail value of
inventories.
Inherent in the retail inventory method calculation are certain
significant management judgments and estimates including, among
others, merchandise markups, markdowns and shrinkage, which
significantly impact both the ending inventory valuation at cost
and the resulting gross margin. These significant estimates,
coupled with the fact that the retail inventory method is an
29
averaging process, can, under certain circumstances, result in
individual inventory components with cost above related net
realizable value. Factors that can lead to this result include
applying the retail inventory method to a group of products that
is not fairly uniform in terms of its cost, selling price
relationship and turnover; or applying the retail inventory
method to transactions that include different rates of gross
profit, such as those relating to seasonal merchandise. In
addition, failure to take timely markdowns can result in an
overstatement of inventory under the lower of cost or market
principle. We believe that the retail inventory method we use
provides an inventory valuation that approximates cost and
results in carrying inventory in the aggregate at the lower of
cost or market.
We regularly review inventory quantities on-hand and record an
adjustment for excess or old inventory based primarily on an
estimated forecast of merchandise demand for the selling season.
Demand for merchandise can fluctuate greatly. A significant
increase in the demand for merchandise could result in a
short-term increase in the cost of inventory purchases while a
significant decrease in demand could result in an increase in
the amount of excess inventory quantities on-hand. Additionally,
estimates of future merchandise demand may prove to be
inaccurate, in which case we may have understated or overstated
the adjustment required for excess or old inventory. If our
inventory is determined to be overvalued in the future, we would
be required to recognize such costs in costs of goods sold and
reduce operating income at the time of such determination.
Likewise, if inventory is later determined to be undervalued, we
may have overstated the costs of goods sold in previous periods
and would recognize additional operating income when such
inventory is sold. Therefore, although every effort is made to
ensure the accuracy of forecasts of merchandise demand, any
significant unanticipated changes in demand or in economic
conditions within our markets could have a significant impact on
the value of our inventory and reported operating results.
As of January 30, 2010 and January 31, 2009,
approximately 32% of our inventories were valued using a
first-in,
first-out cost basis and approximately 68% of our inventories
were valued using a
last-in,
first-out (“LIFO”) cost basis. As is currently the
case with many companies in the retail industry, our LIFO
calculations yielded inventory increases due to deflation
reflected in price indices used. The LIFO method values
merchandise sold at the cost of more recent inventory purchases
(which the deflationary indices indicated to be lower),
resulting in the general inventory on-hand being carried at the
older, higher costs. Given these higher values and the
promotional retail environment, we have reduced the carrying
value of our LIFO inventories to an estimated realizable value.
These reductions totaled $41.7 million and
$41.6 million as of January 30, 2010 and
January 31, 2009, respectively. Inherent in the valuation
of inventories are significant management judgments and
estimates regarding future merchandise selling costs and
pricing. Should these estimates prove to be inaccurate, we may
have overstated or understated our inventory carrying value. In
such cases, operating results would ultimately be impacted.
Vendor
Allowances
As is standard industry practice, allowances from merchandise
vendors are received as reimbursement for charges incurred on
marked-down merchandise. Vendor allowances are generally
credited to costs of goods sold, provided the allowance is:
(1) collectable, (2) for merchandise either
permanently marked down or sold, (3) not predicated on a
future purchase, (4) not predicated on a future increase in
the purchase price from the vendor, and (5) authorized by
internal management. If the aforementioned criteria are not met,
the allowances are recorded as an adjustment to the cost of
merchandise capitalized in inventory and reflected as a
reduction of costs of merchandise sold when the related
merchandise is sold.
Additionally, allowances are received from vendors in connection
with cooperative advertising programs and for reimbursement of
certain payroll expenses. These allowances are reviewed to
ensure reimbursements are for specific, incremental and
identifiable advertising or payroll costs incurred to sell the
vendor’s products. If a vendor reimbursement exceeds the
costs incurred, the excess reimbursement is recorded as a
reduction of cost purchases from the vendor and reflected as a
reduction of costs of merchandise sold when the related
merchandise is sold. All other amounts are
30
recognized as a reduction of the related advertising or payroll
costs that have been incurred and reflected in SG&A expense.
Income
Taxes
Significant management judgment is required in determining the
provision for income taxes, deferred tax assets and liabilities,
and the valuation allowance recorded against net deferred tax
assets. The process involves summarizing temporary differences
resulting from differing treatment of items for tax and
accounting purposes. These differences result in deferred tax
assets and liabilities, which are included within the
consolidated balance sheet. In addition, we are required to
assess whether valuation allowances should be established
against our deferred tax assets based on consideration of all
available evidence using a “more likely than not”
standard. To the extent a valuation allowance is established in
a period, an expense must be recorded within the income tax
provision in the statement of operations.
We reported net deferred tax liabilities of $1.5 million at
January 30, 2010 and net deferred tax assets of
$2.7 million at January 31, 2009. In assessing the
realizability of our deferred tax assets, we considered whether
it is more likely than not that our deferred tax assets will be
realized based upon all available evidence, including scheduled
reversal of deferred tax liabilities, historical operating
results, projected future operating results, tax carry-back
availability and limitations pursuant to Section 382 of the
Internal Revenue Code, among others. Significant weight is given
to evidence that can be objectively verified. As a result,
current or previous losses are given more weight than any
projected future taxable income. In addition, a recent
three-year historical cumulative loss is considered a
significant element of negative evidence that is difficult to
overcome.
We evaluate our deferred tax assets each reporting period,
including assessment of the Company’s cumulative income or
loss over the prior three-year period, to determine if valuation
allowances are required. With respect to our review for the
fourth quarter of 2008, a significant element of negative
evidence considered was our three-year historical cumulative
loss as of the fourth quarter of 2008. This, combined with
uncertain near-term economic conditions, impeded our ability to
rely on our projections of future taxable income in establishing
the deferred tax assets valuation allowance at January 31,
2009. Accordingly, a nearly full valuation allowance was
established on our net deferred tax assets during the fourth
quarter of 2008. With respect to our reviews during 2009, our
three-year historical cumulative loss and the continuation of
uncertain near-term economic conditions again impeded our
ability to rely on our projections of future taxable income in
assessing valuation allowance requirements. As such, we
concluded that it was necessary to maintain a full valuation
allowance on our net deferred tax assets.
Our deferred tax asset valuation allowance totaled
$140.5 million and $145.5 million at January 30,
2010 and January 31, 2009, respectively. If actual results
differ from these estimates or these estimates are adjusted in
future periods, the valuation allowance may need to be adjusted,
which could materially impact our financial position and results
of operations. If sufficient positive evidence arises in the
future indicating that all or a portion of the deferred tax
assets meet the more likely than not standard, the valuation
allowance would be reversed accordingly in the period that such
a conclusion is reached.
We recognize the effect of income tax positions only if those
positions are more likely than not of being sustained.
Recognized income tax positions are measured at the largest
amount that is greater than 50% likely of being realized.
Changes in recognition or measurement are reflected in the
period in which the change in judgment occurs. Interpretations
and guidance surrounding income tax laws and regulations change
over time, and changes to our assumptions and judgments could
materially impact our financial position and results of
operations.
31
Long-lived
Assets
Property, fixtures and equipment are recorded at cost and are
depreciated on a straight-line basis over the estimated useful
lives of such assets. Changes in our business model or capital
strategy can result in the actual useful lives differing from
estimates. In cases where we determined that the useful life of
property, fixtures and equipment should be shortened, we
depreciated the net book value in excess of the salvage value
over the revised remaining useful life, thereby increasing
depreciation expense. Factors such as changes in the planned use
of fixtures or leasehold improvements could also result in
shortened useful lives. Our net property, fixtures and equipment
amounted to $756.6 million and $832.8 million at
January 30, 2010 and January 31, 2009, respectively.
We are required to test a long-lived asset for recoverability
whenever events or changes in circumstances indicate that its
carrying value may not be recoverable. Factors that could
trigger an impairment review include the following:
|
|
|
| |
•
|
Significant underperformance of stores relative to historical or
projected future operating results,
|
| |
| |
•
|
Significant changes in the manner of our use of assets or
overall business strategy, and
|
| |
| |
•
|
Significant negative industry or economic trends for a sustained
period.
|
If the undiscounted cash flows associated with the asset are
insufficient to support the recorded asset, an impairment loss
is recognized for the amount (if any) by which the carrying
amount of the asset exceeds the fair value of the asset. Cash
flow estimates are based on historical results, adjusted to
reflect our best estimate of future market and operating
conditions. Estimates of fair value are calculated based on a
discounted cash flow analysis. Should cash flow estimates differ
significantly from actual results, an impairment could arise and
materially impact our financial position and results of
operations. Given the seasonality of operations, impairment is
not conclusive, in many cases, until after the holiday period in
the fourth quarter is concluded.
Newly opened stores may take time to generate positive operating
and cash flow results. Factors such as store type, store
location, current marketplace awareness of private label brands,
local customer demographic data and current fashion trends are
all considered in determining the time-frame required for a
store to achieve positive financial results. If conditions prove
to be substantially different from expectations, the carrying
value of new stores’ long-lived assets may ultimately
become impaired.
We evaluated the recoverability of our long-lived assets and, as
a result, in 2009 we recognized a $5.7 million asset
impairment charge which resulted in a reduction in the carrying
amount of certain store and distribution center properties.
These 2009 analyses anticipate continued difficult economic
conditions. Should economic conditions be worse than
anticipated, additional impairment charges could result. In 2008
and 2007, we recorded asset impairment charges which resulted in
a reduction in the carrying amount of certain store properties
of $17.9 million and $2.7 million, respectively.
Goodwill and
Intangible Assets
Net intangible assets totaled $138.8 million and
$148.2 million at January 30, 2010 and
January 31, 2009, respectively. Our intangible assets at
January 30, 2010 are principally comprised of
$70.5 million of lease interests that relate to
below-market-rate leases and $68.3 million associated with
trade names, private label brand names and customer lists. The
lease-related interests are being amortized using a
straight-line method. The customer lists are being amortized
using a declining-balance method. At January 30, 2010,
lease-related interests and customer lists had average remaining
lives of thirteen years and nine years, respectively, for
amortization purposes. At January 30, 2010, trade names and
private label brand names of $54.0 million have been deemed
as having indefinite lives.
32
Goodwill and other intangible assets that have indefinite lives
are reviewed for impairment at least annually or when events or
changes in circumstances indicate the carrying value of these
assets might exceed their current fair values. Fair value is
determined using quoted market prices
and/or a
discounted cash flow analysis, which requires certain
assumptions and estimates regarding industry economic factors.
Our policy is to conduct impairment testing based on our most
current business plans, which reflect anticipated changes in the
economy and the industry.
We recorded a goodwill impairment charge of $17.8 million
in the second quarter of 2008. Based upon our review, the fair
value of our single reporting unit, estimated using a
combination of our common stock trading value as of the end of
the second quarter of 2008, a discounted cash flow analysis and
other generally accepted valuation methodologies, was less than
the carrying amount. The charge reduced the balance of goodwill
to zero at January 31, 2009. No such charge was recorded in
2007.
As a result of our review of the carrying amount of intangible
assets in 2009, we recorded an asset impairment charge of
$0.2 million related to a reduction in the value of two
indefinite-lived private label brand names. In 2008, we
recognized asset impairment charges of $8.0 million and
$0.1 million on indefinite-lived trade names and private
label brand names, respectively. In 2007, we recorded an asset
impairment charge of $1.3 million related to the reduction
in the value of two indefinite-lived private label brand names.
While the carrying value of intangible assets has been
substantially reduced, should future results or economic events
cause a change in our projected cash flows, future estimates of
fair value may not support the carrying amount of these assets.
If actual results prove inconsistent with our assumptions and
judgments, we could be exposed to a material impairment charge.
Insurance Reserve
Estimates
We use a combination of insurance and self-insurance for a
number of risks, including workers’ compensation, general
liability and employee-related health care benefits, a portion
of which is paid by our associates. We determine the estimates
for the liabilities associated with these risks by considering
historical claims experience, demographic factors, severity
factors and other actuarial assumptions. A change in claims
frequency and severity of claims from historical experience as
well as changes in state statutes and the mix of states in which
we operate could result in a change to the required reserve
levels.
Pension and
Supplementary Retirement Plans
We provide an unfunded supplementary pension plan to certain key
executives. Through acquisitions, we acquired a defined benefit
pension plan and assumed the liabilities of three supplementary
pension plans and a postretirement benefit plan. Major
assumptions used in accounting for these plans include the
discount rate and the expected long-term rate of return on the
defined benefit plan’s assets.
The discount rate assumption is evaluated annually. We utilize
the Citibank Pension Discount Curve (“CPDC”) to
develop the discount rate assumption. The CPDC is developed from
a U.S. Treasury par curve that reflects the Treasury Coupon
and Strips market. Option-adjusted spreads drawn from the
double-A corporate bond sector are layered in to develop a
double-A corporate par curve, from which the CPDC spot rates are
developed. The CPDC spot rates are applied to expected benefit
payments, from which a single constant discount rate can then be
developed based on the expected timing of these benefit payments.
We base our asset return assumption on current and expected
allocations of assets, as well as a long-term view of expected
returns on the plan asset categories. We assess the
appropriateness of the expected rate of return on an annual
basis and, when necessary, revise the assumption. Our
33
target pension plan asset allocation of equity securities, fixed
income and real estate at January 30, 2010 and
January 31, 2009 was 65%, 30% and 5%, respectively.
Changes in the assumptions regarding the discount rate and
expected return on plan assets may result in materially
different expense and liability amounts. Actuarial estimations
may differ materially from actual results, reflecting many
factors including changing market and economic conditions,
changes in investment strategies, higher or lower withdrawal
rates and longer or shorter life-spans of participants. In
addition, while we are not required to make any mandatory
contributions to the defined benefit pension plan in 2010, the
funded status of this plan and the related cost reflected in our
financial statements are affected by various factors that are
subject to an inherent degree of uncertainty, particularly in
the current economic environment. Under the Pension Protection
Act of 2006, losses of asset values may necessitate increased
funding of the defined benefit pension plan in the future to
meet minimum federal government requirements. Downward pressure
on the asset values of the defined benefit pension plan may
require us to fund obligations earlier than we forecasted, which
would have a negative impact on cash flows from operations.
In the first quarter of 2009, we paid $5.7 million pursuant
to the termination of one of our unfunded supplemental pension
plans.
Recently
Issued Accounting Standards
In January 2010, the Financial Accounting Standards Board
(“FASB”) issued Accounting Standards Update
(“ASU”)
No. 2010-06,
Fair Value Measurements and Disclosures (Topic 820):
Improving Disclosures about Fair Value Measurements
(“ASU
2010-06”),
which requires new disclosures regarding recurring or
nonrecurring fair value measurements. Entities will be required
to separately disclose significant transfers into and out of
Level 1 and Level 2 measurements in the fair value
hierarchy and the reasons for the transfers and provide
information on purchases, sales, issuances and settlements on a
gross basis in the reconciliation of Level 3 fair value
measurements. In addition, entities must provide fair value
measurement disclosures for each class of assets and liabilities
and, for Level 2 or Level 3 measurements, disclose the
valuation technique and inputs used in determining fair value
for each class. The enhanced fair value measurement disclosures
required by ASU
2010-06 are
effective for fiscal years beginning after December 15,
2009. The Company does not anticipate the adoption of the
disclosure requirements of ASU
2010-06 will
have a material impact on its consolidated financial statements.
In August 2009, the FASB issued ASU
No. 2009-05,
Fair Value Measurements and Disclosures (Topic
820) — Measuring Liabilities at Fair Value (“ASU
2009-05”),
which provides amendments to Accounting Standards
Codification (“ASC”) Subtopic
820-10,
Fair Value Measurements and Disclosures — Overall,
for the fair value measurement of liabilities. ASU
2009-05
provides clarification on measuring liabilities at fair value
when a quoted price in an active market is not available. The
amendments are intended to reduce potential ambiguity in
financial reporting when measuring the fair value of
liabilities. The Company adopted the provisions of this update,
as required, in 2009. The adoption of ASU
2009-05 did
not have an impact on the Company’s consolidated financial
statements.
ASC Subtopic
715-20,
Compensation — Retirement Benefits —
Defined Benefit Plans
(“ASC 715-20”),
requires entities to provide enhanced disclosures about
investment allocation decisions, the major categories of plan
assets, the inputs and valuation techniques used to measure fair
value of plan assets, the effect of fair value measurements
using significant unobservable inputs on changes in plan assets
for the period and significant concentrations of risk within
plan assets. The enhanced disclosures required by
ASC 715-20
are provided in Note 8 in Notes to Consolidated Financial
Statements.
34
|
|
|
Item 7A.
|
Quantitative and
Qualitative Disclosures About Market Risk
|
Market Risk
and Financial Instruments
We are exposed to market risk associated with changes in
interest rates. To provide some protection against potential
rate increases associated with our variable-rate facilities, we
enter into derivative financial transactions in the form of
interest rate swaps. The interest rate swaps are used to reduce
or eliminate the variability of interest payments on the
underlying variable-rate facilities. The swaps interest rate
differential is reflected as an adjustment to interest expense
over the life of the swaps.
At January 30, 2010, we held two
“variable-to-fixed”
rate swaps with a notional amount of $50.0 million each.
The notional amount does not represent amounts exchanged by the
parties; rather, it is used as the basis to calculate amounts
due and to be received under the rate swap. During 2009 and
2008, we did not enter into or hold derivative financial
instruments for trading purposes.
The following table provides information about our derivative
financial instruments and other financial instruments that are
sensitive to changes in interest rates, including debt
obligations and the interest rate swaps. For debt obligations,
the table presents principal cash flows and related weighted
average interest rates by expected maturity dates at
January 30, 2010. For the interest rate swaps, the table
presents the notional amount and weighted average pay and
receive interest rates by expected maturity date. For additional
discussion of our interest rate swaps, see Note 10 in the
Notes to Consolidated Financial Statements.
| |
|
|
|
|
|
|
|
|
|
|
|
|
|
|
|
|
|
|
|
|
|
|
|
|
|
|
|
|
|
|
|
|
|
|
|
Expected Maturity Date By Year
|
|
|
|
|
|
|
|
|
|
|
|
|
|
|
|
|
|
|
(Dollars in
|
|
|
|
|
|
|
|
|
|
|
|
|
|
|
|
|
There-
|
|
|
|
|
|
|
|
|
thousands)
|
|
2010
|
|
|
2011
|
|
|
2012
|
|
|
2013
|
|
|
2014
|
|
|
After
|
|
|
Total
|
|
|
Fair Value
|
|
|
|
|
|
|
|
Debt:
|
|
|
|
|
|
|
|
|
|
|
|
|
|
|
|
|
|
|
|
|
|
|
|
|
|
|
|
|
|
|
|
|
|
Fixed-rate debt
|
|
$
|
7,509
|
|
|
$
|
6,978
|
|
|
$
|
7,441
|
|
|
$
|
8,024
|
|
|
$
|
518,609
|
|
|
$
|
214,829
|
|
|
$
|
763,390
|
|
|
$
|
693,213
|
|
|
Average fixed rate
|
|
|
6.56
|
%
|
|
|
6.82
|
%
|
|
|
6.85
|
%
|
|
|
6.86
|
%
|
|
|
10.19
|
%
|
|
|
6.26
|
%
|
|
|
8.95
|
%
|
|
|
|
|
|
Variable-rate debt
|
|
|
—
|
|
|
|
—
|
|
|
|
—
|
|
|
$
|
195,434
|
|
|
|
—
|
|
|
|
—
|
|
|
$
|
195,434
|
|
|
$
|
195,434
|
|
|
Average variable rate
|
|
|
—
|
|
|
|
—
|
|
|
|
—
|
|
|
|
7.69
|
%
|
|
|
—
|
|
|
|
—
|
|
|
|
7.69
|
%
|
|
|
|
|
|
Interest Rate Derivatives:
|
|
|
|
|
|
|
|
|
|
|
|
|
|
|
|
|
|
|
|
|
|
|
|
|
|
|
|
|
|
|
|
|
|
Interest rate swap
|
|
|
|
|
|
|
|
|
|
|
|
|
|
|
|
|
|
|
|
|
|
|
|
|
|
|
|
|
|
|
|
|
|
Variable-to-fixed
|
|
|
—
|
|
|
$
|
100,000
|
|
|
|
—
|
|
|
|
—
|
|
|
|
—
|
|
|
|
—
|
|
|
$
|
100,000
|
|
|
$
|
(6,319
|
)
|
|
Average pay rate
|
|
|
—
|
|
|
|
5.49
|
%
|
|
|
—
|
|
|
|
—
|
|
|
|
—
|
|
|
|
—
|
|
|
|
5.49
|
%
|
|
|
|
|
|
Average receive rate
|
|
|
—
|
|
|
|
0.73
|
%
|
|
|
—
|
|
|
|
—
|
|
|
|
—
|
|
|
|
—
|
|
|
|
0.73
|
%
|
|
|
|
|
|
|
Seasonality
and Inflation
Our business, like that of most retailers, is subject to
seasonal fluctuations, with the major portion of sales and
income realized during the second half of each fiscal year,
which includes the holiday season. See Note 17 in the Notes
to Consolidated Financial Statements for the Company’s
quarterly results for 2009 and 2008. Due to the fixed nature of
certain costs, SG&A expense is typically higher as a
percentage of net sales during the first half of each year.
Working capital requirements fluctuate during the year as well
and generally reach their highest levels during the third and
fourth quarters.
Because of the seasonality of our business, results for any
quarter are not necessarily indicative of results that may be
achieved for a full year. In addition, quarterly operating
results are impacted by the timing and amount of revenues and
costs associated with the opening of new stores and the closing
and remodeling of existing stores.
Although we cannot determine the precise effects of inflation on
our business, we do not believe inflation has had a material
impact on operating results during the past three years.
However, there can be no assurance that our business will not be
affected by material inflationary adjustments in the future.
35
|
|
|
Item 8.
|
Consolidated
Financial Statements and Supplementary Data
|
Information called for by this item is set forth in the
Consolidated Financial Statements and Financial Statement
Schedule contained in this report and is incorporated herein by
this reference. See index at
page F-1.
|
|
|
Item 9.
|
Changes in and
Disagreements with Accountants on Accounting and Financial
Disclosure
|
None.
|
|
|
Item 9A.
|
Controls and
Procedures
|
Attached as exhibits to this
Form 10-K
are certifications of the Company’s Chief Executive Officer
and Chief Financial Officer, which are required by
Rule 13a-14
of the Securities Exchange Act of 1934, as amended (the
“Exchange Act”). This “Controls and
Procedures” section includes information concerning the
controls and controls evaluation referred to in the
certifications. This section should be read in conjunction with
the certifications for a more complete understanding of the
topics presented.
Evaluation of
Disclosure Controls and Procedures
We maintain disclosure controls and procedures that are designed
to ensure that information required to be disclosed in reports
filed pursuant to the Exchange Act is recorded, processed,
summarized and reported within the time periods specified in the
SEC’s rules, regulations and forms, and that such
information is accumulated and communicated to management,
including our Chief Executive Officer and Chief Financial
Officer, as appropriate, to allow timely decisions regarding
required disclosure. Our management, including our Chief
Executive Officer and Chief Financial Officer, evaluated the
effectiveness of our disclosure controls and procedures (as
defined in
Rules 13a-15(e)
and
15d-15(e) of
the Exchange Act) as of the end of the period covered by this
report and, based on this evaluation, concluded that our
disclosure controls and procedures are effective.
Management
Report on Internal Control over Financial
Reporting
The Company’s management is responsible for establishing
and maintaining adequate internal control over financial
reporting to provide reasonable assurance regarding the
reliability of its financial reporting and the preparation of
financial statements for external purposes in accordance with
generally accepted accounting principles. Internal control over
financial reporting includes those policies and procedures that
(i) pertain to the maintenance of records that in
reasonable detail accurately and fairly reflect the transactions
and dispositions of the Company’s assets; (ii) provide
reasonable assurance that transactions are recorded as necessary
to permit preparation of financial statements in accordance with
generally accepted accounting principles, and that the
Company’s receipts and expenditures are being made only in
accordance with authorizations of management and the directors
of the Company; and (iii) provide reasonable assurance
regarding prevention or timely detection of unauthorized
acquisition, use or disposition of its assets that could have a
material effect on the financial statements.
Management assessed the Company’s internal control over
financial reporting as of January 30, 2010, the end of the
2009 fiscal year. Management based its assessment on criteria
established in Internal Control — Integrated
Framework issued by the Committee of Sponsoring
Organizations of the Treadway Commission. Management’s
assessment included evaluation of such elements as the design
and operating effectiveness of key financial reporting controls,
process documentation, accounting policies and the
Company’s overall control environment.
36
Based on its assessment, management has concluded that the
Company’s internal control over financial reporting was
effective as of the end of the fiscal year to provide reasonable
assurance regarding the reliability of financial reporting and
the preparation of financial statements for external reporting
purposes in accordance with generally accepted accounting
principles. The results of management’s assessment were
reviewed with the Audit Committee of the Company’s Board of
Directors.
KPMG LLP independently assessed the effectiveness of the
Company’s internal control over financial reporting. KPMG
LLP has issued an attestation report, which is included below.
Report of
Independent Registered Public Accounting Firm
The Board of Directors and Shareholders
The Bon-Ton Stores, Inc.:
We have audited The Bon-Ton Stores, Inc. internal control over
financial reporting as of January 30, 2010, based on
criteria established in Internal Control —
Integrated Framework issued by the Committee of Sponsoring
Organizations of the Treadway Commission (COSO). The Bon-Ton
Stores, Inc.’s management is responsible for maintaining
effective internal control over financial reporting and for its
assessment of the effectiveness of internal control over
financial reporting, included in the accompanying Management
Report on Internal Control over Financial Reporting. Our
responsibility is to express an opinion on the Company’s
internal control over financial reporting based on our audit.
We conducted our audit in accordance with the standards of the
Public Company Accounting Oversight Board (United States). Those
standards require that we plan and perform the audit to obtain
reasonable assurance about whether effective internal control
over financial reporting was maintained in all material
respects. Our audit included obtaining an understanding of
internal control over financial reporting, assessing the risk
that a material weakness exists, and testing and evaluating the
design and operating effectiveness of internal control based on
the assessed risk. Our audit also included performing such other
procedures as we considered necessary in the circumstances. We
believe that our audit provides a reasonable basis for our
opinion.
A company’s internal control over financial reporting is a
process designed to provide reasonable assurance regarding the
reliability of financial reporting and the preparation of
financial statements for external purposes in accordance with
generally accepted accounting principles. A company’s
internal control over financial reporting includes those
policies and procedures that (1) pertain to the maintenance
of records that, in reasonable detail, accurately and fairly
reflect the transactions and dispositions of the assets of the
company; (2) provide reasonable assurance that transactions
are recorded as necessary to permit preparation of financial
statements in accordance with generally accepted accounting
principles, and that receipts and expenditures of the company
are being made only in accordance with authorizations of
management and directors of the company; and (3) provide
reasonable assurance regarding prevention or timely detection of
unauthorized acquisition, use, or disposition of the
company’s assets that could have a material effect on the
financial statements.
Because of its inherent limitations, internal control over
financial reporting may not prevent or detect misstatements.
Also, projections of any evaluation of effectiveness to future
periods are subject to the risk that controls may become
inadequate because of changes in conditions, or that the degree
of compliance with the policies or procedures may deteriorate.
In our opinion, The Bon-Ton Stores, Inc. maintained, in all
material respects, effective internal control over financial
reporting as of January 30, 2010, based on criteria
established in Internal Control — Integrated
Framework issued by the Committee of Sponsoring
Organizations of the Treadway Commission.
37
We also have audited, in accordance with the standards of the
Public Company Accounting Oversight Board (United States), the
consolidated balance sheets of The Bon-Ton Stores, Inc. and
subsidiaries as of January 30, 2010 and January 31,
2009, and the related consolidated statements of operations,
shareholders’ equity, and cash flows for each of the fiscal
years in the three-year period ended January 30, 2010, and
the related financial statement schedule, and our report dated
April 16, 2010 expressed an unqualified opinion on those
consolidated financial statements and the related financial
statement schedule.
Harrisburg, Pennsylvania
April 16, 2010
Inherent
Limitations on Effectiveness of Controls
Our management, including the Chief Executive Officer and Chief
Financial Officer, does not expect that our disclosure controls
or internal control over financial reporting will prevent or
detect all errors and all fraud. A control system, no matter how
well designed and operated, can provide only reasonable, not
absolute, assurance that the control system’s objectives
will be met. The design of a control system must reflect the
fact that there are resource constraints, and the benefits of
controls must be considered relative to their costs. Further,
because of the inherent limitations in all control systems, no
evaluation of controls can provide absolute assurance that
misstatements because of error or fraud will not occur or that
all control issues and instances of fraud, if any, within our
Company have been detected. These inherent limitations include
the realities that judgments in decision-making can be faulty
and that breakdowns can occur because of a simple error or
mistake. Controls can also be circumvented by the individual
acts of some persons, by collusion of two or more people, or by
management override of the controls. The design of any system of
controls is based, in part, on certain assumptions about the
likelihood of future events, and there can be no assurance that
any design will succeed in achieving its stated goals under all
potential future conditions. Projections of any evaluation of
controls effectiveness to future periods are subject to risks.
Over time, controls may become inadequate because of changes in
conditions or deterioration in the degree of compliance with
policies or procedures.
Changes in
Internal Control Over Financial Reporting
There were no changes to the Company’s internal control
over financial reporting that occurred during the thirteen weeks
ended January 30, 2010 that have materially affected, or
are reasonably likely to materially affect, the Company’s
internal control over financial reporting.
|
|
|
Item 9B.
|
Other
Information
|
None.
38
PART III
|
|
|
Item 10.
|
Directors,
Executive Officers and Corporate Governance
|
As part of our system of corporate governance, our Board of
Directors has adopted a Code of Ethical Standards and Business
Practices applicable to all directors, officers and associates.
This Code is available on our website at www.bonton.com.
The information regarding executive officers is included in
Part I under the heading “Executive Officers.”
The remainder of the information called for by this Item is
incorporated by reference to the sections entitled
“Election of Directors,” “Section 16(a)
Beneficial Ownership Reporting Compliance” and
“Corporate Governance and Board of Directors
Information” of the Proxy Statement.
|
|
|
Item 11.
|
Executive
Compensation
|
The information called for by this Item is incorporated by
reference to the section entitled “Executive
Compensation” of the Proxy Statement.
|
|
|
Item 12.
|
Security
Ownership of Certain Beneficial Owners and Management and
Related Stockholder Matters
|
The information called for by this Item is incorporated by
reference to the sections entitled “Security Ownership of
Directors and Executive Officers” and “Equity
Compensation Plan Information” of the Proxy Statement.
|
|
|
Item 13.
|
Certain
Relationships and Related Transactions, and Director
Independence
|
The information called for by this Item is incorporated by
reference to the sections entitled “Related Party
Transactions” and “Director Independence” of the
Proxy Statement.
|
|
|
Item 14.
|
Principal
Accountant Fees and Services
|
The information called for by this Item is incorporated by
reference to the section entitled “Fees Paid to KPMG”
of the Proxy Statement.
39
PART IV
|
|
|
Item 15.
|
Exhibits and
Financial Statement Schedules
|
(a) The following documents are filed as part of this
report:
1. Consolidated Financial Statements — See the
Index to Consolidated Financial Statements and Financial
Statement Schedule on
page F-1.
2. Financial Statement Schedule — See the Index
to Consolidated Financial Statements and Financial Statement
Schedule on
page F-1.
(b) The following are exhibits to this
Form 10-K
and, if incorporated by reference, we have indicated the
document previously filed with the SEC in which the exhibit was
included.
| |
|
|
|
|
|
|
|
|
|
Exhibit No.
|
|
Description
|
|
Document Location
|
|
|
|
|
|
|
3
|
.1
|
|
|
|
Articles of Incorporation
|
|
Exhibit 3.1 to the Report on Form 8-B, File No. 0-19517
(“Form 8-B”)
|
|
|
3
|
.2
|
|
|
|
Bylaws
|
|
Exhibit 3.2 to Form 8-B
|
|
|
4
|
.1
|
|
|
|
Indenture with The Bank of New York
|
|
Exhibit 4.1 to the Current Report on Form 8-K filed on March 10,
2006 (“3/10/06 Form 8-K”)
|
|
|
10
|
.1
|
|
|
|
Shareholders’ Agreement among The Bon-Ton Stores, Inc. and
the shareholders named therein
|
|
Exhibit 10.3 to Amendment No. 2 to the Registration Statement on
Form S-1, File No. 33-42142 (“1991 Form S-1”)
|
|
|
10
|
.2*
|
|
(a)
|
|
Employment Agreement with Anthony Buccina
|
|
Exhibit 10.1 to the Current Report on Form 8-K filed on January
28, 2009 (“1/28/09 Form 8-K”)
|
|
|
|
|
|
(b)
|
|
Restricted Stock Agreement with Anthony Buccina
|
|
Exhibit 10.2 to the 1/28/09 Form 8-K
|
|
|
|
|
|
(c)
|
|
Restricted Stock Agreement — Performance Shares with
Anthony Buccina
|
|
Exhibit 10.3 to the 1/28/09 Form 8-K
|
|
|
10
|
.3*
|
|
(a)
|
|
Employment Agreement with Stephen Byers
|
|
Exhibit 10.4 to the 1/28/09 Form 8-K
|
|
|
|
|
|
(b)
|
|
Restricted Stock Agreement with Stephen Byers
|
|
Exhibit 10.5 to the 1/28/09 Form 8-K
|
|
|
|
|
|
(c)
|
|
Restricted Stock Agreement — Performance Shares with
Stephen Byers
|
|
Exhibit 10.6 to the 1/28/09 Form 8-K
|
|
|
10
|
.4*
|
|
(a)
|
|
Employment Agreement with Byron L. Bergren
|
|
Exhibit 10.1 to the Quarterly Report on Form 10-Q for the
quarter ended July 31, 2004
|
|
|
|
|
|
(b)
|
|
Amendment No. 1 to Employment Agreement with Byron L. Bergren
|
|
Exhibit 10.5(b) to the Annual Report on Form 10-K for the fiscal
year ended January 29, 2005
|
|
|
|
|
|
(c)
|
|
Amendment No. 2 to Employment Agreement with Byron L. Bergren
|
|
Exhibit 99.1 to the Current Report on Form 8-K filed on May 26,
2006
|
|
|
|
|
|
(d)
|
|
Amendment No. 3 to Employment Agreement with Byron L. Bergren
|
|
Exhibit 10.1 to the Current Report on Form 8-K filed on July 19,
2007
|
|
|
|
|
|
(e)
|
|
Amendment No. 4 to Employment Agreement with Byron L. Bergren
|
|
Exhibit 10.1 to the Current Report on Form 8-K filed on March
20, 2009
|
40
| |
|
|
|
|
|
|
|
|
|
Exhibit No.
|
|
Description
|
|
Document Location
|
|
|
|
|
|
|
10
|
.5*
|
|
(a)
|
|
Restricted Stock Unit Agreement with Byron L. Bergren
|
|
Exhibit 10.2 to the Current Report on Form 8-K filed on June 26,
2006 (“6/26/06 Form 8-K”)
|
|
|
|
|
|
(b)
|
|
Restricted Stock Agreement with Byron L. Bergren
|
|
Exhibit 10.2 to the Quarterly Report on Form 10-Q for the
quarter ended August 4, 2007 (“8/4/07 Form 10-Q”)
|
|
|
|
|
|
(c)
|
|
Restricted Stock Agreement with Byron L. Bergren
|
|
Exhibit 10.3 to the 8/4/07 Form 10-Q
|
|
|
|
|
|
(d)
|
|
Restricted Stock Agreement with Byron L. Bergren
|
|
Exhibit 10.1 to the Current Report on Form 8-K filed on March
27, 2008
|
|
|
|
|
|
(e)
|
|
Restricted Stock Agreement with Byron L. Bergren
|
|
Exhibit 10.5(e) to the Annual Report on Form 10-K for the fiscal
year ended January 31, 2009 (“2008 Form 10-K”)
|
|
|
|
|
|
(f)
|
|
Restricted Stock Agreement with Byron L. Bergren
|
|
Exhibit 10.5(f) to the 2008 Form 10-K
|
|
|
10
|
.6*
|
|
(a)
|
|
Executive Transition Agreement with M. Thomas Grumbacher
|
|
Exhibit 10.1 to the Current Report on Form 8-K filed on March
11, 2005
|
|
|
|
|
|
(b)
|
|
Amendment to Executive Transition Agreement with M. Thomas
Grumbacher
|
|
Exhibit 10.1 to the Current Report on Form 8-K filed on December
10, 2007
|
|
|
|
|
|
(c)
|
|
Amendment No. 2 to Executive Transition Agreement with M. Thomas
Grumbacher
|
|
Exhibit 10.1 to the Current Report on Form 8-K filed on February
1, 2010
|
|
|
10
|
.7*
|
|
|
|
Form of severance agreement with certain executive officers
|
|
Exhibit 10.14 to Form 8-B
|
|
|
10
|
.8*
|
|
(a)
|
|
Supplemental Executive Retirement Plan
|
|
Exhibit 10.2 to the Quarterly Report on Form 10-Q for the
quarter ended August 4, 2001
|
|
|
|
|
|
(b)
|
|
Amendment No. 1 to Supplemental Executive Retirement Plan
|
|
Filed Herewith
|
|
|
10
|
.9*
|
|
(a)
|
|
2009 Omnibus Incentive Plan
|
|
Appendix A to Other Definitive Proxy Statements on Form DEF 14A
filed on May 4, 2009
|
|
|
|
|
|
(b)
|
|
Form of Restricted Stock Agreement
|
|
Exhibit 10.1 to the Current Report on Form 8-K filed on
April 16, 2010 (“4/16/10 Form 8-K”)
|
|
|
|
|
|
(c)
|
|
Form of Restricted Stock
Agreement-Performance
Shares
|
|
Exhibit 10.2 to the 4/16/10 Form 8-K
|
|
|
|
|
|
(d)
|
|
Form of Restricted Stock Unit Agreement
|
|
Exhibit 10.3 to the 4/16/10 Form 8-K
|
|
|
|
|
|
(e)
|
|
Form of
Non-Qualified
Stock Option Agreement
|
|
Exhibit 10.4 to the 4/16/10 Form 8-K
|
|
|
10
|
.10*
|
|
|
|
Amended and Restated Cash Bonus Plan
|
|
Appendix A to Other Definitive Proxy Statements on Form DEF 14A
filed on May 4, 2007
|
|
|
10
|
.11*
|
|
|
|
The Bon-Ton Stores, Inc. Deferred Compensation Plan
|
|
Exhibit 10.14 to the Annual Report on Form 10-K for the fiscal
year ended February 3, 2007 (“2006 Form 10-K”)
|
|
|
10
|
.12*
|
|
|
|
The Bon-Ton Stores, Inc. Severance Pay Plan
|
|
Exhibit 10.1 to the Current Report on Form 8-K filed on August
8, 2006
|
41
| |
|
|
|
|
|
|
|
|
|
Exhibit No.
|
|
Description
|
|
Document Location
|
|
|
|
|
|
|
10
|
.13*
|
|
|
|
The Bon-Ton Stores, Inc. Change of Control and Material
Transaction Severance Plan for Certain Employees of Acquired
Employers
|
|
Exhibit 10.16 to the 2006 Form 10-K
|
|
|
10
|
.14
|
|
|
|
Registration Rights Agreement between The Bon-Ton Stores, Inc.
and Tim Grumbacher
|
|
Exhibit 99.3 to the Current Report on Form 8-K filed on November
7, 2003
|
|
|
10
|
.15
|
|
(a)
|
|
Summary of Consulting Arrangement with Michael L. Gleim
|
|
Exhibit 10.1 to the Current Report on Form 8-K filed on December
1, 2005
|
|
|
|
|
|
(b)
|
|
Renewal of Consulting Arrangement with Michael L. Gleim
|
|
Exhibit 10.18(b) to the Annual Report on Form 10-K for the
fiscal year ended February 2, 2008 (“2007 Form 10-K”)
|
|
|
|
|
|
(c)
|
|
Renewal of Consulting Arrangement with Michael L. Gleim
|
|
Exhibit 10.16(c) to the 2008 Form 10-K
|
|
|
10
|
.16
|
|
(a)
|
|
Sublease of Oil City, Pennsylvania store between The Bon-Ton
Stores, Inc. and Nancy T. Grumbacher, Trustee
|
|
Exhibit 10.16 to the 1991 Form S-1
|
|
|
|
|
|
(b)
|
|
First Amendment to Oil City, Pennsylvania sublease
|
|
Exhibit 10.22 to Amendment No. 1 to the 1991 Form S-1
|
|
|
|
|
|
(c)
|
|
Corporate Guarantee with respect to Oil City, Pennsylvania lease
|
|
Exhibit 10.26 to Amendment No. 1 to the 1991 Form S-1
|
|
|
10
|
.17
|
|
(a)
|
|
Credit Card Program Agreement between The Bon-Ton Stores, Inc.
and HSBC Bank Nevada, N.A.
|
|
Exhibit 10.3 to the Current Report on Form 8-K filed on June 23,
2005
|
|
|
|
|
|
(b)
|
|
First Amendment to the Credit Card Program Agreement
|
|
Exhibit 10.5 to the 3/10/06 Form 8-K
|
|
|
|
|
|
(c)
|
|
Second Amendment to the Credit Card Program Agreement
|
|
Exhibit 10.22(c) to the 2006 Form 10-K
|
|
|
|
|
|
(d)
|
|
Third Amendment to the Credit Card Program Agreement
|
|
Exhibit 10.1 to the Current Report on Form 8-K filed on August
10, 2009
|
|
|
|
|
|
(e)
|
|
Exhibits and Schedules to the Credit Card Program Agreement
|
|
Filed Herewith**
|
|
|
10
|
.18
|
|
|
|
Registration Rights Agreement between The Bon-Ton Department
Stores, Inc., The Bon-Ton Stores, Inc., other guarantors listed
on Schedule I of the Agreement, Banc of America Securities LLC
and Citigroup Global Markets Inc.
|
|
Exhibit 10.1 to the 3/10/06 Form 8-K
|
42
| |
|
|
|
|
|
|
|
|
|
Exhibit No.
|
|
Description
|
|
Document Location
|
|
|
|
|
|
|
10
|
.19
|
|
(a)
|
|
Loan and Security Agreement among Bank of America, N.A., The
Bon-Ton Department Stores, Inc., The Elder-Beerman Stores Corp.,
Carson Pirie Scott, Inc. (f/k/a Parisian, Inc.),
Herberger’s Department Stores, LLC and the other credit
parties and lender parties thereto
|
|
Exhibit 10.2 to the 3/10/06 Form 8-K
|
|
|
|
|
|
(b)
|
|
Amendment No. 1 to Loan and Security Agreement among Bank of
America, N.A., The Bon-Ton Department Stores, Inc., The
Elder-Beerman Stores Corp., Carson Pirie Scott, Inc. (f/k/a
Parisian, Inc.), Herberger’s Department Stores, LLC and the
other credit parties and lender parties thereto
|
|
Exhibit 10.24(b) to the 2007 Form 10-K
|
|
|
|
|
|
(c)
|
|
Amendment No. 2 to Loan and Security Agreement among Bank of
America, N.A., The Bon-Ton Department Stores, Inc., The
Elder-Beerman Stores Corp., Carson Pirie Scott, Inc. (f/k/a
Parisian, Inc.), Herberger’s Department Stores, LLC and the
other credit parties and lender parties thereto
|
|
Exhibit 10.3 to the Current Report on Form 8-K filed on November
24, 2009 (“11/24/09 Form 8-K”)
|
|
|
|
|
|
(d)
|
|
Amended and Restated Loan and Security Agreement among Bank of
America, N.A., The Bon-Ton Department Stores, Inc., The
Elder-Beerman Stores Corp. and the other credit parties and
lender parties thereto
|
|
Exhibit 10.1 to the Current Report on Form 8-K filed on December
9, 2009
|
|
|
|
|
|
(e)
|
|
Exhibits and Schedules to the Amended and Restated Loan and
Security Agreement among Bank of America, N.A., The Bon-Ton
Department Stores, Inc., The Elder-Beerman Stores Corp. and the
other credit parties and lender parties thereto
|
|
Filed Herewith**
|
|
|
10
|
.20
|
|
(a)
|
|
Loan Agreement between Bonstores Realty One, LLP and Bank of
America, N.A.
|
|
Exhibit 10.3 to the 3/10/06 Form 8-K
|
|
|
|
|
|
(b)
|
|
Exhibits and Schedules to Loan Agreement between Bonstores
Realty One, LLP and Bank of America, N.A.
|
|
Filed Herewith
|
|
|
10
|
.21
|
|
(a)
|
|
Loan Agreement between Bonstores Realty Two, LLP and Bank of
America, N.A.
|
|
Exhibit 10.4 to the 3/10/06 Form 8-K
|
|
|
|
|
|
(b)
|
|
Exhibits and Schedules to Loan Agreement between Bonstores
Realty Two, LLP and Bank of America, N.A.
|
|
Filed Herewith
|
43
| |
|
|
|
|
|
|
|
|
|
Exhibit No.
|
|
Description
|
|
Document Location
|
|
|
|
|
|
|
10
|
.22*
|
|
(a)
|
|
Carson Pirie Scott & Co. Supplemental Executive Retirement
Plan
|
|
Exhibit 10.29(a) to the 2006 Form 10-K
|
|
|
|
|
|
(b)
|
|
First Amendment to the Carson Pirie Scott & Co.
Supplemental Executive Retirement Plan
|
|
Exhibit 10.29(b) to the 2006 Form 10-K
|
|
|
10
|
.23
|
|
(a)
|
|
Second Lien Loan and Security Agreement among Sankaty Advisors,
LLC, The Bon-Ton Department Stores, Inc., The Elder-Beerman
Stores Corp. and the other credit parties and lender parties
thereto
|
|
Exhibit 10.1 to the 11/24/09 Form 8-K
|
|
|
|
|
|
(b)
|
|
Exhibits and Schedules to Second Lien Loan and Security
Agreement among Sankaty Advisors, LLC, The Bon-Ton Department
Stores, Inc., The Elder-Beerman Stores Corp. and the other
credit parties and lender parties thereto
|
|
Filed Herewith**
|
|
|
10
|
.24
|
|
|
|
Intercreditor Agreement among Bank of America, N.A., Sankaty
Advisors, LLC and the other Revolving Credit Lenders and Term
Loan Lenders
|
|
Exhibit 10.2 to the 11/24/09 Form 8-K
|
|
|
16
|
.1
|
|
|
|
Letter from ParenteBeard LLC
|
|
Exhibit 16.1 to the Current Report on Form 8-K filed on February
5, 2010
|
|
|
21
|
|
|
|
|
Subsidiaries of the Registrant
|
|
Filed Herewith
|
|
|
23
|
|
|
|
|
Consent of KPMG LLP
|
|
Filed Herewith
|
|
|
31
|
.1
|
|
|
|
Certification of Byron L. Bergren
|
|
Filed Herewith
|
|
|
31
|
.2
|
|
|
|
Certification of Keith E. Plowman
|
|
Filed Herewith
|
|
|
32
|
|
|
|
|
Certifications Pursuant to Rules 13a-14(b) and 15d-14(b) of the
Securities Exchange Act of 1934
|
|
Filed Herewith
|
|
|
|
|
* |
|
Constitutes a management contract or compensatory plan or
arrangement. |
| |
|
** |
|
Portions of the document have been omitted pursuant to a request
for confidential treatment. |
44
SIGNATURES
Pursuant to the requirements of Section 13 or 15(d) of the
Securities Exchange Act of 1934, the registrant has duly caused
this report to be signed on its behalf by the undersigned,
thereunto duly authorized.
THE BON-TON STORES, INC.
Executive Vice President, Chief
Financial Officer and Principal
Accounting Officer
Dated: April 16, 2010
Pursuant to the requirements of the Securities Exchange Act of
1934, this report has been signed below by the following persons
on behalf of the Registrant and in the capacities and on the
dates indicated.
| |
|
|
|
|
|
|
|
Signature
|
|
Capacity
|
|
Date
|
|
|
|
|
|
|
|
|
|
|
|
/s/ Tim
Grumbacher
Tim
Grumbacher
|
|
Executive Chairman of the Board
|
|
April 16, 2010
|
|
|
|
|
|
|
|
/s/ Byron
L. Bergren
Byron
L. Bergren
|
|
President and Chief Executive Officer and Director
|
|
April 16, 2010
|
|
|
|
|
|
|
|
/s/ Keith
E. Plowman
Keith
E. Plowman
|
|
Executive Vice President, Chief Financial Officer and Principal
Accounting Officer
|
|
April 16, 2010
|
|
|
|
|
|
|
|
/s/ Lucinda
M. Baier
Lucinda
M. Baier
|
|
Director
|
|
April 16, 2010
|
|
|
|
|
|
|
|
/s/ Philip
M. Browne
Philip
M. Browne
|
|
Director
|
|
April 16, 2010
|
|
|
|
|
|
|
|
/s/ Shirley
A. Dawe
Shirley
A. Dawe
|
|
Director
|
|
April 16, 2010
|
|
|
|
|
|
|
|
/s/ Marsha
M. Everton
Marsha
M. Everton
|
|
Director
|
|
April 16, 2010
|
|
|
|
|
|
|
|
/s/ Michael
L. Gleim
Michael
L. Gleim
|
|
Director
|
|
April 16, 2010
|
|
|
|
|
|
|
|
/s/ Todd
C. McCarty
Todd
C. McCarty
|
|
Director
|
|
April 16, 2010
|
45
INDEX TO
CONSOLIDATED FINANCIAL STATEMENTS
AND FINANCIAL STATEMENT SCHEDULE
| |
|
|
|
|
|
|
|
|
F-2
|
|
|
|
|
|
F-3
|
|
|
|
|
|
F-4
|
|
|
|
|
|
F-5
|
|
|
|
|
|
F-6
|
|
|
|
|
|
F-7
|
|
|
|
|
|
F-55
|
|
F-1
REPORT OF
INDEPENDENT REGISTERED PUBLIC ACCOUNTING FIRM
The Board of Directors and Shareholders
The Bon-Ton Stores, Inc.:
We have audited the accompanying consolidated balance sheets of
The Bon-Ton Stores, Inc. and subsidiaries as of January 30,
2010 and January 31, 2009, and the related consolidated
statements of operations, shareholders’ equity, and cash
flows for each of the fiscal years in the three-year period
ended January 30, 2010. In connection with our audits of
the consolidated financial statements, we also have audited the
financial statement schedule, Valuation and Qualifying Accounts.
These consolidated financial statements and financial statement
schedule are the responsibility of the Company’s
management. Our responsibility is to express an opinion on these
consolidated financial statements and financial statement
schedule based on our audits.
We conducted our audits in accordance with the standards of the
Public Company Accounting Oversight Board (United States). Those
standards require that we plan and perform the audit to obtain
reasonable assurance about whether the financial statements are
free of material misstatement. An audit includes examining, on a
test basis, evidence supporting the amounts and disclosures in
the financial statements. An audit also includes assessing the
accounting principles used and significant estimates made by
management, as well as evaluating the overall financial
statement presentation. We believe that our audits provide a
reasonable basis for our opinion.
In our opinion, the consolidated financial statements referred
to above present fairly, in all material respects, the financial
position of The Bon-Ton Stores, Inc. and subsidiaries as of
January 30, 2010 and January 31, 2009, and the results
of their operations and their cash flows for each of the fiscal
years in the three-year period ended January 30, 2010, in
conformity with U.S. generally accepted accounting
principles. Also in our opinion, the related financial statement
schedule, when considered in relation to the basic consolidated
financial statements taken as a whole, presents fairly, in all
material respects, the information set forth therein.
We also have audited, in accordance with the standards of the
Public Company Accounting Oversight Board (United States), The
Bon-Ton Stores, Inc.’s internal control over financial
reporting as of January 30, 2010, based on criteria
established in Internal Control — Integrated
Framework issued by the Committee of Sponsoring
Organizations of the Treadway Commission (COSO), and our report
dated April 16, 2010 expressed an unqualified opinion on
the effectiveness of the Company’s internal control over
financial reporting.
Harrisburg, Pennsylvania
April 16, 2010
F-2
| |
|
|
|
|
|
|
|
|
|
|
|
|
|
|
|
January 30,
|
|
|
January 31,
|
|
|
|
|
|
(In thousands except share and per share data)
|
|
2010
|
|
|
2009
|
|
|
|
|
|
|
|
|
|
|
Assets
|
|
|
|
|
|
|
|
|
|
|
|
|
|
Current assets:
|
|
|
|
|
|
|
|
|
|
|
|
|
|
Cash and cash equivalents
|
|
$
|
18,922
|
|
|
$
|
19,719
|
|
|
|
|
|
|
Merchandise inventories
|
|
|
659,399
|
|
|
|
666,081
|
|
|
|
|
|
|
Prepaid expenses and other current assets
|
|
|
87,690
|
|
|
|
113,441
|
|
|
|
|
|
|
|
|
Total current assets
|
|
|
766,011
|
|
|
|
799,241
|
|
|
|
|
|
|
|
|
Property, fixtures and equipment at cost, net of accumulated
depreciation and amortization of $594,020 and $498,556 at
January 30, 2010 and January 31, 2009, respectively
|
|
|
756,618
|
|
|
|
832,763
|
|
|
|
|
|
|
Deferred income taxes
|
|
|
13,303
|
|
|
|
9,994
|
|
|
|
|
|
|
Intangible assets, net of accumulated amortization of $38,477
and $30,611 at January 30, 2010 and January 31, 2009,
respectively
|
|
|
138,794
|
|
|
|
148,171
|
|
|
|
|
|
|
Other long-term assets
|
|
|
47,281
|
|
|
|
31,152
|
|
|
|
|
|
|
|
|
Total assets
|
|
$
|
1,722,007
|
|
|
$
|
1,821,321
|
|
|
|
|
|
|
|
|
|
|
|
|
|
|
|
|
|
|
|
|
|
|
Liabilities and Shareholders’ Equity
|
|
|
|
|
|
|
|
|
|
|
|
|
|
Current liabilities:
|
|
|
|
|
|
|
|
|
|
|
|
|
|
Accounts payable
|
|
$
|
163,671
|
|
|
$
|
143,423
|
|
|
|
|
|
|
Accrued payroll and benefits
|
|
|
48,297
|
|
|
|
36,116
|
|
|
|
|
|
|
Accrued expenses
|
|
|
160,737
|
|
|
|
179,073
|
|
|
|
|
|
|
Current maturities of long-term debt
|
|
|
7,509
|
|
|
|
6,072
|
|
|
|
|
|
|
Current maturities of obligations under capital leases
|
|
|
5,044
|
|
|
|
2,730
|
|
|
|
|
|
|
Deferred income taxes
|
|
|
14,820
|
|
|
|
7,328
|
|
|
|
|
|
|
Income taxes payable
|
|
|
—
|
|
|
|
62
|
|
|
|
|
|
|
|
|
Total current liabilities
|
|
|
400,078
|
|
|
|
374,804
|
|
|
|
|
|
|
|
|
Long-term debt, less current maturities
|
|
|
951,315
|
|
|
|
1,083,449
|
|
|
|
|
|
|
Obligations under capital leases, less current maturities
|
|
|
65,405
|
|
|
|
65,319
|
|
|
|
|
|
|
Other long-term liabilities
|
|
|
163,453
|
|
|
|
163,572
|
|
|
|
|
|
|
|
|
Total liabilities
|
|
|
1,580,251
|
|
|
|
1,687,144
|
|
|
|
|
|
|
|
|
Commitments and contingencies (Note 12)
|
|
|
|
|
|
|
|
|
|
|
|
|
|
Shareholders’ equity
|
|
|
|
|
|
|
|
|
|
|
|
|
|
Preferred Stock — authorized 5,000,000 shares at
$0.01 par value; no shares issued
|
|
|
—
|
|
|
|
—
|
|
|
|
|
|
|
Common Stock — authorized 40,000,000 shares at
$0.01 par value; issued shares of 15,942,348 and 14,880,173
at January 30, 2010 and January 31, 2009, respectively
|
|
|
159
|
|
|
|
149
|
|
|
|
|
|
|
Class A Common Stock — authorized
20,000,000 shares at $0.01 par value; issued and
outstanding shares of 2,951,490 at January 30, 2010 and
January 31, 2009
|
|
|
30
|
|
|
|
30
|
|
|
|
|
|
|
Treasury stock, at cost — 337,800 shares at
January 30, 2010 and January 31, 2009
|
|
|
(1,387
|
)
|
|
|
(1,387
|
)
|
|
|
|
|
|
Additional paid-in capital
|
|
|
149,649
|
|
|
|
144,577
|
|
|
|
|
|
|
Accumulated other comprehensive loss
|
|
|
(52,912
|
)
|
|
|
(59,464
|
)
|
|
|
|
|
|
Retained earnings
|
|
|
46,217
|
|
|
|
50,272
|
|
|
|
|
|
|
|
|
Total shareholders’ equity
|
|
|
141,756
|
|
|
|
134,177
|
|
|
|
|
|
|
|
|
Total liabilities and shareholders’ equity
|
|
$
|
1,722,007
|
|
|
$
|
1,821,321
|
|
|
|
|
|
|
|
The accompanying notes are an integral part of these
consolidated financial statements.
F-3
| |
|
|
|
|
|
|
|
|
|
|
|
|
|
|
|
Fiscal Year Ended
|
|
|
|
|
January 30,
|
|
|
January 31,
|
|
|
February 2,
|
|
|
(In thousands except share and per
share data)
|
|
2010
|
|
|
2009
|
|
|
2008
|
|
|
|
|
|
|
|
Net sales
|
|
$
|
2,959,824
|
|
|
$
|
3,129,967
|
|
|
$
|
3,365,912
|
|
|
Other income
|
|
|
75,113
|
|
|
|
95,448
|
|
|
|
102,657
|
|
|
|
|
|
|
|
3,034,937
|
|
|
|
3,225,415
|
|
|
|
3,468,569
|
|
|
|
|
Costs and expenses:
|
|
|
|
|
|
|
|
|
|
|
|
|
|
Costs of merchandise sold
|
|
|
1,862,192
|
|
|
|
2,034,960
|
|
|
|
2,150,131
|
|
|
Selling, general and administrative
|
|
|
963,639
|
|
|
|
1,033,525
|
|
|
|
1,066,663
|
|
|
Depreciation and amortization
|
|
|
111,635
|
|
|
|
117,382
|
|
|
|
117,055
|
|
|
Amortization of lease-related interests
|
|
|
4,866
|
|
|
|
4,866
|
|
|
|
4,978
|
|
|
Goodwill impairment
|
|
|
—
|
|
|
|
17,767
|
|
|
|
—
|
|
|
Other impairment charges
|
|
|
5,883
|
|
|
|
25,905
|
|
|
|
4,070
|
|
|
|
|
Income (loss) from operations
|
|
|
86,722
|
|
|
|
(8,990
|
)
|
|
|
125,672
|
|
|
Interest expense, net
|
|
|
98,808
|
|
|
|
97,847
|
|
|
|
108,165
|
|
|
|
|
(Loss) income before income taxes
|
|
|
(12,086
|
)
|
|
|
(106,837
|
)
|
|
|
17,507
|
|
|
Income tax (benefit) provision
|
|
|
(8,031
|
)
|
|
|
63,093
|
|
|
|
5,945
|
|
|
|
|
Net (loss) income
|
|
$
|
(4,055
|
)
|
|
$
|
(169,930
|
)
|
|
$
|
11,562
|
|
|
|
|
Per share amounts —
|
|
|
|
|
|
|
|
|
|
|
|
|
|
Basic:
|
|
|
|
|
|
|
|
|
|
|
|
|
|
Net (loss) income
|
|
$
|
(0.24
|
)
|
|
$
|
(10.12
|
)
|
|
$
|
0.67
|
|
|
|
|
Diluted:
|
|
|
|
|
|
|
|
|
|
|
|
|
|
Net (loss) income
|
|
$
|
(0.24
|
)
|
|
$
|
(10.12
|
)
|
|
$
|
0.67
|
|
|
|
The accompanying notes are an integral part of these
consolidated financial statements.
F-4
| |
|
|
|
|
|
|
|
|
|
|
|
|
|
|
|
|
|
|
|
|
|
|
|
|
|
|
|
|
|
|
|
|
|
|
|
|
|
|
|
|
|
|
|
Accumulated
|
|
|
|
|
|
|
|
|
|
|
|
|
|
|
|
|
|
|
|
|
|
|
Other
|
|
|
|
|
|
|
|
|
|
|
|
|
|
Class A
|
|
|
|
|
|
Additional
|
|
|
Compre-
|
|
|
|
|
|
|
|
|
|
|
Common
|
|
|
Common
|
|
|
Treasury
|
|
|
Paid-in
|
|
|
hensive
|
|
|
Retained
|
|
|
|
|
|
(In thousands except per share data)
|
|
Stock
|
|
|
Stock
|
|
|
Stock
|
|
|
Capital
|
|
|
Income (Loss)
|
|
|
Earnings
|
|
|
Total
|
|
|
|
|
|
|
|
BALANCE AT FEBRUARY 3, 2007
|
|
$
|
145
|
|
|
$
|
30
|
|
|
$
|
(1,387
|
)
|
|
$
|
130,875
|
|
|
$
|
1,189
|
|
|
$
|
215,544
|
|
|
$
|
346,396
|
|
|
|
|
Comprehensive income (Note 14):
|
|
|
|
|
|
|
|
|
|
|
|
|
|
|
|
|
|
|
|
|
|
|
|
|
|
|
|
|
|
Net income
|
|
|
—
|
|
|
|
—
|
|
|
|
—
|
|
|
|
—
|
|
|
|
—
|
|
|
|
11,562
|
|
|
|
11,562
|
|
|
Pension and postretirement benefit plans, net of tax
|
|
|
—
|
|
|
|
—
|
|
|
|
—
|
|
|
|
—
|
|
|
|
3,266
|
|
|
|
—
|
|
|
|
3,266
|
|
|
Change in fair value of cash flow hedges, net of tax
|
|
|
—
|
|
|
|
—
|
|
|
|
—
|
|
|
|
—
|
|
|
|
(3,656
|
)
|
|
|
—
|
|
|
|
(3,656
|
)
|
|
|
|
Comprehensive income
|
|
|
|
|
|
|
|
|
|
|
|
|
|
|
|
|
|
|
|
|
|
|
|
|
|
|
11,172
|
|
|
Dividends to shareholders, $0.20 per share
|
|
|
—
|
|
|
|
—
|
|
|
|
—
|
|
|
|
—
|
|
|
|
—
|
|
|
|
(3,438
|
)
|
|
|
(3,438
|
)
|
|
Proceeds from stock options exercised
|
|
|
1
|
|
|
|
—
|
|
|
|
—
|
|
|
|
603
|
|
|
|
—
|
|
|
|
—
|
|
|
|
604
|
|
|
Share-based compensation expense
|
|
|
—
|
|
|
|
—
|
|
|
|
—
|
|
|
|
7,965
|
|
|
|
—
|
|
|
|
—
|
|
|
|
7,965
|
|
|
Excess tax benefit from share-based compensation
|
|
|
—
|
|
|
|
—
|
|
|
|
—
|
|
|
|
366
|
|
|
|
—
|
|
|
|
—
|
|
|
|
366
|
|
|
Cancellation of restricted shares
|
|
|
—
|
|
|
|
—
|
|
|
|
—
|
|
|
|
(4
|
)
|
|
|
—
|
|
|
|
—
|
|
|
|
(4
|
)
|
|
|
|
BALANCE AT FEBRUARY 2, 2008
|
|
|
146
|
|
|
|
30
|
|
|
|
(1,387
|
)
|
|
|
139,805
|
|
|
|
799
|
|
|
|
223,668
|
|
|
|
363,061
|
|
|
|
|
Comprehensive loss (Note 14):
|
|
|
|
|
|
|
|
|
|
|
|
|
|
|
|
|
|
|
|
|
|
|
|
|
|
|
|
|
|
Net loss
|
|
|
—
|
|
|
|
—
|
|
|
|
—
|
|
|
|
—
|
|
|
|
—
|
|
|
|
(169,930
|
)
|
|
|
(169,930
|
)
|
|
Pension and postretirement benefit plans
|
|
|
—
|
|
|
|
—
|
|
|
|
—
|
|
|
|
—
|
|
|
|
(62,279
|
)
|
|
|
—
|
|
|
|
(62,279
|
)
|
|
Change in fair value of cash flow hedges
|
|
|
—
|
|
|
|
—
|
|
|
|
—
|
|
|
|
—
|
|
|
|
2,016
|
|
|
|
—
|
|
|
|
2,016
|
|
|
|
|
Comprehensive loss
|
|
|
|
|
|
|
|
|
|
|
|
|
|
|
|
|
|
|
|
|
|
|
|
|
|
|
(230,193
|
)
|
|
Dividends to shareholders, $0.20 per share
|
|
|
—
|
|
|
|
—
|
|
|
|
—
|
|
|
|
—
|
|
|
|
—
|
|
|
|
(3,466
|
)
|
|
|
(3,466
|
)
|
|
Share-based compensation expense
|
|
|
3
|
|
|
|
—
|
|
|
|
—
|
|
|
|
5,269
|
|
|
|
—
|
|
|
|
—
|
|
|
|
5,272
|
|
|
Tax shortfall from share-based compensation
|
|
|
—
|
|
|
|
—
|
|
|
|
—
|
|
|
|
(497
|
)
|
|
|
—
|
|
|
|
—
|
|
|
|
(497
|
)
|
|
|
|
BALANCE AT JANUARY 31, 2009
|
|
|
149
|
|
|
|
30
|
|
|
|
(1,387
|
)
|
|
|
144,577
|
|
|
|
(59,464
|
)
|
|
|
50,272
|
|
|
|
134,177
|
|
|
|
|
Comprehensive income (Note 14):
|
|
|
|
|
|
|
|
|
|
|
|
|
|
|
|
|
|
|
|
|
|
|
|
|
|
|
|
|
|
Net loss
|
|
|
—
|
|
|
|
—
|
|
|
|
—
|
|
|
|
—
|
|
|
|
—
|
|
|
|
(4,055
|
)
|
|
|
(4,055
|
)
|
|
Pension and postretirement benefit plans
|
|
|
—
|
|
|
|
—
|
|
|
|
—
|
|
|
|
—
|
|
|
|
5,639
|
|
|
|
—
|
|
|
|
5,639
|
|
|
Change in fair value of cash flow hedges
|
|
|
—
|
|
|
|
—
|
|
|
|
—
|
|
|
|
—
|
|
|
|
913
|
|
|
|
—
|
|
|
|
913
|
|
|
|
|
Comprehensive income
|
|
|
|
|
|
|
|
|
|
|
|
|
|
|
|
|
|
|
|
|
|
|
|
|
|
|
2,497
|
|
|
Share-based compensation expense
|
|
|
10
|
|
|
|
—
|
|
|
|
—
|
|
|
|
5,072
|
|
|
|
—
|
|
|
|
—
|
|
|
|
5,082
|
|
|
|
|
BALANCE AT JANUARY 30, 2010
|
|
$
|
159
|
|
|
$
|
30
|
|
|
$
|
(1,387
|
)
|
|
$
|
149,649
|
|
|
$
|
(52,912
|
)
|
|
$
|
46,217
|
|
|
$
|
141,756
|
|
|
|
The accompanying notes are an integral part of these
consolidated financial statements.
F-5
| |
|
|
|
|
|
|
|
|
|
|
|
|
|
|
|
Fiscal Year Ended
|
|
|
|
|
January 30,
|
|
|
January 31,
|
|
|
February 2,
|
|
|
(In thousands)
|
|
2010
|
|
|
2009
|
|
|
2008
|
|
|
|
|
|
|
|
Cash flows from operating activities:
|
|
|
|
|
|
|
|
|
|
|
|
|
|
Net (loss) income
|
|
$
|
(4,055
|
)
|
|
$
|
(169,930
|
)
|
|
$
|
11,562
|
|
|
Adjustments to reconcile net (loss) income to net cash provided
by operating activities:
|
|
|
|
|
|
|
|
|
|
|
|
|
|
Depreciation and amortization
|
|
|
111,635
|
|
|
|
117,382
|
|
|
|
117,055
|
|
|
Amortization of lease-related interests
|
|
|
4,866
|
|
|
|
4,866
|
|
|
|
4,978
|
|
|
Goodwill impairment
|
|
|
—
|
|
|
|
17,767
|
|
|
|
—
|
|
|
Other impairment charges
|
|
|
5,883
|
|
|
|
25,905
|
|
|
|
4,070
|
|
|
Share-based compensation expense
|
|
|
5,082
|
|
|
|
5,272
|
|
|
|
7,965
|
|
|
Excess tax benefit from share-based compensation
|
|
|
—
|
|
|
|
—
|
|
|
|
(366
|
)
|
|
Loss on sale of property, fixtures and equipment
|
|
|
101
|
|
|
|
715
|
|
|
|
281
|
|
|
Reclassifications of other comprehensive loss
|
|
|
10,651
|
|
|
|
2,287
|
|
|
|
532
|
|
|
Amortization of deferred financing costs
|
|
|
5,551
|
|
|
|
4,184
|
|
|
|
4,143
|
|
|
Amortization of deferred gain on sale of proprietary credit card
portfolio
|
|
|
(2,414
|
)
|
|
|
(2,414
|
)
|
|
|
(2,414
|
)
|
|
Deferred income tax provision
|
|
|
4,183
|
|
|
|
101,253
|
|
|
|
1,378
|
|
|
Changes in operating assets and liabilities, net of effect of
acquisitions:
|
|
|
|
|
|
|
|
|
|
|
|
|
|
Decrease in merchandise inventories
|
|
|
6,683
|
|
|
|
88,721
|
|
|
|
32,844
|
|
|
Decrease (increase) in prepaid expenses and other current assets
|
|
|
25,751
|
|
|
|
(35,607
|
)
|
|
|
6,395
|
|
|
Decrease in other long-term assets
|
|
|
2,333
|
|
|
|
239
|
|
|
|
892
|
|
|
Increase (decrease) in accounts payable
|
|
|
22,655
|
|
|
|
(62,888
|
)
|
|
|
(5,808
|
)
|
|
Decrease in accrued payroll and benefits and accrued expenses
|
|
|
(5,071
|
)
|
|
|
(6,148
|
)
|
|
|
(25,112
|
)
|
|
Decrease in income taxes payable
|
|
|
(62
|
)
|
|
|
(837
|
)
|
|
|
(33,067
|
)
|
|
Increase in other long-term liabilities
|
|
|
262
|
|
|
|
3,439
|
|
|
|
10,236
|
|
|
|
|
Net cash provided by operating activities
|
|
|
194,034
|
|
|
|
94,206
|
|
|
|
135,564
|
|
|
|
|
Cash flows from investing activities:
|
|
|
|
|
|
|
|
|
|
|
|
|
|
Capital expenditures
|
|
|
(32,346
|
)
|
|
|
(84,810
|
)
|
|
|
(109,659
|
)
|
|
Acquisitions, net of cash acquired
|
|
|
—
|
|
|
|
—
|
|
|
|
(62
|
)
|
|
Proceeds from sale of property, fixtures and equipment
|
|
|
110
|
|
|
|
348
|
|
|
|
2,807
|
|
|
|
|
Net cash used in investing activities
|
|
|
(32,236
|
)
|
|
|
(84,462
|
)
|
|
|
(106,914
|
)
|
|
|
|
Cash flows from financing activities:
|
|
|
|
|
|
|
|
|
|
|
|
|
|
Payments on long-term debt and capital lease obligations
|
|
|
(899,894
|
)
|
|
|
(805,480
|
)
|
|
|
(893,473
|
)
|
|
Proceeds from issuance of long-term debt
|
|
|
765,051
|
|
|
|
807,467
|
|
|
|
851,309
|
|
|
Cash dividends paid
|
|
|
(866
|
)
|
|
|
(2,600
|
)
|
|
|
(3,438
|
)
|
|
Proceeds from stock options exercised
|
|
|
—
|
|
|
|
—
|
|
|
|
604
|
|
|
Excess tax benefit from share-based compensation
|
|
|
—
|
|
|
|
—
|
|
|
|
366
|
|
|
Deferred financing costs paid
|
|
|
(24,013
|
)
|
|
|
(268
|
)
|
|
|
(307
|
)
|
|
(Decrease) increase in bank overdraft balances
|
|
|
(2,873
|
)
|
|
|
(10,382
|
)
|
|
|
12,794
|
|
|
|
|
Net cash used in financing activities
|
|
|
(162,595
|
)
|
|
|
(11,263
|
)
|
|
|
(32,145
|
)
|
|
|
|
Net decrease in cash and cash equivalents
|
|
|
(797
|
)
|
|
|
(1,519
|
)
|
|
|
(3,495
|
)
|
|
Cash and cash equivalents at beginning of period
|
|
|
19,719
|
|
|
|
21,238
|
|
|
|
24,733
|
|
|
|
|
Cash and cash equivalents at end of period
|
|
$
|
18,922
|
|
|
$
|
19,719
|
|
|
$
|
21,238
|
|
|
|
The accompanying notes are an integral part of these
consolidated financial statements.
F-6
The Bon-Ton Stores, Inc. is a Pennsylvania corporation
incorporated on January 31, 1996 as the successor of a
company incorporated on January 31, 1929. As of
January 30, 2010, The Bon-Ton Stores, Inc. operated,
through its subsidiaries, 278 stores in 23 states in the
Northeast, Midwest and upper Great Plains under the Bon-Ton,
Bergner’s, Boston Store, Carson Pirie Scott, Elder-Beerman,
Herberger’s and Younkers nameplates and, in the Detroit,
Michigan area, under the Parisian nameplate.
References to “the Company” refer to The Bon-Ton
Stores, Inc. and its subsidiaries.
The Company’s fiscal year ends on the Saturday nearer
January 31, and consisted of fifty-two weeks for each of
2009, 2008 and 2007. References to “2009,”
“2008” and “2007” represent the
Company’s fiscal 2009 year ended January 30,
2010, fiscal 2008 year ended January 31, 2009 and
fiscal 2007 year ended February 2, 2008, respectively.
References to “2010” represent the Company’s
fiscal 2010 year ending January 29, 2011.
|
|
|
1.
|
SUMMARY OF
SIGNIFICANT ACCOUNTING POLICIES
|
Basis of
Presentation
The consolidated financial statements include the accounts of
The Bon-Ton Stores, Inc. and its wholly owned subsidiaries. All
intercompany transactions have been eliminated in consolidation.
The Company conducts its operations through one business segment.
Estimates
The preparation of financial statements in conformity with
accounting principles generally accepted in the United States
requires that management make estimates and assumptions about
future events. These estimates and assumptions affect the
amounts of assets and liabilities reported, disclosures about
contingent assets and liabilities and the reported amounts of
revenues and expenses. Such estimates include the valuation of
inventories, long-lived assets, intangible assets, insurance
reserves, legal contingencies and assumptions used in the
calculation of income taxes and retirement and other
post-employment benefits, among others. These estimates and
assumptions are based on management’s best estimates and
judgments. Management evaluates its estimates and assumptions on
an ongoing basis using historical experience and other factors,
including the current economic environment, which management
believes to be reasonable under the circumstances. Management
adjusts such estimates and assumptions when facts and
circumstances dictate. As future events and their effects cannot
be determined with precision, actual results could differ
significantly from these estimates. Changes in those estimates
resulting from continuing changes in the economic environment
will be reflected in the financial statements in future periods.
Reclassifications
Certain prior year balances presented in the consolidated
financial statements and notes thereto have been reclassified to
conform to the current year presentation. These
reclassifications did not impact the Company’s net (loss)
income for 2009, 2008 or 2007.
Cash and Cash
Equivalents
The Company considers all highly liquid short-term investments
with maturities of three months or less at the time of purchase
to be cash equivalents. Cash equivalents are generally overnight
money market investments.
F-7
THE BON-TON
STORES, INC.
NOTES TO CONSOLIDATED FINANCIAL STATEMENTS
(In thousands except share and per share data)
Merchandise
Inventories
For financial reporting and tax purposes, merchandise
inventories are determined by the retail method. As of
January 30, 2010 and January 31, 2009, approximately
32% of the Company’s merchandise inventories were valued
using a
first-in,
first-out (“FIFO”) cost basis and approximately 68% of
merchandise inventories were valued using a
last-in,
first-out (“LIFO”) cost basis. There was no effect on
costs of merchandise sold for LIFO valuations in 2009, 2008 and
2007. If the FIFO method of inventory valuation had been used
for all inventories, the Company’s merchandise inventories
would have been lower by $6,837 at January 30, 2010 and
January 31, 2009.
Costs for merchandise purchases, product development and
distribution are included in costs of merchandise sold.
Property,
Fixtures and Equipment: Depreciation and
Amortization
Depreciation and amortization of property, fixtures and
equipment is computed using the straight-line method based upon
the shorter of the remaining accounting lease term, if
applicable, or the economic life reflected in the following
ranges:
| |
|
|
|
|
|
Buildings
|
|
|
20 to 40 years
|
|
|
Leasehold improvements
|
|
|
2 to 15 years
|
|
|
Fixtures and equipment
|
|
|
3 to 10 years
|
|
No depreciation is recorded until property, fixtures and
equipment are placed into service. The Company capitalizes
interest incurred during the construction of new facilities or
major improvements to existing facilities and development
projects that exceed one month. The amount of interest costs
capitalized is limited to the costs incurred during the
construction period. Interest of $196, $410 and $257 was
capitalized in 2009, 2008 and 2007, respectively.
Repair and maintenance costs are charged to selling, general and
administrative (“SG&A”) expense as incurred.
Property retired or sold is removed from asset and accumulated
depreciation accounts and the resulting gain or loss is
reflected in SG&A expense.
Costs of major remodeling and improvements on leased stores are
capitalized as leasehold improvements. Leasehold improvements
are amortized over the shorter of the accounting lease term or
the useful life of the asset. Capital leases are recorded at the
lower of fair market value or the present value of future
minimum lease payments. Capital leases are amortized in
accordance with the provisions codified within ASC Subtopic
840-30,
Leases — Capital Leases.
ASC
Section 360-10-35,
Property, Plant and Equipment — Overall —
Subsequent Measurement (“ASC
360-10-35”),
requires the Company to test a long-lived asset for
recoverability whenever events or changes in circumstances
indicate that its carrying value may not be recoverable. If the
undiscounted cash flows associated with the asset are
insufficient to support the recorded asset, an impairment loss
is recognized for the amount (if any) by which the carrying
amount of the asset exceeds the fair value of the asset. Cash
flow estimates are based on historical results, adjusted to
reflect the Company’s best estimate of future market and
operating conditions. Estimates of fair value are determined
through various techniques, including discounted cash flow
models and market approaches, as considered necessary. As a
result of this evaluation, asset impairment charges, which
resulted in a reduction in the carrying amount of certain store
and distribution center properties of $5,717, $17,853 and
$2,747, were recorded in 2009, 2008 and 2007, respectively (see
Note 2).
F-8
THE BON-TON
STORES, INC.
NOTES TO CONSOLIDATED FINANCIAL STATEMENTS
(In thousands except share and per share data)
Goodwill and
Intangible Assets
In accordance with the provisions codified within ASC
Section 350-20-35,
Intangibles — Goodwill and Other —
Goodwill — Subsequent Measurement (“ASC
350-20-35”),
and ASC
Section 350-30-35,
Intangibles — Goodwill and Other —
General Intangibles Other than Goodwill — Subsequent
Measurement (“ASC
350-30-35”),
goodwill and other intangible assets that have indefinite lives,
respectively, are reviewed for impairment at the reporting unit
level at least annually or when events or changes in
circumstances indicate it is more likely than not that the
carrying value of these assets exceeds their implied fair
values. Intangible assets subject to amortization are reviewed
for impairment in accordance with
ASC 360-10-35.
Based on its reporting structure, management has determined the
Company has one reporting unit for purposes of applying
ASC 350-20-35
and
ASC 350-30-35.
Fair value is determined using quoted market prices
and/or a
discounted cash flow analysis and other generally accepted
valuation methodologies, which requires certain assumptions and
estimates regarding industry economic factors and future
profitability of acquired businesses. The Company’s policy
is to conduct impairment testing based on its most current
business plans, which reflect anticipated changes in the economy
and the industry.
As a result of its impairment review in the second quarter of
2008, the Company determined its goodwill was fully impaired
and, accordingly, recorded a charge of $17,767. Based upon the
Company’s review, the fair value of its single reporting
unit, estimated using a combination of the Company’s common
stock trading value as of the end of the second quarter of 2008,
a discounted cash flow analysis and other generally accepted
valuation methodologies, was less than the carrying amount (see
Note 3). No such charge was recorded in 2007. As a result
of its review of the carrying value of intangible assets in
2009, the Company recorded an asset impairment charge of $166
related to the reduction in the value of two indefinite-lived
private label brand names (see Note 3). In 2008, the
Company recorded an asset impairment charge of $8,052 primarily
related to the reduction in the value of four indefinite-lived
trade names. In 2007, the Company recorded an asset impairment
charge of $1,323 related to the reduction in the value of two
indefinite-lived private label brand names.
Deferred
Financing Fees
Amounts paid by the Company to secure financing agreements are
reflected in other long-term assets and are amortized over the
term of the related facility. Amortization of credit facility
costs are classified as interest expense. Unamortized amounts at
January 30, 2010 and January 31, 2009 were $36,265 and
$17,812, respectively. Deferred financing fees amortized to
expense for 2009, 2008 and 2007 were $5,551, $4,184 and $4,143,
respectively.
Income
Taxes
Income taxes are accounted for under the asset and liability
method, pursuant to ASC Topic 740, Income Taxes
(“ASC 740”). Deferred tax assets and liabilities
are recognized for the future tax consequences attributable to
differences between the financial statement carrying amounts of
existing assets and liabilities and their respective tax bases
and operating loss and tax credit carryforwards. Deferred tax
assets and liabilities are measured using enacted tax rates
expected to apply to taxable income in the years in which those
temporary differences are expected to be recovered or settled.
The effect on deferred tax assets and liabilities of a change in
tax rates is recognized in income in the period that includes
the enactment date. ASC 740 requires an assessment of
whether valuation allowances are needed against deferred tax
assets based upon consideration of all available evidence using
a “more likely than not” standard. The Company
reported
F-9
THE BON-TON
STORES, INC.
NOTES TO CONSOLIDATED FINANCIAL STATEMENTS
(In thousands except share and per share data)
valuation allowances of $140,452 and $145,468 at
January 30, 2010 and January 31, 2009, respectively
(see Note 16).
In accordance with ASC 740, the Company recognizes the
effect of income tax positions only if those positions are more
likely than not of being sustained. Recognized income tax
positions are measured at the largest amount that is greater
than 50% likely of being realized. Changes in recognition or
measurement are reflected in the period in which the change in
judgment occurs.
Revenue
Recognition
The Company recognizes revenue, which excludes sales tax, at
either the
point-of-sale
or at the time merchandise is delivered to the customer and all
significant obligations have been satisfied. The Company has a
customer return policy allowing customers to return merchandise
with proper documentation. A reserve is provided for estimated
merchandise returns, based on historical returns experience, and
is reflected as an adjustment to sales and costs of merchandise
sold.
Other
Income
The Company receives revenues under a credit card program
agreement with HSBC Bank Nevada, N.A. (“HSBC”), as
amended (see Note 19), in which the Company is paid a
percentage of net credit sales for its proprietary credit card
sales. The aforementioned revenues are recorded within other
income. The Company also licenses space to third parties in its
stores and receives compensation based on a percentage of sales
made in these departments and receives revenues from customers
for delivery of certain items and services (primarily associated
with its furniture operations). In addition, the Company
recovers a portion of its cost from the disposal of damaged or
otherwise distressed merchandise; this recovery is recorded
within other income.
Advertising
Advertising production costs are expensed the first time the
advertisement is run. Media placement costs are expensed in the
period the advertising appears. Total advertising expenses, net
of vendor allowances, included in SG&A expense for 2009,
2008 and 2007 were $129,685, $140,301 and $144,260,
respectively. Prepaid expenses and other current assets include
prepaid advertising costs of $6,241 and $7,599 at
January 30, 2010 and January 31, 2009, respectively.
Vendor
Allowances
As is standard industry practice, the Company receives
allowances from merchandise vendors as reimbursement for charges
incurred on marked-down merchandise. Vendor allowances are
credited to costs of merchandise sold, provided the allowance
is: (1) collectable, (2) for merchandise either
permanently marked down or sold, (3) not predicated on a
future purchase, (4) not predicated on a future increase in
the purchase price from the vendor, and (5) authorized by
internal management. If the aforementioned criteria are not met,
the allowances are recorded as an adjustment to the cost of
merchandise capitalized in inventory and reflected as a
reduction of costs of merchandise sold when the related
merchandise is sold.
Additionally, the Company receives allowances from vendors in
connection with cooperative advertising programs and for
reimbursement of certain payroll expenses. These amounts are
recognized by the Company as a reduction of the related
advertising or payroll costs that have been incurred and
reflected in SG&A expense. The Company reviews these
allowances received from each vendor to ensure reimbursements
are for specific, incremental and identifiable advertising or
payroll costs incurred by the Company to sell the vendor’s
products. If a vendor reimbursement
F-10
THE BON-TON
STORES, INC.
NOTES TO CONSOLIDATED FINANCIAL STATEMENTS
(In thousands except share and per share data)
exceeds the costs incurred by the Company, the excess
reimbursement is recorded as a reduction of cost purchases from
the vendor and reflected as a reduction of costs of merchandise
sold when the related merchandise is sold.
Purchase Order
Violations
The Company, consistent with industry practice, mandates that
vendor merchandise shipments conform to certain standards. These
standards are usually defined in the purchase order and include
items such as proper ticketing, security tagging, quantity,
packaging, on-time delivery, etc. Failure by vendors to conform
to these standards increases the Company’s merchandise
handling costs. Accordingly, various purchase order violation
charges are billed to vendors; these charges are reflected by
the Company as a reduction of costs of merchandise sold in the
period in which the respective violations occur. The Company
establishes reserves for purchase order violations that may
become uncollectible.
Gift and
Merchandise Cards
The Company sells gift cards to customers at its stores and
through its website, and issues merchandise cards as credit for
merchandise returned to its stores. These cards do not have
expiration dates. Revenues from these cards are recognized when
(i) the card is redeemed by the customer, or (ii) the
likelihood of the card being redeemed by the customer is remote
(card “breakage”) and it is determined that the
Company does not have a legal obligation to remit the value of
the unredeemed card to relevant jurisdictions. It is the
Company’s historical experience that the likelihood of
redemption after 60 months from issuance is remote. Should
cards become aged 60 months and the Company determines that
it is probable that it has no legal obligation to remit the
value to relevant jurisdictions, the corresponding liability
would be relieved. The Company has recognized no card breakage
in 2009, 2008 or 2007. Gift and merchandise card liabilities are
included within accrued expenses.
Self-Insurance
Liabilities
The Company is self-insured for certain losses related to
workers’ compensation and health insurance, although it
maintains stop-loss coverage with third party insurers to limit
exposure. The estimate of its self-insurance liability contains
uncertainty since the Company must use judgment to estimate the
ultimate cost that will be incurred to settle reported claims
and claims for incidents incurred but not reported as of the
balance sheet date. When estimating its self-insurance
liability, the Company considers a number of factors which
include, but are not limited to, historical claims experience,
demographic factors, severity factors and information provided
by independent third-party advisors.
Fair Value of
Financial Instruments
The carrying values of the Company’s cash and cash
equivalents, accounts payable and financial instruments reported
within prepaid expenses and other current assets and other
long-term assets approximate fair value. The Company discloses
the fair value of its long-term debt and derivative financial
instruments in Notes 9 and 10, respectively. Fair value
estimates of the Company’s long-term debt are based on
market prices or derived from discounted cash flow analyses and
fair value estimates of the Company’s derivative financial
instruments are derived from discounted cash flow analyses.
F-11
THE BON-TON
STORES, INC.
NOTES TO CONSOLIDATED FINANCIAL STATEMENTS
(In thousands except share and per share data)
Concentration
of Credit Risk
Financial instruments that potentially subject the Company to
concentrations of credit risk consist principally of cash and
cash equivalents. The Company manages the credit risk associated
with cash and cash equivalents by maintaining cash accounts and
investing with high-quality institutions. The Company maintains
cash accounts, primarily on an overnight basis, which may exceed
federally insured limits. The Company has not experienced any
losses from maintaining cash accounts in excess of such limits.
The Company believes that it is not exposed to any significant
risks related to its cash accounts.
Operating
Leases
The Company leases a majority of its retail stores under
operating leases. Many of the lease agreements contain rent
holidays, rent escalation clauses and contingent rent
provisions — or some combination of these items. The
Company recognizes rent expense on a straight-line basis over
the accounting lease term, which includes cancelable option
periods where failure to exercise such options would result in
an economic penalty. In calculating straight-line rent expense,
the Company utilizes an accounting lease term that equals or
exceeds the time period used for depreciation. Additionally, the
commencement date of the accounting lease term reflects the
earlier of the date the Company becomes legally obligated for
the rent payments or the date the Company takes possession of
the building for initial construction and setup. The excess of
rent expense over the actual cash paid is recorded as deferred
rent.
Share-Based
Compensation
The Company recognizes share-based compensation pursuant to ASC
Topic 718, Compensation — Stock Compensation
(“ASC 718”). The Company measures the cost of
grantee services received in exchange for an award of equity
instruments based on the grant date fair value of the award, and
recognizes that cost over the period that the grantee is
required to provide service in exchange for the award. For stock
option awards, the Company estimates grant date fair value using
the Black-Scholes option valuation model.
Earnings Per
Share
Effective February 1, 2009, the Company adopted certain new
provisions now codified within ASC Topic 260, Earnings Per
Share (“ASC 260”), pursuant to which unvested
share-based payment awards that contain nonforfeitable rights to
dividends or dividend equivalents, whether paid or unpaid, are
considered participating securities and are included in the
computation of earnings per share (“EPS”) according to
the two-class method if the impact is dilutive. The
Company’s unvested restricted shares and restricted stock
units are considered participating securities. However, in the
event of a net loss, participating securities are excluded from
the calculation of both basic and diluted EPS. All prior-period
EPS data presented was adjusted retrospectively to conform to
these provisions of ASC 260, which, in 2007, had the effect
of reducing the previously reported basic earnings per share
from $0.70 to $0.67 and diluted earnings per share from $0.68 to
$0.67.
F-12
THE BON-TON
STORES, INC.
NOTES TO CONSOLIDATED FINANCIAL STATEMENTS
(In thousands except share and per share data)
The following table presents a reconciliation of net (loss)
income and weighted average shares outstanding used in basic and
diluted EPS calculations for each of 2009, 2008 and 2007:
| |
|
|
|
|
|
|
|
|
|
|
|
|
|
|
|
2009
|
|
|
2008
|
|
|
2007
|
|
|
|
|
|
|
|
Basic (Loss) Earnings Per Common Share
|
|
|
|
|
|
|
|
|
|
|
|
|
|
Net (loss) income
|
|
$
|
(4,055
|
)
|
|
$
|
(169,930
|
)
|
|
$
|
11,562
|
|
|
Less: Income allocated to participating securities
|
|
|
—
|
|
|
|
—
|
|
|
|
(465
|
)
|
|
|
|
Net (loss) income available to common shareholders
|
|
$
|
(4,055
|
)
|
|
$
|
(169,930
|
)
|
|
$
|
11,097
|
|
|
|
|
Weighted average common shares outstanding
|
|
|
17,003,734
|
|
|
|
16,797,275
|
|
|
|
16,545,101
|
|
|
|
|
Basic (loss) earnings per common share
|
|
$
|
(0.24
|
)
|
|
$
|
(10.12
|
)
|
|
$
|
0.67
|
|
|
|
|
Diluted (Loss) Earnings Per Common Share
|
|
|
|
|
|
|
|
|
|
|
|
|
|
Net (loss) income
|
|
$
|
(4,055
|
)
|
|
$
|
(169,930
|
)
|
|
$
|
11,562
|
|
|
Less: Income allocated to participating securities
|
|
|
—
|
|
|
|
—
|
|
|
|
(462
|
)
|
|
|
|
Net (loss) income available to common shareholders
|
|
$
|
(4,055
|
)
|
|
$
|
(169,930
|
)
|
|
$
|
11,100
|
|
|
|
|
Average common shares outstanding
|
|
|
17,003,734
|
|
|
|
16,797,275
|
|
|
|
16,545,101
|
|
|
Common shares issuable — stock options
|
|
|
—
|
|
|
|
—
|
|
|
|
140,870
|
|
|
|
|
Weighted average common shares outstanding assuming dilution
|
|
|
17,003,734
|
|
|
|
16,797,275
|
|
|
|
16,685,971
|
|
|
|
|
Diluted (loss) earnings per common share
|
|
$
|
(0.24
|
)
|
|
$
|
(10.12
|
)
|
|
$
|
0.67
|
|
|
|
Due to the Company’s net loss position, unvested restricted
shares (participating securities) totaling 1,138,091 and 649,897
for 2009 and 2008, respectively, were excluded from the
calculation of both basic and diluted EPS.
In addition, stock option shares (non-participating securities)
totaling 1,096,390 and 1,089,536 for 2009 and 2008,
respectively, were excluded from the calculation of diluted EPS
as they would have been antidilutive. Certain of these stock
option shares were excluded solely due to the Company’s net
loss position. Had the Company reported a profit for 2009 and
2008, these shares would have had an effect of 75,971 and 2,656
dilutive shares, respectively, for purposes of calculating
diluted EPS. Stock option shares totaling 304,696 were excluded
from the computation of 2007 diluted weighted average common
shares outstanding, as their effect would have been antidilutive.
Risks and
Uncertainties
The Company is a regional department store operator offering a
broad assortment of brand-name fashion apparel and accessories
for women, men and children as well as cosmetics, home
furnishings and other goods. As of January 30, 2010, the
Company operated 278 stores in 23 states in the
Northeastern, Midwestern and upper Great Plains areas of the
United States. The diversity of
F-13
THE BON-TON
STORES, INC.
NOTES TO CONSOLIDATED FINANCIAL STATEMENTS
(In thousands except share and per share data)
the Company’s products, customers and geographic operations
reduces the risk that a severe impact will occur in the near
term as a result of changes in its customer base, competition or
markets.
In response to the current global economic conditions and the
recent decline in consumer spending, the Company has considered
the impact of such factors on its liquidity and has performed an
analysis of the key assumptions in its forecast such as sales,
gross margin and SG&A expenses; an evaluation of its
relationships with vendors and their factors, including
availability of vendor credit; and an analysis of cash
requirements, including the Company’s inventory and other
working capital requirements, capital expenditures and borrowing
availability under its credit facility. Based upon these
analyses and evaluations, the Company expects its anticipated
sources of liquidity will be sufficient to meet its obligations
without significant revisions to its planned operations through
2010.
Recently
Issued Accounting Standards
In August 2009, the FASB issued ASU
No. 2009-05,
Fair Value Measurements and Disclosures (Topic
820) — Measuring Liabilities at Fair Value
(“ASU
2009-05”),
which provides amendments to ASC Subtopic
820-10,
Fair Value Measurements and Disclosures —
Overall, for the fair value measurement of liabilities. ASU
2009-05
provides clarification on measuring liabilities at fair value
when a quoted price in an active market is not available. The
amendments are intended to reduce potential ambiguity in
financial reporting when measuring the fair value of
liabilities. The Company adopted the provisions of this update,
as required, in 2009. The adoption of ASU
2009-05 did
not have an impact on the Company’s consolidated financial
statements.
ASC Subtopic
715-20,
Compensation — Retirement Benefits —
Defined Benefit Plans
(“ASC 715-20”),
requires entities to provide enhanced disclosures about
investment allocation decisions, the major categories of plan
assets, the inputs and valuation techniques used to measure fair
value of plan assets, the effect of fair value measurements
using significant unobservable inputs on changes in plan assets
for the period and significant concentrations of risk within
plan assets. The enhanced disclosures required by
ASC 715-20
are provided in Note 8.
|
|
|
2.
|
PROPERTY,
FIXTURES AND EQUIPMENT
|
Property, fixtures and equipment and related accumulated
depreciation and amortization consisted of:
| |
|
|
|
|
|
|
|
|
|
|
|
January 30,
|
|
|
January 31,
|
|
|
|
|
2010
|
|
|
2009
|
|
|
|
|
|
|
|
Land and improvements
|
|
$
|
121,967
|
|
|
$
|
122,212
|
|
|
Buildings and leasehold improvements
|
|
|
640,888
|
|
|
|
637,959
|
|
|
Furniture and equipment
|
|
|
513,136
|
|
|
|
503,047
|
|
|
Buildings and equipment under capital leases
|
|
|
74,647
|
|
|
|
68,101
|
|
|
|
|
|
|
|
1,350,638
|
|
|
|
1,331,319
|
|
|
Less: Accumulated depreciation and amortization
|
|
|
(594,020
|
)
|
|
|
(498,556
|
)
|
|
|
|
Net property, fixtures and equipment
|
|
$
|
756,618
|
|
|
$
|
832,763
|
|
|
|
Accumulated depreciation and amortization includes $15,593 and
$11,471 at January 30, 2010 and January 31, 2009,
respectively, related to buildings and equipment under capital
leases.
F-14
THE BON-TON
STORES, INC.
NOTES TO CONSOLIDATED FINANCIAL STATEMENTS
(In thousands except share and per share data)
Amortization of buildings and equipment under capital leases is
included within depreciation and amortization expense.
Depreciation and amortization expense related to property,
fixtures and equipment of $109,233, $114,622 and $114,098 was
included in depreciation and amortization expense for 2009, 2008
and 2007, respectively.
Asset impairment charges of $5,717, $17,853 and $2,747, which
resulted in a reduction in the carrying amount of certain store
and distribution center properties, were recorded in 2009, 2008
and 2007, respectively. The expenses are included in other
impairment charges.
|
|
|
3.
|
GOODWILL AND
INTANGIBLES
|
The changes in the carrying amount of goodwill for the years
ended January 30, 2010 and January 31, 2009 are as
follows:
| |
|
|
|
|
|
|
|
|
|
|
|
January 30,
|
|
|
January 31,
|
|
|
|
|
2010
|
|
|
2009
|
|
|
|
|
|
|
|
Balance at beginning of year
|
|
|
|
|
|
|
|
|
|
Goodwill
|
|
$
|
17,767
|
|
|
$
|
17,767
|
|
|
Accumulated impairment losses
|
|
|
(17,767
|
)
|
|
|
—
|
|
|
|
|
|
|
|
—
|
|
|
|
17,767
|
|
|
|
|
Impairment loss
|
|
|
—
|
|
|
|
(17,767
|
)
|
|
|
|
Balance at end of year
|
|
|
|
|
|
|
|
|
|
Goodwill
|
|
|
17,767
|
|
|
|
17,767
|
|
|
Accumulated impairment losses
|
|
|
(17,767
|
)
|
|
|
(17,767
|
)
|
|
|
|
|
|
$
|
—
|
|
|
$
|
—
|
|
|
|
In accordance with
ASC 350-20-35,
the Company is required to review goodwill for impairment at the
reporting unit level at least annually or when events or changes
in circumstances indicate it is more likely than not that the
carrying value of goodwill exceeds its implied fair value. Based
on its reporting structure, management has determined the
Company has one reporting unit for purposes of applying
ASC 350-20-35.
The economic environment as of the second quarter of 2008
depressed stock values for many companies, including that of the
Company. This factor, coupled with the expectation that the
economic challenges would impede near-term recovery in the
retail sector, led the Company to determine that its goodwill
should be reviewed for impairment during the second quarter of
2008.
In evaluating goodwill for impairment, the estimated fair value
of the Company’s single reporting unit is compared to its
carrying amount. If the estimated fair value is less than its
carrying amount, an impairment loss is recorded to the extent
that the implied fair value of the goodwill is less than its
carrying amount. The fair value of the Company’s single
reporting unit was estimated using a combination of its common
stock trading value as of the end of the second quarter of 2008,
a discounted cash flow analysis and other generally accepted
valuation methodologies.
F-15
THE BON-TON
STORES, INC.
NOTES TO CONSOLIDATED FINANCIAL STATEMENTS
(In thousands except share and per share data)
As a result of the goodwill impairment review, the Company
determined that its goodwill was fully impaired and,
accordingly, recorded a goodwill impairment charge of $17,767
during the second quarter of 2008.
Intangible assets consist of the following:
| |
|
|
|
|
|
|
|
|
|
|
|
January 30,
|
|
|
January 31,
|
|
|
|
|
2010
|
|
|
2009
|
|
|
|
|
|
|
|
Intangible assets subject to amortization
|
|
|
|
|
|
|
|
|
|
Gross amount
|
|
|
|
|
|
|
|
|
|
Lease-related interests
|
|
$
|
100,388
|
|
|
$
|
101,720
|
|
|
Customer lists and relationships
|
|
|
22,926
|
|
|
|
22,926
|
|
|
|
|
Total gross amount
|
|
|
123,314
|
|
|
|
124,646
|
|
|
Accumulated amortization
|
|
|
|
|
|
|
|
|
|
Lease-related interests
|
|
|
(29,870
|
)
|
|
|
(24,395
|
)
|
|
Customer lists and relationships
|
|
|
(8,607
|
)
|
|
|
(6,216
|
)
|
|
|
|
Total accumulated amortization
|
|
|
(38,477
|
)
|
|
|
(30,611
|
)
|
|
|
|
Net intangible assets subject to amortization
|
|
$
|
84,837
|
|
|
$
|
94,035
|
|
|
|
|
Intangible assets not subject to amortization
|
|
|
|
|
|
|
|
|
|
Trade names
|
|
|
42,700
|
|
|
|
42,700
|
|
|
Private label brand names
|
|
|
11,257
|
|
|
|
11,423
|
|
|
Other intangibles
|
|
|
—
|
|
|
|
13
|
|
|
|
|
Total intangible assets not subject to amortization
|
|
|
53,957
|
|
|
|
54,136
|
|
|
|
|
Net intangible assets
|
|
$
|
138,794
|
|
|
$
|
148,171
|
|
|
|
Private label brand names not subject to amortization were
reduced by $166 in 2009 as a result of an impairment charge. In
2008, the Company recorded an asset impairment charge of $8,052
primarily related to the reduction in the value of trade names
not subject to amortization. Private label brand names not
subject to amortization were reduced by $1,323 in 2007 as a
result of an impairment charge. The expenses are included in
other impairment charges.
Lease-related interests reflect below-market-rate leases
purchased in store acquisitions completed in 1992 through 2006
that were adjusted to reflect fair market value. The
lease-related interests, including the unfavorable lease-related
interests included in other long-term liabilities, are being
amortized on a straight-line method and reported as
“amortization of lease-related interests” in the
consolidated statements of operations. At January 30, 2010,
these lease-related interests have weighted-average remaining
lives of 13 years for amortization purposes.
At January 30, 2010, customer lists and relationships are
being amortized on a declining-balance method over the remaining
lives of nine years. The amortization from the customer lists
and relationships is included within depreciation and
amortization expense.
F-16
THE BON-TON
STORES, INC.
NOTES TO CONSOLIDATED FINANCIAL STATEMENTS
(In thousands except share and per share data)
During 2009, 2008 and 2007, amortization of $2,402, $2,760 and
$2,957, respectively, was recorded on customer lists and
relationships and private label brand names (which were fully
amortized as of January 31, 2009). Amortization of $4,866,
$4,866 and $4,978 was recorded for favorable and unfavorable
lease-related interests during 2009, 2008 and 2007,
respectively. The Company anticipates amortization associated
with customer lists and relationships of approximately $2,216 in
2010, $2,042 in 2011, $1,890 in 2012, $1,759 in 2013 and $1,629
in 2014. The Company anticipates amortization associated with
favorable and unfavorable lease-related interests of
approximately $4,555 in 2010, $4,747 in 2011, $4,698 in 2012,
$4,553 in 2013 and $4,935 in 2014.
|
|
|
4.
|
FAIR VALUE
MEASUREMENTS
|
ASC Topic 820, Fair Value Measurements and Disclosures
(“ASC 820”) defines fair value and establishes a
framework for measuring fair value. Effective February 3,
2008, the Company adopted the provisions codified within
ASC 820 for financial assets and liabilities that are
measured at fair value on a recurring basis.
ASC 820 establishes fair value hierarchy levels that prioritize
the inputs used in valuations determining fair value.
Level 1 inputs are unadjusted quoted prices in active
markets for identical assets or liabilities. Level 2 inputs
are primarily quoted prices for similar assets or liabilities in
active markets or inputs that are observable for the asset or
liability, either directly or indirectly. Level 3 inputs
are unobservable inputs based on the Company’s own
assumptions.
As of January 30, 2010 and January 31, 2009, the
Company held two interest rate swap contracts required to be
measured at fair value on a recurring basis (see Note 10).
The fair values of these interest rate swap contracts are
derived from discounted cash flow analysis utilizing an interest
rate yield curve that is readily available to the public or can
be derived from information available in publicly quoted
markets. Therefore, the Company has categorized these interest
rate swap contracts as a Level 2 fair value measurement.
The interest rate swap liability comprises the entirety of the
Company’s financial assets and liabilities carried at fair
value and measured on a recurring basis. The carrying value of
the interest rate swap liability as of January 30, 2010 and
January 31, 2009 is as follows:
| |
|
|
|
|
|
|
|
|
|
|
|
|
|
|
|
|
|
|
|
|
|
|
|
|
|
Significant
|
|
|
|
|
|
|
|
|
|
|
Quoted Prices
|
|
|
Other
|
|
|
Significant
|
|
|
|
|
|
|
|
in Active
|
|
|
Observable
|
|
|
Unobservable
|
|
|
|
|
Total Carrying
|
|
|
Markets
|
|
|
Inputs
|
|
|
Inputs
|
|
|
|
|
Value
|
|
|
(Level 1)
|
|
|
(Level 2)
|
|
|
(Level 3)
|
|
|
|
|
|
|
|
January 30, 2010
|
|
$
|
6,319
|
|
|
$
|
—
|
|
|
$
|
6,319
|
|
|
$
|
—
|
|
|
|
|
January 31, 2009
|
|
$
|
5,708
|
|
|
$
|
—
|
|
|
$
|
5,708
|
|
|
$
|
—
|
|
|
|
F-17
THE BON-TON
STORES, INC.
NOTES TO CONSOLIDATED FINANCIAL STATEMENTS
(In thousands except share and per share data)
Effective February 1, 2009, the Company adopted the
provisions of ASC 820 for non-financial assets and
liabilities that are not required or permitted to be measured at
fair value on a recurring basis. The following table represents
the fair value measurements for assets measured at fair value on
a nonrecurring basis:
| |
|
|
|
|
|
|
|
|
|
|
|
|
|
|
|
|
|
|
|
|
|
|
|
|
|
|
|
|
|
Significant
|
|
|
|
|
|
|
|
|
|
|
|
|
|
Quoted Prices
|
|
|
Other
|
|
|
Significant
|
|
|
|
|
|
|
|
|
|
|
in Active
|
|
|
Observable
|
|
|
Unobservable
|
|
|
|
|
|
|
|
January 30,
|
|
|
Markets
|
|
|
Inputs
|
|
|
Inputs
|
|
|
Total
|
|
|
|
|
2010
|
|
|
(Level 1)
|
|
|
(Level 2)
|
|
|
(Level 3)
|
|
|
Losses
|
|
|
|
|
|
|
|
Property, fixtures and equipment
|
|
$
|
3,300
|
|
|
$
|
—
|
|
|
$
|
—
|
|
|
$
|
3,300
|
|
|
$
|
(5,717
|
)
|
|
Intangible assets
|
|
$
|
—
|
|
|
$
|
—
|
|
|
$
|
—
|
|
|
$
|
—
|
|
|
$
|
(166
|
)
|
|
|
In accordance with
ASC 360-10-35,
property, fixtures and equipment with a carrying amount of
$9,017 were written down to their fair value of $3,300 as
determined by a discounted cash flow analysis utilizing a
discount rate the Company believes is appropriate and would be
used by market participants and a market approach using data
that includes recent sales of comparable properties with similar
characteristics, resulting in an impairment charge of $5,717,
which is reflected in other impairment charges.
In accordance with
ASC 350-30-35,
intangible assets not subject to amortization with a carrying
amount of $166 were written down to their fair value of zero as
determined by a Level 3 discounted cash flow analysis
utilizing a discount rate the Company believes is appropriate
and would be used by market participants, resulting in an
impairment charge of $166, which is reflected in other
impairment charges.
|
|
|
5.
|
SUPPLEMENTAL
BALANCE SHEET INFORMATION
|
Prepaid expenses and other current assets were comprised of the
following:
| |
|
|
|
|
|
|
|
|
|
|
|
January 30,
|
|
|
January 31,
|
|
|
|
|
2010
|
|
|
2009
|
|
|
|
|
|
|
|
Income tax receivables
|
|
$
|
8,288
|
|
|
$
|
31,146
|
|
|
Other receivables
|
|
|
48,624
|
|
|
|
49,473
|
|
|
Prepaid expenses
|
|
|
30,778
|
|
|
|
32,822
|
|
|
|
|
Total
|
|
$
|
87,690
|
|
|
$
|
113,441
|
|
|
|
Accrued expenses were comprised of the following:
| |
|
|
|
|
|
|
|
|
|
|
|
January 30,
|
|
|
January 31,
|
|
|
|
|
2010
|
|
|
2009
|
|
|
|
|
|
|
|
Customer liabilities
|
|
$
|
50,203
|
|
|
$
|
50,047
|
|
|
Interest
|
|
|
23,206
|
|
|
|
22,852
|
|
|
Taxes
|
|
|
37,625
|
|
|
|
39,191
|
|
|
Other
|
|
|
49,703
|
|
|
|
66,983
|
|
|
|
|
Total
|
|
$
|
160,737
|
|
|
$
|
179,073
|
|
|
|
F-18
THE BON-TON
STORES, INC.
NOTES TO CONSOLIDATED FINANCIAL STATEMENTS
(In thousands except share and per share data)
Other long-term liabilities were comprised of the following:
| |
|
|
|
|
|
|
|
|
|
|
|
January 30,
|
|
|
January 31,
|
|
|
|
|
2010
|
|
|
2009
|
|
|
|
|
|
|
|
Deferred income
|
|
$
|
47,001
|
|
|
$
|
47,765
|
|
|
Other
|
|
|
116,452
|
|
|
|
115,807
|
|
|
|
|
Total
|
|
$
|
163,453
|
|
|
$
|
163,572
|
|
|
|
|
|
|
6.
|
SUPPLEMENTAL CASH
FLOW INFORMATION
|
The following supplemental cash flow information is provided for
the periods reported:
| |
|
|
|
|
|
|
|
|
|
|
|
|
|
|
|
2009
|
|
|
2008
|
|
|
2007
|
|
|
|
|
|
|
|
Cash paid for:
|
|
|
|
|
|
|
|
|
|
|
|
|
|
Interest, net of amounts capitalized
|
|
$
|
91,364
|
|
|
$
|
93,121
|
|
|
$
|
105,353
|
|
|
Income taxes, net of refunds received
|
|
|
(31,902
|
)
|
|
|
3,995
|
|
|
|
34,961
|
|
|
Non-cash investing activities:
|
|
|
|
|
|
|
|
|
|
|
|
|
|
Increase (decrease) in accrued property, fixtures and equipment
included in accounts payable and accrued expenses
|
|
$
|
122
|
|
|
$
|
(4,608
|
)
|
|
$
|
(2,428
|
)
|
|
Assets acquired under capital leases
|
|
|
6,546
|
|
|
|
629
|
|
|
|
—
|
|
|
|
|
7.
|
EXIT OR DISPOSAL
ACTIVITIES
|
In January 2010, the Company implemented a plan to reduce
corporate and store personnel. Charges related to involuntary
associate termination costs were $1,600 in 2009; these charges
are reflected in SG&A expense. The Company expects to pay
these costs in 2010.
In January 2009, the Company began implementing a cost savings
plan to reduce operating expenses that included reducing
corporate and store personnel by approximately 4,000 positions.
Charges related to involuntary associate termination costs were
$2,100 in 2008 and $2,976 in 2009; these charges are reflected
in SG&A expense. The Company paid $4,988 of these costs in
2009.
In 2009, the Company closed three stores. In connection with the
closing of these stores, the Company developed plans resulting
in involuntary associate termination costs and other closing
costs of $348 and $282, respectively, of which $305 was included
in SG&A expense in 2008 and $325 in 2009. The Company paid
these costs in 2009.
In 2008, the Company closed one store. Charges related to
involuntary associate termination costs and other costs
associated with the closing of this store were $20 and $33,
respectively. The Company recognized $20 of the involuntary
associate termination costs and $10 of the other closing costs
during 2007. The remaining other closings costs of $23 were
incurred during 2008. These charges are reflected in SG&A
expense.
In March 2007, the Company closed its distribution center
located in Ankeny, Iowa. Charges related to involuntary
associate termination costs and other costs associated with the
closing of this distribution center were $711 and $145,
respectively. The Company recognized $233 of the involuntary
associate termination costs during 2006. The remaining
involuntary associate termination costs and other costs of $478
and $145, respectively, were incurred during 2007. These
F-19
THE BON-TON
STORES, INC.
NOTES TO CONSOLIDATED FINANCIAL STATEMENTS
(In thousands except share and per share data)
charges are reflected in SG&A expense. The Company entered
into a sublease agreement with a third party in August 2007 and
anticipates the income from such agreement will approximate the
remaining rent obligation.
In February 2007, the Company closed its Carson Pirie Scott
store at One South State Street in Chicago, Illinois. In
connection with the closing of this store, the Company developed
plans resulting in involuntary associate termination costs and
other closing costs of $2,914 and $1,383, respectively. During
2006, the Company recognized $2,436 of the involuntary associate
termination costs and $273 of other costs. The Company recorded
the remaining involuntary associate termination costs and
closing costs of $478 and $1,110, respectively, during 2007.
These charges are reflected in SG&A expense.
In 2007, the Company closed three additional stores. In
connection with the closing of these stores, the Company
developed plans resulting in involuntary associate termination
costs and other closing costs of $223 and $230, respectively, of
which $46 was included in SG&A expense in 2006 and $407 in
2007. In addition, the Company sold an owned property in
conjunction with the closing of one of its stores and paid, in
full, the related mortgage. The Company recognized a $510 gain
on the building sale within SG&A expense and a $1,019 loss
on the mortgage payoff within interest expense, net.
Following is a reconciliation of accruals related to the
Company’s closing activities:
| |
|
|
|
|
|
|
|
|
|
|
|
|
|
|
|
2009
|
|
|
2008
|
|
|
2007
|
|
|
|
|
|
|
|
Beginning balance
|
|
$
|
2,394
|
|
|
$
|
20
|
|
|
$
|
3,384
|
|
|
Provisions:
|
|
|
|
|
|
|
|
|
|
|
|
|
|
Lease termination fee
|
|
|
—
|
|
|
|
—
|
|
|
|
(4
|
)
|
|
Contract termination
|
|
|
—
|
|
|
|
—
|
|
|
|
(11
|
)
|
|
Associate termination benefits
|
|
|
4,703
|
|
|
|
2,322
|
|
|
|
1,107
|
|
|
Other closing costs
|
|
|
198
|
|
|
|
106
|
|
|
|
1,495
|
|
|
|
|
Total
|
|
|
4,901
|
|
|
|
2,428
|
|
|
|
2,587
|
|
|
Payments:
|
|
|
|
|
|
|
|
|
|
|
|
|
|
Lease termination fee
|
|
|
—
|
|
|
|
—
|
|
|
|
(340
|
)
|
|
Contract termination
|
|
|
—
|
|
|
|
—
|
|
|
|
(21
|
)
|
|
Associate termination benefits
|
|
|
(5,337
|
)
|
|
|
(18
|
)
|
|
|
(3,864
|
)
|
|
Other closing costs
|
|
|
(270
|
)
|
|
|
(36
|
)
|
|
|
(1,726
|
)
|
|
|
|
Total
|
|
|
(5,607
|
)
|
|
|
(54
|
)
|
|
|
(5,951
|
)
|
|
|
|
Balance at year-end
|
|
$
|
1,688
|
|
|
$
|
2,394
|
|
|
$
|
20
|
|
|
|
|
|
|
8.
|
EMPLOYEE BENEFIT
PLANS
|
The Company provides eligible employees with retirement benefits
under a 401(k) salary reduction and retirement contribution plan
(the “Plan”). Employees become eligible to receive
company contributions after they reach the age of 18, complete
one year of service and have worked 1,000 hours in their
first year of service or, if not, in any calendar year
thereafter. Participants are eligible to receive a company
contribution in the Plan if they have worked 1,000 hours in
the calendar year and are employed on the last day of the Plan
year. Participants are also eligible to receive a
F-20
THE BON-TON
STORES, INC.
NOTES TO CONSOLIDATED FINANCIAL STATEMENTS
(In thousands except share and per share data)
company matching contribution if they have contributed eligible
pre-tax dollars to the Plan and are employed on the last day of
the Plan year. Under the Plan provisions, the majority of
eligible employees are permitted to contribute up to 50% of
their compensation to the Plan. Employees are permitted to begin
non-matching contributions to the Plan after three months of
service in a benefit status position. Employees are
automatically enrolled to contribute 3% of pay unless the
employee actively modifies or declines the election. Company
matching contributions, not to exceed 6% of eligible
employees’ compensation, are at the discretion of the
Company’s Board of Directors. Company matching
contributions under the Plan become fully vested for eligible
employees after three years of service in which the employee
works 1,000 hours annually. Contributions to the Plan under
the retirement contribution provisions are at the discretion of
the Company’s Board of Directors. Retirement contributions
made through 2007 become fully vested after five years of
service; retirement contributions made during 2008 and beyond
become fully vested after three years of service.
The Company’s 2009, 2008 and 2007 expense under the 401(k)
Plan was $4,050, $0 and $9,239, respectively. Pursuant to the
provisions of the Plan, the Company’s Board of Directors
determined that no retirement contribution would be made for
2009, and that no company matching contribution or retirement
contribution would be made for 2008.
The Company provides a supplementary pension plan to certain key
executives. Employees become 100% vested in the plan benefits
after achieving a specific age as defined in each
employee’s agreement. The benefits from this unfunded plan
are paid upon retirement, providing the employee is age 60.
In addition, as a result of an acquisition, the Company assumed
a liability for a supplementary pension plan. The benefits from
this unfunded plan are paid upon retirement, provided that the
participant is age 65 or older. All participants in this
plan are fully vested.
As part of an acquisition, the Company acquired a defined
benefit pension plan and unfunded supplemental pension plans. In
connection with the acquisition, all future benefit accruals in
the defined benefit plan were frozen. The defined benefit
pension plan is also closed to new participants. On
December 31, 2008, one of the unfunded supplemental pension
plans was terminated and a related curtailment gain of $218 was
recorded. A payment of $5,658 for settlement of this plan
occurred during the first quarter of 2009. No settlement gain or
loss was required to be recognized.
The Company also acquired an unfunded postretirement benefit
plan as part of an acquisition. The unfunded postretirement plan
provides medical and life insurance benefits. The medical
portion of the plan is contributory, and contains cost-sharing
features such as deductibles and co-insurance. The life
insurance benefits of this plan are noncontributory.
On January 30, 2010, the Company adopted a new accounting
standard codified within
ASC 715-20.
The new standard requires entities to provide enhanced
disclosures about investment allocation decisions, the major
categories of plan assets, the inputs and valuation techniques
used to measure fair value of plan assets, the effect of fair
value measurements using significant unobservable inputs on
changes in plan assets for the period and significant
concentrations of risk within plan assets.
F-21
THE BON-TON
STORES, INC.
NOTES TO CONSOLIDATED FINANCIAL STATEMENTS
(In thousands except share and per share data)
Benefit obligations, fair value of plan assets and funded status
of the plans are as follows:
| |
|
|
|
|
|
|
|
|
|
|
|
|
|
|
|
|
|
|
|
|
|
|
Medical and
|
|
|
|
|
|
|
|
Life Insurance
|
|
|
|
|
Pension Benefits
|
|
|
Benefits
|
|
|
|
|
2009
|
|
|
2008
|
|
|
2009
|
|
|
2008
|
|
|
|
|
|
|
|
Change in benefit obligation:
|
|
|
|
|
|
|
|
|
|
|
|
|
|
|
|
|
|
Benefit obligation at beginning of year
|
|
$
|
186,356
|
|
|
$
|
200,709
|
|
|
$
|
5,794
|
|
|
$
|
6,585
|
|
|
Service cost
|
|
|
—
|
|
|
|
154
|
|
|
|
—
|
|
|
|
—
|
|
|
Interest cost
|
|
|
11,285
|
|
|
|
11,741
|
|
|
|
350
|
|
|
|
379
|
|
|
Participant contributions
|
|
|
—
|
|
|
|
—
|
|
|
|
351
|
|
|
|
339
|
|
|
Benefits paid
|
|
|
(23,495
|
)
|
|
|
(19,731
|
)
|
|
|
(683
|
)
|
|
|
(970
|
)
|
|
Curtailment gain
|
|
|
—
|
|
|
|
(1,710
|
)
|
|
|
—
|
|
|
|
—
|
|
|
Actuarial loss (gain)
|
|
|
19,378
|
|
|
|
(4,807
|
)
|
|
|
564
|
|
|
|
(539
|
)
|
|
|
|
Benefit obligation at end of year
|
|
$
|
193,524
|
|
|
$
|
186,356
|
|
|
$
|
6,376
|
|
|
$
|
5,794
|
|
|
|
|
Change in the fair value of plan assets:
|
|
|
|
|
|
|
|
|
|
|
|
|
|
|
|
|
|
Plan assets at beginning of year
|
|
$
|
113,674
|
|
|
$
|
188,938
|
|
|
$
|
—
|
|
|
$
|
—
|
|
|
Actual return on plan assets
|
|
|
27,855
|
|
|
|
(56,355
|
)
|
|
|
—
|
|
|
|
—
|
|
|
Company contributions
|
|
|
6,465
|
|
|
|
822
|
|
|
|
332
|
|
|
|
631
|
|
|
Participant contributions
|
|
|
—
|
|
|
|
—
|
|
|
|
351
|
|
|
|
339
|
|
|
Benefits paid
|
|
|
(23,495
|
)
|
|
|
(19,731
|
)
|
|
|
(683
|
)
|
|
|
(970
|
)
|
|
|
|
Plan assets at end of year
|
|
$
|
124,499
|
|
|
$
|
113,674
|
|
|
$
|
—
|
|
|
$
|
—
|
|
|
|
|
Funded status
|
|
$
|
(69,025
|
)
|
|
$
|
(72,682
|
)
|
|
$
|
(6,376
|
)
|
|
$
|
(5,794
|
)
|
|
|
Amounts recognized in the consolidated balance sheets consist of:
| |
|
|
|
|
|
|
|
|
|
|
|
|
|
|
|
|
|
|
|
|
|
|
Medical and
|
|
|
|
|
|
|
|
Life Insurance
|
|
|
|
|
Pension Benefits
|
|
|
Benefits
|
|
|
|
|
2009
|
|
|
2008
|
|
|
2009
|
|
|
2008
|
|
|
|
|
|
|
|
Accrued expenses
|
|
$
|
(765
|
)
|
|
$
|
(6,397
|
)
|
|
$
|
(928
|
)
|
|
$
|
(829
|
)
|
|
Other long-term liabilities
|
|
|
(68,260
|
)
|
|
|
(66,285
|
)
|
|
|
(5,448
|
)
|
|
|
(4,965
|
)
|
|
|
|
Net amount recognized
|
|
$
|
(69,025
|
)
|
|
$
|
(72,682
|
)
|
|
$
|
(6,376
|
)
|
|
$
|
(5,794
|
)
|
|
|
F-22
THE BON-TON
STORES, INC.
NOTES TO CONSOLIDATED FINANCIAL STATEMENTS
(In thousands except share and per share data)
Amounts recognized in accumulated other comprehensive loss
(income) consist of:
| |
|
|
|
|
|
|
|
|
|
|
|
|
|
|
|
|
|
|
|
|
|
|
Medical and
|
|
|
|
|
|
|
|
Life Insurance
|
|
|
|
|
Pension Benefits
|
|
|
Benefits
|
|
|
|
|
2009
|
|
|
2008
|
|
|
2009
|
|
|
2008
|
|
|
|
|
|
|
|
Net actuarial loss (gain)
|
|
$
|
47,709
|
|
|
$
|
54,003
|
|
|
$
|
(503
|
)
|
|
$
|
(1,158
|
)
|
|
|
|
Gross amount recognized
|
|
|
47,709
|
|
|
|
54,003
|
|
|
|
(503
|
)
|
|
|
(1,158
|
)
|
|
Deferred tax expense
|
|
|
3,903
|
|
|
|
3,903
|
|
|
|
232
|
|
|
|
232
|
|
|
|
|
Net amount recognized
|
|
$
|
51,612
|
|
|
$
|
57,906
|
|
|
$
|
(271
|
)
|
|
$
|
(926
|
)
|
|
|
The accumulated benefit obligation for all of the defined
benefit and supplemental pension plans was $193,524 and $186,356
at January 30, 2010 and January 31, 2009,
respectively. The benefit obligation and the accumulated benefit
obligation for each of the pension benefit plans exceeded its
assets at January 30, 2010 and January 31, 2009.
Components of net periodic benefit expense (income) and other
amounts recognized in other comprehensive (income) loss before
income taxes are as follows:
| |
|
|
|
|
|
|
|
|
|
|
|
|
|
|
|
|
|
|
|
|
|
|
|
|
|
|
|
|
|
|
Medical and
|
|
|
|
|
|
|
|
Life Insurance
|
|
|
|
|
Pension Benefits
|
|
|
Benefits
|
|
|
|
|
2009
|
|
|
2008
|
|
|
2007
|
|
|
2009
|
|
|
2008
|
|
|
2007
|
|
|
|
|
|
|
|
Net periodic benefit expense (income):
|
|
|
|
|
|
|
|
|
|
|
|
|
|
|
|
|
|
|
|
|
|
|
|
|
|
Service cost
|
|
$
|
—
|
|
|
$
|
154
|
|
|
$
|
130
|
|
|
$
|
—
|
|
|
$
|
—
|
|
|
$
|
—
|
|
|
Interest cost
|
|
|
11,285
|
|
|
|
11,741
|
|
|
|
12,166
|
|
|
|
350
|
|
|
|
379
|
|
|
|
411
|
|
|
Expected return on plan assets
|
|
|
(7,059
|
)
|
|
|
(12,302
|
)
|
|
|
(14,673
|
)
|
|
|
—
|
|
|
|
—
|
|
|
|
—
|
|
|
Recognition of prior service cost
|
|
|
—
|
|
|
|
4
|
|
|
|
4
|
|
|
|
—
|
|
|
|
—
|
|
|
|
—
|
|
|
Recognition of net actuarial loss (gain)
|
|
|
4,876
|
|
|
|
505
|
|
|
|
316
|
|
|
|
(91
|
)
|
|
|
—
|
|
|
|
—
|
|
|
Curtailment gain
|
|
|
—
|
|
|
|
(218
|
)
|
|
|
—
|
|
|
|
—
|
|
|
|
—
|
|
|
|
—
|
|
|
|
|
Net periodic benefit expense (income)
|
|
$
|
9,102
|
|
|
$
|
(116
|
)
|
|
$
|
(2,057
|
)
|
|
$
|
259
|
|
|
$
|
379
|
|
|
$
|
411
|
|
|
|
|
Other changes in plan assets and benefit
|
|
|
|
|
|
|
|
|
|
|
|
|
|
|
|
|
|
|
|
|
|
|
|
|
|
obligations recognized in other
|
|
|
|
|
|
|
|
|
|
|
|
|
|
|
|
|
|
|
|
|
|
|
|
|
|
comprehensive loss (income), before taxes:
|
|
|
|
|
|
|
|
|
|
|
|
|
|
|
|
|
|
|
|
|
|
|
|
|
|
Actuarial net (gain) loss
|
|
$
|
(1,418
|
)
|
|
$
|
62,140
|
|
|
$
|
(4,054
|
)
|
|
$
|
564
|
|
|
$
|
(539
|
)
|
|
$
|
(856
|
)
|
|
Recognition of prior service cost
|
|
|
—
|
|
|
|
(14
|
)
|
|
|
(4
|
)
|
|
|
—
|
|
|
|
—
|
|
|
|
—
|
|
|
Recognition of net actuarial (loss) gain
|
|
|
(4,876
|
)
|
|
|
(277
|
)
|
|
|
(316
|
)
|
|
|
91
|
|
|
|
—
|
|
|
|
—
|
|
|
|
|
Total recognized in other comprehensive (income) loss, before
taxes
|
|
$
|
(6,294
|
)
|
|
$
|
61,849
|
|
|
$
|
(4,374
|
)
|
|
$
|
655
|
|
|
$
|
(539
|
)
|
|
$
|
(856
|
)
|
|
|
|
Total recognized in net periodic cost and other comprehensive
loss (income), before taxes
|
|
$
|
2,808
|
|
|
$
|
61,733
|
|
|
$
|
(6,431
|
)
|
|
$
|
914
|
|
|
$
|
(160
|
)
|
|
$
|
(445
|
)
|
|
|
F-23
THE BON-TON
STORES, INC.
NOTES TO CONSOLIDATED FINANCIAL STATEMENTS
(In thousands except share and per share data)
The Company estimates the following amounts will be amortized
from accumulated other comprehensive (income) loss to net
periodic cost during 2010:
| |
|
|
|
|
|
|
|
|
|
|
|
|
|
|
Medical and
|
|
|
|
|
Pension
|
|
|
Life Insurance
|
|
|
|
|
Benefits
|
|
|
Benefits
|
|
|
|
|
|
|
|
Net actuarial loss
|
|
$
|
3,880
|
|
|
$
|
—
|
|
Weighted average assumptions used to determine benefit
obligations are as follows:
| |
|
|
|
|
|
|
|
|
|
|
|
|
|
|
|
|
|
|
|
|
|
|
Medical and
|
|
|
|
|
|
|
|
Life Insurance
|
|
|
|
|
Pension Benefits
|
|
|
Benefits
|
|
|
|
|
2009
|
|
|
2008
|
|
|
2009
|
|
|
2008
|
|
|
|
|
|
|
|
Discount rate
|
|
|
5.50
|
%
|
|
|
6.50
|
%
|
|
|
5.50
|
%
|
|
|
6.50
|
%
|
|
Rate of compensation increase
|
|
|
N/A
|
|
|
|
N/A
|
|
|
|
N/A
|
|
|
|
N/A
|
|
For measurement of the medical and life insurance benefits plan,
the Company assumed a 9% annual rate of increase in the per
capita cost of covered health care benefits for 2010, grading
down to 5% by 2018.
Weighted average assumptions used to determine net periodic
benefit expense (income) are as follows:
| |
|
|
|
|
|
|
|
|
|
|
|
|
|
|
|
|
|
|
|
|
|
|
|
|
|
|
|
|
|
|
Medical and
|
|
|
|
|
|
|
|
Life Insurance
|
|
|
|
|
Pension Benefits
|
|
|
Benefits
|
|
|
|
|
2009
|
|
|
2008
|
|
|
2007
|
|
|
2009
|
|
|
2008
|
|
|
2007
|
|
|
|
|
|
|
|
Discount rate
|
|
|
6.50
|
%
|
|
|
6.20
|
%
|
|
|
5.75
|
%
|
|
|
6.50
|
%
|
|
|
6.20
|
%
|
|
|
5.75
|
%
|
|
Expected long-term return on plan assets
|
|
|
6.60
|
%
|
|
|
6.90
|
%
|
|
|
7.60
|
%
|
|
|
N/A
|
|
|
|
N/A
|
|
|
|
N/A
|
|
|
Rate of compensation increase
|
|
|
N/A
|
|
|
|
3.00
|
%
|
|
|
3.00
|
%
|
|
|
N/A
|
|
|
|
N/A
|
|
|
|
N/A
|
|
The Company’s discount rate assumption is evaluated
annually. The Company utilizes the Citibank Pension Discount
Curve (“CPDC”) to develop its discount rate
assumption. The CPDC is developed from a U.S. Treasury par
curve that reflects the Treasury Coupon and Strips market.
Option-adjusted spreads drawn from the double-A corporate bond
sector are layered in to develop a double-A corporate par curve,
from which the CPDC spot rates are developed. The CPDC spot
rates are applied to expected benefit payments, from which a
single constant discount rate can then be developed based on the
expected timing of these benefit payments.
The Company bases its asset return assumption on current and
expected allocations of assets, as well as a long-term view of
expected returns on the plan asset categories. The Company
assesses the appropriateness of the expected rate of return on
an annual basis and, when necessary, revises the assumption.
In 2003, the Medicare Prescription Drug, Improvement and
Modernization Act of 2003 (the “Act”) became law.
Among other things, the Act introduced a federal subsidy to
sponsors of retiree health care benefit plans that provide a
benefit that is at least actuarially equivalent to Medicare
Part D. The Company has not evaluated whether the
postretirement benefit plan drug benefit is at least actuarially
equivalent to Medicare Part D. Consequently, the
postretirement benefit obligation and net periodic
postretirement benefit expense do not reflect any amount
associated with the subsidy.
F-24
THE BON-TON
STORES, INC.
NOTES TO CONSOLIDATED FINANCIAL STATEMENTS
(In thousands except share and per share data)
Assumed health care cost trend rate can have a significant
effect on the amounts reported for the postretirement health
care plan. A one-percentage point change in assumed health care
costs would have the following effects:
| |
|
|
|
|
|
|
|
|
|
|
|
One-
|
|
One-
|
|
|
|
Percentage
|
|
Percentage
|
|
|
|
Point
|
|
Point
|
|
|
|
Increase
|
|
Decrease
|
|
|
|
|
|
Effect on total service and interest cost components
|
|
$
|
16
|
|
|
$
|
(15
|
)
|
|
Effect on postretirement benefit obligation
|
|
|
297
|
|
|
|
(274
|
)
|
The weighted average pension plan asset allocation is as follows:
| |
|
|
|
|
|
|
|
|
|
|
|
2009
|
|
2008
|
|
|
|
|
|
Equity securities
|
|
|
65
|
%
|
|
|
61
|
%
|
|
Fixed income
|
|
|
31
|
%
|
|
|
31
|
%
|
|
Real estate
|
|
|
4
|
%
|
|
|
8
|
%
|
The Company’s target pension plan asset allocation of
equity securities, fixed income and real estate at
January 30, 2010 and January 31, 2009 was 65%, 30% and
5%, respectively. Investment objectives for the pension plan
assets include:
|
|
|
| |
•
|
Providing a long-term return on plan assets that provides
sufficient assets to fund pension plan liabilities at an
acceptable level of risk.
|
| |
| |
•
|
Maximizing the long-term return on plan assets by investing
primarily in equity securities. The inclusion of additional
asset classes with differing rates of return, volatility and
correlation are utilized to reduce risk by providing
diversification relative to equity securities.
|
| |
| |
•
|
Diversifying investments within asset classes to reduce the
impact of losses in a single investment.
|
The fair value of the major categories of the pension plan
assets as of January 30, 2010 is as follows:
| |
|
|
|
|
|
|
|
|
|
|
|
|
|
|
|
|
|
|
|
|
|
|
Significant
|
|
|
|
|
|
|
|
|
|
|
Quoted Prices
|
|
|
Other
|
|
|
Significant
|
|
|
|
|
|
|
|
in Active
|
|
|
Observable
|
|
|
Unobservable
|
|
|
|
|
|
|
|
Markets
|
|
|
Inputs
|
|
|
Inputs
|
|
|
|
|
|
|
|
(Level 1)
|
|
|
(Level 2)
|
|
|
(Level 3)
|
|
|
Total
|
|
|
|
|
|
|
|
Equity securities common/collective trust funds:
|
|
|
|
|
|
|
|
|
|
|
|
|
|
|
|
|
|
U.S. large-cap
|
|
$
|
—
|
|
|
$
|
49,793
|
|
|
$
|
—
|
|
|
$
|
49,793
|
|
|
U.S. small/mid-cap
|
|
|
|
|
|
|
6,302
|
|
|
|
|
|
|
|
6,302
|
|
|
International developed economies
|
|
|
|
|
|
|
21,891
|
|
|
|
|
|
|
|
21,891
|
|
|
International emerging market economies
|
|
|
|
|
|
|
2,466
|
|
|
|
|
|
|
|
2,466
|
|
|
Fixed income common/collective trust fund
|
|
|
|
|
|
|
37,756
|
|
|
|
|
|
|
|
37,756
|
|
|
Real estate common/collective trust fund
|
|
|
|
|
|
|
|
|
|
|
5,441
|
|
|
|
5,441
|
|
|
Receivable for investments sold
|
|
|
850
|
|
|
|
|
|
|
|
|
|
|
|
850
|
|
|
|
|
Total
|
|
$
|
850
|
|
|
$
|
118,208
|
|
|
$
|
5,441
|
|
|
$
|
124,499
|
|
|
|
F-25
THE BON-TON
STORES, INC.
NOTES TO CONSOLIDATED FINANCIAL STATEMENTS
(In thousands except share and per share data)
Changes in the Level 3 real estate common/collective trust
fund are as follows:
| |
|
|
|
|
|
|
|
2009
|
|
|
|
|
|
|
|
Fair value at beginning of year
|
|
$
|
9,439
|
|
|
Realized gain
|
|
|
216
|
|
|
Unrealized loss
|
|
|
(3,351
|
)
|
|
Purchases, sales, settlements, net
|
|
|
(863
|
)
|
|
|
|
Fair value at end of year
|
|
$
|
5,441
|
|
|
|
The common/collective trust funds are valued using the net asset
value (“NAV”) provided by the administrator of the
funds. The NAV is a quoted transactional price for participants
in the fund, based on the underlying investments of the fund.
The carrying value of the receivable for investments sold
approximates fair value. The pension plan assets are invested in
compliance with the Employee Retirement Income Security Act, as
amended, and any subsequent regulations and laws. The Company
does not permit direct purchases of its securities by the Plan.
Information about the expected cash flows related to the pension
and other postretirement benefit plans is as follows:
| |
|
|
|
|
|
|
|
|
|
|
|
|
|
Medical and
|
|
|
|
Pension
|
|
Life Insurance
|
|
|
|
Benefits
|
|
Benefits
|
|
|
|
|
|
Expected Company contributions in 2010
|
|
$
|
765
|
|
|
$
|
928
|
|
|
Expected plan benefit payments (net of expected participant
contributions) for year:
|
|
|
|
|
|
|
|
|
|
2010
|
|
$
|
17,175
|
|
|
$
|
928
|
|
|
2011
|
|
|
16,417
|
|
|
|
882
|
|
|
2012
|
|
|
15,950
|
|
|
|
832
|
|
|
2013
|
|
|
15,525
|
|
|
|
777
|
|
|
2014
|
|
|
14,921
|
|
|
|
718
|
|
|
2015-2019
|
|
|
66,594
|
|
|
|
2,622
|
|
F-26
THE BON-TON
STORES, INC.
NOTES TO CONSOLIDATED FINANCIAL STATEMENTS
(In thousands except share and per share data)
Long-term debt consisted of the following:
| |
|
|
|
|
|
|
|
|
|
|
|
January 30,
|
|
|
January 31,
|
|
|
|
|
2010
|
|
|
2009
|
|
|
|
|
|
|
|
Senior secured credit facility — expires June 4,
2013; interest payable periodically at varying rates (2.67%
weighted average for 2009)
|
|
$
|
120,434
|
|
|
$
|
320,059
|
|
|
Term loan — expires November 18, 2013; interest
payable periodically at varying rates (15.75% weighted average
for 2009)
|
|
|
75,000
|
|
|
|
—
|
|
|
Senior notes — mature on March 15, 2014; interest
payable each March 15 and September 15 at 10.25%
|
|
|
510,000
|
|
|
|
510,000
|
|
|
Mortgage loan facility — principal payable in varying
monthly installments, with balance due March 6, 2016;
interest payable monthly at 6.21%; secured by land and buildings
|
|
|
242,690
|
|
|
|
247,743
|
|
|
Mortgage notes payable — principal payable in varying
monthly installments through June 2016; interest payable monthly
at 9.62%; secured by land and buildings
|
|
|
9,700
|
|
|
|
10,719
|
|
|
Mortgage note payable — principal payable
January 1, 2011; interest payable monthly at 5.00%; secured
by a building and fixtures
|
|
|
1,000
|
|
|
|
1,000
|
|
|
|
|
Total debt
|
|
$
|
958,824
|
|
|
$
|
1,089,521
|
|
|
Less: current maturities
|
|
|
(7,509
|
)
|
|
|
(6,072
|
)
|
|
|
|
Long-term debt
|
|
$
|
951,315
|
|
|
$
|
1,083,449
|
|
|
|
On December 4, 2009, The Bon-Ton Department Stores, Inc.
and The Elder-Beerman Stores Corp. as borrowers (the
“Borrowers”), and the Company and certain other
subsidiaries as obligors (together with the Borrowers and the
Company, the “Obligors”) entered into an Amended and
Restated Loan and Security Agreement with Bank of America, N.A.,
as Agent, and certain financial institutions as lenders that
amends and restates the Loan and Security Agreement entered into
on March 6, 2006 (as amended prior to December 4,
2009, the “2006 Revolving Credit Facility”), and
provides for a revolving credit facility of $675,000 expiring
June 4, 2013 (the “Amended Revolving Credit
Facility”). All borrowings under the Amended Revolving
Credit Facility are limited by amounts available pursuant to a
borrowing base calculation, which is based on percentages of
eligible inventory, real estate and credit card receivables, in
each case subject to reductions for applicable reserves. The
terms of the Amended Revolving Credit Facility are substantially
based on the terms of the 2006 Revolving Credit Facility. The
Borrowers are jointly and severally liable for all of the
obligations incurred under the Amended Revolving Credit Facility
and the other loan documents, which obligations are guaranteed
on a joint and several basis by the Company, the other Obligors
and all future domestic subsidiaries of the Obligors (subject to
certain exceptions). The proceeds of the Amended Revolving
Credit Facility were used to pay the outstanding balance under
the 2006 Revolving Credit Facility and will be used for other
general corporate purposes. Commitments for loans under the
Amended Revolving Credit Facility are in two tranches:
Tranche A revolving commitments of $625,000 (which includes
a $150,000 subline for letters of credit and $75,000 for swing
line loans) and
Tranche A-1
revolving commitments of $50,000. The Amended Revolving Credit
Facility provides that the Borrowers may make requests to
increase the Tranche A revolving
F-27
THE BON-TON
STORES, INC.
NOTES TO CONSOLIDATED FINANCIAL STATEMENTS
(In thousands except share and per share data)
commitments up to $800,000 in the aggregate upon the
satisfaction of certain conditions, provided that the lenders
are under no obligation to provide any such increases. On
December 31, 2010, the
Tranche A-1
revolving commitments will be reduced by $20,000 and such amount
will be reallocated to the Tranche A revolving commitments.
Borrowings under the Amended Revolving Credit Facility will be
at either (A) Adjusted LIBOR (based on the highest of
(i) the British Bankers Association LIBOR Rate based on an
interest period selected by the Borrowers, (ii) the British
Bankers Association LIBOR Rate based on an interest period of
three months and (iii) 1.25%) plus the applicable margin or
(B) a base rate (based on the highest of (i) the
Federal Funds Rate plus 0.5%, (ii) the Bank of America
prime rate, and (iii) Adjusted LIBOR based on an interest
period of one month plus 1.0%) plus the applicable margin. The
applicable margin is based upon the excess availability under
the Amended Revolving Credit Facility. The Borrowers are
required to pay a commitment fee to the lenders for unused
commitments at a rate of 0.5% to 1.0% per annum, based upon the
unused portion of the total commitment under the Amended
Revolving Credit Facility. The Amended Revolving Credit Facility
is secured by a first priority security position on
substantially all of the current and future assets of the
Borrowers and the other Obligors, including, but not limited to,
inventory, general intangibles, trademarks, equipment, certain
real estate and proceeds from any of the foregoing, subject to
certain exceptions and liens. The financial covenant contained
in the Amended Revolving Credit Facility requires that the
minimum excess availability be at least $75,000 at all times.
Other covenants continue the requirements of the 2006 Revolving
Credit Facility (with the exception that the limitation on
capital expenditures no longer applies) and require that the
Obligors provide the lenders with certain financial statements,
forecasts and other reports and borrowing base certificates. In
addition, there are certain limitations, including limitations
on any debt the Obligors may have in addition to the existing
debt, and the terms of that debt; acquisitions, joint ventures
and investments; mergers and consolidations; dispositions of
property; dividends by the Obligors or their subsidiaries
(dividends paid may not exceed $5,000 in any year or $20,000
during the term of the agreement; however, additional dividends
may be paid subject to meeting other requirements); transactions
with affiliates; changes in the business or corporate structure
of the Obligors or their subsidiaries; prepaying, redeeming or
repurchasing certain debt; changes in accounting policies or
reporting practices; and speculative transactions. The Amended
Revolving Credit Facility also provides that it is a condition
precedent to borrowing that no event has occurred that could
reasonably be expected to have a material adverse effect, as
defined in the agreement, on the Company. If the Company fails
to comply with the financial covenant or the other restrictions
contained in its Amended Revolving Credit Facility, term loan
facility, mortgage loan facility or the indenture that governs
its senior unsecured notes, an event of default would occur. An
event of default could result in the acceleration of the
Company’s debt due to the cross-default provisions within
the debt agreements. As of January 30, 2010, the Company
had borrowings of $120,434, with $358,177 of borrowing
availability (before taking into account the minimum borrowing
availability covenant of $75,000) and
letter-of-credit
commitments of $18,068. The borrowing base calculation under the
Amended Revolving Credit Facility contains an inventory advance
rate subject to periodic review at the lender’s discretion.
On November 18, 2009, The Bon-Ton Department Stores, Inc.
and The Elder-Beerman Stores Corp. as Borrowers, and the Company
and certain other subsidiaries as Obligors entered into a Second
Lien Loan and Security Agreement with Sankaty Advisors, LLC; GB
Merchant Partners, LLC and GA Capital, LLC as Agents that
provides for $75,000 of term loans expiring November 18,
2013 (the “Term Loan Facility”). The terms of the Term
Loan Facility are primarily based on the terms of the
Company’s Amended Revolving Credit Facility. The Borrowers
and other Obligors under the Term Loan Facility will be jointly
and severally liable for all of the obligations incurred under
the Term Loan Facility. The proceeds of the Term Loan Facility
were used to pay part of the outstanding balance
F-28
THE BON-TON
STORES, INC.
NOTES TO CONSOLIDATED FINANCIAL STATEMENTS
(In thousands except share and per share data)
under the 2006 Revolving Credit Facility and will be used for
other general corporate purposes. Borrowings under the Term Loan
Facility will be at either (A) Adjusted LIBOR (based on the
highest of (i) the British Bankers Association LIBOR Rate
for the two business days prior to the borrowing, (ii) the
British Bankers Association LIBOR Rate based on an interest
period of three months and (iii) 3.00%) plus the applicable
margin or (B) a base rate (based on the highest of
(i) the Federal Funds Rate plus 0.5%, (ii) the Bank of
America prime rate, (iii) Adjusted LIBOR based on an
interest period of one month and (iv) 3.0%) plus the
applicable margin. The applicable margin is 12.75%. The Term
Loan Facility is secured by a second priority security position
on substantially all of the current and future assets of the
Borrowers and the other Obligors, including, but not limited to,
inventory, general intangibles, trademarks, equipment, certain
real estate and proceeds from any of the foregoing, subject to
certain exceptions and liens. The financial covenant contained
in the Term Loan Facility requires that the minimum excess
availability under the Amended Revolving Credit Facility be at
least $75,000 at all times. Other covenants substantially mirror
the requirements of the Amended Revolving Credit Facility.
Dividends paid may not exceed $5,750 in any year or $23,000
during the term of the agreement; however, additional dividends
may be paid subject to meeting other requirements.
On March 6, 2006, The Bon-Ton Department Stores, Inc.
entered into an indenture (the “Indenture”) with The
Bank of New York, as trustee, under which The Bon-Ton Department
Stores, Inc. issued $510,000 aggregate principal amount of its
101/4% Senior
Notes due 2014 (the “Notes”). The Notes are guaranteed
on a senior unsecured basis by The Bon-Ton Stores, Inc. and by
each of its subsidiaries that is an obligor under the Amended
Revolving Credit Facility. The Notes mature on March 15,
2014. The Notes may not be redeemed prior to March 15,
2010. The interest rate of the Notes is fixed at
101/4%
per year. Interest on the Notes is payable on March 15 and
September 15 of each year, beginning on September 15, 2006.
The Indenture includes covenants that limit the ability of the
Company and its restricted subsidiaries to, among other things,
incur additional debt, pay dividends (not to exceed $0.24 per
share in any year) and make distributions, make certain
investments, enter into certain types of transactions with
affiliates, use assets as security in other transactions, and
sell certain assets or merge with or into other companies.
On March 6, 2006, certain bankruptcy remote special purpose
entities (each an “SPE” and, collectively, the
“SPEs”) that are indirect wholly owned subsidiaries of
The Bon-Ton Stores, Inc. entered into loan agreements with Bank
of America, pursuant to which Bank of America provided a
mortgage loan facility in the aggregate principal amount of
$260,000 (the “Mortgage Loan Facility”). The Mortgage
Loan Facility has a term of ten years and is secured by
mortgages on twenty-three retail stores and one distribution
center owned by the SPEs. Each SPE entered into a lease with
each of The Bon-Ton Stores, Inc. subsidiaries operating on such
SPE’s properties. A portion of the rental income received
under these leases will be used to pay the debt service under
the Mortgage Loan Facility. The Mortgage Loan Facility requires
level monthly payments of principal and interest based on an
amortization period of twenty-five years and the balance
outstanding at the end of ten years will then become due and
payable. The interest rate for the Mortgage Loan Facility is a
fixed rate of 6.2125%. Financial covenants contained in the
Mortgage Loan Facility require that the SPEs maintain certain
financial thresholds, as defined in the agreements. In addition,
the SPEs are required to establish lease shortfall reserve
accounts pursuant to the terms of the Mortgage Loan Facility. If
the SPEs’ EBITDA (earnings before interest, taxes,
depreciation and amortization) falls below prescribed levels,
excess cash, as defined in the agreement, shall be deposited in
the lease shortfall reserve account and access to these funds is
restricted.
On May 17, 1996, the Company entered into twenty-year
mortgage agreements for its four stores located in Rochester,
New York, totaling $23,400. The Company’s Irondequoit
property was
F-29
THE BON-TON
STORES, INC.
NOTES TO CONSOLIDATED FINANCIAL STATEMENTS
(In thousands except share and per share data)
sold on April 2, 2007 and the principal balance on the
related mortgage of $3,509 was paid in full. The Company
recognized a $510 gain on the building sale within SG&A
expense and a $1,019 loss on the mortgage payoff within interest
expense, net.
The Company entered into a loan agreement with the City of
Scranton, Pennsylvania on July 5, 2000; the loan is secured
by the Company’s store located in Scranton. The loan
provided $1,000 to be used for certain store renovations. The
loan agreement provides for interest payments, which began
February 1, 2006 at a rate of 5.0% per annum. The principal
balance is to be paid in full by January 1, 2011.
The Company was in compliance with all loan agreement
restrictions and covenants during 2009.
The fair value of the Company’s debt, excluding interest
rate swaps, was estimated at $888,647 and $605,813 at
January 30, 2010 and January 31, 2009, respectively,
and is based on quoted market rates available to the Company or
discounted cash flow analysis as appropriate.
Debt maturities by year at January 30, 2010 are as follows:
| |
|
|
|
|
|
2010
|
|
$
|
7,509
|
|
|
2011
|
|
|
6,978
|
|
|
2012
|
|
|
7,441
|
|
|
2013
|
|
|
203,458
|
|
|
2014
|
|
|
518,609
|
|
|
2015 and thereafter
|
|
|
214,829
|
|
|
|
|
|
|
$
|
958,824
|
|
|
|
|
|
|
10.
|
INTEREST RATE
DERIVATIVES
|
As of February 1, 2009, the Company adopted certain
provisions codified within ASC Topic 815, Derivatives
and Hedging (“ASC 815”), which enhance disclosures
for derivative instruments and hedging activities, including:
(1) how and why a company uses derivative instruments;
(2) the manner in which derivative instruments and related
hedged items are accounted for; and (3) the effect of
derivative instruments and related hedged items on a
company’s financial position, financial performance and
cash flows. The adoption of the enhanced disclosures required by
ASC 815 had no impact on the Company’s financial
condition, results of operations or cash flows.
The Company enters into interest rate swap agreements to manage
the fixed/variable interest rate mix of its debt portfolio.
These derivatives are accounted for in accordance with
ASC 815.
It is the policy of the Company to identify on a continuing
basis the need for debt capital and evaluate financial risks
inherent in funding the Company with debt capital. In
conjunction with this ongoing review, the debt portfolio and
hedging program of the Company is managed to: (1) reduce
funding risk with respect to borrowings made or to be made by
the Company to preserve the Company’s access to debt
capital and provide debt capital as required for funding and
liquidity purposes, and (2) control the aggregate interest
rate risk of the debt portfolio. The Company enters into
interest rate swap agreements to change the fixed/variable
interest rate mix of the debt portfolio in order to maintain an
appropriate balance of fixed-rate and variable-rate debt.
On the date the derivative instrument is entered into, the
Company designates the derivative as a hedge of the variability
of cash flows to be received or paid related to a recognized
asset or liability (“cash flow hedge”). Changes in the
fair value of a derivative that is designated as, and meets
F-30
THE BON-TON
STORES, INC.
NOTES TO CONSOLIDATED FINANCIAL STATEMENTS
(In thousands except share and per share data)
all required criteria for, a cash flow hedge are recorded in
other comprehensive income or loss (“OCI”) and
reclassified into the statement of operations as the underlying
hedged item affects earnings, such as when quarterly settlements
are made on the hedged forecasted transaction. The portion of
the change in fair value of a derivative associated with hedge
ineffectiveness or the component of a derivative instrument
excluded from the assessment of hedge effectiveness, if any, is
recorded in the current statement of operations. Also, changes
in the fair value of a derivative that is not designated as a
hedge, if any, are entirely recorded in the statement of
operations. The Company formally documents all relationships
between hedging instruments and hedged items, as well as its
risk-management objective and strategy for undertaking various
hedge transactions; this process includes relating all
derivatives that are designated as cash flow hedges to specific
balance sheet assets or liabilities. The Company also formally
assesses, both at the inception of the hedge and on an ongoing
basis, whether each derivative is highly effective in offsetting
changes in cash flows of the hedged item. If it is determined
that a derivative is not highly effective as a hedge, or if a
derivative ceases to be a highly effective hedge, the Company
will discontinue hedge accounting prospectively for the
respective derivative. In addition, if the forecasted
transaction is no longer likely to occur, any amounts in
accumulated other comprehensive income or loss
(“AOCI”) related to the derivative are recorded in the
statement of operations for the current period.
At January 30, 2010, the Company had two interest rate swap
contracts to effectively convert a portion of its variable-rate
debt to fixed-rate debt, both of which were entered into on
July 14, 2006 and expire on July 14, 2011. These
contracts entail the exchange of fixed-rate and floating-rate
interest payments periodically over the life of the agreement.
The floating-rate interest payments are based on three-month
LIBOR rates. The following indicates the notional amounts of
these interest rate swap contracts and the range of fixed-rates
associated with these contracts:
| |
|
|
|
|
|
|
|
|
|
|
|
January 30,
|
|
|
January 31,
|
|
|
|
|
2010
|
|
|
2009
|
|
|
|
|
|
|
|
Fixed swaps (notional amount)
|
|
$
|
100,000
|
|
|
$
|
100,000
|
|
|
Range of receive rate
|
|
|
0.25%-1.16%
|
|
|
|
1.16%-4.82%
|
|
|
Range of pay rate
|
|
|
5.48%-5.49%
|
|
|
|
5.48%-5.49%
|
|
On December 4, 2009, the Company amended and restated its
senior secured credit facility (see Note 9), at which time
the Company de-designated and re-measured its two interest rate
swaps and discontinued hedge accounting prospectively in
accordance with ASC 815. Specifically, ASC 815
requires the immediate recognition of the expected cumulative
ineffectiveness, with the remaining amount to remain in AOCI and
be reclassified into the statement of operations as the
originally hedged forecasted transactions affect the statement
of operations. As of December 4, 2009, the re-measured
value of these swaps within AOCI was $6,688, of which $1,437 in
expected cumulative ineffectiveness was immediately recognized
in interest expense. Of the $5,251 remaining in AOCI as of
December 4, 2009, $456 was reclassified to interest expense
in 2009. The Company has not re-designated the two interest rate
swaps to a new hedging relationship. Accordingly, the change in
fair value after December 4, 2009 was recognized in
interest expense.
The following table summarizes the fair value (see
Note 4) and presentation in the consolidated balance
sheet of the de-designated interest rate swaps as of
January 30, 2010:
| |
|
|
|
|
|
|
|
|
|
Balance Sheet Location
|
|
Derivative Assets
|
|
|
Derivative Liabilities
|
|
|
|
|
|
|
|
Other Long-Term Liabilities
|
|
$
|
—
|
|
|
$
|
6,319
|
|
F-31
THE BON-TON
STORES, INC.
NOTES TO CONSOLIDATED FINANCIAL STATEMENTS
(In thousands except share and per share data)
The following table summarizes the effect of the interest rate
swaps on the 2009 consolidated statement of operations and OCI
or AOCI prior to being de-designated on December 4, 2009:
| |
|
|
|
|
|
|
|
|
|
|
|
|
|
|
|
|
|
|
|
|
|
|
|
|
Amount of
|
|
|
Location of
|
|
Amount of
|
|
|
|
|
|
|
|
|
|
Loss
|
|
|
Loss
|
|
Loss
|
|
|
|
|
Amount of
|
|
|
Location of Loss
|
|
Reclassified
|
|
|
Recognized
|
|
Recognized
|
|
|
|
|
Loss
|
|
|
Reclassified from
|
|
from AOCI to
|
|
|
in the
|
|
in the
|
|
|
|
|
Recognized
|
|
|
AOCI to the
|
|
the Statement
|
|
|
Statement of
|
|
Statement of
|
|
|
|
|
in OCI
|
|
|
Statement of
|
|
of Operations
|
|
|
Operations
|
|
Operations
|
|
|
|
|
(effective
|
|
|
Operations
|
|
(effective
|
|
|
(ineffective
|
|
(ineffective
|
|
|
|
|
portion)
|
|
|
(effective portion)
|
|
portion)
|
|
|
portion)
|
|
portion)
|
|
|
|
|
|
|
|
2009
|
|
$
|
4,953
|
|
|
Interest
Expense, Net
|
|
$
|
3,973
|
|
|
Interest
Expense, Net
|
|
$
|
—
|
|
|
|
The following table summarizes the effect of the interest rate
swaps on the 2009 consolidated statement of operations and AOCI
after being de-designated on December 4, 2009:
| |
|
|
|
|
|
|
|
|
|
|
|
|
|
|
|
Loss
|
|
|
|
|
|
|
|
Location of
|
|
|
|
Reclassified
|
|
|
Location of Loss
|
|
|
|
|
Loss
|
|
|
|
from AOCI
|
|
|
Reclassified from
|
|
Loss
|
|
|
Recognized
|
|
|
|
to the
|
|
|
AOCI to the
|
|
Recognized in
|
|
|
in the
|
|
|
|
Statement of
|
|
|
Statement of
|
|
the Statement
|
|
|
Statement of
|
|
|
|
Operations
|
|
|
Operations
|
|
of Operations
|
|
|
Operations
|
|
|
|
|
|
2009
|
|
$
|
1,893
|
|
|
Interest
Expense, Net
|
|
$
|
470
|
|
|
Interest
Expense, Net
|
|
|
At January 30, 2010, it is expected that approximately
$3,590 of losses in AOCI related to interest rate swaps will be
reclassified into the statement of operations within the next
12 months.
Interest costs for the Company are as follows:
| |
|
|
|
|
|
|
|
|
|
|
|
|
|
|
|
2009
|
|
|
2008
|
|
|
2007
|
|
|
|
|
|
|
|
Interest costs incurred
|
|
$
|
99,468
|
|
|
$
|
98,813
|
|
|
$
|
109,028
|
|
|
Interest income
|
|
|
(464
|
)
|
|
|
(556
|
)
|
|
|
(606
|
)
|
|
Capitalized interest, net
|
|
|
(196
|
)
|
|
|
(410
|
)
|
|
|
(257
|
)
|
|
|
|
Interest expense, net
|
|
$
|
98,808
|
|
|
$
|
97,847
|
|
|
$
|
108,165
|
|
|
|
|
|
|
12.
|
COMMITMENTS AND
CONTINGENCIES
|
Leases
The Company is obligated under operating leases for a
significant portion of its store properties. Certain leases
provide for additional rental payments based on a percentage of
sales in excess of a specified base (contingent rentals) and for
payment by the Company of operating costs (taxes, maintenance
and insurance), both of which vary by lease.
F-32
THE BON-TON
STORES, INC.
NOTES TO CONSOLIDATED FINANCIAL STATEMENTS
(In thousands except share and per share data)
At January 30, 2010, future minimum lease payments for the
fixed, noncancelable terms of operating leases and the present
value of net minimum lease payments under capital leases are as
follows:
| |
|
|
|
|
|
|
|
|
|
Year
|
|
Capital Leases
|
|
|
Operating Leases
|
|
|
|
|
|
|
|
2010
|
|
$
|
10,169
|
|
|
$
|
95,303
|
|
|
2011
|
|
|
10,151
|
|
|
|
86,966
|
|
|
2012
|
|
|
8,271
|
|
|
|
75,425
|
|
|
2013
|
|
|
7,500
|
|
|
|
66,642
|
|
|
2014
|
|
|
7,500
|
|
|
|
51,193
|
|
|
2015 and thereafter
|
|
|
67,500
|
|
|
|
158,602
|
|
|
|
|
Total net minimum rentals
|
|
$
|
111,091
|
|
|
$
|
534,131
|
|
|
|
|
Less: Amount representing interest
|
|
|
(40,642
|
)
|
|
|
|
|
|
|
|
Present value of net minimum lease payments, of which $5,044 is
due within one year
|
|
$
|
70,449
|
|
|
|
|
|
|
|
Minimum rental commitments under operating leases are reflected
without reduction for rental income due in future years under
noncancelable subleases since income under these subleases is
immaterial. Some of the store leases contain renewal options
ranging from two to 59 years. Included in the minimum lease
payments under operating leases are leased vehicles, copiers,
fax machines, computer equipment and a related-party commitment
with an entity associated with the Company’s majority
shareholder of $224 for 2010 and $112 for 2011.
Rental expense consisted of the following:
| |
|
|
|
|
|
|
|
|
|
|
|
|
|
|
|
2009
|
|
|
2008
|
|
|
2007
|
|
|
|
|
|
|
|
Operating leases:
|
|
|
|
|
|
|
|
|
|
|
|
|
|
Buildings:
|
|
|
|
|
|
|
|
|
|
|
|
|
|
Rental expense
|
|
$
|
88,615
|
|
|
$
|
89,119
|
|
|
$
|
87,659
|
|
|
Contingent rentals
|
|
|
7,237
|
|
|
|
7,034
|
|
|
|
8,918
|
|
|
Fixtures and equipment
|
|
|
5,011
|
|
|
|
3,628
|
|
|
|
3,256
|
|
|
|
|
Totals
|
|
$
|
100,863
|
|
|
$
|
99,781
|
|
|
$
|
99,833
|
|
|
|
Rental expense includes amounts paid to an entity related to the
Company’s majority shareholder of $224 for each of 2009,
2008 and 2007.
Selling space has been licensed to certain other retailers
(“leased departments”) in many of the Company’s
facilities. Future minimum lease payments and rental expense
disclosed above are reflected without a reduction for leased
departments’ license income.
Contingencies
The Company is party to legal proceedings and claims that arise
during the ordinary course of business. In the opinion of
management, the ultimate outcome of any such litigation and
claims
F-33
THE BON-TON
STORES, INC.
NOTES TO CONSOLIDATED FINANCIAL STATEMENTS
(In thousands except share and per share data)
will not have a material adverse effect on the Company’s
financial condition, results of operations or liquidity.
The Company’s capital structure consists of common stock
with one vote per share and Class A common stock with ten
votes per share. Transfers of the Company’s Class A
common stock are restricted. Upon sale or transfer of ownership
or voting rights of Class A common stock to other than
permitted transferees, such shares will convert to an equal
number of common stock shares. Additionally, the Company has
authorized 5,000,000 shares of preferred stock; however, no
preferred shares have been issued. Treasury stock, which
consists of the Company’s common stock, is accounted for
using the cost method.
|
|
|
14.
|
COMPREHENSIVE
INCOME (LOSS)
|
The accumulated balances for each classification of other
comprehensive income (loss) are as follows:
| |
|
|
|
|
|
|
|
|
|
|
|
|
|
|
|
Pension and
|
|
|
|
|
|
Other
|
|
|
|
|
Postretirement
|
|
|
Cash Flow
|
|
|
Comprehensive
|
|
|
|
|
Benefit Plans
|
|
|
Hedges
|
|
|
Income (Loss)
|
|
|
|
|
|
|
|
Balance at February 3, 2007
|
|
$
|
2,033
|
|
|
$
|
(844
|
)
|
|
$
|
1,189
|
|
|
Net current period change
|
|
|
3,266
|
|
|
|
(3,656
|
)
|
|
|
(390
|
)
|
|
|
|
Balance at February 2, 2008
|
|
|
5,299
|
|
|
|
(4,500
|
)
|
|
|
799
|
|
|
Net current period change
|
|
|
(62,279
|
)
|
|
|
2,016
|
|
|
|
(60,263
|
)
|
|
|
|
Balance at January 31, 2009
|
|
|
(56,980
|
)
|
|
|
(2,484
|
)
|
|
|
(59,464
|
)
|
|
Net current period change
|
|
|
5,639
|
|
|
|
913
|
|
|
|
6,552
|
|
|
|
|
Balance at January 30, 2010
|
|
$
|
(51,341
|
)
|
|
$
|
(1,571
|
)
|
|
$
|
(52,912
|
)
|
|
|
F-34
THE BON-TON
STORES, INC.
NOTES TO CONSOLIDATED FINANCIAL STATEMENTS
(In thousands except share and per share data)
The related tax effects allocated to each component of
accumulated other comprehensive income (loss) are as follows:
| |
|
|
|
|
|
|
|
|
|
|
|
|
|
|
|
Before-Tax
|
|
|
Tax Benefit
|
|
|
Net-of-Tax
|
|
|
|
|
Amount
|
|
|
(Expense)
|
|
|
Amount
|
|
|
|
|
|
|
|
2007:
|
|
|
|
|
|
|
|
|
|
|
|
|
|
Pension and postretirement benefit plans:
|
|
|
|
|
|
|
|
|
|
|
|
|
|
Reclassification adjustments for prior service cost
|
|
$
|
4
|
|
|
$
|
(1
|
)
|
|
$
|
3
|
|
|
Reclassification adjustments for prior net actuarial loss
|
|
|
316
|
|
|
|
(118
|
)
|
|
|
198
|
|
|
Actuarial net gain
|
|
|
4,910
|
|
|
|
(1,845
|
)
|
|
|
3,065
|
|
|
|
|
|
|
|
5,230
|
|
|
|
(1,964
|
)
|
|
|
3,266
|
|
|
Cash flow hedges:
|
|
|
|
|
|
|
|
|
|
|
|
|
|
Derivative loss
|
|
|
(6,492
|
)
|
|
|
2,713
|
|
|
|
(3,779
|
)
|
|
Reclassification adjustments for losses realized in net income
|
|
|
212
|
|
|
|
(89
|
)
|
|
|
123
|
|
|
|
|
|
|
|
(6,280
|
)
|
|
|
2,624
|
|
|
|
(3,656
|
)
|
|
|
|
Other comprehensive loss
|
|
$
|
(1,050
|
)
|
|
$
|
660
|
|
|
$
|
(390
|
)
|
|
|
|
2008:
|
|
|
|
|
|
|
|
|
|
|
|
|
|
Pension and postretirement benefit plans:
|
|
|
|
|
|
|
|
|
|
|
|
|
|
Reclassification adjustments for prior service cost
|
|
$
|
14
|
|
|
$
|
—
|
|
|
$
|
14
|
|
|
Reclassification adjustments for prior net actuarial loss
|
|
|
277
|
|
|
|
—
|
|
|
|
277
|
|
|
Actuarial net loss
|
|
|
(61,601
|
)
|
|
|
(969
|
)
|
|
|
(62,570
|
)
|
|
|
|
|
|
|
(61,310
|
)
|
|
|
(969
|
)
|
|
|
(62,279
|
)
|
|
Cash flow hedges:
|
|
|
|
|
|
|
|
|
|
|
|
|
|
Derivative income
|
|
|
20
|
|
|
|
—
|
|
|
|
20
|
|
|
Reclassification adjustments for losses realized in net loss
|
|
|
1,996
|
|
|
|
—
|
|
|
|
1,996
|
|
|
|
|
|
|
|
2,016
|
|
|
|
—
|
|
|
|
2,016
|
|
|
|
|
Other comprehensive loss
|
|
$
|
(59,294
|
)
|
|
$
|
(969
|
)
|
|
$
|
(60,263
|
)
|
|
|
|
2009:
|
|
|
|
|
|
|
|
|
|
|
|
|
|
Pension and postretirement benefit plans:
|
|
|
|
|
|
|
|
|
|
|
|
|
|
Reclassification adjustments for prior net actuarial loss
|
|
$
|
4,785
|
|
|
$
|
—
|
|
|
$
|
4,785
|
|
|
Actuarial net gain
|
|
|
854
|
|
|
|
—
|
|
|
|
854
|
|
|
|
|
|
|
|
5,639
|
|
|
|
—
|
|
|
|
5,639
|
|
|
Cash flow hedges:
|
|
|
|
|
|
|
|
|
|
|
|
|
|
Derivative loss
|
|
|
(4,953
|
)
|
|
|
—
|
|
|
|
(4,953
|
)
|
|
Reclassification adjustments for losses realized in net loss
|
|
|
5,866
|
|
|
|
—
|
|
|
|
5,866
|
|
|
|
|
|
|
|
913
|
|
|
|
—
|
|
|
|
913
|
|
|
|
|
Other comprehensive income
|
|
$
|
6,552
|
|
|
$
|
—
|
|
|
$
|
6,552
|
|
|
|
As a result of the additional deferred tax asset valuation
allowance established in the fourth quarter of 2008 and
maintained throughout 2009, the changes recognized within other
F-35
THE BON-TON
STORES, INC.
NOTES TO CONSOLIDATED FINANCIAL STATEMENTS
(In thousands except share and per share data)
comprehensive income (loss) for 2009 and 2008 were recorded on a
gross basis, with the exception of the tax expense of $969
related to a supplemental pension plan termination in 2008.
|
|
|
15.
|
SHARE-BASED
COMPENSATION
|
The Company’s 2009 Omnibus Incentive Plan (“2009
Omnibus Plan”), as approved by shareholders on
June 16, 2009, provides for the granting of common stock
options, restricted shares, restricted stock units, performance
shares, stock appreciation rights, phantom stock and dividend
equivalent rights to certain employees, executive officers,
directors, consultants and advisors. A maximum of
2,500,000 shares may be granted under the 2009 Omnibus
Plan, in addition to available shares transferring from the
Company’s Amended and Restated 2000 Stock Incentive and
Performance-Based Award Plan (“2000 Stock Plan”)
between June 16, 2009 and March 2, 2010. At
January 30, 2010, 2,557,986 shares were available
within the 2009 Omnibus Plan. Vesting periods for the awards are
at the discretion of the Company’s Board of Directors.
The 2000 Stock Plan, as amended through June 17, 2008,
provided for the granting of common stock options, restricted
shares, restricted stock units and performance-based awards to
certain employees, officers, directors, consultants and
advisors. A maximum of 3,600,000 shares were available
under the 2000 Stock Plan; no shares remain available as of
January 30, 2010.
The Company’s Amended and Restated 1991 Stock Option and
Restricted Stock Plan (“1991 Stock Plan”), as amended
through June 17, 1997, provided for the granting of
restricted shares, common stock options and performance-based
common stock options as part of a long-term incentive plan for
selected officers. A maximum of 1,900,000 shares were
available under the 1991 Stock Plan; no shares remain available
as of January 30, 2010.
Stock options granted during 2008 and 2007 were granted with an
exercise price equal to the market value of the underlying stock
on the grant date, vest over one to four years and had a
contractual term of seven years. No stock options were granted
during 2009.
Restricted shares granted during 2009, 2008 and 2007 vest over
one to three years. Employees granted restricted shares are not
required to pay for the shares; however, they must remain
employed with the Company until the restrictions on the shares
lapse. In addition, vesting of certain restricted shares awarded
during 2009, 2008 and 2007 was subject to the achievement of
specified criteria based on Company performance.
Restricted stock units granted during 2009, 2008 and 2007 vest
over one year. Employees and directors who are granted
restricted stock units are not required to pay for the shares
but must remain employed by the Company, or continue to serve as
a member of its Board of Directors, until the restricted stock
units vest. In addition, vesting of certain restricted stock
units awarded during 2007 was subject to the achievement of
specified criteria based on Company performance.
The Company recognizes share-based compensation pursuant to
ASC 718. The Company measures the cost of grantee services
received in exchange for an award of equity instruments based on
the grant date fair value of the award, and recognizes that cost
over the period that the grantee is required to provide service
in exchange for the award. For the stock option awards, the
Company estimates grant date fair value using the Black-Scholes
option valuation model. For restricted share and restricted
stock unit grants, grant date fair value is determined based
upon the closing trading value of the Company’s stock on
the day of the grant. The Company generally issues new stock to
satisfy share-based awards.
The compensation cost that has been recorded within SG&A
expense for the Company’s share-based award plans was
$5,083, $5,272 and $7,965 for 2009, 2008 and 2007, respectively.
F-36
THE BON-TON
STORES, INC.
NOTES TO CONSOLIDATED FINANCIAL STATEMENTS
(In thousands except share and per share data)
There was no income tax benefit or expense recognized in the
2009 statement of operations for share-based award
compensation due to continuation of a full valuation allowance
on all net deferred tax assets related to share-based award
compensation. Income tax expense of $4,135 was recognized in the
2008 statement of operations for share-based award
compensation, due in large part to the establishment of a full
valuation allowance on all net deferred tax assets related to
share-based award compensation at January 31, 2009. An
income tax benefit of $2,235 was recognized in the
2007 statement of operations for share-based compensation.
Cash received from exercised stock options was $0, $0 and $604
for 2009, 2008 and 2007, respectively. Actual tax deduction
benefits from exercised stock options and vested restricted
shares totaled $46, $113 and $1,077 for 2009, 2008 and 2007,
respectively.
Awards with graded vesting are recognized using graded
amortization.
Based upon an examination of forfeiture rates for the various
classes of stock options, restricted stock units and restricted
shares, Company management does not believe the total number of
options or shares that are vested and expected to vest as of
January 30, 2010 are materially different from the
respective number of options or shares outstanding as of
January 30, 2010.
Stock
Options
The fair value of each option award was estimated on the grant
date using the Black-Scholes option valuation model and the
assumptions noted in the following table (no stock options were
awarded in 2009):
| |
|
|
|
|
|
|
|
|
|
|
|
|
|
|
|
2009
|
|
|
2008
|
|
|
2007
|
|
|
|
|
|
|
|
Weighted average grant date fair value
|
|
|
—
|
|
|
$
|
1.99
|
|
|
$
|
22.83
|
|
|
Weighted average risk-free interest rate
|
|
|
—
|
|
|
|
2.7
|
%
|
|
|
4.4
|
%
|
|
Weighted average expected volatility
|
|
|
—
|
|
|
|
57.9
|
%
|
|
|
50.5
|
%
|
|
Weighted average expected dividend yield
|
|
|
—
|
|
|
|
3.9
|
%
|
|
|
0.5
|
%
|
|
Weighted average expected term (years)
|
|
|
—
|
|
|
|
5.0
|
|
|
|
4.9
|
|
The risk-free interest rates used in 2008 and 2007 were based on
the zero-coupon U.S. Treasury bond, with a term equal to
the expected term of the stock options. The volatility used in
2008 and 2007 represents the historical volatility of the
Company’s common shares over a period that approximates the
expected term of the stock options. The expected dividend yields
used in 2008 and 2007 were estimated based on historical
dividend yields.
The expected terms of options granted in 2008 and 2007 were
estimated using the average of the vesting period and the
contractual term, in accordance with the simplified method as
provided within SEC Staff Accounting Bulletin No. 107,
“Share-Based Payment.” The SEC issued Staff Accounting
Bulletin No. 110, “Share-Based Payment,” on
December 21, 2007, which provided for continued application
of the simplified method in certain circumstances. The Company
has continued to apply the simplified method, given a
significant change in stock option contractual terms that
precludes adequate historical exercise data to provide a
reasonable basis for estimating expected term.
The Company’s stock options include stock options granted
from the 2000 Stock Plan and the 1991 Stock Plan.
F-37
THE BON-TON
STORES, INC.
NOTES TO CONSOLIDATED FINANCIAL STATEMENTS
(In thousands except share and per share data)
A summary of the stock options as of January 30, 2010 and
changes during 2009 is presented below:
| |
|
|
|
|
|
|
|
|
|
|
|
|
|
|
|
|
|
|
|
|
|
|
|
|
|
Weighted
|
|
|
|
|
|
|
|
|
|
|
|
|
|
Average
|
|
|
|
|
|
|
|
|
|
|
Weighted
|
|
|
Remaining
|
|
|
Aggregate
|
|
|
|
|
Shares Under
|
|
|
Average per-Share
|
|
|
Contractual Term
|
|
|
Intrinsic
|
|
|
|
|
Option
|
|
|
Exercise Price
|
|
|
(Years)
|
|
|
Value
|
|
|
|
|
|
|
|
Outstanding as of January 31, 2009
|
|
|
1,134,106
|
|
|
$
|
17.16
|
|
|
|
|
|
|
|
|
|
|
Forfeited
|
|
|
(52,248
|
)
|
|
|
21.85
|
|
|
|
|
|
|
|
|
|
|
|
|
Outstanding as of January 30, 2010
|
|
|
1,081,858
|
|
|
|
16.93
|
|
|
|
4.32
|
|
|
$
|
1,861
|
|
|
|
|
Exercisable as of January 30, 2010
|
|
|
455,666
|
|
|
$
|
20.95
|
|
|
|
3.40
|
|
|
$
|
50
|
|
|
|
The total intrinsic value of options exercised was $0, $0 and
$1,231 during 2009, 2008 and 2007, respectively. As of
January 30, 2010, there was $540 of total unrecognized
compensation cost related to unvested stock options; that cost
is expected to be recognized over a weighted average period of
0.56 years.
Restricted
Stock Units
Restricted stock units consist of units granted from the 2009
Omnibus Plan and the 2000 Stock Plan. The fair value of each
restricted stock unit award is determined based upon the closing
trading value of the Company’s stock on the day of the
grant. A summary of the restricted stock units as of
January 30, 2010 and changes during 2009 is presented below:
| |
|
|
|
|
|
|
|
|
|
|
|
|
|
|
|
|
|
|
|
|
|
|
Weighted Average Grant-
|
|
|
|
|
Restricted Stock Units
|
|
|
Date Fair Value
|
|
|
|
|
Performance
|
|
|
|
|
|
Performance
|
|
|
|
|
|
|
|
and Service
|
|
|
Service
|
|
|
and Service
|
|
|
Service
|
|
|
|
|
Required
|
|
|
Required
|
|
|
Required
|
|
|
Required
|
|
|
|
|
|
|
|
Outstanding as of
January 31, 2009
|
|
|
20,259
|
|
|
|
195,994
|
|
|
$
|
21.90
|
|
|
$
|
9.64
|
|
|
Granted
|
|
|
—
|
|
|
|
73,920
|
|
|
|
—
|
|
|
|
4.87
|
|
|
Exercised
|
|
|
—
|
|
|
|
(11,581
|
)
|
|
|
—
|
|
|
|
18.99
|
|
|
|
|
Outstanding as of
January 30, 2010
|
|
|
20,259
|
|
|
|
258,333
|
|
|
|
21.90
|
|
|
|
7.86
|
|
|
|
As of January 30, 2010, all outstanding restricted stock
units in the above table were vested, and there was no
unrecognized compensation cost related to restricted stock
units. Vested awards will be settled in shares after certain
events and time periods occur, as defined within the terms of
the restricted stock unit grant agreements.
F-38
THE BON-TON
STORES, INC.
NOTES TO CONSOLIDATED FINANCIAL STATEMENTS
(In thousands except share and per share data)
The total fair value of restricted stock units vested during
2009, 2008 and 2007 was $647, $168 and $145, respectively.
The weighted-average grant date fair value of restricted stock
units granted during 2009, 2008 and 2007 was $4.87 per unit,
$3.91 per unit and $40.47 per unit, respectively.
The Company pays cash dividend equivalents on all outstanding
restricted stock units.
Restricted
Shares
The Company’s restricted shares consist of shares granted
from the 2000 Stock Plan. The fair value of each restricted
share award is determined based upon the closing trading value
of the Company’s stock on the day of the grant. A summary
of the restricted share awards as of January 30, 2010 and
changes during 2009 is presented below:
| |
|
|
|
|
|
|
|
|
|
|
|
|
|
|
|
|
|
|
|
|
|
|
Weighted Average Grant-
|
|
|
|
|
Restricted Shares
|
|
|
Date Fair Value
|
|
|
|
|
Performance
|
|
|
|
|
|
Performance
|
|
|
|
|
|
|
|
and Service
|
|
|
Service
|
|
|
and Service
|
|
|
Service
|
|
|
|
|
Required
|
|
|
Required
|
|
|
Required
|
|
|
Required
|
|
|
|
|
|
|
|
Nonvested as of
January 31, 2009
|
|
|
—
|
|
|
|
548,788
|
|
|
|
—
|
|
|
$
|
19.08
|
|
|
Granted
|
|
|
467,927
|
|
|
|
692,000
|
|
|
$
|
1.32
|
|
|
|
1.78
|
|
|
Vested
|
|
|
(421,134
|
)
|
|
|
(33,250
|
)
|
|
|
1.32
|
|
|
|
31.53
|
|
|
Forfeited
|
|
|
(46,793
|
)
|
|
|
(11,406
|
)
|
|
|
1.32
|
|
|
|
10.67
|
|
|
|
|
Nonvested as of
January 30, 2010
|
|
|
—
|
|
|
|
1,196,132
|
|
|
|
—
|
|
|
|
8.81
|
|
|
|
As of January 30, 2010, there was $983 of total
unrecognized compensation cost related to restricted shares that
is expected to be recognized over a weighted average period of
0.96 years.
The total fair value of shares vested during 2009, 2008 and 2007
was $3,765, $540 and $1,628, respectively.
The Company pays cash dividends on all outstanding restricted
shares.
F-39
THE BON-TON
STORES, INC.
NOTES TO CONSOLIDATED FINANCIAL STATEMENTS
(In thousands except share and per share data)
Components of the income tax (benefit) provision were as follows:
| |
|
|
|
|
|
|
|
|
|
|
|
|
|
|
|
2009
|
|
|
2008
|
|
|
2007
|
|
|
|
|
|
|
|
Current:
|
|
|
|
|
|
|
|
|
|
|
|
|
|
Federal
|
|
$
|
(9,767
|
)
|
|
$
|
(39,179
|
)
|
|
$
|
4,316
|
|
|
State
|
|
|
(2,447
|
)
|
|
|
1,019
|
|
|
|
251
|
|
|
|
|
Total current
|
|
|
(12,214
|
)
|
|
|
(38,160
|
)
|
|
|
4,567
|
|
|
|
|
Deferred:
|
|
|
|
|
|
|
|
|
|
|
|
|
|
Federal
|
|
|
4,019
|
|
|
|
83,279
|
|
|
|
2,529
|
|
|
State
|
|
|
164
|
|
|
|
17,974
|
|
|
|
(1,151
|
)
|
|
|
|
Total deferred
|
|
$
|
4,183
|
|
|
$
|
101,253
|
|
|
$
|
1,378
|
|
|
|
|
Income tax (benefit) provision
|
|
$
|
(8,031
|
)
|
|
$
|
63,093
|
|
|
$
|
5,945
|
|
|
|
Components of gross deferred tax assets and liabilities were as
follows:
| |
|
|
|
|
|
|
|
|
|
|
|
January 30,
|
|
|
January 31,
|
|
|
|
|
2010
|
|
|
2009
|
|
|
|
|
|
|
|
Deferred tax assets:
|
|
|
|
|
|
|
|
|
|
Net operating losses
|
|
$
|
47,692
|
|
|
$
|
49,962
|
|
|
Alternative minimum tax credits
|
|
|
5,806
|
|
|
|
8,020
|
|
|
Defined benefit pension obligations
|
|
|
23,401
|
|
|
|
22,785
|
|
|
Accrued expenses
|
|
|
8,375
|
|
|
|
6,627
|
|
|
Inventories
|
|
|
4,790
|
|
|
|
14,349
|
|
|
Equity compensation
|
|
|
7,852
|
|
|
|
6,463
|
|
|
Rent amortization
|
|
|
24,594
|
|
|
|
22,909
|
|
|
Other
|
|
|
26,748
|
|
|
|
26,424
|
|
|
|
|
Gross deferred tax assets
|
|
|
149,258
|
|
|
|
157,539
|
|
|
Less: Valuation allowance
|
|
|
(140,452
|
)
|
|
|
(145,468
|
)
|
|
|
|
Total gross deferred tax assets
|
|
|
8,806
|
|
|
|
12,071
|
|
|
|
|
Deferred tax liabilities:
|
|
|
|
|
|
|
|
|
|
Property, fixtures and equipment
|
|
|
(5,262
|
)
|
|
|
(7,276
|
)
|
|
Other
|
|
|
(5,061
|
)
|
|
|
(2,129
|
)
|
|
|
|
Total gross deferred tax liabilities
|
|
|
(10,323
|
)
|
|
|
(9,405
|
)
|
|
|
|
Net deferred tax (liabilities) assets
|
|
$
|
(1,517
|
)
|
|
$
|
2,666
|
|
|
|
F-40
THE BON-TON
STORES, INC.
NOTES TO CONSOLIDATED FINANCIAL STATEMENTS
(In thousands except share and per share data)
ASC 740 requires that companies assess whether valuation
allowances should be established against their deferred tax
assets based on consideration of all available evidence using a
“more likely than not” standard. In assessing the
realizability of its deferred tax assets, the Company considered
whether it was more likely than not that its deferred tax assets
will be realized based upon all available evidence, including
the scheduled reversal of deferred tax liabilities, historical
operating results, projected future operating results, tax
carry-back availability, and limitations pursuant to
Section 382 of the Internal Revenue Code
(“Section 382”), among others. Pursuant to
ASC 740, significant weight is to be given to evidence that
can be objectively verified. As a result, a company’s
current or previous losses are given more weight than any
projected future taxable income. In addition, a recent
three-year historical cumulative loss is considered a
significant element of negative evidence that is difficult to
overcome.
The Company has evaluated its deferred tax assets each reporting
period, including assessment of its cumulative income or loss
over the prior three-year period, to determine if valuation
allowances were required. The Company’s three-year
historical cumulative loss as of the fourth quarter of 2008 was
a significant element of negative evidence. This, combined with
uncertain near-term economic conditions, impeded the
Company’s ability to rely on its projections of future
taxable income in establishing its deferred tax assets valuation
allowance at January 31, 2009. Accordingly, a full
valuation allowance was established during the fourth quarter of
2008 on nearly all of the Company’s net deferred tax
assets, resulting in a tax expense adjustment of $108,495. With
respect to reviews during 2009, the Company’s three-year
historical cumulative loss and the continuation of uncertain
near-term economic conditions again impeded the Company’s
ability to rely on its projections of future taxable income in
assessing valuation allowance requirements. As such, the Company
concluded that it was necessary to maintain a full valuation
allowance on its net deferred tax assets.
The Company reported deferred tax asset valuation allowances of
$140,452 and $145,468 at January 30, 2010 and
January 31, 2009, respectively. If actual results differ
from the Company’s underlying estimates, or these estimates
are adjusted in future periods, the Company may need to adjust
its valuation allowance — which could materially
impact its financial position and results of operations.
As a result of the additional deferred tax asset valuation
allowance recognition in 2008, the changes recognized within
other comprehensive income (loss) for 2009 were recorded on a
gross basis, as were the changes recognized in 2008 with the
exception of a tax expense of $969 related to a post-retirement
benefit plan termination.
If sufficient positive evidence arises in the future indicating
that all or a portion of the deferred tax assets meet the more
likely than not standard under ASC 740, the valuation
allowance would be reversed accordingly in the period that such
a conclusion is reached.
At January 30, 2010, the Company had federal and state net
operating loss carry-forwards of $88,209 and $365,781,
respectively, which are available to offset future federal and
state taxable income, subject to certain limitations imposed by
Section 382. These net operating losses will expire at
various dates from 2010 through 2030.
The Company has alternative minimum tax credits of $5,806 and
$8,020 as of January 30, 2010 and January 31, 2009,
respectively. The Company acquired $2,064 of these credits in
connection with an acquisition; their use is subject to the
limitations imposed by Section 382. These credits can be
carried-forward indefinitely.
F-41
THE BON-TON
STORES, INC.
NOTES TO CONSOLIDATED FINANCIAL STATEMENTS
(In thousands except share and per share data)
A reconciliation of the statutory federal income tax rate to the
effective tax rate is as follows:
| |
|
|
|
|
|
|
|
|
|
|
|
|
|
|
|
2009
|
|
|
2008
|
|
|
2007
|
|
|
|
|
|
|
|
Tax at statutory rate
|
|
|
35.0
|
%
|
|
|
35.0
|
%
|
|
|
35.0
|
%
|
|
State income taxes, net of federal benefit
|
|
|
25.7
|
|
|
|
3.8
|
|
|
|
0.6
|
|
|
Valuation allowance changes, net
|
|
|
2.9
|
|
|
|
(96.8
|
)
|
|
|
3.0
|
|
|
Changes in state deferred tax rate
|
|
|
2.9
|
|
|
|
(0.2
|
)
|
|
|
(4.5
|
)
|
|
Other, net
|
|
|
—
|
|
|
|
(0.9
|
)
|
|
|
(0.1
|
)
|
|
|
|
Effective tax rate
|
|
|
66.5
|
%
|
|
|
(59.1
|
)%
|
|
|
34.0
|
%
|
|
|
The Company elected to use the extended carry-back for its
2008 net operating loss, as allowed by The Worker,
Homeownership, and Business Assistance Act of 2009
(“2009 Act”). The 2009 Act allowed the Company to
carry back federal net operating losses for up to five years,
instead of the general two-year carry-back. This election
resulted in a reduction to the Company’s valuation
allowance of $6,920 during the fourth quarter of 2009. The
Company plans to file this carry-back claim during 2010, and
expects to receive a corresponding federal income tax refund of
approximately $6,920 as reflected within prepaid expenses and
other current assets at January 30, 2010.
In accordance with ASC 740, the Company recognizes the
effect of income tax positions only if those positions are more
likely than not of being sustained. Recognized income tax
positions are measured at the largest amount that is greater
than 50% likely of being realized. Changes in recognition or
measurement are reflected in the period in which the change in
judgment occurs. A reconciliation of the beginning and ending
gross unrecognized tax benefits is as follows:
| |
|
|
|
|
|
|
|
|
|
|
|
|
|
|
|
2009
|
|
|
2008
|
|
|
2007
|
|
|
|
|
|
|
|
Balance at beginning of year
|
|
$
|
7,274
|
|
|
$
|
17,234
|
|
|
$
|
18,275
|
|
|
Increases related to prior year tax positions
|
|
|
7,504
|
|
|
|
—
|
|
|
|
252
|
|
|
Decreases related to prior year tax positions
|
|
|
—
|
|
|
|
—
|
|
|
|
(351
|
)
|
|
Increases related to current year tax positions
|
|
|
118
|
|
|
|
98
|
|
|
|
643
|
|
|
Lapse of statute
|
|
|
(2,912
|
)
|
|
|
(10,058
|
)
|
|
|
(1,585
|
)
|
|
|
|
Balance at end of year
|
|
$
|
11,984
|
|
|
$
|
7,274
|
|
|
$
|
17,234
|
|
|
|
The total amount of gross unrecognized tax benefits that, if
recognized, would affect the effective tax rate was $2,870 and
$5,376 as of January 30, 2010 and January 31, 2009,
respectively.
During the twelve months subsequent to January 30, 2010, it
is reasonably possible that the gross unrecognized tax benefits
will decrease by up to $1,236, of which $1,236 could affect the
income tax provision. This potential decrease is due to
expiration of certain statute of limitations and potential
favorable resolution of audits with respect to state tax
positions relating to basis differences from prior acquisitions
and state issues relating to expense disallowances.
It is the Company’s policy to record interest on
unrecognized tax benefits as an income tax provision. The
Company believes that penalties are not applicable to any of its
uncertain tax positions. For 2009, the Company recorded $444 as
an income tax provision to reflect additional interest on
unrecognized tax benefits, offset by a $913 reduction of accrued
interest pursuant to lapses of statutes during 2009. For 2008,
the Company recorded $705 as an income tax provision to
F-42
THE BON-TON
STORES, INC.
NOTES TO CONSOLIDATED FINANCIAL STATEMENTS
(In thousands except share and per share data)
reflect additional interest on unrecognized tax benefits, offset
by a $2,322 reduction of accrued interest pursuant to lapses of
statutes during 2008. For 2007, the Company recorded $1,189 as
an income tax provision to reflect additional interest on
unrecognized tax benefits. At January 30, 2010 and
January 31, 2009, the Company had accruals of $1,152 and
$1,621, respectively, for interest on unrecognized tax benefits.
The Company’s federal tax returns for the years ended
January 31, 2006 through the present are open to
examination, as are the Company’s various state tax returns
for the tax years ended January 31, 2005 through the
present.
|
|
|
17.
|
QUARTERLY RESULTS
(UNAUDITED)
|
| |
|
|
|
|
|
|
|
|
|
|
|
|
|
|
|
|
|
|
|
Quarter Ended
|
|
|
|
|
May 2,
|
|
|
August 1,
|
|
|
October 31,
|
|
|
January 30,
|
|
|
2009:
|
|
2009
|
|
|
2009
|
|
|
2009
|
|
|
2010
|
|
|
|
|
|
|
|
Net sales
|
|
$
|
644,531
|
|
|
$
|
609,228
|
|
|
$
|
703,946
|
|
|
$
|
1,002,119
|
|
|
Other income
|
|
|
18,392
|
|
|
|
16,076
|
|
|
|
18,667
|
|
|
|
21,978
|
|
|
|
|
|
|
|
662,923
|
|
|
|
625,304
|
|
|
|
722,613
|
|
|
|
1,024,097
|
|
|
|
|
Costs and expenses:
|
|
|
|
|
|
|
|
|
|
|
|
|
|
|
|
|
|
Costs of merchandise sold
|
|
|
420,366
|
|
|
|
383,097
|
|
|
|
439,029
|
|
|
|
619,700
|
|
|
Selling, general and administrative
|
|
|
236,827
|
|
|
|
222,923
|
|
|
|
234,798
|
|
|
|
269,091
|
|
|
Depreciation and amortization
|
|
|
28,098
|
|
|
|
28,611
|
|
|
|
27,622
|
|
|
|
27,304
|
|
|
Amortization of lease-related interests
|
|
|
1,227
|
|
|
|
1,217
|
|
|
|
1,216
|
|
|
|
1,206
|
|
|
Other impairment charges
|
|
|
—
|
|
|
|
85
|
|
|
|
394
|
|
|
|
5,404
|
|
|
|
|
(Loss) income from operations
|
|
|
(23,595
|
)
|
|
|
(10,629
|
)
|
|
|
19,554
|
|
|
|
101,392
|
|
|
Interest expense, net
|
|
|
22,926
|
|
|
|
23,194
|
|
|
|
23,201
|
|
|
|
29,487
|
|
|
|
|
(Loss) income before income taxes
|
|
|
(46,521
|
)
|
|
|
(33,823
|
)
|
|
|
(3,647
|
)
|
|
|
71,905
|
|
|
Income tax (benefit) provision
|
|
|
(1,080
|
)
|
|
|
939
|
|
|
|
506
|
|
|
|
(8,396
|
)
|
|
|
|
Net (loss) income
|
|
$
|
(45,441
|
)
|
|
$
|
(34,762
|
)
|
|
$
|
(4,153
|
)
|
|
$
|
80,301
|
|
|
|
|
Per Share Amounts — Basic:
|
|
|
|
|
|
|
|
|
|
|
|
|
|
|
|
|
|
Net (loss) income
|
|
$
|
(2.67
|
)
|
|
$
|
(2.04
|
)
|
|
$
|
(0.24
|
)
|
|
$
|
4.39
|
|
|
Per Share Amounts — Diluted:
|
|
|
|
|
|
|
|
|
|
|
|
|
|
|
|
|
|
Net (loss) income
|
|
$
|
(2.67
|
)
|
|
$
|
(2.04
|
)
|
|
$
|
(0.24
|
)
|
|
$
|
4.34
|
|
The quarter ended January 30, 2010 includes impairment
charges of $5,238 and $166 resulting in a reduction in the
carrying amount of certain store and distribution center
properties and intangible assets (private label brand names) not
subject to amortization, respectively. In addition, an income
tax benefit adjustment of $6,340 was recorded to reflect a
deferred tax asset valuation allowance release associated with
implementation of the carry-back provisions of the 2009 Act,
partially offset by certain other valuation allowance increases.
F-43
THE BON-TON
STORES, INC.
NOTES TO CONSOLIDATED FINANCIAL STATEMENTS
(In thousands except share and per share data)
| |
|
|
|
|
|
|
|
|
|
|
|
|
|
|
|
|
|
|
|
Quarter Ended
|
|
|
|
|
May 3,
|
|
|
August 2,
|
|
|
November 1,
|
|
|
January 31,
|
|
|
2008:
|
|
2008
|
|
|
2008
|
|
|
2008
|
|
|
2009
|
|
|
|
|
|
|
|
Net sales
|
|
$
|
700,248
|
|
|
$
|
673,384
|
|
|
$
|
724,927
|
|
|
$
|
1,031,408
|
|
|
Other income
|
|
|
22,775
|
|
|
|
21,513
|
|
|
|
22,742
|
|
|
|
28,418
|
|
|
|
|
|
|
|
723,023
|
|
|
|
694,897
|
|
|
|
747,669
|
|
|
|
1,059,826
|
|
|
|
|
Costs and expenses:
|
|
|
|
|
|
|
|
|
|
|
|
|
|
|
|
|
|
Costs of merchandise sold
|
|
|
462,500
|
|
|
|
431,962
|
|
|
|
466,791
|
|
|
|
673,707
|
|
|
Selling, general and administrative
|
|
|
255,774
|
|
|
|
246,394
|
|
|
|
261,916
|
|
|
|
269,441
|
|
|
Depreciation and amortization
|
|
|
29,018
|
|
|
|
29,892
|
|
|
|
29,770
|
|
|
|
28,702
|
|
|
Amortization of lease-related interests
|
|
|
1,208
|
|
|
|
1,206
|
|
|
|
1,220
|
|
|
|
1,232
|
|
|
Goodwill impairment
|
|
|
—
|
|
|
|
17,767
|
|
|
|
—
|
|
|
|
—
|
|
|
Other impairment charges
|
|
|
—
|
|
|
|
—
|
|
|
|
—
|
|
|
|
25,905
|
|
|
|
|
(Loss) income from operations
|
|
|
(25,477
|
)
|
|
|
(32,324
|
)
|
|
|
(12,028
|
)
|
|
|
60,839
|
|
|
Interest expense, net
|
|
|
24,362
|
|
|
|
24,376
|
|
|
|
24,681
|
|
|
|
24,428
|
|
|
|
|
(Loss) income before income taxes
|
|
|
(49,839
|
)
|
|
|
(56,700
|
)
|
|
|
(36,709
|
)
|
|
|
36,411
|
|
|
Income tax (benefit) provision
|
|
|
(15,776
|
)
|
|
|
(22,874
|
)
|
|
|
(22,375
|
)
|
|
|
124,118
|
|
|
|
|
Net loss
|
|
$
|
(34,063
|
)
|
|
$
|
(33,826
|
)
|
|
$
|
(14,334
|
)
|
|
$
|
(87,707
|
)
|
|
|
|
Per Share Amounts — Basic:
|
|
|
|
|
|
|
|
|
|
|
|
|
|
|
|
|
|
Net loss
|
|
$
|
(2.03
|
)
|
|
$
|
(2.01
|
)
|
|
$
|
(0.85
|
)
|
|
$
|
(5.22
|
)
|
|
Per Share Amounts — Diluted:
|
|
|
|
|
|
|
|
|
|
|
|
|
|
|
|
|
|
Net loss
|
|
$
|
(2.03
|
)
|
|
$
|
(2.01
|
)
|
|
$
|
(0.85
|
)
|
|
$
|
(5.22
|
)
|
The quarter ended August 2, 2008 includes an asset
impairment charge of $17,767 to write-off the value of goodwill.
The quarter ended November 1, 2008 includes a tax benefit
adjustment of $7,038 resulting from a
statute-of-limitations
expiration; the adjustment was recorded within the income tax
benefit.
The quarter ended January 31, 2009 includes impairment
charges of $17,853 and $8,052 resulting in a reduction in the
carrying amount of certain store properties and intangible
assets (trade names and private label brand names) not subject
to amortization, respectively. In addition, a charge of $108,495
relating to a deferred tax asset valuation allowance was
recorded in the income tax provision.
|
|
|
18.
|
GUARANTOR AND
NON-GUARANTOR SUBSIDIARIES
|
On March 6, 2006, The Bon-Ton Department Stores, Inc. (the
“Issuer”), a wholly owned subsidiary of the Company,
entered into an Indenture with The Bank of New York, as trustee,
under which the Issuer issued $510,000 aggregate principal
amount of its
101/4% Senior
Notes due 2014 (see Note 9). The Notes are guaranteed on a
senior unsecured basis by the Company and by each of
F-44
THE BON-TON
STORES, INC.
NOTES TO CONSOLIDATED FINANCIAL STATEMENTS
(In thousands except share and per share data)
the Company’s subsidiaries, other than the Issuer, that is
an obligor under the Company’s Amended Revolving Credit
Facility. The guarantees are full and unconditional and joint
and several.
The condensed consolidating financial information for the
Company, the Issuer and the Company’s guarantor and
non-guarantor subsidiaries as of January 30, 2010 and
January 31, 2009 and for 2009, 2008 and 2007 as presented
below has been prepared from the books and records maintained by
the Company, the Issuer and the guarantor and non-guarantor
subsidiaries. The condensed financial information may not
necessarily be indicative of the results of operations or
financial position had the guarantor and non-guarantor
subsidiaries operated as independent entities. Certain
intercompany revenues and expenses included in the subsidiary
records are eliminated in consolidation. As a result of this
activity, an amount due to/due from affiliates will exist at any
time.
F-45
THE BON-TON
STORES, INC.
NOTES TO CONSOLIDATED FINANCIAL STATEMENTS
(In thousands except share and per share data)
The Bon-Ton
Stores, Inc.
Condensed Consolidating Balance Sheet
January 30, 2010
| |
|
|
|
|
|
|
|
|
|
|
|
|
|
|
|
|
|
|
|
|
|
|
|
|
|
|
|
Bon-Ton
|
|
|
|
|
|
|
|
|
|
|
|
|
|
|
|
|
|
|
|
(Parent
|
|
|
|
|
|
Guarantor
|
|
|
Non-Guarantor
|
|
|
Consolidating
|
|
|
Company
|
|
|
|
|
Company)
|
|
|
Issuer
|
|
|
Subsidiaries
|
|
|
Subsidiaries
|
|
|
Eliminations
|
|
|
Consolidated
|
|
|
|
|
|
|
|
Assets
|
|
|
|
|
|
|
|
|
|
|
|
|
|
|
|
|
|
|
|
|
|
|
|
|
|
Current assets:
|
|
|
|
|
|
|
|
|
|
|
|
|
|
|
|
|
|
|
|
|
|
|
|
|
|
Cash and cash equivalents
|
|
$
|
1
|
|
|
$
|
9,962
|
|
|
$
|
8,959
|
|
|
$
|
—
|
|
|
$
|
—
|
|
|
$
|
18,922
|
|
|
Merchandise inventories
|
|
|
—
|
|
|
|
339,616
|
|
|
|
319,783
|
|
|
|
—
|
|
|
|
—
|
|
|
|
659,399
|
|
|
Prepaid expenses and other current assets
|
|
|
—
|
|
|
|
73,640
|
|
|
|
11,549
|
|
|
|
3,035
|
|
|
|
(534
|
)
|
|
|
87,690
|
|
|
|
|
Total current assets
|
|
|
1
|
|
|
|
423,218
|
|
|
|
340,291
|
|
|
|
3,035
|
|
|
|
(534
|
)
|
|
|
766,011
|
|
|
|
|
Property, fixtures and equipment at cost, net
|
|
|
—
|
|
|
|
226,915
|
|
|
|
239,850
|
|
|
|
289,853
|
|
|
|
—
|
|
|
|
756,618
|
|
|
Deferred income taxes
|
|
|
—
|
|
|
|
4,277
|
|
|
|
9,026
|
|
|
|
—
|
|
|
|
—
|
|
|
|
13,303
|
|
|
Intangible assets, net
|
|
|
—
|
|
|
|
59,332
|
|
|
|
79,462
|
|
|
|
—
|
|
|
|
—
|
|
|
|
138,794
|
|
|
Investment in and advances to (from) affiliates
|
|
|
141,755
|
|
|
|
489,259
|
|
|
|
153,717
|
|
|
|
316
|
|
|
|
(785,047
|
)
|
|
|
—
|
|
|
Other long-term assets
|
|
|
—
|
|
|
|
38,561
|
|
|
|
4,263
|
|
|
|
4,457
|
|
|
|
—
|
|
|
|
47,281
|
|
|
|
|
Total assets
|
|
$
|
141,756
|
|
|
$
|
1,241,562
|
|
|
$
|
826,609
|
|
|
$
|
297,661
|
|
|
$
|
(785,581
|
)
|
|
$
|
1,722,007
|
|
|
|
|
Liabilities and Shareholders’ Equity
|
|
|
|
|
|
|
|
|
|
|
|
|
|
|
|
|
|
|
|
|
|
|
|
|
|
Current liabilities:
|
|
|
|
|
|
|
|
|
|
|
|
|
|
|
|
|
|
|
|
|
|
|
|
|
|
Accounts payable
|
|
$
|
—
|
|
|
$
|
163,671
|
|
|
$
|
—
|
|
|
$
|
—
|
|
|
$
|
—
|
|
|
$
|
163,671
|
|
|
Accrued payroll and benefits
|
|
|
—
|
|
|
|
40,632
|
|
|
|
7,665
|
|
|
|
—
|
|
|
|
—
|
|
|
|
48,297
|
|
|
Accrued expenses
|
|
|
—
|
|
|
|
73,953
|
|
|
|
85,979
|
|
|
|
1,339
|
|
|
|
(534
|
)
|
|
|
160,737
|
|
|
Current maturities of long-term debt and obligations under
capital leases
|
|
|
—
|
|
|
|
3,635
|
|
|
|
2,409
|
|
|
|
6,509
|
|
|
|
—
|
|
|
|
12,553
|
|
|
Deferred income taxes
|
|
|
—
|
|
|
|
5,650
|
|
|
|
9,170
|
|
|
|
—
|
|
|
|
—
|
|
|
|
14,820
|
|
|
|
|
Total current liabilities
|
|
|
—
|
|
|
|
287,541
|
|
|
|
105,223
|
|
|
|
7,848
|
|
|
|
(534
|
)
|
|
|
400,078
|
|
|
Long-term debt and obligations under capital leases, less
current maturities
|
|
|
—
|
|
|
|
715,891
|
|
|
|
54,948
|
|
|
|
245,881
|
|
|
|
—
|
|
|
|
1,016,720
|
|
|
Other long-term liabilities
|
|
|
—
|
|
|
|
120,469
|
|
|
|
41,706
|
|
|
|
1,278
|
|
|
|
—
|
|
|
|
163,453
|
|
|
|
|
Total liabilities
|
|
|
—
|
|
|
|
1,123,901
|
|
|
|
201,877
|
|
|
|
255,007
|
|
|
|
(534
|
)
|
|
|
1,580,251
|
|
|
|
|
Shareholders’ equity
|
|
|
141,756
|
|
|
|
117,661
|
|
|
|
624,732
|
|
|
|
42,654
|
|
|
|
(785,047
|
)
|
|
|
141,756
|
|
|
|
|
Total liabilities and shareholders’ equity
|
|
$
|
141,756
|
|
|
$
|
1,241,562
|
|
|
$
|
826,609
|
|
|
$
|
297,661
|
|
|
$
|
(785,581
|
)
|
|
$
|
1,722,007
|
|
|
|
F-46
THE BON-TON
STORES, INC.
NOTES TO CONSOLIDATED FINANCIAL STATEMENTS
(In thousands except share and per share data)
The Bon-Ton
Stores, Inc.
Condensed Consolidating Balance Sheet
January 31, 2009
| |
|
|
|
|
|
|
|
|
|
|
|
|
|
|
|
|
|
|
|
|
|
|
|
|
|
|
|
Bon-Ton
|
|
|
|
|
|
|
|
|
|
|
|
|
|
|
|
|
|
|
|
(Parent
|
|
|
|
|
|
Guarantor
|
|
|
Non-Guarantor
|
|
|
Consolidating
|
|
|
Company
|
|
|
|
|
Company)
|
|
|
Issuer
|
|
|
Subsidiaries
|
|
|
Subsidiaries
|
|
|
Eliminations
|
|
|
Consolidated
|
|
|
|
|
|
|
|
Assets
|
|
|
|
|
|
|
|
|
|
|
|
|
|
|
|
|
|
|
|
|
|
|
|
|
|
Current assets:
|
|
|
|
|
|
|
|
|
|
|
|
|
|
|
|
|
|
|
|
|
|
|
|
|
|
Cash and cash equivalents
|
|
$
|
1
|
|
|
$
|
10,769
|
|
|
$
|
8,949
|
|
|
$
|
—
|
|
|
$
|
—
|
|
|
$
|
19,719
|
|
|
Merchandise inventories
|
|
|
—
|
|
|
|
329,808
|
|
|
|
336,273
|
|
|
|
—
|
|
|
|
—
|
|
|
|
666,081
|
|
|
Prepaid expenses and other current assets
|
|
|
—
|
|
|
|
91,644
|
|
|
|
21,797
|
|
|
|
606
|
|
|
|
(606
|
)
|
|
|
113,441
|
|
|
|
|
Total current assets
|
|
|
1
|
|
|
|
432,221
|
|
|
|
367,019
|
|
|
|
606
|
|
|
|
(606
|
)
|
|
|
799,241
|
|
|
|
|
Property, fixtures and equipment at cost, net
|
|
|
—
|
|
|
|
261,922
|
|
|
|
269,357
|
|
|
|
301,484
|
|
|
|
—
|
|
|
|
832,763
|
|
|
Deferred income taxes
|
|
|
—
|
|
|
|
5,214
|
|
|
|
4,780
|
|
|
|
—
|
|
|
|
—
|
|
|
|
9,994
|
|
|
Intangible assets, net
|
|
|
—
|
|
|
|
63,981
|
|
|
|
84,190
|
|
|
|
—
|
|
|
|
—
|
|
|
|
148,171
|
|
|
Investment in and advances to (from) affiliates
|
|
|
135,042
|
|
|
|
558,968
|
|
|
|
58,476
|
|
|
|
317
|
|
|
|
(752,803
|
)
|
|
|
—
|
|
|
Other long-term assets
|
|
|
—
|
|
|
|
19,729
|
|
|
|
6,714
|
|
|
|
4,709
|
|
|
|
—
|
|
|
|
31,152
|
|
|
|
|
Total assets
|
|
$
|
135,043
|
|
|
$
|
1,342,035
|
|
|
$
|
790,536
|
|
|
$
|
307,116
|
|
|
$
|
(753,409
|
)
|
|
$
|
1,821,321
|
|
|
|
|
Liabilities and Shareholders’ Equity
|
|
|
|
|
|
|
|
|
|
|
|
|
|
|
|
|
|
|
|
|
|
|
|
|
|
Current liabilities:
|
|
|
|
|
|
|
|
|
|
|
|
|
|
|
|
|
|
|
|
|
|
|
|
|
|
Accounts payable
|
|
$
|
—
|
|
|
$
|
143,423
|
|
|
$
|
—
|
|
|
$
|
—
|
|
|
$
|
—
|
|
|
$
|
143,423
|
|
|
Accrued payroll and benefits
|
|
|
—
|
|
|
|
24,676
|
|
|
|
11,440
|
|
|
|
—
|
|
|
|
—
|
|
|
|
36,116
|
|
|
Accrued expenses
|
|
|
866
|
|
|
|
93,342
|
|
|
|
84,921
|
|
|
|
1,416
|
|
|
|
(1,472
|
)
|
|
|
179,073
|
|
|
Current maturities of long-term debt and obligations under
capital leases
|
|
|
—
|
|
|
|
495
|
|
|
|
2,236
|
|
|
|
6,071
|
|
|
|
—
|
|
|
|
8,802
|
|
|
Deferred income taxes
|
|
|
—
|
|
|
|
2,548
|
|
|
|
4,780
|
|
|
|
—
|
|
|
|
—
|
|
|
|
7,328
|
|
|
Income taxes payable
|
|
|
—
|
|
|
|
16
|
|
|
|
46
|
|
|
|
—
|
|
|
|
—
|
|
|
|
62
|
|
|
|
|
Total current liabilities
|
|
|
866
|
|
|
|
264,500
|
|
|
|
103,423
|
|
|
|
7,487
|
|
|
|
(1,472
|
)
|
|
|
374,804
|
|
|
Long-term debt and obligations under capital leases, less
current maturities
|
|
|
—
|
|
|
|
839,020
|
|
|
|
57,358
|
|
|
|
252,390
|
|
|
|
—
|
|
|
|
1,148,768
|
|
|
Other long-term liabilities
|
|
|
—
|
|
|
|
123,351
|
|
|
|
39,032
|
|
|
|
1,189
|
|
|
|
—
|
|
|
|
163,572
|
|
|
|
|
Total liabilities
|
|
|
866
|
|
|
|
1,226,871
|
|
|
|
199,813
|
|
|
|
261,066
|
|
|
|
(1,472
|
)
|
|
|
1,687,144
|
|
|
|
|
Shareholders’ equity
|
|
|
134,177
|
|
|
|
115,164
|
|
|
|
590,723
|
|
|
|
46,050
|
|
|
|
(751,937
|
)
|
|
|
134,177
|
|
|
|
|
Total liabilities and shareholders’ equity
|
|
$
|
135,043
|
|
|
$
|
1,342,035
|
|
|
$
|
790,536
|
|
|
$
|
307,116
|
|
|
$
|
(753,409
|
)
|
|
$
|
1,821,321
|
|
|
|
F-47
THE BON-TON
STORES, INC.
NOTES TO CONSOLIDATED FINANCIAL STATEMENTS
(In thousands except share and per share data)
The Bon-Ton
Stores, Inc.
Condensed Consolidating Statement of Operations
2009
| |
|
|
|
|
|
|
|
|
|
|
|
|
|
|
|
|
|
|
|
|
|
|
|
|
|
|
|
Bon-Ton
|
|
|
|
|
|
|
|
|
|
|
|
|
|
|
|
|
|
|
|
(Parent
|
|
|
|
|
|
Guarantor
|
|
|
Non-Guarantor
|
|
|
Consolidating
|
|
|
Company
|
|
|
|
|
Company)
|
|
|
Issuer
|
|
|
Subsidiaries
|
|
|
Subsidiaries
|
|
|
Eliminations
|
|
|
Consolidated
|
|
|
|
|
|
|
|
Net sales
|
|
$
|
—
|
|
|
$
|
1,288,825
|
|
|
$
|
1,670,999
|
|
|
$
|
—
|
|
|
$
|
—
|
|
|
$
|
2,959,824
|
|
|
Other income
|
|
|
—
|
|
|
|
34,395
|
|
|
|
40,718
|
|
|
|
—
|
|
|
|
—
|
|
|
|
75,113
|
|
|
|
|
|
|
|
—
|
|
|
|
1,323,220
|
|
|
|
1,711,717
|
|
|
|
—
|
|
|
|
—
|
|
|
|
3,034,937
|
|
|
Costs and expenses:
|
|
|
|
|
|
|
|
|
|
|
|
|
|
|
|
|
|
|
|
|
|
|
|
|
|
Costs of merchandise sold
|
|
|
—
|
|
|
|
810,479
|
|
|
|
1,051,713
|
|
|
|
—
|
|
|
|
—
|
|
|
|
1,862,192
|
|
|
Selling, general and administrative
|
|
|
—
|
|
|
|
439,870
|
|
|
|
559,811
|
|
|
|
95
|
|
|
|
(36,137
|
)
|
|
|
963,639
|
|
|
Depreciation and amortization
|
|
|
—
|
|
|
|
45,021
|
|
|
|
54,984
|
|
|
|
11,630
|
|
|
|
—
|
|
|
|
111,635
|
|
|
Amortization of lease-related interests
|
|
|
—
|
|
|
|
2,805
|
|
|
|
2,061
|
|
|
|
—
|
|
|
|
—
|
|
|
|
4,866
|
|
|
Other impairment charges
|
|
|
—
|
|
|
|
1,359
|
|
|
|
4,524
|
|
|
|
—
|
|
|
|
—
|
|
|
|
5,883
|
|
|
|
|
Income (loss) from operations
|
|
|
—
|
|
|
|
23,686
|
|
|
|
38,624
|
|
|
|
(11,725
|
)
|
|
|
36,137
|
|
|
|
86,722
|
|
|
Other income (expense):
|
|
|
|
|
|
|
|
|
|
|
|
|
|
|
|
|
|
|
|
|
|
|
|
|
|
Intercompany rental and royalty income
|
|
|
—
|
|
|
|
—
|
|
|
|
7,749
|
|
|
|
28,388
|
|
|
|
(36,137
|
)
|
|
|
—
|
|
|
Equity in (losses) earnings of subsidiaries
|
|
|
(12,086
|
)
|
|
|
41,830
|
|
|
|
—
|
|
|
|
—
|
|
|
|
(29,744
|
)
|
|
|
—
|
|
|
Interest expense, net
|
|
|
—
|
|
|
|
(77,602
|
)
|
|
|
(4,460
|
)
|
|
|
(16,746
|
)
|
|
|
—
|
|
|
|
(98,808
|
)
|
|
|
|
(Loss) income before income taxes
|
|
|
(12,086
|
)
|
|
|
(12,086
|
)
|
|
|
41,913
|
|
|
|
(83
|
)
|
|
|
(29,744
|
)
|
|
|
(12,086
|
)
|
|
Income tax benefit
|
|
|
(8,031
|
)
|
|
|
(8,031
|
)
|
|
|
(55
|
)
|
|
|
—
|
|
|
|
8,086
|
|
|
|
(8,031
|
)
|
|
|
|
Net (loss) income
|
|
$
|
(4,055
|
)
|
|
$
|
(4,055
|
)
|
|
$
|
41,968
|
|
|
$
|
(83
|
)
|
|
$
|
(37,830
|
)
|
|
$
|
(4,055
|
)
|
|
|
F-48
THE BON-TON
STORES, INC.
NOTES TO CONSOLIDATED FINANCIAL STATEMENTS
(In thousands except share and per share data)
The Bon-Ton
Stores, Inc.
Condensed Consolidating Statement of Operations
2008
| |
|
|
|
|
|
|
|
|
|
|
|
|
|
|
|
|
|
|
|
|
|
|
|
|
|
|
|
Bon-Ton
|
|
|
|
|
|
|
|
|
|
|
|
|
|
|
|
|
|
|
|
(Parent
|
|
|
|
|
|
Guarantor
|
|
|
Non-Guarantor
|
|
|
Consolidating
|
|
|
Company
|
|
|
|
|
Company)
|
|
|
Issuer
|
|
|
Subsidiaries
|
|
|
Subsidiaries
|
|
|
Eliminations
|
|
|
Consolidated
|
|
|
|
|
|
|
|
Net sales
|
|
$
|
—
|
|
|
$
|
1,343,824
|
|
|
$
|
1,786,143
|
|
|
$
|
—
|
|
|
$
|
—
|
|
|
$
|
3,129,967
|
|
|
Other income
|
|
|
—
|
|
|
|
39,792
|
|
|
|
55,656
|
|
|
|
—
|
|
|
|
—
|
|
|
|
95,448
|
|
|
|
|
|
|
|
—
|
|
|
|
1,383,616
|
|
|
|
1,841,799
|
|
|
|
—
|
|
|
|
—
|
|
|
|
3,225,415
|
|
|
Costs and expenses:
|
|
|
|
|
|
|
|
|
|
|
|
|
|
|
|
|
|
|
|
|
|
|
|
|
|
Costs of merchandise sold
|
|
|
—
|
|
|
|
878,704
|
|
|
|
1,156,256
|
|
|
|
—
|
|
|
|
—
|
|
|
|
2,034,960
|
|
|
Selling, general and administrative
|
|
|
—
|
|
|
|
462,950
|
|
|
|
606,745
|
|
|
|
83
|
|
|
|
(36,253
|
)
|
|
|
1,033,525
|
|
|
Depreciation and amortization
|
|
|
—
|
|
|
|
44,717
|
|
|
|
60,917
|
|
|
|
11,748
|
|
|
|
—
|
|
|
|
117,382
|
|
|
Amortization of lease-related interests
|
|
|
—
|
|
|
|
2,858
|
|
|
|
2,008
|
|
|
|
—
|
|
|
|
—
|
|
|
|
4,866
|
|
|
Goodwill impairment
|
|
|
|
|
|
|
8,488
|
|
|
|
9,279
|
|
|
|
|
|
|
|
|
|
|
|
17,767
|
|
|
Other impairment charges
|
|
|
|
|
|
|
11,634
|
|
|
|
11,425
|
|
|
|
2,846
|
|
|
|
|
|
|
|
25,905
|
|
|
|
|
Loss from operations
|
|
|
—
|
|
|
|
(25,735
|
)
|
|
|
(4,831
|
)
|
|
|
(14,677
|
)
|
|
|
36,253
|
|
|
|
(8,990
|
)
|
|
Other income (expense):
|
|
|
|
|
|
|
|
|
|
|
|
|
|
|
|
|
|
|
|
|
|
|
|
|
|
Intercompany rental and royalty income
|
|
|
—
|
|
|
|
—
|
|
|
|
7,937
|
|
|
|
28,316
|
|
|
|
(36,253
|
)
|
|
|
—
|
|
|
Equity in losses of subsidiaries
|
|
|
(106,837
|
)
|
|
|
(6,956
|
)
|
|
|
—
|
|
|
|
—
|
|
|
|
113,793
|
|
|
|
—
|
|
|
Interest expense, net
|
|
|
—
|
|
|
|
(74,146
|
)
|
|
|
(6,566
|
)
|
|
|
(17,135
|
)
|
|
|
—
|
|
|
|
(97,847
|
)
|
|
|
|
Loss before income taxes
|
|
|
(106,837
|
)
|
|
|
(106,837
|
)
|
|
|
(3,460
|
)
|
|
|
(3,496
|
)
|
|
|
113,793
|
|
|
|
(106,837
|
)
|
|
Income tax provision
|
|
|
63,093
|
|
|
|
63,093
|
|
|
|
62,537
|
|
|
|
—
|
|
|
|
(125,630
|
)
|
|
|
63,093
|
|
|
|
|
Net loss
|
|
$
|
(169,930
|
)
|
|
$
|
(169,930
|
)
|
|
$
|
(65,997
|
)
|
|
$
|
(3,496
|
)
|
|
$
|
239,423
|
|
|
$
|
(169,930
|
)
|
|
|
F-49
THE BON-TON
STORES, INC.
NOTES TO CONSOLIDATED FINANCIAL STATEMENTS
(In thousands except share and per share data)
The Bon-Ton
Stores, Inc.
Condensed Consolidating Statement of Operations
2007
| |
|
|
|
|
|
|
|
|
|
|
|
|
|
|
|
|
|
|
|
|
|
|
|
|
|
|
|
Bon-Ton
|
|
|
|
|
|
|
|
|
|
|
|
|
|
|
|
|
|
|
|
(Parent
|
|
|
|
|
|
Guarantor
|
|
|
Non-Guarantor
|
|
|
Consolidating
|
|
|
Company
|
|
|
|
|
Company)
|
|
|
Issuer
|
|
|
Subsidiaries
|
|
|
Subsidiaries
|
|
|
Eliminations
|
|
|
Consolidated
|
|
|
|
|
|
|
|
Net sales
|
|
$
|
—
|
|
|
$
|
662,913
|
|
|
$
|
2,702,999
|
|
|
$
|
—
|
|
|
$
|
—
|
|
|
$
|
3,365,912
|
|
|
Other income
|
|
|
—
|
|
|
|
21,731
|
|
|
|
80,926
|
|
|
|
—
|
|
|
|
—
|
|
|
|
102,657
|
|
|
|
|
|
|
|
—
|
|
|
|
684,644
|
|
|
|
2,783,925
|
|
|
|
—
|
|
|
|
—
|
|
|
|
3,468,569
|
|
|
Costs and expenses:
|
|
|
|
|
|
|
|
|
|
|
|
|
|
|
|
|
|
|
|
|
|
|
|
|
|
Costs of merchandise sold
|
|
|
—
|
|
|
|
424,667
|
|
|
|
1,725,464
|
|
|
|
—
|
|
|
|
—
|
|
|
|
2,150,131
|
|
|
Selling, general and administrative
|
|
|
—
|
|
|
|
236,394
|
|
|
|
868,444
|
|
|
|
(597
|
)
|
|
|
(37,578
|
)
|
|
|
1,066,663
|
|
|
Depreciation and amortization
|
|
|
—
|
|
|
|
18,976
|
|
|
|
86,215
|
|
|
|
11,864
|
|
|
|
—
|
|
|
|
117,055
|
|
|
Amortization of lease-related interests
|
|
|
—
|
|
|
|
384
|
|
|
|
4,594
|
|
|
|
—
|
|
|
|
—
|
|
|
|
4,978
|
|
|
Other impairment charges
|
|
|
—
|
|
|
|
2,348
|
|
|
|
1,722
|
|
|
|
—
|
|
|
|
—
|
|
|
|
4,070
|
|
|
|
|
Income (loss) from operations
|
|
|
—
|
|
|
|
1,875
|
|
|
|
97,486
|
|
|
|
(11,267
|
)
|
|
|
37,578
|
|
|
|
125,672
|
|
|
Other income (expense):
|
|
|
|
|
|
|
|
|
|
|
|
|
|
|
|
|
|
|
|
|
|
|
|
|
|
Intercompany rental and royalty income
|
|
|
—
|
|
|
|
—
|
|
|
|
9,142
|
|
|
|
28,436
|
|
|
|
(37,578
|
)
|
|
|
—
|
|
|
Equity in earnings (losses) of subsidiaries
|
|
|
17,507
|
|
|
|
93,647
|
|
|
|
—
|
|
|
|
—
|
|
|
|
(111,154
|
)
|
|
|
—
|
|
|
Interest expense, net
|
|
|
—
|
|
|
|
(78,015
|
)
|
|
|
(11,572
|
)
|
|
|
(18,578
|
)
|
|
|
—
|
|
|
|
(108,165
|
)
|
|
|
|
Income (loss) before income taxes
|
|
|
17,507
|
|
|
|
17,507
|
|
|
|
95,056
|
|
|
|
(1,409
|
)
|
|
|
(111,154
|
)
|
|
|
17,507
|
|
|
Income tax provision
|
|
|
5,945
|
|
|
|
5,945
|
|
|
|
15,769
|
|
|
|
—
|
|
|
|
(21,714
|
)
|
|
|
5,945
|
|
|
|
|
Net income (loss)
|
|
$
|
11,562
|
|
|
$
|
11,562
|
|
|
$
|
79,287
|
|
|
$
|
(1,409
|
)
|
|
$
|
(89,440
|
)
|
|
$
|
11,562
|
|
|
|
F-50
THE BON-TON
STORES, INC.
NOTES TO CONSOLIDATED FINANCIAL STATEMENTS
(In thousands except share and per share data)
The Bon-Ton
Stores, Inc.
Condensed Consolidating Statement of Cash Flows
2009
| |
|
|
|
|
|
|
|
|
|
|
|
|
|
|
|
|
|
|
|
|
|
|
|
|
|
|
|
Bon-Ton
|
|
|
|
|
|
|
|
|
|
|
|
|
|
|
|
|
|
|
|
(Parent
|
|
|
|
|
|
Guarantor
|
|
|
Non-Guarantor
|
|
|
Consolidating
|
|
|
Company
|
|
|
|
|
Company)
|
|
|
Issuer
|
|
|
Subsidiaries
|
|
|
Subsidiaries
|
|
|
Eliminations
|
|
|
Consolidated
|
|
|
|
|
|
|
|
Cash flows from operating activities:
|
|
$
|
866
|
|
|
$
|
176,908
|
|
|
$
|
20,823
|
|
|
$
|
9,385
|
|
|
$
|
(13,948
|
)
|
|
$
|
194,034
|
|
|
|
|
Cash flows from investing activities:
|
|
|
|
|
|
|
|
|
|
|
|
|
|
|
|
|
|
|
|
|
|
|
|
|
|
Capital expenditures
|
|
|
—
|
|
|
|
(21,471
|
)
|
|
|
(10,875
|
)
|
|
|
—
|
|
|
|
—
|
|
|
|
(32,346
|
)
|
|
Intercompany investing activity
|
|
|
—
|
|
|
|
(1,982
|
)
|
|
|
—
|
|
|
|
—
|
|
|
|
1,982
|
|
|
|
—
|
|
|
Proceeds from sale of property, fixtures and equipment
|
|
|
—
|
|
|
|
25
|
|
|
|
85
|
|
|
|
—
|
|
|
|
—
|
|
|
|
110
|
|
|
|
|
Net cash used in investing activities
|
|
|
—
|
|
|
|
(23,428
|
)
|
|
|
(10,790
|
)
|
|
|
—
|
|
|
|
1,982
|
|
|
|
(32,236
|
)
|
|
|
|
Cash flows from financing activities:
|
|
|
|
|
|
|
|
|
|
|
|
|
|
|
|
|
|
|
|
|
|
|
|
|
|
Payments on long-term debt and capital lease obligations
|
|
|
—
|
|
|
|
(891,586
|
)
|
|
|
(2,236
|
)
|
|
|
(6,072
|
)
|
|
|
—
|
|
|
|
(899,894
|
)
|
|
Proceeds from issuance of long-term debt
|
|
|
—
|
|
|
|
765,051
|
|
|
|
—
|
|
|
|
—
|
|
|
|
—
|
|
|
|
765,051
|
|
|
Intercompany financing activity
|
|
|
—
|
|
|
|
(866
|
)
|
|
|
(7,787
|
)
|
|
|
(3,313
|
)
|
|
|
11,966
|
|
|
|
—
|
|
|
Cash dividends paid
|
|
|
(866
|
)
|
|
|
—
|
|
|
|
—
|
|
|
|
—
|
|
|
|
—
|
|
|
|
(866
|
)
|
|
Deferred financing costs paid
|
|
|
—
|
|
|
|
(24,013
|
)
|
|
|
—
|
|
|
|
—
|
|
|
|
—
|
|
|
|
(24,013
|
)
|
|
Decrease in bank overdraft balances
|
|
|
—
|
|
|
|
(2,873
|
)
|
|
|
—
|
|
|
|
—
|
|
|
|
—
|
|
|
|
(2,873
|
)
|
|
|
|
Net cash used in financing activities
|
|
|
(866
|
)
|
|
|
(154,287
|
)
|
|
|
(10,023
|
)
|
|
|
(9,385
|
)
|
|
|
11,966
|
|
|
|
(162,595
|
)
|
|
|
|
Net (decrease) increase in cash and cash equivalents
|
|
|
—
|
|
|
|
(807
|
)
|
|
|
10
|
|
|
|
—
|
|
|
|
—
|
|
|
|
(797
|
)
|
|
|
|
Cash and cash equivalents at beginning of period
|
|
|
1
|
|
|
|
10,769
|
|
|
|
8,949
|
|
|
|
—
|
|
|
|
—
|
|
|
|
19,719
|
|
|
|
|
Cash and cash equivalents at end of period
|
|
$
|
1
|
|
|
$
|
9,962
|
|
|
$
|
8,959
|
|
|
$
|
—
|
|
|
$
|
—
|
|
|
$
|
18,922
|
|
|
|
F-51
THE BON-TON
STORES, INC.
NOTES TO CONSOLIDATED FINANCIAL STATEMENTS
(In thousands except share and per share data)
The Bon-Ton
Stores, Inc.
Condensed Consolidating Statement of Cash Flows
2008
| |
|
|
|
|
|
|
|
|
|
|
|
|
|
|
|
|
|
|
|
|
|
|
|
|
|
|
|
Bon-Ton
|
|
|
|
|
|
|
|
|
|
|
|
|
|
|
|
|
|
|
|
(Parent
|
|
|
|
|
|
Guarantor
|
|
|
Non-Guarantor
|
|
|
Consolidating
|
|
|
Company
|
|
|
|
|
Company)
|
|
|
Issuer
|
|
|
Subsidiaries
|
|
|
Subsidiaries
|
|
|
Eliminations
|
|
|
Consolidated
|
|
|
|
|
|
|
|
Cash flows from operating activities:
|
|
$
|
2,600
|
|
|
$
|
48,507
|
|
|
$
|
49,149
|
|
|
$
|
10,586
|
|
|
$
|
(16,636
|
)
|
|
$
|
94,206
|
|
|
|
|
Cash flows from investing activities:
|
|
|
|
|
|
|
|
|
|
|
|
|
|
|
|
|
|
|
|
|
|
|
|
|
|
Capital expenditures
|
|
|
—
|
|
|
|
(43,350
|
)
|
|
|
(41,460
|
)
|
|
|
—
|
|
|
|
—
|
|
|
|
(84,810
|
)
|
|
Proceeds from sale of property, fixtures and equipment
|
|
|
—
|
|
|
|
275
|
|
|
|
73
|
|
|
|
—
|
|
|
|
—
|
|
|
|
348
|
|
|
|
|
Net cash used in investing activities
|
|
|
—
|
|
|
|
(43,075
|
)
|
|
|
(41,387
|
)
|
|
|
—
|
|
|
|
—
|
|
|
|
(84,462
|
)
|
|
|
|
Cash flows from financing activities:
|
|
|
|
|
|
|
|
|
|
|
|
|
|
|
|
|
|
|
|
|
|
|
|
|
|
Payments on long-term debt and capital lease obligations
|
|
|
—
|
|
|
|
(798,490
|
)
|
|
|
(1,798
|
)
|
|
|
(5,192
|
)
|
|
|
—
|
|
|
|
(805,480
|
)
|
|
Proceeds from issuance of long-term debt
|
|
|
—
|
|
|
|
807,467
|
|
|
|
—
|
|
|
|
—
|
|
|
|
—
|
|
|
|
807,467
|
|
|
Intercompany financing activity
|
|
|
—
|
|
|
|
(2,600
|
)
|
|
|
(8,648
|
)
|
|
|
(5,388
|
)
|
|
|
16,636
|
|
|
|
—
|
|
|
Cash dividends paid
|
|
|
(2,600
|
)
|
|
|
—
|
|
|
|
—
|
|
|
|
—
|
|
|
|
—
|
|
|
|
(2,600
|
)
|
|
Deferred financing costs paid
|
|
|
—
|
|
|
|
(262
|
)
|
|
|
—
|
|
|
|
(6
|
)
|
|
|
—
|
|
|
|
(268
|
)
|
|
Decrease in bank overdraft balances
|
|
|
—
|
|
|
|
(10,382
|
)
|
|
|
—
|
|
|
|
—
|
|
|
|
—
|
|
|
|
(10,382
|
)
|
|
|
|
Net cash used in financing activities
|
|
|
(2,600
|
)
|
|
|
(4,267
|
)
|
|
|
(10,446
|
)
|
|
|
(10,586
|
)
|
|
|
16,636
|
|
|
|
(11,263
|
)
|
|
|
|
Net increase (decrease) in cash and cash equivalents
|
|
|
—
|
|
|
|
1,165
|
|
|
|
(2,684
|
)
|
|
|
—
|
|
|
|
—
|
|
|
|
(1,519
|
)
|
|
|
|
Cash and cash equivalents at beginning of period
|
|
|
1
|
|
|
|
9,604
|
|
|
|
11,633
|
|
|
|
—
|
|
|
|
—
|
|
|
|
21,238
|
|
|
|
|
Cash and cash equivalents at end of period
|
|
$
|
1
|
|
|
$
|
10,769
|
|
|
$
|
8,949
|
|
|
$
|
—
|
|
|
$
|
—
|
|
|
$
|
19,719
|
|
|
|
F-52
THE BON-TON
STORES, INC.
NOTES TO CONSOLIDATED FINANCIAL STATEMENTS
(In thousands except share and per share data)
The Bon-Ton
Stores, Inc.
Condensed Consolidating Statement of Cash Flows
2007
| |
|
|
|
|
|
|
|
|
|
|
|
|
|
|
|
|
|
|
|
|
|
|
|
|
|
|
|
Bon-Ton
|
|
|
|
|
|
|
|
|
|
|
|
|
|
|
|
|
|
|
|
(Parent
|
|
|
|
|
|
Guarantor
|
|
|
Non-Guarantor
|
|
|
Consolidating
|
|
|
Company
|
|
|
|
|
Company)
|
|
|
Issuer
|
|
|
Subsidiaries
|
|
|
Subsidiaries
|
|
|
Eliminations
|
|
|
Consolidated
|
|
|
|
|
|
|
|
Cash flows from operating activities:
|
|
$
|
2,834
|
|
|
$
|
88,088
|
|
|
$
|
50,846
|
|
|
$
|
12,168
|
|
|
$
|
(18,372
|
)
|
|
$
|
135,564
|
|
|
|
|
Cash flows from investing activities:
|
|
|
|
|
|
|
|
|
|
|
|
|
|
|
|
|
|
|
|
|
|
|
|
|
|
Capital expenditures
|
|
|
—
|
|
|
|
(64,416
|
)
|
|
|
(45,243
|
)
|
|
|
—
|
|
|
|
—
|
|
|
|
(109,659
|
)
|
|
Acquisitions, net of cash acquired
|
|
|
—
|
|
|
|
(62
|
)
|
|
|
—
|
|
|
|
—
|
|
|
|
—
|
|
|
|
(62
|
)
|
|
Proceeds from sale of property, fixtures and equipment
|
|
|
—
|
|
|
|
259
|
|
|
|
53
|
|
|
|
2,495
|
|
|
|
—
|
|
|
|
2,807
|
|
|
|
|
Net cash (used in) provided by investing activities
|
|
|
—
|
|
|
|
(64,219
|
)
|
|
|
(45,190
|
)
|
|
|
2,495
|
|
|
|
—
|
|
|
|
(106,914
|
)
|
|
|
|
Cash flows from financing activities:
|
|
|
|
|
|
|
|
|
|
|
|
|
|
|
|
|
|
|
|
|
|
|
|
|
|
Payments on long-term debt and capital lease obligations
|
|
|
—
|
|
|
|
(882,987
|
)
|
|
|
(1,714
|
)
|
|
|
(8,772
|
)
|
|
|
—
|
|
|
|
(893,473
|
)
|
|
Proceeds from issuance of long-term debt
|
|
|
—
|
|
|
|
851,309
|
|
|
|
—
|
|
|
|
—
|
|
|
|
—
|
|
|
|
851,309
|
|
|
Intercompany financing activity
|
|
|
—
|
|
|
|
(2,834
|
)
|
|
|
(9,657
|
)
|
|
|
(5,881
|
)
|
|
|
18,372
|
|
|
|
—
|
|
|
Cash dividends paid
|
|
|
(3,438
|
)
|
|
|
—
|
|
|
|
—
|
|
|
|
—
|
|
|
|
—
|
|
|
|
(3,438
|
)
|
|
Proceeds from stock options exercised
|
|
|
604
|
|
|
|
—
|
|
|
|
—
|
|
|
|
—
|
|
|
|
—
|
|
|
|
604
|
|
|
Excess tax benefit from stock-based compensation
|
|
|
—
|
|
|
|
366
|
|
|
|
—
|
|
|
|
—
|
|
|
|
—
|
|
|
|
366
|
|
|
Deferred financing costs paid
|
|
|
—
|
|
|
|
(297
|
)
|
|
|
—
|
|
|
|
(10
|
)
|
|
|
—
|
|
|
|
(307
|
)
|
|
Increase in bank overdraft balances
|
|
|
—
|
|
|
|
12,794
|
|
|
|
—
|
|
|
|
—
|
|
|
|
—
|
|
|
|
12,794
|
|
|
|
|
Net cash used in financing activities
|
|
|
(2,834
|
)
|
|
|
(21,649
|
)
|
|
|
(11,371
|
)
|
|
|
(14,663
|
)
|
|
|
18,372
|
|
|
|
(32,145
|
)
|
|
|
|
Net increase (decrease) in cash and cash equivalents
|
|
|
—
|
|
|
|
2,220
|
|
|
|
(5,715
|
)
|
|
|
—
|
|
|
|
—
|
|
|
|
(3,495
|
)
|
|
|
|
Cash and cash equivalents at beginning of period
|
|
|
1
|
|
|
|
7,384
|
|
|
|
17,348
|
|
|
|
—
|
|
|
|
—
|
|
|
|
24,733
|
|
|
|
|
Cash and cash equivalents at end of period
|
|
$
|
1
|
|
|
$
|
9,604
|
|
|
$
|
11,633
|
|
|
$
|
—
|
|
|
$
|
—
|
|
|
$
|
21,238
|
|
|
|
|
|
|
19.
|
THIRD AMENDMENT
TO CREDIT CARD PROGRAM AGREEMENT
|
On August 4, 2009, the Company entered into a Third
Amendment to the Credit Card Program Agreement (the “Third
Amendment”) with HSBC, effective as of January 1,
2009. Under the agreement, which is in effect through
June 20, 2012, the Company continues to participate in the
revenue generated by credit sales. The Third Amendment defines
additional protection for the credit lines of certain of the
Company’s credit card customers, revises the compensation
the Company will
F-53
THE BON-TON
STORES, INC.
NOTES TO CONSOLIDATED FINANCIAL STATEMENTS
(In thousands except share and per share data)
receive for certain types of sales made on the credit cards and
provides that the Company and HSBC will share certain losses
associated with the credit card program. Either party may
terminate the Third Amendment between April 1, 2010 and
July 31, 2010 and revert back to the terms and conditions
of the agreement prior to the Third Amendment upon providing
notice and making a prescribed cash payment to the other party.
Pursuant to the terms of the Third Amendment, revenue received
under the credit card program agreement was reduced by $8,983 in
2009.
F-54
Schedule II:
VALUATION AND QUALIFYING ACCOUNTS
THE BON-TON STORES, INC. AND SUBSIDIARIES
| |
|
|
|
|
|
|
|
|
|
|
|
|
|
|
|
|
|
|
|
|
|
|
|
Balance at
|
|
|
Charged to
|
|
|
|
|
|
Balance at
|
|
|
|
|
|
|
|
Beginning
|
|
|
Costs &
|
|
|
|
|
|
End of
|
|
|
|
|
|
Classification
|
|
of Period
|
|
|
Expenses
|
|
|
Deductions
|
|
|
Period
|
|
|
|
|
|
|
|
|
|
|
Year ended February 2, 2008:
|
|
|
|
|
|
|
|
|
|
|
|
|
|
|
|
|
|
|
|
|
|
Accrual for sales returns
|
|
$
|
11,519,000
|
|
|
$
|
6,460,000
|
|
|
$
|
—
|
|
|
$
|
17,979,000
|
|
|
|
|
|
|
Accrual for purchase order violations reserve
|
|
$
|
1,332,000
|
|
|
$
|
3,338,000
|
|
|
$
|
(2,834,000
|
)
|
|
$
|
1,836,000
|
|
|
|
|
|
|
Year ended January 31, 2009:
|
|
|
|
|
|
|
|
|
|
|
|
|
|
|
|
|
|
|
|
|
|
Accrual for sales returns
|
|
$
|
17,979,000
|
|
|
$
|
333,000
|
|
|
$
|
—
|
|
|
$
|
18,312,000
|
|
|
|
|
|
|
Accrual for purchase order violations reserve
|
|
$
|
1,836,000
|
|
|
$
|
2,278,000
|
|
|
$
|
(2,515,000
|
)
|
|
$
|
1,599,000
|
|
|
|
|
|
|
Year ended January 30, 2010:
|
|
|
|
|
|
|
|
|
|
|
|
|
|
|
|
|
|
|
|
|
|
Accrual for sales returns
|
|
$
|
18,312,000
|
|
|
$
|
—
|
|
|
$
|
(10,000
|
)
|
|
$
|
18,302,000
|
|
|
|
|
|
|
Accrual for purchase order violations reserve
|
|
$
|
1,599,000
|
|
|
$
|
1,969,000
|
|
|
$
|
(2,206,000
|
)
|
|
$
|
1,362,000
|
|
|
|
|
|
F-55
EXHIBIT INDEX
| |
|
|
| Exhibit |
|
Description |
|
|
|
| |
10.8(b)
|
|
Amendment No. 1 to Supplemental Executive Retirement Plan |
10.17(e)
|
|
Exhibits and Schedules to the Credit Card Program Agreement |
10.19(e)
|
|
Exhibits and Schedules to the Amended and Restated Loan and Security Agreement among
Bank of America, N.A., The Bon-Ton Department Stores, Inc., The Elder-Beerman Stores Corp. and
the other credit parties and lender parties thereto |
10.20(b)
|
|
Exhibits and Schedules to Loan Agreement between Bonstores Realty One, LLP and Bank of
America, N.A. |
10.21(b)
|
|
Exhibits and Schedules to Loan Agreement between Bonstores Realty Two, LLP and Bank of
America, N.A. |
10.23(b)
|
|
Exhibits and Schedules to Second Lien Loan and Security Agreement among Sankaty
Advisors, LLC, The Bon-Ton Department Stores, Inc., The Elder-Beerman Stores Corp. and the
other credit parties and lender parties thereto |
21
|
|
Subsidiaries of the Registrant |
23
|
|
Consent of KPMG LLP |
31.1
|
|
Certification of Byron L. Bergren |
31.2
|
|
Certification of Keith E. Plowman |
32
|
|
Certification Pursuant to Rules 13a-14(b) and 15d-14(b) of the Securities Exchange Act of
1934 |