Attached files
| file | filename |
|---|---|
| 8-K - ZALE CORP. 8-K - ZALE CORP | a50390330.htm |
| EX-99.1 - EXHIBIT 99.1 - ZALE CORP | a50390330ex99_1.htm |
Exhibit 99.2
Fourth Quarter and Fiscal Year 2012 Earnings Call August 29, 2012 1
Forward‐Looking Statements and Use of Non‐GAAP Financial Measures This presentation contains forward‐looking statements, including statements regarding expected operating performance, interest expense, effective tax rate, future sales, expenses, margins, profitability, merchandising and marketing initiatives and industry growth forecasts. Forward‐looking statements are not guarantees of future performance and a variety of factors could cause the Company's actual results to differ materially from the results expressed in the forward‐looking statements. These factors include, but are not limited to: if the general economy continues to perform poorly, discretionary spending on goods that are, or are perceived to be, “luxuries” may decrease; the concentration of a substantial portion of the Company’s sales in three, relatively brief selling seasons means that the Company’s performance is more susceptible to disruptions; most of the Company’s sales are of products that include diamonds, precious metals and other commodities, and fluctuations in the availability and pricing of commodities could impact the Company’s ability to obtain and produce products at favorable prices; the Company’s sales are dependent upon mall traffic; the Company operates in a highly competitive industry; the financing market remains difficult, and if we are unable to meet the financial commitments in our current financing arrangements it will be difficult to replace or restructure these arrangements; and changes in regulatory requirements may increase the cost or adversely affect the Company’s operations and its ability to provide consumer credit and write credit insurance. For other factors, see the Company's filings with the Securities and Exchange Commission, including its Quarterly Report on Form 10‐Q for the fiscal quarter ended April 30, 2012. The Company disclaims any obligation to update or revise publicly or otherwise any forward‐looking statements to reflect subsequent events, new information or future circumstances, except as required by law. This presentation contains certain non‐GAAP measures as defined by SEC rules. One of these non‐GAAP measures is EBITDA, which is defined as earnings before interest, taxes, depreciation and amortization. second non‐measure is adjusted EBITDA, which is further adjusted to exclude charges related to store closures. We use these measurements as part of our evaluation of the performance of the Company. In addition, we believe these measures provide useful information to investors. Please refer to the appendix at the back of this presentation for a reconciliation of these non‐GAAP measures to the most comparable GAAP financial measures. 2
Q4 Fiscal Year 2012 Highlights Achieved strong revenue and comp performance Comparable store sales up 8.3%...follows a 9.8% rise in Q4 FY11 (1) Seven consecutive quarters of positive comps Accelerated progress towards profitability Gross margin improved 30 basis points Continued to leverage selling, general and administrative expense Operating margin improved 450 basis points Completed debt refinancing Confirmation from the financial marketplace of improvements made over past two years Reduced borrowing cost adds to momentum already established by the business Improved covenants and overall liquidity position (1) Comparable Store Sales exclude revenue recognized from warranties. The sales results of new stores are included beginning with the thirteenth full month of operations, and the sales results of closed stores are excluded from the calculation. 3
Fiscal Year 2012 Highlights Achieved strong revenue and comp performance Comparable store sales up 6.9%...follows an 8.1% rise in FY11 Reported full year operating earnings for the first time since fiscal year 2008 Improved merchandise assortment Successful and expansion of proprietary branded introduction collections…Vera Wang LOVE and Persona Significant growth continued in our bridal categories Expanded the omnichannel business model eCommerce sales up 16%; up 40% over past two years Introduced ship‐to‐store option in Q2 FY12…represented approximately 25% of web sales in the second half of FY12 Active social media presence…almost 750,000 Facebook followers; actively using Pinterest and Twitter to increase brand awareness 4
Strategic Focus for Fiscal Year 2013 Improve merchandise assortment Fine tune core assortment Expand proprietary branded collections in bridal and fashion Increase promotion / marketing effectiveness Grow brand momentum by reinforcing “The Diamond Store” Expand omnichannel capabilities Expand ship‐to‐store Increase social media reach through Facebook, Pinterest and Twitter Enhance organization effectiveness Invest in people and functions Focus on product training Implement additional process efficiencies 5
Q4 Fiscal Year 2012 Financial Highlights Revenues increased $30 million or 7 9% million, 7.9%, to $407 million Comparable store sales up 8.3% Gross margin increased $16 million to $210 million, up 30 bps to 51.6% SG&A expense of $208 million, or 51.0% of revenues, compared to $204 million, or 54.1% of revenues, in Q4 FY11 Operating loss of $8 million, or 1.9% of revenues, an improvement of $16 million, or 450 bps, compared to operating loss of $24 million in Q4 FY11 Q Loss from continuing operations of $20 million, or $0.61 per share, improved from prior year loss of $33 million, or $1.02 per share Warranty revenue recognition change: Increased revenue by $7.6 million Improved loss from continuing operations by $0.20 per share 6
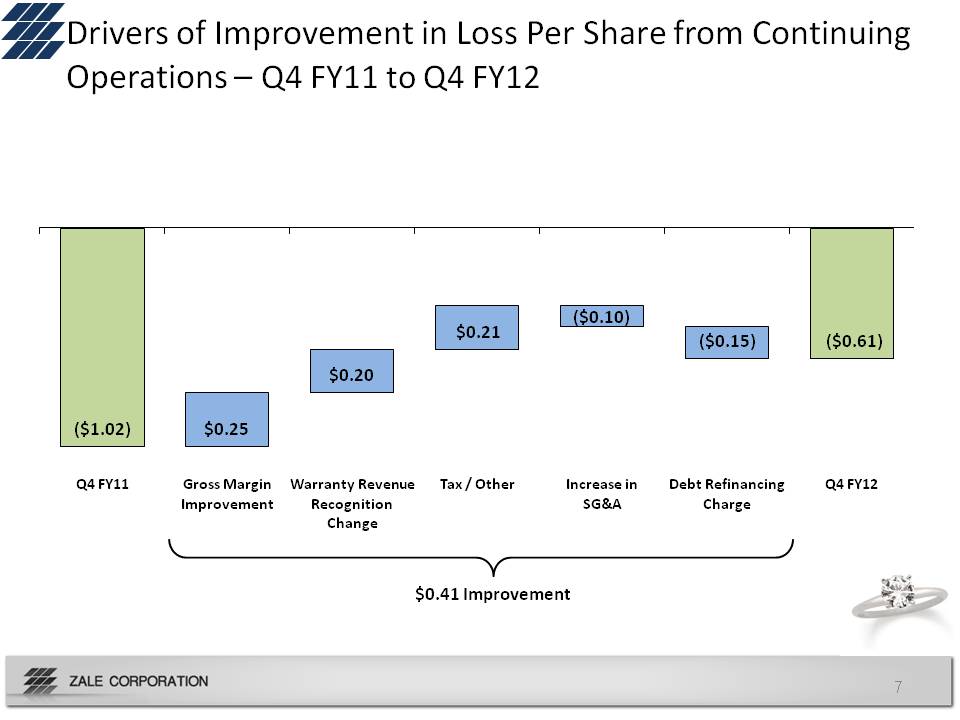
Drivers of Improvement in Loss Per Share from Continuing Operations – Q4 FY11 to Q4 FY12 ($1.02) $0.25 $0.20 $0.21 ($0.10) ($0.15) ($0.61) Q4 FY11 Gross Margin Improvement Warranty Revenue Recognition Change Tax / Other Increase in SG&A Debt Refinancing Charge Q4 FY12 $0.41 Improvement 7
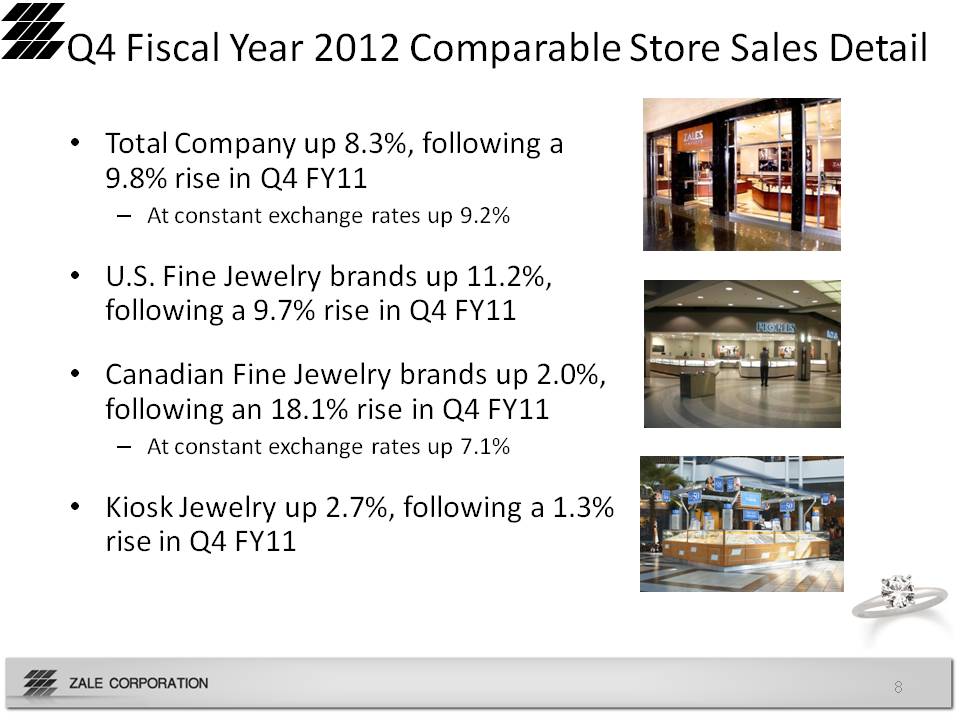
Q4 Fiscal Year 2012 Comparable Store Sales Detail Total Company up 8.3%, following a 9.8% rise in Q4 FY11 At constant exchange rates up 9.2% U.S. Fine Jewelry brands up 11.2%, following a 9.7% rise in Q4 FY11 Canadian Fine Jewelry brands up 2.0%, following an 18.1% rise in Q4 FY11 At constant exchange rates up 7.1% Kiosk Jewelry up 2.7%, following a 1.3% rise in Q4 FY11 8
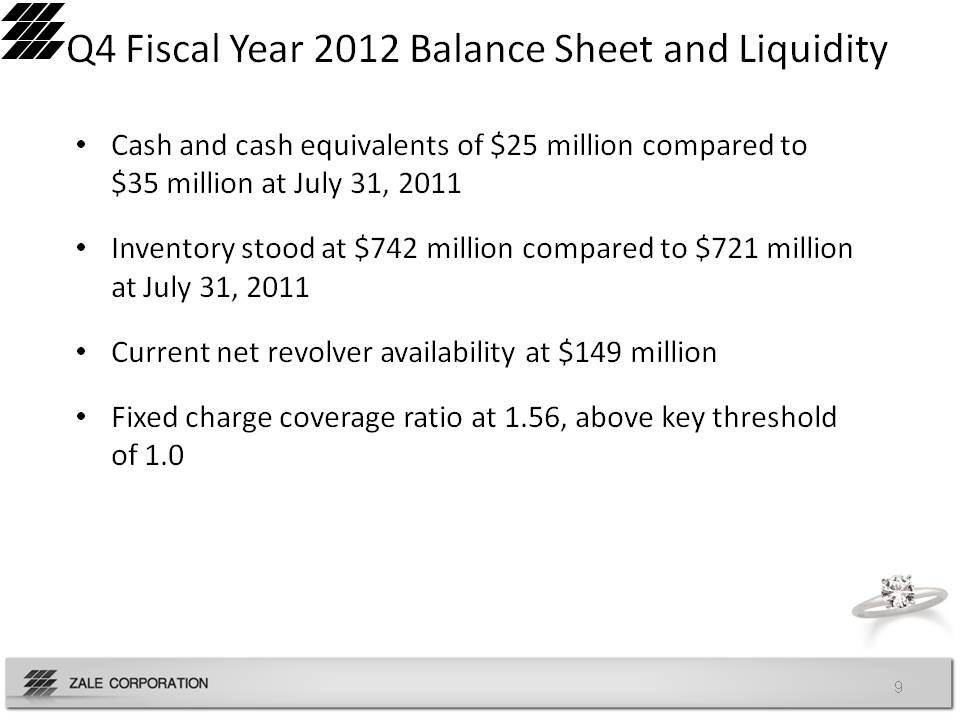
Q4 Fiscal Year 2012 Balance Sheet and Liquidity Cash and cash equivalents of $25 million compared to $35 million at July 31, 2011 Inventory stood at $742 million compared to $721 million at July 31, 2011 Current net revolver availability at $149 million Fixed charge coverage ratio at 1.56, above key threshold of 1.0 9
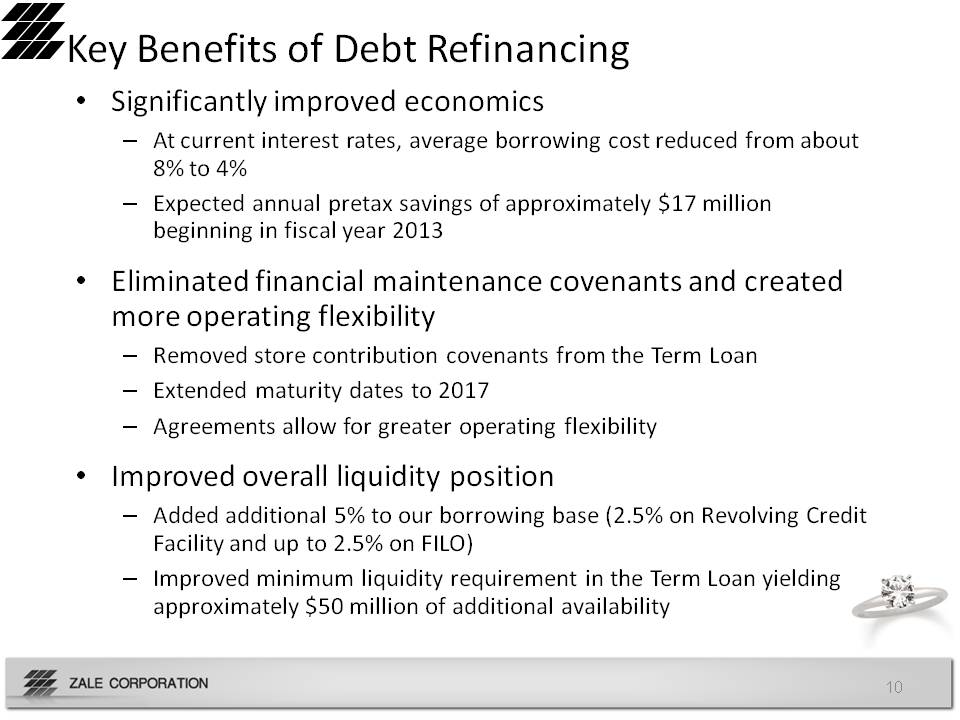
Key Benefits of Debt Refinancing Significantly improved economics At current interest rates, average borrowing cost reduced from about 8% to 4% Expected annual pretax savings of approximately $17 million beginning in fiscal year 2013 Eliminated financial maintenance covenants and created more operating flexibility Removed store contribution covenants from the Term Loan Extended maturity dates to 2017 Agreements allow for greater operating flexibility Improved overall liquidity position Added additional 5% to our borrowing base (2.5% on Revolving Credit Facility and up to 2.5% on FILO) Improved minimum liquidity requirement in the Term Loan yielding approximately $50 million of additional availability 10
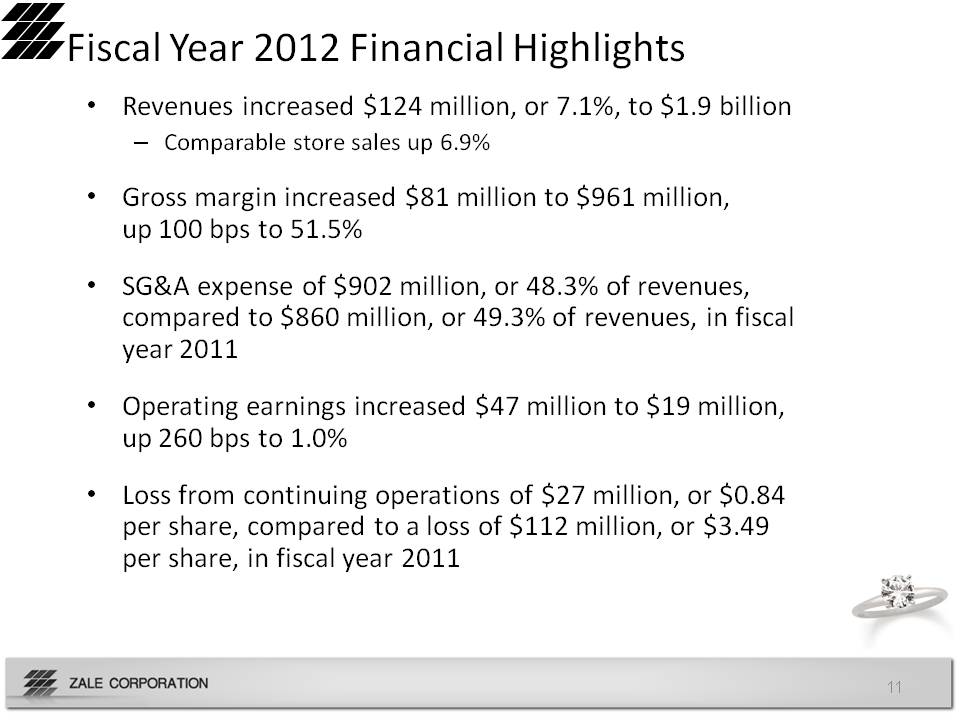
Fiscal Year 2012 Financial Highlights Revenues increased $124 million, or 7.1%, to $1.9 billion Comparable store sales up 6.9% Gross margin increased $81 million to $961 million, up 100 bps to 51.5% SG&A expense of $902 million, or 48.3% of revenues, compared to $860 million, or 49.3% of revenues, in fiscal year 2011 Operating earnings increased $47 million to $19 million, up 260 bps to 1.0% Loss from continuing operations of $27 million, or $0.84 per share, compared to a loss of $112 million, or $ 3.49 per share, in fiscal year 2011 11
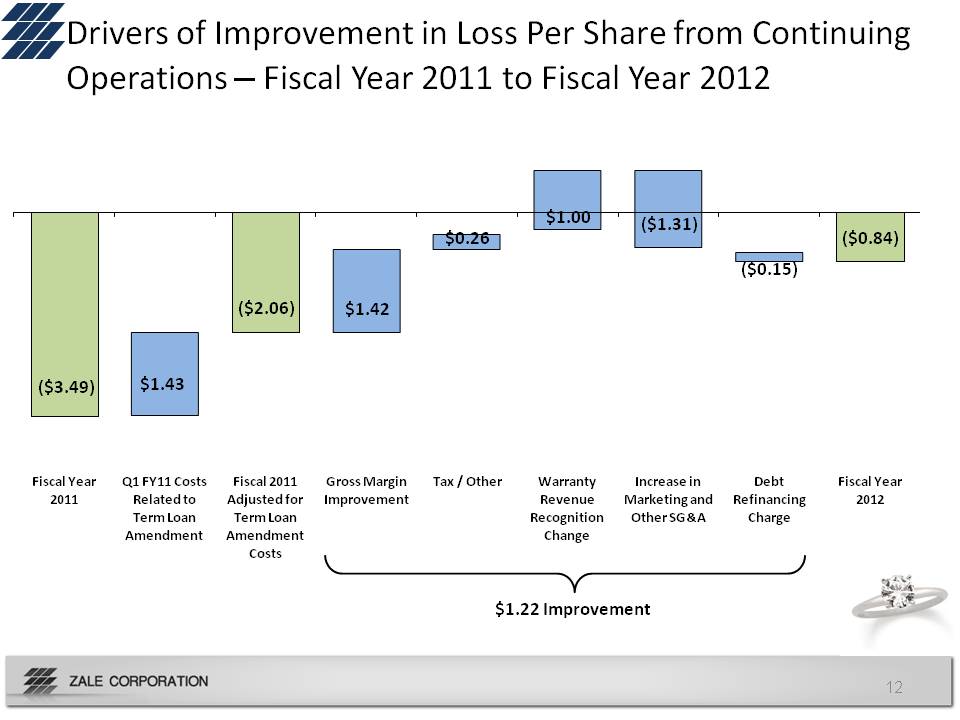
Drivers of Improvement in Loss Per Share from Continuing Operations – Fiscal Year 2011 to Fiscal Year 2012 ($3.49) $1.43 ($2.06) $1.42 $0.26 $1.00 ($1.31) ($0.15) ($0.84) Fiscal Year 2011 Q1 FY11 Costs Related to Term Loan Amendment Fiscal 2011 Adjusted for Term Loan Amendment Costs Gross Margin Improvement Tax / Other Warranty Revenue Recognition Change Increase in Marketing and Other SG&A Debt Refinancing Charge Fiscal Year 2012 $1.22 Improvement 12
Fiscal Year 2012 Comparable Store Sales Detail Total Company up 6.9%, following an 8.1% rise in the prior year At constant exchange rates up 7.1% U.S. Fine Jewelry brands up 9.5%, following a 7.7% rise in the prior year Canadian Fine Jewelry brands up 2.9%, following a 13.5% rise in the prior year At constant exchange rates up 4.5%, following a rise of 7.5% in the prior year Kiosk Jewelry down 1.0%, following a 3.6% rise in the prior year 13
Fiscal Year 2013…Path to Profitability Operating performance Macroeconomic conditions continue to be uncertain…we are taking a cautionary view Expect to continue driving positive comps Number of store closures in line with fiscal year 2012 Gross margin rate consistent with fiscal year 2012 Expect to achieve leverage on SG&A based on top line growth, while making selective investments in the business We expect to achieve positive net earnings for fiscal year 2013 Interest expense Based on debt refinancing, expect to be approximately $23 to $25 million Income tax expense Overall effective tax rate estimated at ~15% Assumes valuation allowance release to the extent NOL’s used to offset tax on 2013 income 14
Appendix 15
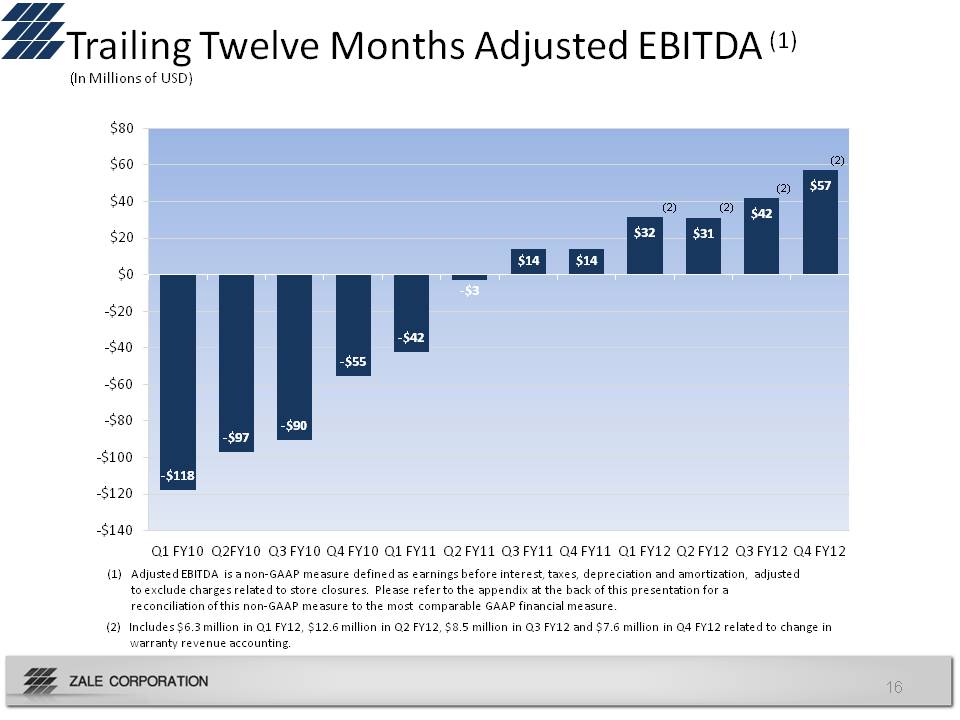
Trailing Twelve Months Adjusted EBITDA (1) (In Millions of USD) ($ in Millions) $80 $60 $40 $20 $0 -$20 -$40 -$60 -$80 -$100 -$120 -$140 -$118 -$97 -$90 -$55 -$42 -$3 $14 $14 $32(2) $31(2) $42(2) $57(2) Q1 FY10 Q2FY10 Q3 FY10 Q4 FY10 Q1 FY11 Q2 FY11 Q3 FY11 Q4 FY11 Q1 FY12 Q2 FY12 Q3 FY12 Q4 FY12 (1) Adjusted EBITDA is a non‐GAAP measure defined as earnings before interest, taxes, depreciation and amortization, adjusted to exclude charges related to store closures. Please refer to the appendix at the back of this presentation for a reconciliation of this non‐GAAP measure to the most comparable GAAP financial measure. (2) Includes $6.3 million in Q1 FY12, $12.6 million in Q2 FY12, $8.5 million in Q3 FY12 and $7.6 million in Q4 FY12 related to change in warranty revenue accounting. 16

Reconciliation of Trailing Twelve Months Loss from Continuing Operations to Adjusted EBITDA ($ in Millions) ZALE CORPORATION AND SUBSIDIARIES (In thousands) For the Twelve Months Ended October 31, 2009 January 31, 2010 April 30, 2010 July 31, 2010 October 31, 2010 January 31, 2011 April 30, 2011 July 31, 2011 October 31, 2011 January 31, 2012 April 30, 2012 July 31, 2012 Loss from continuing operations $ (177,677) $ (138,730) $ (133,816) $ (95,790) $ (133,230) $ (112,659) $ (107,956) $ (112,042) $ (46,609) $ (45,421) $ (39,933) $ (26,896) Interest expense 8,849 7,666 7,691 15,657 69,056 76,466 83,165 82,619 37,228 38,197 39,321 44,649 Income tax (benefit) expense (33,236) (52,192) (47,618) (28,750) (30,075) (11,647) (3,761) 1,557 980 (1,592) 3,437 1,365 Depreciation and amortization 57,209 55,433 52,573 50,005 47,364 44,753 42,933 41,327 40,493 39,229 38,731 37,887 EBITDA (144,855) (127,823) (121,170) (58,878) (46,885) (3,087) 14,381 13,461 32,092 30,413 41,556 57,005 Store closure adjustments 27,047 30,743 30,743 3,426 4,546 46 (219) 285 (337) 609 499 222 Adjusted EBITDA $ (117,808) $ (97,080) $ (90,427) $ (55,452) $ (42,339) $ (3,041) $ 14,162 $ 13,746 $ 31,755 $ 31,022 $ 42,055 $ 57,227 17
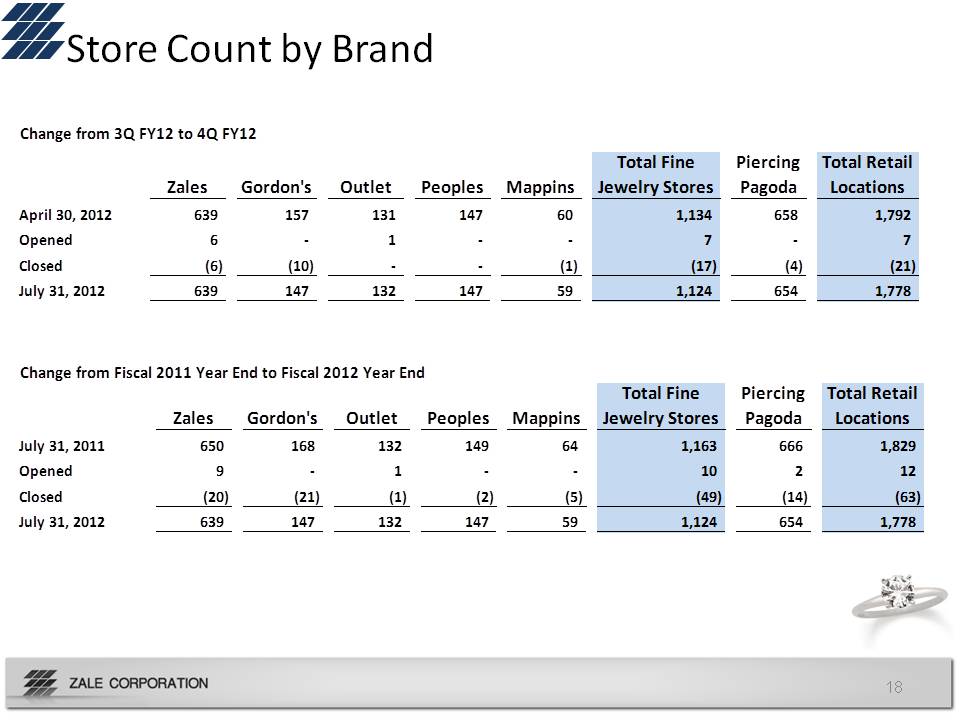
Store Count by Brand Change from 3Q FY12 to 4Q FY12 Zales Gordon's Outlet Peoples Mappins Total Fine Jewelry Stores Piercing Pagoda Total Retail Locations April 30, 2012 639 157 131 147 60 1,134 658 1,792 Opened 6 ‐ 1 ‐ ‐ 7 ‐ 7 Closed (6) (10) ‐ ‐ (1) (17) (4) (21) July 31, 2012 639 147 132 147 59 1,124 654 1,778 Change from Fiscal 2011 Year End to Fiscal 2012 Year End Zales Gordon's Outlet Peoples Mappins Total Fine Jewelry Stores Piercing Pagoda Total Retail Locations July 31, 2011 650 168 132 149 64 1,163 666 1,829 Opened 9 ‐ 1 ‐ ‐ 10 2 12 Closed (20) (21) (1) (2) (5) (49) (14) (63) July 31, 2012 639 147 132 147 59 1,124 654 1,778 18