Attached files
| file | filename |
|---|---|
| 8-K - KINGSTONE 8-K RE: 2ND QTR RESULTS - KINGSTONE COMPANIES, INC. | form8k.htm |
|
|
Kingstone Companies, Inc.
1154 Broadway
Hewlett, NY 11557
Phone: (516) 374-7600
Fax: (516) 295-7216
www.kingstonecompanies.com
Contact: Barry Goldstein, CEO
|
News Release
Kingstone Companies Announces Year to Date and Second Quarter Results
Book Value per Share Reaches $4.45
Board Increases Quarterly Dividend by 33% to $.04/Share
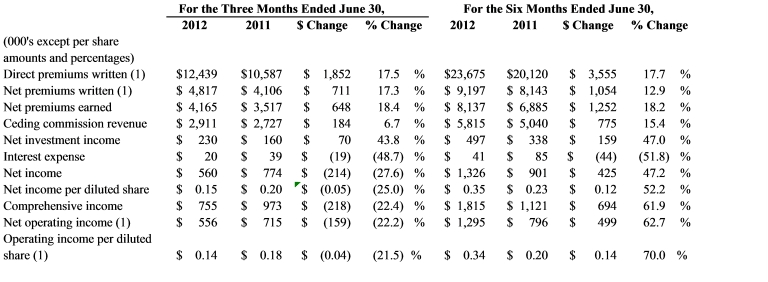
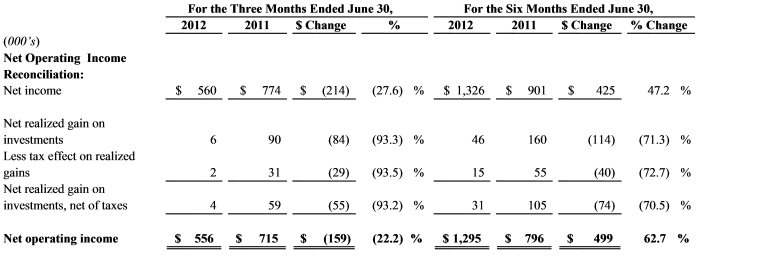
Hewlett, New York—August 14, 2012--Kingstone Companies, Inc. (NASDAQ: KINS) reported its results for the period ended June 30, 2012. Year to date net income was $1.32 million, or $.35 per share, up from the $.90 million and $.23 per share earned during the comparable period in 2011. Second quarter net income was $560,000, or $.15 per share, as compared to $774,000 and $.20 per share in the second quarter of 2011. Net operating income1 for the six months ended June 30, 2012 was $1,295,000, or $.34 per share, as compared to $796,000 and $.20 per share generated during the comparable period in 2011. Second quarter net operating income was $556,000 and $.14 per share, while second quarter 2011 amounts were $715,000 and $.18 per share
The Company also announced that its board declared an increased quarterly dividend of $.04 per share payable on September 18, 2012 to shareholders of record at the close of business on August 31, 2012. This marks the fifth consecutive quarter of dividend distributions and an increase of 33% from the $.03 per share dividends previously declared.
_____________
1This measure is not based on U.S. generally accepted accounting principles (“GAAP”) and is defined and reconciled to the most directly comparable GAAP measure in “Information Regarding Non-GAAP Measures.”
Operating Highlights
|
·
|
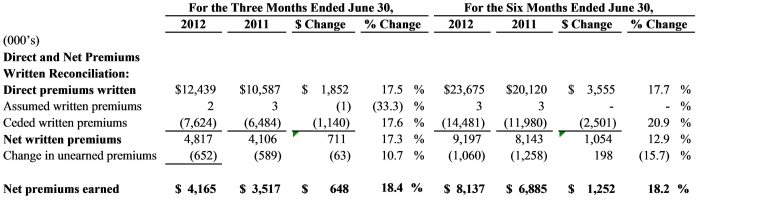
Direct premiums written in the second quarter 2012 were up by 17.5% over the second quarter of 2011. For the six months ended June 30 2012, direct premiums written increased 17.7% over the prior year’s amount.
|
|
·
|
Net premiums written in the second quarter were up 17.3% over 2011. Year to date the increase was 12.9%.
|
|
·
|
Net premiums earned in the second quarter were up by 18.4% over 2011. Year to date the increase was 18.2%.
|
|
·
|
Ceding commission revenue earned in the second quarter increased by 6.7% over 2011. Year to date the increase was 15.4%
|
|
·
|
Q2 net loss ratio was 57.8% as compared to 51.9% in Q2 2011.
|
|
·
|
Q2 combined ratio was 76.2% as compared to 63.5% in Q2 2011.
|
Financial Highlights
____________________
1These measures are not based on GAAP and are defined and reconciled to the most directly comparable GAAP measures in “Information Regarding Non-GAAP Measures.”
Management Commentary
Barry Goldstein, Kingstone’s Chairman and CEO, stated “The second quarter was another excellent one for KICO. We continue on a solid growth path and continue to manage our risk profile in a conservative and prudent manner.
Homeowners and dwelling fire products as well as small commercial liability policies lead the way in our growth. Most of the national carriers have avoided writing new homeowners policies in downstate New York, perhaps due to the sheer size of the book they already have in force. This has allowed KICO and its Selected Producers to grow. Most of the bigger carriers shy away from the smaller premiums and heightened customer service that accompany Artisans (small contractors) policies. With our hands-on old school way of doing business, we are happy to make this product available to our Selected Producers. We maintain underwriting guidelines designed to eliminate those risks that will not lead to a long term profitable relationship. We have expanded our writings into Western and Central New York as well as beginning our expansion into Pennsylvania. We expect the growth in these regions to be slow and steady.
On a year to date basis, our results are excellent, with our loss ratio at 57.6% and our combined ratio at 73.3%. Losses from fires during the second quarter were elevated over the prior quarter and prior year’s second quarter. Other than losses from hurricanes, losses from fire are the major risk we encounter. The timing of fires surely cannot be gauged, but, with over 20,000 insured residences, our risk and frequency over time should be similar to that experienced by other carriers. The loss ratio and combined ratio for the second quarter were 57.8% and 76.2%, respectively, up from the 51.9% and 63.5%, respectively, experienced in the second quarter of 2011.
Net premiums earned in the second quarter were up by 18.4% over the comparable period in 2011. Year to date growth in net premiums earned was 18.2%. Ceding commission revenue, earned on our quota share treaties, totaled $2.911 million in Q2 and $5.815 million year to date. These are up by 6.7% and 15.4% for the three and six month periods, respectively, as compared to 2011. It should be noted that the increased losses experienced in Q2 resulted in a diminished ceding commission percentage.
We continued and strengthened our quota share reinsurance programs at July 1st. Our Personal Lines treaty, covering the period July 1, 2012-June 30, 2013, continues to have us cede 75% of our written premium in exchange for a ceding commission structure that compensates us on a sliding scale based on loss ratio. We enjoy an excellent relationship with our reinsurance partners on this treaty, and in fact the four carriers that participate in our Personal Lines treaty remain unchanged over the past five years. We also continued our Commercial Lines quota share treaty, but elected to reduce the ceded portion of written premiums from 60% to 40%. Based on our experience, we opted to retain more of the risk from these policies. This will lead to higher net written and higher net earned premiums as we move forward. We maintain a conservative risk profile; our risk for any single loss has been structured through Excess of Loss reinsurance to keep our maximum loss per occurrence to less than 2% of our capital, except for catastrophes (generally hurricanes) where our retention is $750,000. Our catastrophe coverage has been expanded to a total of $73,000,000, up 35% from last year’s $54,000,000. We decided to increase our total coverage, to an amount well above last year’s total and significantly greater than the amount that matched our growth. While catastrophe coverage is quite expensive, our management decided, and our board agreed, that it is appropriate to protect our policyholders and shareholders as best as we reasonably can.”
Victor Brodsky, Kingstone’s CFO, added “As our staff and selected producers work hard to increase our policies in force and premiums written, our constant vigilance over containing underwriting expenses has resulted in them increasing at a lower rate than the growth rate of our premium writings. We ended Q2 with a book value per share of $4.45, up from $4.07 at year end 2011. This represents an annual growth rate of 18.7%.
Information Regarding Non-GAAP Measures
Direct premiums written - represents the total premiums charged on policies issued by the Company during the fiscal period in question.
Net premiums written - represents direct premiums written less premiums ceded to reinsurers.
Net operating income - is net income exclusive of realized investment gains, net of tax. Net income is the GAAP measure most closely comparable to net operating income. Management uses net operating income, along with other measures, to gauge the Company’s performance and evaluate results, which can be skewed when including realized investment gains, which may vary significantly between periods. Net operating income is provided as supplemental information, is not a substitute for net income and does not reflect the Company’s overall profitability.
# # #
Forward Looking Statements
Statements in this press release may contain “forward-looking statements” within the meaning of the Private Securities Litigation Reform Act of 1995. All statements, other than statements of historical facts, may be forward-looking statements. These statements are based on management’s current expectations and are subject to uncertainty and changes in circumstances. These statements involve risks and uncertainties that could cause actual results to differ materially from those included in forward-looking statements due to a variety of factors. More information about these factors can be found in Kingstone’s filings with the Securities and Exchange Commission, including its latest Annual Report filed with the Securities and Exchange Commission on Form 10-K. Kingstone undertakes no obligation to publicly update or revise any forward-looking statements, whether as a result of new information, future events or otherwise.