Attached files
| file | filename |
|---|---|
| EX-23 - CONSENT - KINGSTONE COMPANIES, INC. | kins_ex23.htm |
| EX-32 - CERTIFICATION - KINGSTONE COMPANIES, INC. | kins_ex32.htm |
| EX-31.B - CERTIFICATION - KINGSTONE COMPANIES, INC. | kins_ex31b.htm |
| EX-31.A - CERTIFICATION - KINGSTONE COMPANIES, INC. | kins_ex31a.htm |
United States Securities and Exchange Commission
Washington, D.C. 20549
FORM 10-K
(Mark One)
|
(x)
|
ANNUAL REPORT UNDER SECTION 13 OR 15(d) OF THE SECURITIES EXCHANGE ACT OF 1934
|
|
FOR THE FISCAL YEAR ENDED DECEMBER 31, 2015
|
|
( )
|
TRANSITION REPORT PURSUANT TO SECTION 13 OR 15(d) OF THE SECURITIES EXCHANGE ACT OF 1934
|
|
FOR THE TRANSITION PERIOD FROM TO
|
|
Commission File Number 0-1665
|
KINGSTONE COMPANIES, INC.
(Exact name of registrant as specified in its charter)
|
Delaware
|
36-2476480
|
|
(State or other jurisdiction of incorporation or organization)
|
(I.R.S. Employer Identification No.)
|
|
15 Joys Lane, Kingston, New York
|
12401
|
|
(Address of principal executive offices)
|
(Zip Code)
|
|
(845) 802-7900
|
|
(Registrant’s telephone number, including area code)
|
Securities registered pursuant to Section 12(b) of the Act:
|
Title of each class
|
Name of each exchange on which registered
|
|
Common Stock
|
NASDAQ
|
Securities registered pursuant to Section 12(g) of the Act:
None
Indicate by check mark if the registrant is a well-known seasoned issuer, as defined in Rule 405 of the Securities Act. Yes __ No X
Indicate by check mark if the registrant is not required to file reports pursuant to Section 13 or Section 15(d) of the Exchange Act. Yes __ No X
Indicate by check mark whether the registrant (1) has filed all reports required to be filed by Section 13 or 15(d) of the Securities Exchange Act of 1934 during the preceding 12 months (or for such shorter period that the registrant was required to file such reports), and (2) has been subject to such filing requirements for the past 90 days. Yes X No __
Indicate by check mark whether the registrant has submitted electronically and posted on its corporate Web site, if any, every Interactive Data File required to be submitted and posted pursuant to Rule 405 of Regulation S-T during the preceding 12 months (or for such shorter period that the registrant was required to submit and post such files). Yes X No __
Indicate by check mark if disclosure of delinquent filers pursuant to Item 405 of Regulation S-K is not contained herein, and will not be contained, to the best of registrant’s knowledge, in definitive proxy or information statements incorporated by reference in Part III of this Form 10-K or any amendment to this Form 10-K. X
Indicate by check mark whether the registrant is a large accelerated filer, an accelerated filer, a non-accelerated filer, or a smaller reporting company. See the definitions of “large accelerated filer,” “accelerated filer”” and “smaller reporting company” in Rule 12b-2 of the Exchange Act. (Check one):
|
Large accelerated filer __
|
Accelerated filer __
|
|
Non-accelerated __ (Do not check if a smaller reporting company)
|
Smaller reporting company X
|
Indicate by check mark whether the registrant is a shell company (as defined in Rule 12b-2 of the Exchange Act). Yes __ No X
As of June 30, 2015, the aggregate market value of the registrant’s common stock held by non-affiliates of the registrant was $42,754,324 based on the closing sale price as reported on the NASDAQ Capital Market. As of March 22, 2016, there were 7,321,637 shares of common stock outstanding.
DOCUMENTS INCORPORATED BY REFERENCE
None
INDEX
|
Page No.
|
|||
|
Forward-Looking Statements
|
2
|
||
|
PART I
|
|||
|
Item 1.
|
Business.
|
3
|
|
|
Item 1A.
|
Risk Factors.
|
21
|
|
|
Item 1B.
|
Unresolved Staff Comments.
|
22
|
|
|
Item 2.
|
Properties.
|
22
|
|
|
Item 3.
|
Legal Proceedings.
|
22
|
|
|
Item 4.
|
Mine Safety Disclosures.
|
22
|
|
|
PART II
|
|||
|
Item 5.
|
Market for Registrant’s Common Equity, Related Stockholder Matters and Issuer Purchases of Equity Securities.
|
23
|
|
|
Item 6.
|
Selected Financial Data.
|
24
|
|
|
Item 7.
|
Management’s Discussion and Analysis of Financial Condition and Results of Operations.
|
24
|
|
|
Item 7A.
|
Quantitative and Qualitative Disclosures About Market Risk.
|
61
|
|
|
Item 8.
|
Financial Statements and Supplementary Data.
|
61
|
|
|
Item 9.
|
Changes in and Disagreements With Accountants on Accounting and Financial Disclosure.
|
61
|
|
|
Item 9A.
|
Controls and Procedures.
|
61
|
|
|
Item 9B.
|
Other Information.
|
62
|
|
|
PART III
|
|||
|
Item 10.
|
Directors, Executive Officers and Corporate Governance.
|
63
|
|
|
Item 11.
|
Executive Compensation.
|
67
|
|
|
Item 12.
|
Security Ownership of Certain Beneficial Owners and Management and Related Stockholder Matters.
|
70
|
|
|
Item 13.
|
Certain Relationships and Related Transactions, and Director Independence.
|
73
|
|
|
Item 14.
|
Principal Accountant Fees and Services.
|
73
|
|
|
PART IV
|
|||
|
Item 15.
|
Exhibits and Financial Statement Schedules.
|
75
|
|
|
Signatures
|
78
|
||
PART I
Forward-Looking Statements
This Annual Report contains forward-looking statements as that term is defined in the federal securities laws. The events described in forward-looking statements contained in this Annual Report may not occur. Generally these statements relate to business plans or strategies, projected or anticipated benefits or other consequences of our plans or strategies, projected or anticipated benefits from acquisitions to be made by us, or projections involving anticipated revenues, earnings or other aspects of our operating results. The words “may,” “will,” “expect,” “believe,” “anticipate,” “project,” “plan,” “intend,” “estimate,” and “continue,” and their opposites and similar expressions are intended to identify forward-looking statements. We caution you that these statements are not guarantees of future performance or events and are subject to a number of uncertainties, risks and other influences, many of which are beyond our control, that may influence the accuracy of the statements and the projections upon which the statements are based. Factors which may affect our results include, but are not limited to, the risks and uncertainties discussed in Item 7 of this Annual Report under “Factors That May Affect Future Results and Financial Condition”.
Any one or more of these uncertainties, risks and other influences could materially affect our results of operations and whether forward-looking statements made by us ultimately prove to be accurate. Our actual results, performance and achievements could differ materially from those expressed or implied in these forward-looking statements. We undertake no obligation to publicly update or revise any forward-looking statements, whether from new information, future events or otherwise.
2
ITEM 1. BUSINESS.
(a) Business Development
General
As used in this Annual Report on Form 10-K (the “Annual Report”), references to the “Company”, “we”, “us”, or “our” refer to Kingstone Companies, Inc. (“Kingstone”) and its subsidiaries.
We offer property and casualty insurance products to small businesses and individuals in New York State through our wholly owned subsidiary, Kingstone Insurance Company (“KICO”). KICO is a licensed property and casualty insurance company in New York, New Jersey, Connecticut, Pennsylvania and Texas; however, KICO writes substantially all of its business in New York. Payments, Inc., our wholly owned subsidiary, is a licensed premium finance company in the State of New York and through March 31, 2015, received fees for placing contracts with a third party licensed premium finance company.
Recent Developments
Developments During 2015
● Reduced Reliance on Quota Share Reinsurance
Effective July 1, 2015, KICO reduced the ceding percentage for its personal lines quota share reinsurance treaty from 55% gross quota share to 40% net quota share. The reduction of the ceding percentage allows KICO to retain a higher portion of its premiums.
· Implemented Electronic Content Management and Workflow System
In July 2015, KICO implemented Vertafore’s ImageRight® software, an insurance industry leading electronic content management and workflow system. The new software enhancement has streamlined underwriting and claims processes, allowing for greater efficiency and increased production to support KICO’s continued growth.
· Expanded Licensing to Additional States
In 2015, KICO expanded its ability to write property and casualty insurance by obtaining licenses to write insurance policies in New Jersey, Connecticut and Texas.
· A.M. Best Rating
In 2015, the A.M. Best rating for KICO was upgraded from B+ (Good) to B++ (Good).
· Increased Rate of Dividends Declared
In November 2015, we increased the quarterly dividends on our common stock from $.05 per share to $.0625 per share.
Dividends of $.05 per share were declared on each of February 6, 2015, May 12, 2015 and August 11, 2015 and were paid on March 13, 2015 and June 15, 2015 and September 14, 2015, respectively. A dividend of $.0625 per share was declared on November 10, 2015 and was paid on December 14, 2015.
3
Developments During 2014
· Reduced Reliance on Quota Share Reinsurance
In May 2014, KICO notified its personal lines reinsurers of its election to reduce the ceding percentage for its personal lines quota share reinsurance treaty from 75% to 55% effective July 1, 2014. It was this ability of KICO to retain a higher portion of its premiums that was a prime factor in proceeding with the December 2013 underwritten public offering.
Effective July 1, 2014, KICO non-renewed its commercial lines reinsurance treaty (excluding commercial auto), which consists of small business and artisans risks. KICO had previously ceded 25% of commercial lines written premiums to quota share reinsurers.
· Increased Rate of Dividends Declared
In August 2014, we increased the quarterly dividends on our common stock from $.04 per share to $.05 per share.
Dividends of $.04 per share were declared on each of February 19, 2014 and May 13, 2014 and were paid on March 14, 2014 and June 13, 2014, respectively. Dividends of $.05 per share were declared on each of August 12, 2014 and November 12, 2014 and were paid on September 15, 2014 and December 12, 2014, respectively.
4
|
(b)
|
Business
|
Property and Casualty Insurance
Overview
Generally, property and casualty insurance companies write insurance policies in exchange for premiums paid by their customers (the “insureds”). An insurance policy is a contract between the insurance company and its insureds where the insurance company agrees to pay for losses suffered by the insured that are covered under the contract. Such contracts often are subject to legal interpretation by courts, often involving legislative actions and/or arbitration. Property insurance generally covers the financial consequences of accidental losses to the insured’s property, such as a home and the personal property in it, or a business’ building, inventory and equipment. Casualty insurance (often referred to as liability insurance) generally covers the financial consequences related to the legal liability of an individual or an organization resulting from negligent acts and omissions causing bodily injury and/or property damage to a third party. Claims for property coverage generally are reported and settled in a relatively short period of time, whereas those for casualty coverage can take years and even decades to settle.
We generate revenues from earned premiums, ceding commissions from quota share reinsurance, net investment income generated from our investment portfolio, and net realized gains and losses on investment securities. We also receive installment fee income, fees charged to reinstate a policy after it has been cancelled for non-payment, and fees for placing premium finance contracts with a third party licensed premium finance company. Earned premiums represent premiums received from insureds, which are recognized as revenue over the period of time that insurance coverage is provided (i.e., ratably over the life of the policy). A significant period of time can elapse between the receipt of insurance premiums and the payment of insurance claims. During this time, KICO invests the premiums, earns investment income and generates net realized and unrealized investment gains and losses on investments.
Insurance companies incur a significant amount of their total expenses from policyholder losses, which are commonly referred to as claims. In settling policyholder losses, various loss adjustment expenses (“LAE”) are incurred such as insurance adjusters’ fees and litigation expenses. In addition, insurance companies incur policy acquisition expenses, such as commissions paid to producers and premium taxes, and other expenses related to the underwriting process, including their employees’ compensation and benefits.
The key measure of relative underwriting performance for an insurance company is the combined ratio. An insurance company’s combined ratio is calculated by adding the ratio of incurred loss and LAE to earned premiums (the “loss and LAE ratio”) and the ratio of policy acquisition and other underwriting expenses to earned premiums (the “expense ratio”). A combined ratio under 100% indicates that an insurance company is generating an underwriting profit. However, after considering investment income and investment gains or losses, insurance companies operating at a combined ratio of greater than 100% can be profitable.
General; Strategy
We are a property and casualty insurance holding company whose principal operating subsidiary is Kingstone Insurance Company, referred to as KICO, domiciled in the State of New York. We are a multi-line regional property and casualty insurance company writing business exclusively through independent retail and wholesale agents and brokers, referred to collectively as producers. We are licensed to write insurance policies in New York, New Jersey, Connecticut, Pennsylvania and Texas.
5
We seek to deliver an attractive return on capital and to provide consistent earnings growth through underwriting profits and income from our investment portfolio. Our goal is to allocate capital efficiently to those lines of business that generate sustainable underwriting profits and exit any line for which an underwriting profit is not likely to result. Our strategy is to be the preferred multi-line property and casualty insurance company for selected producers in the geographic markets in which we operate. We believe producers prefer to place profitable business with us because we provide excellent, consistent service to our producers, policyholders and claimants coupled with competitive rates and commission levels and a consistent market presence. We offer a wide array of personal and commercial lines policies, and we believe that this differentiates us from other insurance companies that also distribute through our selected producers.
Our principal objectives are to increase the volume of profitable business that we write while limiting our risk of loss and preserving our capital. We seek to generate underwriting income by writing profitable insurance policies and by effectively managing our other underwriting and operating expenses. We are pursuing profitable growth by expanding the geographic regions in which we operate, increasing the volume of business that we write with existing producers, developing new selected producer relationships, and introducing niche insurance products that are attractive to our producers and policyholders.
For the year ended December 31, 2015, our gross written premiums totaled $91.0 million, an increase of 19.3% from the $76.3 million in gross written premium for the year ended December 31, 2014. For the year ended December 31, 2015, our gross written premiums from our continuing lines of business grew by 23.9% compared to the year ended December 31, 2014.
Product Lines
Our product lines include the following:
Personal lines - Our largest line of business is personal lines, consisting of homeowners, dwelling fire, 3-4 family dwelling package, condominiums, renters, equipment breakdown and service line endorsements, and personal umbrella policies. Personal lines policies accounted for 76.0% of our gross written premiums for the year ended December 31, 2015.
Commercial liability - We offer business owners policies, which consist primarily of small business retail, service, and office risks without a residential exposure. We also write artisan’s liability policies for small independent contractors with seven or fewer employees. In addition, we write special multi-peril policies for larger and more specialized business owners’ risks, including those with limited residential exposures. Commercial lines policies accounted for 13.2% of our gross written premiums for the year ended December 31, 2015.
Commercial automobile – Until recently we provided liability and physical damage coverage for light vehicles owned by small contractors and artisans. However, due to the poor performance of this line, effective October 1, 2014, we decided to no longer accept new commercial auto policies. In February 2015, we decided to no longer offer renewals to our existing commercial auto policies beginning with those that expired on or after May 1, 2015. Commercial automobile policies accounted for 0.6% of our gross written premiums for the year ended December 31, 2015.
Livery physical damage - We write for-hire vehicle physical damage only policies for livery and car service vehicles and taxicabs. These policies insure only the physical damage portion of insurance for such vehicles, with no liability coverage included. These policies accounted for 9.9% of our gross written premiums for the year ended December 31, 2015.
6
Other - We write canine legal liability policies and also have a small participation in mandatory state joint underwriting associations. This subset of our business accounted for 0.3% of our gross written premiums for the year ended December 31, 2015.
Our Competitive Strengths
History of Growing Our Profitable Operations
Our insurance company subsidiary, KICO, has been in operation in the State of New York for 129 years. We have consistently increased the volume of profitable business that we write by introducing new insurance products, increasing the volume of business that we write with our selected producers and developing new producer relationships. KICO has earned an underwriting profit in each of the past ten years, including in 2012 when our financial results were adversely impacted by Superstorm Sandy. The extensive heritage of our insurance company subsidiary and our commitment to the New York market is a competitive advantage with producers and policyholders.
Strong Producer Relationships
Within our selected producers’ offices, we compete with other property and casualty insurance carriers available to those producers. We carefully select the producers that distribute our insurance policies and continuously monitor and evaluate their performance. We believe our insurance producers value their relationships with us because we provide excellent, consistent personal service coupled with competitive rates and commission levels. We have consistently been rated by insurance producers as above average in the important areas of underwriting, claims handling and service. In the last three performance surveys conducted by the Professional Insurance Agents of New York and New Jersey (“PIA”) of its membership (2010, 2012, and 2014), KICO was rated as the one of the top performing insurance companies in New York, twice ranking as the top rated carrier among all those surveyed.
We offer our selected producers the ability to write a wide array of personal lines and commercial lines policies, including some which are unique to us. Many of our producers write multiple lines of business with us, which provides an advantage over those competitors who are focused on a single product line. We now provide a multi-policy discount on homeowners policies in order to attract and retain more of this multi-line business. We have had a consistent presence in the New York market for over 100 years and we believe that producers value the longevity of our relationship with them. We believe that the excellent service we provide to our selected producers, our broad product offering, and our consistent market presence provides a foundation for profitable growth.
Sophisticated Underwriting and Risk Management Practices
We believe that we have a significant underwriting advantage due to our local market presence and expertise. Our underwriting process evaluates and screens out certain risks based on property reports, individual insurance scoring, information collected from physical property inspections, and driving records. We maintain certain policy exclusions that reduce our exposure to risks that can create severe losses. We target a more preferred risk profile in order to reduce adverse selection from risks seeking the lowest premiums by selecting only minimal coverage levels.
7
Our underwriting procedures, premium rates and policy terms support the underwriting profitability of our personal lines policies. We apply premium surcharges for certain coastal properties and maintain deductibles for hurricane-prone exposures in order to provide an appropriate premium rate for the risk of loss. We limit the business that we write in certain coastal counties and within close proximity to coastlines, through the use of individual catastrophe risk scoring, in order to manage our exposure to catastrophic weather events.
Our underwriting expertise and risk management practices enable us to profitably write personal and commercial lines business in our markets without the need for frequent rate adjustments. We believe that the consistency and the reliable availability of our insurance products is important to our selected producer relationships.
Effective Utilization of Reinsurance
Our reinsurance treaties allow us to limit our exposure to the financial impact of catastrophe losses and to reduce our net liability on individual risks. Our reinsurance program is structured to enable us to grow our premium volume while maintaining regulatory capital and other financial ratios generally within or below the expected ranges used for regulatory oversight purposes.
Our reinsurance program also provides income as a result of ceding commissions earned pursuant to the quota share reinsurance contracts. The income we earn from ceding commissions typically exceeds our fixed operating costs, which consist of other underwriting expenses. Quota share reinsurance treaties transfer a portion of the profit (or loss) associated with the subject insurance policies to the reinsurers. We believe that a prudent reduction in our reliance on quota share reinsurance in the future could increase our overall net underwriting profits.
Experienced Management Team
Our management team has significant expertise in underwriting, agency management, claims management and insurance regulatory matters. Barry Goldstein, our Chairman and Chief Executive Officer, has extensive experience in the insurance industry and managing public companies. He has served in his current capacity since 2001 and previously served as president of an insurance agency in Pennsylvania. John Reiersen, Executive Vice President of KICO, has over 50 years of industry and regulatory experience and previously served as Chief Examiner in the Property and Casualty Insurance Bureau of the New York State Insurance Department, now known as the New York State Department of Financial Services. Benjamin Walden, Senior Vice President and Chief Actuary of KICO, has 26 years of experience with both large and small insurance carriers and has also worked for actuarial consulting firms. Throughout his career, he has specialized in many of the markets that are a primary focus for KICO. Our underwriting and claims managers have extensive experience in the insurance industry with an average of 33 years of experience, including over 6 years with KICO on average.
Scalable, Low-Cost Operations
We focus on keeping expenses low, but invest in tools and processes that improve the efficiency and effectiveness of underwriting risks and processing claims. We evaluate the costs and benefits of each new tool or process in order to achieve optimal results. While the majority of our policies are written for risks in downstate New York, our Kingston, New York location provides a significantly lower cost operating environment. We also take a proactive approach to settling outstanding claims rather than engaging in protracted litigation, which results in substantially lower loss adjustment expenses and reduced reserve uncertainty.
8
We have made investments to develop online application and quoting systems for many of our personal lines and commercial products. This has resulted in increased business submissions from our producers due to the greater ease of placing business with us. We plan to expand these online capabilities to all lines of business. We have also leveraged a paperless workflow management and document storage tool in order to further improve efficiency and reduce costs. Our ability to control the growth of our operating and other expenses while growing revenue at a higher rate is a key component of our business model and is important to our future financial success.
Underwriting and Claims Management Philosophy
Our underwriting philosophy is to target niche risk segments for which we have detailed expertise and can take advantage of market conditions. We monitor results on a regular basis and all of our selected producers are reviewed by management on a quarterly basis. We utilize certain targeted policy exclusions to reduce our exposure to risks that can create severe losses.
We believe that our rates are competitive with other carriers’ rates in our markets. We believe that consistency and the reliable availability of our insurance products is important to our producers. We do not seek to grow by competing based solely upon price. We seek to develop long-term relationships with our selected producers who understand and appreciate the consistent path we have chosen. We carefully underwrite all of our business utilizing the CLUE industry claims database, insurance scoring reports, physical inspection of risks and other individual risk underwriting tools. In the event that a material misrepresentation is discovered in the underwriting application, the policy is voided. If a material misrepresentation is discovered after a claim is presented, we deny the claim. We write homeowners and dwelling fire business in New York City and Long Island and are cognizant of our exposure to hurricanes. We have mitigated this risk through application of mandatory hurricane deductibles in these areas. Our claim and underwriting expertise enables us to profitably write personal lines business in all areas of New York City and Long Island.
Distribution
We generate business through our relationships with over 350 independent producers. We carefully select our producers by evaluating several factors such as their need for our products, premium production potential, loss history with other insurance companies that they represent, product and market knowledge, and the size of the agency. We only distribute through independent agents and have never sought to distribute our products direct to the consumer. We will not appoint any agency owned or controlled by another carrier which distributes its products direct to the consumer. We monitor and evaluate the performance of our producers through periodic reviews of volume, profitability, and quality of business. Our senior executives are actively involved in managing our producer relationships.
Each producer is assigned an underwriter and the producer can call that underwriter directly on any matter. We believe that the close relationship with their underwriter is the principal reason producers place their business with us. Our online application and quoting systems have streamlined the process of placing business with KICO. Our producers have access to a website portal that contains all of our applications, quoting screens, policy forms and underwriting guidelines for all lines of business. We send out frequent electronic “Producer Grams” in order to inform our producers of updates at KICO. In addition, we have an active Producer Council and have at least one annual meeting with all of our producers.
9
Competition; Market
The insurance industry is highly competitive. We constantly assess and project the market conditions and prices for our products, but we cannot fully know our profitability until all claims have been reported and settled.
Our policyholders are located primarily in New York State. Our market primarily consists of New York City, Long Island and Westchester County, which we collectively define as Downstate New York. We are also licensed to write insurance in Connecticut, New Jersey, Pennsylvania, and Texas, and are in the process of obtaining a license in one other state.
New York State is the fourth largest property and casualty insurance market in the U.S. and the fourth largest state in the United States with respect to homeowners and dwelling fire insurance direct premiums written. In 2015, we were the 19th largest writer of homeowners and dwelling fire insurance in the State of New York, according to data compiled by SNL Financial. Based on this same data, we now have a 0.9% market share for this combined group of personal lines property business. We compete with large national carriers as well as regional and local carriers in the property and casualty marketplace in New York. We believe that many national and regional carriers have chosen to limit their rate of premium growth or to decrease their presence in the Downstate New York property insurance market due to the high catastrophe risk that exists in the region. Given present market conditions, we believe that we have the opportunity to significantly expand the size of our business in the State of New York, as well as in the other states where we recently became licensed.
Loss and Loss Adjustment Expense Reserves
We are required to establish reserves for incurred losses that are unpaid, including reserves for claims and loss adjustment expenses (“LAE”), which represent the expenses of settling and adjusting those claims. These reserves are balance sheet liabilities representing estimates of future amounts required to pay losses and loss expenses for claims that have occurred at or before the balance sheet date, whether already known to us or not yet reported. We establish these reserves after considering all information known to us as of the date they are recorded.
Loss reserves fall into two categories: case reserves for reported losses and loss expenses associated with a specific reported insured claim, and reserves for losses incurred but not reported (“IBNR”) and LAE. We establish these two categories of loss reserves as follows:
Reserves for reported losses - When a claim is received, we establish a case reserve for the estimated amount of its ultimate settlement and its estimated loss expenses. We establish case reserves based upon the known facts about each claim at the time the claim is reported and may subsequently increase or reduce the case reserves as our claims department deems necessary based upon the development of additional facts about claims.
IBNR reserves - We also estimate and establish reserves for loss and LAE amounts incurred but not yet reported. IBNR reserves are calculated as ultimate losses and LAE less reported losses and LAE. Ultimate losses are projected by using generally accepted actuarial techniques.
10
The liability for loss and LAE represents our best estimate of the ultimate cost of all reported and unreported losses that are unpaid as of the balance sheet date. The liability for loss and LAE is estimated on an undiscounted basis, using individual case-basis valuations, statistical analyses and various actuarial procedures. The projection of future claim payment and reporting is based on an analysis of our historical experience, supplemented by analyses of industry loss data. We believe that the reserves for loss and LAE are adequate to cover the ultimate cost of losses and claims to date; however, because of the uncertainty from various sources, including changes in reporting patterns, claims settlement patterns, judicial decisions, legislation, and economic conditions, actual loss experience may not conform to the assumptions used in determining the estimated amounts for such liability at the balance sheet date. As adjustments to these estimates become necessary, such adjustments are reflected in expense for the period in which the estimates are changed. Because of the nature of the business historically written, we believe that we have limited exposure to asbestos and environmental claim liabilities. We recognize recoveries from salvage and subrogation when received.
We engage an independent external actuarial specialist to opine on our recorded statutory reserves. Our actuary estimates a range of ultimate losses, along with a range and recommended central estimate of IBNR reserve amounts.
Reconciliation of Loss and Loss Adjustment Expenses
The table below shows the reconciliation of loss and LAE on a gross and net basis, reflecting changes in losses incurred and paid losses:
|
Years ended
|
||||||||
|
December 31,
|
||||||||
|
2015
|
2014
|
|||||||
|
Balance at beginning of period
|
$ | 39,912,683 | $ | 34,503,229 | ||||
|
Less reinsurance recoverables
|
(18,249,526 | ) | (17,363,975 | ) | ||||
|
Net balance, beginning of period
|
21,663,157 | 17,139,254 | ||||||
|
Incurred related to:
|
||||||||
|
Current year
|
23,642,998 | 15,268,426 | ||||||
|
Prior years
|
(462,998 | ) | 1,763,762 | |||||
|
Total incurred
|
23,180,000 | 17,032,188 | ||||||
|
Paid related to:
|
||||||||
|
Current year
|
13,172,870 | 6,351,920 | ||||||
|
Prior years
|
8,500,151 | 6,156,365 | ||||||
|
Total paid
|
21,673,021 | 12,508,285 | ||||||
|
|
||||||||
|
Net balance at end of period
|
23,170,136 | 21,663,157 | ||||||
|
Add reinsurance recoverables
|
16,706,364 | 18,249,526 | ||||||
|
Balance at end of period
|
$ | 39,876,500 | $ | 39,912,683 | ||||
Our claims reserving practices are designed to set reserves that, in the aggregate, are adequate to pay all claims at their ultimate settlement value.
Loss and Loss Adjustment Expenses Development
The table below shows the net loss development for business written each year from 2005 through 2015. The table reflects the changes in our loss and loss adjustment expense reserves in subsequent years from the prior loss estimates based on experience as of the end of each succeeding year.
11
The next section of the table sets forth the re-estimates in later years of incurred losses, including payments for the years indicated. The next section of the table shows by year, the cumulative amounts of loss and loss adjustment expense payments, net of amounts recoverable from reinsurers, as of the end of each succeeding year. For example, with respect to the net loss reserves of $4,370,000 as of December 31, 2006, by December 31, 2008 (two years later), $3,303,000 had actually been paid in settlement of the claims that relate to liabilities as of December 31, 2006.
The “cumulative redundancy (deficiency)” represents, as of December 31, 2015, the difference between the latest re-estimated liability and the amounts as originally estimated. A redundancy means that the original estimate was higher than the current estimate. A deficiency means that the current estimate is higher than the original estimate.
12
|
(in thousands of $)
|
2005
|
2006
|
2007
|
2008
|
2009
|
2010
|
2011
|
2012
|
2013
|
2014
|
2015
|
|||||||||||||||||||||||||||||||||
|
Reserve for loss and loss adjustment expenses, net of reinsurance recoverables
|
3,074 | 4,370 | 4,799 | 5,823 | 6,001 | 7,280 | 8,520 | 12,065 | 17,139 | 21,663 | 23,170 | |||||||||||||||||||||||||||||||||
|
Net reserve estimated as of One year later
|
3,627 | 4,844 | 5,430 | 6,119 | 6,235 | 7,483 | 9,261 | 13,886 | 18,903 | 21,200 | ||||||||||||||||||||||||||||||||||
|
Two years later
|
4,315 | 5,591 | 5,867 | 6,609 | 6,393 | 8,289 | 11,022 | 16,875 | 18,332 | |||||||||||||||||||||||||||||||||||
|
Three years later
|
5,101 | 5,792 | 6,433 | 6,729 | 6,486 | 9,170 | 12,968 | 16,624 | ||||||||||||||||||||||||||||||||||||
|
Four years later
|
5,094 | 6,260 | 6,569 | 6,711 | 7,182 | 10,128 | 12,552 | |||||||||||||||||||||||||||||||||||||
|
Five years later
|
5,540 | 6,343 | 6,683 | 7,261 | 7,766 | 9,925 | ||||||||||||||||||||||||||||||||||||||
|
Six years later
|
5,616 | 6,429 | 7,245 | 7,727 | 7,602 | |||||||||||||||||||||||||||||||||||||||
|
Seven years later
|
5,678 | 6,886 | 7,721 | 7,554 | ||||||||||||||||||||||||||||||||||||||||
|
Eight years later
|
6,140 | 7,318 | 7,568 | |||||||||||||||||||||||||||||||||||||||||
|
Nine years later
|
6,560 | 7,160 | ||||||||||||||||||||||||||||||||||||||||||
|
Ten years later
|
6,399 | |||||||||||||||||||||||||||||||||||||||||||
|
Net cumulative redundancy (deficiency)
|
(3,325 | ) | (2,790 | ) | (2,769 | ) | (1,731 | ) | (1,601 | ) | (2,645 | ) | (4,032 | ) | (4,559 | ) | (1,193 | ) | 463 | |||||||||||||||||||||||||
|
(in thousands of $)
|
2005 | 2006 | 2007 | 2008 | 2009 | 2010 | 2011 | 2012 | 2013 | 2014 | 2015 | |||||||||||||||||||||||||||||||||
|
Cumulative amount of reserve paid, net of reinsurance recoverable through
|
||||||||||||||||||||||||||||||||||||||||||||
|
One year later
|
1,106 | 2,018 | 1,855 | 2,533 | 2,307 | 3,201 | 3,237 | 4,804 | 6,156 | 8,500 | ||||||||||||||||||||||||||||||||||
|
Two years later
|
2,321 | 3,303 | 3,339 | 3,974 | 3,992 | 4,947 | 5,661 | 8,833 | 10,629 | |||||||||||||||||||||||||||||||||||
|
Three years later
|
3,321 | 4,036 | 4,339 | 5,054 | 4,659 | 6,199 | 8,221 | 11,873 | ||||||||||||||||||||||||||||||||||||
|
Four years later
|
3,705 | 4,471 | 5,146 | 5,373 | 5,238 | 7,737 | 10,100 | |||||||||||||||||||||||||||||||||||||
|
Five years later
|
3,988 | 5,079 | 5,424 | 5,717 | 5,997 | 8,585 | ||||||||||||||||||||||||||||||||||||||
|
Six years later
|
4,484 | 5,305 | 5,738 | 6,224 | 6,562 | |||||||||||||||||||||||||||||||||||||||
|
Seven years later
|
4,595 | 5,594 | 6,247 | 6,718 | ||||||||||||||||||||||||||||||||||||||||
|
Eight years later
|
4,880 | 5,966 | 6,740 | |||||||||||||||||||||||||||||||||||||||||
|
Nine years later
|
5,246 | 6,377 | ||||||||||||||||||||||||||||||||||||||||||
|
Ten years later
|
5,654 | |||||||||||||||||||||||||||||||||||||||||||
|
Net reserve -
|
||||||||||||||||||||||||||||||||||||||||||||
|
December 31,
|
3,074 | 4,370 | 4,799 | 5,823 | 6,001 | 7,280 | 8,520 | 12,065 | 17,139 | 21,663 | 23,170 | |||||||||||||||||||||||||||||||||
|
* Reinsurance Recoverable
|
7,283 | 6,523 | 6,693 | 9,766 | 10,512 | 10,432 | 9,960 | 18,420 | 17,364 | 18,250 | 16,707 | |||||||||||||||||||||||||||||||||
|
* Gross reserves -
|
||||||||||||||||||||||||||||||||||||||||||||
|
December 31,
|
10,357 | 10,893 | 11,492 | 15,589 | 16,513 | 17,712 | 18,480 | 30,485 | 34,503 | 39,913 | 39,877 | |||||||||||||||||||||||||||||||||
|
Net re-estimated reserve
|
6,399 | 7,160 | 7,568 | 7,554 | 7,602 | 9,925 | 12,552 | 16,624 | 18,332 | 21,200 | ||||||||||||||||||||||||||||||||||
|
Re-estimated reinsurance recoverable
|
11,137 | 11,312 | 11,254 | 12,954 | 12,920 | 13,621 | 14,150 | 27,750 | 19,779 | 18,742 | ||||||||||||||||||||||||||||||||||
|
Gross re-estimated reserve
|
17,536 | 18,472 | 18,822 | 20,508 | 20,522 | 23,546 | 26,702 | 44,374 | 38,111 | 39,942 | ||||||||||||||||||||||||||||||||||
|
Gross cumulative redundancy (deficiency)
|
(7,179 | ) | (7,579 | ) | (7,330 | ) | (4,919 | ) | (4,009 | ) | (5,834 | ) | (8,222 | ) | (13,889 | ) | (3,608 | ) | (29 | ) | ||||||||||||||||||||||||
13
See “Management’s Discussion and Analysis of Financial Condition and Results of Operations – Factors That May Affect Future Results and Financial Condition” in Item 7 of this Annual Report.
Reinsurance
We purchase reinsurance to reduce our net liability on individual risks, to protect against possible catastrophes, to achieve a target ratio of net premiums written to policyholders’ surplus and to expand our underwriting capacity. Our reinsurance program is structured to reflect our obligations and goals. Reinsurance via quota share allows for a carrier to write business without increasing its underwriting leverage above a management determined ratio. The business written under a reinsurance quota share obligates a reinsurer to assume the risks involved, and gives the reinsurer the profit (or loss) associated with such. We have determined it to be in the best interests of our shareholders to prudently reduce our reliance on quota share reinsurance. This will result in higher earned premiums and a reduction in ceding commission revenue in future years. Our participation in reinsurance arrangements does not relieve us from our obligations to policyholders.
Our quota share reinsurance treaties in effect for the year ended December 31, 2015 for our personal lines business, which primarily consists of homeowners’ policies, were covered under the July 1, 2014/June 30, 2015 treaty year (“2014/2015 Treaty”) and July 1, 2015/June 30, 2016 treaty year (“2015/2016 Treaty”). The expired 2014/2015 Treaty was at a 55% quota share percentage and the current 2015/2016 Treaty is at a 40% quota share percentage. Our maximum net retention under the quota share and excess of loss treaties for any one personal lines policy for dates of loss after July 1, 2015 is $450,000.
We did not renew our expiring 25% commercial lines quota share reinsurance treaty on July 1, 2014. Excess of loss contracts provide coverage for individual commercial lines losses. Our maximum net retention under excess of loss treaties for any one commercial general liability policy for dates of loss after July 1, 2015 is $425,000. Commercial auto policies are covered by an excess of loss reinsurance contract that provides coverage for individual losses in excess of $300,000.
We earn ceding commission revenue under the quota share reinsurance treaties based on a provisional commission rate on all premiums ceded to the reinsurers as adjusted by a sliding scale based on the ultimate treaty year loss ratios on the policies reinsured under each agreement. The sliding scale provides minimum and maximum ceding commission rates in relation to specified ultimate loss ratios. Under the 2015/2016 Treaty, we are receiving a higher upfront fixed provisional rate in exchange for a less favorable sliding scale contingent rate. Under this arrangement, we earn more provisional ceding commissions, while contingent ceding commissions are reduced due the less favorable sliding scale rate.
The 2015/2016 Treaty is on a “net” of catastrophe reinsurance basis, as opposed to the “gross” arrangement that existed in prior treaties. Under a “net” arrangement, all catastrophe reinsurance coverage is now purchased directly by us. Since we pay for all of the catastrophe coverage, none of the losses covered under a catastrophic event will be included in the quota share, drastically reducing the adverse impact that a catastrophic event can have on ceding commissions.
In 2015, we purchased catastrophe reinsurance to provide coverage of up to $180 million for losses associated with a single event. One of the most commonly used catastrophe forecasting models prepared for us indicates that the catastrophe reinsurance treaties provide coverage in excess of our estimated probable maximum loss associated with a single one-in-200 year storm event. Losses on personal lines policies are subject to the 40% quota share treaty, which results in a net retention by us of $2.4 million of exposure per catastrophe occurrence. Our catastrophe reinsurance also covers losses caused by severe winter weather during any consecutive 28 day period. Catastrophe coverage is limited on an annual basis to two times the per occurrence amounts. Effective July 1, 2015, we have reinstatement premium protection on the first $16,000,000 layer of catastrophe coverage in excess of $4,000,000.
14
Investments
Our investment portfolio, including cash and cash equivalents, and short term investments, as of December 31, 2015 and 2014, is summarized in the table below by type of investment.
|
December 31, 2015
|
December 31, 2014
|
|||||||||||||||
|
Carrying
|
% of
|
Carrying
|
% of
|
|||||||||||||
|
Category
|
Value
|
Portfolio
|
Value
|
Portfolio
|
||||||||||||
|
Cash and cash equivalents
|
$ | 13,551,372 | 15.0 | % | $ | 9,906,878 | 13.4 | % | ||||||||
|
Held to maturity
|
||||||||||||||||
|
U.S. Treasury securities and
|
||||||||||||||||
|
obligations of U.S. government
|
||||||||||||||||
|
corporations and agencies
|
606,389 | 0.7 | % | 606,353 | 0.8 | % | ||||||||||
|
Political subdivisions of states,
|
||||||||||||||||
|
territories and possessions
|
1,417,679 | 1.6 | % | 1,413,303 | 1.9 | % | ||||||||||
| Available for sale | ||||||||||||||||
|
Corporate and other bonds
|
||||||||||||||||
|
Industrial and miscellaneous
|
3,114,804 | 3.4 | % | 3,109,079 | 4.2 | % | ||||||||||
|
Political subdivisions of states,
|
||||||||||||||||
|
territories and possessions
|
12,555,098 | 13.9 | % | 14,244,438 | 19.2 | % | ||||||||||
|
Corporate and other bonds
|
||||||||||||||||
|
Industrial and miscellaneous
|
44,956,468 | 49.7 | % | 36,876,421 | 49.7 | % | ||||||||||
|
Residential backed mortgage securities
|
4,990,498 | 5.5 | % | - | 0.0 | % | ||||||||||
|
Preferred stocks
|
2,915,650 | 3.2 | % | 3,126,280 | 4.2 | % | ||||||||||
|
Common stocks
|
6,288,620 | 7.0 | % | 4,891,449 | 6.6 | % | ||||||||||
|
Total
|
$ | 90,396,578 | 100.0 | % | $ | 74,174,201 | 100.0 | % | ||||||||
15
The table below summarizes the credit quality of our fixed-maturity securities available-for-sale as of December 31, 2015 and 2014 as rated by Standard and Poor’s (or if unavailable from Standard and Poor's, then Moody’s or Fitch):
|
December 31, 2015
|
December 31, 2014
|
|||||||||||||||||
|
Percentage of
|
Percentage of
|
|||||||||||||||||
|
Fair Market
|
Fair Market
|
Fair Market
|
Fair Market
|
|||||||||||||||
|
Value
|
Value
|
Value
|
Value
|
|||||||||||||||
|
Rating
|
||||||||||||||||||
|
Corporate and municipal bonds
|
||||||||||||||||||
|
AAA
|
$ | 2,218,147 | 3.5 | % | $ | 2,779,539 | 5.5 | % | ||||||||||
|
AA
|
9,060,781 | 14.5 | % | 9,826,545 | 19.2 | % | ||||||||||||
| A | 10,639,888 | 17.0 | % | 13,954,036 | 27.3 | % | ||||||||||||
|
BBB
|
35,592,750 | 57.1 | % | 24,560,739 | 48.0 | % | ||||||||||||
|
Total corporate and municipal bonds
|
57,511,566 | 92.1 | % | 51,120,859 | 100.0 | % | ||||||||||||
|
Residential mortgage backed securities
|
||||||||||||||||||
| A | 216,077 | 0.3 | % | - | 0.0 | % | ||||||||||||
|
CCC
|
457,889 | 0.7 | % | - | 0.0 | % | ||||||||||||
|
CC
|
402,558 | 0.6 | % | - | 0.0 | % | ||||||||||||
| D | 3,913,974 | 6.3 | % | - | 0.0 | % | ||||||||||||
|
Total residential mortgage backed securities
|
4,990,498 | 7.9 | % | - | 0.0 | % | ||||||||||||
|
Total
|
$ | 62,502,064 | 100.0 | % | $ | 51,120,859 | 100.0 | % | ||||||||||
Additional financial information regarding our investments is presented under the subheading “Investments” in Item 7 of this Annual Report.
Ratings
Many insurance buyers, agents and brokers use the ratings assigned by A.M. Best and other agencies to assist them in assessing the financial strength and overall quality of the companies from which they are considering purchasing insurance. In 2009, KICO applied for its initial A.M. Best rating, and was assigned a letter rating of “B” (Fair) by A.M. Best in 2010. Our rating was upgraded to B+ (Good) in 2011 and B++ (Good) in 2015. KICO is beginning the process of undergoing its annual review from A.M. Best, which may result in a change to its rating. A.M. Best ratings are derived from an in-depth evaluation of an insurance company’s balance sheet strengths, operating performances and business profiles. A.M. Best evaluates, among other factors, the company’s capitalization, underwriting leverage, financial leverage, asset leverage, capital structure, quality and appropriateness of reinsurance, adequacy of reserves, quality and diversification of assets, liquidity, profitability, spread of risk, revenue composition, market position, management, market risk and event risk. A.M. Best ratings are intended to provide an independent opinion of an insurer’s ability to meet its obligations to policyholders and are not an evaluation directed at investors. An A.M. Best rating of A- or better could create additional demand from producers in markets requiring a carrier to have that level of rating from A.M. Best. We currently have a Demotech rating of A (Excellent) which generally qualifies our policies as eligible by most banks and finance companies.
Severe Winter Weather
Our predominant market, downstate New York, suffered severe weather during the winters of 2015 and 2014. We include severe winter weather in our definition of catastrophe. The catastrophe component of 2015 and 2014 severe winters was determined by the number of claims in excess of our threshold of average claims from severe winter weather. These claims were primarily from losses due to frozen pipes, weight of snow and ice, and other water related structural damage as a result of excess snow and below normal temperatures for an extended period of time. The effects of severe winter weather increased our net loss ratio by 4.3 percentage points in 2015 and 2.9 percentage points in 2014.
16
The computation to determine contingent ceding commission revenue includes direct catastrophe losses and loss adjustment expenses incurred from severe winter weather. Such losses increased our ceded loss ratio in our July 1, 2014/June 30, 2015 personal lines quota share treaties which reduced our contingent ceding commission revenue by $1.3 million for the year ended December 31, 2015. The effects of severe winter weather increased our net underwriting expense ratio by 2.7 percentage points in 2015. The effects of severe winter weather increased our ceded loss ratio in our July 1, 2013/June 30, 2014 personal lines quota share treaties which reduced our contingent ceding commission revenue by $0.5 million for the year ended December 31, 2014. The effects of severe winter weather increased our net underwriting expense ratio by 1.6 percentage points in 2014.
Premium Financing
Customers who purchase insurance policies are often unable to pay the premium in a lump sum or are unable to afford the payment plan offered and, therefore, require extended payment terms. Premium finance involves making a loan to the customer that is secured by the unearned portion of the insurance premiums being financed and held by the insurance carrier. Our wholly owned subsidiary, Payments Inc. (“Payments”), is licensed as a premium finance agency in the state of New York.
Prior to February 1, 2008, Payments Inc. provided premium financing in connection with the obtaining of insurance policies. Effective February 1, 2008, Payments Inc. sold its outstanding premium finance loan portfolio. The purchaser of the portfolio (the “Purchaser”) agreed that, during the five year period ended February 1, 2013 (which period was extended to February 1, 2015), it would purchase, assume and service all eligible premium finance contracts originated by Payments in the state of New York (the “Agreement”). In connection with such purchases, Payments was entitled to receive a fee generally equal to a percentage of the amount financed. On July 17, 2014, the Purchaser terminated the Agreement effective February 1, 2015. Following any expiration or termination of the obligation of the Purchaser to purchase premium finance contracts, Payments was entitled to receive the fees for an additional two years (“Termination Period”) with regard to contracts for policies from our producers. On March 26, 2015, we and the Purchaser agreed to amend the Termination Period to end as of March 31, 2015 (“Termination Date”). We received a one-time payment of $350,000 in exchange for the fees that we would have received during the Termination Period. In connection with such agreement, we agreed to several restrictive covenants, including that, for a period of eighteen months following the Termination Date, we would not engage in the premium financing business within New York, New Jersey and Pennsylvania. Our premium financing business consisted of the placement fees that Payments earned from placing contracts. Placement fees earned from placing contracts constituted approximately 0.1% and 0.5% of our revenues from operations during the years ended December 31, 2015 and 2014, respectively.
Government Regulation
Holding Company Regulation
We, as the parent of KICO, are subject to the insurance holding company laws of the state of New York. These laws generally require an insurance company to register with the New York State Department of Financial Services (the “DFS”) and to furnish annually financial and other information about the operations of companies within our holding company system. Generally under these laws, all material transactions among companies in the holding company system to which KICO is a party must be fair and reasonable and, if material or of a specified category, require prior notice and approval or non-disapproval by the DFS.
17
Change of Control
The insurance holding company laws of the state of New York require approval by the DFS for any change of control of an insurer. “Control” is generally defined as the possession, direct or indirect, of the power to direct or cause the direction of the management and policies of the company, whether through the ownership of voting securities, by contract or otherwise. Control is generally presumed to exist through the direct or indirect ownership of 10% or more of the voting securities of a domestic insurance company or any entity that controls a domestic insurance company. Any future transactions that would constitute a change of control of KICO, including a change of control of Kingstone Companies, Inc., would generally require the party acquiring control to obtain the approval of the DFS (and in any other state in which KICO may operate). Obtaining these approvals may result in the material delay of, or deter, any such transaction. These laws may discourage potential acquisition proposals and may delay, deter or prevent a change of control of Kingstone Companies, Inc., including through transactions, and in particular unsolicited transactions, that some or all of our stockholders might consider to be desirable.
State Insurance Regulation
Insurance companies are subject to regulation and supervision by the department of insurance in the state in which they are domiciled and, to a lesser extent, other states in which they conduct business. The primary purpose of such regulatory powers is to protect individual policyholders. State insurance authorities have broad regulatory, supervisory and administrative powers, including, among other things, the power to grant and revoke licenses to transact business, set the standards of solvency to be met and maintained, determine the nature of, and limitations on, investments and dividends, approve policy forms and rates in some instances and regulate unfair trade and claims practices.
KICO is required to file detailed financial statements and other reports with the insurance departments in the states in which KICO is licensed to transact business. These financial statements are subject to periodic examination by the insurance departments.
In addition, many states have laws and regulations that limit an insurer’s ability to withdraw from a particular market. For example, states may limit an insurer’s ability to cancel or not renew policies. Furthermore, certain states prohibit an insurer from withdrawing from one or more lines of business written in the state, except pursuant to a plan that is approved by the state insurance department. The state insurance department may disapprove a plan that may lead to market disruption. Laws and regulations, including those in New York, that limit cancellation and non-renewal and that subject program withdrawals to prior approval requirements may restrict the ability of KICO to exit unprofitable markets.
In the aftermath of Superstorm Sandy, the DFS adopted various emergency regulations that affect insurance companies that operate in the state of New York. Included among the regulations is mandatory participation in non-binding mediation proceedings funded by the insurer.
18
Federal and State Legislative and Regulatory Changes
From time to time, various regulatory and legislative changes have been proposed in the insurance industry. Among the proposals that have in the past been or at the present being considered are the possible introduction of Federal regulation in addition to, or in lieu of, the current system of state regulation of insurers, and proposals in various state legislatures (some of which proposals have been enacted) to conform portions of their insurance laws and regulations to various model acts adopted by the National Association of Insurance Commissioners (the “NAIC”).
In December 2010, the NAIC adopted amendments to the Model Insurance Holding Company System Regulation Act and Regulation (the “Amended Model Act and Regulation”) to introduce the concept of “enterprise risk” within an insurance company holding system. Enterprise risk is defined as any activity, circumstance, event or series of events involving one or more affiliates of an insurer that, if not remedied promptly, is likely to have a material adverse effect upon the financial condition or the liquidity of the insurer or its insurance holding company system as a whole. If and when adopted by a particular state, the Amended Model Act and Regulation would impose more extensive informational requirements on us in order to protect the licensed insurance companies from enterprise risk, including requiring us to prepare an annual enterprise risk report that identifies the material risks within the insurance company holding system that could pose enterprise risk to the licensed insurer. In addition, the Amended Model Act and Regulation requires any controlling person of a domestic insurer seeking to divest its controlling interest to file a notice of its proposed divestiture, which may be subject to approval by the insurance commissioner. The Amended Model Act and Regulation must be adopted by the individual states, and specifically states in which we are licensed, for the new requirements to apply to us. The NAIC has made certain sections of the amendments part of its accreditation standards for state solvency regulation, which may motivate more states to adopt the amendments promptly. Additional requirements are also expected. For example, the NAIC has adopted the Risk Management and Own Risk and Solvency Assessment (“ORSA”) Model Act, which, when adopted by the states, will require insurers to perform a risk and solvency assessment and, upon request of a state, file an ORSA Summary Report with the state. The ORSA Summary Report will be required in 2015, subject to the various dates of adoption by states, and will describe our process for assessing our own solvency.
In 2013, New York, where KICO is domiciled, adopted its version of the Amended Model Act and Regulation. The statute requires a holding company that directly or indirectly controls an insurer to adopt a formal enterprise risk management function and file an enterprise risk report with the DFS by April 30 of each year commencing in 2014. In 2014, the DFS promulgated the implementing regulations. The report must identify the material risks within the holding company system that could pose enterprise risk to the insurer. In addition, any holding company seeking to divest its controlling interest in a domestic insurer is required to file with the DFS a notice of its proposed divestiture at least thirty days prior to cessation of control. Also in 2014 the DFS also promulgated two amendments to its holding company regulation affecting the transactions between the insurer and any person in the holding company system and requiring additional information in applications for control. In 2015, the DFS indicated that it will initiate new targeted cybersecurity assessments for insurance companies.
On November 9, 2015, the DFS sent a letter to financial regulators outlining the parameters of the regulations. While the letter primarily addresses banking institutions, it is expected the regulations will also apply to insurance companies.
On July 21, 2010, the President signed into law the Dodd-Frank Wall Street Reform and Consumer Protection Act (the “Dodd-Frank Act”) that established a Federal Insurance Office (the “FIO”) within the U.S. Department of the Treasury. The FIO is initially charged with monitoring all aspects of the insurance industry (other than health insurance, certain long-term care insurance and crop insurance), gathering data, and conducting a study on methods to modernize and improve the insurance regulatory system in the United States. On December 12, 2013, the FIO issued a report (as required under the Dodd-Frank Act) entitled “How to Modernize and Improve the System of Insurance Regulation in the United States” (the “Report”), which stated that, given the “uneven” progress the states have made with several near-term state reforms, should the states fail to accomplish the necessary modernization reforms in the near term, “Congress should strongly consider direct federal involvement.” The FIO continues to support the current state-based regulatory regime, but will consider federal regulation should the states fail to take steps to greater uniformity (e.g., federal licensing of insurers).
19
State Insurance Department Examinations
As part of their regulatory oversight process, state insurance departments conduct periodic detailed examinations of the financial reporting of insurance companies domiciled in their states, generally once every three to five years. Examinations are generally carried out in cooperation with the insurance departments of other states under guidelines promulgated by the NAIC.
Risk-Based Capital Regulations
State insurance departments impose risk-based capital (“RBC”) requirements on insurance enterprises. The RBC Model serves as a benchmark for the regulation of insurance companies by state insurance regulators. RBC provides for targeted surplus levels based on formulas, which specify various weighting factors that are applied to financial balances or various levels of activity based on the perceived degree of risk, and are set forth in the RBC requirements. Such formulas focus on four general types of risk: (a) the risk with respect to the company’s assets (asset or default risk); (b) the risk of default on amounts due from reinsurers, policyholders, or other creditors (credit risk); (c) the risk of underestimating liabilities from business already written or inadequately pricing business to be written in the coming year (underwriting risk); and (d) the risk associated with items such as excessive premium growth, contingent liabilities, and other items not reflected on the balance sheet (off-balance sheet risk). The amount determined under such formulas is called the authorized control level RBC (“ACLC”).
The RBC guidelines define specific capital levels based on a company’s ACLC that are determined by the ratio of the company’s total adjusted capital (“TAC”) to its ACLC. TAC is equal to statutory capital, plus or minus certain other specified adjustments. KICO was in compliance with New York’s RBC requirements as of December 31, 2015.
Dividend Limitations
Our ability to receive dividends from KICO is restricted by the state laws and insurance regulations of New York. These restrictions are related to surplus and net investment income. Dividends are restricted to the lesser of 10% of surplus or 100% of investment income (on a statutory accounting basis) for the trailing 36 months, less dividends paid during such period.
Insurance Regulatory Information System Ratios
The Insurance Regulatory Information System, or IRIS, was developed by the NAIC and is intended primarily to assist state insurance departments in executing their statutory mandates to oversee the financial condition of insurance companies operating in their respective states. IRIS identifies thirteen industry ratios and specifies “usual values” for each ratio. Departure from the usual values on four or more of the ratios can lead to inquiries from individual state insurance commissioners as to certain aspects of an insurer’s business.
20
As of December 31, 2015, as a result of its growth and reduction of its quota share reinsurance percentages, KICO had two ratios outside the usual range due to an increase in net premiums written and an estimated current reserve deficiency to surplus.
Accounting Principles
Statutory accounting principles (“SAP”) are a basis of accounting developed by the NAIC. They are used to prepare the statutory financial statements of insurance companies and to assist insurance regulators in monitoring and regulating the solvency of insurance companies. SAP is primarily concerned with measuring an insurer’s surplus to policyholders. Accordingly, statutory accounting focuses on valuing assets and liabilities of insurers at financial reporting dates in accordance with appropriate insurance law and regulatory provisions applicable in each insurer’s domiciliary state.
Generally accepted accounting principles (“GAAP”) is concerned with a company’s solvency, but is also concerned with other financial measurements, principally income and cash flows. Accordingly, GAAP gives more consideration to appropriate matching of revenue and expenses and accounting for management’s stewardship of assets than does SAP. As a direct result, different assets and liabilities and different amounts of assets and liabilities will be reflected in financial statements prepared in accordance with GAAP as compared to SAP.
Statutory accounting practices established by the NAIC and adopted in part by the New York insurance regulators, determine, among other things, the amount of statutory surplus and statutory net income of KICO and thus determine, in part, the amount of funds that are available to pay dividends to Kingstone Companies, Inc.
Legal Structure
We were incorporated in 1961 and assumed the name DCAP Group, Inc. in 1999. On July 1, 2009, we changed our name to Kingstone Companies, Inc.
Offices
Our principal executive offices are located at 15 Joys Lane, Kingston, New York 12401, and our telephone number is (845) 802-7900. Our insurance underwriting business is located principally at 15 Joys Lane, Kingston, New York 12401. Our insurance underwriting business maintains an executive office located at 70 East Sunrise Highway, Valley Stream, New York 11581. Our website is www.kingstonecompanies.com. Our internet website and the information contained therein or connected thereto are not intended to be incorporated by reference into this Annual Report.
Employees
As of December 31, 2015, we had 69 employees all of whom are located in New York. None of our employees are covered by a collective bargaining agreement. We believe that our relationship with our employees is good.
ITEM 1A. RISK FACTORS.
Not applicable. See, however, “Management’s Discussion and Analysis of Financial Condition and Results of Operations – Factors That May Affect Future Results and Financial Condition” in Item 7 of this Annual Report.
21
ITEM 1B. UNRESOLVED STAFF COMMENTS.
Not applicable.
ITEM 2. PROPERTIES.
Our principal executive offices are currently located at 15 Joys Lane, Kingston, New York 12401. Our insurance underwriting business is located principally at 15 Joys Lane, Kingston, New York 12401. Our insurance underwriting business also maintains an executive office located at 70 East Sunrise Highway, Valley Stream, New York 11581, at which we lease 3,250 square feet of space.
We own the building at which our insurance underwriting business principally operates, free of mortgage.
ITEM 3. LEGAL PROCEEDINGS.
None.
ITEM 4. MINE SAFETY DISCLOSURES.
Not applicable.
22
PART II
|
ITEM 5.
|
MARKET FOR REGISTRANT’S COMMON EQUITY, RELATED STOCKHOLDER MATTERS AND ISSUER PURCHASES OF EQUITY SECURITIES.
|
Market Information
Our common stock is quoted on The NASDAQ Capital Market under the symbol “KINS.”
Set forth below are the high and low sales prices for our common stock for the periods indicated, as reported on The NASDAQ Capital Market.
|
High
|
Low
|
|||||||
|
2015 Calendar Year
|
||||||||
|
First Quarter
|
$ | 8.22 | $ | 7.50 | ||||
|
Second Quarter
|
7.79 | 6.11 | ||||||
|
Third Quarter
|
9.47 | 7.50 | ||||||
|
Fourth Quarter
|
10.00 | 8.47 | ||||||
|
High
|
Low
|
|||||||
|
2014 Calendar Year
|
||||||||
|
First Quarter
|
$ | 7.90 | $ | 6.66 | ||||
|
Second Quarter
|
7.24 | 5.66 | ||||||
|
Third Quarter
|
8.24 | 6.53 | ||||||
|
Fourth Quarter
|
8.97 | 7.44 | ||||||
Holders
As of March 8, 2016, there were approximately 299 record holders of our common stock.
Dividends
Holders of our common stock are entitled to dividends when and if declared by our Board of Directors out of funds legally available. During 2015, we paid quarterly dividends of $0.05 per share on March 13, 2015, June 15, 2015 and September 14, 2015, and $.0625 per share on December 14, 2015. During 2014, we paid quarterly dividends of $0.04 per share on March 14, 2014 and June 13, 2014, and $.05 per share on September 15, 2014 and December 12, 2014. Future dividend policy will be subject to the discretion of our Board of Directors and will be contingent upon future earnings, if any, our financial condition, capital requirements, general business conditions, and other factors. Therefore, we can give no assurance that future dividends of any kind will continue to be paid to holders of our common stock.
Our ability to pay dividends depends, in part, upon on the ability of KICO to pay dividends to us. KICO, as an insurance company, is subject to significant regulatory restrictions limiting its ability to declare and pay dividends. See “Business – Government Regulation” and “Management’s Discussion and Analysis of Financial Condition and Results of Operation – Liquidity” in Items 1 and 7, respectively, of this Annual Report.
23
We declared and paid dividends on our common stock as follows:
|
2015
|
2014
|
|||||||
|
Common stock dividends declared
|
$ | 1,557,398 | $ | 1,312,625 | ||||
Recent Sales of Unregistered Securities
None.
Issuer Purchases of Equity Securities
The following table set forth certain information with respect to purchases of common stock made by us or any “affiliated purchaser” during the quarter ended December 31, 2015:
|
Period
|
Total Number of Shares Purchased
|
Average Price Paid per Share
|
Total Number of Shares Purchased as Part of Publicly Announced Plans or Programs
|
Maximum Number of Shares that May Be Purchased Under the Plans or Programs
|
||||||||||||
|
10/1/15 – 10/31/15
|
- | - | - | - | ||||||||||||
|
11/1/15 – 11/30/15
|
- | - | - | - | ||||||||||||
|
12/1/15 – 12/31/15
|
8,181 | $ | 9.04 | - | - | |||||||||||
|
Total
|
8,181 | $ | 9.04 | - | - | |||||||||||
|
ITEM 6.
|
SELECTED FINANCIAL DATA.
|
Not applicable.
|
ITEM 7.
|
MANAGEMENT’S DISCUSSION AND ANALYSIS OF FINANCIAL CONDITION AND RESULTS OF OPERATIONS.
|
Overview
We offer property and casualty insurance products to small businesses and individuals in New York State through our subsidiary, Kingstone Insurance Company (“KICO”). KICO’s insureds are located primarily in downstate New York, consisting of New York City, Long Island and Westchester County. We are also licensed in the States of New Jersey, Connecticut, Pennsylvania and Texas.
We derive substantially all of our revenue from KICO, which includes revenues from earned premiums, ceding commissions from quota share reinsurance, net investment income generated from its portfolio, and net realized gains and losses on investment securities. All of KICO’s insurance policies are for a one year period. Earned premiums represent premiums received from insureds, which are recognized as revenue over the period of time that insurance coverage is provided (i.e., ratably over the one year life of the policy). A significant period of time normally elapses between the receipt of insurance premiums and the payment of insurance claims. During this time, KICO invests the premiums, earns investment income and generates net realized and unrealized investment gains and losses on investments.
24
Our expenses include the insurance underwriting expenses of KICO and other operating expenses. Insurance companies incur a significant amount of their total expenses from losses incurred by policyholders, which are commonly referred to as claims. In settling these claims for losses, various loss adjustment expenses (“LAE”) are incurred such as insurance adjusters’ fees and litigation expenses. In addition, insurance companies incur policy acquisition costs. Policy acquisition costs include commissions paid to producers, premium taxes, and other expenses related to the underwriting process, including employees’ compensation and benefits.
Other operating expenses include our corporate expenses as a holding company. These expenses include legal and auditing fees, executive employment costs, and other costs directly associated with being a public company.
Principal Revenue and Expense Items
Net premiums earned. Net premiums earned is the earned portion of our written premiums, less that portion of premium that is ceded to third party reinsurers under reinsurance agreements. The amount ceded under these reinsurance agreements is based on a contractual formula contained in the individual reinsurance agreement. Insurance premiums are earned on a pro rata basis over the term of the policy. At the end of each reporting period, premiums written that are not earned are classified as unearned premiums and are earned in subsequent periods over the remaining term of the policy. Our insurance policies have a term of one year. Accordingly, for a one-year policy written on July 1, 2014, we would earn half of the premiums in 2014 and the other half in 2015.
Ceding commission revenue. Commissions on reinsurance premiums ceded are earned in a manner consistent with the recognition of the direct acquisition costs of the underlying insurance policies, generally on a pro-rata basis over the terms of the policies reinsured.
Net investment income and net realized gains (losses) on investments. We invest in cash and cash equivalents, short-term investments, fixed-maturity and equity securities. Our net investment income includes interest and dividends earned on our invested assets, less investment expenses. Net realized gains and losses on our investments are reported separately from our net investment income. Net realized gains occur when our investment securities are sold for more than their costs or amortized costs, as applicable. Net realized losses occur when our investment securities are sold for less than their costs or amortized costs, as applicable, or are written down as a result of other-than-temporary impairment. We classify equity securities as available-for-sale and our fixed-maturity securities as either available-for-sale or held-to-maturity. Net unrealized gains (losses) on those securities classified as available-for-sale are reported separately within accumulated other comprehensive income on our balance sheet.
Other income. We recognize installment fee income and fees charged to reinstate a policy after it has been cancelled for non-payment. Through March 31, 2015, we also recognized premium finance fee income on loans financed by a third party finance company.
Loss and loss adjustment expenses incurred. Loss and loss adjustment expenses (“LAE”) incurred represent our largest expense item, and for any given reporting period, include estimates of future claim payments, changes in those estimates from prior reporting periods and costs associated with investigating, defending and servicing claims. These expenses fluctuate based on the amount and types of risks we insure. We record loss and LAE related to estimates of future claim payments based on case-by-case valuations, statistical analyses and actuarial procedures. We seek to establish all reserves at the most likely ultimate liability based on our historical claims experience. It is typical for certain claims to take several years to settle and we revise our estimates as we receive additional information on such claims. Our ability to estimate loss and LAE accurately at the time of pricing our insurance policies is a critical factor affecting our profitability.
25
Commission expenses and other underwriting expenses. Other underwriting expenses include policy acquisition costs and other expenses related to the underwriting of policies. Policy acquisition costs represent the costs of originating new insurance policies that vary with, and are primarily related to, the production of insurance policies (principally commissions, premium taxes and certain underwriting salaries). Policy acquisition costs are deferred and recognized as expense as the related premiums are earned. Other underwriting expenses represent general and administrative expenses of our insurance business and are comprised of other costs associated with our insurance activities such as regulatory fees, telecommunication and technology costs, occupancy costs, employment costs, and legal and auditing fees.
Other operating expenses. Other operating expenses include the corporate expenses of our holding company, Kingstone Companies, Inc. These expenses include executive employment costs, legal and auditing fees, and other costs directly associated with being a public company.
Stock-based compensation. Non-cash equity compensation includes the fair value of stock grants issued to our directors, officers and employees, and amortization of stock options issued to the same.
Depreciation and amortization. Depreciation and amortization includes the amortization of intangibles related to the acquisition of KICO, depreciation of the real estate used in KICO’s operations, as well as depreciation of capital expenditures for information technology projects, office equipment and furniture.
Income tax expense. We incur federal income tax expense on our consolidated operations as well as state income tax expense for our non-insurance underwriting subsidiaries.
Product Lines
Our product lines include the following:
Personal lines: Our largest line of business is personal lines, consisting of homeowners, dwelling fire, 3-4 family dwelling package, cooperative and condominium, renters, equipment breakdown and service line endorsements, and personal umbrella policies.
Commercial liability: We offer business owners policies, which consist primarily of small business retail, service, and office risks without a residential exposure. We also write artisan’s liability policies for small independent contractors with seven or fewer employees. In addition, we write special multi-peril policies for larger and more specialized business owners’ risks, including those with limited residential exposures.
Commercial automobile: Until recently we provided liability and physical damage coverage for light vehicles owned by small contractors and artisans. However, due to the poor performance of this line, effective October 1, 2014, we decided to no longer accept new commercial auto policies. In February 2015, we decided to no longer offer renewals to our existing commercial auto policies beginning with those that expired on or after May 1, 2015.
26
Livery physical damage: We write for-hire vehicle physical damage only policies for livery and car service vehicles and taxicabs. These policies insure only the physical damage portion of insurance for such vehicles, with no liability coverage included.
Other: We write canine legal liability policies and also have a small participation in mandatory state joint underwriting associations.
Key Measures
We utilize the following key measures in analyzing the results of our insurance underwriting business:
Net loss ratio: The net loss ratio is a measure of the underwriting profitability of an insurance company’s business. Expressed as a percentage, this is the ratio of net losses and loss adjustment expenses (“LAE”) incurred to net premiums earned.
Net underwriting expense ratio: The net underwriting expense ratio is a measure of an insurance company’s operational efficiency in administering its business. Expressed as a percentage, this is the ratio of the sum of acquisition costs (the most significant being commissions paid to our producers) and other underwriting expenses less ceding commission revenue less other income to net premiums earned.
Net combined ratio: The net combined ratio is a measure of an insurance company’s overall underwriting profit. This is the sum of the net loss and net underwriting expense ratios. If the net combined ratio is at or above 100 percent, an insurance company cannot be profitable without investment income, and may not be profitable if investment income is insufficient.
Underwriting income: Underwriting income is net pre-tax income attributable to our insurance underwriting business before investment activity. It excludes net investment income, net realized gains from investments, and depreciation and amortization (net premiums earned less expenses included in combined ratio). Underwriting income is a measure of an insurance company’s overall operating profitability before items such as investment income, depreciation and amortization, interest expense and income taxes.
Critical Accounting Policies and Estimates
Our consolidated financial statements include the accounts of Kingstone Companies, Inc. and all majority-owned and controlled subsidiaries. The preparation of financial statements in conformity with accounting principles generally accepted in the United States requires our management to make estimates and assumptions in certain circumstances that affect amounts reported in our consolidated financial statements and related notes. In preparing these financial statements, our management has utilized information available including our past history, industry standards and the current economic environment, among other factors, in forming its estimates and judgments of certain amounts included in the consolidated financial statements, giving due consideration to materiality. It is possible that the ultimate outcome as anticipated by our management in formulating its estimates inherent in these financial statements might not materialize. However, application of the critical accounting policies involves the exercise of judgment and use of assumptions as to future uncertainties and, as a result, actual results could differ from these estimates. In addition, other companies may utilize different estimates, which may impact comparability of our results of operations to those of companies in similar businesses.
27
We believe that the most critical accounting policies relate to the reporting of reserves for loss and LAE, including losses that have occurred but have not been reported prior to the reporting date, amounts recoverable from third party reinsurers, deferred ceding commission revenue, deferred policy acquisition costs, deferred income taxes, the impairment of investment securities, intangible assets and the valuation of stock-based compensation. See Note 2 (Accounting Policies and Basis of Presentation) of the Notes to Consolidated Financial Statements following Item 15 of this Annual Report.
Consolidated Results of Operations
The following table summarizes the changes in the results of our operations for the periods indicated:
|
Year ended December 31,
|
||||||||||||||||
|
($ in thousands)
|
2015
|
2014
|
Change
|
Percent
|
||||||||||||
|
Revenues
|
||||||||||||||||
|
Direct written premiums
|
$ | 91,004 | $ | 76,255 | $ |
14,749
|
19.3 | % | ||||||||
|
Assumed written premiums
|
41 | 49 | (8 | ) | (16.3 | )% | ||||||||||
| 91,045 | 76,304 | 14,741 | 19.3 | % | ||||||||||||
|
Ceded written premiums
|
||||||||||||||||
|
Ceded to quota share treaties in force during the period
|
28,701 | 35,887 | (7,186 | ) | (20.0 | )% | ||||||||||
|
Return of premiums previously ceded to prior quota share treaties
|
(5,866 | ) | (6,597 | ) | 731 | (11.1 | )% | |||||||||
|
Ceded to quota share treaties
|
22,835 | 29,290 | (6,455 | ) | (22.0 | )% | ||||||||||
|
Ceded to excess of loss treaties
|
1,277 | 1,039 | 238 | 22.9 | % | |||||||||||
|
Ceded to catastrophe treaties
|
6,548 | 2,611 | 3,937 | 150.8 | % | |||||||||||
|
Catastrophe reinstatement (1)
|
- | 70 | (70 | ) | (100.0 | )% | ||||||||||
|
Total ceded written premiums
|
30,660 | 33,010 | (2,350 | ) | (7.1 | )% | ||||||||||
|
Net written premiums
|
60,385 | 43,294 | 17,091 | 39.5 | % | |||||||||||
|
Change in net unearned premiums
|
(11,773 | ) | (10,666 | ) | (1,107 | ) | 10.4 | % | ||||||||
|
Net premiums earned
|
48,612 | 32,628 | 15,984 | 49.0 | % | |||||||||||
|
Ceding commission revenue
|
||||||||||||||||
|
Excluding the effect of catastrophes
|
12,754 | 14,427 | (1,673 | ) | (11.6 | )% | ||||||||||
|
Effect of catastrophes (1)
|
(1,281 | ) | (517 | ) | (764 | ) | 147.8 | % | ||||||||
|
Total ceding commission revenue
|
11,473 | 13,910 | (2,437 | ) | (17.5 | )% | ||||||||||
|
Net investment income
|
2,564 | 1,800 | 764 | 42.4 | % | |||||||||||
|
Net realized gain (loss) on investments
|
(50 | ) | 707 | (757 | ) | (107.1 | )% | |||||||||
|
Other income
|
1,577 | 1,006 | 571 | 56.8 | % | |||||||||||
|
Total revenues
|
64,176 | 50,051 | 14,125 | 28.2 | % | |||||||||||
|
Expenses
|
||||||||||||||||
|
Loss and loss adjustment expenses
|
||||||||||||||||
|
Direct and assumed:
|
||||||||||||||||
|
Loss and loss adjustment expenses excluding the effect of catastrophes
|
32,962 | 28,146 | 4,816 | 17.1 | % | |||||||||||
|
Losses from catastrophes (1)
|
4,646 | 3,764 | 882 | 23.4 | % | |||||||||||
|
Total direct and assumed loss and loss adjustment expenses
|
37,608 | 31,910 | 5,698 | 17.9 | % | |||||||||||
|
Ceded loss and loss adjustment expenses:
|
||||||||||||||||
|
Loss and loss adjustment expenses excluding the effect of catastrophes
|
11,873 | 12,055 | (182 | ) | (1.5 | )% | ||||||||||
|
Losses from catastrophes (1)
|
2,555 | 2,823 | (268 | ) | (9.5 | )% | ||||||||||
|
Total ceded loss and loss adjustment expenses
|
14,428 | 14,878 | (450 | ) | (3.0 | )% | ||||||||||
|
Net loss and loss adjustment expenses:
|
||||||||||||||||
|
Loss and loss adjustment expenses excluding the effect of catastrophes
|
21,089 | 16,091 | 4,998 | 31.1 | % | |||||||||||
|
Losses from catastrophes (1)
|
2,091 | 941 | 1,150 | 122.2 | % | |||||||||||
|
Net loss and loss adjustment expenses
|
23,180 | 17,032 | 6,148 | 36.1 | % | |||||||||||
|
Commission expense
|
15,317 | 12,125 | 3,192 | 26.3 | % | |||||||||||
|
Other underwriting expenses
|
12,833 | 10,656 | 2,177 | 20.4 | % | |||||||||||
|
Other operating expenses
|
1,504 | 1,487 | 17 | 1.1 | % | |||||||||||
|
Depreciation and amortization
|
1,032 | 875 | 157 | 17.9 | % | |||||||||||
|
Total expenses
|
53,867 | 42,176 | 11,691 | 27.7 | % | |||||||||||
|
Income from operations before taxes
|
10,309 | 7,875 | 2,434 | 30.9 | % | |||||||||||
|
Provision for income tax
|
3,349 | 2,547 | 802 | 31.5 | % | |||||||||||
|
Net income
|
$ | 6,960 | $ | 5,328 | $ | 1,632 | 30.6 | % | ||||||||
28
(1) For the years ended December 31, 2015 and 2014, includes the effects of severe winter weather (which we define as a catastrophe). The year ended December 31, 2014 also includes catastrophe reinstatement premiums resulting from Superstorm Sandy, which occurred on October 29, 2012. We define a “catastrophe” as an event or series of related events that involve multiple first party policyholders, or an event or series of events that produce a number of claims in excess of a preset, per-event threshold of average claims in a specific area, occurring within a certain amount of time constituting the event or series of events. Catastrophes are caused by various natural events including high winds, excessive rain, winter storms, severe winter weather, tornadoes, hailstorms, wildfires, tropical storms, and hurricanes.
|
Year ended December 31,
|
||||||||||||||||
|
2015
|
2014
|
Point Change
|
Percent Change
|
|||||||||||||
|
Key ratios:
|
||||||||||||||||
|
Net loss ratio
|
47.7 | % | 52.2 | % | -4.5 | % | (8.6 | )% | ||||||||
|
Net underwriting expense ratio
|
32.3 | % | 24.9 | % | 7.4 | % | 29.7 | % | ||||||||
|
Net combined ratio
|
80.0 | % | 77.1 | % | 2.9 | % | 3.8 | % | ||||||||
Direct Written Premiums
Direct written premiums during the year ended December 31, 2015 (“2015”) were $91,004,000 compared to $76,255,000 during the year ended December 31, 2014 (“2014”). The increase of $14,749,000, or 19.3%, was primarily due to an increase in policies in-force during 2015 as compared to 2014. We wrote more new policies as a result of continued demand for our products in the markets that we serve. Policies in-force increased by 17.9% as of December 31, 2015 compared to December 31, 2014.
Our growth rate in direct premiums written was dampened somewhat due to the cessation, effective October 1, 2014, of the writing of new policies in our commercial auto line of business due to a history of poor underwriting results. In February 2015, we made the decision to no longer offer renewals on our existing commercial auto policies beginning with those that expire on or after May 1, 2015.
Our direct written premiums in our other lines of business grew by 23.9% in 2015 compared to 2014. Policies-in-force in our other lines of business increased by 19.5% as of December 31, 2015 compared to December 31, 2014.
Net Written Premiums and Net Premiums Earned
The following table describes the quota share reinsurance ceding rates in effect during 2015 and 2014. For purposes of the discussion herein, the change in quota share ceding rates on July 1 of each year will be referred to as “the Cut-off”. This table should be referred to in conjunction with the discussions for net written premiums, net premiums earned, ceding commission revenue and net loss and loss adjustment expenses that follow.
|
Year ended December 31, 2015
|
Year ended December 31, 2014
|
|||||||||||||||
|
January 1,
|
July 1,
|
January 1,
|
July 1,
|
|||||||||||||
|
to
|
to
|
to
|
to
|
|||||||||||||
|
June 30,
|
December 31,
|
June 30,
|
December 31,
|
|||||||||||||
|
("2014/2015 Treaty")
|
("2015/2016 Treaty")
|
("2013/2014 Treaties")
|
("2014/2015 Treaty")
|
|||||||||||||
|
Quota share reinsurance rates
|
||||||||||||||||
|
Personal lines
|
55 | % | 40 | % | 75 | % | 55 | % | ||||||||
|
Commercial lines
|
none
|
none
|
25 | % |
none
|
|||||||||||
29
Net written premiums increased $17,091,000, or 39.5%, to $60,385,000 in 2015 from $43,294,000 in 2014. Net written premiums include direct and assumed premiums, less the amount of written premiums ceded under our reinsurance treaties (quota share, excess of loss, and catastrophe). Our personal lines business is currently subject to a quota share treaty and our commercial lines business was subject to a quota share treaty through June 30, 2014. A reduction to the quota share percentage or elimination of a quota share treaty will reduce our ceded written premiums, which will result in a corresponding increase to our net written premiums.
Effective July 1, 2015, we decreased the quota share ceding rate in our personal lines quota share treaty from 55% to 40%. The Cut-off of this treaty on July 1, 2015 resulted in a $5,866,000 return of unearned premiums from our reinsurers that were previously ceded under the expiring personal lines quota share treaty. The new treaty is on a “net” of catastrophe reinsurance basis, as opposed to the “gross” arrangement that existed in prior years. Under a “net” arrangement, all catastrophe reinsurance coverage is now purchased directly by us.
Effective July 1, 2014, we terminated our commercial lines quota share treaty. The previous commercial lines quota share treaty effective July 1, 2013 had a quota share percentage of 25%. Also, effective July 1, 2014, we decreased the quota share percentage in our personal lines quota share treaty from 75% to 55%. The Cut-off of these treaties on July 1, 2014 resulted in a $6,597,000 return of unearned premiums from our reinsurers that were previously ceded under the expiring quota share treaties.
Most of the premiums written under our personal lines are also subject to our catastrophe treaty. An increase in our personal lines business gives rise to more property exposure, which increases our exposure to catastrophe risk; therefore, our premiums for catastrophe insurance will increase. This results in an increase in premiums ceded under our catastrophe treaty, which reduces net written premiums. With the inception of our personal lines quota share treaty being on a “net” basis effective July 1, 2015, our catastrophe premiums are ceded based on substantially all of our personal lines direct written premiums, compared to catastrophe premiums being ceded only on the amount of personal lines written premiums that we retained under the expired “gross” basis. As a result of the increase in our personal lines business and the change to a “net” basis for our personal lines quota share treaty, ceded catastrophe premiums increased by $3,937,000, or 150.8%, to $6,548,000 in 2015 from $3,937,000 in 2014.
An increase in written premiums will also increase the premiums ceded under our excess of loss treaties, which will also reduce our net written premiums. In 2015, our ceded excess of loss reinsurance premiums increased by $238,000 over the ceded premiums for 2014.
Net premiums earned increased $15,984,000, or 49.0%, to $48,612,000 in 2015 from $32,628,000 in 2014. The increase was primarily due to us retaining more earned premiums as result of the reduction of the quota share percentage in our personal lines quota share treaty and the elimination of the commercial lines treaty on July 1, 2014. The decreases in our quota share ceding percentages from the July 1, 2015 and 2014 Cut-offs gave us a return of premiums previously ceded, which increases our net premiums earned during the twelve month periods after the Cut-offs. In addition, as premiums written earn ratably over a twelve month period, net premiums earned in 2015 increased due to the higher net written premiums generated for the twelve months ended December 31, 2015 compared to the twelve months ended December 31, 2014.
30
Ceding Commission Revenue
The following table describes the quota share provisional ceding commission rates in effect during 2015 and 2014. This table should be referred to in conjunction with the discussion for ceding commission revenue that follows.
|
Year ended December 31, 2015
|
Year ended December 31, 2014
|
|||||||||||||||
|
January 1,
|
July 1,
|
January 1,
|
July 1,
|
|||||||||||||
|
to
|
to
|
to
|
to
|
|||||||||||||
|
June 30,
|
December 31,
|
June 30,
|
December 31,
|
|||||||||||||
|
("2014/2015 Treaty")
|
("2015/2016 Treaty")
|
("2013/2014 Treaties")
|
("2014/2015 Treaty")
|
|||||||||||||
|
Provisional ceding commission rate on quota share treaty
|
||||||||||||||||
|
Personal lines
|
40 | % | 55 | % | 40 | % | 40 | % | ||||||||
|
Commercial lines
|
none
|
none
|
36 | % |
none
|
|||||||||||
The following table summarizes the changes in the components of ceding commission revenue (in thousands) for the periods indicated:
|
Year ended December 31,
|
||||||||||||||||
|
($ in thousands)
|
2015
|
2014
|
Change
|
Percent
|
||||||||||||
|
Provisional ceding commissions earned
|
$ | 11,692 | $ | 12,456 | $ | (764 | ) | (6.1 | )% | |||||||
|
Contingent ceding commissions earned
|
||||||||||||||||
|
Contingent ceding commissions earned excluding
|
||||||||||||||||
|
the effect of catastrophes
|
1,062 | 1,971 | (909 | ) | (46.1 | )% | ||||||||||
|
Effect of catastrophes on ceding commisions earned
|
(1,281 | ) | (517 | ) | (764 | ) | 147.8 | % | ||||||||
|
Contingent ceding commissions earned
|
(219 | ) | 1,454 | (1,673 | ) | (115.1 | )% | |||||||||
|
Total ceding commission revenue
|
$ | 11,473 | $ | 13,910 | $ | (2,437 | ) | (17.5 | )% | |||||||
Ceding commission revenue was $11,473,000 in 2015 compared to $13,910,000 in 2014. The decrease of $2,437,000, or 17.5%, was due to a decrease in provisional ceding commissions earned and a decrease in contingent ceding commissions earned.
Provisional Ceding Commissions Earned
We receive a provisional ceding commission based on ceded written premiums. Under the terms of the 2015/2016 Treaty, the provisional ceding commission rate increased to 55% from 40% under the 2014/2015 Treaty. Provisional ceding commission earned was $11,692,000 in 2015 compared to $12,456,000 in 2014. The decrease of $764,000, or 6.1%, in provisional ceding commissions earned is due to: (1) a decrease in the amount of premiums subject to provisional ceding commissions, (2) a decrease in the percentage of ceded premiums subject to quota share under the “net” 2015/2016 Treaty compared to the “gross” 2014/2015 Treaty, and (3) partially offset by the increase in the provisional ceding commission rates under the 2015/2016 Treaty.
31
Contingent Ceding Commissions Earned
As a result of the increase in the provisional ceding commission rate to 55% under the 2015/2016 Treaty from 40% under the 2014/2015 Treaty, we do not have an opportunity to earn as much contingent ceding commissions. Under the “net” treaty in effect as of July 1, 2015, catastrophe losses in excess of the first $4,000,000 will fall outside of the quota share treaty and such losses will not have an impact on contingent ceding commissions, as was the case under previous “gross” treaties. The new structure eliminates the adverse impact that catastrophe losses above $4,000,000 would have on contingent ceding commissions.
We receive a contingent ceding commission based on a sliding scale in relation to the losses incurred under our quota share treaties. The lower the ceded loss ratio, the more contingent commission we receive. The amount of contingent ceding commissions we are eligible to receive under the two personal lines quota share treaties described in the table above that were in effect during 2015 are subject to change based on losses incurred from claims with accident dates beginning July 1, 2014. The amount of contingent ceding commissions we are eligible to receive under our prior years’ quota share treaties is subject to change based on losses incurred related to claims with accident dates before July 1, 2014 under those treaties. In addition, our total ceding contingent commission revenue was reduced in 2015 due to us not renewing our commercial lines quota share treaty upon its expiration on June 30, 2014.
The term of our expired personal lines reinsurance quota share treaty covered the period from July 1, 2013 to June 30, 2015 (“2013/2015 Treaty”). The computation to arrive at contingent ceding commission revenue under the 2013/2015 Treaty included catastrophe losses and LAE incurred from severe winter weather during 2015 and 2014 (see discussion of “Net Loss and LAE” below). Such losses increased our ceded loss ratio in our 2013/2015 Treaty, which reduced our contingent ceding commission revenue in accordance with the sliding scale discussed above in 2015 and 2014 by $1,281,000 and $517,000, respectively. See “Reinsurance” below for changes to our personal lines quota share treaty effective July 1, 2015.
Net Investment Income
Net investment income was $2,564,000 in 2015 compared to $1,800,000 in 2014. The increase of $764,000, or 42.4%, was due to an increase in average invested assets in 2015. The increase in cash and invested assets resulted primarily from: (1) the proceeds of $18,804,000 that we received on December 13, 2013 from our public offering being fully deployed in 2015 as compared to the partial deployment in 2014, (2) increased operating cash flows for the period after December 31, 2014, and (3) a decrease in investment expenses due to a rate decrease in our custodial fees. The increase in operating cash flows is due in part from the reduction in quota share rates on July 1, 2015 and 2014. The reduction in quota share ceding rates results in a decline in ceded premiums, which leads to more cash flow and more invested funds. The pre-tax equivalent investment yield on estimated annual income, excluding cash, was 4.77% and 4.67% as of December 31, 2015 and 2014, respectively.
Other Income
Other income was $1,577,000 in 2015 compared to $1,006,000 in 2014. The increase of $571,000, or 56.8%, was primarily due to the $350,000 we received as early settlement of the termination agreement that generated placement fees in our premium finance business (see Note 19 to the Consolidated Financial Statements).
32
Net Loss and LAE
Net loss and LAE was $23,180,000 in 2015 compared to $17,032,000 in 2014. The net loss ratio was 47.7% in 2015 compared to 52.2% in 2014, a decrease of 4.5 percentage points. The following graphs summarize the changes in the components of net loss ratio for the periods indicated:
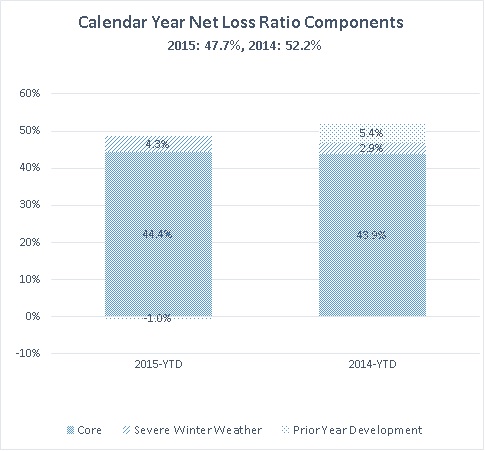
During 2015, our calendar year net loss ratio decreased by 4.5 points as compared to 2014. The primary driver of the decrease is an improvement in prior year loss development, as we recorded 1.0 points of favorable prior year loss development in 2015 compared to 5.4 points of adverse (unfavorable) prior year development in 2014, or an improvement of 6.4 points. Offsetting some of the improvement in prior year loss development was the impact of severe winter weather, determined as the losses incurred over and above those expected in an average winter season. Severe winter weather had a 4.3 point impact on the net loss ratio in 2015 compared to 2.9 points in 2014, an increase of 1.4 points. The core loss ratio (excluding prior year loss development and severe winter weather) was stable, at 44.4% in 2015 compared to 43.9% for 2014, an increase of 0.5 points. The provision in our current year catastrophe reinsurance treaty that adds coverage for winter storm losses in excess of $4,000,000 over any 28 day period was not triggered by the winter weather in 2015. See table below under “Additional Financial Information” summarizing net loss ratios by line of business.
Commercial Auto Line of Business
Effective October 1, 2014 we decided to no longer accept applications for new commercial auto coverage. The action was taken following a series of underwriting and pricing measures which were intended to improve the profitability of this line of business. The actions taken did not yield the hoped for results. In February 2015, we decided to no longer offer renewals to our existing commercial auto policies beginning with those that expired on or after May 1, 2015. As of December 31, 2015, we had 134 commercial auto policies in force, which represented 0.3% of our policies in force. As of December 31, 2014, we had 730 commercial auto policies in force, which represented 1.6% of our policies in force.
33
Commission Expense
Commission expense was $15,317,000 in 2015 or 18.9% of direct earned premiums. Commission expense was $12,125,000 in 2014 or 17.8% of direct earned premiums. The increase of $3,192,000, or 26.3%, is due to the increase in direct written premiums in 2015 as compared to 2014 and a change in the mix of business to lines of business with higher commission rates, and an increase in bonus commissions.
Other Underwriting Expenses
Other underwriting expenses were $12,833,000 in 2015 compared to $10,656,000 in 2014. The increase of $2,177,000, or 20.4%, in other underwriting expenses was primarily due to expenses directly and indirectly related to growth in direct written premiums. Expenses directly related to the increase in direct written premiums primarily consist of underwriting expenses, software usage fees and state premium taxes. Expenses indirectly related to the increase in direct written premiums primarily consist of salaries along with related other employment costs. Salaries and employment costs were $5,858,000 in 2015 compared to $4,914,000 in 2014. The increase of $944,000, or 19.2%, was due to hiring of additional staff to service our current level of business and anticipated growth in volume. In addition, there were annual rate increases in both salaries and the cost of employee benefits. Other underwriting expenses as a percentage of direct written premiums increased to 14.1% in 2015 from 14.0% in 2014. Other underwriting expenses as a percentage of direct earned premiums decreased to 15.5% in 2015 from 15.6% in 2014.
Our net underwriting expense ratio in 2015 was 32.3% compared with 24.9% in 2014. The following table shows the individual components of our net underwriting expense ratio for the periods indicated:
|
Years ended
|
||||||||||||
|
December 31,
|
Percentage
|
|||||||||||
|
2015
|
2014
|
Point Change
|
||||||||||
|
Ceding commission revenue - provisional
|
(24.1 | )% | (38.2 | )% | 14.1 | |||||||
|
Ceding commission revenue - contingent
|
0.5 | (4.5 | ) | 5.0 | ||||||||
|
Other income
|
(2.0 | ) | (2.3 | ) | 0.3 | |||||||
|
Acquistion costs and other underwriting expenses:
|
||||||||||||
|
Commission expense
|
31.5 | 37.2 | (5.7 | ) | ||||||||
|
Other underwriting expenses
|
26.4 | 32.7 | (6.3 | ) | ||||||||
|
Net underwriting expense ratio
|
32.3 | % | 24.9 | % | 7.4 | |||||||
The increase of 7.4 percentage points was due to the individual components of provisional ceding commission revenue, commission expense and other underwriting expenses and their relation to the increase in net premiums earned as a result of the additional retention resulting from the Cut-offs to our quota share treaties on July 1, 2015.
34
Other Operating Expenses
Other operating expenses, related to the expenses of our holding company, were $1,504,000 in 2015 compared to $1,487,000 in 2014. The increase in 2015 of $17,000, or 1.1%, was composed of nominal increases and decreases in the various expenses that are included in other operating expenses.
Depreciation and Amortization
Depreciation and amortization was $1,032,000 in 2015 compared to $875,000 in 2014. The increase of $157,000, or 17.9%, in depreciation and amortization was primarily due to depreciation on newly purchased assets used to upgrade our systems infrastructure and the Kingston, New York home office building from which we operate.
Income Tax Expense
Income tax expense in 2015 was $3,349,000, which resulted in an effective tax rate of 32.5%. Income tax expense in 2014 was $2,547,000, which resulted in an effective tax rate of 32.3%. Income before taxes was $10,309,000 in 2015 compared to $7,875,000 in 2014. The increase in the effective tax rate by 0.2 percentage points in 2015 is a result of the change in the enacted state tax rate resulting in a current period decrease in the deferred tax benefit of our state net operating losses, net of the corresponding valuation adjustment. This increase was partially offset by the benefits of permanent differences generated from investment income as a result of the increase in our invested assets.
Net Income
Net income was $6,960,000 in 2015 compared to $5,328,000 in 2014. The increase in net income of $1,632,000, or 30.6%, was due to the circumstances described above that caused the increase in our net premiums earned, net investment income, and other income, and a decrease in our net loss ratio, partially offset by a decrease in net realized gains and ceding commission revenue, and increases in other underwriting expenses related to premium growth and other operating expenses.
Additional Financial Information
We operate our business as one segment, property and casualty insurance. Within this segment, we offer a wide array of property and casualty policies to our producers. The following table summarizes gross and net premiums written, net premiums earned, and loss and loss adjustment expenses by major product type, which were determined based primarily on similar economic characteristics and risks of loss.
35
|
For the Year Ended
|
||||||||
|
December 31,
|
||||||||
|
2015
|
2014
|
|||||||
|
Gross premiums written:
|
||||||||
|
Personal lines
|
$ | 69,227,233 | $ | 56,808,940 | ||||
|
Commercial lines
|
12,010,892 | 10,967,008 | ||||||
|
Commercial auto
|
519,920 | 3,222,033 | ||||||
|
Livery physical damage
|
9,032,957 | 5,034,260 | ||||||
|
Other(1)
|
253,937 | 272,041 | ||||||
|
Total
|
$ | 91,044,939 | $ | 76,304,282 | ||||
|
Net premiums written:
|
||||||||
|
Personal lines
|
||||||||
|
Excluding the effect of quota share
|
||||||||
|
adjustments on July 1
|
$ | 33,899,714 | $ | 19,817,259 | ||||
|
Return of premiums previously ceded to
|
||||||||
|
prior quota share treaties
|
5,866,300 | 5,159,646 | ||||||
|
Total Personal lines
|
39,766,014 | 24,976,905 | ||||||
|
Commercial lines
|
||||||||
|
Excluding the effect of quota share
|
||||||||
|
adjustments on July 1
|
10,922,649 | 8,516,227 | ||||||
|
Return of premiums previously ceded to
|
||||||||
|
prior quota share treaties
|
- | 1,437,345 | ||||||
|
Total Commercial lines
|
10,922,649 | 9,953,572 | ||||||
|
Commercial auto
|
471,135 | 3,134,657 | ||||||
|
Livery physical damage
|
9,032,957 | 5,034,260 | ||||||
|
Other(1)
|
192,022 | 195,468 | ||||||
|
Total
|
$ | 60,384,777 | $ | 43,294,862 | ||||
|
Net premiums earned:
|
||||||||
|
Personal lines
|
$ | 29,498,110 | $ | 16,670,947 | ||||
|
Commercial lines
|
10,133,600 | 8,292,960 | ||||||
|
Commercial auto
|
1,722,381 | 3,932,349 | ||||||
|
Livery physical damage
|
7,082,843 | 3,494,711 | ||||||
|
Other(1)
|
175,148 | 237,517 | ||||||
|
Total
|
$ | 48,612,082 | $ | 32,628,484 | ||||
|
Net loss and loss adjustment expenses:
|
||||||||
|
Personal lines
|
$ | 12,513,907 | $ | 6,345,559 | ||||
|
Commercial lines
|
5,931,699 | 4,332,021 | ||||||
|
Commercial auto
|
653,898 | 3,438,957 | ||||||
|
Livery physical damage
|
2,444,555 | 1,295,746 | ||||||
|
Other(1)
|
147,789 | 516,042 | ||||||
|
Unallocated loss adjustment expenses
|
1,488,152 | 1,103,863 | ||||||
|
Total
|
$ | 23,180,000 | $ | 17,032,188 | ||||
|
Net loss ratio:
|
||||||||
|
Personal lines
|
42.4 | % | 38.1 | % | ||||
|
Commercial lines
|
58.5 | % | 52.2 | % | ||||
|
Commercial auto
|
38.0 | % | 87.5 | % | ||||
|
Livery physical damage
|
34.5 | % | 37.1 | % | ||||
|
Other(1)
|
84.4 | % | 217.3 | % | ||||
|
Total
|
47.7 | % | 52.2 | % | ||||
|
(1)
|
“Other” includes, among other things, premiums and loss and loss adjustment expenses from our participation in mandatory state joint underwriting associations.
|
36
Insurance Underwriting Business on a Standalone Basis
Our insurance underwriting business reported on a standalone basis for the years ended December 31, 2015 and 2014 follows:
|
Year ended
|
||||||||
|
December 31,
|
||||||||
|
2015
|
2014
|
|||||||
|
Revenues
|
||||||||
|
Net premiums earned
|
$ | 48,612,082 | $ | 32,628,484 | ||||
|
Ceding commission revenue
|
11,473,117 | 13,910,111 | ||||||
|
Net investment income
|
2,563,890 | 1,799,768 | ||||||
|
Net realized gain on investments
|
(50,546 | ) | 707,027 | |||||
|
Other income
|
992,270 | 749,369 | ||||||
|
Total revenues
|
63,590,813 | 49,794,759 | ||||||
|
Expenses
|
||||||||
|
Loss and loss adjustment expenses
|
23,180,000 | 17,032,188 | ||||||
|
Commission expense
|
15,317,140 | 12,125,328 | ||||||
|
Other underwriting expenses
|
12,833,391 | 10,656,265 | ||||||
|
Depreciation and amortization
|
1,028,622 | 871,520 | ||||||
|
Total expenses
|
52,359,153 | 40,685,301 | ||||||
|
Income from operations
|
11,231,660 | 9,109,458 | ||||||
|
Income tax expense
|
3,601,935 | 2,918,109 | ||||||
|
Net income
|
$ | 7,629,725 | $ | 6,191,349 | ||||
|
Key Measures:
|
||||||||
|
Net loss ratio
|
47.7 | % | 52.2 | % | ||||
|
Net underwriting expense ratio
|
32.3 | % | 24.9 | % | ||||
|
Net combined ratio
|
80.0 | % | 77.1 | % | ||||
|
Reconciliation of net underwriting expense ratio:
|
||||||||
|
Acquisition costs and other
|
||||||||
|
underwriting expenses
|
$ | 28,150,531 | $ | 22,781,593 | ||||
|
Less: Ceding commission revenue
|
(11,473,117 | ) | (13,910,111 | ) | ||||
|
Less: Other income
|
(992,270 | ) | (749,369 | ) | ||||
|
Net underwriting expenses
|
$ | 15,685,144 | $ | 8,122,113 | ||||
|
Net premiums earned
|
$ | 48,612,082 | $ | 32,628,484 | ||||
|
Net Underwriting Expense Ratio
|
32.3 | % | 24.9 | % | ||||
37
An analysis of our direct, assumed and ceded earned premiums, loss and loss adjustment expenses, and loss ratios is shown below:
|
Direct
|
Assumed
|
Ceded
|
Net
|
|||||||||||||
|
Year ended December 31, 2015
|
||||||||||||||||
|
Written premiums
|
$ | 91,003,968 | $ | 40,971 | $ | (30,660,161 | ) | $ | 60,384,778 | |||||||
|
Change in unearned premiums
|
(8,436,456 | ) | 4,255 | (3,340,495 | ) | (11,772,696 | ) | |||||||||
|
Earned premiums
|
$ | 82,567,512 | $ | 45,226 | $ | (34,000,656 | ) | $ | 48,612,082 | |||||||
|
Loss and loss adjustment expenses exluding
|
||||||||||||||||
|
the effect of catastrophes
|
$ | 32,850,817 | $ | 111,618 | $ | (11,873,028 | ) | $ | 21,089,407 | |||||||
|
Catastrophe loss
|
4,645,762 | - | (2,555,169 | ) | 2,090,593 | |||||||||||
|
Loss and loss adjustment expenses
|
$ | 37,496,579 | $ | 111,618 | $ | (14,428,197 | ) | $ | 23,180,000 | |||||||
|
Loss ratio excluding the effect of catastrophes
|
39.8 | % | 246.8 | % | 34.9 | % | 43.4 | % | ||||||||
|
Catastrophe loss
|
5.6 | % | 0.0 | % | 7.5 | % | 4.3 | % | ||||||||
|
Loss ratio
|
45.4 | % | 246.8 | % | 42.4 | % | 47.7 | % | ||||||||
|
Year ended December 31, 2014
|
||||||||||||||||
|
Written premiums
|
$ | 76,255,426 | $ | 48,856 | $ | (33,009,420 | ) | $ | 43,294,862 | |||||||
|
Change in unearned premiums
|
(8,119,029 | ) | (3,398 | ) | (2,543,951 | ) | (10,666,378 | ) | ||||||||
|
Earned premiums
|
$ | 68,136,397 | $ | 45,458 | $ | (35,553,371 | ) | $ | 32,628,484 | |||||||
|
Loss and loss adjustment expenses exluding
|
||||||||||||||||
|
the effect of catastrophes
|
$ | 28,075,577 | $ | 71,054 | $ | (12,055,470 | ) | $ | 16,091,161 | |||||||
|
Catastrophe loss
|
3,764,108 | - | (2,823,081 | ) | 941,027 | |||||||||||
|
Loss and loss adjustment expenses
|
$ | 31,839,685 | $ | 71,054 | $ | (14,878,551 | ) | $ | 17,032,188 | |||||||
|
Loss ratio excluding the effect of catastrophes
|
41.2 | % | 156.3 | % | 33.9 | % | 49.3 | % | ||||||||
|
Catastrophe loss
|
5.5 | % | 0.0 | % | 7.9 | % | 2.9 | % | ||||||||
|
Loss ratio
|
46.7 | % | 156.3 | % | 41.8 | % | 52.2 | % | ||||||||
38
The key measures for our insurance underwriting business for the years ended December 31, 2015 and 2014 are as follows:
|
Year ended
|
||||||||
|
December 31,
|
||||||||
|
2015
|
2014
|
|||||||
|
Net premiums earned
|
$ | 48,612,082 | $ | 32,628,484 | ||||
|
Ceding commission revenue (1)
|
11,473,117 | 13,910,111 | ||||||
|
Other income
|
992,270 | 749,369 | ||||||
|
Loss and loss adjustment expenses (2)
|
23,180,000 | 17,032,188 | ||||||
|
Acquistion costs and other underwriting expenses:
|
||||||||
|
Commission expense
|
15,317,140 | 12,125,328 | ||||||
|
Other underwriting expenses
|
12,833,391 | 10,656,265 | ||||||
|
Total acquistion costs and other
|
||||||||
|
underwriting expenses
|
28,150,531 | 22,781,593 | ||||||
|
Underwriting income
|
$ | 9,746,938 | $ | 7,474,183 | ||||
|
Key Measures:
|
||||||||
|
Net loss ratio excluding the effect of catastrophes
|
43.4 | % | 49.3 | % | ||||
|
Effect of catastrophe loss on net loss ratio (2) (3)
|
4.3 | % | 2.9 | % | ||||
|
Net loss ratio
|
47.7 | % | 52.2 | % | ||||
|
Net underwriting expense ratio excluding the
|
||||||||
|
effect of catastrophes
|
29.6 | % | 23.3 | % | ||||
|
Effect of catastrophe loss on net underwriting
|
||||||||
|
expense ratio (1) (2) (3)
|
2.7 | % | 1.6 | % | ||||
|
Net underwriting expense ratio
|
32.3 | % | 24.9 | % | ||||
|
Net combined ratio excluding the effect
|
||||||||
|
of catastrophes
|
73.0 | % | 72.6 | % | ||||
|
Effect of catastrophe loss on net combined
|
||||||||
|
ratio (1) (2) (3)
|
7.0 | % | 4.5 | % | ||||
|
Net combined ratio
|
80.0 | % | 77.1 | % | ||||
|
Reconciliation of net underwriting expense ratio:
|
||||||||
|
Acquisition costs and other
|
||||||||
|
underwriting expenses
|
$ | 28,150,531 | $ | 22,781,593 | ||||
|
Less: Ceding commission revenue (1)
|
(11,473,117 | ) | (13,910,111 | ) | ||||
|
Less: Other income
|
(992,270 | ) | (749,369 | ) | ||||
|
|
$ | 15,685,144 | $ | 8,122,113 | ||||
|
Net earned premium
|
$ | 48,612,082 | $ | 32,628,484 | ||||
|
Net Underwriting Expense Ratio
|
32.3 | % | 24.9 | % | ||||
39
(2) For the year ended December 31, 2015 and 2014, includes the sum of net catastrophe losses and loss adjustment expenses of $2,090,593 and $941,027, respectively, resulting from severe winter weather.
(3) For the year ended December 31, 2015 and 2014, the effect of catastrophe loss from severe winter weather on our net combined ratio only includes the direct effects of loss and loss adjustment expenses and ceding commission revenue and does not include the indirect effects of a $324,906 and $163,673, respectively, decrease in other underwriting expenses.
Investments
Portfolio Summary
The following table presents a breakdown of the amortized cost, aggregate fair value and unrealized gains and losses by investment type as of December 31, 2015 and 2014:
Available-for-Sale Securities
|
December 31, 2015
|
||||||||||||||||||||||||
|
|
Cost or
|
Gross
|
Gross Unrealized Losses
|
Aggregate
|
% of
|
|||||||||||||||||||
|
Amortized
|
Unrealized
|
Less than 12
|
More than 12
|
Fair
|
Fair
|
|||||||||||||||||||
|
Category
|
Cost
|
Gains
|
Months
|
Months
|
Value
|
Value
|
||||||||||||||||||
|
Political subdivisions of States,
|
||||||||||||||||||||||||
|
Territories and Possessions
|
$ | 12,139,793 | $ | 431,194 | $ | (15,889 | ) | $ | - | $ | 12,555,098 | 17.5 | % | |||||||||||
|
Corporate and other bonds
|
||||||||||||||||||||||||
|
Industrial and miscellaneous
|
45,078,044 | 490,444 | (512,427 | ) | (99,593 | ) | 44,956,468 | 62.7 | % | |||||||||||||||
|
Residential mortgage backed
|
||||||||||||||||||||||||
|
securities
|
5,003,292 | 48,375 | (61,169 | ) | - | 4,990,498 | 7.0 | % | ||||||||||||||||
|
Total fixed-maturity securities
|
62,221,129 | 970,013 | (589,485 | ) | (99,593 | ) | 62,502,064 | 87.2 | % | |||||||||||||||
|
Equity Securities
|
8,751,537 | 585,776 | (103,721 | ) | (29,322 | ) | 9,204,270 | 12.8 | % | |||||||||||||||
|
Total
|
$ | 70,972,666 | $ | 1,555,789 | $ | (693,206 | ) | $ | (128,915 | ) | $ | 71,706,334 | 100.0 | % | ||||||||||
|
December 31, 2014
|
||||||||||||||||||||||||
|
|
Cost or
|
Gross
|
Gross Unrealized Losses
|
Aggregate
|
% of
|
|||||||||||||||||||
|
Amortized
|
Unrealized
|
Less than 12
|
More than 12
|
Fair
|
Fair
|
|||||||||||||||||||
|
Category
|
Cost
|
Gains
|
Months
|
Months
|
Value
|
Value
|
||||||||||||||||||
|
Political subdivisions of States,
|
||||||||||||||||||||||||
|
Territories and Possessions
|
$ | 13,862,141 | $ | 412,490 | $ | (23,813 | ) | $ | (6,379 | ) | $ | 14,244,439 | 24.1 | % | ||||||||||
|
Corporate and other bonds
|
||||||||||||||||||||||||
|
Industrial and miscellaneous
|
36,221,300 | 803,440 | (118,092 | ) | (30,228 | ) | 36,876,420 | 62.4 | % | |||||||||||||||
|
Total fixed-maturity securities
|
50,083,441 | 1,215,930 | (141,905 | ) | (36,607 | ) | 51,120,859 | 86.5 | % | |||||||||||||||
|
Equity Securities
|
7,621,309 | 464,130 | (2,647 | ) | (65,063 | ) | 8,017,729 | 13.5 | % | |||||||||||||||
|
Total
|
$ | 57,704,750 | $ | 1,680,060 | $ | (144,552 | ) | $ | (101,670 | ) | $ | 59,138,588 | 100.0 | % | ||||||||||
40
Held-to-Maturity Securities
|
December 31, 2015
|
||||||||||||||||||||||||
|
|
Cost or
|
Gross
|
Gross Unrealized Losses
|
% of
|
||||||||||||||||||||
|
Amortized
|
Unrealized
|
Less than 12
|
More than 12
|
Fair
|
Fair
|
|||||||||||||||||||
|
Category
|
Cost
|
Gains
|
Months
|
Months
|
Value
|
Value
|
||||||||||||||||||
|
U.S. Treasury securities
|
$ | 606,389 | $ | 147,650 | $ | - | $ | - | $ | 754,039 | 14.4 | % | ||||||||||||
|
Political subdivisions of States,
|
||||||||||||||||||||||||
|
Territories and Possessions
|
1,417,679 | 70,284 | - | (54,189 | ) | 1,433,774 | 27.4 | % | ||||||||||||||||
|
Corporate and other bonds
|
||||||||||||||||||||||||
|
Industrial and miscellaneous
|
3,114,804 | 82,265 | (17,980 | ) | (125,807 | ) | 3,053,282 | 58.2 | % | |||||||||||||||
|
Total
|
$ | 5,138,872 | $ | 300,199 | $ | (17,980 | ) | $ | (179,996 | ) | $ | 5,241,095 | 100.0 | % | ||||||||||
|
December 31, 2014
|
||||||||||||||||||||||||
|
|
Cost or
|
Gross
|
Gross Unrealized Losses
|
% of
|
||||||||||||||||||||
|
Amortized
|
Unrealized
|
Less than 12
|
More than 12
|
Fair
|
Fair
|
|||||||||||||||||||
|
Category
|
Cost
|
Gains
|
Months
|
Months
|
Value
|
Value
|
||||||||||||||||||
|
U.S. Treasury securities
|
$ | 606,353 | $ | 183,200 | $ | - | $ | - | $ | 789,553 | 14.6 | % | ||||||||||||
|
Political subdivisions of States,
|
||||||||||||||||||||||||
|
Territories and Possessions
|
1,413,303 | 49,981 | - | (12,247 | ) | 1,451,037 | 26.9 | % | ||||||||||||||||
|
Corporate and other bonds
|
||||||||||||||||||||||||
|
Industrial and miscellaneous
|
3,109,079 | 98,306 | (52,921 | ) | - | 3,154,464 | 58.5 | % | ||||||||||||||||
|
Total
|
$ | 5,128,735 | $ | 331,487 | $ | (52,921 | ) | $ | (12,247 | ) | $ | 5,395,054 | 100.0 | % | ||||||||||
U.S. Treasury securities included in held-to-maturity securities are held in trust pursuant to the New York State Department of Financial Services’ minimum funds requirement.
A summary of the amortized cost and fair value of the Company’s investments in held-to-maturity securities by contractual maturity as of December 31, 2015 and 2014 is shown below:
|
December 31, 2015
|
December 31, 2014
|
|||||||||||||||
|
Amortized
|
Amortized
|
|||||||||||||||
|
Remaining Time to Maturity
|
Cost
|
Fair Value
|
Cost
|
Fair Value
|
||||||||||||
|
Less than one year
|
$ | - | $ | - | $ | - | $ | - | ||||||||
|
One to five years
|
500,000 | 496,245 | - | - | ||||||||||||
|
Five to ten years
|
4,032,483 | 3,990,811 | 3,522,927 | 3,563,401 | ||||||||||||
|
More than 10 years
|
606,389 | 754,039 | 1,605,808 | 1,831,653 | ||||||||||||
|
Total
|
$ | 5,138,872 | $ | 5,241,095 | $ | 5,128,735 | $ | 5,395,054 | ||||||||
41
Credit Rating of Fixed-Maturity Securities
The table below summarizes the credit quality of our available-for-sale fixed-maturity securities as of December 31, 2015 and 2014 as rated by Standard and Poor’s (or, if unavailable from Standard and Poor’s, then Moody’s or Fitch):
|
December 31, 2015
|
December 31, 2014
|
|||||||||||||||||
|
Percentage of
|
Percentage of
|
|||||||||||||||||
|
Fair Market
|
Fair Market
|
Fair Market
|
Fair Market
|
|||||||||||||||
|
Value
|
Value
|
Value
|
Value
|
|||||||||||||||
|
Rating
|
||||||||||||||||||
|
Corporate and municipal bonds
|
||||||||||||||||||
|
AAA
|
$ | 2,218,147 | 3.5 | % | $ | 2,779,539 | 5.5 | % | ||||||||||
|
AA
|
9,060,781 | 14.5 | % | 9,826,545 | 19.2 | % | ||||||||||||
| A | 10,639,888 | 17.0 | % | 13,954,036 | 27.3 | % | ||||||||||||
|
BBB
|
35,592,750 | 57.1 | % | 24,560,739 | 48.0 | % | ||||||||||||
|
Total corporate and municipal bonds
|
57,511,566 | 92.1 | % | 51,120,859 | 100.0 | % | ||||||||||||
|
Residential mortgage backed securities
|
||||||||||||||||||
| A | 216,077 | 0.3 | % | - | 0.0 | % | ||||||||||||
|
CCC
|
457,889 | 0.7 | % | - | 0.0 | % | ||||||||||||
|
CC
|
402,558 | 0.6 | % | - | 0.0 | % | ||||||||||||
| D | 3,913,974 | 6.3 | % | - | 0.0 | % | ||||||||||||
|
Total residential mortgage backed securities
|
4,990,498 | 7.9 | % | - | 0.0 | % | ||||||||||||
|
Total
|
$ | 62,502,064 | 100.0 | % | $ | 51,120,859 | 100.0 | % | ||||||||||
The table below details the average yield by type of fixed-maturity security as of December 31, 2015 and 2014:
|
Category
|
December 31, 2015
|
December 31, 2014
|
||||||
|
U.S. Treasury securities and
|
||||||||
|
obligations of U.S. government
|
||||||||
|
corporations and agencies
|
3.44 | % | 3.29 | % | ||||
|
Political subdivisions of States,
|
||||||||
|
Territories and Possessions
|
3.55 | % | 3.77 | % | ||||
|
Corporate and other bonds
|
||||||||
|
Industrial and miscellaneous
|
4.28 | % | 4.20 | % | ||||
|
Residential mortgage backed securities
|
6.24 | % | n/a | |||||
|
Total
|
4.26 | % | 4.06 | % | ||||
42
The table below lists the weighted average maturity and effective duration in years on our fixed-maturity securities as of December 31, 2015 and 2014:
|
December 31, 2015
|
December 31, 2014
|
|||||||
|
Weighted average effective maturity
|
5.5 | 6.5 | ||||||
|
Weighted average final maturity
|
7.3 | 7.3 | ||||||
|
Effective duration
|
4.9 | 5.7 | ||||||
Fair Value Consideration
As disclosed in Note 4 to the Consolidated Financial Statements, with respect to “Fair Value Measurements,” we define fair value as the price that would be received to sell an asset or paid to transfer a liability in a transaction involving identical or comparable assets or liabilities between market participants (an “exit price”). The fair value hierarchy distinguishes between inputs based on market data from independent sources (“observable inputs”) and a reporting entity’s internal assumptions based upon the best information available when external market data is limited or unavailable (“unobservable inputs”). The fair value hierarchy prioritizes fair value measurements into three levels based on the nature of the inputs. Quoted prices in active markets for identical assets have the highest priority (“Level 1”), followed by observable inputs other than quoted prices including prices for similar but not identical assets or liabilities (“Level 2”), and unobservable inputs, including the reporting entity’s estimates of the assumption that market participants would use, having the lowest priority (“Level 3”). As of December 31, 2015 and 2014, 66% and 63%, respectively, of the investment portfolio recorded at fair value was priced based upon quoted market prices.
As more fully described in Note 3 to our Consolidated Financial Statements, “Investments—Impairment Review,” we completed a detailed review of all our securities in a continuous loss position as of December 31, 2015 and 2014, and concluded that the unrealized losses in these asset classes are temporary in nature and the result of a decrease in value due to technical spread widening and broader market sentiment, rather than fundamental collateral deterioration.
The table below summarizes the gross unrealized losses of our fixed-maturity securities available-for-sale and equity securities by length of time the security has continuously been in an unrealized loss position as of December 31, 2015 and 2014:
43
|
December 31, 2015
|
||||||||||||||||||||||||||||||||
|
Less than 12 months
|
12 months or more
|
Total
|
||||||||||||||||||||||||||||||
|
|
No. of
|
No. of
|
Aggregate
|
|||||||||||||||||||||||||||||
|
Fair
|
Unrealized
|
Positions
|
Fair
|
Unrealized
|
Positions
|
Fair
|
Unrealized
|
|||||||||||||||||||||||||
|
Category
|
Value
|
Losses
|
Held
|
Value
|
Losses
|
Held
|
Value
|
Losses
|
||||||||||||||||||||||||
|
Fixed-Maturity Securities:
|
||||||||||||||||||||||||||||||||
|
Political subdivisions of
|
||||||||||||||||||||||||||||||||
|
States, Territories and
|
||||||||||||||||||||||||||||||||
|
Possessions
|
$ | 1,432,005 | $ | (15,889 | ) | 4 | $ | - | $ | - | - | $ | 1,432,005 | $ | (15,889 | ) | ||||||||||||||||
|
Corporate and other
|
||||||||||||||||||||||||||||||||
|
bonds industrial and
|
||||||||||||||||||||||||||||||||
|
miscellaneous
|
18,424,609 | (512,427 | ) | 32 | 636,093 | (99,593 | ) | 2 | 19,060,702 | (612,020 | ) | |||||||||||||||||||||
|
Residential mortgage
|
||||||||||||||||||||||||||||||||
|
backed securities
|
2,413,980 | (61,169 | ) | 12 | - | - | - | 2,413,980 | (61,169 | ) | ||||||||||||||||||||||
|
Total fixed-maturity
|
||||||||||||||||||||||||||||||||
|
securities
|
$ | 22,270,594 | $ | (589,485 | ) | 48 | $ | 636,093 | $ | (99,593 | ) | 2 | $ | 22,906,687 | $ | (689,078 | ) | |||||||||||||||
|
Equity Securities:
|
||||||||||||||||||||||||||||||||
|
Preferred stocks
|
$ | - | $ | - | - | $ | 702,000 | $ | (29,322 | ) | 1 | $ | 702,000 | $ | (29,322 | ) | ||||||||||||||||
|
Common stocks
|
2,538,900 | (103,721 | ) | 6 | - | - | - | 2,538,900 | (103,721 | ) | ||||||||||||||||||||||
|
Total equity securities
|
$ | 2,538,900 | $ | (103,721 | ) | 6 | $ | 702,000 | $ | (29,322 | ) | 1 | $ | 3,240,900 | $ | (133,043 | ) | |||||||||||||||
|
Total
|
$ | 24,809,494 | $ | (693,206 | ) | 54 | $ | 1,338,093 | $ | (128,915 | ) | 3 | $ | 26,147,587 | $ | (822,121 | ) | |||||||||||||||
44
|
December 31, 2014
|
||||||||||||||||||||||||||||||||
|
Less than 12 months
|
12 months or more
|
Total
|
||||||||||||||||||||||||||||||
|
|
No. of
|
No. of
|
Aggregate
|
|||||||||||||||||||||||||||||
|
Fair
|
Unrealized
|
Positions
|
Fair
|
Unrealized
|
Positions
|
Fair
|
Unrealized
|
|||||||||||||||||||||||||
|
Category
|
Value
|
Losses
|
Held
|
Value
|
Losses
|
Held
|
Value
|
Losses
|
||||||||||||||||||||||||
|
Fixed-Maturity Securities:
|
||||||||||||||||||||||||||||||||
|
Political subdivisions of
|
||||||||||||||||||||||||||||||||
|
States, Territories and
|
||||||||||||||||||||||||||||||||
|
Possessions
|
$ | 3,013,648 | $ | (23,813 | ) | 9 | $ | 126,658 | $ | (6,379 | ) | 1 | $ | 3,140,306 | $ | (30,192 | ) | |||||||||||||||
|
Corporate and other
|
||||||||||||||||||||||||||||||||
|
bonds industrial and
|
||||||||||||||||||||||||||||||||
|
miscellaneous
|
6,325,579 | (118,092 | ) | 15 | 714,640 | (30,228 | ) | 2 | 7,040,219 | (148,320 | ) | |||||||||||||||||||||
|
Total fixed-maturity
|
||||||||||||||||||||||||||||||||
|
securities
|
$ | 9,339,227 | $ | (141,905 | ) | 24 | $ | 841,298 | $ | (36,607 | ) | 3 | $ | 10,180,525 | $ | (178,512 | ) | |||||||||||||||
|
Equity Securities:
|
||||||||||||||||||||||||||||||||
|
Preferred stocks
|
$ | 656,325 | $ | (2,647 | ) | 1 | $ | 1,448,376 | $ | (62,886 | ) | 6 | $ | 2,104,701 | $ | (65,533 | ) | |||||||||||||||
|
Common stocks
|
- | - | - | 267,000 | (2,177 | ) | 1 | 267,000 | (2,177 | ) | ||||||||||||||||||||||
|
Total equity securities
|
$ | 656,325 | $ | (2,647 | ) | 1 | $ | 1,715,376 | $ | (65,063 | ) | 7 | $ | 2,371,701 | $ | (67,710 | ) | |||||||||||||||
|
Total
|
$ | 9,995,552 | $ | (144,552 | ) | 25 | $ | 2,556,674 | $ | (101,670 | ) | 10 | $ | 12,552,226 | $ | (246,222 | ) | |||||||||||||||
45
There were 57 securities at December 31, 2015 that accounted for the gross unrealized loss, none of which were deemed by us to be other than temporarily impaired. There were 35 securities at December 31, 2014 that accounted for the gross unrealized loss, none of which were deemed by us to be other than temporarily impaired. Significant factors influencing our determination that unrealized losses were temporary included the magnitude of the unrealized losses in relation to each security’s cost, the nature of the investment and management’s intent not to sell these securities and it being not more likely than not that we will be required to sell these investments before anticipated recovery of fair value to our cost basis.
Liquidity and Capital Resources
Cash Flows
The primary sources of cash flow are from our insurance underwriting subsidiary, KICO, and include direct premiums written, ceding commissions from our quota share reinsurers, loss recovery payments from our reinsurers, investment income and proceeds from the sale or maturity of investments. Funds are used by KICO for ceded premium payments to reinsurers, which are paid on a net basis after subtracting losses paid on reinsured claims and reinsurance commissions. KICO also uses funds for loss payments and loss adjustment expenses on our net business, commissions to producers, salaries and other underwriting expenses as well as to purchase investments and fixed assets.
Through the quarter ended March 31, 2015, the primary sources of cash flow for our holding company operations were in connection with the fee income we received from premium finance. On March 27, 2015, we received $350,000 in connection with the early termination of the agreement that generated placement fees in our premium finance business (see Note 19 to the Consolidated Financial Statements). We also receive cash dividends from KICO, subject to statutory restrictions. For the year ended December 31, 2015, KICO paid dividends of $1,650,000 to us. In January 2016, we received the remaining outstanding balance of $250,000 on a note receivable from the June 2009 sale of our former Pennsylvania retail business.
Effective December 31, 2015 we cancelled our $600,000 bank line of credit which had been intended to be used for general corporate needs. There were no borrowings on the credit line during years ended December 31, 2015 and 2014.
If the aforementioned sources of cash flow currently available are insufficient to cover our holding company cash requirements, we will seek to obtain additional financing.
Our reconciliation of net income to net cash provided by operations is generally influenced by the collection of premiums in advance of paid losses, the timing of reinsurance, issuing company settlements and loss payments.
46
Cash flow and liquidity are categorized into three sources: (1) operating activities; (2) investing activities; and (3) financing activities, which are shown in the following table:
|
Years Ended December 31,
|
2015
|
2014
|
||||||
|
Cash flows provided by (used in):
|
||||||||
|
Operating activities
|
$ | 20,401,907 | $ | 17,332,972 | ||||
|
Investing activities
|
(14,902,052 | ) | (25,998,677 | ) | ||||
|
Financing activities
|
(1,855,361 | ) | (1,349,923 | ) | ||||
|
Net increase (decrease) in cash and cash equivalents
|
3,644,494 | (10,015,628 | ) | |||||
|
Cash and cash equivalents, beginning of period
|
9,906,878 | 19,922,506 | ||||||
|
Cash and cash equivalents, end of period
|
$ | 13,551,372 | $ | 9,906,878 | ||||
Net cash provided by operating activities was $20,402,000 in 2015 as compared to $17,333,000 provided in 2014. The $3,069,000 increase in cash flows provided by operating activities in 2015 was primarily a result of an increase in cash arising from net fluctuations in assets and liabilities relating to operating activities of KICO as affected by the growth in its operations which are described above, and an increase in net income (adjusted for non-cash items) of $2,230,000.
Net cash used in investing activities was $14,902,000 in 2015 compared to $25,999,000 used in 2014. The $11,097,000 decrease in cash used in investing activities is the result of a $17,143,000 decrease in acquisitions of invested assets, offset by a $5,526,000 increase in sales of invested assets.
Net cash used in financing activities was $1,855,000 in 2015 compared to $1,350,000 used in 2014. The $505,000 increase in cash used in financing activities is the result of the $278,000 purchase of treasury stock in 2015, compared to $47,000 purchased in 2014, a $245,000 increase in dividends paid due to additional shares outstanding in 2015 and an increase in the dividend rate.
Reinsurance
The following table provides summary information with respect to each reinsurer that accounted for more than 10% of our reinsurance recoverables on paid and unpaid losses and loss adjustment expenses as of December 31, 2015:
|
Amount
|
||||||||||||
|
Recoverable
|
||||||||||||
|
|
as of
|
|||||||||||
|
($ in thousands)
|
A.M.
Best Rating |
December 31, 2015
|
%
|
|||||||||
|
Maiden Reinsurace Company
|
A- | $ | 8,610 | 45.9 | % | |||||||
|
Swiss Reinsurance America Corporation
|
A+ | 4,039 | 21.5 | % | ||||||||
|
SCOR Reinsurance Company
|
A | 2,096 | 11.2 | % | ||||||||
| 14,745 | 78.6 | % | ||||||||||
|
Others
|
4,009 | 21.4 | % | |||||||||
|
Total
|
$ | 18,754 | 100.0 | % | ||||||||
Reinsurance recoverable from Maiden Reinsurance Company and Motors Insurance Corporation (included in Others) are secured pursuant to collateralized trust agreements. Assets held in the two trusts are not included in our invested assets and investment income earned on these assets is credited to the two reinsurers respectively.
47
Our quota share reinsurance treaties are on a July 1 through June 30 treaty year basis; therefore, for year to date fiscal periods after June 30, two separate treaties will be included in such periods.
Our quota share reinsurance treaty in effect for the year ended December 31, 2015 for our personal lines business, which primarily consists of homeowners’ policies, was covered under the July 1, 2014/June 30, 2015 and July 1, 2015/June 30, 2016 treaty years. Our quota share reinsurance treaties in effect for the year ended December 31, 2014 for our personal lines business, which primarily consists of homeowners’ policies, was covered under the July 1, 2013/June 30, 2014 and July 1, 2014/June 30, 2015 treaty years. Our quota share reinsurance treaty in effect for the year ended December 31, 2014 for our commercial lines business was covered under the July 1, 2013/June 30, 2014 treaty year. We did not renew our expiring commercial lines quota share reinsurance treaty on July 1, 2014.
Our personal lines quota share treaty that covered the July 1, 2013/June 30, 2014 treaty year was a two year treaty that expired on June 30, 2015. Effective July 1, 2014, we had the option to increase the quota share percentage from 75% to a maximum of 85% or decrease the quota share percentage from 75% to a minimum of 55% by giving no less than 30 days advance notice. On May 12, 2014, we notified the personal lines reinsurers of our election to reduce the ceding percentage in the personal lines quota share treaty from 75% to 55% effective July 1, 2014.We entered into new annual treaties with different terms effective July 1, 2015. Our treaties for the July 1, 2013/ June 30, 2014, July 1, 2014/June 30, 2015 and July 1, 2015/June 30, 2016 treaty years provide for the following material terms:
48
|
Treaty Year
|
||||||||||||
|
July 1, 2015
|
July 1, 2014
|
July 1, 2013
|
||||||||||
|
to
|
to
|
to
|
||||||||||
|
Line of Busines
|
June 30, 2016
|
June 30, 2015
|
June 30, 2014
|
|||||||||
|
Personal Lines:
|
||||||||||||
|
Homeowners, dwelling fire and canine legal liability
|
||||||||||||
|
Quota share treaty:
|
||||||||||||
|
Percent ceded
|
40 | % | 55 | % | 75 | % | ||||||
|
Risk retained
|
$ | 450,000 | $ | 360,000 | $ | 300,000 | ||||||
|
Losses per occurrence subject to quota share reinsurance coverage
|
$ | 750,000 | $ | 800,000 | $ | 1,200,000 | ||||||
|
Excess of loss coverage above quota share coverage
|
$ | 3,750,000 | $ | 3,200,000 | $ | 1,700,000 | ||||||
|
in excess of
|
in excess of
|
in excess of
|
||||||||||
| $ | 750,000 | $ | 800,000 | $ | 1,200,000 | |||||||
|
Total reinsurance coverage per occurrence
|
$ | 4,050,000 | $ | 3,640,000 | $ | 2,600,000 | ||||||
|
Losses per occurrence subject to reinsurance coverage
|
$ | 4,500,000 | $ | 4,000,000 | $ | 2,900,000 | ||||||
|
Expiration date
|
June 30, 2016
|
June 30, 2015
|
June 30, 2015
|
|||||||||
|
Personal Umbrella
|
||||||||||||
|
Quota share treaty:
|
||||||||||||
|
Percent ceded - first million dollars of coverage
|
90 | % | 90 | % | 90 | % | ||||||
|
Percent ceded - excess of one million dollars of coverage
|
100 | % | 100 | % | 100 | % | ||||||
|
Risk retained
|
$ | 100,000 | $ | 100,000 | $ | 100,000 | ||||||
|
Total reinsurance coverage per occurrence
|
$ | 2,900,000 | $ | 2,900,000 | $ | 1,900,000 | ||||||
|
Losses per occurrence subject to quota share reinsurance coverage
|
$ | 3,000,000 | $ | 3,000,000 | $ | 2,000,000 | ||||||
|
Expiration date
|
June 30, 2016
|
June 30, 2015
|
June 30, 2014
|
|||||||||
|
Commercial Lines:
|
||||||||||||
|
General liability commercial policies, except for commercial auto
|
||||||||||||
|
Quota share treaty:
|
||||||||||||
|
Percent ceded (terminated effective July 1, 2014)
|
None
|
None
|
25 | % | ||||||||
|
Risk retained
|
$ | 425,000 | $ | 400,000 | $ | 300,000 | ||||||
|
Losses per occurrence subject to quota share reinsurance coverage
|
None
|
None
|
$ | 400,000 | ||||||||
|
Excess of loss coverage above quota share coverage
|
$ | 4,075,000 | $ | 3,600,000 | $ | 2,500,000 | ||||||
|
in excess of
|
in excess of
|
in excess of
|
||||||||||
| $ | 425,000 | $ | 400,000 | $ | 400,000 | |||||||
|
Total reinsurance coverage per occurrence
|
$ | 4,075,000 | $ | 3,600,000 | $ | 2,600,000 | ||||||
|
Losses per occurrence subject to reinsurance coverage
|
$ | 4,500,000 | $ | 4,000,000 | $ | 2,900,000 | ||||||
|
Commercial Auto:
|
||||||||||||
|
Risk retained
|
$ | 300,000 | $ | 300,000 | $ | 300,000 | ||||||
|
Excess of loss coverage in excess of risk retained
|
$ | 1,700,000 | $ | 1,700,000 | $ | 1,700,000 | ||||||
|
in excess of
|
in excess of
|
in excess of
|
||||||||||
| $ | 300,000 | $ | 300,000 | $ | 300,000 | |||||||
|
Catastrophe Reinsurance:
|
||||||||||||
|
Initial loss subject to personal lines quota share treaty
|
$ | 4,000,000 | $ | 4,000,000 | $ | 4,000,000 | ||||||
|
Risk retained per catastrophe occurrence (1)
|
$ | 2,400,000 | $ | 1,800,000 | $ | 1,000,000 | ||||||
|
Catastrophe loss coverage in excess of quota share coverage (2) (3)
|
$ | 176,000,000 | $ | 137,000,000 | $ | 86,000,000 | ||||||
|
Severe winter weather aggregate (3)
|
Yes
|
Yes
|
No
|
|||||||||
|
Reinstatement premium protection (4)
|
Yes
|
No
|
No
|
|||||||||
|
1.
|
Plus losses in excess of catastrophe coverage.
|
|
2.
|
Catastrophe coverage is limited on an annual basis to two times the per occurrence amounts. Effective July 1, 2015, the duration of a catastrophe occurrence from windstorm, hail, tornado, hurricane and cyclone was extended to 120 consecutive hours from 96 consecutive hours.
|
|
3.
|
Effective July 1, 2014, our catastrophe treaty also covers losses caused by severe winter weather during any consecutive 28 day period.
|
|
4.
|
Effective July 1, 2015, reinstatement premium protection for $16,000,000 of catastrophe coverage in excess of $4,000,000.
|
49
The single maximum risks per occurrence to which we are subject under the new treaties effective July 1, 2015 are as follows:
|
July 1, 2015 - June 30, 2016
|
||||||||
|
Treaty
|
Extent of Loss
|
Risk Retained
|
||||||
|
Personal Lines
|
Initial $750,000
|
$ | 450,000 | |||||
| $ | 750,000 - $4,500,000 |
None(1)
|
||||||
|
Over $4,500,000
|
100 | % | ||||||
|
Personal Umbrella
|
Initial $1,000,000
|
$ | 100,000 | |||||
| $ | 1,000,000 - $3,000,000 |
None(1)
|
||||||
|
Over $3,000,000
|
100 | % | ||||||
|
Commercial Lines
|
Initial $425,000
|
$ | 425,000 | |||||
| $ | 425,000 - $4,500,000 |
None(1)
|
||||||
|
Over $4,500,000
|
100 | % | ||||||
|
Commercial Auto
|
Initial $300,000
|
$ | 300,000 | |||||
| $ | 300,000 - $2,000,000 |
None(1)
|
||||||
|
Over $2,000,000
|
100 | % | ||||||
|
Catastrophe (2)
|
Initial $4,000,000
|
$ | 2,400,000 | |||||
| $ | 4,000,000 - $180,000,000 |
None
|
||||||
|
Over $180,000,000
|
100 | % | ||||||
The single maximum risks per occurrence to which we are subject under the treaties that expired on June 30, 2015 and 2014 are as follows:
|
July 1, 2014 - June 30, 2015
|
July 1, 2013 - June 30, 2014
|
|||||||||||||||
|
Treaty
|
Extent of Loss
|
Risk Retained
|
Extent of Loss
|
Risk Retained
|
||||||||||||
|
Personal Lines
|
Initial $800,000
|
$ | 360,000 |
Initial $1,200,000
|
$ | 300,000 | ||||||||||
| $ | 800,000 - $4,000,000 |
None(1)
|
$ | 1,200,000 - $2,900,000 |
None(1)
|
|||||||||||
|
Over $4,000,000
|
100 | % |
Over $2,900,000
|
100 | % | |||||||||||
|
Personal Umbrella
|
Initial $1,000,000
|
$ | 100,000 |
Initial $1,000,000
|
$ | 100,000 | ||||||||||
| $ | 1,000,000 - $3,000,000 |
None(1)
|
$ | 1,000,000 - $2,000,000 |
None(1)
|
|||||||||||
|
Over $3,000,000
|
100 | % |
Over $2,000,000
|
100 | % | |||||||||||
|
Commercial Lines
|
Initial $400,000
|
$ | 400,000 |
Initial $400,000
|
$ | 300,000 | ||||||||||
| $ | 400,000 - $4,000,000 |
None(1)
|
$ | 400,000 - $2,900,000 |
None(1)
|
|||||||||||
|
Over $4,000,000
|
100 | % |
Over $2,900,000
|
100 | % | |||||||||||
|
Commercial Auto
|
Initial $300,000
|
$ | 300,000 |
Initial $300,000
|
$ | 300,000 | ||||||||||
| $ | 300,000 - $2,000,000 |
None(1)
|
$ | 300,000 - $2,000,000 |
None(1)
|
|||||||||||
|
Over $2,000,000
|
100 | % |
Over $2,000,000
|
100 | % | |||||||||||
|
Catastrophe (2)
|
Initial $4,000,000
|
$ | 1,800,000 |
Initial $4,000,000
|
$ | 1,000,000 | ||||||||||
| $ | 4,000,000 - $141,000,000 |
None
|
$ | 4,000,000 - $90,000,000 |
None
|
|||||||||||
|
Over $141,000,000
|
100 | % |
Over $90,000,000
|
100 | % | |||||||||||
|
(1)
|
Covered by excess of loss treaties.
|
|
(2)
|
Catastrophe coverage is limited on an annual basis to two times the per occurrence amounts.
|
50
Inflation
Premiums are established before we know the amount of losses and loss adjustment expenses or the extent to which inflation may affect such amounts. We attempt to anticipate the potential impact of inflation in establishing our reserves, especially as it relates to medical and hospital rates where historical inflation rates have exceeded the general level of inflation. Inflation in excess of the levels we have assumed could cause loss and loss adjustment expenses to be higher than we anticipated, which would require us to increase reserves and reduce earnings.
Fluctuations in rates of inflation also influence interest rates, which in turn impact the market value of our investment portfolio and yields on new investments. Operating expenses, including salaries and benefits, generally are impacted by inflation.
Off-Balance Sheet Arrangements
We have no off-balance sheet arrangements that have or are reasonably likely to have a current or future effect on our financial condition, changes in financial condition, revenues or expenses, results of operations, liquidity, capital expenditures or capital resources that is material to investors.
Factors That May Affect Future Results and Financial Condition
Based upon the following factors, as well as other factors affecting our operating results and financial condition, past financial performance should not be considered to be a reliable indicator of future performance, and investors should not use historical trends to anticipate results or trends in future periods. In addition, such factors, among others, may affect the accuracy of certain forward-looking statements contained in this Annual Report.
Risks Related to Our Business
As a property and casualty insurer, we may face significant losses from catastrophes and severe weather events.
Because of the exposure of our property and casualty business to catastrophic events (such as Superstorm Sandy), our operating results and financial condition may vary significantly from one period to the next. Catastrophes can be caused by various natural and man-made disasters, including earthquakes, wildfires, tornadoes, hurricanes, severe winter weather, storms and certain types of terrorism. We have catastrophe reinsurance coverage with regard to losses of up to $180,000,000. The initial $4,000,000 of losses in a catastrophe are subject to a 40% quota share reinsurance treaty, such that we retain $2,400,000 of risk per catastrophe occurrence. With respect to any additional catastrophe losses of up to $176,000,000, we are 100% reinsured under our catastrophe reinsurance program. Catastrophe coverage is limited on an annual basis to two times the per occurrence amounts. We may incur catastrophe losses in excess of: (i) those that we project would be incurred, (ii) those that external modeling firms estimate would be incurred, (iii) the average expected level used in pricing or (iv) our current reinsurance coverage limits. Despite our catastrophe management programs, we are exposed to catastrophes that could have a material adverse effect on our operating results and financial condition. Our liquidity could be constrained by a catastrophe, or multiple catastrophes, which may result in extraordinary losses or a downgrade of our financial strength ratings. In addition, the reinsurance losses that are incurred in connection with a catastrophe could have an adverse impact on the terms and conditions of future reinsurance treaties.
51
In addition, we are subject to claims arising from non-catastrophic weather events such as tropical storms, severe winter weather, rain, hail and high winds. The incidence and severity of weather conditions are largely unpredictable. There is generally an increase in the frequency of claims when severe weather conditions occur.
Unanticipated increases in the severity or frequency of claims may adversely affect our operating results and financial condition.
Changes in the severity or frequency of claims may affect our profitability. Changes in homeowners claim severity are driven by inflation in the construction industry, in building materials and in home furnishings, and by other economic and environmental factors, including increased demand for services and supplies in areas affected by catastrophes. Changes in bodily injury claim severity are driven primarily by inflation in the medical sector of the economy and litigation. Changes in auto physical damage claim severity are driven primarily by inflation in auto repair costs, prices of auto parts and used car prices. However, changes in the level of the severity of claims are not limited to the effects of inflation and demand surge in these various sectors of the economy. Increases in claim severity can arise from unexpected events that are inherently difficult to predict, such as a change in the law or an inability to enforce exclusions and limitations contained in our policies. Although we pursue various loss management initiatives to mitigate future increases in claim severity, there can be no assurances that these initiatives will successfully identify or reduce the effect of future increases in claim severity, and a significant increase in claim frequency could have an adverse effect on our operating results and financial condition.
The inability to obtain an upgrade to our financial strength rating from A.M. Best, or a downgrade in our rating, may have a material adverse effect on our competitive position, the marketability of our product offerings, and our liquidity, operating results and financial condition.
Financial strength ratings are important factors in establishing the competitive position of insurance companies and generally have an effect on an insurance company's business. Many insurance buyers, agents, brokers and secured lenders use the ratings assigned by A.M. Best and other agencies to assist them in assessing the financial strength and overall quality of the companies from which they are considering purchasing insurance or in determining the financial strength of the company that provides insurance with respect to the collateral they hold. KICO currently has an A.M. Best financial strength rating of B++ (Good). A.M. Best ratings are derived from an in-depth evaluation of an insurance company’s balance sheet strengths, operating performances and business profiles. A.M. Best evaluates, among other factors, the company’s capitalization, underwriting leverage, financial leverage, asset leverage, capital structure, quality and appropriateness of reinsurance, adequacy of reserves, quality and diversification of assets, liquidity, profitability, spread of risk, revenue composition, market position, management, market risk and event risk. On an ongoing basis, rating agencies such as A.M. Best review the financial performance and condition of insurers and can downgrade or change the outlook on an insurer's ratings due to, for example, a change in an insurer's statutory capital, a reduced confidence in management or a host of other considerations that may or may not be under the insurer's control. KICO currently has a Demotech financial stability rating of A (Excellent), which generally permits lenders to accept our policies. All ratings are subject to continuous review; therefore, the retention of these ratings cannot be assured. A downgrade in any of these ratings could have a material adverse effect on our competitiveness, the marketability of our product offerings and our ability to grow in the marketplace.
52
Adverse capital and credit market conditions may significantly affect our ability to meet liquidity needs or our ability to obtain credit on acceptable terms.
The capital and credit markets have been experiencing extreme volatility and disruption. In some cases, the markets have exerted downward pressure on the availability of liquidity and credit capacity. In the event that we need access to additional capital to pay our operating expenses, make payments on our indebtedness, pay for capital expenditures or increase the amount of insurance that we seek to underwrite or otherwise grow our business, our ability to obtain such capital may be limited and the cost of any such capital may be significant. Our access to additional financing will depend on a variety of factors, such as market conditions, the general availability of credit, the overall availability of credit to our industry, our credit ratings and credit capacity as well as lenders' perception of our long or short-term financial prospects. Similarly, our access to funds may be impaired if regulatory authorities or rating agencies take negative actions against us. If a combination of these factors occurs, our internal sources of liquidity may prove to be insufficient and, in such case, we may not be able to successfully obtain additional financing on favorable terms.
We are exposed to significant financial and capital markets risk which may adversely affect our results of operations, financial condition and liquidity, and our net investment income can vary from period to period.
We are exposed to significant financial and capital markets risk, including changes in interest rates, equity prices, market volatility, the performance of the economy in general, the performance of the specific obligors included in our portfolio and other factors outside our control. Our exposure to interest rate risk relates primarily to the market price and cash flow variability associated with changes in interest rates. Our investment portfolio contains interest rate sensitive instruments, such as fixed income securities, which may be adversely affected by changes in interest rates from governmental monetary policies, domestic and international economic and political conditions and other factors beyond our control. A rise in interest rates would increase the net unrealized loss position of our investment portfolio, which would be offset by our ability to earn higher rates of return on funds reinvested. Conversely, a decline in interest rates would decrease the net unrealized loss position of our investment portfolio, which would be offset by lower rates of return on funds reinvested.
In addition, market volatility can make it difficult to value certain of our securities if trading becomes less frequent. As such, valuations may include assumptions or estimates that may have significant period to period changes which could have a material adverse effect on our consolidated results of operations or financial condition. If significant, continued volatility, changes in interest rates, changes in defaults, a lack of pricing transparency, market liquidity and declines in equity prices, individually or in tandem, could have a material adverse effect on our results of operations, financial condition or cash flows through realized losses, impairments, and changes in unrealized positions.
Reinsurance may be unavailable at current levels and prices, which may limit our ability to write new business.
Our personal lines catastrophe reinsurance program was designed, utilizing our risk management methodology, to address our exposure to catastrophes. Market conditions beyond our control impact the availability and cost of the reinsurance we purchase. No assurances can be given that reinsurance will remain continuously available to us to the same extent and on the same terms and rates as currently available. For example, our ability to afford reinsurance to reduce our catastrophe risk may be dependent upon our ability to adjust premium rates for its cost, and there are no assurances that the terms and rates for our current reinsurance program will continue to be available in the future. If we are unable to maintain our current level of reinsurance or purchase new reinsurance protection in amounts that we consider sufficient and at prices that we consider acceptable, we will have to either accept an increase in our exposure risk, reduce our insurance writings or develop or seek other alternatives.
53
We intend to prudently reduce our reliance on quota share reinsurance; this would lead to greater exposure to net insurance losses.
We have determined it to be in the best interests of our shareholders to prudently reduce our reliance on quota share reinsurance. Any such reduction would result in higher net earned premiums and a reduction in ceding commission revenue in future years. Such an approach would also lead to increased exposure to net insurance losses.
Reinsurance subjects us to the credit risk of our reinsurers, which may have a material adverse effect on our operating results and financial condition.
The collectability of reinsurance recoverables is subject to uncertainty arising from a number of factors, including changes in market conditions, whether insured losses meet the qualifying conditions of the reinsurance contract and whether reinsurers, or their affiliates, have the financial capacity and willingness to make payments under the terms of a reinsurance treaty or contract. Since we are primarily liable to an insured for the full amount of insurance coverage, our inability to collect a material recovery from a reinsurer could have a material adverse effect on our operating results and financial condition.
Applicable insurance laws regarding the change of control of our company may impede potential acquisitions that our shareholders might consider to be desirable.
We are subject to statutes and regulations of the state of New York which generally require that any person or entity desiring to acquire direct or indirect control of KICO, our insurance company subsidiary, obtain prior regulatory approval. In addition, a change of control of Kingstone Companies, Inc. would require such approval. These laws may discourage potential acquisition proposals and may delay, deter or prevent a change of control of our company, including through transactions, and in particular unsolicited transactions, that some of our shareholders might consider to be desirable. Similar regulations may apply in other states in which we may operate.
The insurance industry is subject to extensive restrictive regulation that may affect our operating costs and limit the growth of our business, and changes within this regulatory environment may, too, adversely affect our operating costs and limit the growth of our business.
We are subject to extensive laws and regulations. State insurance regulators are charged with protecting policyholders and have broad regulatory, supervisory and administrative powers over our business practices, including, among other things, the power to grant and revoke licenses to transact business and the power to regulate and approve underwriting practices and rate changes, which may delay the implementation of premium rate changes or prevent us from making changes we believe are necessary to match rate to risk. In addition, many states have laws and regulations that limit an insurer’s ability to cancel or not renew policies and that prohibit an insurer from withdrawing from one or more lines of business written in the state, except pursuant to a plan that is approved by the state insurance department. Laws and regulations that limit cancellation and non-renewal and that subject program withdrawals to prior approval requirements may restrict our ability to exit unprofitable markets.
54
Because the laws and regulations under which we operate are administered and enforced by a number of different governmental authorities, including state insurance regulators, state securities administrators and the SEC, each of which exercises a degree of interpretive latitude, we are subject to the risk that compliance with any particular regulator's or enforcement authority's interpretation of a legal issue may not result in compliance with another's interpretation of the same issue, particularly when compliance is judged in hindsight. In addition, there is risk that any particular regulator's or enforcement authority's interpretation of a legal issue may change over time to our detriment, or that changes in the overall legal and regulatory environment may, even absent any particular regulator's or enforcement authority's interpretation of a legal issue changing, cause us to change our views regarding the actions we need to take from a legal risk management perspective, thereby necessitating changes to our practices that may, in some cases, limit our ability to grow and improve the profitability of our business.
While the United States federal government does not directly regulate the insurance industry, federal legislation and administrative policies can affect us. Congress and various federal agencies periodically discuss proposals that would provide for a federal charter for insurance companies. We cannot predict whether any such laws will be enacted or the effect that such laws would have on our business. Moreover, there can be no assurance that changes will not be made to current laws, rules and regulations, or that any other laws, rules or regulations will not be adopted in the future, that could adversely affect our business and financial condition.
We may not be able to maintain the requisite amount of risk-based capital, which may adversely affect our profitability and our ability to compete in the property and casualty insurance markets.
The New York State Department of Financial Services imposes risk-based capital requirements on insurance companies to ensure that insurance companies maintain appropriate levels of surplus to support their overall business operations and to protect customers against adverse developments, after taking into account default, credit, underwriting, reserve and off-balance sheet risks. If the amount of our capital falls below this minimum, we may face restrictions with respect to soliciting new business and/or keeping existing business. Similar regulations will apply in other states in which we may operate.
Changing climate conditions may adversely affect our financial condition, profitability or cash flows.
We recognize the scientific view that the world is getting warmer. Climate change, to the extent it produces rising temperatures and sea levels, could impact the frequency and/or severity of weather-related claim events. This may ultimately affect the affordability and availability of homeowners insurance and our ability to grow profitably in certain lines of business and geographic regions.
Our operating results and financial condition may be adversely affected by the cyclical nature of the property and casualty business.
The property and casualty market is cyclical and has experienced periods characterized by relatively high levels of price competition, less restrictive underwriting standards and relatively low premium rates, followed by periods of relatively lower levels of competition, more selective underwriting standards and relatively high premium rates. A downturn in the profitability cycle of the property and casualty business could have a material adverse effect on our operating results and financial condition.
55
Because substantially all of our revenue is currently derived from sources located in New York, our business may be adversely affected by conditions in such state.
Substantially all of our revenue is currently derived from sources located in the state of New York and, accordingly, is affected by the prevailing regulatory, economic, demographic, competitive and other conditions in such state. Changes in any of these conditions could make it more costly or difficult for us to conduct our business. Adverse regulatory developments in New York, which could include fundamental changes to the design or implementation of the insurance regulatory framework, could have a material adverse effect on our results of operations and financial condition.
We are highly dependent on a small number of insurance brokers for a large portion of our revenues.
We market our insurance products primarily through insurance brokers. A large percentage of our gross premiums written are sourced through a limited number of brokers. These brokers provided a total of 33.5% of our gross premiums written for the year ended December 31, 2015. The nature of our dependency on these brokers relates to the high volume of business they consistently refer to us. Our relationship with these brokers is based on the quality of the underwriting and claims services we provide to our clients and on our financial strength ratings. Any deterioration in these factors could result in these brokers advising clients to place their risks with other insurers rather than with us. A loss of all or a substantial portion of the business provided by one or more of these brokers could have a material adverse effect on our financial condition and results of operations.
Regulatory action taken by the New York State Department of Financial Services following Superstorm Sandy may affect our operations and business.
In the aftermath of Superstorm Sandy, the New York State Department of Financial Services (the “DFS”) has adopted various regulations that affect insurance companies that operate in the state of New York. Included among the regulations are accelerated claims investigation and settlement requirements and mandatory participation in non-binding mediation proceedings funded by the insurer. In addition, in February 2013, the state of New York announced that the DFS has commenced an investigation into the claims practices of three insurance companies, including KICO, in connection with Superstorm Sandy claims. The DFS stated that the three insurers had a much larger than average consumer complaint rate with regard to Superstorm Sandy claims and indicated that the three insurers were being investigated for (i) failure to send adjusters in a timely manner; (ii) failure to process claims in a timely manner; and (iii) inability of homeowners to contact insurance company representatives. KICO received a letter from the DFS seeking information and data with regard to the foregoing. KICO provided information and data to the DFS and has cooperated with the DFS in connection with its investigation. KICO has not received a response from the DFS since a meeting held on May 23, 2013 and believes that such matter will not have any effect on our financial position or results of operations. In settling insurance claims, including those related to Superstorm Sandy, if KICO were to pay for losses not covered by the insurance policy, such as those based on water and sewer back up claims, it could face disclaimers of coverage from its reinsurers with regard to the amounts paid.
56
Actual claims incurred may exceed current reserves established for claims, which may adversely affect our operating results and financial condition.
Recorded claim reserves for our business are based on our best estimates of losses after considering known facts and interpretations of circumstances. Internal and external factors are considered. Internal factors include, but are not limited to, actual claims paid, pending levels of unpaid claims, product mix and contractual terms. External factors include, but are not limited to, changes in the law, court decisions, changes in regulatory requirements and economic conditions. Because reserves are estimates of the unpaid portion of losses that have occurred, the establishment of appropriate reserves, including reserves for catastrophes, is an inherently uncertain and complex process. The ultimate cost of losses may vary materially from recorded reserves, and such variance may adversely affect our operating results and financial condition.
As a holding company, we are dependent on the results of operations of our subsidiaries; there are restrictions on the payment of dividends by KICO.
We are a holding company and a legal entity separate and distinct from our operating subsidiary, KICO. As a holding company with limited operations of our own, the principal sources of our funds are dividends from KICO. Consequently, we must rely on KICO for our ability to repay debts, pay expenses and pay cash dividends to our shareholders.
Our ability to receive dividends from KICO is restricted by the state laws and insurance regulations of New York. These restrictions are related to surplus and net investment income. Maximum permissible dividends are restricted to the lesser of 10% of surplus or 100% of net investment income (on a statutory accounting basis) for the trailing 36 months, less dividends paid during the preceding 24 months of the current 12 month period. As of December 31, 2015, the maximum permissible distribution that KICO could pay without prior regulatory approval was approximately $3,357,000.
Our future results are dependent in part on our ability to successfully operate in an insurance industry that is highly competitive.
The insurance industry is highly competitive. Many of our competitors have well-established national reputations, substantially more capital and significantly greater marketing and management resources. Because of the competitive nature of the insurance industry, including competition for customers, agents and brokers, there can be no assurance that we will continue to effectively compete with our industry rivals, or that competitive pressures will not have a material adverse effect on our business, operating results or financial condition.
If we lose key personnel or are unable to recruit qualified personnel, our ability to implement our business strategies could be delayed or hindered.
Our future success will depend, in part, upon the efforts of Barry Goldstein, our President and Chief Executive Officer. The loss of Mr. Goldstein or other key personnel could prevent us from fully implementing our business strategies and could materially and adversely affect our business, financial condition and results of operations. As we continue to grow, we will need to recruit and retain additional qualified management personnel, but we may not be able to do so. Our ability to recruit and retain such personnel will depend upon a number of factors, such as our results of operations and prospects and the level of competition then prevailing in the market for qualified personnel. Mr. Goldstein is a party to an employment agreement with us that expires on December 31, 2016.
57
Difficult conditions in the economy could adversely affect our business and operating results.
Some economists project the potential for significant negative macroeconomic trends, including increased unemployment, reduced consumer spending, and substantial increases in delinquencies on consumer debt, including defaults on home mortgages. Moreover, recent disruptions in the financial markets, particularly the reduced availability of credit and tightened lending requirements, have impacted the ability of borrowers to refinance loans at more affordable rates. As with most businesses, we believe that difficult conditions in the economy could have an adverse effect on our business and operating results. General economic conditions also could adversely affect us in the form of consumer behavior, which may include decreased demand for our products. As consumers become more cost conscious, they may choose lower levels of insurance.
Changes in accounting standards issued by the Financial Accounting Standards Board or other standard-setting bodies may adversely affect our results of operations and financial condition.
Our financial statements are subject to the application of generally accepted accounting principles, which are periodically revised, interpreted and/or expanded. Accordingly, we are required to adopt new guidance or interpretations, which may have a material adverse effect on our results of operations and financial condition that is either unexpected or has a greater impact than expected.
Our business could be adversely affected by a security breach or other attack involving our computer systems or those of one or more of our vendors.
Our business requires that we develop and maintain computer systems to run our operations and to store a significant volume of confidential data. Some of these systems rely on third-party vendors, through either a connection to, or an integration with, those third-parties’ systems. In the course of our operations, we acquire the personal confidential information of our customers and employees. We also store our intellectual property, trade secrets, and other sensitive business and financial information.
All of these systems are subject to “cyber attacks” by sophisticated third parties with substantial computing resources and capabilities, and to unauthorized or illegitimate actions by employees, consultants, agents and other persons with legitimate access to our systems. Such attacks or actions may include attempts to:
| ● |
steal, corrupt, or destroy data, including our intellectual property, financial data or the personal information of our customers or employees
|
|
| ● |
misappropriate funds
|
|
| ● |
disrupt or shut down our systems
|
|
| ● |
deny customers, agents, brokers, or others access to our systems, or
|
|
| ● |
infect our systems with viruses or malware.
|
While we can take defensive measures, there can be no assurance that we will be successful in preventing attacks or detecting and stopping them once they have begun. Our business could be significantly damaged by a security breach, data loss or corruption, or cyber attack. In addition to the potentially high costs of investigating and stopping such an event and implementing necessary fixes, we could incur substantial liability if confidential customer or employee information is stolen. In addition, such an event could cause a significant disruption of our ability to conduct our insurance operations. We have a cyber insurance policy to protect against the monetary impact of some of these risks. However, the occurrence of a security breach, data loss or corruption, or cyber-attack, if sufficiently severe, could have a material adverse effect on our business results.
We rely on our information technology and telecommunication systems, and the failure of these systems could materially and adversely affect our business.
Our business is highly dependent upon the successful and uninterrupted functioning of our information technology and telecommunications systems. We rely on these systems to support our operations. The failure of these systems could interrupt our operations and result in a material adverse effect on our business.
We have incurred, and will continue to incur, increased costs as a result of being an SEC reporting company.
The Sarbanes-Oxley Act of 2002, as well as a variety of related rules implemented by the SEC, have required changes in corporate governance practices and generally increased the disclosure requirements of public companies. As a reporting company, we incur significant legal, accounting and other expenses in connection with our public disclosure and other obligations. Based upon SEC regulations currently in effect, we are required to establish, evaluate and report on our internal control over financial reporting. We believe that compliance with the myriad of rules and regulations applicable to reporting companies and related compliance issues will require a significant amount of time and attention from our management.
58
Risks Related to Our Common Stock
Our stock price may fluctuate significantly and be highly volatile and this may make it difficult for shareholders to resell shares of our common stock at the volume, prices and times they find attractive.
The market price of our common stock could be subject to significant fluctuations and be highly volatile, which may make it difficult for shareholders to resell shares of our common stock at the volume, prices and times they find attractive. There are many factors that will impact our stock price and trading volume, including, but not limited to, the factors listed above under “Risks Related to Our Business.”
Stock markets, in general, have continued to experience significant price and volume volatility, and the market price of our common stock may continue to be subject to similar market fluctuations that may be unrelated to our operating performance and prospects. Increased market volatility and fluctuations could result in a substantial decline in the market price of our common stock.
The trading volume in our common stock has been limited. As a result, shareholders may not experience liquidity in their investment in our common stock, thereby potentially limiting their ability to resell their shares at the volume, times and prices they find attractive.
Our common stock is currently traded on The NASDAQ Capital Market. Our common stock is currently thinly traded and has substantially less liquidity than the average trading market for many other publicly traded insurance and other companies. An active trading market for our common stock may not develop or, if developed, may not be sustained. Thinly traded stocks can be more volatile than stock trading in an active public market. Therefore, shareholders have very little liquidity and may not be able to sell their shares at the volume, prices and times that they desire.
There may be future issuances or resales of our common stock which may materially and adversely affect the market price of our common stock.
Subject to any required state insurance regulatory approvals, we are not restricted from issuing additional shares of our common stock in the future, including securities convertible into, or exchangeable or exercisable for, shares of our common stock. Our issuance of additional shares of common stock in the future will dilute the ownership interests of our then existing shareholders.
We have an effective registration on Form S-3 under the Securities Act registering for resale 659,100 shares of our common stock and effective registration statements on Form S-8 under the Securities Act registering an aggregate of 700,000 shares of our common stock issuable under our 2005 Equity Participation Plan and an aggregate of 700,000 shares of our common stock issuable under our 2014 Equity Participation Plan. Options to purchase 289,750 shares of our common stock are outstanding under the 2005 plan. Options to purchase 50,000 shares of our common stock are outstanding under the 2014 plan and 650,000 shares are reserved for issuance thereunder. The shares subject to the registration statement on Form S-3 will be freely tradeable in the public market. In addition, the shares issuable pursuant to the registration statements on Form S-8 will be freely tradable in the public market, except for shares held by affiliates.
59
The sale of a substantial number of shares of our common stock or securities convertible into, or exchangeable or exercisable for, shares of our common stock, whether directly by us or by our existing shareholders in the secondary market, the perception that such issuances or resales could occur or the availability for future issuances or resale of shares of our common stock or securities convertible into, or exchangeable or exercisable for, shares of our common stock could materially and adversely affect the market price of our common stock and our ability to raise capital through future offerings of equity or equity-related securities on attractive terms or at all.
In addition, our board of directors is authorized to designate and issue preferred stock without further shareholder approval, and we may issue other equity and equity-related securities that are senior to our common stock in the future for a number of reasons, including, without limitation, to support operations and growth, to maintain our capital ratios, and to comply with any future changes in regulatory standards.
Our executive officers and directors own a substantial number of shares of our common stock. This will enable them to significantly influence the vote on all matters submitted to a vote of our shareholders.
As of March 15, 2016, our executive officers and directors beneficially owned 1,880,990 shares of our common stock (including options to purchase 157,500 shares of our common stock), representing 25.1% of the outstanding shares of our common stock.
Accordingly, our executive officers and directors, through their beneficial ownership of our common stock, will be able to significantly influence the vote on all matters submitted to a vote of our shareholders, including the election of directors, amendments to our restated certificate of incorporation or amended and restated bylaws, mergers or other business combination transactions and certain sales of assets outside the usual and regular course of business. The interests of our executive officers and directors may not coincide with the interests of our other shareholders, and they could take actions that advance their own interests to the detriment of our other shareholders.
Anti-takeover provisions and the regulations to which we may be subject may make it more difficult for a third party to acquire control of us, even if the change in control would be beneficial to our shareholders.
We are a holding company incorporated in Delaware. Anti-takeover provisions in Delaware law and our restated certificate of incorporation and bylaws, as well as regulatory approvals required under state insurance laws, could make it more difficult for a third party to acquire control of us and may prevent shareholders from receiving a premium for their shares of common stock. Our certificate of incorporation provides that our board of directors may issue up to 2,500,000 shares of preferred stock, in one or more series, without shareholder approval and with such terms, preferences, rights and privileges as the board of directors may deem appropriate. These provisions, the control of our executive officers and directors over the election of our directors, and other factors may hinder or prevent a change in control, even if the change in control would be beneficial to, or sought by, our shareholders.
60
|
ITEM 7A.
|
QUANTITATIVE AND QUALITATIVE DISCLOSURES ABOUT MARKET RISK.
|
Not applicable.
ITEM 8. FINANCIAL STATEMENTS AND SUPPLEMENTARY DATA.
The financial statements required by this Item 8 are included in this Annual Report following Item 15 hereof. As a smaller reporting company, we are not required to provide supplementary financial information.
|
ITEM 9.
|
CHANGES IN AND DISAGREEMENTS WITH ACCOUNTANTS ON ACCOUNTING AND FINANCIAL DISCLOSURE.
|
None.
ITEM 9A. CONTROLS AND PROCEDURES.
Disclosure Controls and Procedures
We maintain disclosure controls and procedures (as defined in Exchange Act Rule 13a-15(e)) that are designed to assure that information required to be disclosed in our Exchange Act reports is recorded, processed, summarized and reported within the time periods specified in the SEC’s rules and forms, and that such information is accumulated and communicated to management, including our Chief Executive Officer and Chief Financial Officer, as appropriate, to allow timely decisions regarding required disclosures.
As required by Exchange Act Rule 13a-15(b), as of the end of the period covered by this Annual Report, under the supervision and with the participation of our Chief Executive Officer and Chief Financial Officer, we evaluated the effectiveness of our disclosure controls and procedures. Based on this evaluation, our Chief Executive Officer and Chief Financial Officer concluded that our disclosure controls and procedures were effective as of December 31, 2015.
This Annual Report does not include an attestation report of our independent registered public accounting firm regarding internal control over financial reporting. Management’s report was not subject to attestation by our registered public accounting firm pursuant to rules of the SEC that permit us to provide only management’s report in this Annual Report.
Internal Control over Financial Reporting
Management’s Annual Report on Internal Control over Financial Reporting
Our management is responsible for establishing and maintaining adequate internal control over financial reporting as defined in Rule 13a-15(f) under the Exchange Act. Internal control over financial reporting is a process designed by, or under the supervision of, our Chief Executive Officer and Chief Financial Officer, and effected by the board of directors, management, and other personnel, to provide reasonable assurance regarding the reliability of financial reporting and the preparation of financial statements for external purposes in accordance with GAAP including those policies and procedures that: (i) pertain to the maintenance of records that, in reasonable detail, accurately and fairly reflect the transactions and dispositions of our assets, (ii) provide reasonable assurance that transactions are recorded as necessary to permit preparation of financial statements in accordance with GAAP and that receipts and expenditures are being made only in accordance with authorizations of our management and directors, and (iii) provide reasonable assurance regarding prevention or timely detection of unauthorized acquisition, use, or disposition of our assets that could have a material effect on the financial statements.
61
Because of its inherent limitations, internal control over financial reporting may not prevent or detect misstatements. Also, projections of any evaluation of effectiveness to future periods are subject to the risk that controls may become inadequate because of changes in conditions, or that the degree of compliance with policies and procedures may deteriorate.
Management conducted an evaluation of the effectiveness of our internal control over financial reporting based on the framework in Internal Control – Integrated Framework (2013) issued by the Committee of Sponsoring Organizations of the Treadway Commission. Based on the evaluation of the effectiveness of our internal control over financial reporting management concluded that our internal control over financial reporting was effective as of December 31, 2015.
Changes in Internal Control Over Financial Reporting
There was no change in our internal control over financial reporting during our most recently completed fiscal quarter that has materially affected, or is reasonably likely to materially affect, our internal control over financial reporting.
ITEM 9B. OTHER INFORMATION.
None.
62
PART III
|
ITEM 10.
|
DIRECTORS, EXECUTIVE OFFICERS AND CORPORATE GOVERNANCE.
|
Executive Officers and Directors
The following table sets forth the positions and offices presently held by each of our current directors and executive officers and their ages:
|
Name
|
Age
|
Positions and Offices Held
|
|
Barry B. Goldstein
|
63
|
President, Chairman of the Board, Chief Executive Officer and Director
|
|
Victor J. Brodsky
|
58
|
Chief Financial Officer and Treasurer
|
|
John D. Reiersen
|
73
|
Executive Vice President, Kingstone Insurance Company
|
|
Benjamin Walden
|
48
|
Senior Vice President and Chief Actuary, Kingstone Insurance Company
|
|
Floyd R. Tupper
|
61
|
Secretary and Director
|
|
Jay M. Haft
|
80
|
Director
|
|
Jack D. Seibald
|
55
|
Director
|
Barry B. Goldstein
Mr. Goldstein has served as our President, Chief Executive Officer, Chairman of the Board, and a director since March 2001. He served as our Chief Financial Officer from March 2001 to November 2007 and as our Treasurer from May 2001 to August 2013. Since January 2006, Mr. Goldstein has served as Chairman of the Board of Kingstone Insurance Company (“KICO”) (formerly known as Commercial Mutual Insurance Company), a New York property and casualty insurer, as well as Chairman of its Executive Committee. Mr. Goldstein has served as Chief Investment Officer of KICO since August 2008 and as its President and Chief Executive Officer since January 2012. He was Treasurer of KICO from March 2010 through September 2010. Effective July 1, 2009, we acquired a 100% equity interest in KICO. From April 1997 to December 2004, Mr. Goldstein served as President of AIA Acquisition Corp., which operated insurance agencies in Pennsylvania and which sold substantially all of its assets to us in May 2003. Mr. Goldstein received his B.A. and M.B.A. from State University of New York at Buffalo. We believe that Mr. Goldstein’s extensive experience in the insurance industry, including his service as Chairman of the Board of KICO since 2006 and as its Chief Investment Officer since 2008, give him the qualifications and skills to serve as one of our directors.
Victor J. Brodsky
Mr. Brodsky has served as our Chief Financial Officer since August 2009 and as our Treasurer since August 2013. He served as our Chief Accounting Officer from August 2007 through July 2009, as our Principal Financial Officer for Securities and Exchange Commission (“SEC”) reporting purposes from November 2007 through July 2009 and as our Secretary from December 2008 to August 2013. In addition, Mr. Brodsky has served as a director of KICO since February 2008, as Chief Financial Officer of KICO since September 2010 and as Senior Vice President of KICO since January 2012. He also served as Treasurer of KICO from September 2010 through December 2011. Mr. Brodsky served from May 2008 through March 15, 2010 as Vice President of Financial Reporting and Principal Financial Officer for SEC reporting purposes of Vertical Branding Inc. Mr. Brodsky served as Chief Financial Officer of Vertical Branding from March 1998 through May 2008 and as a director of Vertical Branding from May 2002 through November 2005. He served as its Secretary from November 2005 through May 2008 and from April 2009 to March 15, 2010. A receiver was appointed for the business of Vertical Branding in February 2010. Prior to joining Vertical Branding, Mr. Brodsky spent 16 years at the CPA firm of Michael & Adest in New York. Mr. Brodsky earned a Bachelor of Business Administration degree from Hofstra University, with a major in accounting, and is a licensed CPA in New York.
63
John D. Reiersen
Mr. Reiersen served as President of KICO from 1999 to 2011 and as its Chief Executive Officer from 2001 to 2011. Since January 2012, Mr. Reiersen has served as Executive Vice President of KICO. Mr. Reiersen served for 25 years with the New York State Insurance Department ending his tenure there as Chief Examiner in the Property and Casualty Insurance Bureau. At the Insurance Department, he was instrumental in the enactment of numerous statutes and regulations, including the automobile no-fault program, the photo inspection law, the Insurance Information and Enforcement System program and many other cost-containment measures. Mr. Reiersen was also instrumental in the enactment of many rules in the New York Automobile Insurance Plan. He served as President of the Eagle Insurance Group from 1990 to 2000. Mr. Reiersen served as Chairman of the New York Insurance Association and has served and continues to serve on many insurance industry association boards and committees. He holds the professional designations of Chartered Property and Casualty Underwriter, Certified Financial Examiner and Certified Insurance Examiner. Mr. Reiersen is a graduate of Brooklyn College and holds a Bachelor of Science Degree in Accounting.
Benjamin Walden
Mr. Walden has served as Senior Vice President of KICO since January 2015 and as Chief Actuary of KICO since December 2013. From December 2013 to January 2015, he served as Vice President of KICO. From February 2010 to November 2013, Mr. Walden served as Chief Actuary for Interboro Insurance Company, a personal lines carrier. From July 2008 to February 2010, Mr. Walden was President of Assigned Risk Consulting, Inc., an independent actuarial consulting firm. From October 2001 to April 2009, he served as Vice President and Chief Actuary of AutoOne Insurance, an assigned risk servicing carrier. Mr. Walden was also an actuarial consultant at Milliman, Inc., an independent provider of actuarial and consulting services, from January 1998 to October 2001. Mr. Walden has been a Fellow of the Casualty Actuarial Society since 1999 and holds a Bachelor of Science Degree in Mathematics from Villanova University.
Floyd R. Tupper
Mr. Tupper is a certified public accountant in New York City. For over 30 years, Mr. Tupper has counseled high-net worth individuals by creating tax planning strategies to achieve their goals as well as those of their families. He has also helped small businesses by developing business strategies to meet their current and future needs. He began his career in public accounting with Ernst & Young LLP prior to becoming self-employed. Mr. Tupper holds an M.B.A. in Taxation from the New York University Stern School of Business and a B.S. from New York University. Mr. Tupper has served as a director of KICO, and Chairman of its Audit Committee, since 2006. He also serves as a member of its Investment Committee. From 1990 until 2010, Mr. Tupper served as a Trustee of The Acorn School in New York City. He was also a member of the school’s Executive Committee and served as its Treasurer from 1990 to 2010. Mr. Tupper is a member of the American Institute of Certified Public Accountants and the New York State Society of Certified Public Accountants. He has served as one of our directors since June 2014 and as our Secretary since June 2015. We believe that Mr. Tupper’s accounting experience, as well as his service on the Board of KICO since 2006 (including his service as Chairman of its Audit Committee), give him the qualifications and skills to serve as one of our directors.
64
Jay M. Haft
Mr. Haft is currently a personal advisor to Victor Vekselberg, a Russian entrepreneur with considerable interests in oil, aluminum, utilities and other industries. Mr. Haft is also a partner at Columbus Nova, the U.S.-based investment and operating arm of Mr. Vekselberg’s Renova Group of companies. Mr. Haft is also a strategic and financial consultant for growth stage companies. He is active in international corporate finance and mergers and acquisitions as well as in the representation of emerging growth companies. Mr. Haft has extensive experience in the Russian market, in which he has worked on growth strategies for companies looking to internationalize their business assets and enter international capital markets. He has been a founder, consultant and/or director of numerous public and private corporations, and served as Chairman of the Board of Dusa Pharmaceuticals, Inc. Mr. Haft serves on the Board of Neurotrope, Inc., SpA, the United States-Russian Business Counsel and The Link of Times Foundation and is an advisor to Montezemolo & Partners. He has been instrumental in strategic planning and fundraising for a variety of Internet and high-tech, leading edge medical technology and marketing companies over the years. Mr. Haft is counsel to Reed Smith, an international law firm, as well as several other law and accounting firms. Mr. Haft is a past member of the Florida Commission for Government Accountability to the People, a past national trustee and Treasurer of the Miami City Ballet, and a past Board member of the Concert Association of Florida. He is also a past trustee of Florida International University Foundation and previously served on the advisory board of the Wolfsonian Museum and Florida International University Law School. Mr. Haft served as our Vice Chairman of the Board from February 1999 until March 2001. From October 1989 to February 1999, he served as our Chairman of the Board and he has served as one of our directors since 1989. Mr. Haft received B.A. and LL.B. degrees from Yale University. We believe that Mr. Haft’s corporate finance, business consultation, legal and executive-level experience, as well as his service on the Board of KICO since July 2009, give him the qualifications and skills to serve as one of our directors.
Jack D. Seibald
Mr. Seibald is Managing Director – Global Co-Head of Prime Brokerage Services of Cowen Prime Services, LLC. Mr. Seibald co-founded Concept Capital Markets, LLC (“Concept Capital”) and, until its acquisition by Cowen Group, Inc., served as a Managing Member of the firm. During his tenure with Concept Capital, Mr. Seibald was involved in the management of all aspects of the firm’s operations, with a particular emphasis on business and client development and legal matters. Mr. Seibald also served as a member of the Board of Managers of Concept Capital Holdings, LLC, the former parent of Concept Capital, Concept Capital Administration, LLC, which provided administrative services to Concept Capital and its affiliates, and ConceptONE, LLC, which provides risk and performance analytic solutions, middle and back office support services, and regulatory reporting services to investment managers. Mr. Seibald had been affiliated with Concept Capital and its predecessors since 1995 and has extensive experience in prime brokerage, investment management, and investment research dating back to 1983. From 1997 to 2005, Mr. Seibald was also a Managing Member of Whiteford Advisors, LLC, an investment management firm, where as co-founder, he co-managed several pools of funds. He began his career at Oppenheimer & Co. as an equity analyst covering the retailing industry and has also been affiliated with Salomon Brothers and Morgan Stanley & Co in similar positions. Mr. Seibald also operated The Seibald Report, Inc., an independent research firm specializing in the retailing sector. He holds an M.B.A. from Hofstra University and a B.A. from George Washington University. Mr. Seibald has served as one of our directors since 2004. In January 2008, the Financial Industry Regulatory Authority (“FINRA”) imposed a $100,000 fine and 20-day suspension on Mr. Seibald in connection with the settlement of a FINRA action against Sanders Morris Harris Inc. and Mr. Seibald, among others. FINRA had found that Mr. Seibald had improperly received compensation from a profit pool derived, in part, from commissions on trading by a hedge fund for which he served as a manager. We believe that Mr. Seibald’s corporate finance and executive-level experience, as well as his service on the Board of KICO since 2006 (including his service as Chairman of its Investment Committee), give him the qualifications and skills to serve as one of our directors.
65
Family Relationships
There are no family relationships among any of our executive officers and directors.
Term of Office
Each director will hold office until the next annual meeting of stockholders and until his successor is elected and qualified or until his earlier resignation or removal. Each executive officer will hold office until the initial meeting of the Board of Directors following the next annual meeting of stockholders and until his successor is elected and qualified or until his earlier resignation or removal.
Audit Committee
The Audit Committee of the Board of Directors is responsible for overseeing our accounting and financial reporting processes and the audits of our financial statements. The members of the Audit Committee are Messrs. Tupper, Haft and Seibald.
Audit Committee Financial Expert
Our Board of Directors has determined that Mr. Tupper is an “audit committee financial expert,” as that is defined in Item 407(d)(5) of Regulation S-K Mr. Tupper is an “independent director” based on the definition of independence in Listing Rule 5605(a)(2) of The NASDAQ Stock Market.
Section 16(a) Beneficial Ownership Reporting Compliance
Section 16 of the Exchange Act requires that reports of beneficial ownership of common shares and changes in such ownership be filed with the Securities and Exchange Commission by Section 16 “reporting persons,” including directors, certain officers, holders of more than 10% of the outstanding common shares and certain trusts of which reporting persons are trustees. We are required to disclose in this Annual Report each reporting person whom we know to have failed to file any required reports under Section 16 on a timely basis during the fiscal year ended December 31, 2015. To our knowledge, based solely on a review of copies of Forms 3, 4 and 5 filed with the Securities and Exchange Commission and written representations that no other reports were required, during the fiscal year ended December 31, 2015, our officers, directors and 10% stockholders complied with all Section 16(a) filing requirements applicable to them.
Code of Ethics; Officer and Director Trading Restrictions Policy
Our Board of Directors has adopted a Code of Ethics for our principal executive officer, principal financial officer, principal accounting officer or controller, or persons performing similar functions. Our Board of Directors has also adopted an Officer and Director Trading Restrictions Policy for our officers and directors as well as the officers and directors of KICO. Copies of the Code of Ethics and Officer and Director Trading Restrictions Policy are posted on our website, www.kingstonecompanies.com. We intend to satisfy the disclosure requirement under Item 5.05(c) of Form 8-K regarding an amendment to, or a waiver from, our Code of Ethics or Officer and Director Trading Restrictions Policy by posting such information on our website, www.kingstonecompanies.com.
66
ITEM 11. EXECUTIVE COMPENSATION.
Summary Compensation Table
The following table sets forth certain information concerning the compensation for the fiscal years ended December 31, 2015 and 2014 for certain executive officers, including our Chief Executive Officer:
|
Name and Principal Position
|
Year
|
Salary
|
Bonus
|
Option Awards
|
Non-Equity
Incentive Plan
Compensation
|
All Other
Compensation
|
Total
|
|||||||||||||||||||
|
Barry B. Goldstein
Chief Executive
|
2015
|
$ | 575,000 | $ | - | $ | 93,719 | $ | 514,970 | (1) | $ | 36,723 | $ | 1,220,412 | ||||||||||||
|
Officer
|
2014
|
$ | 512,500 | $ | 62,500 | $ | 320,026 | $ | 453,853 | (2) | $ | 36,319 | $ | 1,385,198 | ||||||||||||
|
Victor J. Brodsky
Chief Financial
|
2015
|
$ | 280,400 | $ | 14,377 | $ | - | $ | 33,521 | (3) | $ | 20,041 | $ | 348,339 | ||||||||||||
|
Officer
|
2014
|
$ | 269,600 | $ | 10,000 | $ | - | $ | 32,248 | (4) | $ | 19,691 | $ | 331,539 | ||||||||||||
|
Benjamin Walden
Senior Vice President and
|
2015
|
$ | 235,000 | $ | - | $ | - | $ | 40,044 | (3) | $ | 13,282 | $ | 288,326 | ||||||||||||
|
Chief Actuary, Kingstone Insurance Company
|
2014
|
$ | 210,000 | $ | - | $ | - | $ | 36,160 | (4) | $ | 7,431 | $ | 253,591 | ||||||||||||
(2) Represents bonus compensation of $385,825 accrued pursuant to Mr. Goldstein’s employment agreement and paid in 2015, and $68,028 accrued pursuant to the KICO employee profit sharing plan and paid in 2015.
(3) Represents amounts accrued pursuant to the KICO employee profit sharing plan for 2015 and paid in 2016.
(4) Represents amounts accrued pursuant to the KICO employee profit sharing plan for 2014 and paid in 2015.
67
Employment Contracts
Mr. Goldstein is employed as our President, Chairman of the Board and Chief Executive Officer pursuant to an employment agreement, dated October 16, 2007, as amended (the “Goldstein Employment Agreement”), that expires on December 31, 2016. Pursuant to the Goldstein Employment Agreement, effective July 1, 2014, Mr. Goldstein is entitled to receive an annual base salary of $575,000 (“Base Salary”). Mr. Goldstein’s annual base salary had been $350,000 from January 1, 2004 through December 31, 2009, $375,000 from January 1, 2010 through December 31, 2011 and $450,000 from January 1, 2012 through June 30, 2014. Effective July 1, 2014, Mr. Goldstein is entitled to receive an annual bonus equal to 6% of our consolidated income from operations before taxes, net of our consolidated net investment income and net realized gains on sales of investments. Through June 30, 2014, Mr. Goldstein was entitled to receive an annual bonus of up to 6% of our consolidated net income. In consideration of Mr. Goldstein entering into an amendment to his employment agreement in August 2014, we paid him a bonus in the amount of $62,500. He is also entitled to increases in the Base Salary and other potential additional compensation as may be determined from time to time by the Board in its sole discretion. A portion of the Base Salary amount payable to Mr. Goldstein is contractually shared with KICO and the bonus payable to him by us is subject to reduction on a dollar-for-dollar basis to the extent of any bonus paid to him by KICO. Since August 2008, Mr. Goldstein has served as Chief Investment Officer of KICO. Since January 2012, he has also served as President and Chief Executive Officer of KICO. See “Termination of Employment and Change-in-Control Arrangements.”
OUTSTANDING EQUITY AWARDS AT FISCAL YEAR-END
|
Option Awards
|
|||||||||||||
|
Name
|
Number of Securities Underlying
Unexercised Options
|
Number of Securities Underlying
Unexercised Options
|
Option Exercise
Price
|
Option Expiration Date
|
|||||||||
|
Exercisable
|
Unexercisable
|
||||||||||||
|
Barry B. Goldstein
|
125,000 | 125,000 | (1) | $ | 6.73 |
08/12/19
|
|||||||
|
Victor J. Brodsky
|
15,000 | 5,000 | (2) | $ | 5.09 |
08/29/18
|
|||||||
|
Benjamin Walden
|
7,500 | 2,500 | (3) | $ | 6.60 |
12/16/18
|
|||||||
(1) Such options are exercisable to the extent of 62,500 shares effective as of each of August 12, 2016 and 2017.
(2) Such options are exercisable on August 29, 2016.
(3) Such options are exercisable on December 16, 2016.
Termination of Employment and Change-in-Control Arrangements
Pursuant to the Goldstein Employment Agreement and as provided for in his prior employment agreement which expired on April 1, 2007, Mr. Goldstein would be entitled, under certain circumstances, to a payment equal to one and one-half times his then annual salary in the event of the termination of his employment following a change of control of Kingstone Companies, Inc. Under such circumstances, Mr. Goldstein’s outstanding options would become exercisable and would remain exercisable until the first anniversary of the termination date. In addition, in the event Mr. Goldstein’s employment is terminated by us without cause or he resigns with good reason (each as defined in the Goldstein Employment Agreement), Mr. Goldstein would be entitled to receive his base salary and bonuses from us for the remainder of the term, and his outstanding options would become exercisable and would remain exercisable until the first anniversary of the termination date. In addition, in the event Mr. Goldstein’s employment with KICO is terminated by KICO with or without cause, he would be entitled to receive a lump sum payment from KICO equal to six months base salary.
68
Compensation of Directors
The following table sets forth certain information concerning the compensation of our directors for the fiscal year ended December 31, 2015:
DIRECTOR COMPENSATION
|
Name
|
Fees Earned or
Paid in Cash
|
Stock Awards
|
Option Awards
|
Total
|
||||||||||||
|
Michael R. Feinsod(1)
|
$ | 20,500 | - | - | $ | 20,500 | ||||||||||
|
Jay M. Haft
|
$ | 43,875 | - | - | $ | 43,875 | ||||||||||
|
Jack D. Seibald
|
$ | 48,375 | - | - | $ | 48,375 | ||||||||||
|
Floyd R. Tupper
|
$ | 50,375 | - | - | $ | 50,375 | ||||||||||
Our non-employee directors are currently entitled to receive annual compensation for their services as directors as follows:
|
·
|
$43,000 (including $5,000 for services as a director of KICO)
|
|
·
|
an additional $6,000 for services as committee chair (and $1,500 for services as KICO committee chair)
|
|
·
|
2,000 shares of our common stock which vest in one-third increments over a three year period.
|
69
|
ITEM 12.
|
SECURITY OWNERSHIP OF CERTAIN BENEFICIAL OWNERS AND MANAGEMENT AND RELATED STOCKHOLDER MATTERS.
|
Security Ownership
The following table sets forth certain information as of March 15, 2016 regarding the beneficial ownership of our shares of common stock by (i) each person who we believe to be the beneficial owner of more than 5% of our outstanding shares of common stock, (ii) each present director, (iii) each person listed in the Summary Compensation Table under “Executive Compensation,” and (iv) all of our present executive officers and directors as a group.
|
Name and Address
of Beneficial Owner
|
Number of Shares
Beneficially Owned
|
Approximate
Percent of Class
|
|
Barry B. Goldstein
15 Joys Lane
Kingston, New York
|
1,145,161
(1)(2)
|
15.4 %
|
|
Jack D. Seibald
1336 Boxwood Drive West
Hewlett Harbor, New York
|
408,147
(1)(3)
|
5.6%
|
|
Jay M. Haft
69 Beaver Dam Road
Salisbury, Connecticut
|
170,275
(1)
|
2.3%
|
|
Floyd R. Tupper
220 East 57th Street
New York, New York
|
96,975
(1)(4)
|
1.3%
|
|
Victor J. Brodsky
15 Joys Lane
Kingston, New York
|
26,408
(1)(5)
|
*
|
|
Benjamin Walden
11 Mill Pond Lane
Centerport, New York
|
10,000
(1)(6)
|
*
|
|
Eidelman Virant Capital, Inc.
8000 Maryland Avenue, Suite 380
St. Louis, Missouri
|
492,227
(7)
|
6.7%
|
|
Ronin Capital, LLC
350 N. Orleans Street, Suite 2N
Chicago, Illinois
|
471,166
(7)
|
6.4%
|
|
Wedbush Opportunity Capital, LLC
Wedbush Opportunity Partners, LP
1000 Wilshire Boulevard
Los Angeles, California
|
454,051
(7)(8)
|
6.2%
|
|
All executive officers
and directors as a group
(7 persons)
|
1,880,990
(1)(2)(3)(4)(5)(6)(9)
|
25.1%
|
* Less than 1%.
70
|
(1)
|
Based upon Schedule 13D filed under the Securities Exchange Act of 1934, as amended (the “Exchange Act”), and/or other information that is publicly available.
|
|
(2)
|
Includes (i) 35,000 shares held in retirement trusts for the benefit of Mr. Goldstein, (ii) 125,000 shares issuable upon the exercise of currently exercisable options and (iii) 144,161 shares owned by Mr. Goldstein’s wife. The inclusion of the shares owned by Mr. Goldstein’s wife shall not be construed as an admission that Mr. Goldstein is, for purposes of Section 13(d) or 13(g) of the Exchange Act, the beneficial owner of such shares.
|
|
(3)
|
Pursuant to Schedule 13D filed under the Exchange Act, includes (i) 113,000 shares owned jointly by Mr. Seibald and his wife, Stephanie Seibald; (ii) 174,824 shares held in a retirement trust for the benefit of Mr. Seibald; and (iii) 100,000 shares owned by SDS Partners I, Ltd. for which Mr. Seibald serves as a general partner. Mr. Seibald has sole voting and dispositive power over 195,147 shares and shared voting and dispositive power over 213,000 shares. The inclusion of shares that Mr. Seibald does not directly own shall not be deemed an admission that Mr. Seibald is, for purposes of Section 13(d) of the Exchange Act, the beneficial owner of such shares.
|
|
(4)
|
Includes (i) 26,592 shares held in a retirement trust for the benefit of Mr. Tupper and (ii) 43,200 shares owned by Mr. Tupper’s wife or a retirement trust for her benefit. The inclusion of the shares owned by Mr. Tupper’s wife and the retirement trust for her benefit shall not be construed as an admission that Mr. Tupper is, for purposes of Section 13(d) or 13(g) of the Exchange Act, the beneficial owner of such shares.
|
|
(5)
|
Includes 15,000 shares issuable upon the exercise of currently exercisable options.
|
|
(6)
|
Represents shares issuable upon the exercise of currently exercisable options.
|
|
(7)
|
Based upon Schedule 13G, as amended, filed under the Exchange Act.
|
|
(8)
|
Pursuant to Schedule 13G: (i) Wedbush Opportunity Partners, L.P. (the “Fund”) and Wedbush Opportunity Capital, LLC (the “General Partner”), as the general partner of the Fund, each have sole voting and dispositive power over 415,551 shares; (ii) the General Partner has shared voting and dispositive power over the remaining 38,500 shares; (iii) the 454,051 shares are held directly by the Fund and accounts under management by the General Partner for the benefit of the Fund's investors; (iv) the 454,051 shares may be deemed to be indirectly beneficially owned by the General Partner, as the general partner of the Fund; and (v) the General Partner disclaims beneficial ownership of the shares owned by the Fund, except to the extent of any pecuniary interest therein.
|
|
(9)
|
Includes 7,500 shares issuable upon the exercise of currently exercisable options.
|
71
Securities Authorized for Issuance Under Equity Compensation Plans
The following table sets forth information as of December 31, 2015 with respect to compensation plans (including individual compensation arrangements) under which our common shares are authorized for issuance, aggregated as follows:
|
·
|
All compensation plans previously approved by security holders; and
|
|
·
|
All compensation plans not previously approved by security holders.
|
EQUITY COMPENSATION PLAN INFORMATION
|
Number of securities to be issued upon exercise of outstanding options, warrants and rights
|
Weighted average exercise price of outstanding options, warrants and rights
|
Number of securities remaining available for future issuance under equity compensation plans (excluding securities reflected in column (a))
|
||||||||||
|
(a)
|
(b)
|
(c)
|
||||||||||
|
Equity compensation plans approved by security holders
|
339,750 | $ | 6.34 | 650,000 | ||||||||
|
Equity compensation plans not approved by security holders
|
- | $ | - | - | ||||||||
|
Total
|
339,750 | 650,000 | ||||||||||
72
|
ITEM 13.
|
CERTAIN RELATIONSHIPS AND RELATED TRANSACTIONS, AND DIRECTOR INDEPENDENCE.
|
Director Independence
Board of Directors
Our Board of Directors is currently comprised of Barry B. Goldstein, Jay M. Haft, Jack D. Seibald and Floyd R. Tupper. Each of Messrs. Haft, Seibald and Tupper is currently an “independent director” based on the definition of independence in Listing Rule 5605(a)(2) of The NASDAQ Stock Market.
Audit Committee
The members of our Board’s Audit Committee currently are Messrs. Tupper, Haft and Seibald, each of whom is an “independent director” based on the definition of independence in Listing Rule 5605(a)(2) of The NASDAQ Stock Market and Rule 10A-3(b)(1) under the Exchange Act.
Nominating and Corporate Governance Committee
The members of our Board’s Nominating and Corporate Governance Committee currently are Messrs. Haft, Seibald and Tupper, each of whom is an “independent director” based on the definition of independence in Listing Rule 5605(a)(2) of The NASDAQ Stock Market.
Compensation Committee
The members of our Board’s Compensation Committee currently are Messrs. Seibald, Haft and Tupper, each of whom is an “independent director” based on the definition of independence in Listing Rule 5605(a)(2) of The NASDAQ Stock Market.
|
ITEM 14.
|
PRINCIPAL ACCOUNTANT FEES AND SERVICES.
|
The following is a summary of the fees billed to us by Marcum LLP, our independent auditors, for professional services rendered for the fiscal year ended December 31, 2015 and 2014.
|
Fee Category
|
Fiscal 2015 Fees
|
Fiscal 2014 Fees
|
||||||
|
Audit Fees(1)
|
$ | 203,749 | $ | 192,318 | ||||
|
Audit-Related Fees(2)
|
$ | - | $ | - | ||||
|
Tax Fees(3)
|
$ | 5,379 | $ | 43,085 | ||||
|
All Other Fees(4)
|
$ | - | $ | - | ||||
| $ | 209,128 | $ | 235,403 | |||||
|
(1)
|
Audit Fees consist of fees billed for services rendered for the audit of our consolidated financial statements and review of our condensed consolidated financial statements included in our quarterly reports on Form 10-Q, services rendered in connection with the filing of Form S-8 and services provided in connection with other statutory or regulatory filings.
|
|
(2)
|
Audit-Related Fees consist of aggregate fees billed for assurance and related services that are reasonably related to the performance of the audit or review of our financial statements and are not reported under “Audit Fees.”
|
73
|
(3)
|
Tax Fees consist of fees billed by our independent auditors for professional services related to preparation of our 2013 U.S. federal and state income tax returns, representation for the examination of our 2011 and 2012 federal tax returns, and tax advice.
|
|
(4)
|
All Other Fees consist of aggregate fees billed for products and services provided by our independent auditors, other than those disclosed above.
|
The Audit Committee is responsible for the appointment, compensation and oversight of the work of the independent auditors and approves in advance any services to be performed by the independent auditors, whether audit-related or not. The Audit Committee reviews each proposed engagement to determine whether the provision of services is compatible with maintaining the independence of the independent auditors. Substantially all of the fees shown above were pre-approved by the Audit Committee.
74
PART IV
ITEM 15. EXHIBITS AND FINANCIAL STATEMENT SCHEDULES.
|
Exhibit
Number
|
Description of Exhibit
|
|
3(a)
|
Restated Certificate of Incorporation, as amended (1)
|
|
3(b)
|
By-laws, as amended (2)
|
|
10(a)
|
2005 Equity Participation Plan (3)
|
|
10(b)
|
2014 Equity Participation Plan (4)
|
|
10(c)
|
Employment Agreement, dated as of October 16, 2007, between DCAP Group, Inc. and Barry B. Goldstein (5)
|
|
10(d)
|
Amendment No. 1, dated as of August 25, 2008, to Employment Agreement between DCAP Group, Inc. and Barry B. Goldstein (6)
|
|
10(e)
|
Amendment No. 2, dated as of March 24, 2010, to Employment Agreement between Kingstone Companies, Inc. (formerly DCAP Group, Inc.) and Barry B. Goldstein (7)
|
|
10(f)
|
Amendment No. 3, dated as of May 10, 2011, to Employment Agreement between Kingstone Companies, Inc. (formerly DCAP Group, Inc.) and Barry B. Goldstein (8)
|
|
10(g)
|
Amendment No. 4, dated as of April 16, 2012, to Employment Agreement between Kingstone Companies, Inc. (formerly DCAP Group, Inc.) and Barry B. Goldstein (9)
|
|
10(h)
|
Amendment No. 5, dated as of August 12, 2014, to Employment Agreement between Kingstone Companies, Inc. (formerly DCAP Group, Inc.) and Barry B. Goldstein (4)
|
|
10(i)
|
Employment Agreement, dated as of May 10, 2011, between Kingstone Insurance Company and Barry B. Goldstein (8)
|
|
10(j)
|
Amendment No. 1, dated as of May 14, 2012, to Employment Agreement between Kingstone Insurance Company and Barry B. Goldstein (10)
|
|
10(k)
|
Employment Contract, dated as of September 13, 2006, between Commercial Mutual Insurance Company and Successor Companies and John D. Reiersen (11)
|
|
10(l)
|
Amendment No. 1, dated as of January 25, 2008, to Employment Contract between Commercial Mutual Insurance Company and Successor Companies and John D. Reiersen (11)
|
|
10(m)
|
Amendment No. 2, dated as of July 18, 2008, to Employment Contract between Commercial Mutual Insurance Company and Successor Companies and John D. Reiersen (11)
|
75
|
10(n)
|
Amendment No. 3, dated as of February 28, 2011, to Employment Contract between Kingstone Insurance Company (as successor in interest to Commercial Mutual Insurance Company) and John D. Reiersen (12)
|
|
10(o)
|
Amendment No. 4, dated as of October 14, 2013, to Employment Contract between Kingstone Insurance Company (as successor in interest to Commercial Mutual Insurance Company) and John D. Reiersen (13)
|
|
10(p)
|
Stock Option Agreement, dated as of August 12, 2014, between Kingstone Companies, Inc. and Barry B. Goldstein (2005 Equity Participation Plan) (4)
|
|
10(q)
|
Stock Option Agreement, dated as of August 12, 2014, between Kingstone Companies, Inc. and Barry B. Goldstein (2014 Equity Participation Plan) (4)
|
|
14(a)
|
Code of Ethics (3)
|
|
14(b)
|
Officer and Director Trading Restrictions Policy (3)
|
|
21
|
Subsidiaries (10)
|
|
23
|
Consent of Marcum LLP
|
|
Rule 13a-14(a)/15d-14(a) Certification of Principal Executive Officer as Adopted Pursuant to Section 302 of the Sarbanes-Oxley Act of 2002
|
|
|
Rule 13a-14(a)/15d-14(a) Certification of Principal Financial Officer as Adopted Pursuant to Section 302 of the Sarbanes-Oxley Act of 2002
|
|
|
Certification of Chief Executive Officer and Chief Financial Officer Pursuant to 18 U.S.C. Section 1350, as Adopted Pursuant to Section 906 of the Sarbanes-Oxley Act of 2002
|
|
|
101.INS
|
XBRL Instance Document
|
|
101.SCH
|
101.SCH XBRL Taxonomy Extension Schema.
|
|
101.CAL
|
101.CAL XBRL Taxonomy Extension Calculation Linkbase.
|
|
101.DEF
|
101.DEF XBRL Taxonomy Extension Definition Linkbase.
|
|
101.LAB
|
101.LAB XBRL Taxonomy Extension Label Linkbase.
|
|
101.PRE
|
101.PRE XBRL Taxonomy Extension Presentation Linkbase.
|
76
|
(1)
|
Denotes document filed as an exhibit to our Quarterly Report on Form 10-Q for the period ended March 31, 2014 and incorporated herein by reference.
|
|
(2)
|
Denotes document filed as an exhibit to our Current Report on Form 8-K for an event dated November 5, 2009 and incorporated herein by reference.
|
|
(3)
|
Denotes document filed as an exhibit to our Annual Report on Form 10-K for the fiscal year ended December 31, 2014 and incorporated herein by reference.
|
|
(4)
|
Denotes document filed as an exhibit to our Current Report on Form 8-K for an event dated August 12, 2014 and incorporated herein by reference.
|
|
(5)
|
Denotes document filed as an exhibit to our Current Report on Form 8-K for an event dated October 16, 2007 and incorporated herein by reference.
|
|
(6)
|
Denotes document filed as an exhibit to our Quarterly Report on Form 10-Q for the period ended September 30, 2008 and incorporated herein by reference.
|
|
(7)
|
Denotes document filed as an exhibit to our Current Report on Form 8-K for an event dated March 24, 2010 and incorporated herein by reference.
|
|
(8)
|
Denotes document filed as an exhibit to our Current Report on Form 8-K for an event dated May 10, 2011 and incorporated herein by reference.
|
|
(9)
|
Denotes document filed as an exhibit to our Current Report on Form 8-K for an event dated April 16, 2012 and incorporated herein by reference.
|
|
(10)
|
Denotes document filed as an exhibit to our Annual Report on Form 10-K for the fiscal year ended December 31, 2012 and incorporated herein by reference.
|
|
(11)
|
Denotes document filed as an exhibit to our Annual Report on Form 10-K for the fiscal year ended December 31, 2009 and incorporated herein by reference.
|
|
(12)
|
Denotes document filed as an exhibit to our Current Report on Form 8-K for an event dated February 28, 2011 and incorporated herein by reference.
|
|
(13)
|
Denotes document filed as an exhibit to our Registration Statement on Form S-1 filed with the Securities and Exchange Commission on October 15, 2013 and incorporated herein by reference.
|
77
SIGNATURES
Pursuant to the requirements of Section 13 or 15(d) of the Securities Exchange Act of 1934, the registrant has duly caused this report to be signed on its behalf by the undersigned, thereunto duly authorized.
| KINGSTONE COMPANIES, INC. | |||
|
Dated: March 24, 2016
|
By:
|
/s/ Barry B. Goldstein | |
| Barry B. Goldstein | |||
| Chief Executive Officer | |||
Pursuant to the requirements of the Securities Exchange Act of 1934, this report has been signed below by the following persons on behalf of the registrant and in the capacities and on the dates indicated.
|
Signature
|
Capacity
|
Date
|
|
/s/ Barry B. Goldstein
Barry B. Goldstein
|
President, Chairman of the Board, Chief Executive Officer, Treasurer and Director (Principal Executive Officer)
|
March 24, 2016
|
|
/s/ Victor J. Brodsky
Victor J. Brodsky
|
Chief Financial Officer and Treasurer
(Principal Financial and Accounting Officer)
|
March 24, 2016
|
|
________________
Jay M. Haft
|
Director
|
|
|
/s/ Floyd R. Tupper
Floyd R. Tupper
|
Director
|
March 24, 2016
|
|
/s/ Jack D. Seibald
Jack D. Seibald
|
Director
|
March 24, 2016
|
78
Index to Consolidated Financial Statements
|
Page
|
|
|
Report of Independent Registered Public Accounting Firm
|
F-2
|
|
Consolidated Balance Sheets as of December 31, 2015 and 2014
|
F-3
|
|
Consolidated Statements of Income and Comprehensive Income for the years ended December 31, 2015 and 2014
|
F-4
|
|
Consolidated Statements of Stockholders’ Equity for the years ended December 31, 2015 and 2014
|
F-5
|
|
Consolidated Statements of Cash Flows for the years ended December 31, 2015 and 2014
|
F-6
|
|
Notes to Consolidated Financial Statements
|
F-7
|
F-1
REPORT OF INDEPENDENT REGISTERED PUBLIC ACCOUNTING FIRM
To the Audit Committee of the
Board of Directors and Shareholders
of Kingstone Companies, Inc. and Subsidiaries
We have audited the accompanying consolidated balance sheets of Kingstone Companies, Inc. and Subsidiaries (the “Company”) as of December 31, 2015 and 2014, and the related consolidated statements of income and comprehensive income, changes in stockholders’ equity and cash flows for the years then ended. These financial statements are the responsibility of the Company’s management. Our responsibility is to express an opinion on these financial statements based on our audits.
We conducted our audits in accordance with the standards of the Public Company Accounting Oversight Board (United States). Those standards require that we plan and perform the audits to obtain reasonable assurance about whether the financial statements are free of material misstatement. The Company is not required to have, nor were we engaged to perform, an audit of its internal control over financial reporting. Our audits included consideration of internal control over financial reporting as a basis for designing audit procedures that are appropriate in the circumstances, but not for the purpose of expressing an opinion on the effectiveness of the Company’s internal control over financial reporting. Accordingly, we express no such opinion. An audit also includes examining, on a test basis, evidence supporting the amounts and disclosures in the financial statements, assessing the accounting principles used and significant estimates made by management, as well as evaluating the overall financial statement presentation. We believe that our audits provide a reasonable basis for our opinion.
In our opinion, the financial statements referred to above present fairly, in all material respects, the financial position of Kingstone Companies, Inc. and Subsidiaries, as of December 31, 2015 and 2014, and the results of its operations and its cash flows for the years then ended in conformity with accounting principles generally accepted in the United States of America.
/s/ Marcum LLP
Marcum llp
Melville, NY
March 24, 2016
F-2
|
KINGSTONE COMPANIES, INC. AND SUBSIDIARIES
|
||||||||
|
Consolidated Balance Sheets
|
||||||||
|
December 31,
|
December 31,
|
|||||||
|
2015
|
2014
|
|||||||
|
Assets
|
||||||||
|
Fixed-maturity securities, held-to-maturity, at amortized cost (fair value of
|
||||||||
|
$5,241,095 at December 31, 2015 and $5,395,054 at December 31, 2014)
|
$ | 5,138,872 | $ | 5,128,735 | ||||
|
Fixed-maturity securities, available-for-sale, at fair value (amortized cost of
|
||||||||
|
$62,221,129 at December 31, 2015 and $50,083,441 at December 31, 2014)
|
62,502,064 | 51,120,859 | ||||||
|
Equity securities, available-for-sale, at fair value (cost of $8,751,537
|
||||||||
|
at December 31, 2015 and $7,621,309 at December 31, 2014)
|
9,204,270 | 8,017,729 | ||||||
|
Total investments
|
76,845,206 | 64,267,323 | ||||||
|
Cash and cash equivalents
|
13,551,372 | 9,906,878 | ||||||
|
Premiums receivable, net
|
10,621,655 | 8,946,899 | ||||||
|
Receivables - reinsurance contracts
|
- | 1,301,549 | ||||||
|
Reinsurance receivables, net
|
31,270,235 | 35,575,276 | ||||||
|
Deferred policy acquisition costs
|
10,835,306 | 8,985,981 | ||||||
|
Intangible assets, net
|
1,757,816 | 2,233,530 | ||||||
|
Property and equipment, net
|
3,152,266 | 2,448,042 | ||||||
|
Other assets
|
1,095,894 | 1,330,944 | ||||||
|
Total assets
|
$ | 149,129,750 | $ | 134,996,422 | ||||
|
Liabilities
|
||||||||
|
Loss and loss adjustment expense reserves
|
$ | 39,876,500 | $ | 39,912,683 | ||||
|
Unearned premiums
|
48,890,241 | 40,458,041 | ||||||
|
Advance premiums
|
1,199,376 | 1,006,582 | ||||||
|
Reinsurance balances payable
|
1,688,922 | 2,096,363 | ||||||
|
Deferred ceding commission revenue
|
6,435,068 | 5,956,540 | ||||||
|
Accounts payable, accrued expenses and other liabilities
|
4,826,603 | 3,928,137 | ||||||
|
Income taxes payable
|
263,622 | - | ||||||
|
Deferred income taxes
|
672,190 | 1,137,180 | ||||||
|
Total liabilities
|
103,852,522 | 94,495,526 | ||||||
|
Commitments and Contingencies
|
||||||||
|
Stockholders' Equity
|
||||||||
|
Preferred stock, $.01 par value; authorized 2,500,000 shares
|
- | - | ||||||
|
Common stock, $.01 par value; authorized 20,000,000 shares; issued 8,289,606 shares
|
||||||||
|
at December 31, 2015 and 8,235,095 shares at December 31, 2014; outstanding
|
||||||||
|
7,328,637 shares at December 31, 2015 and 7,308,757 shares at December 31, 2014
|
82,896 | 82,351 | ||||||
|
Capital in excess of par
|
32,987,082 | 32,873,383 | ||||||
|
Accumulated other comprehensive income
|
484,220 | 946,332 | ||||||
|
Retained earnings
|
13,605,225 | 8,203,003 | ||||||
| 47,159,423 | 42,105,069 | |||||||
|
Treasury stock, at cost, 960,969 shares at December 31, 2015 and 926,338 shares
|
||||||||
|
at December 31, 2014
|
(1,882,195 | ) | (1,604,173 | ) | ||||
|
Total stockholders' equity
|
45,277,228 | 40,500,896 | ||||||
|
Total liabilities and stockholders' equity
|
$ | 149,129,750 | $ | 134,996,422 | ||||
See accompanying notes to these consolidated financial statements.
F-3
|
KINGSTONE COMPANIES, INC. AND SUBSIDIARIES
|
||||||||
|
Consolidated Statements of Income and Comprehensive Income
|
||||||||
|
Years ended December 31,
|
2015
|
2014
|
||||||
|
Revenues
|
||||||||
|
Net premiums earned
|
$ | 48,612,082 | $ | 32,628,484 | ||||
|
Ceding commission revenue
|
11,473,117 | 13,910,111 | ||||||
|
Net investment income
|
2,563,890 | 1,799,768 | ||||||
|
Net realized (losses) gains on sales of investments
|
(50,546 | ) | 707,027 | |||||
|
Other income
|
1,577,191 | 1,006,102 | ||||||
|
Total revenues
|
64,175,734 | 50,051,492 | ||||||
|
Expenses
|
||||||||
|
Loss and loss adjustment expenses
|
23,180,000 | 17,032,188 | ||||||
|
Commission expense
|
15,317,140 | 12,125,328 | ||||||
|
Other underwriting expenses
|
12,833,391 | 10,656,265 | ||||||
|
Other operating expenses
|
1,504,121 | 1,487,345 | ||||||
|
Depreciation and amortization
|
1,032,009 | 874,907 | ||||||
|
Total expenses
|
53,866,661 | 42,176,033 | ||||||
|
Income from operations before taxes
|
10,309,073 | 7,875,459 | ||||||
|
Income tax expense
|
3,349,453 | 2,547,040 | ||||||
|
Net income
|
6,959,620 | 5,328,419 | ||||||
|
Other comprehensive income (loss), net of tax
|
||||||||
|
Gross change in unrealized gains (losses)
|
||||||||
|
on available-for-sale-securities
|
(750,716 | ) | 1,678,410 | |||||
|
Reclassification adjustment for (gains) losses
|
||||||||
|
included in net income
|
50,546 | (707,027 | ) | |||||
|
Net change in unrealized gains (losses)
|
(700,170 | ) | 971,383 | |||||
|
Income tax benefit (expense) related to items
|
||||||||
|
of other comprehensive income (loss)
|
238,058 | (330,270 | ) | |||||
|
Other comprehensive income (loss), net of tax
|
(462,112 | ) | 641,113 | |||||
|
Comprehensive income
|
$ | 6,497,508 | $ | 5,969,532 | ||||
|
Earnings per common share:
|
||||||||
|
Basic
|
$ | 0.95 | $ | 0.73 | ||||
|
Diluted
|
$ | 0.94 | $ | 0.72 | ||||
|
Weighted average common shares outstanding
|
||||||||
|
Basic
|
7,331,114 | 7,287,657 | ||||||
|
Diluted
|
7,377,880 | 7,356,962 | ||||||
|
Dividends declared and paid per common share
|
$ | 0.2125 | $ | 0.1800 | ||||
See accompanying notes to these consolidated financial statements.
F-4
|
KINGSTONE COMPANIES, INC. AND SUBSIDIARIES
|
||||||||||||||||||||||||||||||||||||||||
|
Consolidated Statement of Stockholders' Equity
|
||||||||||||||||||||||||||||||||||||||||
|
Years ended Decemebr 31, 2015 and 2014
|
||||||||||||||||||||||||||||||||||||||||
|
Accumulated
|
||||||||||||||||||||||||||||||||||||||||
|
Capital
|
Other
|
|||||||||||||||||||||||||||||||||||||||
|
Preferred Stock
|
Common Stock
|
in Excess
|
Comprehensive
|
Retained
|
Treasury Stock
|
|||||||||||||||||||||||||||||||||||
|
Shares
|
Amount
|
Shares
|
Amount
|
of Par
|
Income (Loss)
|
Earnings
|
Shares
|
Amount
|
Total
|
|||||||||||||||||||||||||||||||
|
Balance, January 1, 2014
|
- | $ | - | 8,186,031 | $ | 81,860 | $ | 32,692,568 | $ | 305,219 | $ | 4,187,209 | 919,458 | $ | (1,557,445 | ) | $ | 35,709,411 | ||||||||||||||||||||||
|
Stock-based compensation
|
- | - | - | - | 171,876 | - | - | - | - | 171,876 | ||||||||||||||||||||||||||||||
|
Shares deducted from exercise of stock options for payment of withholding taxes
|
- | - | (17,165 | ) | (172 | ) | (133,246 | ) | - | - | - | - | (133,418 | ) | ||||||||||||||||||||||||||
|
Excess tax benefit from exercise of stock options
|
- | - | - | - | 136,971 | - | - | - | - | 136,971 | ||||||||||||||||||||||||||||||
|
Exercise of stock options
|
- | - | 66,229 | 663 | 5,214 | - | - | - | - | 5,877 | ||||||||||||||||||||||||||||||
|
Acquisition of treasury stock
|
- | - | - | - | - | - | - | 6,880 | (46,728 | ) | (46,728 | ) | ||||||||||||||||||||||||||||
|
Dividends
|
- | - | - | - | - | - | (1,312,625 | ) | - | - | (1,312,625 | ) | ||||||||||||||||||||||||||||
|
Net income
|
- | - | - | - | - | - | 5,328,419 | - | - | 5,328,419 | ||||||||||||||||||||||||||||||
|
Change in unrealized gains on available-for-sale securities, net of tax
|
- | - | - | - | - | 641,113 | - | - | - | 641,113 | ||||||||||||||||||||||||||||||
|
Balance, December 31, 2014
|
- | - | 8,235,095 | 82,351 | 32,873,383 | 946,332 | 8,203,003 | 926,338 | (1,604,173 | ) | 40,500,896 | |||||||||||||||||||||||||||||
|
Stock-based compensation
|
- | - | - | - | 134,185 | - | - | - | - | 134,185 | ||||||||||||||||||||||||||||||
|
Shares deducted from exercise of stock options for payment of withholding taxes
|
- | - | (30,755 | ) | (308 | ) | (243,354 | ) | - | - | - | - | (243,662 | ) | ||||||||||||||||||||||||||
|
Excess tax benefit from exercise of stock options
|
- | - | - | - | 223,721 | - | - | - | - | 223,721 | ||||||||||||||||||||||||||||||
|
Exercise of stock options
|
- | - | 85,266 | 853 | (853 | ) | - | - | - | - | - | |||||||||||||||||||||||||||||
|
Acquisition of treasury stock
|
- | - | - | - | - | - | - | 34,631 | (278,022 | ) | (278,022 | ) | ||||||||||||||||||||||||||||
|
Dividends
|
- | - | - | - | - | - | (1,557,398 | ) | - | - | (1,557,398 | ) | ||||||||||||||||||||||||||||
|
Net income
|
- | - | - | - | - | - | 6,959,620 | - | - | 6,959,620 | ||||||||||||||||||||||||||||||
|
Change in unrealized losses on available-for-sale securities, net of tax
|
- | - | - | - | - | (462,112 | ) | - | - | - | (462,112 | ) | ||||||||||||||||||||||||||||
|
Balance, December 31, 2015
|
- | $ | - | 8,289,606 | $ | 82,896 | $ | 32,987,082 | $ | 484,220 | $ | 13,605,225 | 960,969 | $ | (1,882,195 | ) | $ | 45,277,228 | ||||||||||||||||||||||
See accompanying notes to these consolidated financial statements.
F-5
|
KINGSTONE COMPANIES, INC. AND SUBSIDIARIES
|
||||||||
|
Consolidated Statements of Cash Flows
|
||||||||
|
Years ended December 31,
|
2015
|
2014
|
||||||
|
Cash flows provided by operating activities:
|
||||||||
|
Net income
|
$ | 6,959,620 | $ | 5,328,419 | ||||
|
Adjustments to reconcile net income to net cash flows provided by operating activities:
|
||||||||
|
Net realized losses (gains) on sale of investments
|
50,546 | (707,027 | ) | |||||
|
Depreciation and amortization
|
1,032,009 | 874,907 | ||||||
|
Amortization of bond premium, net
|
323,773 | 260,996 | ||||||
|
Stock-based compensation
|
134,185 | 171,876 | ||||||
|
Excess tax benefit from exercise of stock options
|
(223,721 | ) | (136,971 | ) | ||||
|
Deferred income tax expense
|
(226,932 | ) | 113,823 | |||||
|
(Increase) decrease in operating assets:
|
||||||||
|
Premiums receivable, net
|
(1,674,756 | ) | (1,356,825 | ) | ||||
|
Receivables - reinsurance contracts
|
1,301,549 | (326,560 | ) | |||||
|
Reinsurance receivables, net
|
4,305,041 | 1,985,549 | ||||||
|
Deferred policy acquisition costs
|
(1,849,325 | ) | (2,125,718 | ) | ||||
|
Other assets
|
224,211 | 273,481 | ||||||
|
Increase (decrease) in operating liabilities:
|
||||||||
|
Loss and loss adjustment expense reserves
|
(36,183 | ) | 5,409,454 | |||||
|
Unearned premiums
|
8,432,200 | 8,122,427 | ||||||
|
Advance premiums
|
192,794 | 230,483 | ||||||
|
Reinsurance balances payable
|
(407,441 | ) | (470,366 | ) | ||||
|
Deferred ceding commission revenue
|
478,528 | (1,027,626 | ) | |||||
|
Accounts payable, accrued expenses and other liabilities
|
1,385,809 | 712,650 | ||||||
|
Net cash flows provided by operating activities
|
20,401,907 | 17,332,972 | ||||||
|
Cash flows used in investing activities:
|
||||||||
|
Purchase - fixed-maturity securities held-to-maturity
|
- | (2,715,540 | ) | |||||
|
Purchase - fixed-maturity securities available-for-sale
|
(19,152,457 | ) | (28,826,537 | ) | ||||
|
Purchase - equity securities available-for-sale
|
(3,766,972 | ) | (8,520,581 | ) | ||||
|
Sale or maturity - fixed-maturity securities available-for-sale
|
6,577,943 | 6,823,015 | ||||||
|
Sale - equity securities available-for-sale
|
2,689,113 | 7,970,324 | ||||||
|
Acquisition of fixed assets
|
(1,260,519 | ) | (808,480 | ) | ||||
|
Recovery of loss from failed bank
|
- | 51,587 | ||||||
|
Other investing activities
|
10,840 | 27,535 | ||||||
|
Net cash flows used in investing activities
|
(14,902,052 | ) | (25,998,677 | ) | ||||
|
Cash flows used in financing activities:
|
||||||||
|
Proceeds from exercise of stock options
|
- | 5,877 | ||||||
|
Withholding taxes paid on net exercise of stock options
|
(243,662 | ) | (133,418 | ) | ||||
|
Excess tax benefit from exercise of stock options
|
223,721 | 136,971 | ||||||
|
Purchase of treasury stock
|
(278,022 | ) | (46,728 | ) | ||||
|
Dividends paid
|
(1,557,398 | ) | (1,312,625 | ) | ||||
|
Net cash flows used in financing activities
|
(1,855,361 | ) | (1,349,923 | ) | ||||
|
Increase (decrease) in cash and cash equivalents
|
$ | 3,644,494 | $ | (10,015,628 | ) | |||
|
Cash and cash equivalents, beginning of period
|
9,906,878 | 19,922,506 | ||||||
|
Cash and cash equivalents, end of period
|
$ | 13,551,372 | $ | 9,906,878 | ||||
|
Supplemental disclosures of cash flow information:
|
||||||||
|
Cash paid for income taxes
|
$ | 3,596,754 | $ | 2,555,400 | ||||
|
Cash paid for interest
|
$ | - | $ | - | ||||
|
Supplemental schedule of non-cash investing and financing activities:
|
||||||||
|
Value of shares deducted from exercise of stock options for payment of withholding taxes
|
$ | 243,662 | $ | 133,418 | ||||
See accompanying notes to these consolidated financial statements.
F-6
KINGSTONE COMPANIES, INC. AND SUBSIDIARIES
NOTES TO CONSOLIDATED FINANCIAL STATEMENTS
YEARS ENDED DECEMBER 31, 2014 AND 2013
Note 1 - Nature of Business
Kingstone Companies, Inc. (referred to herein as "Kingstone" or the “Company”), through its wholly owned subsidiary, Kingstone Insurance Company (“KICO”), underwrites property and casualty insurance to small businesses and individuals exclusively through independent agents and brokers. KICO is a licensed insurance company in the States of New York, New Jersey, Connecticut, Pennsylvania and Texas; however, KICO writes substantially all of its business in New York. Through March 31, 2015, Kingstone, through its wholly owned subsidiary, Payments Inc., a licensed premium finance company in the State of New York, received fees for placing contracts with a third party licensed premium finance company (see Note 19 – Premium Finance Placement Fees).
Note 2 – Summary of Significant Accounting Policies
Basis of Presentation
The accompanying consolidated financial statements have been prepared in accordance with accounting principles generally accepted in the United States of America (“GAAP”).
Principles of Consolidation
The consolidated financial statements consist of Kingstone and its wholly owned subsidiaries; (1) KICO and its wholly owned subsidiaries, CMIC Properties, Inc. (“Properties”) and 15 Joys Lane, LLC (“15 Joys Lane”), which together own the land and building from which KICO operates, and (2) Payments Inc. All significant inter-company transactions have been eliminated in consolidation.
Revenue Recognition
Net Premiums Earned
Insurance policies issued by the Company are short-duration contracts. Accordingly, premium revenues, net of premiums ceded to reinsurers, are recognized as earned in proportion to the amount of insurance protection provided, on a pro-rata basis over the terms of the underlying policies. Unearned premiums represent premiums applicable to the unexpired portions of in-force insurance contracts at the end of each year.
Ceding Commission Revenue
Commissions on reinsurance premiums ceded are earned in a manner consistent with the recognition of the costs of the reinsurance, generally on a pro-rata basis over the terms of the policies reinsured. Unearned amounts are recorded as deferred ceding commission revenue. Certain reinsurance agreements contain provisions whereby the ceding commission rates vary based on the loss experience under the agreements. The Company records ceding commission revenue based on its current estimate of subject losses. The Company records adjustments to the ceding commission revenue in the period that changes in the estimated losses are determined.
Premium Finance Placement Fees
Premium finance placement fees are earned in the period when the contracts are placed with the third party premium finance company. Premium finance placement fees are included in “Other income” in the accompanying consolidated statements of income and comprehensive income (see Note 19 – Premium Finance Placement Fees).
F-7
KINGSTONE COMPANIES, INC. AND SUBSIDIARIES
NOTES TO CONSOLIDATED FINANCIAL STATEMENTS
YEARS ENDED DECEMBER 31, 2014 AND 2013
Liability for Loss and Loss Adjustment Expenses (“LAE”)
The liability for loss and LAE represents management’s best estimate of the ultimate cost of all reported and unreported losses that are unpaid as of the balance sheet date. The liability for losses and LAE is estimated on an undiscounted basis, using individual case-basis valuations, statistical analyses and various actuarial reserving methodologies. The projection of future claim payment and reporting is based on an analysis of the Company’s historical experience, supplemented by analyses of industry loss data. Management believes that the reserves for loss and LAE are adequate to cover the ultimate cost of losses and claims to date; however, because of the uncertainty from various sources, including changes in reporting patterns, claims settlement patterns, judicial decisions, legislation, and economic conditions, actual loss experience may not conform to the assumptions used in determining the estimated amounts for such liability at the balance sheet date. Adjustments to these estimates are reflected in expense for the period in which the estimates are changed. Because of the nature of the business historically written, management believes that the Company has limited exposure to environmental claim liabilities. The Company recognizes recoveries from salvage and subrogation when received.
Reinsurance
In the normal course of business, the Company seeks to reduce the loss that may arise from catastrophes or other events that cause unfavorable underwriting results by reinsuring certain levels of risk in various areas of exposure with other insurance enterprises or reinsurers.
Reinsurance receivables represents management’s best estimate of paid and unpaid loss and LAE recoverable from reinsurers, and ceded losses receivable and unearned ceded premiums under reinsurance agreements. Ceded losses receivable are estimated using techniques and assumptions consistent with those used in estimating the liability for loss and LAE. Management believes that reinsurance receivables as recorded represent its best estimate of such amounts; however, as changes in the estimated ultimate liability for loss and LAE are determined, the estimated ultimate amount receivable from the reinsurers will also change. Accordingly, the ultimate receivable could be significantly in excess of or less than the amount recorded in the consolidated financial statements. Adjustments to these estimates are reflected in expense for the period in which the estimates are changed. Loss and LAE incurred as presented in the consolidated statement of income and comprehensive income are net of reinsurance recoveries.
Management has evaluated its reinsurance arrangements and determined that significant insurance risk is transferred to the reinsurers. Reinsurance agreements have been determined to be short-duration prospective contracts and, accordingly, the costs of the reinsurance are recognized over the life of the contract in a manner consistent with the earning of premiums on the underlying policies subject to the reinsurance contract.
Management estimates uncollectible amounts receivable from reinsurers based on an assessment of factors including the creditworthiness of the reinsurers and the adequacy of collateral obtained, where applicable. There was no allowance for uncollectible reinsurance as of December 31, 2015 and 2014. The Company did not expense any uncollectible reinsurance for the years ended December 31, 2015 and 2014. Significant uncertainties are inherent in the assessment of the creditworthiness of reinsurers and estimates of any uncollectible amounts due from reinsurers. Any change in the ability of the Company’s reinsurers to meet their contractual obligations could have a material adverse effect on the consolidated financial statements as well as KICO’s ability to meet its regulatory capital and surplus requirements.
F-8
KINGSTONE COMPANIES, INC. AND SUBSIDIARIES
NOTES TO CONSOLIDATED FINANCIAL STATEMENTS
YEARS ENDED DECEMBER 31, 2015 AND 2014
Cash and Cash Equivalents
Cash and cash equivalents are presented at cost, which approximates fair value. The Company considers all highly liquid investments with original maturities of three months or less to be cash equivalents. The Company maintains its cash balances at several financial institutions. The Federal Deposit Insurance Corporation (“FDIC”) secures accounts up to $250,000 at these institutions.
Investments
The Company classifies its fixed-maturity securities as either held-to- maturity or available-for-sale and its equity securities as available-for-sale. The Company may sell its available-for-sale securities in response to changes in interest rates, risk/reward characteristics, liquidity needs or other factors. Fixed-maturity securities that the Company has the specific intent and ability to hold until maturity are classified as such and carried at amortized cost.
Available-for-sale securities are reported at their estimated fair values based on quoted market prices from a recognized pricing service, with unrealized gains and losses, net of tax effects, reported as a separate component of accumulated other comprehensive income in stockholders’ equity. Realized gains and losses are determined on the specific identification method and recognized in the consolidated statements of income and comprehensive income.
Investment income is accrued to the date of the consolidated financial statements and includes amortization of premium and accretion of discount on fixed-maturities. Interest is recognized when earned, while dividends are recognized when declared. As of December 31, 2015 and 2014, due and accrued investment income was $694,239 and $644,061, respectively, and is included in other assets on the accompanying consolidated balance sheets.
Premiums Receivable
Premiums receivable are presented net of an allowance for doubtful accounts of approximately $231,000 and $127,000 as of December 31, 2015 and 2014, respectively. The allowance for uncollectible amounts is based on an analysis of amounts receivable giving consideration to historical loss experience and current economic conditions and reflects an amount that, in management’s judgment, is adequate. Uncollectible premiums receivable balances of approximately $72,000 and $146,000 were written off for the years ended December 31, 2015 and 2014, respectively.
Deferred Policy Acquisition Costs
Deferred policy acquisition costs represent the costs of writing business that vary with, and are primarily related to, the successful production of insurance business (principally commissions, premium taxes and certain underwriting salaries). Policy acquisition costs are deferred and recognized as expense as related premiums are earned.
F-9
KINGSTONE COMPANIES, INC. AND SUBSIDIARIES
NOTES TO CONSOLIDATED FINANCIAL STATEMENTS
YEARS ENDED DECEMBER 31, 2015 AND 2014
Intangible Assets
The Company has recorded acquired identifiable intangible assets. The cost of a group of assets acquired in a transaction is allocated to the individual assets including identifiable intangible assets based on their relative fair values. Identifiable intangible assets with a finite useful life are amortized over the period that the asset is expected to contribute directly or indirectly to the future cash flows of the Company. Intangible assets with an indefinite life are not amortized, but are subject to annual impairment testing. All identifiable intangible assets are tested for recoverability whenever events or changes in circumstances indicate that a carrying amount may not be recoverable. Based on the results of the Company’s annual impairment testing, no impairment losses from intangible assets were recognized for the years ended December 31, 2015 and 2014.
Property and Equipment
Building and building improvements, furniture, computer equipment, and software are reported at cost less accumulated depreciation. Depreciation is provided using the straight-line method over the estimated useful lives of the assets. The Company estimates the useful life for computer equipment, computer software, automobile, furniture and other equipment is three years, and building and building improvements is 39 years.
The Company reviews its real estate assets used as its headquarters to evaluate the necessity of recording impairment losses for market changes due to declines in the fair value of the property. In evaluating potential impairment, management considers the current estimated fair value compared to the carrying value of the asset. At December 31, 2015 and 2014, the fair value of the real estate assets is estimated to be in excess of the carrying value.
Income Taxes
Deferred tax assets and liabilities are recognized for the future tax consequences attributable to differences between the financial statement carrying amounts of existing assets and liabilities and their respective tax basis and for operating loss and tax credit carry forwards. Deferred tax assets and liabilities are measured using enacted tax rates expected to apply to taxable income in the years in which those temporary differences are expected to be recovered or settled. The effect on deferred tax assets and liabilities of a change in tax rates is recognized in income in the period that includes the enactment date. The Company files a consolidated tax return with its subsidiaries. At December 31, 2015, the Company had no material unrecognized tax benefits and no adjustments to liabilities or operations were required.
Assessments
Insurance related assessments are accrued in the period in which they have been incurred. A typical obligating event would be the issuance of an insurance policy or the occurrence of a claim. The Company is subject to a variety of assessments.
Concentration and Credit Risk
Financial instruments that potentially subject the Company to concentration of credit risk are primarily cash and cash equivalents, investments, and premium and reinsurance receivables. Investments are diversified through many industries and geographic regions based upon KICO’s Investment Committee’s guidelines, which employs different investment strategies. The Company believes that no significant concentration of credit risk exists with respect to investments. As of December 31, 2015 and 2014, the Company had cash deposits in excess of the FDIC secured limit of $250,000 per account at financial institutions of approximately $15,021,000 and $6,041,000, respectively. Cash equivalents are not insured by the FDIC.
F-10
KINGSTONE COMPANIES, INC. AND SUBSIDIARIES
NOTES TO CONSOLIDATED FINANCIAL STATEMENTS
YEARS ENDED DECEMBER 31, 2015 AND 2014
As of December 31, 2015 and 2014, the Company had deposits of cash equivalents as follows:
|
December 31,
|
December 31,
|
|||||||
|
2015
|
2014
|
|||||||
|
Collateralized bank repurchase agreement (1)
|
$ | 3,992,509 | $ | 1,130,154 | ||||
|
Money market fund
|
7,505,531 | 4,288,876 | ||||||
|
Total
|
$ | 11,498,040 | $ | 5,419,030 | ||||
(1) The Company has a security interest in certain of the bank's holdings of direct obligations of the United States or one or more agencies thereof. The collateral is held in a hold-in-custody arrangement with a third party who maintains physical possession of the collateral on behalf of the bank.
At December 31, 2015, the outstanding premiums receivable balance is generally diversified due to the number of insureds comprising the Company’s customer base, which is largely concentrated in the area of New York City and adjacent Long Island. The Company also has receivables from its reinsurers. Reinsurance contracts do not relieve the Company from its obligations to policyholders. Failure of reinsurers to honor their obligations could result in losses to the Company. The Company periodically evaluates the financial condition of its reinsurers to minimize its exposure to significant losses from reinsurer insolvencies. See Note 7 for reinsurance recoverables on unpaid and paid losses by reinsurer. Management’s policy is to review all outstanding receivables at period end as well as the bad debt write-offs experienced in the past and establish an allowance for doubtful accounts, if deemed necessary.
Direct premiums earned from lines of business that subject the Company to concentration risk for the years ended December 31, 2015 and 2014 are as follows:
|
Years ended December 31,
|
||||||||
|
2015
|
2014
|
|||||||
|
Personal Lines
|
75.4 | % | 73.3 | % | ||||
|
Commercial Lines
|
13.6 | % | 15.3 | % | ||||
|
Total premiums earned subject to concentration
|
89.0 | % | 88.6 | % | ||||
|
Premiums earned not subject to concentration
|
11.0 | % | 11.4 | % | ||||
|
Total premiums earned
|
100.0 | % | 100.0 | % | ||||
Use of Estimates
The preparation of financial statements in conformity with GAAP requires management to make estimates and assumptions that affect the reported amounts of assets and liabilities and disclosure of contingent assets and liabilities at the date of the consolidated financial statements and the reported amounts of revenues and expenses during the reporting period. Such estimates and assumptions, which include the reserves for losses and loss adjustment expenses, are subject to considerable estimation error due to the inherent uncertainty in projecting ultimate claim amounts that will be reported and settled over a period of several years. In addition, estimates and assumptions associated with receivables under reinsurance contracts related to contingent ceding commission revenue require considerable judgment by management. On an on-going basis, management reevaluates its assumptions and the methods of calculating its estimates. Actual results may differ significantly from the estimates and assumptions used in preparing the consolidated financial statements.
F-11
KINGSTONE COMPANIES, INC. AND SUBSIDIARIES
NOTES TO CONSOLIDATED FINANCIAL STATEMENTS
YEARS ENDED DECEMBER 31, 2015 AND 2014
Earnings per share
Basic earnings per common share is computed by dividing income available to common stockholders by the weighted-average number of common shares outstanding. Diluted earnings per common share reflect, in periods in which they have a dilutive effect, the impact of common shares issuable upon exercise of stock options. The computation of diluted earnings per share excludes those with an exercise price in excess of the average market price of the Company’s common shares during the periods presented.
Advertising Costs
Advertising costs are charged to operations when the advertising first takes place. Included in other underwriting expenses in the accompanying consolidated statements of income and comprehensive income are advertising costs approximating $75,000 and $71,000 for the years ended December 31, 2015 and 2014, respectively.
Stock-based Compensation
Stock-based compensation expense in 2015 and 2014 is the estimated fair value of options granted amortized on a straight-line basis over the requisite service period for the entire portion of the award less an estimate for anticipated forfeitures. The Company uses the “simplified” method to estimate the expected term of the options because the Company’s historical share option exercise experience does not provide a reasonable basis upon which to estimate expected term.
Comprehensive Income
Comprehensive income refers to revenue, expenses, gains and losses that are included in comprehensive income but are excluded from net income as these amounts are recorded directly as an adjustment to stockholders' equity, primarily from changes in unrealized gains/losses on available-for-sale securities.
Recent Accounting Pronouncements
In April 2014, the Financial Accounting Standards Board (“FASB”) issued Accounting Standards Update (“ASU”) No. 2014-08, “Presentation of Financial Statements (Topic 205) and Property, Plant, and Equipment (Topic 360): Reporting Discontinued Operations and Disclosures of Disposals of Components of an Entity. This ASU revised guidance to only allow disposals of components of an entity that represent a strategic shift (e.g., disposal of a major geographical area, a major line of business, a major equity method investment, or other major parts of an entity) and that have a major effect on a reporting entity’s operations and financial results to be reported as discontinued operations. The revised guidance also requires expanded disclosure in the financial statements for discontinued operations as well as for disposals of significant components of an entity that do not qualify for discontinued operations presentation. The Company adopted this guidance on January 1, 2015 and it did not have any effect on the Company’s consolidated results of operations, financial position or cash flows.
F-12
KINGSTONE COMPANIES, INC. AND SUBSIDIARIES
NOTES TO CONSOLIDATED FINANCIAL STATEMENTS
YEARS ENDED DECEMBER 31, 2015 AND 2014
In May 2014, FASB issued ASU 2014-09, “Revenue from Contracts with Customers (Topic 606). The core principle of the new guidance is that an entity should recognize revenue to reflect the transfer of goods and services to customers in an amount equal to the consideration the entity receives or expects to receive. The guidance will be effective for the Company for reporting periods beginning after December 15, 2016. The Company will apply the guidance using a modified retrospective approach. The Company does not expect these amendments to have a material effect on its financial statements.
In May 2015, FASB issued ASU 2015-09, Financial Services – Insurance (Topic 944): Disclosures About Short-Duration Contracts.” The updated accounting guidance requires expanded disclosures for insurance entities that issue short-duration contracts. The expanded disclosures are designed to provide additional insight into an insurance entity’s ability to underwrite and anticipate costs associated with insurance claims. The disclosures include information about incurred and paid claims development by accident year, on a net basis after reinsurance, for the number of years claims incurred typically remain outstanding, not to exceed ten years. Each period presented in the disclosure about claims development that precedes the current reporting period is considered required supplementary information. The expanded disclosures also include information about significant changes in methodologies and assumptions, a reconciliation of incurred and paid claims development to the carrying amount of the liability for unpaid claims and claim adjustment expenses, the total amount of incurred but not reported liabilities plus expected development, claims frequency information including the methodology used to determine claim frequency and any changes to that methodology, and claim duration. The guidance is effective for annual periods beginning after December 15, 2015, and interim periods beginning after December 15, 2016, and is to be applied retrospectively. The new guidance affects disclosures only and will have no impact on the Company’s results of operations or financial position.
In January of 2016, the FASB issued ASU 2016-01, “Financial Instruments – Overall (Subtopic 825-10): Recognition and Measurement of Financial Assets and Financial Liabilities.” The updated accounting guidance requires changes to the reporting model for financial instruments. The primary change for the Company is expected to be the requirement for equity investments (except those accounted for under the equity method of accounting or those that result in consolidation of the investee) to be measured at fair value with changes in fair value recognized in net income. The updated guidance is effective for fiscal years beginning after December 15, 2017, including interim periods within those fiscal years. The Company is currently evaluating the effect the updated guidance will have on its consolidated financial statements.
In February 2016, FASB issued ASU No. 2016-02, “Leases” (Topic 842). Under this ASU, lessees will recognize a right-of-use asset and corresponding liability on the balance sheet for all leases, except for leases covering a period of fewer than 12 months. The liability is to be measured as the present value of the future minimum lease payments taking into account renewal options if applicable plus initial incremental direct costs such as commissions. The minimum payments are discounted using the rate implicit in the lease or, if not known, the lessee’s incremental borrowing rate. The lessee’s income statement treatment for leases will vary depending on the nature of what is being leased. A financing type lease is present when, among other matters, the asset is being leased for a substantial portion of its economic life or has an end-of-term title transfer or a bargain purchase option as in today’s practice. The payment of the liability set up for such leases will be apportioned between interest and principal; the right-of use asset will be generally amortized on a straight-line basis. If the lease does not qualify as a financing type lease, it will be accounted for on the income statement as rent on a straight-line basis. The guidance will be effective for the Company for reporting periods beginning after December 15, 2018. The Company will apply the guidance using a modified retrospective approach. Early application is permitted. The Company is evaluating whether the adoption of ASU 2016-02 will have a significant impact on its consolidated results of operations, financial position or cash flows.
The Company has determined that all other recently issued accounting pronouncements will not have a material impact on its consolidated financial position, results of operations and cash flows, or do not apply to its operations.
F-13
KINGSTONE COMPANIES, INC. AND SUBSIDIARIES
NOTES TO CONSOLIDATED FINANCIAL STATEMENTS
YEARS ENDED DECEMBER 31, 2015 AND 2014
Note 3 - Investments
Available-for-Sale Securities
The amortized cost and fair value of investments in available-for-sale fixed-maturity securities and equity securities as of December 31, 2015 and December 31, 2014 are summarized as follows:
|
December 31, 2015
|
||||||||||||||||||||||||
|
Net
|
||||||||||||||||||||||||
|
|
Cost or
|
Gross
|
Gross Unrealized Losses
|
Unrealized
|
||||||||||||||||||||
|
Amortized
|
Unrealized
|
Less than 12
|
More than 12
|
Fair
|
Gains/
|
|||||||||||||||||||
|
Category
|
Cost
|
Gains
|
Months
|
Months
|
Value
|
(Losses)
|
||||||||||||||||||
|
Fixed-Maturity Securities:
|
||||||||||||||||||||||||
|
|
||||||||||||||||||||||||
|
Political subdivisions of States, Territories and Possessions
|
$ | 12,139,793 | $ | 431,194 | $ | (15,889 | ) | $ | - | $ | 12,555,098 | $ | 415,305 | |||||||||||
|
Corporate and other bonds Industrial and miscellaneous
|
45,078,044 | 490,444 | (512,427 | ) | (99,593 | ) | 44,956,468 | (121,576 | ) | |||||||||||||||
|
Residential mortgage backed securities
|
5,003,292 | 48,375 | (61,169 | ) | - | 4,990,498 | (12,794 | ) | ||||||||||||||||
|
Total fixed-maturity securities
|
62,221,129 | 970,013 | (589,485 | ) | (99,593 | ) | 62,502,064 | 280,935 | ||||||||||||||||
|
Equity Securities:
|
||||||||||||||||||||||||
|
Preferred stocks
|
2,874,173 | 70,799 | - | (29,322 | ) | 2,915,650 | 41,477 | |||||||||||||||||
|
Common stocks
|
5,877,364 | 514,977 | (103,721 | ) | - | 6,288,620 | 411,256 | |||||||||||||||||
|
Total equity securities
|
8,751,537 | 585,776 | (103,721 | ) | (29,322 | ) | 9,204,270 | 452,733 | ||||||||||||||||
|
Total
|
$ | 70,972,666 | $ | 1,555,789 | $ | (693,206 | ) | $ | (128,915 | ) | $ | 71,706,334 | $ | 733,668 | ||||||||||
F-14
KINGSTONE COMPANIES, INC. AND SUBSIDIARIES
NOTES TO CONSOLIDATED FINANCIAL STATEMENTS
YEARS ENDED DECEMBER 31, 2015 AND 2014
|
December 31, 2014
|
||||||||||||||||||||||||
|
Net
|
||||||||||||||||||||||||
|
|
Cost or
|
Gross
|
Gross Unrealized Losses
|
Unrealized
|
||||||||||||||||||||
|
Amortized
|
Unrealized
|
Less than 12
|
More than 12
|
Fair
|
Gains/
|
|||||||||||||||||||
|
Category
|
Cost
|
Gains
|
Months
|
Months
|
Value
|
(Losses)
|
||||||||||||||||||
|
Fixed-Maturity Securities:
|
||||||||||||||||||||||||
|
|
||||||||||||||||||||||||
|
Political subdivisions of States, Territories and Possessions
|
$ | 13,862,141 | $ | 412,490 | $ | (23,813 | ) | $ | (6,379 | ) | $ | 14,244,439 | $ | 382,298 | ||||||||||
|
Corporate and other bonds Industrial and miscellaneous
|
36,221,300 | 803,440 | (118,092 | ) | (30,228 | ) | 36,876,420 | 655,120 | ||||||||||||||||
|
Total fixed-maturity securities
|
50,083,441 | 1,215,930 | (141,905 | ) | (36,607 | ) | 51,120,859 | 1,037,418 | ||||||||||||||||
|
Equity Securities:
|
||||||||||||||||||||||||
|
Preferred stocks
|
3,172,632 | 19,180 | (2,647 | ) | (62,886 | ) | 3,126,280 | (46,352 | ) | |||||||||||||||
|
Common stocks
|
4,448,677 | 444,950 | - | (2,177 | ) | 4,891,449 | 442,772 | |||||||||||||||||
|
Total equity securities
|
7,621,309 | 464,130 | (2,647 | ) | (65,063 | ) | 8,017,729 | 396,420 | ||||||||||||||||
|
Total
|
$ | 57,704,750 | $ | 1,680,060 | $ | (144,552 | ) | $ | (101,670 | ) | $ | 59,138,588 | $ | 1,433,838 | ||||||||||
A summary of the amortized cost and fair value of the Company’s investments in available-for-sale fixed-maturity securities by contractual maturity as of December 31, 2015 and 2014 is shown below:
The actual maturities may differ from contractual maturities because certain borrowers have the right to call or prepay obligations with or without penalties.
|
December 31, 2015
|
December 31, 2014
|
|||||||||||||||
|
Amortized
|
Amortized
|
|||||||||||||||
|
Remaining Time to Maturity
|
Cost
|
Fair Value
|
Cost
|
Fair Value
|
||||||||||||
|
Less than one year
|
$ | 827,246 | $ | 837,918 | $ | 482,833 | $ | 487,507 | ||||||||
|
One to five years
|
17,146,349 | 17,393,571 | 11,640,381 | 11,943,127 | ||||||||||||
|
Five to ten years
|
37,877,726 | 37,884,450 | 32,283,921 | 32,865,231 | ||||||||||||
|
More than 10 years
|
1,366,516 | 1,395,627 | 5,676,306 | 5,824,994 | ||||||||||||
|
Residential mortgage backed securities
|
5,003,292 | 4,990,498 | - | - | ||||||||||||
|
Total
|
$ | 62,221,129 | $ | 62,502,064 | $ | 50,083,441 | $ | 51,120,859 | ||||||||
F-15
KINGSTONE COMPANIES, INC. AND SUBSIDIARIES
NOTES TO CONSOLIDATED FINANCIAL STATEMENTS
YEARS ENDED DECEMBER 31, 2015 AND 2014
Held-to-Maturity Securities
The amortized cost and fair value of investments in held-to-maturity fixed-maturity securities as of December 31, 2015 and 2014 are summarized as follows:
|
December 31, 2015
|
||||||||||||||||||||||||
|
Net
|
||||||||||||||||||||||||
|
|
Cost or
|
Gross
|
Gross Unrealized Losses
|
Unrealized
|
||||||||||||||||||||
|
Amortized
|
Unrealized
|
Less than 12
|
More than 12
|
Fair
|
Gains/
|
|||||||||||||||||||
|
Category
|
Cost
|
Gains
|
Months
|
Months
|
Value
|
(Losses)
|
||||||||||||||||||
|
U.S. Treasury securities
|
$ | 606,389 | $ | 147,650 | $ | - | $ | - | $ | 754,039 | $ | 147,650 | ||||||||||||
|
Political subdivisions of States, Territories and Possessions
|
1,417,679 | 70,284 | - | (54,189 | ) | 1,433,774 | 16,095 | |||||||||||||||||
|
|
||||||||||||||||||||||||
|
Corporate and other bondsIndustrial and miscellaneous
|
3,114,804 | 82,265 | (17,980 | ) | (125,807 | ) | 3,053,282 | (61,522 | ) | |||||||||||||||
|
Total
|
$ | 5,138,872 | $ | 300,199 | $ | (17,980 | ) | $ | (179,996 | ) | $ | 5,241,095 | $ | 102,223 | ||||||||||
|
December 31, 2014
|
||||||||||||||||||||||||
|
Net
|
||||||||||||||||||||||||
|
|
Cost or
|
Gross
|
Gross Unrealized Losses
|
Unrealized
|
||||||||||||||||||||
|
Amortized
|
Unrealized
|
Less than 12
|
More than 12
|
Fair
|
Gains/
|
|||||||||||||||||||
|
Category
|
Cost
|
Gains
|
Months
|
Months
|
Value
|
(Losses)
|
||||||||||||||||||
|
U.S. Treasury securities
|
$ | 606,353 | $ | 183,200 | $ | - | $ | - | $ | 789,553 | $ | 183,200 | ||||||||||||
|
Political subdivisions of States,Territories and Possessions
|
1,413,303 | 49,981 | - | (12,247 | ) | 1,451,037 | 37,734 | |||||||||||||||||
|
Corporate and other bonds Industrial and miscellaneous
|
3,109,079 | 98,306 | (52,921 | ) | - | 3,154,464 | 45,385 | |||||||||||||||||
|
Total
|
$ | 5,128,735 | $ | 331,487 | $ | (52,921 | ) | $ | (12,247 | ) | $ | 5,395,054 | $ | 266,319 | ||||||||||
Held-to-maturity U.S. Treasury securities are held in trust pursuant to the New York State Department of Financial Services’ minimum funds requirement.
F-16
KINGSTONE COMPANIES, INC. AND SUBSIDIARIES
NOTES TO CONSOLIDATED FINANCIAL STATEMENTS
YEARS ENDED DECEMBER 31, 2015 AND 2014
A summary of the amortized cost and fair value of the Company’s investments in held-to-maturity securities by contractual maturity as of December 31, 2015 and 2014 is shown below:
|
December 31, 2015
|
December 31, 2014
|
|||||||||||||||
|
Amortized
|
Amortized
|
|||||||||||||||
|
Remaining Time to Maturity
|
Cost
|
Fair Value
|
Cost
|
Fair Value
|
||||||||||||
|
Less than one year
|
$ | - | $ | - | $ | - | $ | - | ||||||||
|
One to five years
|
500,000 | 496,245 | - | - | ||||||||||||
|
Five to ten years
|
4,032,483 | 3,990,811 | 3,522,927 | 3,563,401 | ||||||||||||
|
More than 10 years
|
606,389 | 754,039 | 1,605,808 | 1,831,653 | ||||||||||||
|
Total
|
$ | 5,138,872 | $ | 5,241,095 | $ | 5,128,735 | $ | 5,395,054 | ||||||||
Investment Income
Major categories of the Company’s net investment income are summarized as follows:
|
Year ended
|
||||||||
|
December 31,
|
||||||||
|
2015
|
2014
|
|||||||
|
Income:
|
|
|
||||||
|
Fixed-maturity securities
|
$ | 2,308,993 | $ | 1,665,534 | ||||
|
Equity securities
|
503,363 | 483,175 | ||||||
|
Cash and cash equivalents
|
7,314 | 23,750 | ||||||
|
Other
|
1 | (481 | ) | |||||
|
Total
|
2,819,671 | 2,171,978 | ||||||
|
Expenses:
|
||||||||
|
Investment expenses
|
255,781 | 372,210 | ||||||
|
Net investment income
|
$ | 2,563,890 | $ | 1,799,768 | ||||
Proceeds from the sale and maturity of fixed-maturity securities were $6,577,943 and $6,823,015 for the years ended December 31, 2015 and 2014, respectively.
Proceeds from the sale of equity securities were $2,689,113 and $7,970,324 for the years ended December 31, 2015 and 2014, respectively.
F-17
KINGSTONE COMPANIES, INC. AND SUBSIDIARIES
NOTES TO CONSOLIDATED FINANCIAL STATEMENTS
YEARS ENDED DECEMBER 31, 2015 AND 2014
The Company’s net realized gains and losses on investments are summarized as follows:
|
Year ended
|
||||||||
|
December 31,
|
||||||||
|
2015
|
2014
|
|||||||
|
Fixed-maturity securities:
|
||||||||
|
Gross realized gains
|
$ | 49,412 | $ | 323,455 | ||||
|
Gross realized losses
|
(152,328 | ) | (48,729 | ) | ||||
| (102,916 | ) | 274,726 | ||||||
|
Equity securities:
|
||||||||
|
Gross realized gains
|
153,711 | 497,023 | ||||||
|
Gross realized losses
|
(101,341 | ) | (116,309 | ) | ||||
| 52,370 | 380,714 | |||||||
|
Cash and short term investments (1)
|
- | 51,587 | ||||||
|
Net realized gains (losses)
|
$ | (50,546 | ) | $ | 707,027 | |||
(1) Realized gain on cash and short term investments is a partial recovery from the FDIC of an amount previously written off in 2009 due to the failure of Waterfield Bank.
Impairment Review
Impairment of investment securities results in a charge to operations when a market decline below cost is deemed to be other-than-temporary. The Company regularly reviews its fixed-maturity securities and equity securities portfolios to evaluate the necessity of recording impairment losses for other-than-temporary declines in the fair value of investments. In evaluating potential impairment, GAAP specifies (i) if the Company does not have the intent to sell a debt security prior to recovery and (ii) it is more likely than not that it will not have to sell the debt security prior to recovery, the security would not be considered other-than-temporarily impaired unless there is a credit loss. When the Company does not intend to sell the security and it is more likely than not that the Company will not have to sell the security before recovery of its cost basis, it will recognize the credit component of an other-than-temporary impairment (“OTTI”) of a debt security in earnings and the remaining portion in other comprehensive income. The credit loss component recognized in earnings is identified as the amount of principal cash flows not expected to be received over the remaining term of the security as projected based on cash flow projections. For held-to-maturity debt securities, the amount of OTTI recorded in other comprehensive income for the noncredit portion of a previous OTTI is amortized prospectively over the remaining life of the security on the basis of timing of future estimated cash flows of the security.
OTTI losses are recorded in the consolidated statements of income and comprehensive income as net realized losses on investments and result in a permanent reduction of the cost basis of the underlying investment. The determination of OTTI is a subjective process and different judgments and assumptions could affect the timing of loss realization. At December 31, 2015, there were 57 securities that accounted for the gross unrealized loss. The Company determined that none of the unrealized losses were deemed to be OTTI for its portfolio of fixed-maturity investments and equity securities for the years ended December 31, 2015 and 2014. Significant factors influencing the Company’s determination that unrealized losses were temporary included the magnitude of the unrealized losses in relation to each security’s cost, the nature of the investment and management’s intent and ability to retain the investment for a period of time sufficient to allow for an anticipated recovery of fair value to the Company’s cost basis.
F-18
KINGSTONE COMPANIES, INC. AND SUBSIDIARIES
NOTES TO CONSOLIDATED FINANCIAL STATEMENTS
YEARS ENDED DECEMBER 31, 2015 AND 2014
The Company held securities with unrealized losses representing declines that were considered temporary at December 31, 2015 and 2014 as follows:
|
December 31, 2015
|
||||||||||||||||||||||||||||||||
|
Less than 12 months
|
12 months or more
|
Total
|
||||||||||||||||||||||||||||||
|
|
No. of
|
No. of
|
Aggregate
|
|||||||||||||||||||||||||||||
|
Fair
|
Unrealized
|
Positions
|
Fair
|
Unrealized
|
Positions
|
Fair
|
Unrealized
|
|||||||||||||||||||||||||
|
Category
|
Value
|
Losses
|
Held
|
Value
|
Losses
|
Held
|
Value
|
Losses
|
||||||||||||||||||||||||
|
Fixed-Maturity Securities:
|
||||||||||||||||||||||||||||||||
|
Political subdivisions of States, Territories and Possessions
|
$ | 1,432,005 | $ | (15,889 | ) | 4 | $ | - | $ | - | - | $ | 1,432,005 | $ | (15,889 | ) | ||||||||||||||||
|
Corporate and other bonds industrial and miscellaneous
|
18,424,609 | (512,427 | ) | 32 | 636,093 | (99,593 | ) | 2 | 19,060,702 | (612,020 | ) | |||||||||||||||||||||
|
Resedential mortgage backed securities
|
2,413,980 | (61,169 | ) | 12 | - | - | - | 2,413,980 | (61,169 | ) | ||||||||||||||||||||||
|
Total fixed-maturity securities
|
$ | 22,270,594 | $ | (589,485 | ) | 48 | $ | 636,093 | $ | (99,593 | ) | 2 | $ | 22,906,687 | $ | (689,078 | ) | |||||||||||||||
|
Equity Securities:
|
||||||||||||||||||||||||||||||||
|
Preferred stocks
|
$ | - | $ | - | - | $ | 702.000 | $ | (29,322 | ) | 1 | $ | 702,000 | $ | (29,322 | ) | ||||||||||||||||
|
Common stocks
|
2,538,900 | (103,721 | ) | 6 | - | - | - | 2,538,900 | (103,721 | ) | ||||||||||||||||||||||
|
Total equity securities
|
$ | 2,538,900 | $ | (103,721 | ) | 6 | $ | 702,000 | $ | (29,322 | ) | 1 | $ | 3,240,900 | $ | (133,043 | ) | |||||||||||||||
|
Total
|
$ | 24,809,494 | $ | (693,206 | ) | 54 | $ | 1,338,093 | $ | (128,915 | ) | 3 | $ | 26,147,587 | $ | (822,121 | ) | |||||||||||||||
F-19
KINGSTONE COMPANIES, INC. AND SUBSIDIARIES
NOTES TO CONSOLIDATED FINANCIAL STATEMENTS
YEARS ENDED DECEMBER 31, 2015 AND 2014
|
December 31, 2014
|
||||||||||||||||||||||||||||||||
|
Less than 12 months
|
12 months or more
|
Total
|
||||||||||||||||||||||||||||||
|
|
No. of
|
No. of
|
Aggregate
|
|||||||||||||||||||||||||||||
|
Fair
|
Unrealized
|
Positions
|
Fair
|
Unrealized
|
Positions
|
Fair
|
Unrealized
|
|||||||||||||||||||||||||
|
Category
|
Value
|
Losses
|
Held
|
Value
|
Losses
|
Held
|
Value
|
Losses
|
||||||||||||||||||||||||
|
Fixed-Maturity Securities:
|
||||||||||||||||||||||||||||||||
|
Political subdivisions of States, Territories and Possessions
|
$ | 3,013,648 | $ | (23,813 | ) | 9 | $ | 126,658 | $ | (6,379 | ) | 1 | $ | 3,140,306 | $ | (30,192 | ) | |||||||||||||||
|
Corporate and other bonds industrial and miscellaneous
|
6,325,579 | (118,092 | ) | 15 | 714,640 | (30,228 | ) | 2 | 7,040,219 | (148,320 | ) | |||||||||||||||||||||
|
Total fixed-maturity securities
|
$ | 9,339,227 | $ | (141,905 | ) | 24 | $ | 841,298 | $ | (36,607 | ) | 3 | $ | 10,180,525 | $ | (178,512 | ) | |||||||||||||||
|
Equity Securities:
|
||||||||||||||||||||||||||||||||
|
Preferred stocks
|
$ | 656,325 | $ | (2,647 | ) | 1 | $ | 1,448,376 | $ | (62,886 | ) | 6 | $ | 2,104,701 | $ | (65,533 | ) | |||||||||||||||
|
Common stocks
|
- | - | - | 267,000 | (2,177 | ) | 1 | 267,000 | (2,177 | ) | ||||||||||||||||||||||
|
Total equity securities
|
$ | 656,325 | $ | (2,647 | ) | 1 | $ | 1,715,376 | $ | (65,063 | ) | 7 | $ | 2,371,701 | $ | (67,710 | ) | |||||||||||||||
|
Total
|
$ | 9,995,552 | $ | (144,552 | ) | 25 | $ | 2,556,674 | $ | (101,670 | ) | 10 | $ | 12,552,226 | $ | (246,222 | ) | |||||||||||||||
Note 4 - Fair Value Measurements
Fair value is the price that would be received upon sale of an asset or paid to transfer a liability in an orderly transaction between market participants at the measurement date. The valuation technique used by the Company to fair value its financial instruments is the market approach which uses prices and other relevant information generated by market transactions involving identical or comparable assets.
The fair value hierarchy gives the highest priority to quoted prices in active markets for identical assets or liabilities (Level 1) and the lowest priority to unobservable inputs (Level 3). If the inputs used to measure the assets or liabilities fall within different levels of the hierarchy, the classification is based on the lowest level input that is significant to the fair value measurement of the asset or liability. Classification of assets and liabilities within the hierarchy considers the markets in which the assets and liabilities are traded, including during period of market disruption, and the reliability and transparency of the assumptions used to determine fair value. The hierarchy requires the use of observable market data when available. The levels of the hierarchy and those investments included in each are as follows:
Level 1—Inputs to the valuation methodology are quoted prices (unadjusted) for identical assets or liabilities traded in active markets. Included are those investments traded on an active exchange, such as the NASDAQ Global Select Market, U.S. Treasury securities and obligations of U.S. government agencies, together with corporate debt securities that are generally investment grade.
Level 2—Inputs to the valuation methodology include quoted prices for similar assets or liabilities in active markets, quoted prices for identical or similar assets or liabilities in markets that are not active, inputs other than quoted prices that are observable for the asset or liability and market-corroborated inputs. Municipal and corporate bonds, and residential mortgage-backed securities, that are traded in less active markets are classified as Level 2. These securities are valued using market price quotations for recently executed transactions.
Level 3—Inputs to the valuation methodology are unobservable for the asset or liability and are significant to the fair value measurement. Material assumptions and factors considered in pricing investment securities and other assets may include appraisals, projected cash flows, market clearing activity or liquidity circumstances in the security or similar securities that may have occurred since the prior pricing period.
The availability of observable inputs varies and is affected by a wide variety of factors. When the valuation is based on models or inputs that are less observable or unobservable in the market, the determination of fair value requires significantly more judgment. The degree of judgment exercised by management in determining fair value is greatest for investments categorized as Level 3. For investments in this category, the Company considers prices and inputs that are current as of the measurement date. In periods of market dislocation, as characterized by current market conditions, the ability to observe prices and inputs may be reduced for many instruments. This condition could cause a security to be reclassified between levels.
F-20
KINGSTONE COMPANIES, INC. AND SUBSIDIARIES
NOTES TO CONSOLIDATED FINANCIAL STATEMENTS
YEARS ENDED DECEMBER 31, 2015 AND 2014
The Company’s investments are allocated among pricing input levels at December 31, 2015 and 2014 as follows:
|
December 31, 2015
|
||||||||||||||||
|
($ in thousands)
|
Level 1
|
Level 2
|
Level 3
|
Total
|
||||||||||||
|
Fixed-maturity securities available-for-sale
|
||||||||||||||||
|
Political subdivisions of States, Territories and Possessions
|
$ | - | $ | 12,555,098 | $ | - | $ | 12,555,098 | ||||||||
|
|
||||||||||||||||
|
Corporate and other bonds industrial and miscellaneous
|
37,964,006 | 6,992,462 | - | 44,956,468 | ||||||||||||
|
Resedential mortgage backed securities
|
- | 4,990,498 | - | 4,990,498 | ||||||||||||
|
Total fixed maturities
|
37,964,006 | 24,538,058 | - | 62,502,064 | ||||||||||||
|
Equity securities
|
9,204,270 | - | - | 9,204,270 | ||||||||||||
|
Total investments
|
$ | 47,168,276 | $ | 24,538,058 | $ | - | $ | 71,706,334 | ||||||||
|
December 31, 2014
|
||||||||||||||||
|
($ in thousands)
|
Level 1
|
Level 2
|
Level 3
|
Total
|
||||||||||||
|
Fixed-maturity investments available-for-sale
|
||||||||||||||||
|
Political subdivisions of States, Territories and Possessions
|
$ | - | $ | 14,244,439 | $ | - | $ | 14,244,439 | ||||||||
|
Corporate and other bonds industrial and miscellaneous
|
29,257,850 | 7,618,570 | - | 36,876,420 | ||||||||||||
|
Total fixed maturities
|
29,257,850 | 21,863,009 | - | 51,120,859 | ||||||||||||
|
Equity investments
|
8,017,729 | - | - | 8,017,729 | ||||||||||||
|
Total investments
|
$ | 37,275,579 | $ | 21,863,009 | $ | - | $ | 59,138,588 | ||||||||
Note 5 - Fair Value of Financial Instruments
The Company uses the following methods and assumptions in estimating its fair value disclosures for financial instruments:
Equity securities and fixed income securities available-for-sale: Fair value disclosures for these investments are included in “Note 3 - Investments.”
Cash and cash equivalents: The carrying values of cash and cash equivalents approximate their fair values because of the short-term nature of these instruments.
Premiums receivable and reinsurance receivables: The carrying values reported in the accompanying consolidated balance sheets for these financial instruments approximate their fair values due to the short-term nature of the assets.
F-21
KINGSTONE COMPANIES, INC. AND SUBSIDIARIES
NOTES TO CONSOLIDATED FINANCIAL STATEMENTS
YEARS ENDED DECEMBER 31, 2015 AND 2014
Real estate: The fair value of the land and building included in property and equipment, which is used in the Company’s operations, approximates the carrying value. The fair value was based on an appraisal dated September 8, 2015 prepared using the sales comparison approach and income approach, and accordingly the real estate is a Level 3 asset under the fair value hierarchy.
Reinsurance balances payable: The carrying value reported in the consolidated balance sheets for these financial instruments approximates fair value.
The estimated fair values of the Company’s financial instruments are as follows:
|
December 31, 2015
|
December 31, 2014
|
|||||||||||||||
|
Carrying Value
|
Fair Value
|
Carrying Value
|
Fair Value
|
|||||||||||||
|
Fixed-maturity securitied-held-to maturity
|
$ | 5,138,872 | $ | 5,241,095 | $ | 5,128,735 | $ | 5,395,054 | ||||||||
|
Cash and cash equivalents
|
$ | 13,551,372 | $ | 13,551,372 | $ | 9,906,878 | $ | 9,906,878 | ||||||||
|
Premiums receivable
|
$ | 10,621,655 | $ | 10,621,655 | $ | 8,946,899 | $ | 8,946,899 | ||||||||
|
Receivables - reinsurance contracts
|
$ | - | $ | - | $ | 1,301,549 | $ | 1,301,549 | ||||||||
|
Reinsurance receivables
|
$ | 31,270,235 | $ | 31,270,235 | $ | 35,575,276 | $ | 35,575,276 | ||||||||
|
Real estate, net of accumulated depreciation
|
$ | 1,710,897 | $ | 1,925,000 | $ | 1,762,345 | $ | 1,816,122 | ||||||||
|
Reinsurance balances payable
|
$ | 1,688,922 | $ | 1,688,922 | $ | 2,096,363 | $ | 2,096,363 | ||||||||
Note 6 - Intangibles
Intangible assets consist of finite and indefinite life assets. Finite life intangible assets include customer and producer relationships and other identifiable intangibles. Insurance company license is considered an indefinite life intangible asset subject to annual impairment testing. The weighted average amortization period of identified intangible assets of finite useful life is approximately 3.3 years as of December 31, 2015.
The components of intangible assets and their useful lives, accumulated amortization, and net carrying value as of December 31, 2015 and 2014 are summarized as follows:
|
December 31, 2015
|
December 31, 2014
|
|||||||||||||||||||||||||||
|
Useful
|
Gross
|
Net
|
Gross
|
Net
|
||||||||||||||||||||||||
|
Life
|
Carrying
|
Accumulated
|
Carrying
|
Carrying
|
Accumulated
|
Carrying
|
||||||||||||||||||||||
|
(in yrs)
|
Value
|
Amortization
|
Amount
|
Value
|
Amortization
|
Amount
|
||||||||||||||||||||||
|
Insurance license
|
- | $ | 500,000 | $ | - | $ | 500,000 | $ | 500,000 | $ | - | $ | 500,000 | |||||||||||||||
|
Customer relationships
|
10 | 3,400,000 | 2,210,000 | 1,190,000 | 3,400,000 | 1,870,000 | 1,530,000 | |||||||||||||||||||||
|
Other identifiable intangibles
|
7 | 950,000 | 882,184 | 67,816 | 950,000 | 746,470 | 203,530 | |||||||||||||||||||||
|
Total
|
$ | 4,850,000 | $ | 3,092,184 | $ | 1,757,816 | $ | 4,850,000 | $ | 2,616,470 | $ | 2,233,530 | ||||||||||||||||
Intangible asset impairment testing and amortization
The Company performs an analysis annually as of December 31 to identify potential impairment of intangible assets with both finite and indefinite lives and measures the amount of any impairment loss that may need to be recognized. Intangible asset impairment testing requires an evaluation of the estimated fair value of each identified intangible asset to its carrying value. An impairment charge would be recorded if the estimated fair value is less than the carrying amount of the intangible asset. No impairments have been identified in the years ended December 31, 2015 and 2014.
F-22
KINGSTONE COMPANIES, INC. AND SUBSIDIARIES
NOTES TO CONSOLIDATED FINANCIAL STATEMENTS
YEARS ENDED DECEMBER 31, 2015 AND 2014
The Company recorded amortization expense related to intangibles of $475,714 for each of the years ended December 31, 2015 and 2014. The estimated aggregate amortization expense for the remaining life of finite life intangibles is as follows:
|
2016
|
$ | 407,816 | ||
|
2017
|
340,000 | |||
|
2018
|
340,000 | |||
|
2019
|
170,000 | |||
| $ | 1,257,816 |
Note 7 - Reinsurance
The Company’s quota share reinsurance treaties are on a July 1 through June 30 calendar year basis; therefore, for year to date fiscal periods after June 30, two separate treaties will be included in such periods.
The Company’s quota share reinsurance treaty in effect for the year ended December 31, 2015 for its personal lines business, which primarily consists of homeowners’ policies, was covered under the July 1, 2014/June 30, 2015 and July 1, 2015/June 30, 2016 treaty years. The Company’s quota share reinsurance treaties in effect for the year ended December 31, 2014 for its personal lines business, which primarily consists of homeowners’ policies, were covered under the July 1, 2013/June 30, 2014 and July 1, 2014/June 30, 2015 treaty years. The Company’s quota share reinsurance treaty in effect for the year ended December 31, 2014 for its commercial lines business was covered under the July 1, 2013/June 30, 2014 treaty year. The Company did not renew its expiring commercial lines quota share reinsurance treaty on July 1, 2014.
The Company’s personal lines quota share treaty that covered the July 1, 2013/June 30, 2014 treaty year was a two year treaty that expired on June 30, 2015. Effective July 1, 2014, the Company had the option to increase the quota share percentage from 75% to a maximum of 85% or decrease the quota share percentage from 75% to a minimum of 55% by giving no less than 30 days advance notice. On May 12, 2014, the Company notified the personal lines reinsurers of its election to reduce the ceding percentage in the personal lines quota share treaty from 75% to 55% effective July 1, 2014. The Company entered into new annual treaties with different terms effective July 1, 2015. The Company’s treaties for the July 1, 2013/ June 30, 2014, July 1, 2014/June 30, 2015 and July 1, 2015/June 30, 2016 treaty years provide for the following material terms:
F-23
KINGSTONE COMPANIES, INC. AND SUBSIDIARIES
NOTES TO CONSOLIDATED FINANCIAL STATEMENTS
YEARS ENDED DECEMBER 31, 2015 AND 2014
|
Treaty Year
|
||||||||||||
|
July 1, 2015
|
July 1, 2014
|
July 1, 2013
|
||||||||||
|
to
|
to
|
to
|
||||||||||
|
Line of Busines
|
June 30, 2016
|
June 30, 2015
|
June 30, 2014
|
|||||||||
|
Personal Lines:
|
||||||||||||
|
Homeowners, dwelling fire and canine legal liability
|
||||||||||||
|
Quota share treaty:
|
||||||||||||
|
Percent ceded
|
40 | % | 55 | % | 75 | % | ||||||
|
Risk retained
|
$ | 450,000 | $ | 360,000 | $ | 300,000 | ||||||
|
Losses per occurrence subject to quota share reinsurance coverage
|
$ | 750,000 | $ | 800,000 | $ | 1,200,000 | ||||||
|
Excess of loss coverage above quota share coverage
|
$ | 3,750,000 | $ | 3,200,000 | $ | 1,700,000 | ||||||
|
in excess of
|
in excess of
|
in excess of
|
||||||||||
| $ | 750,000 | $ | 800,000 | $ | 1,200,000 | |||||||
|
Total reinsurance coverage per occurrence
|
$ | 4,050,000 | $ | 3,640,000 | $ | 2,600,000 | ||||||
|
Losses per occurrence subject to reinsurance coverage
|
$ | 4,500,000 | $ | 4,000,000 | $ | 2,900,000 | ||||||
|
Expiration date
|
June 30, 2016
|
June 30, 2015
|
June 30, 2015
|
|||||||||
|
Personal Umbrella
|
||||||||||||
|
Quota share treaty:
|
||||||||||||
|
Percent ceded - first million dollars of coverage
|
90 | % | 90 | % | 90 | % | ||||||
|
Percent ceded - excess of one million dollars of coverage
|
100 | % | 100 | % | 100 | % | ||||||
|
Risk retained
|
$ | 100,000 | $ | 100,000 | $ | 100,000 | ||||||
|
Total reinsurance coverage per occurrence
|
$ | 2,900,000 | $ | 2,900,000 | $ | 1,900,000 | ||||||
|
Losses per occurrence subject to quota share reinsurance coverage
|
$ | 3,000,000 | $ | 3,000,000 | $ | 2,000,000 | ||||||
|
Expiration date
|
June 30, 2016
|
June 30, 2015
|
June 30, 2014
|
|||||||||
|
Commercial Lines:
|
||||||||||||
|
General liability commercial policies, except for commercial auto
|
||||||||||||
|
Quota share treaty:
|
||||||||||||
|
Percent ceded (terminated effective July 1, 2014)
|
None
|
None
|
25 | % | ||||||||
|
Risk retained
|
$ | 425,000 | $ | 400,000 | $ | 300,000 | ||||||
|
Losses per occurrence subject to quota share reinsurance coverage
|
None
|
None
|
$ | 400,000 | ||||||||
|
Excess of loss coverage above quota share coverage
|
$ | 4,075,000 | $ | 3,600,000 | $ | 2,500,000 | ||||||
|
in excess of
|
in excess of
|
in excess of
|
||||||||||
| $ | 425,000 | $ | 400,000 | $ | 400,000 | |||||||
|
Total reinsurance coverage per occurrence
|
$ | 4,075,000 | $ | 3,600,000 | $ | 2,600,000 | ||||||
|
Losses per occurrence subject to reinsurance coverage
|
$ | 4,500,000 | $ | 4,000,000 | $ | 2,900,000 | ||||||
|
Commercial Auto:
|
||||||||||||
|
Risk retained
|
$ | 300,000 | $ | 300,000 | $ | 300,000 | ||||||
|
Excess of loss coverage in excess of risk retained
|
$ | 1,700,000 | $ | 1,700,000 | $ | 1,700,000 | ||||||
|
in excess of
|
in excess of
|
in excess of
|
||||||||||
| $ | 300,000 | $ | 300,000 | $ | 300,000 | |||||||
|
Catastrophe Reinsurance:
|
||||||||||||
|
Initial loss subject to personal lines quota share treaty
|
$ | 4,000,000 | $ | 4,000,000 | $ | 4,000,000 | ||||||
|
Risk retained per catastrophe occurrence (1)
|
$ | 2,400,000 | $ | 1,800,000 | $ | 1,000,000 | ||||||
|
Catastrophe loss coverage in excess of quota share coverage (2) (3)
|
$ | 176,000,000 | $ | 137,000,000 | $ | 86,000,000 | ||||||
|
Severe winter weather aggregate (3)
|
Yes
|
Yes
|
No
|
|||||||||
|
Reinstatement premium protection (4)
|
Yes
|
No
|
No
|
|||||||||
|
1.
|
Plus losses in excess of catastrophe coverage.
|
|
2.
|
Catastrophe coverage is limited on an annual basis to two times the per occurrence amounts. Effective July 1, 2015, the duration of a catastrophe occurrence from windstorm, hail, tornado, hurricane and cyclone was extended to 120 consecutive hours from 96 consecutive hours.
|
|
3.
|
Effective July 1, 2014, our catastrophe treaty also covers losses caused by severe winter weather during any consecutive 28 day period.
|
|
4.
|
Effective July 1, 2015, reinstatement premium protection for $16,000,000 of catastrophe coverage in excess of $4,000,000.
|
F-24
KINGSTONE COMPANIES, INC. AND SUBSIDIARIES
NOTES TO CONSOLIDATED FINANCIAL STATEMENTS
YEARS ENDED DECEMBER 31, 2015 AND 2014
The single maximum risks per occurrence to which the Company is subject under the new treaties effective July 1, 2015 are as follows:
|
July 1, 2015 - June 30, 2016
|
||||||||
|
Treaty
|
Extent of Loss
|
Risk Retained
|
||||||
|
Personal Lines
|
Initial $750,000
|
$ | 450,000 | |||||
| $ | 750,000 - $4,500,000 |
None(1)
|
||||||
|
Over $4,500,000
|
100 | % | ||||||
|
Personal Umbrella
|
Initial $1,000,000
|
$ | 100,000 | |||||
| $ | 1,000,000 - $3,000,000 |
None(1)
|
||||||
|
Over $3,000,000
|
100 | % | ||||||
|
Commercial Lines
|
Initial $425,000
|
$ | 425,000 | |||||
| $ | 425,000 - $4,500,000 |
None(1)
|
||||||
|
Over $4,500,000
|
100 | % | ||||||
|
Commercial Auto
|
Initial $300,000
|
$ | 300,000 | |||||
| $ | 300,000 - $2,000,000 |
None(1)
|
||||||
|
Over $2,000,000
|
100 | % | ||||||
|
Catastrophe (2)
|
Initial $4,000,000
|
$ | 2,400,000 | |||||
| $ | 4,000,000 - $180,000,000 |
None
|
||||||
|
Over $180,000,000
|
100 | % | ||||||
The single maximum risks per occurrence to which the Company is subject under the treaties that expired on June 30, 2015 and 2014 are as follows:
|
July 1, 2014 - June 30, 2015
|
July 1, 2013 - June 30, 2014
|
|||||||||||||||
|
Treaty
|
Extent of Loss
|
Risk Retained
|
Extent of Loss
|
Risk Retained
|
||||||||||||
|
Personal Lines
|
Initial $800,000
|
$ | 360,000 |
Initial $1,200,000
|
$ | 300,000 | ||||||||||
| $ | 800,000 - $4,000,000 |
None(1)
|
$ | 1,200,000 - $2,900,000 |
None(1)
|
|||||||||||
|
Over $4,000,000
|
100 | % |
Over $2,900,000
|
100 | % | |||||||||||
|
Personal Umbrella
|
Initial $1,000,000
|
$ | 100,000 |
Initial $1,000,000
|
$ | 100,000 | ||||||||||
| $ | 1,000,000 - $3,000,000 |
None(1)
|
$ | 1,000,000 - $2,000,000 |
None(1)
|
|||||||||||
|
Over $3,000,000
|
100 | % |
Over $2,000,000
|
100 | % | |||||||||||
|
Commercial Lines
|
Initial $400,000
|
$ | 400,000 |
Initial $400,000
|
$ | 300,000 | ||||||||||
| $ | 400,000 - $4,000,000 |
None(1)
|
$ | 400,000 - $2,900,000 |
None(1)
|
|||||||||||
|
Over $4,000,000
|
100 | % |
Over $2,900,000
|
100 | % | |||||||||||
|
Commercial Auto
|
Initial $300,000
|
$ | 300,000 |
Initial $300,000
|
$ | 300,000 | ||||||||||
| $ | 300,000 - $2,000,000 |
None(1)
|
$ | 300,000 - $2,000,000 |
None(1)
|
|||||||||||
|
Over $2,000,000
|
100 | % |
Over $2,000,000
|
100 | % | |||||||||||
|
Catastrophe (2)
|
Initial $4,000,000
|
$ | 1,800,000 |
Initial $4,000,000
|
$ | 1,000,000 | ||||||||||
| $ | 4,000,000 - $141,000,000 |
None
|
$ | 4,000,000 - $90,000,000 |
None
|
|||||||||||
|
Over $141,000,000
|
100 | % |
Over $90,000,000
|
100 | % | |||||||||||
|
(1)
|
Covered by excess of loss treaties.
|
|
(2)
|
Catastrophe coverage is limited on an annual basis to two times the per occurrence amounts.
|
F-25
KINGSTONE COMPANIES, INC. AND SUBSIDIARIES
NOTES TO CONSOLIDATED FINANCIAL STATEMENTS
YEARS ENDED DECEMBER 31, 2015 AND 2014
The Company’s reinsurance program is structured to enable the Company to significantly grow its premium volume while maintaining regulatory capital and other financial ratios generally within or below the expected ranges used for regulatory oversight purposes. The reinsurance program also provides income as a result of ceding commissions earned pursuant to the quota share reinsurance contracts. The Company’s participation in reinsurance arrangements does not relieve the Company of its obligations to policyholders.
Approximate reinsurance recoverables on unpaid and paid losses by reinsurer at December 31, 2015 and 2014 are as follows:
|
Unpaid
|
Paid
|
|||||||||||||||
|
($ in thousands)
|
Losses
|
Losses
|
Total
|
Security
|
||||||||||||
|
December 31, 2015
|
||||||||||||||||
|
Maiden Reinsurace Company
|
$ | 7,979 | $ | 631 | $ | 8,610 | $ | 12,201 | (1) | |||||||
|
Swiss Reinsurance America Corporation
|
3,662 | 377 | 4,039 | - | ||||||||||||
|
SCOR Reinsurance Company
|
1,982 | 114 | 2,096 | - | ||||||||||||
|
Hannover Rueck
|
853 | 524 | 1,377 | - | ||||||||||||
|
Allied World Assurance Company
|
940 | 285 | 1,225 | - | ||||||||||||
|
Others
|
1,290 | 117 | 1,407 | 293 | (2) | |||||||||||
|
Total
|
$ | 16,706 | $ | 2,048 | $ | 18,754 | $ | 12,494 | ||||||||
|
December 31, 2014
|
||||||||||||||||
|
Maiden Reinsurace Company
|
$ | 7,946 | $ | 598 | $ | 8,544 | $ | 12,847 | (1) | |||||||
|
SCOR Reinsurance Company
|
2,843 | 194 | 3,037 | - | ||||||||||||
|
Swiss Reinsurance America Corporation
|
3,652 | 359 | 4,011 | - | ||||||||||||
|
Motors Insurance Corporation
|
931 | 8 | 939 | 500 | (1) | |||||||||||
|
Sirius American Insurance Company
|
908 | 22 | 930 | - | ||||||||||||
|
Allied World Assurance Company
|
651 | 15 | 666 | - | ||||||||||||
|
Others
|
1,319 | 273 | 1,592 | 110 | (3) | |||||||||||
|
Total
|
$ | 18,250 | $ | 1,469 | $ | 19,719 | $ | 13,457 | ||||||||
|
(1) Secured pursuant to collateralized trust agreement.
|
||||||||||||||||
|
(2) Includes $248,000 secured pursuant to collateralized trust agreement and $45,000 guaranteed by an irrevocable letter of credit.
|
||||||||||||||||
|
(3) Guaranteed by an irrevocable letter of credit.
|
||||||||||||||||
Assets held in the two trusts referred to in footnote (1) in the table above are not included in the Company’s invested assets and investment income earned on these assets is credited to the two reinsurers respectively. In addition to reinsurance recoverables on unpaid and paid losses, reinsurance receivables as of December 31, 2015 and 2014 include unearned ceded premiums of $12,515,892 and $15,856,387, respectively.
Ceding Commission Revenue
The Company earns ceding commission revenue under its quota share reinsurance agreements based on: (i) a fixed provisional commission rate at which provisional ceding commissions are earned, and (ii) a sliding scale of commission rates and ultimate treaty year loss ratios on the policies reinsured under each of these agreements based upon which contingent ceding commissions are earned. The sliding scale includes minimum and maximum commission rates in relation to specified ultimate loss ratios. The commission rate and contingent ceding commissions earned increases when the estimated ultimate loss ratio decreases and, conversely, the commission rate and contingent ceding commissions earned decreases when the estimated ultimate loss ratio increases.
F-26
KINGSTONE COMPANIES, INC. AND SUBSIDIARIES
NOTES TO CONSOLIDATED FINANCIAL STATEMENTS
YEARS ENDED DECEMBER 31, 2015 AND 2014
The Company’s estimated ultimate treaty year loss ratios (“Loss Ratio(s)”) for treaties in effect for the year ended December 31, 2015 are attributable to contracts for the July 1, 2015/June 30, 2016 treaty year (“2015/2016 Treaty”) and the July 1, 2014/June 30, 2015 treaty year (“2014/2015 Treaty”). The Company’s Loss Ratios for treaties in effect for the year ended December 31, 2014 are attributable to contracts for the 2014/2015 Treaty and the July 1, 2013/June 30, 2014 treaty year (“2013/2014 Treaties”).
Treaties in effect for the year ended December 31, 2015
Under the 2015/2016 Treaty, the Company is receiving a higher upfront fixed provisional rate in exchange for a less favorable sliding scale contingent rate. Under this arrangement, the Company earns more provisional ceding commissions, while contingent ceding commissions are reduced due the less favorable sliding scale rate. The Company’s Loss Ratio for the period July 1, 2015 through December 31, 2015, which is attributable to the 2015/2016 Treaty, was higher than the contractual Loss Ratio at which provisional ceding commissions are earned. Accordingly, for the six month period ended December 31, 2015, the Company’s contingent ceding commission earned was reduced as a result of the estimated Loss Ratio for the 2015/2016 Treaty.
The Company’s Loss Ratio for the period July 1, 2014 through June 30, 2015, which is attributable to the 2014/2015 Treaty, was lower than the contractual Loss Ratio at which provisional ceding commissions are earned. Accordingly, for the year ended December 31, 2015, the Company earned contingent ceding commission revenue with respect to the 2014/2015 Treaty. However, as a result of severe winter weather during February and March 2015, the Loss Ratio was greater than what would have been expected during an ordinary winter. Such severe winter weather had the effect of reducing contingent ceding commission revenue that would have otherwise been earned.
Treaties in effect for the year ended December31, 2014
The Company’s Loss Ratio for the period July 1, 2014 through December 31, 2014, which is attributable to the 2014/2015 Treaty, was lower than the contractual Loss Ratio at which provisional ceding commissions are earned. Accordingly, for the six month period ended December 31, 2014, the Company recorded contingent ceding commission earned with respect to the 2014/2015 Treaty.
The Company’s Loss Ratios for the period July 1, 2013 through June 30, 2014, which are attributable to the 2013/2014 Treaties, were lower than the contractual Loss Ratios at which provisional ceding commissions are earned. Accordingly, for the year ended December 31, 2014, the Company earned contingent ceding commission revenue with respect to the 2013/2014 Treaties. However, as a result of severe winter weather during January and February 2014, the Loss Ratios attributable to these treaties as of June 30, 2014 were greater than the Loss Ratios as of December 31, 2013. Such severe winter weather had the effect of reducing contingent ceding commission revenue that would have otherwise been earned.
In addition to the treaties that were in effect for years ended December 31, 2015 and 2014, the Loss Ratios from prior years’ treaties are subject to change as loss reserves from those periods increase or decrease, resulting in an increase or decrease in the commission rate and contingent ceding commissions earned.
F-27
KINGSTONE COMPANIES, INC. AND SUBSIDIARIES
NOTES TO CONSOLIDATED FINANCIAL STATEMENTS
YEARS ENDED DECEMBER 31, 2015 AND 2014
Ceding commissions earned consists of the following:
|
Years ended
|
||||||||
|
December 31,
|
||||||||
|
2015
|
2014
|
|||||||
|
Provisional ceding commissions earned
|
$ | 11,692,458 | $ | 12,456,411 | ||||
|
Contingent ceding commissions earned
|
(219,341 | ) | 1,453,700 | |||||
| $ | 11,473,117 | $ | 13,910,111 | |||||
Provisional ceding commissions are settled monthly. Balances due from reinsurers for contingent ceding commissions on quota share treaties are settled annually based on the Loss Ratio of each treaty year that ends on June 30. As discussed above the Loss Ratios from prior years’ treaties are subject to change as loss reserves from those periods increase or decrease, resulting in an increase or decrease in the commission rate and contingent ceding commissions earned. As of December 31, 2015 and 2014, net contingent ceding commissions (payable to) and due from reinsurers under all treaties was approximately $(1,277,000) and $1,302,000, respectively.
Note 8 - Deferred Policy Acquisition Costs and Deferred Ceding Commission Revenue
Policy acquisition costs incurred and policy-related ceding commission revenue are deferred, and amortized to income on property and casualty insurance business as follows:
|
Year ended
|
||||||||
|
December 31,
|
||||||||
|
2015
|
2014
|
|||||||
|
Net deferred policy acquisition costs net of ceding commission revenue, beginning of year
|
$ | 3,029,441 | $ | (123,903 | ) | |||
|
Cost incurred and deferred:
|
||||||||
|
Commissions and brokerage
|
16,963,843 | 13,612,109 | ||||||
|
Other underwriting and policy acquisition costs
|
4,904,350 | 4,426,614 | ||||||
|
Ceding commission revenue
|
(12,170,986 | ) | (11,428,785 | ) | ||||
|
Net deferred policy acquisition costs
|
9,697,207 | 6,609,938 | ||||||
|
Amortization
|
(8,326,410 | ) | (3,456,594 | ) | ||||
| 1,370,797 | 3,153,344 | |||||||
|
Net deferred policy acquisition costs net of ceding commission revenue, end of year
|
$ | 4,400,238 | $ | 3,029,441 | ||||
Ending balances for deferred policy acquisition costs and deferred ceding commission revenue as of December 31, 2015 and 2014 follows:
|
December 31,
|
||||||||
|
2015
|
2014
|
|||||||
|
Deferred policy acquisition costs
|
$ | 10,835,306 | $ | 8,985,981 | ||||
|
Deferred ceding commission revenue
|
(6,435,068 | ) | (5,956,540 | ) | ||||
|
Balance at end of period
|
$ | 4,400,238 | $ | 3,029,441 | ||||
F-28
KINGSTONE COMPANIES, INC. AND SUBSIDIARIES
NOTES TO CONSOLIDATED FINANCIAL STATEMENTS
YEARS ENDED DECEMBER 31, 2015 AND 2014
Note 9 - Property and Equipment
The components of property and equipment are summarized as follows:
|
|
Accumulated
|
|||||||||||
|
Cost
|
Depreciation
|
Net
|
||||||||||
|
December 31, 2015
|
|
|
|
|||||||||
|
Building
|
$ | 1,887,347 | $ | (313,376 | ) | $ | 1,573,971 | |||||
|
Land
|
153,097 | - | 153,097 | |||||||||
|
Furniture office equipment
|
518,495 | (257,485 | ) | 261,010 | ||||||||
|
Computer equipment and software
|
2,128,063 | (963,875 | ) | 1,164,188 | ||||||||
|
Automobile
|
81,394 | (81,394 | ) | - | ||||||||
|
Total
|
$ | 4,768,396 | $ | (1,616,130 | ) | $ | 3,152,266 | |||||
|
December 31, 2014
|
||||||||||||
|
Building
|
$ | 1,887,347 | $ | (253,624 | ) | $ | 1,633,723 | |||||
|
Land
|
153,097 | - | 153,097 | |||||||||
|
Furniture office equipment
|
366,392 | (151,983 | ) | 214,409 | ||||||||
|
Computer equipment and software
|
1,019,647 | (572,834 | ) | 446,813 | ||||||||
|
Automobile
|
81,394 | (81,394 | ) | - | ||||||||
|
Total
|
$ | 3,507,877 | $ | (1,059,835 | ) | $ | 2,448,042 | |||||
Depreciation expense for the years ended December 31, 2015 and 2014 was $556,295 and $399,193, respectively.
Note 10 - Property and Casualty Insurance Activity
Premiums written, ceded and earned are as follows:
|
Direct
|
Assumed
|
Ceded
|
Net
|
|||||||||||||
|
Year ended December 31, 2015
|
|
|
|
|||||||||||||
|
Premiums written
|
$ | 91,003,968 | $ | 40,971 | $ | (30,660,161 | ) | $ | 60,384,778 | |||||||
|
Change in unearned premiums
|
(8,436,456 | ) | 4,255 | (3,340,495 | ) | (11,772,696 | ) | |||||||||
|
Premiums earned
|
$ | 82,567,512 | $ | 45,226 | $ | (34,000,656 | ) | $ | 48,612,082 | |||||||
|
Year ended December 31, 2014
|
||||||||||||||||
|
Premiums written
|
$ | 76,255,426 | $ | 48,856 | $ | (33,009,420 | ) | $ | 43,294,862 | |||||||
|
Change in unearned premiums
|
(8,119,029 | ) | (3,398 | ) | (2,543,951 | ) | (10,666,378 | ) | ||||||||
|
Premiums earned
|
$ | 68,136,397 | $ | 45,458 | $ | (35,553,371 | ) | $ | 32,628,484 | |||||||
Premium receipts in advance of the policy effective date are recorded as advance premiums. The balance of advance premiums as of December 31, 2015 and 2014 was $1,199,376 and $1,006,582, respectively.
F-29
KINGSTONE COMPANIES, INC. AND SUBSIDIARIES
NOTES TO CONSOLIDATED FINANCIAL STATEMENTS
YEARS ENDED DECEMBER 31, 2015 AND 2014
The components of the liability for loss and LAE expenses and related reinsurance receivables as of December 31, 2015 and 2014 are as follows:
|
|
Gross
|
Reinsurance
|
||||||
|
Liability
|
Receivables
|
|||||||
|
December 31, 2015
|
||||||||
|
Case-basis reserves
|
$ | 24,730,463 | $ | 11,264,279 | ||||
|
Loss adjustment expenses
|
5,429,221 | 1,720,522 | ||||||
|
IBNR reserves
|
9,716,816 | 3,721,563 | ||||||
|
Recoverable on unpaid losses
|
16,706,364 | |||||||
|
Recoverable on paid losses
|
- | 2,047,979 | ||||||
|
Total loss and loss adjustment expenses
|
$ | 39,876,500 | 18,754,343 | |||||
|
Unearned premiums
|
12,515,892 | |||||||
|
Total reinsurance receivables
|
$ | 31,270,235 | ||||||
|
December 31, 2014
|
||||||||
|
Case-basis reserves
|
$ | 24,064,175 | $ | 11,930,330 | ||||
|
Loss adjustment expenses
|
5,663,856 | 1,920,437 | ||||||
|
IBNR reserves
|
10,184,652 | 4,398,759 | ||||||
|
Recoverable on unpaid losses
|
18,249,526 | |||||||
|
Recoverable on paid losses
|
- | 1,469,363 | ||||||
|
Total loss and loss adjustment expenses
|
$ | 39,912,683 | 19,718,889 | |||||
|
Unearned premiums
|
15,856,387 | |||||||
|
Total reinsurance receivables
|
$ | 35,575,276 | ||||||
The following table provides a reconciliation of the beginning and ending balances for unpaid losses and LAE:
|
Years ended
|
||||||||
|
December 31,
|
||||||||
|
2015
|
2014
|
|||||||
|
Balance at beginning of period
|
$ | 39,912,683 | $ | 34,503,229 | ||||
|
Less reinsurance recoverables
|
(18,249,526 | ) | (17,363,975 | ) | ||||
|
Net balance, beginning of period
|
21,663,157 | 17,139,254 | ||||||
|
Incurred related to:
|
||||||||
|
Current year
|
23,642,998 | 15,268,426 | ||||||
|
Prior years
|
(462,998 | ) | 1,763,762 | |||||
|
Total incurred
|
23,180,000 | 17,032,188 | ||||||
|
Paid related to:
|
||||||||
|
Current year
|
13,172,870 | 6,351,920 | ||||||
|
Prior years
|
8,500,151 | 6,156,365 | ||||||
|
Total paid
|
21,673,021 | 12,508,285 | ||||||
|
|
||||||||
|
Net balance at end of period
|
23,170,136 | 21,663,157 | ||||||
|
Add reinsurance recoverables
|
16,706,364 | 18,249,526 | ||||||
|
Balance at end of period
|
$ | 39,876,500 | $ | 39,912,683 | ||||
Incurred losses and LAE are net of reinsurance recoveries under reinsurance contracts of $14,428,197 and $14,878,551 for the years ended December 31, 2015 and 2014, respectively.
F-30
KINGSTONE COMPANIES, INC. AND SUBSIDIARIES
NOTES TO CONSOLIDATED FINANCIAL STATEMENTS
YEARS ENDED DECEMBER 31, 2015 AND 2014
Prior year incurred loss and LAE development is based upon estimates by line of business and accident year. Prior year loss and LAE development incurred during the years ended December 31, 2015 and 2014 was favorable $(462,998) and unfavorable $1,763,762, respectively. The Company’s management continually monitors claims activity to assess the appropriateness of carried case and incurred but not reported (“IBNR”) reserves, giving consideration to Company and industry trends.
Loss and LAE reserves
The reserving process for loss and LAE reserves provides for the Company’s best estimate at a particular point in time of the ultimate unpaid cost of all losses and LAE incurred, including settlement and administration of losses, and is based on facts and circumstances then known and including losses that have been incurred but not yet been reported. The process includes using actuarial methodologies to assist in establishing these estimates, judgments relative to estimates of future claims severity and frequency, the length of time before losses will develop to their ultimate level and the possible changes in the law and other external factors that are often beyond the Company’s control. Several actuarial reserving methodologies are used to estimate required loss reserves. The process produces carried reserves set by management based upon the actuaries’ best estimate and is the result of numerous best estimates made by line of business, accident year, and loss and LAE. The amount of loss and LAE reserves for reported claims (“case reserve”) is based primarily upon a case-by-case evaluation of coverage, liability, injury severity, and any other information considered pertinent to estimating the exposure presented by the claim. The amounts of loss and LAE reserves for unreported claims and development on known claims (IBNR reserves) are determined using historical information by line of insurance as adjusted to current conditions. Since this process produces loss reserves set by management based upon the actuaries’ best estimate, there is no explicit or implicit provision for uncertainty in the carried loss reserves.
Due to the inherent uncertainty associated with the reserving process, the ultimate liability may differ, perhaps substantially, from the original estimate. Such estimates are regularly reviewed and updated and any resulting adjustments are included in the current year’s results. Reserves are closely monitored and are recomputed periodically using the most recent information on reported claims and a variety of statistical techniques. On at least a quarterly basis, the Company reviews by line of business existing reserves, new claims, changes to existing case reserves and paid losses with respect to the current and prior years. Several methods are used, varying by product line and accident year, in order to select the estimated year-end loss reserves. These methods include the following:
Paid Loss Development – historical patterns of paid loss development are used to project future paid loss emergence in order to estimate required reserves.
Incurred Loss Development – historical patterns of incurred loss development, reflecting both paid losses and changes in case reserves, are used to project future incurred loss emergence in order to estimate required reserves.
Paid Bornhuetter-Ferguson (“BF”) – an estimated loss ratio for a particular accident year is determined, and is weighted against the portion of the accident year claims that have been paid, based on historical paid loss development patterns. The estimate of required reserves assumes that the remaining unpaid portion of a particular accident year will pay out at a rate consistent with the estimated loss ratio for that year. This method can be useful for situations where an unusually high or low amount of paid losses exists at the early stages of the claims development process.
F-31
KINGSTONE COMPANIES, INC. AND SUBSIDIARIES
NOTES TO CONSOLIDATED FINANCIAL STATEMENTS
YEARS ENDED DECEMBER 31, 2015 AND 2014
Incurred Bornhuetter-Ferguson (“BF”) - an estimated loss ratio for a particular accident year is determined, and is weighted against the portion of the accident year claims that have been reported, based on historical incurred loss development patterns. The estimate of required reserves assumes that the remaining unreported portion of a particular accident year will pay out at a rate consistent with the estimated loss ratio for that year. This method can be useful for situations where an unusually high or low amount of reported losses exists at the early stages of the claims development process.
Management’s best estimate of required reserves is generally based on an average of the methods above, with appropriate weighting of the various methods based on the line of business and accident year being projected. In some cases, additional methods or historical data from industry sources are employed to supplement the projections derived from the methods listed above.
Two key assumptions that materially affect the estimate of loss reserves are the loss ratio estimate for the current accident year used in the BF methods described above, and the loss development factor selections used in the loss development methods described above. The loss ratio estimates used in the BF methods are selected after reviewing historical accident year loss ratios adjusted for rate changes, trend, and mix of business.
The Company is not aware of any claims trends that have emerged or that would cause future adverse development that have not already been considered in existing case reserves and in its current loss development factors.
In New York State, lawsuits for negligence are subject to certain limitations and must be commenced within three years from the date of the accident or are otherwise barred. Accordingly, the Company’s exposure to unreported claims (‘pure’ IBNR) for accident dates of December 31, 2012 and prior is limited although there remains the possibility of adverse development on reported claims (‘case development’ IBNR).
Commercial Auto Line of Business
Effective October 1, 2014 the Company decided that it would no longer accept applications for new commercial auto policies. The action was taken following a series of underwriting and pricing measures which were intended to improve the profitability of this line of business. The actions taken did not yield the hoped for results. In February 2015, the Company made the decision that it would no longer offer renewals on its existing commercial auto policies beginning with those that expire on or after May 1, 2015. The Company had 134 and 730 commercial auto policies in force as of December 31, 2015 and 2014, respectively.
Note 11 – Bank Line of Credit
Kingstone maintained a Promissory Note pursuant to a line of credit (together, the “Trustco Agreement”) with Trustco Bank (“Lender”), which, at the option of Kingstone, was cancelled effective December 31, 2015. Under the Trustco Agreement, Kingstone was able to receive advances from Lender not to exceed an unpaid principal balance of $600,000 (the “Credit Limit”). Advances available under the Trustco Agreement were subject to interest at a floating rate based on the Lender’s prime rate, which was 3.75% at December 31, 2015.
F-32
KINGSTONE COMPANIES, INC. AND SUBSIDIARIES
NOTES TO CONSOLIDATED FINANCIAL STATEMENTS
YEARS ENDED DECEMBER 31, 2015 AND 2014
Interest only payments were due monthly. The principal balance was payable on demand, and must be reduced to zero for a minimum of thirty consecutive days during each year of the term of the Trustco Agreement. The line of credit was subject to annual renewal at the discretion of the Lender. Lender may set off any depository accounts maintained by Kingstone that were held by Lender. Payment of amounts due pursuant to the Trustco Agreement was secured by all of Kingstone’s cash and deposit accounts, receivables, inventory and fixed assets, and was guaranteed by Kingstone’s subsidiary, Payments Inc.
The line of credit was used for general corporate purposes.
There were no outstanding balances under the bank line of credit at any time during the years ended December 31, 2015 and 2014. There were no other fees in connection with this credit line.
Note 12 – Stockholders’ Equity
Dividend Declared
Dividends declared and paid on Common Stock were $1,557,398 and $1,312,625 for the years ended December 31, 2015 and 2014, respectively. The Company’s Board of Directors approved a quarterly dividend on February 4, 2016 of $.0625 per share payable in cash on March 15, 2016 to stockholders of record as of February 29, 2016 (see Note 20).
Stock Options
Pursuant to the Company’s 2005 Equity Participation Plan (the “2005 Plan”), which provides for the issuance of incentive stock options, non-statutory stock options and restricted stock, a maximum of 700,000 shares of the Company’s Common Stock are permitted to be issued pursuant to options granted and restricted stock issued. The 2005 Plan terminated on October 10, 2015 (except for options already granted), ten years after its effective date. Effective August 12, 2014, the Company adopted the 2014 Equity Participation Plan (the “2014 Plan”) pursuant to which, subject to stockholder approval on or before August 12, 2015, a maximum of 700,000 shares of Common Stock of the Company are authorized to be issued pursuant to the grant of incentive stock options, non-statutory stock options, stock appreciation rights, restricted stock and stock bonuses. The stockholders approved the 2014 Plan on August 11, 2015. Incentive stock options granted under the 2014 Plan and 2005 Plan expire no later than ten years from the date of grant (except no later than five years for a grant to a 10% stockholder). The Board of Directors or the Stock Option Committee determines the expiration date with respect to non-statutory stock options and the vesting provisions for restricted stock granted under the 2014 Plan and 2005 Plan.
The results of operations for the years ended December 31, 2015 and 2014 include stock-based compensation expense totaling $134,185 and $171,876, respectively. Stock-based compensation expense related to stock options for the years ended December 31, 2015 and 2014 is net of estimated forfeitures of approximately 17% and 20%, respectively. Such amounts have been included in the consolidated statements of income and comprehensive income within other operating expenses.
Stock-based compensation expense in 2015 and 2014 is the estimated fair value of options granted amortized on a straight-line basis over the requisite service period for the entire portion of the award. The weighted average estimated fair value of stock options granted during the years ended December 31, 2015 and 2014 was $1.87 and $1.60 per share, respectively. The fair value of stock options at the grant date was estimated using the Black-Scholes option-pricing model. The following weighted average assumptions were used for grants during the following periods:
F-33
KINGSTONE COMPANIES, INC. AND SUBSIDIARIES
NOTES TO CONSOLIDATED FINANCIAL STATEMENTS
YEARS ENDED DECEMBER 31, 2015 AND 2014
|
Years ended
|
||||||||
|
December 31,
|
||||||||
|
2015
|
2014
|
|||||||
|
Dividend Yield
|
2.62 | % | 2.97 | % | ||||
|
Volatility
|
34.54 | % | 40.53 | % | ||||
|
Risk-Free Interest Rate
|
1.03 | % | 0.92 | % | ||||
|
Expected Life
|
3.0 years
|
3.25 years
|
||||||
The Black-Scholes option valuation model was developed for use in estimating the fair value of traded options, which have no vesting restrictions and are fully transferable. In addition, option valuation models require the input of highly subjective assumptions including the expected stock price volatility. Because the Company’s stock options have characteristics significantly different from those of traded options, and because changes in the subjective input assumptions can materially affect the fair value estimate, in management's opinion, the existing models do not necessarily provide a reliable single measure of the fair value of our stock options.
A summary of stock option activity under the Company’s 2005 Plan and 2014 Plan for the year ended December 31, 2015 is as follows:
|
Stock Options
|
Number of Shares
|
Weighted Average Exercise Price per Share
|
Weighted Average Remaining Contractual Term
|
Aggregate Intrinsic Value
|
||||||||||||
|
Outstanding at January 1, 2015
|
421,250 | $ | 5.16 | 3.13 | $ | 1,258,013 | ||||||||||
|
Granted (1)
|
50,000 | $ | 6.73 | $ | 113,500 | |||||||||||
|
Exercised
|
(127,750 | ) | $ | 2.66 | $ | 677,713 | ||||||||||
|
Forfeited
|
(3,750 | ) | $ | 5.09 | $ | 32,150 | ||||||||||
|
Outstanding at December 31, 2015
|
339,750 | $ | 6.34 | 3.36 | $ | 904,775 | ||||||||||
|
Vested and Exercisable at December 31, 2015
|
191,625 | $ | 6.21 | 3.30 | $ | 534,094 | ||||||||||
|
(1)
|
On August 12, 2014, 50,000 options were awarded under the 2014 Plan, which were subject to stockholder approval. Stockholder approval of the 2014 Plan was obtained on August 11, 2015.
|
The aggregate intrinsic value of options outstanding and options exercisable at December 31, 2015 is calculated as the difference between the exercise price of the underlying options and the market price of the Company’s Common Stock for the options that had exercise prices that were lower than the $9.00 closing price of the Company’s Common Stock on December 31, 2015. The total intrinsic value of options exercised in the year ended December, 2015 was $677,713, determined as of the date of exercise.
F-34
KINGSTONE COMPANIES, INC. AND SUBSIDIARIES
NOTES TO CONSOLIDATED FINANCIAL STATEMENTS
YEARS ENDED DECEMBER 31, 2015 AND 2014
Participants in the 2005 Plan and 2014 Plan may exercise their outstanding vested options, in whole or in part, by having the Company reduce the number of shares otherwise issuable by a number of shares having a fair market value equal to the exercise price of the option being exercised (“Net Exercise”). All of the 127,750 options exercised during the year ended December 31, 2015 were Net Exercises. A total of 100,115 options were exercised during the year ended December 31, 2014. The Company received cash proceeds of $5,877 from the exercise of options for the purchase of 2,500 shares of Common Stock in the year ended December 31, 2014. The remaining 97,615 options exercised in 2014 were Net Exercises.
As of December 31, 2015 and 2014, the fair value of unamortized compensation cost related to unvested stock option awards was approximately $101,000 and $156,000, respectively. Unamortized compensation cost as of December 31, 2015 is expected to be recognized over a remaining weighted-average vesting period of 1.31 years.
As of December 31, 2015, there were 650,000 shares reserved under the 2014 Plan.
Other Equity Compensation
For the years ended December 31, 2015 and 2014, there was no other equity compensation.
Note 13 - Statutory Financial Information and Accounting Policies
For regulatory purposes, KICO prepares its statutory basis financial statements in accordance with Statements of Statutory Accounting Principles (“statutory basis” or “SAP”) as promulgated by the National Association of Insurance Commissioners (the “NAIC”) and the prescribed or permitted practices of the New York State Department of Financial Services (the “DFS”). The more significant SAP variances from GAAP are as follows:
|
•
|
Policy acquisition costs are charged to operations in the year such costs are incurred, rather than being deferred and amortized as premiums are earned over the terms of the policies.
|
|
•
|
Ceding commission revenues are earned when ceded premiums are written except for ceding commission revenues in excess of anticipated acquisition costs, which are deferred and amortized as ceded premiums are earned. GAAP requires that all ceding commission revenues be earned as the underlying ceded premiums are earned over the term of the reinsurance agreements.
|
|
•
|
Certain assets including certain receivables, a portion of the net deferred tax asset, prepaid expenses and furniture and equipment are not admitted.
|
|
•
|
Investments in fixed-maturity securities are valued at NAIC value for statutory financial purposes, which is primarily amortized cost. GAAP requires certain investments in fixed-maturity securities classified as available for sale, to be reported at fair value.
|
|
•
|
Certain amounts related to ceded reinsurance are reported on a net basis within the statutory basis financial statements. GAAP requires these amounts to be shown gross.
|
|
•
|
For SAP purposes, changes in deferred income taxes relating to temporary differences between net income for financial reporting purposes and taxable income are recognized as a separate component of gains and losses in surplus rather than included in income tax expense or benefit as required under GAAP.
|
F-35
KINGSTONE COMPANIES, INC. AND SUBSIDIARIES
NOTES TO CONSOLIDATED FINANCIAL STATEMENTS
YEARS ENDED DECEMBER 31, 2015 AND 2014
State insurance laws restrict the ability of KICO to declare dividends. These restrictions are related to surplus and net investment income. Dividends are restricted to the lesser of 10% of surplus or 100% of investment income (on a statutory accounting basis) for the trailing 12 quarters. State insurance regulators require insurance companies to maintain specified levels of statutory capital and surplus. Generally, dividends may only be paid out of unassigned surplus, and the amount of an insurer’s unassigned surplus following payment of any dividends must be reasonable in relation to the insurer’s outstanding liabilities and adequate to meet its financial needs. For the years ended December 31, 2015 and 2014, KICO paid dividends to Kingstone of $1,650,000 and $1,500,000, respectively. On February 25, 2016, KICO’s Board of Directors approved a cash dividend of $450,000 to Kingstone, which was paid on February 26, 2016. For the years ended December 31, 2015 and 2014, KICO had statutory basis net income of $6,632,042 and $3,617,139, respectively. At December 31, 2015 and 2014, KICO had reported statutory basis surplus as regards policyholders of $39,072,962 and $34,425,381, respectively, as filed with the DFS.
Note 14 - Risk Based Capital
State insurance departments impose risk-based capital (“RBC”) requirements on insurance enterprises. The RBC Model serves as a benchmark for the regulation of insurance companies by state insurance regulators. RBC provides for targeted surplus levels based on formulas, which specify various weighting factors that are applied to financial balances or various levels of activity based on the perceived degree of risk, and are set forth in the RBC requirements. Such formulas focus on four general types of risk: (a) the risk with respect to the company’s assets (asset or default risk); (b) the risk of default on amounts due from reinsurers, policyholders, or other creditors (credit risk); (c) the risk of underestimating liabilities from business already written or inadequately pricing business to be written in the coming year (underwriting risk); and, (d) the risk associated with items such as excessive premium growth, contingent liabilities, and other items not reflected on the balance sheet (off-balance sheet risk). The amount determined under such formulas is called the authorized control level RBC (“ACLC”).
The RBC guidelines define specific capital levels based on a company’s ACLC that are determined by the ratio of the company’s total adjusted capital (“TAC”) to its ACLC. TAC is equal to statutory capital, plus or minus certain other specified adjustments. The Company is in compliance with RBC requirements as of December 31, 2015 and 2014.
Note 15 – Income Taxes
The Company files a consolidated U.S. federal income tax return that includes all wholly owned subsidiaries. State tax returns are filed on a consolidated or separate basis depending on applicable laws. The Company records adjustments related to prior years’ taxes during the period when they are identified, generally when the tax returns are filed. The effect of these adjustments on the current and prior periods (during which the differences originated) is evaluated based upon quantitative and qualitative factors and are considered in relation to the financial statements taken as a whole for the respective periods. The Company has evaluated this year’s amounts in relation to the current and prior reporting periods and determined that a restatement of those prior reporting periods is not appropriate.
F-36
KINGSTONE COMPANIES, INC. AND SUBSIDIARIES
NOTES TO CONSOLIDATED FINANCIAL STATEMENTS
YEARS ENDED DECEMBER 31, 2015 AND 2014
The provision for income taxes is comprised of the following:
|
Years ended December 31,
|
2015
|
2014
|
||||||
|
Current federal income tax expense
|
$ | 3,557,385 | $ | 2,418,621 | ||||
|
Current state income tax expense
|
19,000 | 14,596 | ||||||
|
Deferred federal and state income tax expense (benefit)
|
(226,932 | ) | 113,823 | |||||
|
Provision for income taxes
|
$ | 3,349,453 | $ | 2,547,040 | ||||
A reconciliation of the federal statutory rate to the effective tax rate is as follows:
|
Years ended December 31,
|
2015
|
2014
|
||||||||||||||
|
Computed expected tax expense
|
$ | 3,505,085 | 34.0 | % | $ | 2,677,656 | 34.0 | % | ||||||||
|
State taxes, net of Federal benefit
|
(74,827 | ) | (0.7 | ) | (99,356 | ) | (1.3 | ) | ||||||||
|
State valuation allowance
|
171,532 | 1.7 | 139,137 | 1.8 | ||||||||||||
|
Permanent differences
|
||||||||||||||||
|
Dividends received deduction
|
(121,960 | ) | (1.2 | ) | (114,996 | ) | (1.5 | ) | ||||||||
|
Non-taxable investment income
|
(177,487 | ) | (1.7 | ) | (92,283 | ) | (1.2 | ) | ||||||||
|
Other permanent differences
|
55,623 | 0.5 | 86,193 | 1.1 | ||||||||||||
|
Prior year tax matters
|
(49,139 | ) | (0.5 | ) | (53,556 | ) | (0.7 | ) | ||||||||
|
Other
|
40,626 | 0.4 | 4,245 | 0.1 | ||||||||||||
|
Total tax
|
$ | 3,349,453 | 32.5 | % | $ | 2,547,040 | 32.3 | % | ||||||||
Deferred tax assets and liabilities are determined using the enacted tax rates applicable to the period the temporary differences are expected to be recovered. Accordingly, the current period income tax provision can be affected by the enactment of new tax rates. The net deferred income taxes on the balance sheet reflect temporary differences between the carrying amounts of the assets and liabilities for financial reporting purposes and income tax purposes, tax effected at a various rates depending on whether the temporary differences are subject to federal taxes, state taxes, or both. Significant components of the Company’s deferred tax assets and liabilities are as follows:
F-37
KINGSTONE COMPANIES, INC. AND SUBSIDIARIES
NOTES TO CONSOLIDATED FINANCIAL STATEMENTS
YEARS ENDED DECEMBER 31, 2015 AND 2014
|
December 31,
|
December 31,
|
|||||||
|
2015
|
2014
|
|||||||
|
Deferred tax asset:
|
||||||||
|
Net operating loss carryovers (1)
|
$ | 150,492 | $ | 211,550 | ||||
|
Claims reserve discount
|
405,709 | 562,941 | ||||||
|
Unearned premium
|
2,555,012 | 1,741,360 | ||||||
|
Deferred ceding commission revenue
|
2,187,923 | 2,025,224 | ||||||
|
Other
|
151,250 | 88,148 | ||||||
|
Total deferred tax assets
|
5,450,386 | 4,629,223 | ||||||
|
Deferred tax liability:
|
||||||||
|
Investment in KICO (2)
|
1,169,000 | 1,169,000 | ||||||
|
Deferred acquisition costs
|
3,684,004 | 3,055,234 | ||||||
|
Intangibles
|
597,657 | 759,400 | ||||||
|
Depreciation and amortization
|
415,938 | 291,689 | ||||||
|
Net unrealized appreciation of securities - available for sale
|
255,977 | 491,080 | ||||||
|
Total deferred tax liabilities
|
6,122,576 | 5,766,403 | ||||||
|
Net deferred income tax liability
|
$ | (672,190 | ) | $ | (1,137,180 | ) | ||
|
(1)
|
The deferred tax assets from net operating loss carryovers are as follows:
|
|
December 31,
|
December 31,
|
||||||||
|
Type of NOL
|
2015
|
2014
|
Expiration
|
||||||
|
State only (A)
|
$ | 540,865 | $ | 567,188 |
December 31, 2035
|
||||
|
Valuation allowance
|
(403,973 | ) | (372,638 | ) | |||||
|
State only, net of valuation allowance
|
136,892 | 194,550 | |||||||
|
Amount subject to Annual Limitation, federal only (B)
|
13,600 | 17,000 |
December 31, 2019
|
||||||
|
Total deferred tax asset from net operating loss carryovers
|
$ | 150,492 | $ | 211,550 | |||||
(A) Kingstone generates operating losses for state purposes and has prior year NOLs available. The state NOL as of December 31, 2015 and December 31, 2014 was approximately $8,321,000 and $6,834,000, respectively. KICO, the Company’s insurance underwriting subsidiary, is not subject to state income taxes. KICO’s state tax obligations are paid through a gross premiums tax, which is included in the consolidated statements of income and comprehensive income within other underwriting expenses. A valuation allowance has been recorded due to the uncertainty of generating enough state taxable income to utilize 100% of the available state NOLs over their remaining lives, which expire between 2027 and 2035. Effective January 1, 2015, the enacted state tax rate was reduced to 6.5% from 8.33%, resulting in a current period decrease in the available benefit of the state NOL, net of the corresponding valuation adjustment. The decrease in the available benefit of the state net NOL increased the tax provision in the current period by $44,553.
(B) The Company has an NOL of $50,000 that is subject to Internal Revenue Code Section 382, which places a limitation on the utilization of the federal net operating loss to approximately $10,000 per year (“Annual Limitation”) as a result of a greater than 50% ownership change of the Company in 1999. The losses subject to the Annual Limitation will be available for future years, expiring through December 31, 2019.
|
(2)
|
Deferred tax liability - investment in KICO
|
F-38
KINGSTONE COMPANIES, INC. AND SUBSIDIARIES
NOTES TO CONSOLIDATED FINANCIAL STATEMENTS
YEARS ENDED DECEMBER 31, 2015 AND 2014
On July 1, 2009, the Company completed the acquisition of 100% of the issued and outstanding common stock of KICO (formerly known as Commercial Mutual Insurance Company (“CMIC”)) pursuant to the conversion of CMIC from an advance premium cooperative to a stock property and casualty insurance company. Pursuant to the plan of conversion, the Company acquired a 100% equity interest in KICO, in consideration for the exchange of $3,750,000 principal amount of surplus notes of CMIC. In addition, the Company forgave all accrued and unpaid interest on the surplus notes as of the date of conversion. As of the date of acquisition, unpaid accrued interest on the surplus notes along with the accretion of the discount on the original purchase of the surplus notes totaled $2,921,319 (together “Untaxed Interest”). As of the date of acquisition, the deferred tax liability on the Untaxed Interest was $1,169,000. Under GAAP guidance for business combinations, a temporary difference with an indefinite life exists when the parent has a lower carrying value of its subsidiary for income tax purposes. The Company is required to maintain its deferred tax liability of $1,169,000 related to this temporary difference until the stock of KICO is sold, or the assets of KICO are sold or KICO and the parent are merged.
The table below reconciles the changes in net deferred income tax liability to the deferred income tax provision for the year ended December 31, 2015:
|
Change in net deferred income tax liabilities
|
$ | (464,990 | ) | |
|
Deferred tax expense (benefit) allocated to other comprehensive income
|
(238,058 | ) | ||
|
Deferred income tax provision
|
$ | (226,932 | ) |
In assessing the valuation of deferred tax assets, the Company considers whether it is more likely than not that some portion or all of the deferred tax assets will not be realized. The ultimate realization of deferred tax assets is dependent upon the generation of future taxable income during the periods in which those temporary differences become deductible. No valuation allowance against deferred tax assets has been established, except for NOL limitations, as the Company believes it is more likely than not the deferred tax assets will be realized based on the historical taxable income of KICO, or by offset to deferred tax liabilities.
The Company had no material unrecognized tax benefit and no adjustments to liabilities or operations were required. There were no interest or penalties related to income taxes that have been accrued or recognized as of and for the years ended December 31, 2015 and 2014. If any had been recognized these would be reported in income tax expense.
IRS Tax Audit
The tax returns for years ended December 31, 2012 through 2014 are subject to examination, generally for three years after filing.
In March 2014, the Company received a notice that its federal income tax returns for the years ended December 31, 2011 and 2012 were selected for examination by the Internal Revenue Service. On March 31, 2014, the Company was notified that the examination was cancelled.
Note 16 - Employee Benefit Plans
KICO maintains a salary reduction plan under Section 401(k) of the Internal Revenue Code (“the 401(k) Plan”) for its qualified employees. KICO matches 100% of each participant’s contribution up to 4% of the participant’s eligible contribution. The Company, at its discretion, may allocate an amount for additional contributions (“Additional Contributions”) to the 401(k) Plan. The Company incurred approximately $422,000 and $367,000 of expense for the years ended December 31, 2015 and 2014, respectively, related to the 401(k) Plan. For the years ended December 31, 2015 and 2014, Additional Contributions totaled approximately $263,000 and $229,000, respectively.
F-39
KINGSTONE COMPANIES, INC. AND SUBSIDIARIES
NOTES TO CONSOLIDATED FINANCIAL STATEMENTS
YEARS ENDED DECEMBER 31, 2015 AND 2014
Note 17 - Commitments and Contingencies
Litigation
From time to time, the Company is involved in various legal proceedings in the ordinary course of business. For example, to the extent a claim asserted by a third party in a lawsuit against one of the Company’s insureds covered by a particular policy, the Company may have a duty to defend the insured party against the claim. These claims may relate to bodily injury, property damage or other compensable injuries as set forth in the policy. Such proceedings are considered in estimating the liability for loss and LAE expenses. The Company is not subject to any other pending legal proceedings that management believes are likely to have a material adverse effect on the financial statements.
Office Lease
On March 27, 2015, the Company entered into a lease agreement for an additional office facility for KICO located in Valley Stream, NY under a non-cancelable operating lease. In addition to the base rental costs, occupancy lease agreements generally provide for rent escalations resulting from increased assessments from real estate taxes and other charges.
The lease commencement date was July 1, 2015 and rent commencement begins January 1, 2016. The lease has a term of seven years and six months.
Rent expense under the lease will be recognized on a straight-line basis over the lease term. At December 31, 2015, cumulative rent expense exceeded cumulative rent payments by $52,252. This difference is recorded as deferred rent and is included in accounts payable, accrued expenses and other liabilities in the accompanying consolidated balance sheets.
As of December 31, 2015, aggregate future minimum rental commitments under this agreement are as follows:
|
For the Year
|
||||
|
Ending
|
||||
|
December 31,
|
Total
|
|||
|
2016
|
$ | 100,750 | ||
|
2017
|
104,276 | |||
|
2018
|
107,926 | |||
|
2019
|
111,703 | |||
|
2020
|
115,613 | |||
|
Thereafter
|
243,506 | |||
|
Total
|
$ | 783,774 | ||
Rent expense for the year ended December 31, 2015 amounted to $52,252 and is included in the consolidated statements of income and comprehensive income within other underwriting expenses.
F-40
KINGSTONE COMPANIES, INC. AND SUBSIDIARIES
NOTES TO CONSOLIDATED FINANCIAL STATEMENTS
YEARS ENDED DECEMBER 31, 2015 AND 2014
Employment Agreements
Chief Executive Officer (Kingstone)
Effective August 12, 2014, the Company entered into an amendment to its employment agreement with Barry Goldstein, its President, Chairman of the Board and Chief Executive Officer (as amended, the “Goldstein Employment Agreement”), pursuant to which the term of the employment agreement was extended from December 31, 2014 to December 31, 2016 and, effective July 1, 2014 and continuing through the term of the agreement, Mr. Goldstein’s annual base salary was increased to $575,000 and his bonus was revised to equal 6% of the Company’s consolidated income from operations before taxes, net of the Company’s consolidated net investment income and net realized gains on sales of investments. In addition, in consideration of Mr. Goldstein entering into the amendment, the Company paid him a bonus in the amount of $62,500.
Concurrently with the amendment, the Company granted to Mr. Goldstein, pursuant to the 2005 Plan, a five year option for the purchase of 200,000 shares of common stock at an exercise price of $6.73 per share, exercisable to the extent of 62,500 shares on the date of grant and each of the initial two anniversary dates of the grant and 12,500 shares on the third anniversary date of the grant. In addition, the Company granted to Mr. Goldstein, pursuant to the 2014 Plan, a five year option for the purchase of 50,000 shares of common stock at an exercise price of $6.73 per share, exercisable on the third anniversary of the date of the grant. The 50,000 share option grant was subject to stockholder approval of the 2014 Plan. The stockholders approved the 2014 Plan on August 11, 2015. Pursuant to the stock option agreements with Mr. Goldstein, the Company agreed that, under certain circumstances following a change of control of the Company, and the termination of his employment, or in the event Mr. Goldstein’s employment with the Company is terminated by the Company without cause or he resigns with good reason (each as defined in his employment agreement), all of the options granted to Mr. Goldstein would become exercisable and would remain exercisable until the first anniversary of the termination date.
Pursuant to the Goldstein Employment Agreement, the Company also agreed that, under certain circumstances following a change of control of Kingstone Companies, Inc. and the termination of his employment, Mr. Goldstein would be entitled to a payout equal to one and one-half times his then annual salary. In the event of termination of Mr. Goldstein’s employment by the Company without cause or he resigns with good reason (as each term is defined in the Goldstein Employment Agreement), Mr. Goldstein would be entitled to receive his base salary and bonuses from the Company for the remainder of the term, and his outstanding options would become exercisable and would remain exercisable until the first anniversary of the termination date. In addition, in the event Mr. Goldstein’s employment with KICO is terminated by KICO with or without cause, he would be entitled to receive a lump sum payment from KICO equal to six months base salary.
Executive Vice President (KICO)
John D. Reiersen, KICO’s Executive Vice President, is employed pursuant to an employment agreement effective as of November 13, 2006 and amended as of January 25, 2008, February 28, 2011 and October 14, 2013 (together, the “Reiersen Agreement”). The Reiersen Agreement expires on December 31, 2016 and may be terminated by KICO at any time with or without cause upon written notice. In the event of termination by KICO, Mr. Reiersen will be entitled to receive severance in an amount equal to the lesser of $50,000 or the remaining salary payable to him through the term of his agreement. Pursuant to the Reiersen Agreement, Mr. Reiersen’s minimum annual salary effective from January 1, 2012 through December 31, 2014 was $100,000. His minimum annual salary effective January 1, 2015 is $105,000. His minimum salary in both periods is subject to increase based upon the provision of more than 500 hours of service per year on behalf of KICO. Mr. Reiersen also receives additional customary benefits and a $5,000 annual fee for his position as a director of KICO.
F-41
KINGSTONE COMPANIES, INC. AND SUBSIDIARIES
NOTES TO CONSOLIDATED FINANCIAL STATEMENTS
YEARS ENDED DECEMBER 31, 2015 AND 2014
Approval Required for Transactions with Subsidiary
On July 1, 2009, Kingstone completed the acquisition of 100% of the issued and outstanding common stock of KICO (formerly known as Commercial Mutual Insurance Company (“CMIC”)) pursuant to the conversion of CMIC from an advance premium cooperative to a stock property and casualty insurance company. Pursuant to the plan of conversion, Kingstone acquired a 100% equity interest in KICO. In connection with the plan of conversion of CMIC, the Company has agreed with the Department of Financial Services that any intercompany transaction between itself and KICO must be filed with the Department 30 days prior to implementation.
Note 18 - Earnings Per Common Share
Basic net earnings per common share is computed by dividing income available to common shareholders by the weighted-average number of common shares outstanding. Diluted earnings per common share reflect, in periods in which they have a dilutive effect, the impact of common shares issuable upon exercise of stock options. The computation of diluted earnings per common share excludes those options with an exercise price in excess of the average market price of the Company’s common shares during the periods presented.
The computation of diluted earnings per common share excludes outstanding options in periods where the exercise of such options would be anti-dilutive. For the years ended December 31, 2015 and 2014, the inclusion of -0- and 63,356 options, respectively, in the computation of diluted earnings per common share would have been anti-dilutive for the periods and, as a result, the weighted average number of common shares used in the calculation of diluted earnings per common share has not been adjusted for the effect of such options.
The reconciliation of the weighted average number of common shares used in the calculation of basic and diluted earnings per common share follows:
|
Year ended
|
||||||||
|
December 31,
|
||||||||
|
2015
|
2014
|
|||||||
|
Weighted average number of shares outstanding
|
7,331,114 | 7,287,657 | ||||||
|
Effect of dilutive securities, common share equivalents
|
46,766 | 69,305 | ||||||
|
Weighted average number of shares outstanding, used for computing diluted earnings per share
|
7,377,880 | 7,356,962 | ||||||
F-42
KINGSTONE COMPANIES, INC. AND SUBSIDIARIES
NOTES TO CONSOLIDATED FINANCIAL STATEMENTS
YEARS ENDED DECEMBER 31, 2015 AND 2014
Note 19 – Premium Finance Placement Fees
The Company’s wholly owned subsidiary, Payments Inc. (“Payments”), is licensed as a premium finance agency in the state of New York. Prior to February 1, 2008, Payments provided premium financing in connection with the obtaining of insurance policies. Effective February 1, 2008, Payments sold its outstanding premium finance loan portfolio. The purchaser of the portfolio (the “Purchaser”) agreed that, during the five year period ended February 1, 2013 (which period was extended to February 1, 2015), it would purchase, assume and service all eligible premium finance contracts originated by Payments in the state of New York (the “Agreement”). In connection with such purchases, Payments was entitled to receive a fee generally equal to a percentage of the amount financed.
On July 17, 2014, the Purchaser terminated the Agreement effective February 1, 2015. Following any expiration or termination of the obligation of the Purchaser to purchase premium finance contracts, Payments was entitled to receive the fees for an additional two years (“Termination Period”) with regard to contracts for policies from the Company’s producers. On March 26, 2015, the Company and the Purchaser agreed to amend the Termination Period to end as of March 31, 2015 (“Termination Date”). The Company received a one-time payment of $350,000 in exchange for the fees that the Company would have received during the Termination Period. In connection with such agreement, the Company agreed to several restrictive covenants, including that, for a period of eighteen months following the Termination Date, it would not engage in the premium financing business within New York, New Jersey and Pennsylvania. The Company’s premium financing business consisted of the placement fees that Payments earned from placing contracts.
Placement fee revenue included in other income and the related direct expenses included in other operating expenses in the consolidated statements of net income and comprehensive income are as follows:
|
For the Year Ended
|
||||||||
|
December 31,
|
||||||||
|
2015
|
2014
|
|||||||
|
Placement fee revenue
|
$ | 54,343 | $ | 229,738 | ||||
|
Termination fee
|
350,000 | - | ||||||
|
Direct expenses
|
(12,989 | ) | (62,610 | ) | ||||
|
Net income before taxes from placement fees
|
$ | 391,354 | $ | 167,128 | ||||
Note 20 - Subsequent Events
The Company has evaluated events that occurred subsequent to December 31, 2015 through the date these consolidated financial statements were issued for matters that required disclosure or adjustment in these consolidated financial statements.
Dividends Declared and Paid
On February 4, 2016, the Company’s Board of Directors approved a dividend of $.0625 per share, or $457,604, payable in cash on March 15, 2016 to stockholders of record as of February 29, 2016.
F-43
KINGSTONE COMPANIES, INC. AND SUBSIDIARIES
NOTES TO CONSOLIDATED FINANCIAL STATEMENTS
YEARS ENDED DECEMBER 31, 2015 AND 2014
Note 21 – Quarterly Financial Data (Unaudited)
The following is a summary of unaudited quarterly results of operations for the years ended December 31, 2015 and 2014:
|
2015
|
||||||||||||||||||||
|
March 31,
|
June 30,
|
September 30,
|
December 31,
|
Total
|
||||||||||||||||
|
Net premiums earned
|
$ | 10,385,799 | $ | 10,865,715 | $ | 13,129,604 | $ | 14,230,964 | $ | 48,612,082 | ||||||||||
|
Ceding commission revenue
|
3,089,404 | 3,655,522 | 2,643,531 | 2,084,660 | 11,473,117 | |||||||||||||||
|
Net investment income
|
574,656 | 625,972 | 649,441 | 713,821 | 2,563,890 | |||||||||||||||
|
Net realized gain (loss) on sale of investments
|
(67,494 | ) | 2,263 | (40,487 | ) | 55,172 | (50,546 | ) | ||||||||||||
|
Total revenues
|
14,613,556 | 15,542,512 | 16,657,369 | 17,362,297 | 64,175,734 | |||||||||||||||
|
Loss and loss adjustment expenses
|
7,063,217 | 4,770,813 | 5,050,194 | 6,295,776 | 23,180,000 | |||||||||||||||
|
Commission expense and other underwriting expenses
|
6,411,482 | 6,561,827 | 7,410,407 | 7,766,815 | 28,150,531 | |||||||||||||||
|
Net income
|
382,499 | 2,379,182 | 2,345,654 | 1,852,285 | 6,959,620 | |||||||||||||||
|
Basic earnings per share
|
$ | 0.05 | $ | 0.32 | $ | 0.32 | $ | 0.25 | $ | 0.95 | ||||||||||
|
Diluted earnings per share
|
$ | 0.05 | $ | 0.32 | $ | 0.32 | $ | 0.25 | $ | 0.94 | ||||||||||
| 2014 | ||||||||||||||||||||
|
March 31,
|
June 30,
|
September 30,
|
December 31,
|
Total
|
||||||||||||||||
|
Net premiums earned
|
$ | 5,926,311 | $ | 6,429,373 | $ | 9,895,000 | $ | 10,377,800 | $ | 32,628,484 | ||||||||||
|
Ceding commission revenue
|
3,381,283 | 3,706,049 | 3,278,319 | 3,544,460 | 13,910,111 | |||||||||||||||
|
Net investment income
|
378,788 | 451,915 | 463,513 | 505,552 | 1,799,768 | |||||||||||||||
|
Net realized gain on sale of investments
|
188,348 | 134,602 | 115,176 | 268,901 | 707,027 | |||||||||||||||
|
Total revenues
|
10,102,287 | 10,972,847 | 14,015,734 | 14,960,624 | 50,051,492 | |||||||||||||||
|
Loss and loss adjustment expenses
|
4,324,954 | 3,007,939 | 4,538,167 | 5,161,128 | 17,032,188 | |||||||||||||||
|
Commission expense and other underwriting expenses
|
4,864,257 | 5,432,867 | 5,951,772 | 6,532,697 | 22,781,593 | |||||||||||||||
|
Net income
|
327,133 | 1,354,502 | 1,883,681 | 1,763,103 | 5,328,419 | |||||||||||||||
|
Basic earnings per share
|
$ | 0.05 | $ | 0.19 | $ | 0.26 | $ | 0.24 | $ | 0.73 | ||||||||||
|
Diluted earnings per share
|
$ | 0.04 | $ | 0.18 | $ | 0.26 | $ | 0.24 | $ | 0.72 | ||||||||||
Due to changes in number of shares outstanding from quarter to quarter, the total earnings per share of the four quarters may not necessarily equal the earnings per share for the year.
F-44