Attached files
| file | filename |
|---|---|
| 8-K - 8-K - Agiliti Health, Inc. | a12-18111_18k.htm |
| EX-99.1 - EX-99.1 - Agiliti Health, Inc. | a12-18111_1ex99d1.htm |
Exhibit 99.2
|
|
UHOS Q2 2012 Earnings Teleconference August 14, 2012 |
|
|
Safe Harbor Statement under the Private Securities Litigation Reform Act of 1995: Universal Hospital Services, Inc. believes statements in this presentation looking forward in time involve risks and uncertainties based on management’s current views and assumptions. Actual events may differ materially. Please refer to the cautionary statement regarding forward-looking statements and risk factors that appear in the Company’s Annual Report on Form 10-K for the year ended December 31, 2011, and other filings with the SEC, which can be accessed at www.UHS.com under “Financials.” This presentation contains non-GAAP measures as defined by SEC rules. Reconciliations of these measures to the most directly comparable GAAP measures are contained in the appendix. Forward Looking Statements 2 |
|
|
2nd Quarter EBITDA Results + 32% (growth driven by gains on recalled equipment) UHS $29.9 UHS $39.6 $2.8 Surgical Services 2011 2012 3 $2.3 $32.2 $42.4 2011 2012 Flu Chart |
|
|
2012: 1st Half Performance 4 360 Solutions Patient Handling Solutions Wound Care Solutions Integrating acquisitions into the UHS fold and setting the stage for growth in the future Continued softness in hospital admissions and proactive measures to cut costs at hospitals; however, this is also leveraged to the upsize of the eventual ramp up of admissions New entry points of Patient Handling and Wound Care in our Asset360 platform are enhancing opportunities Surgical Services Solutions Peak Need Rental Solutions |
|
|
Lasers Cryosurgery Lithotripsy Ultrasound Surgical Services Uses light waves for cardiac, neuro, ENT and urology Freeze and destroy tissue for Prostate, Liver, Kidney, and Bone cancer Shock waves fragment stones into sand like particles Images of vital organs Continuing our goal of a nationwide footprint, we completed the acquisition of surgical service assets in the Northwest in July for $4.8M 5 |
|
|
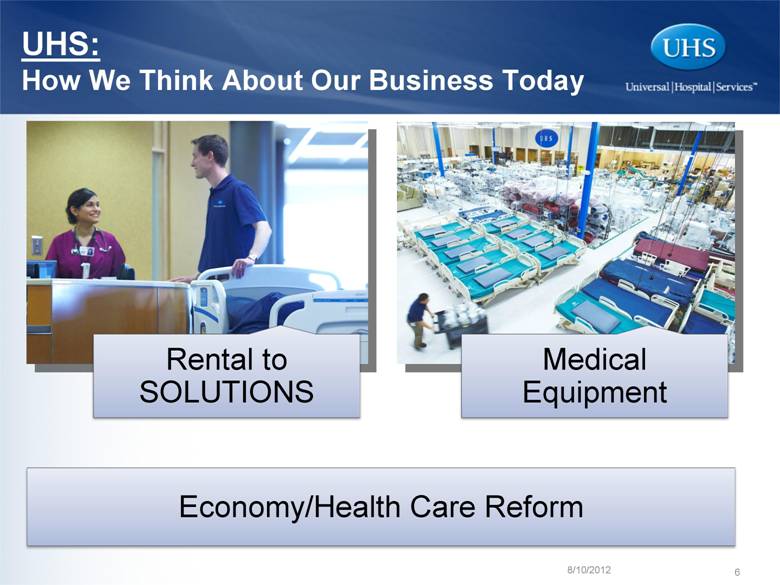
Rental to SOLUTIONS Medical Equipment 8/10/2012 6 Economy/Health Care Reform UHS: How We Think About Our Business Today |
|
|
Confidential 7 7 7 Technical Expert Trusted Advisor Clinical Expert Financial Expert CUSTOMERS S O L U T I O N S UHS: How Our Customers Think About Us |

|
|
Financial Review 2nd Quarter 2012 8 |
|
|
Refer to Appendix for reconciliation of Gross Margin Pre-ASC 805 to Gross Margin & Historical Depreciation to Depreciation Medical Equipment Outsourcing RENTAL OF UHS-OWNED EQUIPMENT Supplemental (short-term) Long-Term Bariatrics: Suite of specialty equipment for obese patients Surgery: Suite of minimally invasive lasers RENTAL OF MANUFACTURER-OWNED EQUIPMENT ASSET360TM EQUIPMENT MANAGEMENT PROGRAM On-site management to drive better equipment utilization (UHS people, technology & processes) Trend Analysis 2011 and 2012 include Revenue, Cash Gross Margin and Gross Margin from the Surgical Services acquisition beginning April 1st 2011. Refer to the appendix for the consolidating reconciliations Momentum in our growth areas of Asset360™, Patient Handling, and Wound Therapy, as well as gains on recalled equipment offset continued weak Peak Need Rental caused by ongoing weak hospital admissions and acuity levels 9 $ in Millions 2nd Quarter June YTD LTM 2011 2012 % Chg 2011 2012 % Chg 2012 Revenues $ 73.8 $ 88.5 19.8% $ 140.1 $ 168.5 20.3% $ 320.2 Cash Gross Margin Pre ASC 805 46.4 57.0 22.9% 89.3 106.4 19.0% $ 199.8 % of Revenue 63.0% 64.5% 63.8% 63.1% 62.4% Historical Depreciation (16.9) (18.3) (32.4) (36.5) $ (71.9) Gross Margin Pre ASC 805 $ 29.5 $ 38.7 31.1% $ 56.9 $ 69.9 22.8% $ 127.9 % of Revenue 40.1% 43.7% 40.7% 41.5% 39.9% |
|
|
Asset360 Solutions Counts at 6/30/12 80 Hospitals Infusion Wound Therapy Patient Handling Total Programs 113 Avg. Yearly Signings 2009 - 2011 + 20 programs + 11 Hospitals 10 Expect future signings to increase as we are increasing resources |
|
|
Equipment Recall Gains Will be completed by Q3-2012 Total gains from 2010 to Q2-2012 = $35.3 (including $15.3 YTD 2012) Cash component: $ 7.5 Equipment trade in: $27.8 New equipment replaces older, substantially depreciated infusion pumps, and such new pumps will provide future capex avoidance and revenue for years to come 11 |
|
|
Technical and Professional Services TECHNICAL SERVICES Maintain & Repair Customer owned Equipment: Non-resident, response based/ scheduled Biomedical Services Manufacturer Services BIOMED360TM EQUIPMENT MAINTENANCE PROGRAM (Formerly CHAMP) Customizable on-site biomedical services program Refer to Appendix for reconciliation of Gross Margin Pre-ASC 805 to Gross Margin & Historical Depreciation to Depreciation 12 Trend Analysis The signing of a large BioMed360™ account in 3Q 2011 is accelerating revenues, albeit with lower margins vs. historical margins $ in Millions 2nd Quarter June YTD LTM 2011 2012 % Chg 2011 2012 % Chg 2012 Revenues $ 11.4 $ 22.4 96.7% $ 22.2 $ 42.5 91.1% $ 74.4 Cash Gross Margin Pre ASC 805 3.2 5.6 76.1% 6.3 10.1 59.7% $ 17.8 % of Revenue 28.5% 25.2% 28.5% 23.7% 23.9% Historical Depreciation (0.1) (0.1) (0.2) (0.3) $ (0.5) Gross Margin Pre ASC 805 $ 3.1 $ 5.5 74.2% $ 6.1 $ 9.8 60.5% $ 17.3 % of Revenue 27.6% 24.5% 27.5% 23.1% 23.3% |
|
|
Medical Equipment Sales and Remarketing ASSET RECOVERY & EQUIPMENT BROKERAGE NEW EQUIPMENT SALES DISPOSABLE SALES 13 Refer to Appendix for reconciliation of Gross Margin Pre-ASC 805 to Gross Margin & Historical Depreciation to Depreciation Trend Analysis Results in this segment will fluctuate based on equipment availability, transactional size and the transactional nature of the business $ in Millions 2nd Quarter June YTD LTM 2011 2012 % Chg 2011 2012 % Chg 2012 Revenues $ 5.9 $ 9.3 57.7% $ 11.5 $ 15.6 36.1% $ 29.3 Cash Gross Margin Pre ASC 805 1.4 2.0 43.9% 2.8 3.7 32.9% $ 6.7 % of Revenue 23.4% 21.8% 24.3% 23.8% 22.9% Historical Depreciation (0.1) (0.1) (0.2) (0.2) $ (0.3) Gross Margin Pre ASC 805 $ 1.3 $ 1.9 49.5% $ 2.6 $ 3.5 35.9% $ 6.4 % of Revenue 21.8% 20.7% 22.7% 22.6% 21.9% |
|
|
Selected Financial Data * Refer to Appendix for Proforma calculation Refer to Appendix for reconciliation of Cash SG&A to SG&A, Gross Margin Pre-ASC 805 to Gross Margin, Historical Depreciation to Depreciation, Adjusted EBITDA to Cash Flows from Operations, and Accrual CAPEX to investing cash flows. 14 $ in Millions 2nd Quarter June YTD LTM Q2 2011 2012 % Chg 2011 2012 % Chg 2012 Consolidated Revenues $ 91.1 $ 120.1 31.8% $ 173.8 $ 226.6 30.4% $ 423.8 Cash Gross Margin Pre-ASC 805 $ 51.0 $ 64.6 26.9% $ 98.4 $ 120.2 22.2% $ 224.3 % of Revenues 56.0% 53.9% 56.6% 53.1% 52.9% Historical Depreciation (17.1) (18.5) (32.8) (37.0) (72.7) Gross Margin Pre-ASC 805 $ 33.9 $ 46.1 36.1% $ 65.6 $ 83.2 27.1% $ 151.6 % of Revenues 37.4% 38.4% 37.7% 36.8% 35.8% Adjusted Cash SG&A $ 18.8 $ 22.0 25.4% $ 34.9 $ 42.4 21.5% $ 76.3 % of Revenues 20.7% 18.3% 20.1% 18.7% 18.0% Non Controlling Interest $ - $ 0.2 $ - $ - $ 0.4 0.0% $ 0.7 % of Revenues 0.0% 0.2% 0.0% 0.0% 0.2% 0.2% Adjusted EBITDA Actual $ 32.2 $ 42.4 31.7% $ 63.5 $ 77.4 21.9% $ 147.3 Proforma Adjustment $ 1.5 Proforma EBITDA $ 148.8 * % of Revenues 35.3% 35.3% 36.5% 34.2% 35.1% |
|
|
UHS Footprint Provides Unparalleled Opportunities to Continue to Diversify Our Solutions in Future While Peak Need has gravitated from 65% to 33% of total revenues, we have developed four $50M+ growth engines Biomed 360 Surgical Services Patient Handling & Wound Care Asset360 15 Revenue Mix 2004 2005 2006 2007 2008 2009 2010 2011 Other Peak Need |
|
|
16 Refinancing Overview 2020 2016 2017 2018 $405 8.50% Fixed Rate Notes 2012 2013 2014 $230 4.11% Floating Rate Notes $195 Bank Line 2015 2019 New $425 7.625% Notes (proceeds to retire 8.50% Fixed Rate Notes) Extend and Increase to $235 Keep in place due to extremely low rate; callable at par Tendered / Called for Redemption "Springing" maturity upon extension of Floating Rate Notes (must be at least 90 days inside the maturity of the Notes) |
|
|
$195 Bank Line (as of June 30th) Used = ~ $52 Liquidity Profile Remains Solid ($ millions) Available Liquidity = ~ $143 17 Facility increased to $235 effective 7/31/2012 “Springing” Maturity extended to the earlier of 5 years or 90 days inside the Notes maturities Similar borrowing base structure (Includes LOCs of $5) Borrowing Base = $195 |
|
|
Leverage Trend 18 Refer to Appendix for reconciliation of Adjusted EBIDTA to Cash Flow from Operations Note that our calculations include accrued interest for conservatism * Refer to Appendix for the Proforma calculation Total Net Debt and Accrued Interest / LTM Adjusted EBITDA 0.0 0.5 1.0 1.5 2.0 2.5 3.0 3.5 4.0 4.5 5.0 5.5 6.0 Q1 Q2 Q3 Q4 Q1 Q2 Q3 Q4 Q1 Q2 Q3 Q4 Q1 Q2 Q3 Q4 Q1 Q2 Q3 Q4 Q1 Q2 Q3 Q4 Q1 Q2 Q3 Q4 Q1 Q2 Q3 Q4 Q1 Q2 Q3 Q4 Q1 Q2 Q3 Q4 Q1 Q2 Q3 Q4 Q1 Q2 Q3 Q4 Q1 Q2 2000 2001 2002 2003 2004 2005 2006 2007 2008 2009 2010 2011 12 Recap Recap Equity Payout UHS Debt Structure ($ in millions) 12/31/2011 6/30/2012 Floating Rate Notes $ 230.0 $ 230.0 PIK Toggle Notes 405.0 405.0 Unamortized Bond Premium 3.4 3.0 Bank Line 14.5 47.5 Consolidated Capital Leases 18.2 17.9 Total Debt $ 671.1 $ 703.4 Less: Cash On Hand (1.2) (0.3) Add: Accrued Interest 4.9 4.1 Net Debt $ 674.8 $ 707.2 Consolidated LTM Adj EBITDA $ 136.8 $ 148.8 * Leverage 4.9 4.8 |
|
|
2010 2011 2012 E Adjusted EBITDA $121.6 Actual: $133.4 Proforma: $136.8* Mid $130’s Accrual CAPEX $85 $80 Low $70’s Year-end Leverage 4.3x 4.9x* ~ 5.0x Street Guidance for 2012 ($ in Millions) * Refer to later slide for Proforma calculations 19 |
|
|
Outlook: UHS Expects Another Stable Year in 2012 Refer to appendix for reconciliation of Adjusted EBITDA to Cash Flows from Operations 20 |
|
|
Consolidating Reconciliations EBITDA Reconciliation: 2011 & LTM Q2 2012 EBITDA Reconciliation: 1998 – LTM Q2 2012 Selected Reconciliations Gross Margin Pre-ASC 805 to Gross Margin Depreciation and Amortization Reconciliation Other Reconciliations Appendix 21 |
|
|
Consolidating Reconciliations 22 Includes $27.0 LTM gains on recalled equipment $ in Millions Consolidated Q2 2012 Consolidated YTD 2012 Consolidated LTM 2012 Surgical Surgical Surgical Actual: UHS Services Total UHS Services Total UHS Services Total Cash Gross Margin $ 59.1 $ 5.5 $ 64.6 $ 109.3 $ 10.9 $ 120.2 $ 205.4 $ 18.9 $ 224.3 Depreciation - Historical (17.2) (1.3) (18.5) (34.6) (2.4) (37.0) (69.0) (3.7) (72.7) Gross Margin Pre ASC 805 41.9 4.2 46.1 74.7 8.5 83.2 136.4 15.2 151.6 Adj Cash SGA 19.4 2.6 22.0 37.3 5.1 42.4 69.6 6.7 76.3 Non Controlling Interest in LLC's - 0.2 0.2 - 0.4 0.4 - 0.7 0.7 EBITDA per GAAP 38.1 2.7 40.8 68.5 5.1 73.6 128.9 9.2 138.1 Option Expense 1.1 - 1.1 2.2 - 2.2 4.3 - 4.3 Other ASC 805 Impact - - - 0.1 - 0.1 - 0.1 0.1 Board and Strategic Expenses 0.4 0.1 0.5 1.2 0.3 1.5 2.7 2.1 4.8 Adjusted EBITDA $ 39.6 $ 2.8 $ 42.4 $ 72.0 $ 5.4 $ 77.4 135.9 11.4 147.3 Surgical laser services acquisition purchased on 10/1/11 0.2 0.2 * Surgical laser services acquisition purchased on 1/1/12 1.3 1.3 ** Proforma Adjusted EBITDA $ 135.9 $ 12.9 $ 148.8 * Proforma adjustments include the 3 months prior to the 10/1/11 acquisition ** Proforma adjustments include the 6 months prior to the 1/1/12 acquisition |
|
|
EBITDA Reconciliation Adjusted EBITDA Reconciliation. Adjusted EBITDA is defined by UHS as Earnings Before Interest, Taxes, Depreciation and Amortization (“EBITDA”), before management, board and strategic fees, stock option expense, ASC 805 impact, loss on extinguishment of debt, transaction and related costs and other. In addition to using Adjusted EBITDA internally as a measure of operational performance, we disclose Adjusted EBITDA externally to assist analysts, investors and lenders in their comparisons of operational performance, valuation and debt capacity across companies with differing capital, tax and legal structures. Management also understands that some industry analysts and investors consider Adjusted EBITDA as a supplementary non-GAAP financial measure useful in analyzing a company’s ability to service debt. Adjusted EBITDA, however, is not a measure of financial performance under Generally Accepted Accounting Principals (“GAAP”) and should not be considered as an alternative to, or more meaningful than, net income as a measure of operating performance or to cash flows from operating, investing or financing activities or as a measure of liquidity. Since Adjusted EBITDA is not a measure determined in accordance with GAAP and is thus susceptible to varying interpretations and calculations, Adjusted EBITDA, as presented, may not be comparable to other similarly titled measures of other companies. Adjusted EBITDA does not represent an amount of funds that is available for management’s discretionary use. A reconciliation of operating cash flows to EBITDA and Adjusted EBITDA is included below. 23 Includes $27.0 LTM gains on recalled equipment $ in Millions 2nd Quarter June YTD LTM Q2 2011 2012 2011 2012 2012 Net Cash provided by Operating Activities $ 5.9 $ (6.4) $ 31.1 $ 17.7 $ 44.3 Changes in Operating Assets and Liabilities 5.9 $ 22.6 1.0 16.8 16.4 Other and Non-Cash Expenses 11.0 $ 9.9 7.2 11.8 21.9 Income Tax Expense (7.5) $ 0.2 (7.3) (2.7) (5.1) Interest Expense 12.7 $ 14.5 24.4 30.0 60.6 EBITDA 28.0 40.8 56.4 73.6 138.1 Management, Board & Strategic Fees 2.4 0.5 4.0 1.5 4.8 Stock Option Expense 1.1 1.1 2.2 2.2 4.3 ASC 805 Impact 0.7 - 0.9 0.1 0.1 Adjusted EBITDA $ 32.2 $ 42.4 $ 63.5 77.4 147.3 10/1/11 Surgical laser services proforma EBITDA (3 mos) 0.2 1/1/12 Surgical laser services proforma EBITDA (6 mos) 1.3 Proforma Adjusted EBITDA $ 148.8 |
|
|
EBITDA Reconciliation: 1998 – LTM Q2 2012 24 Includes $27.0 LTM gains on recalled equipment LTM Q2 $ in Millions 1998 1999 2000 2001 2002 2003 2004 2005 2006 2007 2008 2009 2010 2011 2012 Net Cash provided by Operating Activities $ 9.7 $ 15.2 $ 28.2 $ 31.7 $ 40.2 $ 16.0 $ 38.0 $ 44.0 $ 48.9 $ 29.8 $ 56.2 $ 56.0 $ 76.2 $ 57.7 $ 44.3 Changes in Operating Assets and Liabilities 1.4 3.7 (3.5) 0.4 4.1 7.9 2.2 2.3 0.7 6.7 3.6 6.2 (2.1) 0.6 16.4 Other and Non-Cash Expenses 0.9 0.7 (2.3) (3.7) (11.7) (7.9) (3.4) (3.3) (4.1) (28.5) 6.5 6.3 (11.5) 17.3 21.9 Income Tax Expense (1.1) (1.7) 0.1 0.1 0.1 0.3 1.2 0.8 0.6 (9.7) (15.4) (11.5) 1.7 (9.7) (5.1) Interest Expense 11.2 18.0 20.7 19.6 18.1 20.2 30.5 31.1 31.6 40.2 46.9 46.5 46.5 55.0 60.6 EBITDA 22.1 35.9 43.2 48.1 50.8 36.5 68.5 75.0 77.7 38.5 97.8 103.5 110.8 120.9 138.1 Recapitalization, company sale, stock compensation and severence expenses 5.1 - - 1.6 10.1 14.4 - - - 27.2 - - - - - Terminated IPO Expenses - - - 1.2 - - - - - - - - - - - Loss on extinguishment of debt - - - - - 13.3 - - - 23.4 - - - - - Financing and Reorganization Charges $ 5.1 $ - $ - $ 2.8 $ 10.1 $ 27.7 $ - $ - $ - $ 50.6 $ - $ - $ - $ - $ - Management, Board & Strategic Fees - - 0.3 0.4 0.3 0.3 0.7 0.8 1.6 1.0 1.3 1.3 2.4 7.3 4.8 Other 2.9 - - - - - - - - (0.7) 0.1 - - - - Stock Option Expense - - - - - - - - 1.7 3.7 2.5 1.3 7.3 4.3 4.3 ASC 805 Impact - - - - - - - - - 2.4 2.3 2.0 1.1 0.9 0.1 Adjusted EBITDA 30.1 35.9 43.5 51.3 61.2 64.5 69.2 75.8 80.9 95.5 104.0 108.1 121.6 133.4 147.3 Surgical Services LTM proforma EBITDA 3.4 1.5 Proforma Adjusted EBITDA $ 136.8 $ 148.8 Total Revenue $ 69.4 $ 92.2 $ 106.0 $ 125.6 $ 153.8 $ 171.0 $ 199.6 $ 215.9 $ 225.1 $ 264.0 $ 289.1 $ 297.2 $ 317.4 $ 371.0 $ 423.8 Total Debt & Accrued Int, Less Cash & Investments $ 153.8 $ 192.4 $ 199.0 $ 209.2 $ 205.8 $ 276.7 $ 301.9 $ 305.0 $ 315.0 $ 501.1 $ 521.7 $ 522.3 $ 528.6 $ 674.8 $ 707.2 Leverage (Total Net Debt & Accrued Interest Less Cash & Investments/ LTM adj EBITDA) 5.1 5.4 4.6 4.1 3.4 4.3 4.4 4.0 3.9 5.2 5.0 4.8 4.3 4.9 4.8 |
|
|
Selected Reconciliations 25 $ in Millions 2nd Quarter June YTD LTM Q2 2011 2012 2011 2012 2012 Gross Margin ASC 805 Impact Depreciation $ 1.8 $ 0.1 $ 4.6 $ 0.2 $ 0.3 Other - - - - $ 0.2 Total Gross Margin ASC 805 Impact $ 1.8 $ 0.1 $ 4.6 $ 0.2 $ 0.5 SG&A per GAAP to Cash SG&A SG&A per GAAP $ 28.3 $ 28.7 $ 51.5 $ 56.6 $ 109.5 Stock Option Expense (1.1) (1.1) (2.2) (2.2) $ (4.3) Historical Depreciation & Amortization (1.3) (1.2) (2.2) (2.3) $ (4.1) ASC 805 Depreciation & Amortization (4.0) (3.9) (7.5) (8.1) $ (19.9) Other ASC 805 Impact (0.7) - (0.7) (0.1) $ (0.1) Management, Board, & Strategic Fees (2.4) (0.5) (4.0) (1.5) $ (4.8) Adjusted Cash SG&A $ 18.8 $ 22.0 $ 34.9 $ 42.4 $ 76.3 |
|
|
Selected Reconciliations: Gross Margin Pre-ASC 805 to Gross Margin 26 $ in Millions 2nd Quarter June YTD LTM Q2 2011 2012 2011 2012 2012 Medical Equipment Outsourcing Gross Margin Pre-ASC 805 $ 29.5 $ 38.7 $ 56.9 $ 69.9 $ 127.9 ASC 805 Outsourcing Depreciation 1.8 0.1 4.6 0.2 0.3 Other ASC 805 Items - - - - 0.2 Gross Margin per GAAP $ 27.7 $ 38.6 $ 52.3 $ 69.7 $ 127.4 Technical & Professional Services Gross Margin Pre-ASC 805 $ 3.1 $ 5.5 $ 6.1 $ 9.8 $ 17.3 Gross Margin per GAAP $ 3.1 $ 5.5 $ 6.1 $ 9.8 $ 17.3 Medical Equipment Sales & Remarketing Gross Margin Pre-ASC 805 $ 1.3 $ 1.9 $ 2.6 $ 3.5 $ 6.4 Gross Margin per GAAP $ 1.3 $ 1.9 $ 2.6 $ 3.5 $ 6.4 Total Gross Margin Pre-ASC 805 $ 33.9 $ 46.1 $ 65.6 $ 83.2 $ 151.6 Total ASC 805 Depreciation 1.8 0.1 4.6 0.2 0.3 Total Other ASC 805 Items - - - - 0.2 Total Gross Margin per GAAP $ 32.1 $ 46.0 $ 61.0 $ 83.0 $ 151.1 |
|
|
Depreciation & Amortization Reconciliations 27 $ in Millions 2nd Quarter June YTD LTM Q2 2011 2012 2011 2012 2012 Historical Outsourcing Depreciation $ 16.9 $ 18.3 $ 32.4 $ 36.5 $ 71.9 ASC 805 Outsourcing Depreciation 1.8 0.1 4.6 0.2 0.3 Total Outsourcing Depreciation 18.7 18.4 37.0 36.7 72.2 Historical Technical & Professional Services Depreciation 0.1 0.1 0.2 0.3 0.5 Total Technical & Professional Services Depreciation 0.1 0.1 0.2 0.3 0.5 Historical Sales & Remarketing Depreciation 0.1 0.1 0.2 0.2 0.3 Total Sales & Remarketing Depreciation 0.1 0.1 0.2 0.2 0.3 Historical Gross Margin Depreciation 17.1 18.5 32.8 37.0 72.7 Gross Margin ASC 805 Depreciation 1.8 0.1 4.6 0.2 0.3 Total Gross Margin Depreciation 18.9 18.6 37.4 37.2 73.0 Total Selling, General, and Admin Depreciation 1.3 1.2 2.2 2.3 4.1 Total ASC 805 Selling, General, and Admin Amortization 4.0 3.9 7.5 8.1 19.9 Total Depreciation and Amortization $ 24.2 $ 23.7 $ 47.1 $ 47.6 $ 97.0 |
|
|
Other Reconciliations 28 ACCRUAL CAPEX RECONCILIATION Q2 $ in Millions 2000 2001 2002 2003 2004 2005 2006 2007 2008 2009 2010 2011 2012 Cash used in Investing Activities $ 31.5 $ 41.5 $ 39.0 $ 36.8 $ 65.2 $ 40.6 $ 51.7 $ 418.9 $ 71.4 $ 50.6 $ 74.2 $ 153.2 $ 43.2 - Acquisitions - (7.8) - (1.9) (15.1) (1.1) - (349.7) - - - (70.0) (11.4) - / + Other 0.1 (0.3) (0.2) (0.2) - - - 1.4 - 1.5 3.3 - - - ME in A/P prior period (3.0) (3.0) (5.9) (6.0) (10.5) (3.8) (5.8) (7.4) (9.0) (5.7) (4.7) (11.8) (8.8) + ME in A/P current period 3.0 5.9 6.0 10.5 3.8 5.8 7.4 9.0 5.7 4.7 11.8 8.8 8.0 Accrual CAPEX $ 31.6 $ 36.3 $ 38.9 $ 39.2 $ 43.4 $ 41.5 $ 53.3 $ 72.2 $ 68.1 $ 51.1 $ 84.6 $ 80.2 $ 31.0 ACQUISITIONS Certain Intellamed Assets $ - $ - $ - $ - $ - $ - $ - $ (14.6) $ - $ - $ - $ - $ - UHS by Parent - - - - - - - (335.1) - - - - - Emergent, net of cash received - - - - - - - - - - - (58.5) - SLS, net of cash received (11.0) Other - (7.8) - (1.9) (15.1) (1.1) - - - - - (11.5) (0.4) Total Acquisitions $ - $ (7.8) $ - $ (1.9) $ (15.1) $ (1.1) $ - $ (349.7) $ - $ - $ - $ (70.0) $ (11.4) |