Attached files
| file | filename |
|---|---|
| EX-99.1 - EX-99.1 - PennyMac Mortgage Investment Trust | a12-17875_1ex99d1.htm |
| 8-K - 8-K - PennyMac Mortgage Investment Trust | a12-17875_18k.htm |
Exhibit 99.2
|
|
PennyMac Mortgage Investment Trust August 2, 2012 Second Quarter 2012 Earnings Report |

|
|
2Q12 Earnings Report 2 This presentation contains forward-looking statements within the meaning of Section 21E of the Securities Exchange Act of 1934, as amended, regarding management’s beliefs, estimates, projections and assumptions with respect to, among other things, the Company’s financial results, future operations, business plans and investment strategies, as well as industry and market conditions, all of which are subject to change. Words like “believe,” “expect,” “anticipate,” “promise,” “plan,” and other expressions or words of similar meanings, as well as future or conditional verbs such as “will,” “would,” “should,” “could,” or “may” are generally intended to identify forward-looking statements. Actual results and operations for any future period may vary materially from those projected herein, from past results discussed herein, or illustrative examples provided herein. Factors which could cause actual results to differ materially from historical results or those anticipated include, but are not limited to: changes in general business, economic, market and employment conditions from those expected; continued declines in residential real estate and disruption in the U.S. housing market; the availability of, and level of competition for, attractive risk-adjusted investment opportunities in residential mortgage loans and mortgage-related assets that satisfy our investment objectives and investment strategies; changes in our investment or operational objectives and strategies, including any new lines of business; the concentration of credit risks to which we are exposed; the availability, terms and deployment of short-term and long-term capital; unanticipated increases in financing and other costs, including a rise in interest rates; the performance, financial condition and liquidity of borrowers; increased rates of delinquency or decreased recovery rates on our investments; increased prepayments of the mortgage and other loans underlying our investments; changes in regulations or the occurrence of other events that impact the business, operation or prospects of government sponsored enterprises; changes in government support of homeownership; changes in governmental regulations, accounting treatment, tax rates and similar matters; and our ability to satisfy complex rules in order to qualify as a REIT for U.S. federal income tax purposes. You should not place undue reliance on any forward-looking statement and should consider all of the uncertainties and risks described above, as well as those more fully discussed in reports and other documents filed by the Company with the Securities and Exchange Commission from time to time. The Company undertakes no obligation to publicly update or revise any forward-looking statements or any other information contained herein, and the statements made in this presentation are current as of the date of this presentation only. Forward-Looking Statements |

|
|
2Q12 Earnings Report 3 Second Quarter 2012 Highlights Net Income of $29.6 million on revenue of $64.4 million Diluted EPS of $0.79 per share, dividend of $0.55 per share and ROAE of 17% Correspondent purchase volume increased to $3.4 billion in UPB, an increase of 88% from 1Q12 Conventional purchases of $1.8 billion, rising 79% from 1Q12 Purchased $402 million in unpaid principal balance (UPB) of distressed whole loan pools Nonperforming Loans: $224 million in UPB Re-performing Loans: $178 million in UPB Completed an offering in excess of 10 million shares of common stock in May, with net proceeds totaling $201 million |

|
|
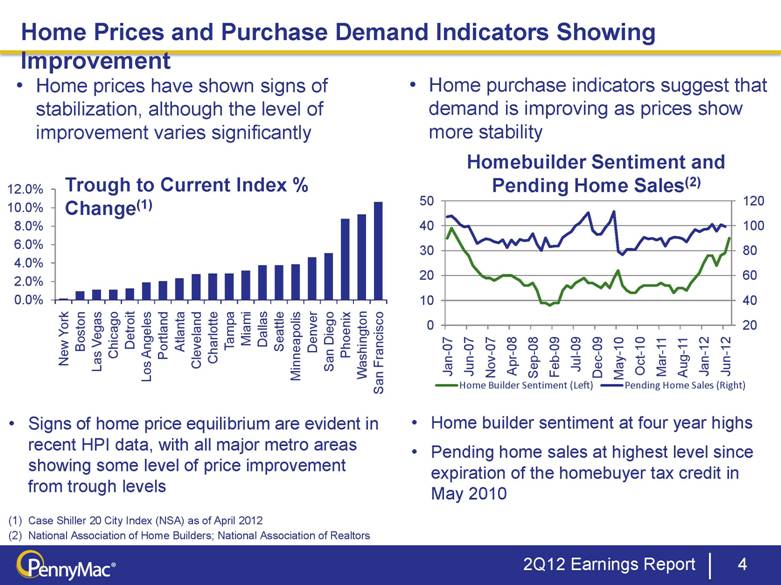
2Q12 Earnings Report 4 Home Prices and Purchase Demand Indicators Showing Improvement Signs of home price equilibrium are evident in recent HPI data, with all major metro areas showing some level of price improvement from trough levels Home builder sentiment at four year highs Pending home sales at highest level since expiration of the homebuyer tax credit in May 2010 Trough to Current Index % Change(1) Home prices have shown signs of stabilization, although the level of improvement varies significantly Homebuilder Sentiment and Pending Home Sales(2) Case Shiller 20 City Index (NSA) as of April 2012 National Association of Home Builders; National Association of Realtors Home purchase indicators suggest that demand is improving as prices show more stability |
|
|
2Q12 Earnings Report 5 Mortgage Origination Market Continues To Evolve Mortgage Originations(1) Estimate Actual Correspondent Market Share of Selected Banks(2) Banks have given up significant market share in correspondent Non-bank financial intermediaries offer competitive alternatives to banks Increased price stability is forecast to result in more purchase mortgage transactions as refinance activity declines Purchase originations are estimated to comprise more than half of total 2013 originations Last time this occurred was in 2006 2011 data source Inside Mortgage Finance; Estimates derived from average of Fannie Mae, Freddie Mac and the Mortgage Bankers Association forecasts as of June 2012 Inside Mortgage Finance – Market share data for JPM, C, BAC and Ally/GMAC Significant opportunities have emerged in the correspondent channel as market leading banks reduce or exit the channel $ in billions |

|
|
Focus on residential mortgage loans and the business of mortgage banking Complete end-to-end origination and servicing capabilities Growing correspondent business fuels growth of MSR servicing portfolio Leading specialty servicer; PMT is the only REIT participating in the distressed whole loan opportunity Infrastructure, operations and expertise, through our manager PCM and servicing and fulfillment provider PLS Actively pursuing bulk MSR acquisition opportunity; one of a few potential buyers with the capacity to add a large-sized transaction 2Q12 Earnings Report 6 PMT’s Distinctive Business Model Focused On Long-term Value |
|
|
Financial Results |

|
|
2Q12 Earnings Report 8 Income Statement Overview (Unaudited) Drivers Net gain on investments rose Q/Q as a result of strong liquidation activity and improved loan attributes Net gain on loans acquired for sale increased 35% Q/Q Servicing income was impacted by increased prepayment expectations as a result of declining mortgage rates Interest income declined 3% Q/Q, on lower Modification activity Expenses increased Q/Q , primarily due to higher volumes of correspondent purchases and increased liquidation activity Quarter Ended Q/Q ($ in thousands, except per share data) June 30, 2012 March 31, 2012 % Change Investment Income Net gain (loss) on investments (1) 30,563 $ 15,205 $ 101% Interest Income 16,002 16,425 -3% Net gain on mortgage loans acquired for sale 18,046 13,370 35% Net servicing fees (855) 197 n.m. Other 650 1,452 -55% Net Investment Income 64,406 46,649 38% Total Expenses 26,431 22,074 20% Pretax Income 37,975 24,575 55% Provision for income tax 8,406 5,517 52% Net Income 29,569 $ 19,058 $ 55% Diluted EPS 0.79 $ 0.65 $ 22% (1) Includes results of real estate acquired in settlement of loans |

|
|
2Q12 Earnings Report 9 Solid Growth In Mortgage Assets and Net Investment Income Mortgage assets rose 42% Q/Q, driven by four distressed loan pool acquisitions and increase in mortgage loans held for sale at quarter end The MSR asset increased 77% Q/Q to $33 million ($ in millions) Increased activity in REO sales and short sales drove strong liquidation performance, which resulted in solid investment returns Correspondent lending conventional loan sales rose 42% Q/Q Net Investment Income Mortgage Assets Three months ended |

|
|
2Q12 Earnings Report 10 Investment Activities Produce Record Pretax Income in 2Q12 Investment Activities pretax income increased 82% from 1Q12 Liquidation activity increased 28% Q/Q(1) Loan valuations rise a result of improving loan attributes and a net increase in home prices Interest income declined 6% Q/Q, resulting from a decline in modification activity Expenses increased 13% Q/Q, as a result of higher loss mitigation, liquidation and due diligence activities Investment Activities Segment Pretax Income Based on Unpaid Principal Balance of loans liquidated, which include short sales, payoffs and 3rd party foreclosure sales (Unaudited) Quarter ended ($ in thousands) June 30, 2012 March 31, 2012 Revenues: Net gain on investments 27,992 $ 11,488 $ Interest income 12,881 13,649 Other income 1,783 3,905 Total revenues 42,656 29,042 Expenses: Interest 5,071 5,747 Servicing 5,006 4,889 Other 6,621 4,132 Total expenses 16,698 14,768 Pre-tax income 25,958 $ 14,274 $ |

|
|
2Q12 Earnings Report 11 Correspondent Lending Segment Pretax Income Rises in 2Q12 Correspondent segment pretax income rose 17% Q/Q, on higher net gain on mortgage loans acquired for sale Lock volumes reached $4.6 billion, a 94% Q/Q increase Conventional loan sales rose 43% Q/Q Margins remain healthy, but tightened modestly from 1Q12 levels Loan fulfillment fees are commensurate with increased loan sales activity Jumbo loan sales total $5.4 million Product is still an area of focus, but current market volume is small Correspondent Lending Segment Pretax Income (Unaudited) Quarter ended ($ in thousands) June 30, 2012 March 31, 2012 Revenues: Interest income 3,178 $ 2,792 $ Net gain on mortgage loans acquired for sale 18,046 13,370 Other income 583 1,461 Total revenues 21,807 17,623 Expenses: Interest 1,689 943 Servicing 30 47 Loan fulfillment fees 7,715 6,124 Other 356 208 Total expenses 9,790 7,322 Pre-tax income 12,017 $ 10,301 $ |

|
|
2Q12 Earnings Report 12 MSR Capitalization Rates On New Production in 2Q12 The average capitalization rate on new conventional mortgage servicing rights was 110 bps in 2Q12 MSRs booked in the current environment have an inherently lower risk of prepayment due to low rates on the underlying mortgage Valuations encompass a variety of variables including the prevailing market conditions, production mix, secondary market execution, and the level of excess servicing retained PMT’s valuations are compared to third party surveys and competitor research for independent verification of “reasonableness” New Production MSR Valuation Metrics: Conventional Loan Purchases Quarter Ended 2Q12 New Production MSR Valuation June 30, 2012 UPB of Loans Sold ($ in millions) $1,537 Weighted Average Servicing Fee 25.2 bps Capitalization Rate 1.10% Multiple 4.37 Weighted Average Coupon 4.02% |

|
|
Loans serviced for others grew 91% Q/Q driven by the solid growth in correspondent loan purchases Net loan servicing fees incurred an $855K loss, primarily due to MSR valuation adjustments Resulted from higher prepayment assumptions driven by falling mortgage rates Mortgage rates declined 33bps in 2Q12(1), ending the quarter near all-time historic low levels The majority of PMT’s MSR asset is carried at the lower of amortized cost or fair market value (amortization method) Impairment is provisioned to a valuation allowance account and may be reversible as rates rise The recoverable amount is the balance of the valuation allowance and benefits earnings in the period of recovery MSRs are currently not hedged 2Q12 Earnings Report 13 Servicing Portfolio Continues to Grow; MSRs Impacted By Lower Rates Third Party Servicing Portfolio and MSR Asset Net Loan Servicing Fees(2) Source: Freddie Mac Primary Mortgage Market Survey A component of the investment activities segment income Quarter ended ($ in thousands) June 30, 2012 Servicing Fees 1,757 $ Effect of MSRs: Amortization (655) Provision for impairment of MSRs carried at lower of amortized cost or fair value (1,517) Change in fair value of MSRs carried at fair value (440) (2,612) Net loan servicing fees (855) $ Multiple on total portfolio of loans serviced for others 4.32 |

|
|
Investment Activities |

|
|
15 Market For Distressed Mortgage Loans Flow of distressed whole loan deals available for review in 2Q12 was strong We anticipate that the flow of deals will be consistent for next twelve months and possibly longer We expect the pipeline for potential distressed loan acquisitions to be $15-$20 billion over the next 12 months New sellers of distressed whole loan pools are anticipated to come to market incrementally over time Removal of AG/DOJ settlement overhang and desire to reduce risk-weighted assets are motivating distressed loan sales by large banks Pricing in current market reflects a strong demand and a more optimistic view of home price stabilization 2Q12 Earnings Report |
|
|
16 Distressed Mortgage Investments Whole loan acquisitions totaled $402 million in UPB in 2Q12 Largest quarterly purchase of distressed loan pools since 1Q11 Purchased pools were both nonperforming and reperforming loans Nonperforming loans: UPB acquired – $224 million Current – 5% 90+ days delinquent and foreclosure – 89% Reperforming loans: UPB acquired – $178 million Current – 88% 90+ days delinquent and foreclosure – 0.8% Whole Loan Acquisitions ($ in millions) Reperforming Loan Strategy Purchase modified loans at discount Review for modification/principal reduction Establish dialog with borrower Liquidation through refinancing or securitization 2Q12 Earnings Report Hold to maturity |

|
|
2Q12 Earnings Report 17 PMT Loan Portfolio Liquidation Activity Rose On Strong REO Sales Loan portfolio liquidations rise 24% Q/Q REO sales comprised 48% of liquidations, increasing 19% Q/Q Solid demand, with multiple offers Assets sold at foreclosure auctions doubled quarter-over-quarter, implying greater strength in national home prices Negative equity refinances increased for the third consecutive quarter Provides net benefit to the borrower and investor Dedicating additional resources to further this liquidation outcome Liquidation activities generate significant cash flows Loan Investment Portfolio Activity Sales UPB ($ in millions) Beginning balance as of March 31, 2012: $1,612.0 Purchased Portfolios (settled during the quarter) 402.5 Quarterly Activities: REO Sales (72.3) Loan Principal Payments & Adjustments (3.4) Loan Liquidations (79.6) Total Activities: (155.2) Ending Balance as of June 30, 2012 $1,859.6 PMT Portfolio |

|
|
18 Market for Foreclosure and REO Properties Improved in 2Q12 Sales of REO and Foreclosures to Third Parties increased in 2Q12 Third Party foreclosure sales doubled as buyers more readily met our reserve price Demand for foreclosure properties from investors and first-time home buyers has been strong Third party data indicate that the bulk of recent price improvement has been in the lower-tier price point(1) Inventory of homes for sale is tight in many markets, resulting in increased prices, but sales activity is slowing as a result Lack of inventory is also a key factor in driving sales activity in REO and Foreclosures 2Q12 Earnings Report PMT REO Sales and Third Party Foreclosure Sales National Months Inventory of Existing Homes(1) +29% National Association of Realtors |

|
|
Portfolio Acquisitions Are Progressing in Line With Expectations 2Q12 Earnings Report 19 (1) Ratio of unpaid principal balance remaining to unpaid principal balance at acquisition Purchase 2Q12 Purchase 2Q12 Purchase 2Q12 Purchase 2Q12 Balance ($mm) 182.7 $ 85.2 Balance ($mm) 195.5 $ 82.9 Balance ($mm) 146.2 $ 65.8 Balance ($mm) 277.8 $ 176.4 Pool Factor(1) 1.00 0.47 Pool Factor(1) 1.00 0.42 Pool Factor(1) 1.00 0.45 Pool Factor(1) 1.00 0.63 Current 6.2% 26.9% Current 5.1% 29.3% Current 1.2% 23.2% Current 5.0% 29.6% 30 1.6% 6.9% 30 2.0% 4.4% 30 0.4% 4.3% 30 4.0% 6.7% 60 5.8% 5.8% 60 4.1% 3.5% 60 1.3% 4.4% 60 5.1% 3.7% 90+ 37.8% 11.2% 90+ 42.8% 9.8% 90+ 38.2% 13.7% 90+ 26.8% 10.0% FC 46.4% 41.1% FC 45.9% 40.7% FC 58.9% 39.7% FC 59.1% 41.4% REO 2.3% 8.1% REO 0.0% 12.2% REO 0.0% 14.7% REO 0.0% 8.6% Purchase 2Q12 Purchase 2Q12 Purchase 2Q12 Purchase 2Q12 Balance ($mm) 515.1 $ 379.7 Balance ($mm) 259.8 $ 209.7 Balance ($mm) 542.6 $ 381.7 Balance ($mm) 49.0 $ 46.0 Pool Factor(1) 1.00 0.74 Pool Factor(1) 1.00 0.81 Pool Factor(1) 1.00 0.70 Pool Factor(1) 1.00 0.94 Current 2.0% 24.9% Current 11.5% 28.4% Current 0.6% 8.2% Current 0.2% 1.4% 30 1.9% 4.1% 30 6.5% 5.6% 30 1.3% 2.2% 30 0.1% 0.1% 60 3.9% 1.9% 60 5.2% 3.7% 60 2.0% 1.5% 60 0.2% 0.1% 90+ 25.9% 11.5% 90+ 31.2% 11.8% 90+ 22.6% 13.6% 90+ 70.4% 54.5% FC 66.3% 46.5% FC 43.9% 40.1% FC 73.0% 61.5% FC 29.0% 42.0% REO 0.0% 11.1% REO 1.7% 10.4% REO 0.4% 12.9% REO 0.0% 1.9% 1Q10 2Q10 3Q10 4Q10 1Q11 2Q11 3Q11 4Q11 |

|
|
Correspondent Lending |

|
|
PMT Is Capitalizing On The Significant Opportunity in Correspondent Significant transformation occurring in the correspondent channel New focus on retail channel originations and the capital treatment of MSRs under Basel III has caused many banks to reduce their presence or exit the channel PMT is capitalizing on this opportunity with a differentiated approach Selective, client-focused model that values business partners and growth through deepening relationships Expanding footprint with opening of Tampa operations(3) Drive for excellence in customer service, fulfillment timelines and issue resolution Knowledgeable and experienced correspondent leadership team at PLS Source: Inside Mortgage Finance and company estimates Excludes Streamline Refinances Operational activities conducted by PLS, PMT’s servicer and fulfillment provider 2Q12 Earnings Report 21 Key Metrics Q212 Purchase Volume (UPB): $3.4 Bn Conventional $1.8 Bn FHA $1.6 Bn Jumbo $2.6 Mn #11 Correspondent purchaser in 1Q12 (1) CLG Business Partners 117 Net Worth > $10 million 66 CLG Employees Moorpark Operations 177 Tampa Operations 40 Credit Conventional FHA WA FICO 764 711 WA DTI (2) 33 40 % Purchase (2) 39% 69% % CA 44% 44% (1) (2) (3) |

|
|
Purchases totaled $3.4 billion in 2Q12, up 88% vs. 1Q12 and the fourth consecutive quarter of greater than 80% quarter over quarter growth July volume: Purchases of $1.7 billion, Locks of $2.4 billion Correspondent Purchases and Lock Volumes (UPB) 2Q12 Earnings Report 22 Correspondent Delivers Continued Growth (1) For FHA/VA, PMT earns a sourcing fee and interest income for its holding period (1) |

|
|
Growth Strategy 2Q12 Earnings Report 23 Operations(1) Correspondent Partners Product Development Variable cost structure allows for greater flexibility and scale Ongoing enhancement to fulfillment capabilities and systems to drive increased efficiencies and lower costs Data integrity and asset quality Growth through deepening relationships Selectively acquire new partners Strategically manage client group to maintain high quality service levels Expand product menu while balancing risk and return all within FHA and GSE guidelines Continue to develop Warehouse Lending Business (currently in beta testing period) Target of $1 billion in purchases per month by quarter end achieved early in May Targeting $2 billion in purchases per month by the end of Q3 and prepared to continue growing volume as returns dictate Tampa operations facility expands geographic footprint in the Eastern U.S. Operational activities conducted by PLS, PMT’s servicer and fulfillment provider |

|
|
Key Takeaways |

|
|
Key Takeaways 2Q12 Earnings Report 25 PMT’s business model and strong operational execution deliver solid results Investment Activities and Correspondent Lending deliver record pretax earnings Growth in correspondent purchase volume and the servicing portfolio continues Increased liquidation activity drives higher portfolio returns Significant opportunities in the current mortgage market Distressed Mortgage Assets Correspondent purchases Bulk MSR acquisitions PMT’s strong performance, growth, and strategic positioning ensure it is well positioned to capitalize on the growing opportunities across the mortgage market |
