Attached files
| file | filename |
|---|---|
| 8-K - 8-K - KAPSTONE PAPER & PACKAGING CORP | a12-17201_18k.htm |
| EX-99.1 - EX-99.1 - KAPSTONE PAPER & PACKAGING CORP | a12-17201_1ex99d1.htm |
Exhibit 99.2
|
|
2012 Second Quarter Financial Highlights Roger W. Stone Chairman and Chief Executive Officer Andrea K. Tarbox Vice President and Chief Financial Officer August 1, 2012 |

|
|
Forward Looking Statements The information in this presentation and statements made during this presentation may contain certain forward-looking statements within the meaning of federal securities laws. These statements reflect management’s expectations regarding future events and operating performance. These forward-looking statements involve a number of risks and uncertainties. A list of the factors that could cause actual results to differ materially from those expressed in, or underlying, any forward-looking statements can be found in the Company’s filings with the Securities and Exchange Commission, such as its annual and quarterly reports. The Company disclaims any obligation to revise or update such statements to reflect the occurrence of events after the date of this presentation. This presentation refers to non-U.S. GAAP financial information. A reconciliation of those numbers to U.S. GAAP financial measures is available on the company’s website at KapStonePaper.com under Investors. Forward-Looking Statements Non-GAAP Financial Measures Risk Factors 2 |
|
|
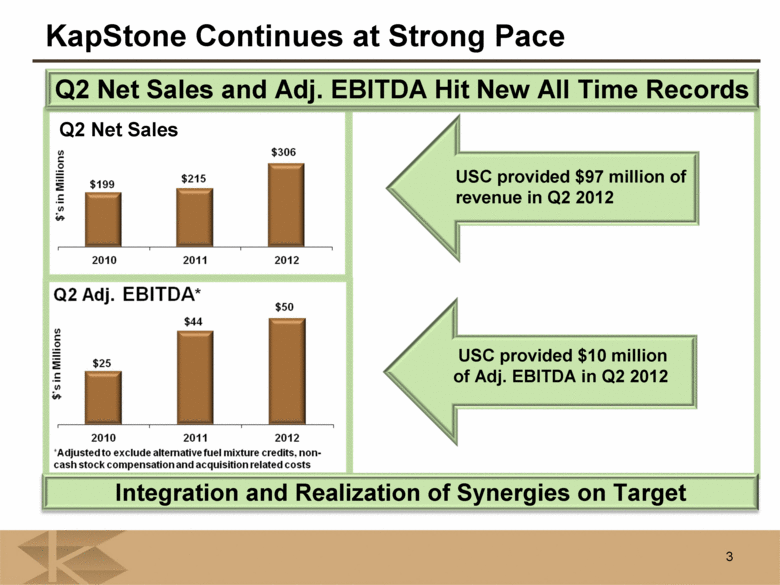
3 Q2 Net Sales and Adj. EBITDA Hit New All Time Records Q2 Net Sales KapStone Continues at Strong Pace USC provided $97 million of revenue in Q2 2012 USC provided $10 million of Adj. EBITDA in Q2 2012 Integration and Realization of Synergies on Target $’s in Millions Q2 Adj. EBITDA* $’s in Millions * Adjusted to exclude alternative fuel mixture credits, non-cash stock compensation and acquisition related costs. |
|
|
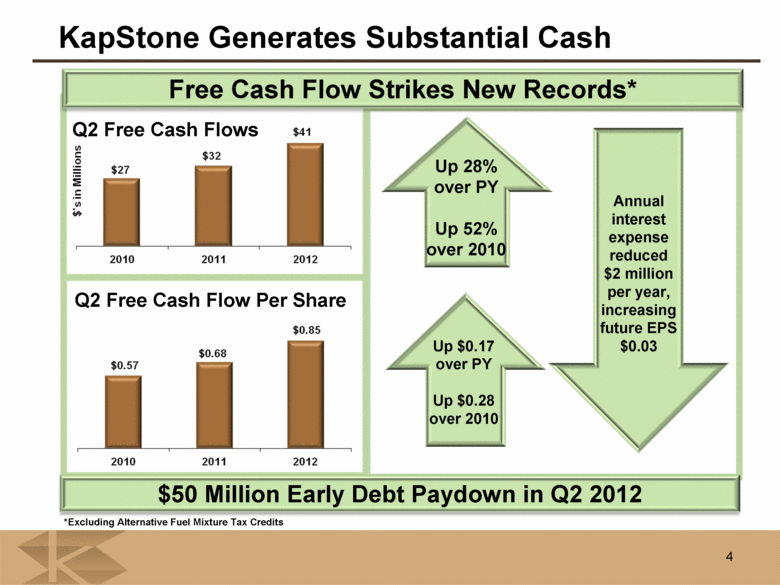
4 Free Cash Flow Strikes New Records* Q2 Free Cash Flows Q2 Free Cash Flow Per Share KapStone Generates Substantial Cash Up 28% over PY Up 52% over 2010 $50 Million Early Debt Paydown in Q2 2012 Up $0.17 over PY Up $0.28 over 2010 *Excluding Alternative Fuel Mixture Tax Credits Annual interest expense reduced $2 million per year, increasing future EPS $0.03 |
|
|
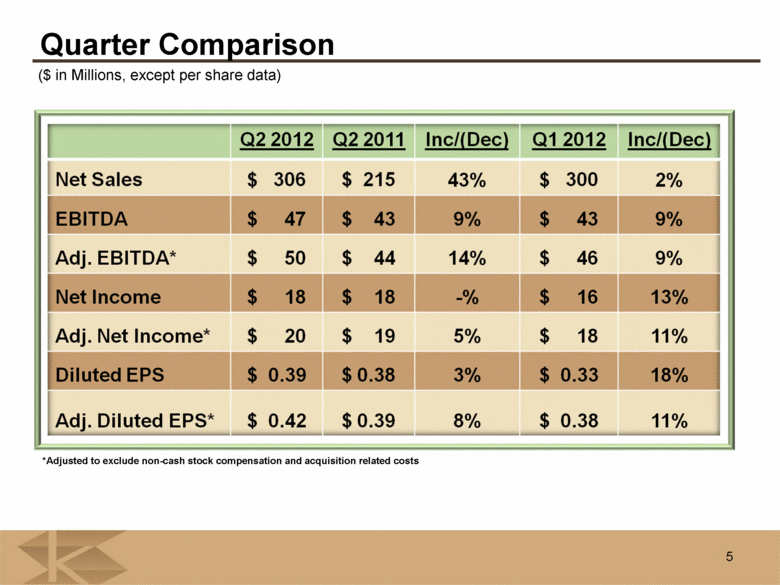
Quarter Comparison 5 *Adjusted to exclude non-cash stock compensation and acquisition related costs ($ in Millions, except per share data) Q2 2012 Q2 2011 Inc/(Dec) Q1 2012 Inc/(Dec) Net Sales $ 306 $ 215 43% $ 300 2% EBITDA $ 47 $ 43 9% $ 43 9% Adj. EBITDA* $ 50 $ 44 14% $ 46 9% Net Income $ 18 $ 18 -% $ 16 13% Adj. Net Income* $ 20 $ 19 5% $ 18 11% Diluted EPS $ 0.39 $ 0.38 3% $ 0.33 18% Adj. Diluted EPS* $ 0.42 $ 0.39 8% $ 0.38 11% |
|
|
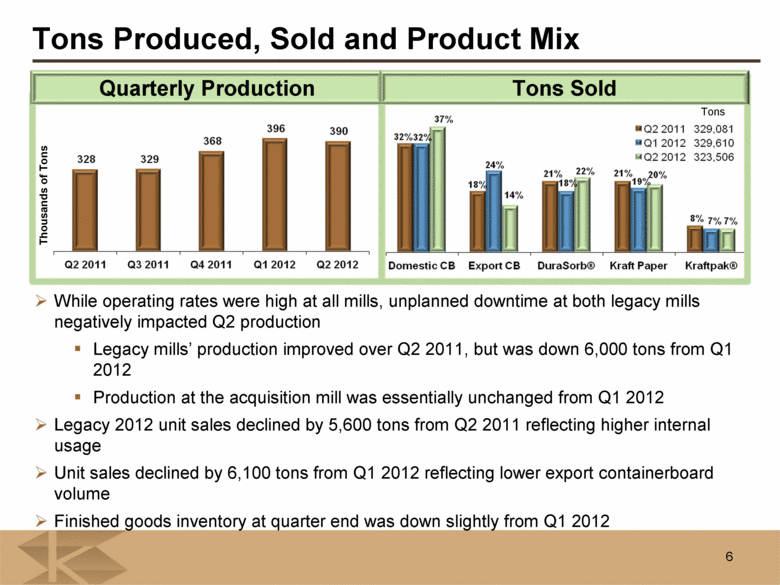
6 Thousands of Tons Tons Produced, Sold and Product Mix While operating rates were high at all mills, unplanned downtime at both legacy mills negatively impacted Q2 production Legacy mills’ production improved over Q2 2011, but was down 6,000 tons from Q1 2012 Production at the acquisition mill was essentially unchanged from Q1 2012 Legacy 2012 unit sales declined by 5,600 tons from Q2 2011 reflecting higher internal usage Unit sales declined by 6,100 tons from Q1 2012 reflecting lower export containerboard volume Finished goods inventory at quarter end was down slightly from Q1 2012 Quarterly Production Tons Tons Sold |
|
|
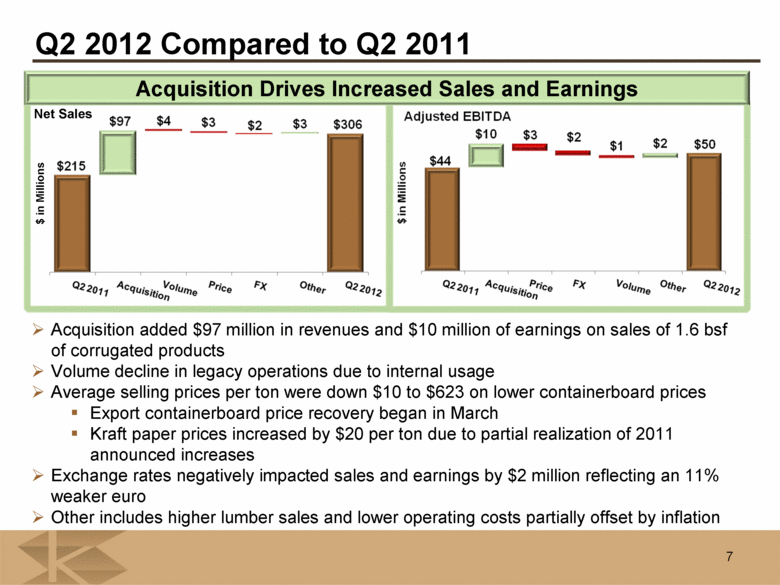
Acquisition Drives Increased Sales and Earnings 7 Q2 2012 Compared to Q2 2011 Acquisition added $97 million in revenues and $10 million of earnings on sales of 1.6 bsf of corrugated products Volume decline in legacy operations due to internal usage Average selling prices per ton were down $10 to $623 on lower containerboard prices Export containerboard price recovery began in March Kraft paper prices increased by $20 per ton due to partial realization of 2011 announced increases Exchange rates negatively impacted sales and earnings by $2 million reflecting an 11% weaker euro Other includes higher lumber sales and lower operating costs partially offset by inflation Net Sales $ in Millions Adjusted EBITDA $’s in Millions |
|
|
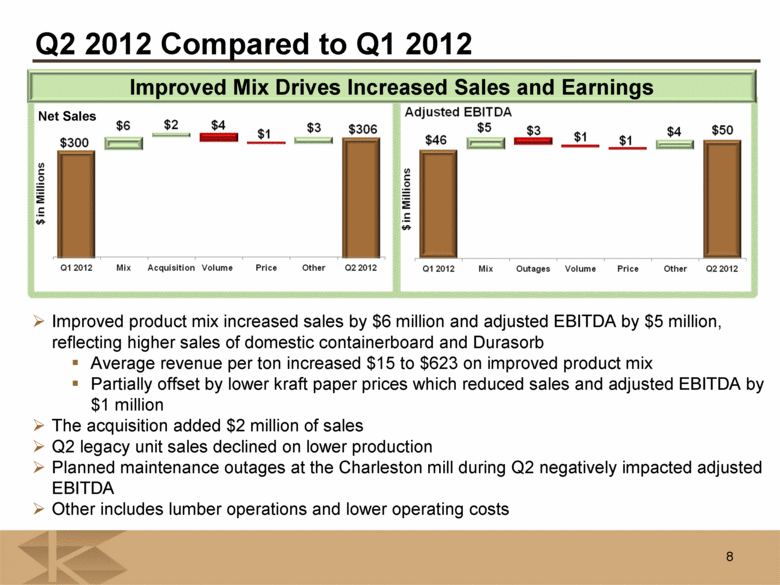
Improved Mix Drives Increased Sales and Earnings 8 Q2 2012 Compared to Q1 2012 Improved product mix increased sales by $6 million and adjusted EBITDA by $5 million, reflecting higher sales of domestic containerboard and Durasorb Average revenue per ton increased $15 to $623 on improved product mix Partially offset by lower kraft paper prices which reduced sales and adjusted EBITDA by $1 million The acquisition added $2 million of sales Q2 legacy unit sales declined on lower production Planned maintenance outages at the Charleston mill during Q2 negatively impacted adjusted EBITDA Other includes lumber operations and lower operating costs Net Sales $’s in Millions Adjusted EBITDA $’s in Millions |
|
|
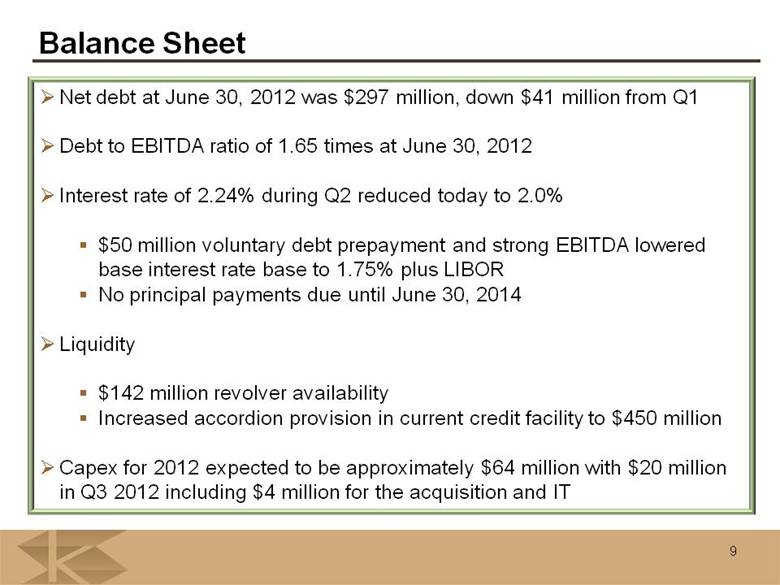
9 Balance Sheet Net debt at June 30, 2012 was $297 million, down $41 million from Q1 Debt to EBITDA ratio of 1.65 times at June 30, 2012 Interest rate of 2.24% during Q2 reduced today to 2.0% $50 million voluntary debt prepayment and strong EBITDA lowered base interest rate base to 1.75% plus LIBOR No principal payments due until June 30, 2014 Liquidity $142 million revolver availability Increased accordion provision in current credit facility to $450 million Capex for 2012 expected to be approximately $64 million with $20 million in Q3 2012 including $4 million for the acquisition and IT |
|
|
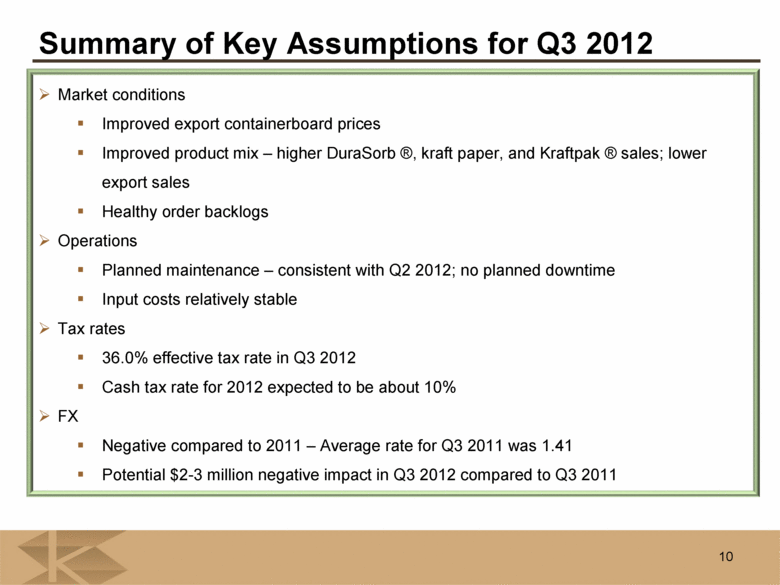
Summary of Key Assumptions for Q3 2012 Market conditions Improved export containerboard prices Improved product mix – higher DuraSorb ®, kraft paper, and Kraftpak ® sales; lower export sales Healthy order backlogs Operations Planned maintenance – consistent with Q2 2012; no planned downtime Input costs relatively stable Tax rates 36.0% effective tax rate in Q3 2012 Cash tax rate for 2012 expected to be about 10% FX Negative compared to 2011 – Average rate for Q3 2011 was 1.41 Potential $2-3 million negative impact in Q3 2012 compared to Q3 2011 10 |