Attached files
| file | filename |
|---|---|
| 8-K - FORM 8-K - BNC BANCORP | v319894_8k.htm |
This presentation contains forward - looking statements relating to the financial condition, results of operations and business of BNC Bancorp and its subsidiary Bank of North Carolina . These forward - looking statements involve risks and uncertainties and are based on the beliefs and assumptions of the management of BNC Bancorp, and the information available to management at the time that this presentation was prepared . Factors that could cause actual results to differ materially from those contemplated by such forward - looking statements include, among others, the following : (i) general economic or business conditions, either nationally or regionally, may be less favorable than expected, resulting in, among other things, a deterioration in credit quality and/or a reduced demand for credit or other services ; (ii) changes in the interest rate environment may reduce net interest margins and/or the volumes and values of loans made or held as well as the value of other financial assets held ; (iii) competitive pressures among depository and other financial institutions may increase significantly ; (iv) legislative or regulatory changes, including changes in accounting standards, may adversely affect the businesses in which BNC Bancorp is engaged ; (v) local, state or federal taxing authorities may take tax positions that are adverse to BNC Bancorp ; (vi) adverse changes may occur in the securities markets ; (vii) competitors of BNC Bancorp may have greater financial resources and develop products that enable them to compete more successfully than BNC Bancorp ; (viii) costs or difficulties related to the integration of Beach First National Bank, Regent Bank of SC, Blue Ridge Savings Bank, KeySource Financial, Carolina Federal Savings Bank, or First Trust Bank may be greater than expected ; (ix) expected cost savings associated with our acquisition of these three banks may not be fully realized or realized within the expected time frame ; and (x) deposit attrition, customer loss or revenue loss following our acquisitions of Beach First, Regent, Blue Ridge, Carolina Federal, KeySource, or First Trust may be greater than expected . Additional factors affecting BNC Bancorp and Bank of North Carolina are discussed in BNC Bancorp’s filings with the Securities and Exchange Commission (the “SEC”), Annual Report on Form 10 - K, its Quarterly Reports on Form 10 - Q and its Current Reports on Form 8 - K . Please refer to the Securities and Exchange Commission’s website at www . sec . gov where you can review those documents . BNC Bancorp does not undertake a duty to update any forward - looking statements made during this presentation . 2
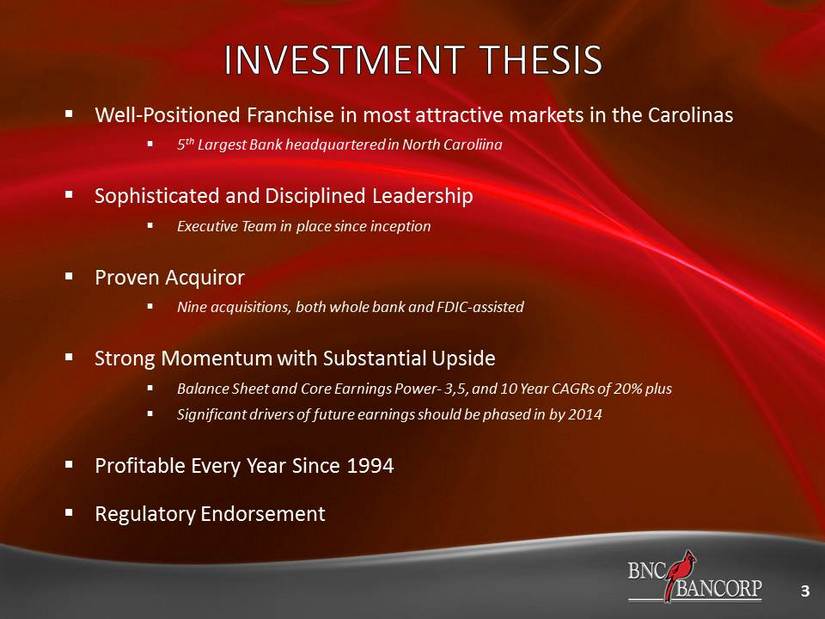
▪ Well - Positioned Franchise in most attractive markets in the Carolinas ▪ 5 th Largest Bank headquartered in North Caroliina ▪ Sophisticated and Disciplined Leadership ▪ Executive Team in place since inception ▪ Proven Acquiror ▪ Nine acquisitions, both whole bank and FDIC - assisted ▪ Strong Momentum with Substantial Upside ▪ Balance Sheet and Core Earnings Power - 3,5, and 10 Year CAGRs of 20% plus ▪ Significant drivers of future earnings should be phased in by 2014 ▪ Profitable Every Year Since 1994 ▪ Regulatory Endorsement 3
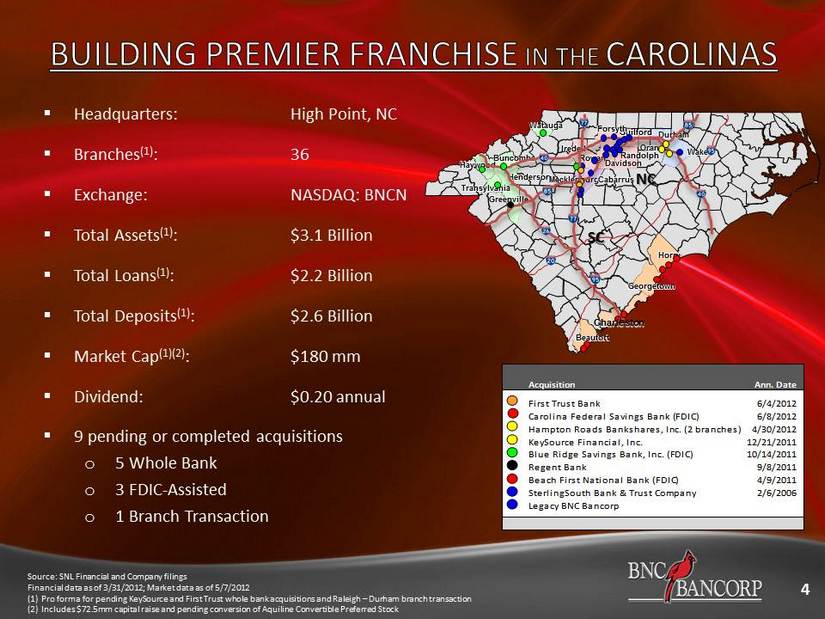
4 Greenville Greenville Greenville Greenville Greenville Greenville Greenville Greenville Greenville Haywood Haywood Haywood Haywood Haywood Haywood Haywood Haywood Haywood Buncombe Buncombe Buncombe Buncombe Buncombe Buncombe Buncombe Buncombe Buncombe Transylvania Transylvania Transylvania Transylvania Transylvania Transylvania Transylvania Transylvania Transylvania Henderson Henderson Henderson Henderson Henderson Henderson Henderson Henderson Henderson Watauga Watauga Watauga Watauga Watauga Watauga Watauga Watauga Watauga Mecklenburg Mecklenburg Mecklenburg Mecklenburg Mecklenburg Mecklenburg Mecklenburg Mecklenburg Mecklenburg Cabarrus Cabarrus Cabarrus Cabarrus Cabarrus Cabarrus Cabarrus Cabarrus Cabarrus Iredell Iredell Iredell Iredell Iredell Iredell Iredell Iredell Iredell Rowan Rowan Rowan Rowan Rowan Rowan Rowan Rowan Rowan Davidson Davidson Davidson Davidson Davidson Davidson Davidson Davidson Davidson Randolph Randolph Randolph Randolph Randolph Randolph Randolph Randolph Randolph Guilford Guilford Guilford Guilford Guilford Guilford Guilford Guilford Guilford Forsyth Forsyth Forsyth Forsyth Forsyth Forsyth Forsyth Forsyth Forsyth Durham Durham Durham Durham Durham Durham Durham Durham Durham Wake Wake Wake Wake Wake Wake Wake Wake Wake Georgetown Georgetown Georgetown Georgetown Georgetown Georgetown Georgetown Georgetown Georgetown Orange Orange Orange Orange Orange Orange Orange Orange Orange Beaufort Beaufort Beaufort Beaufort Beaufort Beaufort Beaufort Beaufort Beaufort Horry Horry Horry Horry Horry Horry Horry Horry Horry NC SC Charleston Acquisition Ann. Date First Trust Bank 6/4/2012 Carolina Federal Savings Bank (FDIC) 6/8/2012 Hampton Roads Bankshares, Inc. (2 branches) 4/30/2012 KeySource Financial, Inc. 12/21/2011 Blue Ridge Savings Bank, Inc. (FDIC) 10/14/2011 Regent Bank 9/8/2011 Beach First National Bank (FDIC) 4/9/2011 SterlingSouth Bank & Trust Company 2/6/2006 Legacy BNC Bancorp ▪ Headquarters: High Point , NC ▪ Branches (1) : 36 ▪ Exchange: NASDAQ: BNCN ▪ Total Assets (1) : $3.1 Billion ▪ Total Loans (1) : $2.2 Billion ▪ Total Deposits (1) : $2.6 Billion ▪ Market Cap (1)(2) : $180 mm ▪ Dividend: $0.20 annual ▪ 9 pending or completed acquisitions o 5 Whole Bank o 3 FDIC - Assisted o 1 Branch Transaction Source: SNL Financial and Company filings Financial data as of 3/31/2012; Market data as of 5/7/2012 (1) P ro forma for pending KeySource and First Trust whole bank acquisitions and Raleigh – Durham branch transaction (2) Includes $72.5mm capital raise and pending conversion of Aquiline Convertible Preferred Stock

5 Regent Blue Ridge KeySource Chapel Hill & Cary Branches First Trust Bank Carolina Federal Savings Bank Deal Type: Whole Bank FDIC Whole Bank Branch Whole Bank FDIC Announce Date: 9/8/2011 10/14/2011 12/21/2011 4/30/2012 06/04/2011 6/12/2012 Status: Completed Completed Pending Pending Pending Completed Integration: Completed Completed Conversion 09/14/2012 Conversion 09/21/2012 Conversion 02/5/2013 Conversion 11/03/2012 Headquarters: Greenville, SC Asheville, NC Durham, NC Cary, NC Chapel Hill, NC Charlotte, NC Charleston, SC Deal Value ($mm): $9.8 FDIC $12.2 Branch $36.0 FDIC Price / TBV (%): 124% FDIC 60% Branch 72% FDIC Consideration: 100% Cash FDIC 100% Stock 100% Cash 70% Stock FDIC Bargain Purchase Gain ($mm): – $7.8 – – – $7.7 Strategic Rationale: • Access to attractive Greenville, SC market • Clean balance sheet with loan portfolio underwritten post credit crisis • Accretive to EPS • Solid core deposit base. Good deposit growth • Accretive to EPS and TBV • Significant cost efficiencies • Loss - share agreement minimized risk • Dramatically increased Triangle presence • Accretive to EPS and capital • Attractive financial return • Further expansion in Raleigh - Durham, NC • Complemented new lending team in Cary, NC • Dramatically increased Charlotte presence • Accretive to EPS • Low loan to core deposit ratio • Attractive financial return • Very attractive financial transaction • Problem loans carved out of bid • Strategic fit to coastal SC franchise • Accretive to EPS and TBV Source: SNL Financial Note: Target financial data at announcement for whole bank transactions excludes purchase accounting; Total assets and deposi ts acquired for FDIC deals

Greenville Greenville Greenville Greenville Greenville Greenville Greenville Greenville Greenville Haywood Haywood Haywood Haywood Haywood Haywood Haywood Haywood Haywood Buncombe Buncombe Buncombe Buncombe Buncombe Buncombe Buncombe Buncombe Buncombe Transylvania Transylvania Transylvania Transylvania Transylvania Transylvania Transylvania Transylvania Transylvania Henderson Henderson Henderson Henderson Henderson Henderson Henderson Henderson Henderson Watauga Watauga Watauga Watauga Watauga Watauga Watauga Watauga Watauga Mecklenburg Mecklenburg Mecklenburg Mecklenburg Mecklenburg Mecklenburg Mecklenburg Mecklenburg Mecklenburg Cabarrus Cabarrus Cabarrus Cabarrus Cabarrus Cabarrus Cabarrus Cabarrus Cabarrus Iredell Iredell Iredell Iredell Iredell Iredell Iredell Iredell Iredell Rowan Rowan Rowan Rowan Rowan Rowan Rowan Rowan Rowan Davidson Davidson Davidson Davidson Davidson Davidson Davidson Davidson Davidson Randolph Randolph Randolph Randolph Randolph Randolph Randolph Randolph Randolph Guilford Guilford Guilford Guilford Guilford Guilford Guilford Guilford Guilford Forsyth Forsyth Forsyth Forsyth Forsyth Forsyth Forsyth Forsyth Forsyth Durham Durham Durham Durham Durham Durham Durham Durham Durham Wake Wake Wake Wake Wake Wake Wake Wake Wake Georgetown Georgetown Georgetown Georgetown Georgetown Georgetown Georgetown Georgetown Georgetown Orange Orange Orange Orange Orange Orange Orange Orange Orange Beaufort Beaufort Beaufort Beaufort Beaufort Beaufort Beaufort Beaufort Beaufort Horry Horry Horry Horry Horry Horry Horry Horry Horry 6 Source: SNL Financial and MapInfo Loan data as of 6/30/2012 per Company management NC SC Charleston Western Carolinas - Asheville Branches Loans Deposits 6 122,000 165 ,000 Piedmont Triad - Greensboro Branches Loans Deposits 12 7 80,000 1,302 ,000 Raleigh - Durham Branches Loans Deposits 4 222,000 230 ,000 Coastal South Carolina Branches Loans Deposits 8 296,000 351 ,000 Charlotte Branches Loans Deposits 8 683,000 631 ,000 5.78% 3.42% 0.00% 2.00% 4.00% 6.00% 8.00% BNCN Nation Projected Population Growth 2011 - 2016 (%)

7 Triad 2.0% Metro - Charlotte 2.0% Raleigh - Durham 2.0% Coastal SC 3.0% Western NC and SC 3.0% Triad 2.25% Metro - Charlotte 4.25% Raleigh - Durham 3.5% Coastal SC (2.0%) Western NC and SC 1.0% TOTAL DEPOSITS 12.0% TOTAL LOANS 9.0% Regional Deposit Growth Contribution Goals Regional Loan Growth Contribution Goals REGIONS COMPLIMENT AND CREATE A BALANCED FRANCHISE High Growth No Growth Med Growth
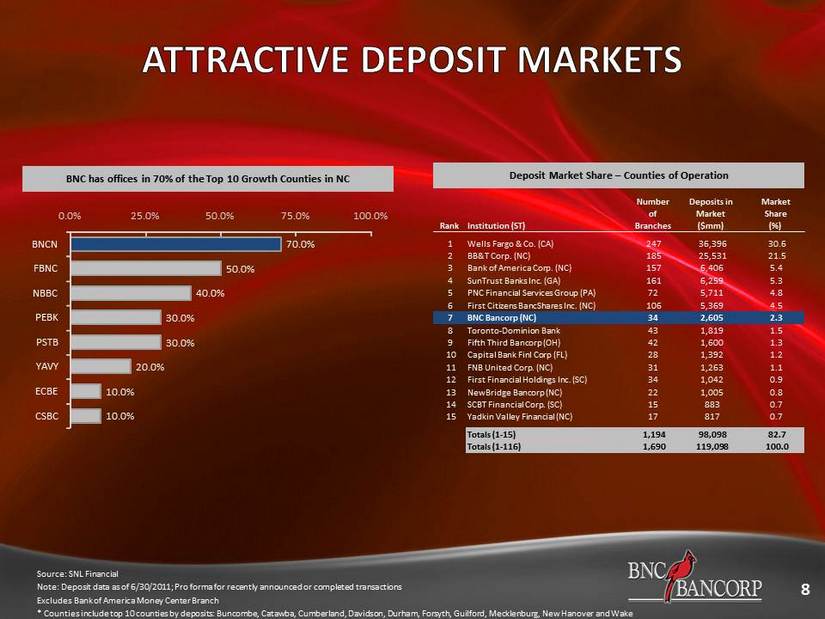
8 Source: SNL Financial Note: Deposit data as of 6/30/2011; Pro forma for recently announced or completed transactions Excludes Bank of America Money Center Branch * Counties include top 10 counties by deposits: Buncombe, Catawba, Cumberland, Davidson, Durham, Forsyth, Guilford, Mecklenbu rg, New Hanover and Wake Deposit Market Share – Counties of Operation Rank Institution (ST) Number of Branches Deposits in Market ($mm) Market Share (%) 1 Wells Fargo & Co. (CA) 247 36,396 30.6 2 BB&T Corp. (NC) 185 25,531 21.5 3 Bank of America Corp. (NC) 157 6,406 5.4 4 SunTrust Banks Inc. (GA) 161 6,259 5.3 5 PNC Financial Services Group (PA) 72 5,711 4.8 6 First Citizens BancShares Inc. (NC) 106 5,369 4.5 7 BNC Bancorp (NC) 34 2,605 2.3 8 Toronto - Dominion Bank 43 1,819 1.5 9 Fifth Third Bancorp (OH) 42 1,600 1.3 10 Capital Bank Finl Corp (FL) 28 1,392 1.2 11 FNB United Corp. (NC) 31 1,263 1.1 12 First Financial Holdings Inc. (SC) 34 1,042 0.9 13 NewBridge Bancorp (NC) 22 1,005 0.8 14 SCBT Financial Corp. (SC) 15 883 0.7 15 Yadkin Valley Financial (NC) 17 817 0.7 Totals (1 - 15) 1,194 98,098 82.7 Totals (1 - 116) 1,690 119,098 100.0 BNC has offices in 70% of the Top 10 Growth Counties in NC 10.0% 10.0% 20.0% 30.0% 30.0% 40.0% 50.0% 70.0% 0.0% 25.0% 50.0% 75.0% 100.0% CSBC ECBE YAVY PSTB PEBK NBBC FBNC BNCN
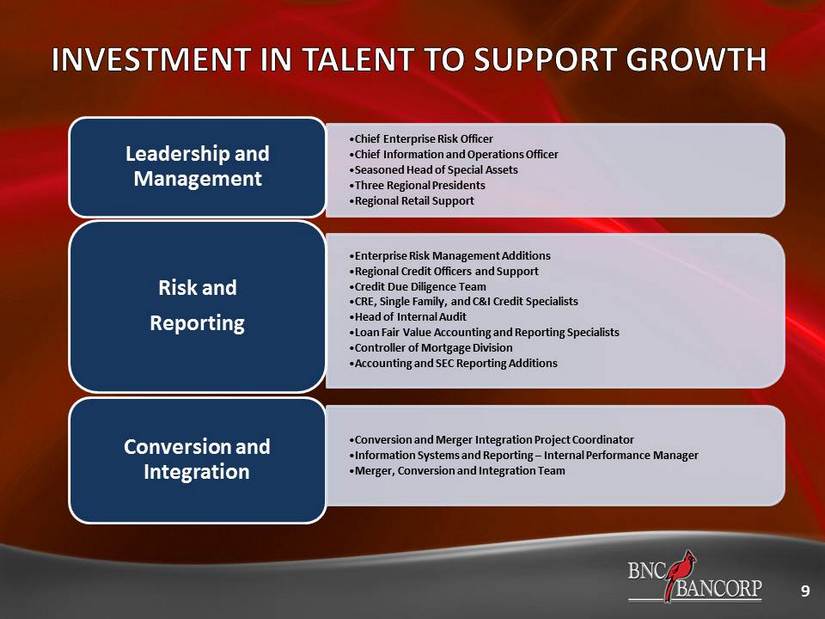
9 • Chief Enterprise Risk Officer • Chief Information and Operations Officer • Seasoned Head of Special Assets • Three Regional Presidents • Regional Retail Support Conversion and Integration • Enterprise Risk Management Additions • Regional Credit Officers and Support • Credit Due Diligence Team • CRE, Single Family, and C&I Credit Specialists • Head of Internal Audit • Loan Fair Value Accounting and Reporting Specialists • Controller of Mortgage Division • Accounting and SEC Reporting Additions Risk and Reporting • Conversion and Merger Integration Project Coordinator • Information Systems and Reporting – Internal Performance Manager • Merger, Conversion and Integration Team Leadership and Management

10 $102 $134 $154 $181 $210 $307 $372 $498 $595 $952 $1,130 $1,573 $1,634 $2,150 $2,455 $3,105 -300 200 700 1,200 1,700 2,200 2,700 3,200 1997 1998 1999 2000 2001 2002 2003 2004 2005 2006 2007 2008 2009 2010 2011 2012* Loans Deposits Assets Source: SNL Financial and Company filings * Pro forma for KeySource, First Trust, and Gateway branch acquisitions 1997+ 5 Year 3 Year CAGR CAGR CAGR Loans 27.6% 18.5% 26.3% Deposits 28.3% 25.5% 25.4% Assets 27.6% 22.4% 23.9%
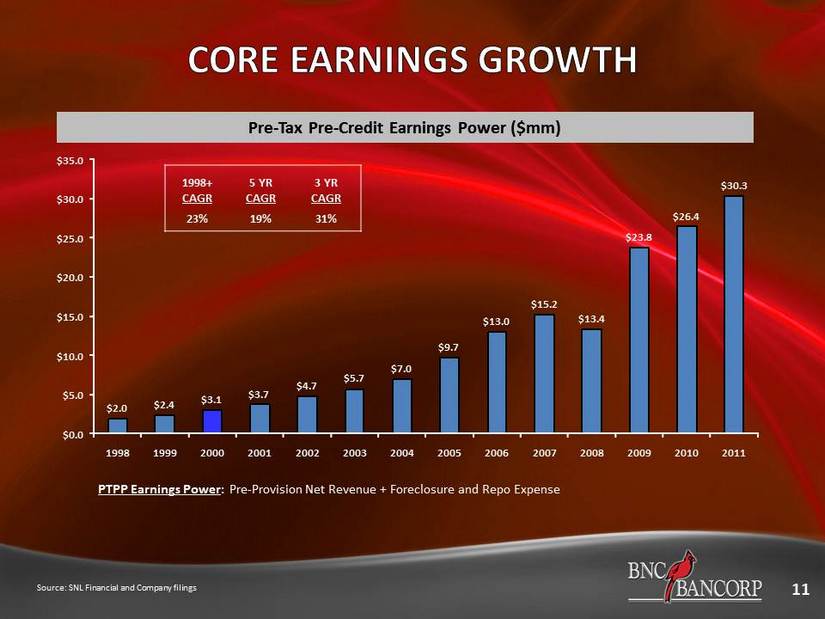
PTPP Earnings Power : Pre - Provision Net Revenue + Foreclosure and Repo Expense 1998+ 5 YR 3 YR CAGR CAGR CAGR 23% 19% 31% 11 Pre - Tax Pre - Credit Earnings Power ($mm) Source: SNL Financial and Company filings $2.0 $2.4 $3.1 $3.7 $4.7 $5.7 $7.0 $9.7 $13.0 $15.2 $13.4 $23.8 $26.4 $30.3 $0.0 $5.0 $10.0 $15.0 $20.0 $25.0 $30.0 $35.0 1998 1999 2000 2001 2002 2003 2004 2005 2006 2007 2008 2009 2010 2011
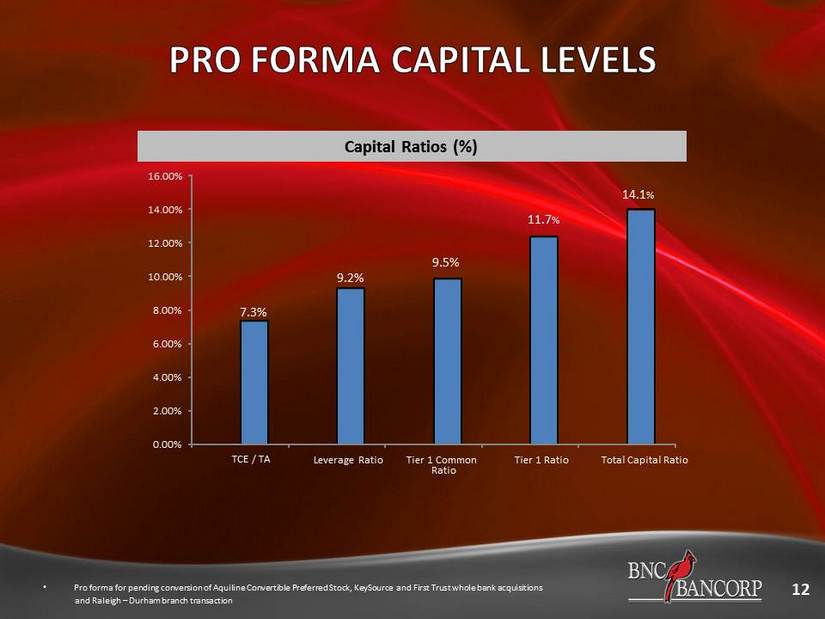
12 Capital Ratios (%) • Pro forma for pending conversion of Aquiline Convertible Preferred Stock, KeySource and First Trust whole bank acquisitions and Raleigh – Durham branch transaction 7.3 % 9 .2% 9.5% 11.7 % 14.1 % 0.00% 2.00% 4.00% 6.00% 8.00% 10.00% 12.00% 14.00% 16.00% TCE / TA Leverage Ratio Tier 1 Common Ratio Tier 1 Ratio Total Capital Ratio
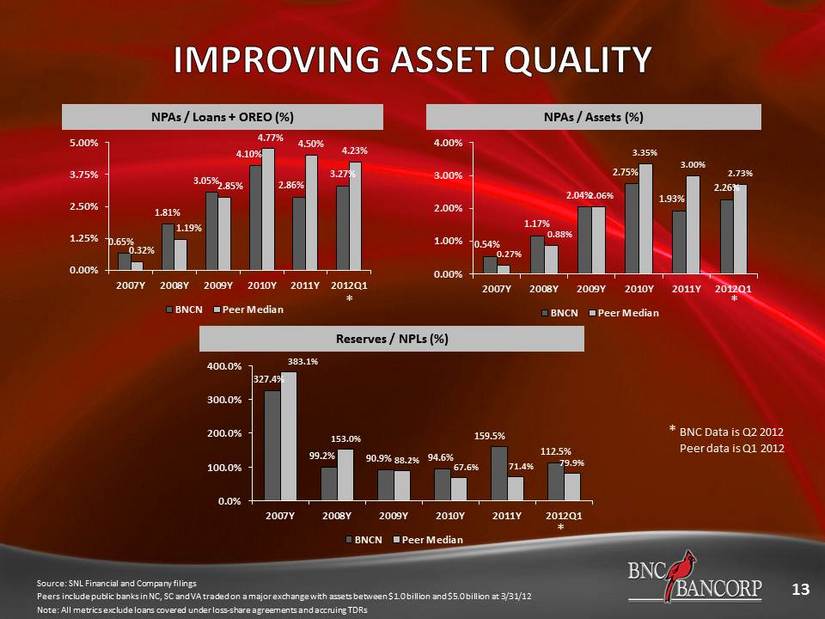
0.65% 1.81% 3.05% 4.10% 2.86% 3.27% 0.32% 1.19% 2.85% 4.77% 4.50% 4.23% 0.00% 1.25% 2.50% 3.75% 5.00% 2007Y 2008Y 2009Y 2010Y 2011Y 2012Q1 BNCN Peer Median 327.4% 99.2% 90.9% 94.6% 159.5% 112.5% 383.1% 153.0% 88.2% 67.6% 71.4% 79.9% 0.0% 100.0% 200.0% 300.0% 400.0% 2007Y 2008Y 2009Y 2010Y 2011Y 2012Q1 BNCN Peer Median 0.54% 1.17% 2.04% 2.75% 1.93% 2.26% 0.27% 0.88% 2.06% 3.35% 3.00% 2.73% 0.00% 1.00% 2.00% 3.00% 4.00% 2007Y 2008Y 2009Y 2010Y 2011Y 2012Q1 BNCN Peer Median 13 Source: SNL Financial and Company filings Peers include public banks in NC, SC and VA traded on a major exchange with assets between $1.0 billion and $5.0 billion at 3 /31 /12 Note: All metrics exclude loans covered under loss - share agreements and accruing TDRs NPAs / Assets (%) NPAs / Loans + OREO (%) Reserves / NPLs (%) * * * * BNC Data is Q2 2012 Peer data is Q1 2012
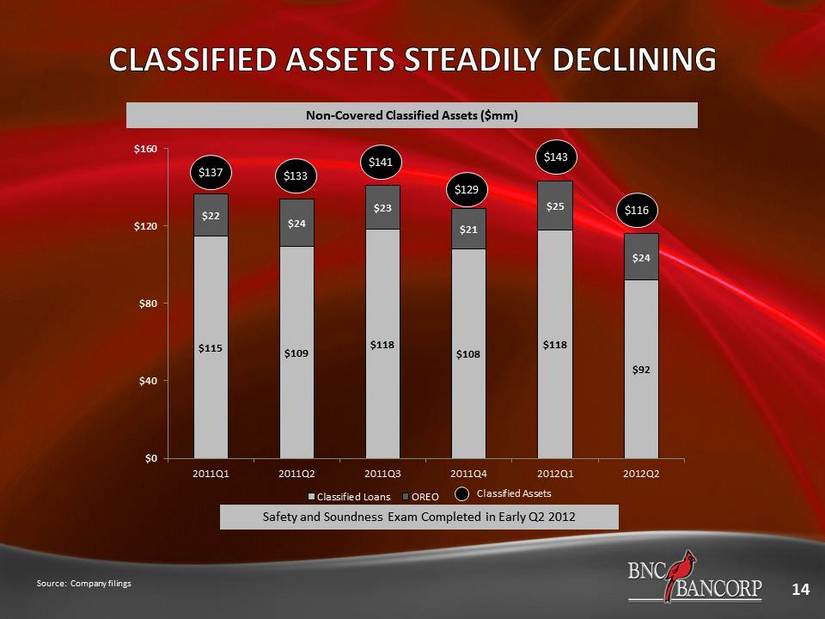
$115 $109 $118 $108 $118 $92 $22 $24 $23 $21 $25 $24 $0 $40 $80 $120 $160 2011Q1 2011Q2 2011Q3 2011Q4 2012Q1 2012Q2 Classified Loans OREO 14 Source: Company filings Non - Covered Classified Assets ($mm) Classified Assets $143 $129 $141 $137 $116 $133 Safety and Soundness Exam Completed in Early Q2 2012
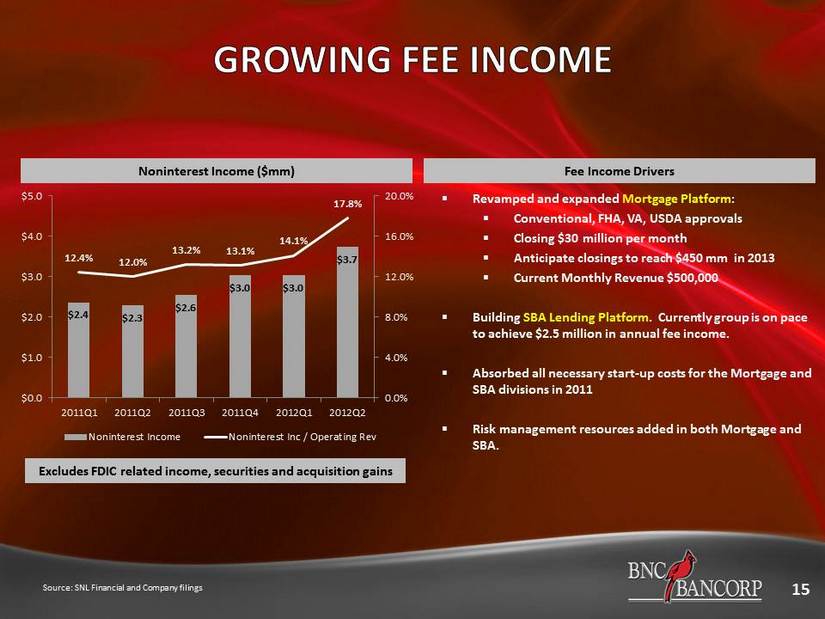
15 Source: SNL Financial and Company filings Noninterest Income ($mm) ▪ Revamped and expanded Mortgage Platform : ▪ Conventional, FHA, VA, USDA approvals ▪ Closing $30 million per month ▪ Anticipate closings to reach $450 mm in 2013 ▪ Current Monthly Revenue $500,000 ▪ Building SBA Lending Platform . Currently group is on pace to achieve $2.5 million in annual fee income. ▪ Absorbed all necessary start - up costs for the Mortgage and SBA divisions in 2011 ▪ Risk management resources added in both Mortgage and SBA. Fee Income Drivers E xcludes FDIC related income, securities and acquisition gains $2.4 $2.3 $2.6 $3.0 $3.0 $3.7 12.4% 12.0% 13.2% 13.1% 14.1% 17.8% 0.0% 4.0% 8.0% 12.0% 16.0% 20.0% $0.0 $1.0 $2.0 $3.0 $4.0 $5.0 2011Q1 2011Q2 2011Q3 2011Q4 2012Q1 2012Q2 Noninterest Income Noninterest Inc / Operating Rev


17 Cost of Funds (%) Noninterest Bearing Demand Deposits ($mm) $116 $129 $131 $146 $ 180 $100 $125 $150 $175 $200 2011Q1 2011Q2 2011Q3 2011Q4 2012Q2 57% 21 bps Source: SNL Financial and Company filings 1.68% 1.62% 1.62% 1.52% 1.47% 1.49% 1.43% 1.36% 1.22% 1.09% 1.00% 1.20% 1.40% 1.60% 1.80% 2.00% 2011Q1 2011Q2 2011Q3 2011Q4 2012Q2 Cost of Funds Cost of Funds w/o Cap Costs $745 million of CDs reprice over the coming 7 Quarters at an average rate of 1.45%. Replacement cost less than 80 bpts. Significant Cost Reductions Still Available
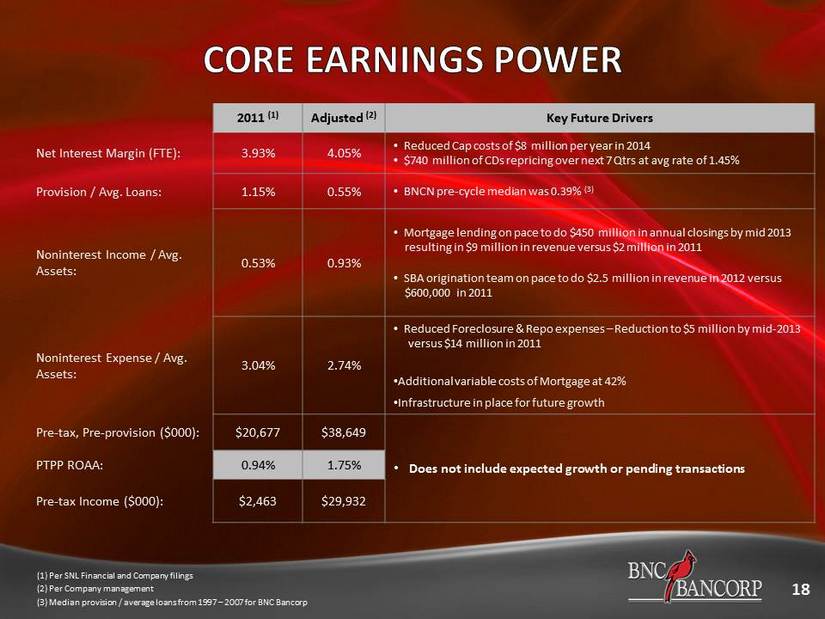
18 2011 (1) Adjusted (2) Key Future Drivers Net Interest Margin (FTE): 3.93% 4.05% • Reduced Cap costs of $8 million per year in 2014 • $740 million of CDs repricing over next 7 Qtrs at avg rate of 1.45% Provision / Avg. Loans: 1.15% 0.55% • BNCN pre - cycle median was 0.39% (3) Non interest Income / Avg. Assets: 0.53% 0.93% • Mortgage lending on pace to do $450 million in annual closings by mid 2013 resulting in $9 million in revenue versus $2 million in 2011 • SBA origination team on pace to do $2.5 million in revenue in 2012 versus $600,000 in 2011 Noninterest Expense / Avg. Assets: 3.04% 2.74% • Reduced Foreclosure & Repo expenses – Reduction to $5 million by mid - 2013 versus $14 million in 2011 • Additional variable costs of Mortgage at 42% • Infrastructure in place for future growth Pre - tax, Pre - provision ($000): $20,677 $38,649 • Does not include expected growth or pending transactions PTPP ROAA: 0.94% 1.75% Pre - tax Income ($000): $2,463 $29,932 (1) Per SNL Financial and Company filings (2) Per Company management (3) Median provision / average loans from 1997 – 2007 for BNC Bancorp

19 Source: Company filings (1) Ex cludes loans held for sale Commercial Real Estate, 46% Commercial Construction, 10% 1% 1% Residential Mortgage, 19% 1% 7% 2% 1% 0% 5% 0% Commercial Real Estate Commercial Construction Commercial & Industrial Leases Residential Construction Residential Mortgage Consumer & Other Commercial Real Estate - Covered Commercial Construction - Covered Commercial & Industrial - Covered Residential Construction - Covered Residential Mortgage - Covered Consumer & Other - Covered Loan Portfolio Composition(1) - 6/30/2012 Type Balance ($000) Commercial Real Estate $802,707 Commercial Construction 167,083 Commercial & Industrial 127,288 Leases 12,502 Residential Construction 22,193 Residential Mortgage 334,207 Consumer & Other 9,728 Total Non-Covered Loans $1,475,708 Commercial Real Estate - Covered 126,143 Commercial Construction - Covered 40,294 Commercial & Industrial - Covered 13,493 Residential Construction - Covered 5,713 Residential Mortgage - Covered 95,966 Consumer & Other - Covered 2,970 Total Covered Loans $284,579 Total Loans $1,760,287
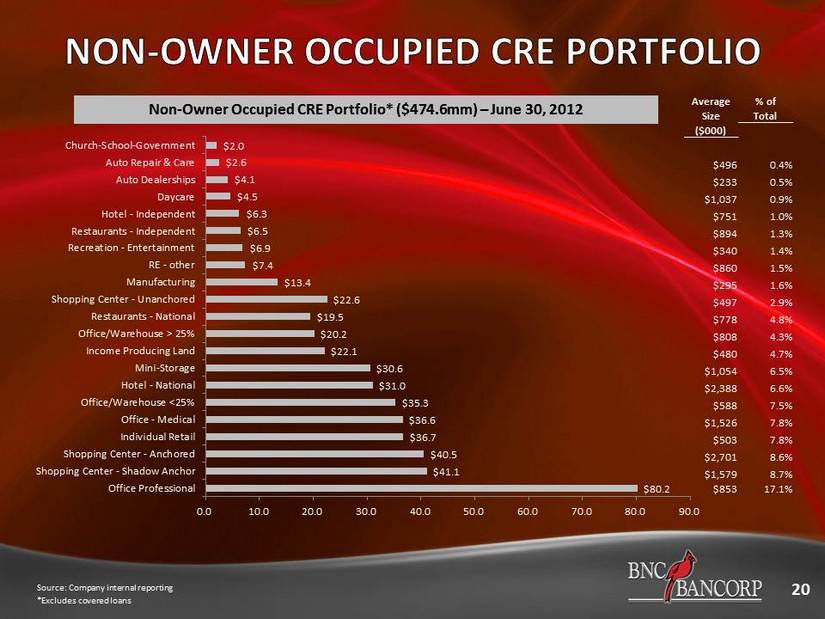
20 Source: Company internal reporting *Excludes covered loans Non - Owner Occupied CRE Portfolio* ($474.6mm) – June 30, 2012 $80.2 $41.1 $40.5 $36.7 $36.6 $35.3 $31.0 $30.6 $22.1 $20.2 $19.5 $22.6 $13.4 $7.4 $6.9 $6.5 $6.3 $4.5 $4.1 $2.6 $2.0 0.0 10.0 20.0 30.0 40.0 50.0 60.0 70.0 80.0 90.0 Office Professional Shopping Center - Shadow Anchor Shopping Center - Anchored Individual Retail Office - Medical Office/Warehouse <25% Hotel - National Mini-Storage Income Producing Land Office/Warehouse > 25% Restaurants - National Shopping Center - Unanchored Manufacturing RE - other Recreation - Entertainment Restaurants - Independent Hotel - Independent Daycare Auto Dealerships Auto Repair & Care Church-School-Government Average % of Size Total ($000) $496 0.4% $233 0.5% $1,037 0.9% $751 1.0% $894 1.3% $340 1.4% $860 1.5% $295 1.6% $497 2.9% $778 4.8% $808 4.3% $480 4.7% $1,054 6.5% $2,388 6.6% $588 7.5% $1,526 7.8% $503 7.8% $2,701 8.6% $1,579 8.7% $853 17.1%
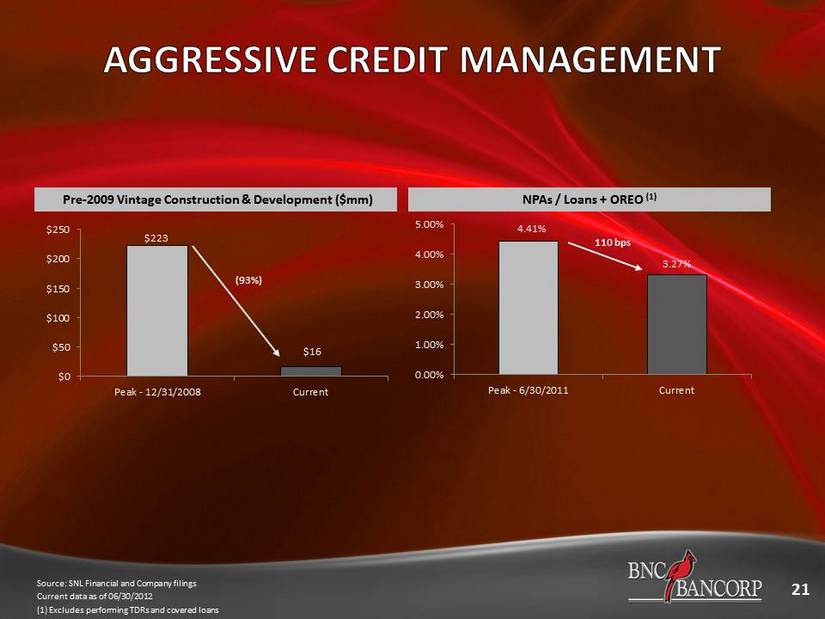
21 $223 $16 $0 $50 $100 $150 $200 $250 Peak - 12/31/2008 Current 4.41% 3.27% 0.00% 1.00% 2.00% 3.00% 4.00% 5.00% Peak - 6/30/2011 Current NPAs / Loans + OREO (1) Pre - 2009 Vintage Construction & Development ($mm) (93%) 110 bps Source: SNL Financial and Company filings Current data as of 06/30/ 2012 (1) Excludes performing TDRs and covered loans
22 Employment gains are now broad - based, with jobs added to every major industry over the past year. The increased pace of hiring in North Carolina will support further income gains in the state over the course of the current year. Some of the recent manufacturing sector expansions around the state include …the new Caterpillar plant in Winston - Salem and the new Siemens gas turbine plant in Charlotte . Besides bringing more jobs to these parts of the state, these additions provide much needed diversification to the economy’s industrial base . Recent payroll additions at higher value - added manufacturing facilities in the state, such as Daimler Trucks and Honda Aircraft, are welcome additions to the Charlotte and Greensboro regions and the state’s economic recovery . The Research Triangle Park continues to act as a catalyst for population and employment growth. The Raleigh and Durham markets have seen some of the strongest growth over the past year. This has pushed up demand for multifamily housing, where permitting is up more than 10 percent from a year earlier. The Charlotte metro region also experienced sizable population growth, rising 1.8 percent over last year as job growth began to pick up . [Regarding home prices] around the state, conditions vary, with prices up in the Charlotte and Greensboro metro areas. Source: Wells Fargo May 07, 2012 Edition, Special Commentary on NC, Economics Group
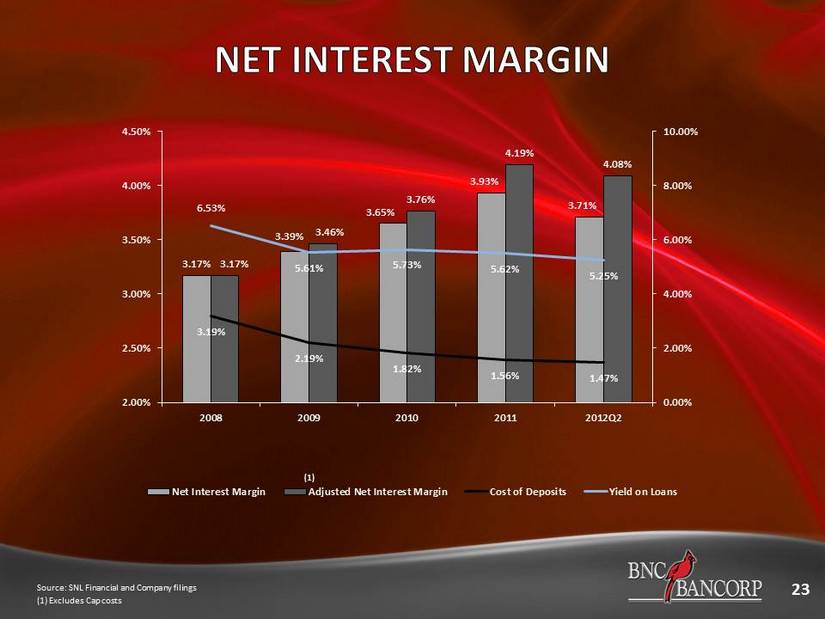
3.17% 3.39% 3.65% 3.93% 3.71% 3.17% 3.46% 3.76% 4.19% 4.08% 3.19% 2.19% 1.82% 1.56% 1.47% 6.53% 5.61% 5.73% 5.62% 5.25% 0.00% 2.00% 4.00% 6.00% 8.00% 10.00% 2.00% 2.50% 3.00% 3.50% 4.00% 4.50% 2008 2009 2010 2011 2012Q2 Net Interest Margin Adjusted Net Interest Margin Cost of Deposits Yield on Loans 23 Source: SNL Financial and Company filings (1) Excludes Cap costs (1)
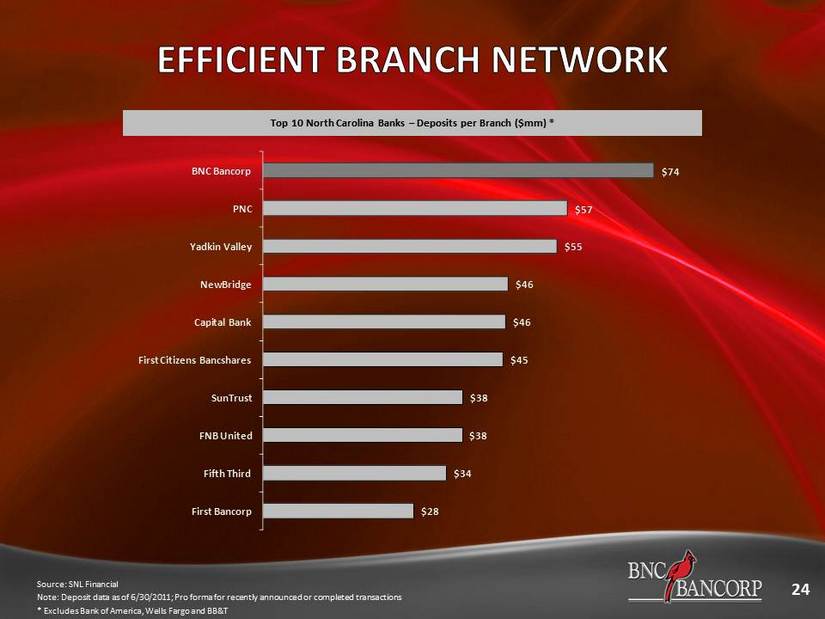
24 Source: SNL Financial Note: Deposit data as of 6/30/2011; Pro forma for recently announced or completed transactions * Excludes Bank of America, Wells Fargo and BB&T $28 $34 $38 $38 $45 $46 $46 $55 $57 $74 First Bancorp Fifth Third FNB United SunTrust First Citizens Bancshares Capital Bank NewBridge Yadkin Valley PNC BNC Bancorp Top 10 North Carolina Banks – Deposits per Branch ($mm) *
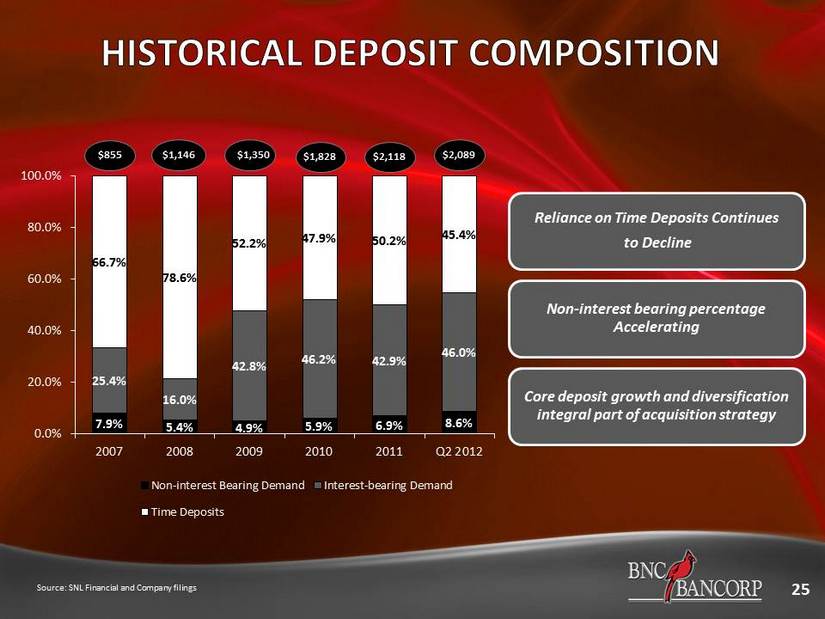
25 $1,146 $855 Source: SNL Financial and Company filings $2,089 $1,350 $1,828 $2,118 Reliance on Time Deposits Continues to Decline Non - interest bearing percentage Accelerating Core deposit growth and diversification integral part of acquisition strategy 7.9% 5.4% 4.9% 5.9% 6.9% 8.6% 25.4% 16.0% 42.8% 46.2% 42.9% 46.0% 66.7% 78.6% 52.2% 47.9% 50.2% 45.4% 0.0% 20.0% 40.0% 60.0% 80.0% 100.0% 2007 2008 2009 2010 2011 Q2 2012 Non-interest Bearing Demand Interest-bearing Demand Time Deposits
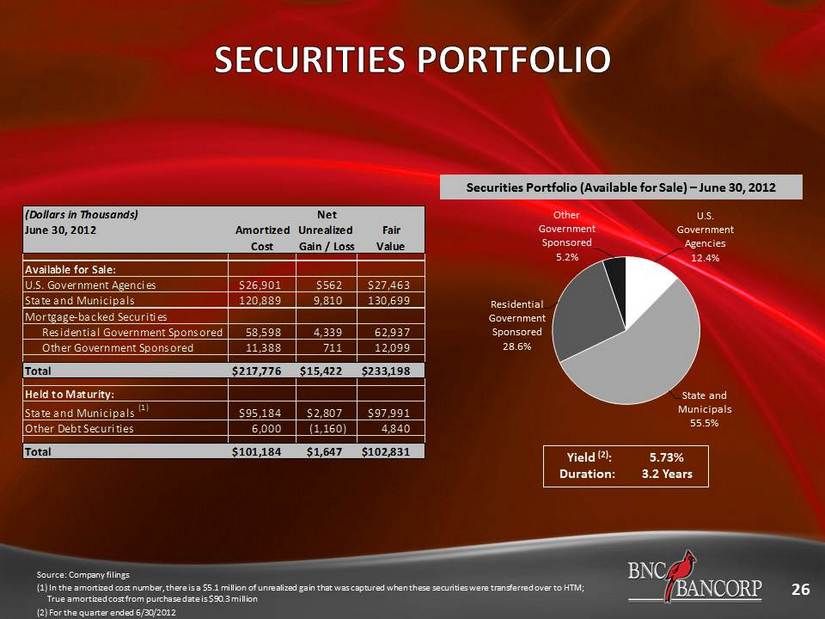
26 Source: Company filings (1) In the amortized cost number, there is a $5.1 million of unrealized gain that was captured when these securities were tra nsf erred over to HTM; True amortized cost from purchase date is $90.3 million (2) For the quarter ended 6/30/ 2012 Securities Portfolio (Available for Sale) – June 30, 2012 Yield (2) : 5.73% Duration: 3.2 Years (Dollars in Thousands) Net June 30, 2012 Amortized Unrealized Fair Cost Gain / Loss Value Available for Sale: U.S. Government Agencies $26,901 $562 $27,463 State and Municipals 120,889 9,810 130,699 Mortgage-backed Securities Residential Government Sponsored 58,598 4,339 62,937 Other Government Sponsored 11,388 711 12,099 Total $217,776 $15,422 $233,198 Held to Maturity: State and Municipals (1) $95,184 $2,807 $97,991 Other Debt Securities 6,000 (1,160) 4,840 Total $101,184 $1,647 $102,831 U.S. Government Agencies 12.4% State and Municipals 55.5% Residential Government Sponsored 28.6% Other Government Sponsored 5.2%

27 ▪ In connection with receipt of TARP in 2008, management executed a leverage trade ▪ Objectives: 1) Create Earnings Power 2) Hedge AOCI volatility 3) Protect transaction spread from rate movements ▪ Description: o Purchased $375 million of government securities at prices between 98 and 102 to yield 5.75% o Funded by: – $250 million wholesale money market account with underlying rate tied to the Fed Funds index. (Purchased $250mm of notional caps on Fed Funds). Five year effective cost of underlying MMA and caps were 2.95%. Caps provide a mark - to - market component to offset mark - to - market volatility of securities. – $125 million of short term funding, which has ranged from 1.25% to 0.20%. ▪ Management embarked on this strategy to re - deploy the earnings in the build out of the franchise in markets with high growth potential. Ultimate goal was to replace a portion of leveraged securities with loan growth in new markets. ▪ Although this hedged strategy will produce significant earnings over the five years, the cap costs escalate over the five years resulting in less earnings in the final two years putting pressure on the Company’s net interest margin over the final seven quarters. ▪ Management estimates 25 bps of net interest margin will be recaptured when this strategy rolls off at the end of 2013