Attached files
| file | filename |
|---|---|
| EX-99.1 - PRESS RELEASE - VISA INC. | d384121dex991.htm |
| 8-K - FORM 8-K - VISA INC. | d384121d8k.htm |
 Visa
Inc. Fiscal Third Quarter
Financial Results
July 25, 2012
Exhibit 99.2 |
 Third Quarter Fiscal 2012 Financial Results
2
Forward-Looking Statements
This presentation contains forward-looking statements within the meaning of the
U.S. Private Securities Litigation Reform Act of 1995. These statements can be identified by the terms
"believe," "continue," "potential," "project,"
“subject to," and similar references to the future. Examples of
such forward-looking statements include, but are not limited to, statements we make about the settlement of the multi-district interchange litigation; our litigation reserves;
the number of transactions we process; the shift to electronic payments and our
growth in the category; the growth rate of consumer and commercial spending; our liquidity needs and our
ability to meet them; our online payment, fraud and security management
capabilities; the relative strength of the U.S. dollar; dividend payments; and earnings per share, free cash flow,
revenue, incentive payments, expenses, operating margin, tax rate and capital
expenditures and the growth of those items. By
their
nature,
forward-looking
statements:
(i)
speak
only
as
of
the
date
they
are
made,
(ii)
are
neither
statements
of
historical
fact
nor
guarantees
of
future
performance
and
(iii)
are
subject to risks, uncertainties, assumptions and changes in circumstances that are
difficult to predict or quantify. Therefore, actual results could differ materially and adversely from those
forward-looking statements because of a variety of factors, including the
following: •
the impact of new laws, regulations and marketplace barriers, including:
•
rules capping debit interchange reimbursement fees promulgated under the Reform
Act; •
rules under the Reform Act expanding issuers' and merchants' choice among debit
payment networks; •
U.S. government and other parties' reactions to the changes we have made to our
business in response to the Reform Act;
•
increased regulation outside the United States and in other product categories;
and •
rules about consumer privacy and data use and security;
•
developments in current or future litigation or government enforcement, including
interchange, antitrust and tax disputes and also including our failure to satisfy the conditions
•
economic factors, such as:
•
an increase or spread of the current European crisis involving sovereign debt and
the euro; •
other global economic, political and health conditions;
•
cross-border activity and currency exchange rates; and
•
material changes in our clients' performance compared to our estimates;
•
industry developments, such as competitive pressure, rapid technological
developments and disintermediation from the payments value stream;
•
system developments, such as:
•
disruption of our transaction processing systems or the inability to process
transactions efficiently; •
account data breaches or increased fraudulent or other illegal activities involving
our cards; and •
issues arising at Visa Europe, including failure to maintain interoperability
between our systems; •
costs arising if Visa Europe were to exercise its right to require us to acquire
all of its outstanding stock; •
loss of organizational effectiveness or key employees;
•
failure to integrate recent acquisitions successfully or to effectively launch new
products and businesses; •
changes in accounting principles or treatments; and
the other factors discussed in our most recent Annual Report on Form 10-K
and our most recent Current Reports on Form 8-K filed with the U.S. Securities and Exchange
Commission. You should not place undue reliance on such statements. Unless required
to do so by law, we do not intend to update or revise any forward-looking statement, because of
new information or future developments or otherwise.
necessary to make the multi-district litigation settlements effective;
|
 Third Quarter Fiscal 2012 Financial Results
3
Solid Fiscal Third Quarter Results
•
Strong operating revenues of $2.6 billion, up 10% over prior year
•
Adjusted quarterly net income of $1.1 billion, up 20%, and adjusted diluted
earnings per share of $1.56, up 25% over prior year
•
Continued positive secular trends and spending momentum contributed to
growth in key underlying business drivers
Note: See appendix for reconciliation of adjusted non-GAAP measures to the
closest comparable GAAP measures. •
Repurchased 4 million shares at an average price of $115.51 for a total cost
of $461 million |
 Third Quarter Fiscal 2012 Financial Results
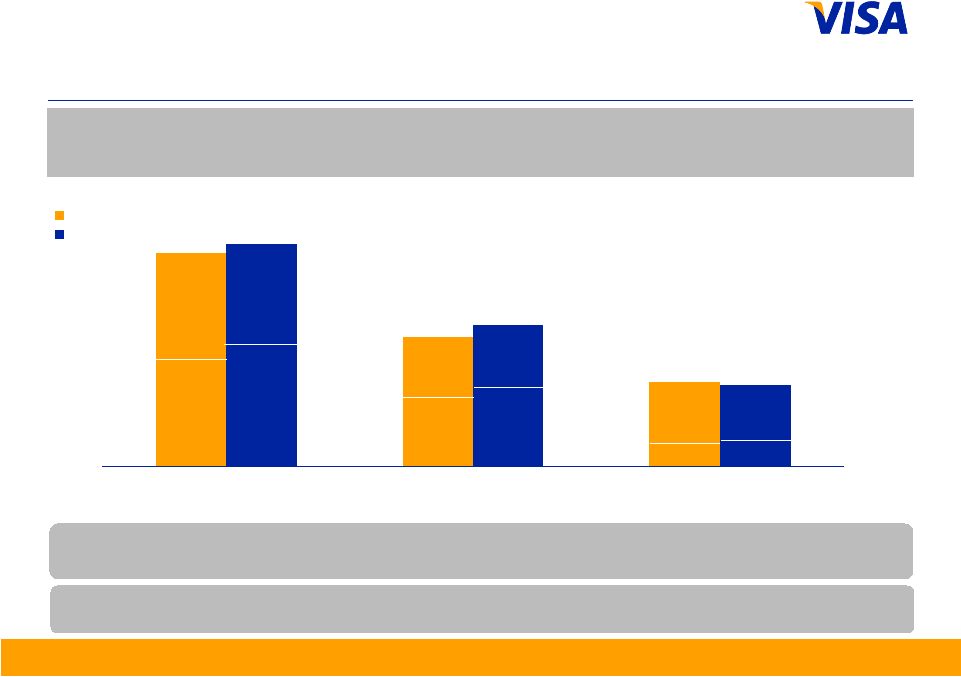
4
862
517
345
958
588
370
Total Visa Inc.
Credit
Debit
2011
2012
U.S.
477
ROW
385
U.S.
199
ROW
318
U.S.
508
ROW
450
U.S.
223
ROW
365
U.S.
284
ROW 85
U.S.
278
ROW 68
Payments Volume
US$ in billions, nominal, except percentages
YOY Change
(nominal)
14%
7%
11%
YOY Change
(constant)
11%
14%
8%
Note: Figures may not sum due to rounding. Growth rates calculated based on whole
numbers, not rounded numbers. From time to time, previously submitted volume
information may be updated. Prior period updates are not material. Constant dollar growth rates exclude the impact of foreign
currency fluctuations against the U.S. dollar in measuring performance.
ROW
=
Rest
of
World
Quarter ended March |
 Third Quarter Fiscal 2012 Financial Results
5
941
572
369
979
624
355
Total Visa Inc.
Credit
Debit
2011
2012
U.S.
518
ROW
423
U.S.
224
ROW
348
U.S.
294
ROW 75
U.S.
512
ROW
467
U.S.
246
ROW
379
U.S.
266
ROW 88
Payments Volume
US$ in billions, nominal, except percentages
YOY Change
(nominal)
9%
(4)%
4%
YOY Change
(constant)
6%
12%
(2)%
Note: Current quarter payments volume and other select metrics are provided in the
operational performance data supplement to provide more recent operating
data. Service revenues continue to be recognized based on payments volume in the prior quarter. From time to time, reported
payments volume information may be updated to reflect revised client submissions or
other adjustments. Prior period updates are not material. Figures may not
sum due to rounding. ROW
=
Rest
of
World
Quarter ended June |
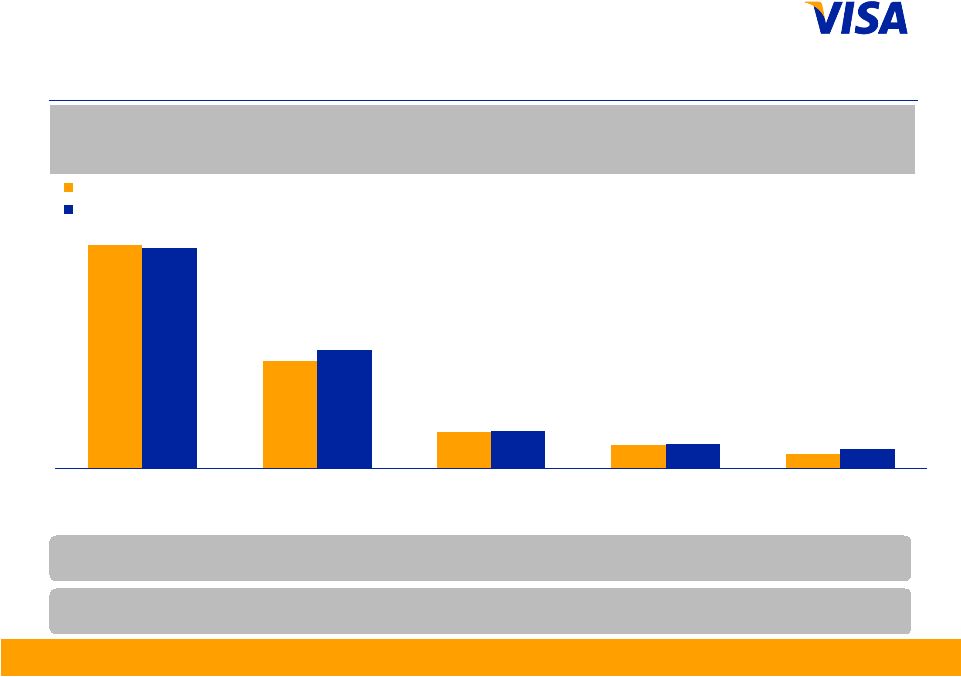
 Third Quarter Fiscal 2012 Financial Results
6
Payments Volume
US$ in billions, nominal, except percentages
YOY Change
(nominal)
17%
7%
6%
17%
33%
YOY Change
(constant)
6%
14%
9%
23%
40%
Note: Growth rates calculated based on whole numbers, not rounded numbers. From
time to time, previously submitted volume information may be updated.
Prior
period
updates
are
not
material.
Constant
dollar
growth
rates
exclude
the
impact
of
foreign
currency
fluctuations
against
the
U.S.
dollar in measuring performance.
Quarter ended March
477
230
77
48
30
508
269
90
51
40
United States
Asia Pacific
Latin America and
Caribbean
Canada
Central and Eastern
Europe, Middle East
and Africa
2011
2012 |
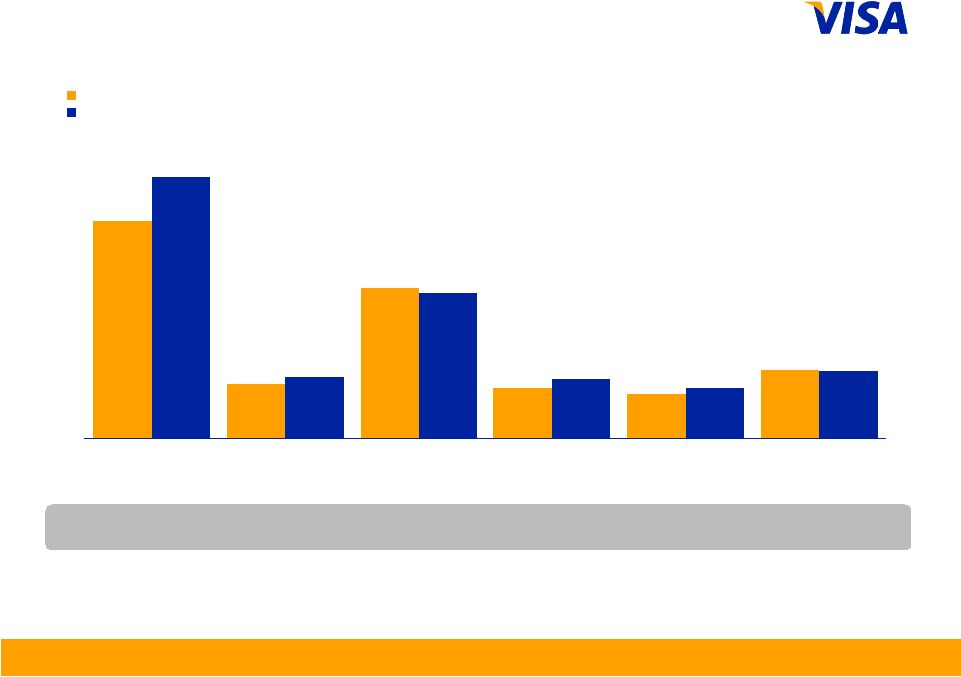
 Third Quarter Fiscal 2012 Financial Results
7
Payments Volume
US$ in billions, nominal, except percentages
Note: Current quarter payments volume and other select metrics are provided in the
operational performance data supplement to provide more recent operating
data. Service revenues continue to be recognized based on payments volume in the prior quarter. From time to time, reported
payments volume information may be updated to reflect revised client submissions or
other adjustments. Prior period updates are not material. Figures may not
sum due to rounding. YOY Change
(nominal)
11%
4%
(1)%
3%
30%
YOY Change
(constant)
13%
8%
(1)%
20%
41%
Quarter ended June
518
248
85
55
35
512
277
88
57
45
United States
Asia Pacific
Latin America and
Caribbean
Canada
Central and Eastern
Europe, Middle East
and Africa
2011
2012 |
 Third Quarter Fiscal 2012 Financial Results
8
19,404
13,038
19,919
13,113
Total
Transactions
Processed
Transactions
2011
2012
Debit
62%
Credit
35%
Credit
38%
Debit
65%
Transactions
in millions, except percentages
Quarter ended June
Note: Processed transactions represent transactions involving Visa, Visa Electron,
Interlink and Plus cards processed on Visa’s networks. Total transactions
represent payments and cash transactions as reported by Visa clients on their
operating certificates. From time to time, previously submitted transaction
information may be updated. Prior period updates are not material.
YOY
Change
3%
1% |
 Third Quarter Fiscal 2012 Financial Results
9
Total Cards
in millions, except percentages
YOY
Change
12%
8%
2%
Note: Figures may not sum due to rounding. From time to time, previously submitted
card information may be updated. Prior period updates are not
material. Quarter ended March
760
1,110
1,870
778
1,246
2,025
Credit
Debit
Visa Inc.
2011
2012 |
 Third Quarter Fiscal 2012 Financial Results
10
Revenue –
Q3 2012
US$ in millions, except percentages
YOY
Change
37%
10%
15%
Note: Growth rates and percentage of gross revenues calculated based on whole
numbers, not rounded numbers. FY12 % of Gross
Revenues
19%
81%
2,770
(448)
2,322
3,179
(614)
2,565
Gross Revenues
Incentives
Net Operating
Revenues
Fiscal 2011
Fiscal 2012 |
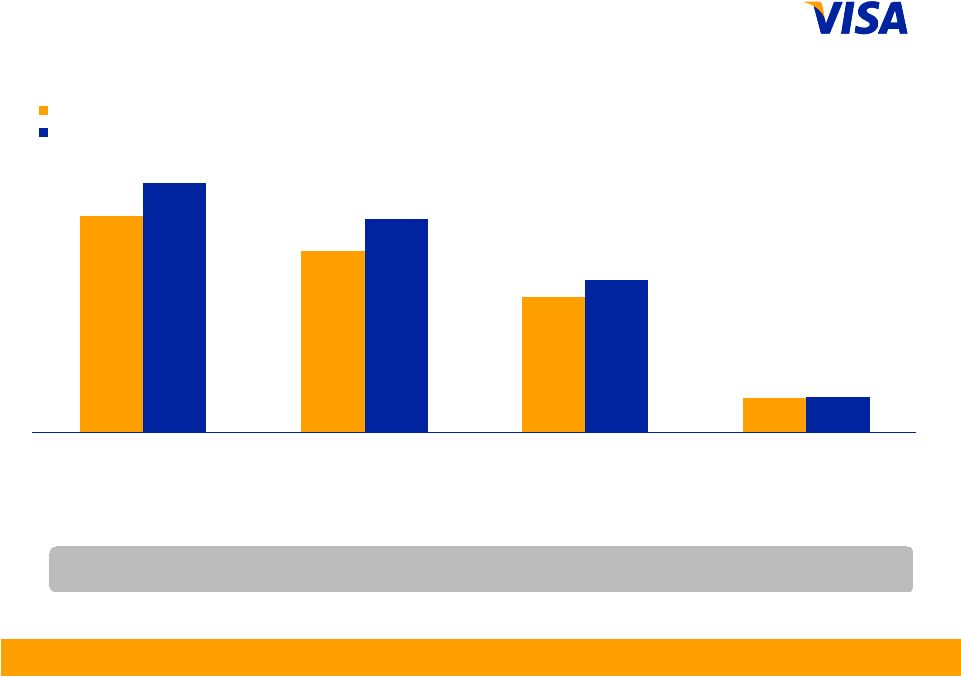 Third Quarter Fiscal 2012 Financial Results
11
Revenue Detail –
Q3 2012
US$ in millions, except percentages
Note: Growth rates calculated based on whole numbers, not rounded numbers.
YOY
Change
17%
13%
15%
7%
1,055
886
662
167
1,216
1,040
748
175
Service
Revenues
Data Processing
Revenues
International
Transaction
Revenues
Other
Revenues
Fiscal 2011
Fiscal 2012 |
 Third Quarter Fiscal 2012 Financial Results
12
Adjusted Operating Margin –
Q3 2012
US$ in millions, except percentages
Note: Growth rates calculated based on whole numbers, not rounded numbers. See
appendix for reconciliation of adjusted non-GAAP measures to the closest
comparable GAAP measures. YOY
Change
10%
11%
10%
-
2,322
977
1,345
58%
2,565
1,074
1,491
58%
Fiscal 2011
Fiscal 2012
Net Operating
Revenues
Total Operating
Expenses
Operating
Income
Operating
Margin |
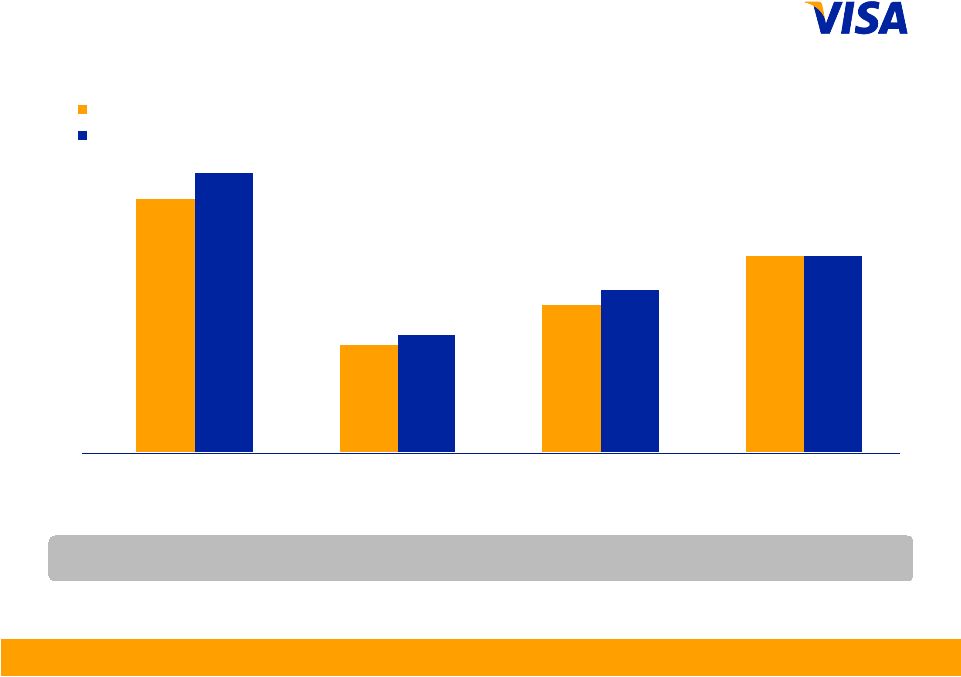
 Third Quarter Fiscal 2012 Financial Results
13
Adjusted Operating Expenses –
Q3 2012
US$ in millions, except percentages
Note: Growth rates calculated based on whole numbers, not rounded numbers. See
appendix for reconciliation of adjusted non-GAAP measures to the closest
comparable GAAP measures. YOY
Change
17%
14%
13%
(3%)
(3%)
20%
363
91
251
84
74
114
435
102
242
99
84
112
Personnel
Network
and Processing
Marketing
Professional Fees
Depreciation
and Amortization
General
and Administrative
Fiscal 2011
Fiscal 2012 |
 Third Quarter Fiscal 2012 Financial Results
14
Other Financial Results
•
Cash, cash equivalents, restricted cash, and available-for-sale
investment securities of $9.4 billion at the end of the fiscal third quarter,
which
includes
$4.3
billion
of
restricted
cash
in
the
litigation
escrow
account
•
Free cash flow of $1.1 billion for the fiscal third quarter
•
Capital expenditures of $108 million during the fiscal third quarter
|
 Third Quarter Fiscal 2012 Financial Results
15
Under $1
billion
Marketing expenses
Financial Metrics for Fiscal Year 2012
Adjusted annual operating margin
About 60%*
17% to 18%
range
Client incentives as % of gross revenues
Annual net revenue growth
Low double
digits
*Financial Outlook excludes the impact of the litigation
provision of $4.1 billion recorded in Q3 2012. See appendix for reconciliation of adjusted non-
GAAP measures to the closest comparable GAAP measures.
|
 Third Quarter Fiscal 2012 Financial Results
16
Financial Metrics for Fiscal Year 2012
Capital expenditures
$350 million to
$400 million
range
Adjusted annual diluted class A common stock
earnings per share growth
Adjusted tax rate
33% to 34%
range*
Annual free cash flow
Greater than
$4 billion
*Financial
Outlook
excludes
the
impact
of
(i)
the
litigation
provision
of
$4.1
billion
and
related
tax
benefits
recorded
in
Q3
2012,
and
(ii)
a
non-cash
benefit
related
to
the
remeasurement
of
deferred
tax
liabilities
recorded
in
Q2
2012,
which
would
decrease
the
GAAP
tax
rate
to
30%
to
31%.
These deferred tax liabilities are primarily associated with indefinite-lived
intangible assets recorded as part of Visa’s October 2007
reorganization. See appendix for reconciliation of adjusted non-GAAP measures
to the closest comparable GAAP measures. Low twenties*
|
 Appendix
Reconciliation of
Non-GAAP Measures |
  Third Quarter Fiscal 2012 Financial Results
Reconciliation of Non-GAAP
Financial Results
US$ in millions, except margin ratio and per share data
During
the
third
quarter
of
fiscal
2012,
we
recorded
a
provision
related
to
litigation
subject
to
the
retrospective responsibility
plan of $4.1 billion and related tax benefits ("litigation provision
adjustment"). During the third quarter of fiscal 2011, we recorded a
decrease of $122 million in the fair value of the Visa Europe put option ("revaluation of the Visa Europe put
option"), which resulted in the recognition of non-cash, non-operating
other income in our financial results. We believe the presentation of
adjusted financial results excluding the litigation provision adjustment and the revaluation of the Visa Europe
put option provides a clearer understanding of our operating performance for the
respective periods. A1
(1)
Operating margin is calculated as operating (loss) income divided by total
operating revenues. (2)
Diluted (loss) earnings per share figures calculated based on whole numbers, not
rounded numbers. (3)
The litigation provision adjustment to net (loss) income attributable to Visa Inc.
is shown net of tax. The tax impact is determined
by
applying
applicable
federal
and
state
tax
rates
to
the
litigation
provision
and
applying
related
reserves
for
uncertain tax positions.
(4)
For the three months ended June 30, 2012, the computation of adjusted diluted
earnings per share included the effect of 3 million incremental dilutive
shares, which were excluded from the computation of reported diluted loss per share as they are
considered anti-dilutive when applied to a net loss.
2012
2011
2012
2011
2012
2011
2012
2011
As reported
$ 5,172
$ 977
(102)%
58%
(1,839)
$
1,005
$
(2.74)
$
1.43
$
Litigation Provision
(4,098)
-
NM
-
2,894
(3)
-
4.30
-
Revaluation of Visa
Europe put option
-
-
-
-
-
(122)
-
(0.17)
Adjusted
$ 1,074
$ 977
58%
58%
1,055
$
883
$
1.56
$
1.26
$
Diluted weighted-average
shares outstanding
(4)
675
704
Three Months Ended June 30,
Diluted (loss) earnings
per share
(2)
Operating
Expenses
Operating
Margin
(1)
Net (loss) income
attributable to Visa Inc. |
  Third Quarter Fiscal 2012 Financial Results
Reconciliation of Non-GAAP
Financial Results
US$ in millions, except tax rate
(1)
Effective tax
rate
(1)
As reported
29.5%
Litigation Provision
(0.3%)
Adjusted
29.2%
Three Months Ended June 30, 2012
During the third quarter of fiscal 2012, we recorded a provision related to litigation subject to the
retrospective responsibility plan of $4.1 billion and related tax benefits. We believe the
covered litigation provision recorded in our effective income tax rate is not indicative of our
financial performance in the current or future periods. We believe the presentation of our
adjusted effective income tax rate provides a clearer understanding of our operating
performance for the current period. Effective income tax rate calculated based on whole numbers, not rounded numbers.
A2 |
     Third
Quarter Fiscal 2012 Financial Results Calculation of Free Cash Flow
US$ in millions
A3
(1) Includes changes in client incentives, trade receivable/payable, settlement
receivable/payable, and personnel incentives. Additions (+) /
Reductions (-) to
Net (loss) income
attributable to
Visa Inc.
Net (loss) income attributable to Visa Inc. (as reported)
(1,839)
482
Capital Assets
+
Depreciation and amortization
84
244
-
Capital expenditures
(108)
(235)
(24)
9
Litigation
+
Litigation provision
4,098
4,098
+
Accretion expense
-
1
-
Settlement payments
-
(140)
+
Settlement payments funded by litigation escrow
-
140
4,098
4,099
Share-based Compensation
+
Share-based compensation
36
112
Pension
+
Pension expense
14
36
-
Pension contribution
-
-
14
36
Taxes
+
Income tax (benefit) provision
(768)
139
-
Income taxes paid
(504)
(1,575)
(1,272)
(1,436)
Changes in Working Capital
(1)
+/-
Changes in other working capital accounts
107
258
Total Free Cash Flow
1,120
3,560
Three Months
Ended June 30,
2012
Nine Months
Ended June 30,
2012 |