Attached files
| file | filename |
|---|---|
| EX-32.2 - EXHIBIT 32.2 - VISA INC. | vex322093017.htm |
| EX-32.1 - EXHIBIT 32.1 - VISA INC. | vex321093017.htm |
| EX-31.2 - EXHIBIT 31.2 - VISA INC. | vex312093017.htm |
| EX-31.1 - EXHIBIT 31.1 - VISA INC. | vex311093017.htm |
| EX-23.1 - EXHIBIT 23.1 - VISA INC. | vex231093017.htm |
| EX-21.1 - EXHIBIT 21.1 - VISA INC. | vex211093017.htm |
| EX-12.1 - EXHIBIT 12.1 - VISA INC. | vex121093017.htm |
UNITED STATES SECURITIES AND EXCHANGE COMMISSION
WASHINGTON, D.C. 20549
FORM 10-K
þ | ANNUAL REPORT PURSUANT TO SECTION 13 OR 15(d) OF THE SECURITIES EXCHANGE ACT OF 1934 |
For the fiscal year ended September 30, 2017
OR
¨ | TRANSITION REPORT PURSUANT TO SECTION 13 OR 15(d) OF THE SECURITIES EXCHANGE ACT OF 1934 |
For the transition period from to
Commission file number 001-33977
VISA INC.
(Exact name of Registrant as specified in its charter)
Delaware | 26-0267673 | |
(State or other jurisdiction of incorporation or organization) | (IRS Employer Identification No.) | |
P.O. Box 8999 San Francisco, California | 94128-8999 | |
(Address of principal executive offices) | (Zip Code) | |
(650) 432-3200
(Registrant’s telephone number, including area code)
Securities registered pursuant to Section 12(b) of the Act:
Class A common stock, par value $0.0001 per share | New York Stock Exchange | |
(Title of each Class) | (Name of each exchange on which registered) | |
Securities registered pursuant to Section 12(g) of the Act:
Class B common stock, par value $0.0001 per share
Class C common stock, par value $0.0001 per share
(Title of each Class)
Indicate by check mark if the registrant is a well-known seasoned issuer, as defined in Rule 405 of the Securities Act. Yes þ No ¨
Indicate by check mark if the registrant is not required to file reports pursuant to Section 13 or 15(d) of the Act. Yes ¨ No þ
Indicate by check mark whether the registrant (1) has filed all reports required to be filed by Section 13 or 15(d) of the Securities Exchange Act of 1934 during the preceding 12 months (or for such shorter period that the registrant was required to file such reports), and (2) has been subject to such filing requirements for the past 90 days. Yes þ No ¨
Indicate by check mark whether the registrant has submitted electronically and posted on its corporate website, if any, every Interactive Data File required to be submitted and posted pursuant to Rule 405 of Regulation S-T (§232.405 of this chapter) during the preceding 12 months (or for such shorter period that the registrant was required to submit and post such files). Yes þ No ¨
Indicate by check mark if disclosure of delinquent filers pursuant to Item 405 of Regulation S-K is not contained herein, and will not be contained to the best of registrant’s knowledge, in definitive proxy or information statements incorporated by reference in Part III of this Form 10-K or any amendment to this Form 10-K. þ
Indicate by check mark whether the registrant is a large accelerated filer, an accelerated filer, a non-accelerated filer, smaller reporting company, or an emerging growth company. See the definitions of “large accelerated filer” “accelerated filer,” “smaller reporting company,” and "emerging growth company" in Rule 12b-2 of the Exchange Act. (Check one):
Large accelerated filer þ | Accelerated filer o | Smaller reporting company o |
Non-accelerated filer o (Do not check if a smaller reporting company) | Emerging growth company o | |
Indicate by check mark whether the registrant is a shell company (as defined in Rule 12b-2 of the Exchange Act). Yes ¨ No þ
The aggregate market value of the registrant’s class A common stock, par value $0.0001 per share, held by non-affiliates (using the New York Stock Exchange closing price as of March 31, 2017, the last business day of the registrant’s most recently completed second fiscal quarter) was approximately $164.1 billion. There is currently no established public trading market for the registrant’s class B common stock, par value $0.0001 per share, or the registrant’s class C common stock, par value $0.0001 per share.
As of November 10, 2017, there were 1,813,463,251 shares outstanding of the registrant’s class A common stock, par value $0.0001 per share, 245,513,385 shares outstanding of the registrant’s class B common stock, par value $0.0001 per share, and 12,665,935 shares outstanding of the registrant’s class C common stock, par value $0.0001 per share.
DOCUMENTS INCORPORATED BY REFERENCE
Portions of the Registrant’s Proxy Statement for the 2018 Annual Meeting of Stockholders are incorporated herein by reference in Part III of this Annual Report on Form 10-K to the extent stated herein. Such Proxy Statement will be filed with the Securities and Exchange Commission within 120 days of the Registrant’s fiscal year ended September 30, 2017.
TABLE OF CONTENTS
Page | ||
Item 1 | ||
Item 1A | ||
Item 1B | ||
Item 2 | ||
Item 3 | ||
Item 4 | ||
Item 5 | ||
Item 6 | ||
Item 7 | ||
Item 7A | ||
Item 8 | ||
Item 9 | ||
Item 9A | ||
Item 9B | ||
Item 10 | ||
Item 11 | ||
Item 12 | ||
Item 13 | ||
Item 14 | ||
Item 15 | ||
Unless the context indicates otherwise, reference to "Visa," "Company," "we," "us" or "our" refers to Visa Inc. and its subsidiaries.
"Visa" and our other trademarks referenced in this report are Visa's property. This report may contain additional trade names and trademarks of other companies. The use or display of other companies' trade names or trademarks does not imply our endorsement or sponsorship of, or a relationship with these companies.
2
Forward-Looking Statements:
This Annual Report on Form 10-K contains forward-looking statements within the meaning of the U.S. Private Securities Litigation Reform Act of 1995 that relate to, among other things, our future operations, prospects, developments, strategies and growth of our business; integration of Visa Europe, including the migration of European activity to VisaNet and anticipated benefits for our European clients; anticipated expansion of our products in certain countries; industry developments; expectations regarding litigation matters, investigations and proceedings; timing and amount of stock repurchases; sufficiency of sources of liquidity and funding; effectiveness of our risk management programs; and expectations regarding the impact of recent accounting pronouncements on our consolidated financial statements. Forward-looking statements generally are identified by words such as "believes," "estimates," "expects," "intends," "may," "projects," “could," "should," "will," "continue" and other similar expressions. All statements other than statements of historical fact could be forward-looking statements, which speak only as of the date they are made, are not guarantees of future performance and are subject to certain risks, uncertainties and other factors, many of which are beyond our control and are difficult to predict. We describe risks and uncertainties that could cause actual results to differ materially from those expressed in, or implied by, any of these forward-looking statements in Item 1—Business, Item 1A—Risk Factors, Item 7—Management's Discussion and Analysis of Financial Condition and Results of Operations and elsewhere in this report. Except as required by law, we do not intend to update or revise any forward-looking statements as a result of new information, future events or otherwise.
3
PART I
ITEM 1. Business
OVERVIEW
Visa is a global payments technology company that enables fast, secure and reliable electronic payments across more than 200 countries and territories. We facilitate global commerce through the transfer of value and information among a global network of consumers, merchants, financial institutions, businesses, strategic partners, and government entities. Our advanced transaction processing network, VisaNet, enables authorization, clearing, and settlement of payment transactions and allows us to provide our financial institution and merchant clients with a wide range of products, platforms, and value-added services.
Our mission is to connect the world through the most innovative, reliable, and secure payment network – enabling individuals, businesses, and economies to thrive. To deliver on this mission, we are focused on seven strategic pillars:

4
Our focus, expertise, and assets have enabled Visa to become one of the world’s largest retail electronic payments networks based on payments volume and number of transactions.
Visa Network
Visa connects millions of consumers and businesses every day through the power of our network.
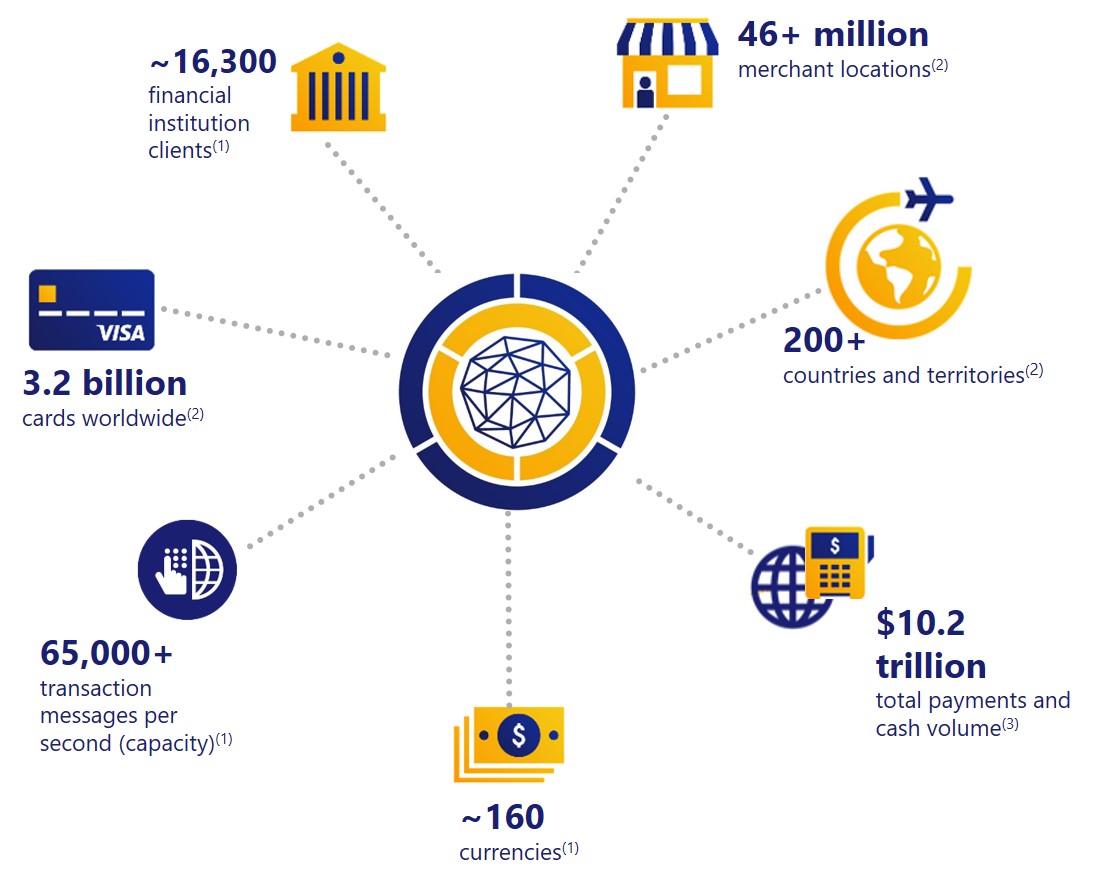
(1) | As of September 30, 2017 |
(2) | As of June 30, 2017 |
(3) | Transacted on our payment products for the 12 months ended June 30, 2017 |
5
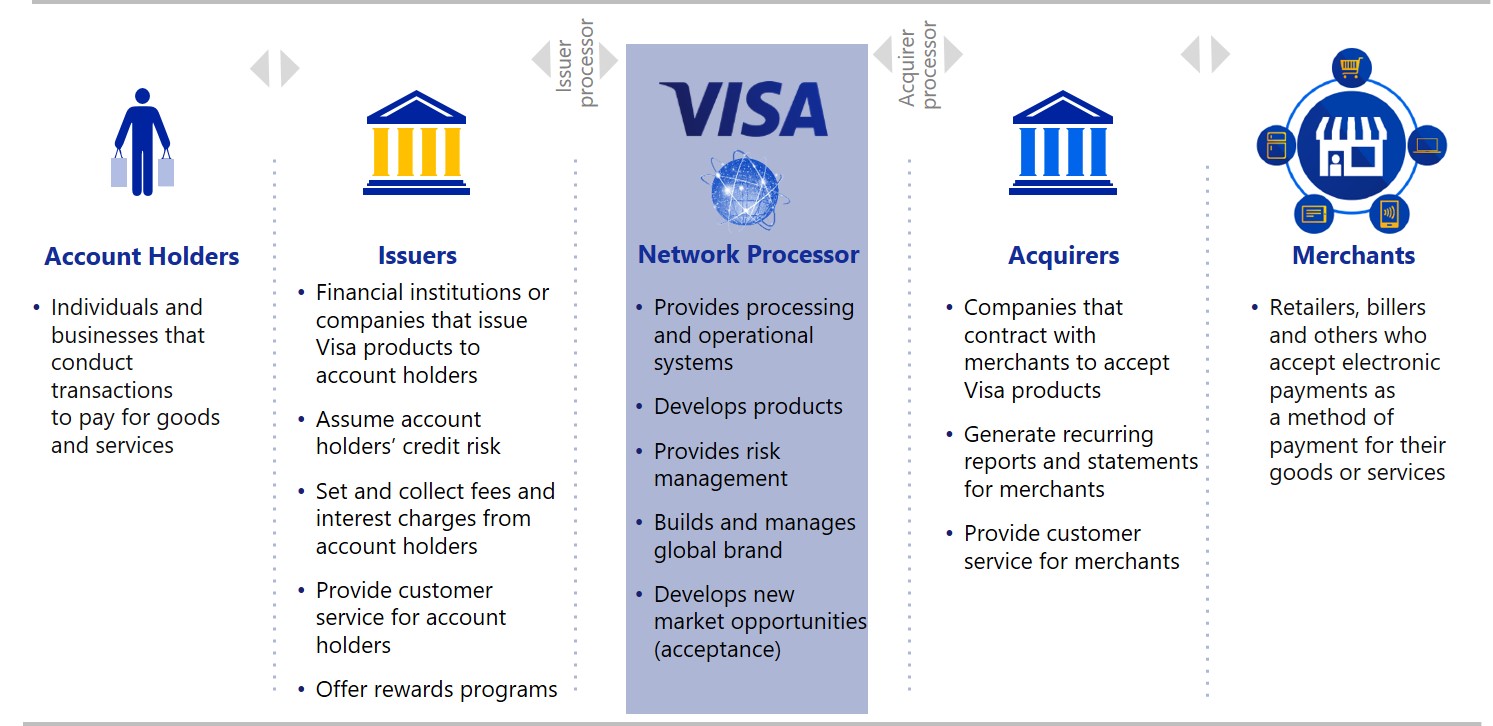
Visa operates in a four party model, which includes card issuing financial institutions, acquirers, and merchants. We are not a bank and do not issue cards, extend credit, or set rates and fees for account holders on Visa products. Generally, our financial institution clients are responsible for managing account holder and merchant relationships.
Visa does not earn revenues from, or bear credit risk with respect to, interest or fees paid by account holders on Visa products. Interchange reimbursement fees represent a transfer of value between the financial institutions participating in our open-loop payments network. We administer the collection and remittance of interchange reimbursement fees through the settlement process, but we generally do not receive any revenue related to interchange reimbursement fees. In addition, we do not receive as revenue the fees that merchants are charged directly for acceptance by their acquirers.
Visa Brand
The Visa brand is one of the world's most recognized, trusted, and valuable brands. Anchored on the notion that Visa is "everywhere you want to be," the brand stands for acceptance, security, convenience, speed, and reliability. In recognition of its strength among clients and consumers, the Visa brand is ranked highly in a number of widely recognized brand studies, including BrandZ Top 100 Most Valuable Global Brands Study, Forbes World’s Most Valuable Brands, Interbrand's Best Global Brands, and YouGov Brand Index. Our brand strength helps us to deliver added value to financial institutions, merchants, and other clients through compelling brand expressions, expanded products and services, and innovative marketing efforts.
6
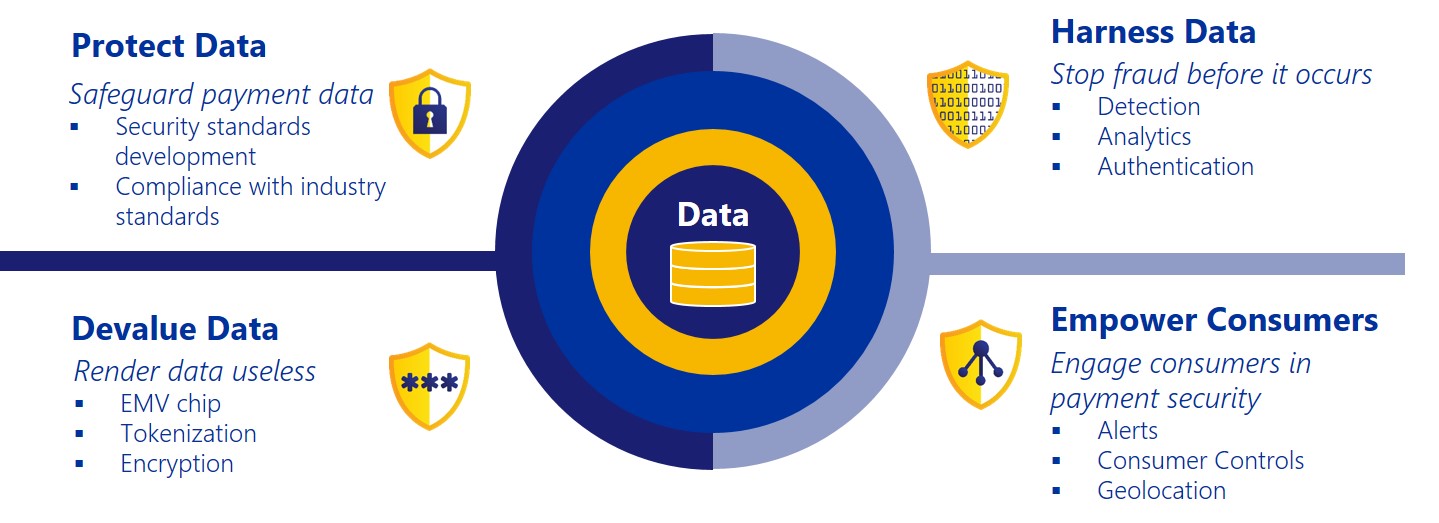
Payment Security
Visa has focused its investments, partnerships, and expertise to enhance the security of our network, and to enable consumers and businesses to pay and be paid with confidence. As payments methods evolve, we are focused on four primary areas:
• | Protecting payment data with a payments architecture that complies with industry standards; |
• | Rendering the use of sensitive payment data useless by deploying technologies such as the EMV chip and tokenization; |
• | Using predictive analytics, intelligence, and insights to identify and prevent fraud before it happens; and |
• | Empowering consumers to actively protect their own financial information and transactions. |
7
Fiscal 2017 Key Statistics (including Visa Europe)(1)
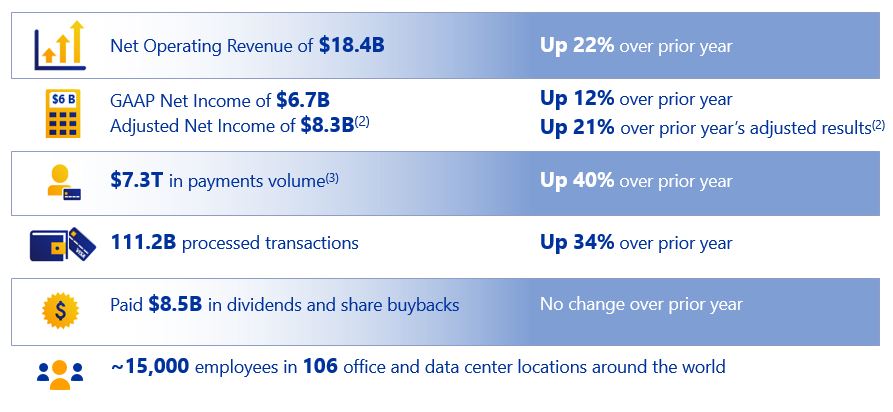
(1) | Figures and period-over-period percentages reflect the inclusion of Visa Europe for the full year of fiscal 2017. We acquired Visa Europe on June 21, 2016. |
(2) | Please see Item 7—Management's Discussion and Analysis of Financial Condition and Results of Operations for a reconciliation of our adjusted financial results. |
(3) | For the 12 months ended June 30, 2017, upon which fiscal 2017 service revenues are based. |
KEY INITIATIVES
Visa Europe Integration
In fiscal 2017, we made significant progress on integrating Visa Europe into the broader Visa group following our completion of the acquisition in June 2016. We streamlined and integrated our European functions with the global Visa organization and bolstered the European leadership team. We invested in launching a suite of digital products, including Visa Checkout and Visa Commerce Network, and entered into new strategic partnerships, including Klarna and Paypal, to spur innovation and drive usage and acceptance. We made significant progress in our multi-year effort to harmonize our respective technology systems and prepare for European client migrations onto VisaNet beginning in fiscal 2018. Along with our new innovation center in London, we believe these efforts will help bring more enhanced capabilities as well as provide greater scale and additional levels of cybersecurity for our European clients. In addition, we made significant progress in entering into new commercial agreements with our European clients to transition the business from the prior association business model to a for-profit model. These new commercial arrangements have led to an increase in client incentives as we have replaced the rebates in effect under the prior model.
Technology Transformation
Visa is primarily a technology company. In fiscal 2015, we embarked on a multi-year journey to transform our use of technology. We have increased our technology employee footprint by more than 2,000 globally over the past three years, including nearly 1,000 new college graduates, replacing a significant percentage of our contractor and vendor spend. We are making steady progress on our technology strategic roadmap, resulting in enhanced services in the payments ecosystem and positive impacts to our infrastructure. Since the launch of Visa’s Developer Platform (VDP) in fiscal 2016, we have made our application program interfaces (APIs) available to our developers, clients, and partners. VDP offers them access to Visa technology, services, and tools, and provides safe testing environments for the development of new digital payments and commerce solutions. We added new services to enable clients to develop support for tokenized transactions and create new and innovative solutions in mobile, ecommerce, and digital face-to-face transactions.
8
Cybersecurity remains a top focus, and in fiscal 2016 we launched our Threat Intelligence Fusion Platform, a cyber command and control center that provides integrated cybersecurity operations to further protect our data and assets. In fiscal 2017, we continued to embed security earlier in the software development lifecycle to further strengthen our security posture. New open technologies have been added systematically to our infrastructure and platform components. We continue to bolster the resiliency of our infrastructure and application services to provide high availability of our client services.
How We Work with Partners – Innovation Centers, Visa Developer Program, Certifications, and Startups
To drive new solutions in the payments space and accelerate the proliferation of safe and fast digital payments, we opened a new innovation center in London in fiscal 2017. Our innovation centers foster collaboration with our financial institution clients, merchants, partners, and developers across the regions to spur the creation of the next generation of payments and commerce applications and solutions. By providing access to Visa capabilities through an open network of APIs, the Visa Developer Platform allows global partners to transform ideas into new digital commerce experiences. Visa’s Everywhere Initiative is an innovation program in over 40 countries designed to generate and harness ideas within the start-up community to solve business problems, influence Visa's product development, and support Visa's clients. Visa makes minority investments in companies around the world that we believe will further our vision and strategic objectives, support deeper engagement with key partners, and expand access to payment solutions worldwide. In addition, through the Visa Ready certification program, we provide the structure that allows partners to introduce devices, software, and solutions that can securely initiate or accept Visa payments.
PRODUCTS & SERVICES
Core Products
Debit: Debit cards are issued by financial institutions to allow consumers and small businesses to purchase goods and services using funds held in their demand deposit accounts. Debit cards enable cardholders to transact – in person, online, or via mobile – without needing cash or checks and without accessing a line of credit. Visa provides a strong brand; the network infrastructure and processing; acceptance; product features and support; risk tools and services; and industry expertise to help issuers optimize their debit offerings.
Credit: Credit cards are issued by financial institutions to allow consumers and businesses to access credit to pay for goods and services. Visa does not extend credit; however, we provide combinations of card benefits, including technology, authorization, fraud tools, and brand support that financial institutions use to support and enable their credit products. We also partner with our clients on product design, consumer segmentation, and consumer experience design to help financial institutions better deliver products and services that match their consumers’ needs.
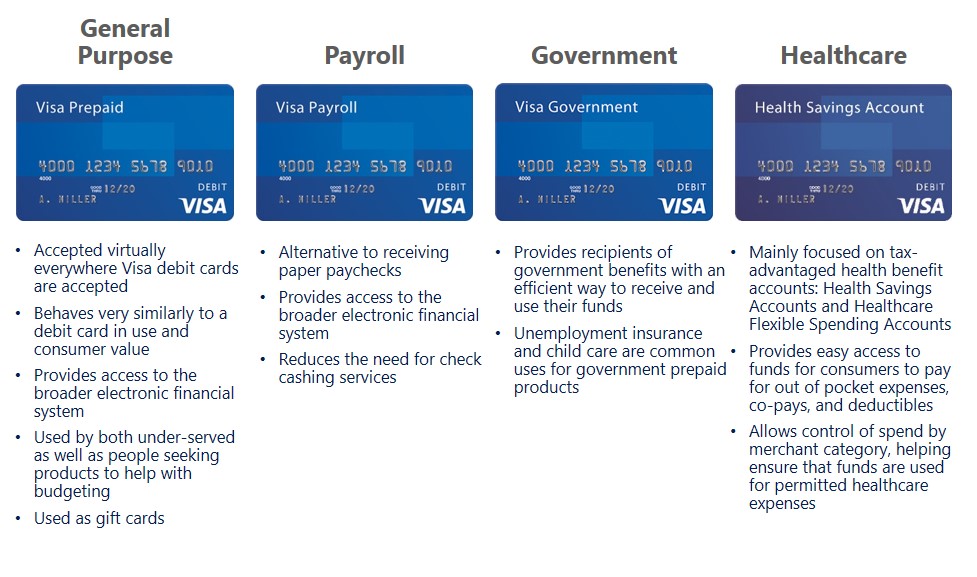
Prepaid: Prepaid products draw from a designated balance funded by individuals, corporations, or governments. Prepaid cards address many consumer-use cases and needs including, general purpose reloadable, payroll, government and corporate disbursements, healthcare, gift, and travel. Prepaid cards also play an important part in financial inclusion, bringing payment solutions to those with limited or no access to traditional banking products.
9
Commercial: We offer a portfolio of commercial payment solutions including corporate (travel) cards, purchasing cards, virtual accounts, and disbursement accounts covering all major industry segments. The commercial category is a portfolio of solutions designed to bring efficiency, controls, and automation to commercial and government payment processes ranging from employee travel to fully integrated, invoice-based payables. Beyond payment processing, we provide comprehensive data management solutions, consulting and analytics support, and integration capabilities. We support financial institutions, partners in the accounts payable space, and technology companies as they build and expand their commercial payment platforms.
Global ATM: The Visa/PLUS Global ATM network provides account holders with convenient cash access in more than 200 countries and territories worldwide through issuing and acquiring partnerships with both financial institutions and independent ATM operators.
Processing Infrastructure
VisaNet authorizes, clears, and settles transactions processed by Visa, excluding transactions within Europe, which are routed through different software and hardware platforms in the United Kingdom (UK) to perform authorization, clearing, and settlement in Europe. VisaNet consists of multiple synchronized processing centers that are linked by a global telecommunications network and engineered for minimal downtime and uninterrupted connectivity. We are in the process of integrating Visa Europe's processing systems with VisaNet. Until that process is completed, we will continue to maintain the current authorization, clearing, and settlement systems in Europe while ensuring interoperability between such systems and VisaNet.
VisaNet provides secure and reliable payments around the world and is capable of handling more than 65,000 transaction messages a second. VisaNet is built on a centralized architecture, which allows us to analyze each authorization we process in real time and provide value-added processing services such as risk scoring and tokenization. It provides the infrastructure for delivering innovation and other payment system enhancements for domestic payment systems and cross-border international transactions globally. In fiscal 2017, Visa processed over 111.2 billion payment and cash disbursement authorization transactions globally.
A typical Visa transaction begins when an account holder presents his or her Visa product to a merchant as payment for goods or services. The transaction is then sent to the merchant's acquirer and routed to an issuer for an authorization decision. The transaction is either approved or declined and routed back to the acquirer and merchant usually in a matter of seconds.
10
Transaction Processing Services
Our core transaction processing services involve the routing of payment information and related data to facilitate the authorization, clearing, and settlement of transactions between our issuers and acquirers. Our processing services also address the varied needs of other participants in the evolving payments ecosystem, through such offerings as our merchant gateway and Visa Debit Processing Services (DPS) for issuer processing. Merchant gateway services, provided through CyberSource, enable merchants to accept, process, and reconcile payments, manage fraud and safeguard payment security online and at the physical point of sale. CyberSource additionally enables acquirers and other partners to offer these services to their merchants. Visa DPS provides comprehensive issuer processing services for participating issuers of Visa debit, prepaid, and ATM products. Value-added offerings by Visa DPS to issuer clients include: fraud and risk services, data analytics, marketing campaign management, mobile and digital solutions, back office tools and services, card fulfillment and management, network gateway services, call centers, and web hosting solutions. These and other services support our issuers and acquirers and their use of our products, and promote the growth and security of our payments network.
Digital Products
Visa Checkout: Visa Checkout offers consumers an expedited and secure payment experience for online and mobile transactions wherever Visa Checkout is offered. Visa Checkout helps merchants attain higher rates of completed purchases from their consumers, a particularly important feature as digital commerce shifts from desktop devices to mobile devices, where shoppers have been less likely to complete purchases from their shopping carts. At the end of fiscal 2017, Visa Checkout had over 25 million consumer accounts in 26 countries, seven languages and over 1,600 financial institution partners participating, amounting to $3.8 billion in transaction dollars. More than 350,000 merchants, including some of the largest global retailers, accept Visa Checkout. In fiscal 2017, our product enhancement focus was making Visa Checkout more convenient for consumers to sign in and sign up by enabling biometric sign in. We also successfully piloted a stay-signed-in feature that verifies account holders on their device, allowing a consumer to checkout in as little as two clicks.
Visa Direct: Visa Direct is Visa’s real-time “push” payments platform that allows businesses, governments, and consumers to use the Visa network to transfer funds from an originating account to another via a debit, prepaid, or credit card number. This platform enables faster payments solutions for a range of new use cases, including person-to-person (P2P), disbursements, bill pay, and micro merchant payments. At the end of fiscal 2017, there were over 1 billion Visa debit, prepaid, and credit cards enabled for real-time receipt of funds, providing global scale and reach for partners. Issuers, acquirers, processors, and merchants are able to leverage our existing network connections to build new services, capabilities, and solutions. We have partnered with Adyen, Braintree, Hyperwallet, Ingo Money, OnDeck, PayPal, Stripe and Vantiv to incorporate Visa Direct into their payment solutions. Additionally, in emerging markets, push payments enable mobile applications to allow consumers to use their mobile device to “push” money to a business account via a QR code for payment of goods and services. Visa’s scan-and-pay functionality enables low-cost, low-barrier alternatives for promoting digital payment acceptance for small merchants. Visa has successfully launched merchant-presented QR technology that utilizes Visa Direct in India, Kenya, and Nigeria, and is continuing to work on developing common standards for QR code payments to ensure global interoperability, which is key to the growth of the push payments ecosystem. Work is currently underway to launch QR technology with Visa Direct in 12 additional markets over the next year.
Visa Token Service: The Visa Token Service replaces the card account numbers from the transaction with a token. Tokenization helps to protect consumer financial information and lessen the risk of stolen card credentials, particularly when information regarding a financial instrument is stored on a device, such as a mobile phone or wearable, or is stored on file at an ecommerce merchant. In fiscal 2017, we expanded Visa Token Service to 29 markets and are actively engaged in tokenizing accounts. We also enabled wearables providers FitBit and Garmin to embed Visa tokens in their devices. Finally, we announced a new program to drive acceleration into Internet-of-Things (IoT) payments. Visa Ready for IoT allows certified third-party service providers such as Gemalto, Giesecke & Devrient, FitPay, Infosys, PriNum, and Inside Secure to connect directly to our token service and become Token Service Providers (TSPs). These TSPs will be able to provide a range of services to support Visa tokens for issuers and token requestors, including new account provisioning and life cycle management. By expanding access to the Visa Token Service to new partners, we expect Visa issuers and other partners to be able to more quickly and easily offer secure digital payment services across a wide range of solutions.
11
Merchant Products
Visa has a suite of products and services to help merchants reduce their payment fraud and improve their customer engagement. Visa Advertising Solutions, Visa Commerce Network, and CyberSource’s product offerings are examples of Visa’s continued investment to deliver industry-leading products and capabilities to our merchant partners.
Visa Advertising Solutions is a service that allows merchants to better target and track the efficacy of their digital campaigns. Visa partners with strategic advertising technology companies to help deliver targeting and measurement capabilities using aggregated and de-identified spend insights. Visa Commerce Network uses Visa’s global payments network to enable merchants to promote relevant offers to acquire new customers, drive loyalty, and increase sales. For example, Uber and Visa Commerce Network have partnered to introduce Visa Local Offers, a card-linked offer program that rewards enrolled U.S. Visa account holders for shopping at thousands of featured merchants in the United States. Uber credits are awarded to the riders’ Uber accounts automatically on qualifying purchases – eliminating the need for coupons or promo codes.
The CyberSource platform enables merchants to manage online, mobile, and in-person payments. CyberSource offers solution packages tailored for merchants, acquirers, and technology partners. CyberSource offers a secure, integrated commerce solution that gives businesses the flexibility to select the ecommerce or point-of-sale platform, financial partner, and hardware of their choice. CyberSource enables businesses to accept payments from over 200 countries and territories across the world through its acquirer and processor connections and its Token Management Service provides a 360 degree view of customer purchases across all sales channels. The CyberSource Decision Manager fraud management service helps businesses minimize fraud losses, maximize revenue, and control costs. The solution combines advanced machine learning methods, a flexible rules engine, and insights derived from billions of CyberSource and Visa transactions. CyberSource's small business solutions are represented by the Authorize.Net brand in North America and the United Kingdom. CyberSource and Authorize.Net capabilities are offered through Visa and our partners.
Risk Products & Payment Security Initiatives
We continue to develop our suite of risk products and services to help clients minimize risk and enable secure commerce. Visa Risk Manager is a decision-making solution that helps issuers improve loss prevention and profitability through enhanced risk evaluation capabilities. Products like Visa Advanced Authorization evaluate the risk associated with every participating VisaNet transaction. In addition to reducing fraud, clients can increase approval rates by utilizing Visa's risk products that provide more insightful, real-time information and accept transactions that were once deemed too risky. For example, Mobile Location Confirmation, a service that enhances Visa Advanced Authorization by adding geolocation intelligence in real time, informs issuers if their participating account holder’s mobile phone is near a purchase location. This new data improves the issuer’s ability to make more informed decisions. Another tool that issuers can utilize across their entire card portfolio is Transaction Controls, which allows account holders to place restrictions on their enrolled cards that define when, where, and how those cards can be used to better manage account spending and security.
We have also extended our fraud prediction capabilities to merchants via Visa Transaction Advisor, which provides real-time analytics and identifies suspicious transactions that require additional verification before the transaction is processed. Visa's use of 3-D Secure technology is designed to make digital transactions safer by using risk-based authorization in real-time. Additionally, in fiscal 2017, Visa acquired CardinalCommerce, an industry leader in digital payment authentication. The acquisition enables Visa to help reduce fraud and support digital commerce.
Beyond our risk products and services, we continue to work with the Payment Card Industry Security Standards Council, EMVCo, and other industry standards organizations to develop and support standards for payment data security, EMV chip payment technology, tokenization, and 3-D Secure 2.0. We also partner with clients, merchants, governments, and law enforcement agencies to help identify fraud and share information about security best practices, threat intelligence, and legal and regulatory developments.
OTHER BUSINESS DEVELOPMENTS
Visa Foundation. In fiscal 2017, we established the Visa Foundation, a nonprofit public benefit corporation, aimed at enabling economic opportunity for the underserved, with a particular focus on helping low-income micro and small enterprises thrive. In February 2017, the foundation was funded with a contribution of 2.2 million shares of Visa class A common stock to advance these goals.
12
Capital Structure. In September 2017, we issued $2.5 billion of senior notes with maturities ranging between 5 and 30 years. Subsequent to our fiscal year-end, in October 2017, we used the majority of the proceeds from this new debt to redeem the $1.75 billion of senior notes scheduled to mature in December 2017.
INTELLECTUAL PROPERTY
We own and manage the Visa brand, which stands for acceptance, security, convenience, speed, and reliability. Our portfolio of trademarks, in particular our family of Visa marks, our PLUS mark, and our Dove design mark, are important to our business. We give our clients access to these assets through agreements with our issuers and acquirers, which authorize the use of our trademarks in connection with their participation in our payments network. We also own a number of patents, patent applications, and other intellectual property relating to payment solutions, transaction processing, security systems, and other matters. We rely on a combination of patent, trademark, copyright, and trade secret laws in the United States and other jurisdictions, as well as confidentiality procedures and contractual provisions, to protect our proprietary technology.
13
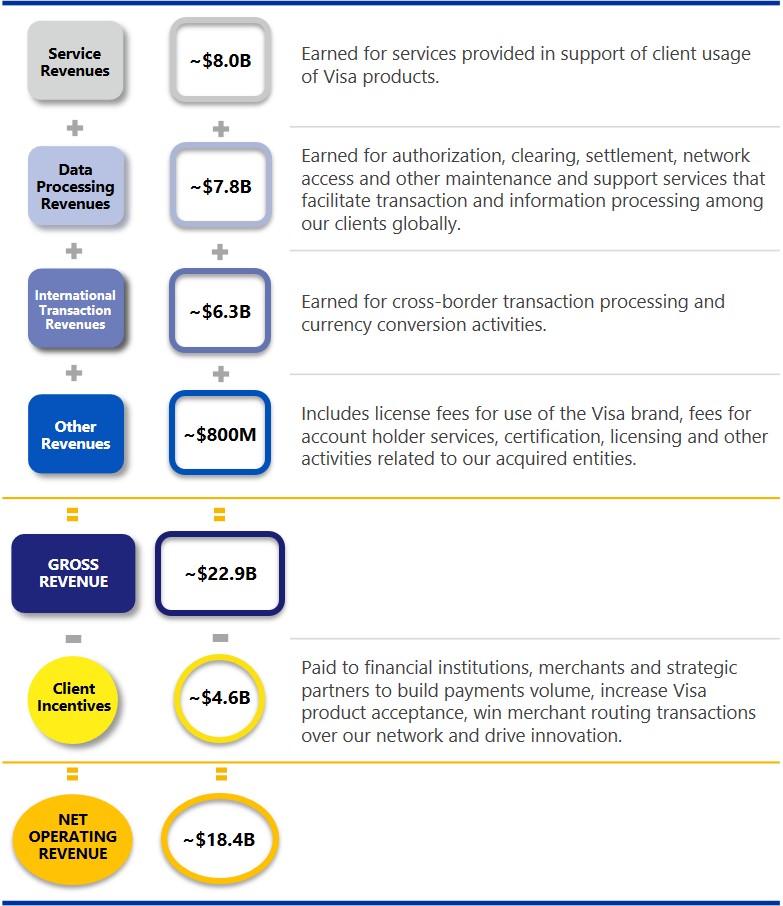
NET OPERATING REVENUES
Our gross revenues are principally comprised of service revenues, data processing revenues, international transaction revenues, and other revenues. Net operating revenues are gross revenues reduced by costs incurred under client incentive arrangements. We have one reportable segment, Payment Services.
Revenue Details
14
COMPETITION
The global payments industry continues to undergo dynamic change. Existing and emerging competitors compete with Visa's network and payment solutions for consumers and for participation by financial institutions and merchants. Technology and innovation are shifting consumer habits and driving growth opportunities in ecommerce, mobile payments, block chain technology, and digital currencies. These advances are enabling new entrants, many of which depart from traditional network payment models. In certain countries, the evolving regulatory landscape is changing how we compete, creating local networks, or enabling processing competition.
We compete against all forms of payment. This includes paper-based payments, primarily cash and checks, and all forms of electronic payments. Our electronic payment competitors principally include:
Global or Multi-Regional Networks, which typically offer a range of branded, general purpose card payment products that can be used at millions of merchant locations around the world. Examples include MasterCard, American Express, Discover, JCB, and UnionPay. These competitors may be more concentrated in specific geographic regions, such as JCB in Japan and Discover in the United States, or have a leading position in certain countries. For example, UnionPay operates the sole domestic acceptance mark in China and is expanding into other global markets. See Item 1A—Risk Factors—Regulatory Risks—Government-imposed restrictions on payment systems may prevent us from competing against providers in certain countries, including significant markets such as China and Russia. Based on available data, Visa is one of the largest retail electronic funds transfer networks used throughout the world. The following chart compares our network with these network competitors for calendar year 2016(1):
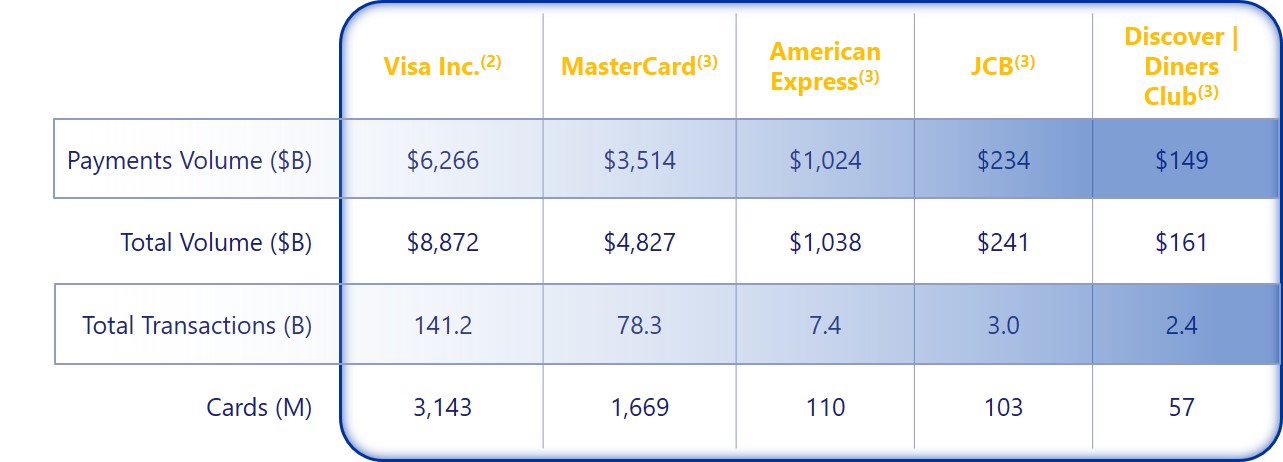
(1) | UnionPay, which operates primarily within the Chinese domestic market, is not included in this table as Visa currently does not compete in that market under local law. Although we are uncertain how UnionPay reports certain volumes, reportedly its numbers could approach or exceed some of those listed in this chart. |
(2) | The data presented are provided by our financial institution clients, inclusive of Europe for the second half of calendar year 2016. Previously submitted information may be updated and all data are subject to review by Visa. |
(3) | MasterCard, American Express, JCB and Discover/Diners Club data sourced from The Nilson Report issue 1109 (May 2017). Includes all consumer and commercial credit, debit and prepaid cards. Some figures are estimates and currency figures are in U.S. dollars. MasterCard excludes Maestro and Cirrus figures. American Express includes figures for third-party issuers. Discover figures consist of U.S. data only and include third-party issuers. JCB figures include third-party issuers and other payment-related products. |
Local and regional networks, that operate in many countries, often with the support of government influence or mandate. In some cases, they are owned by financial institutions. These networks typically focus on debit payment products, have functionality or their brand marks present with the Visa brand on the card or payment device, and may have strong local acceptance, and recognizable brands. Examples include STAR, NYCE, and Pulse in the United States, Interac in Canada, EFTPOS in Australia and Mir in Russia.
Alternate Payment Providers, which often have a primary focus of enabling payments through ecommerce and mobile channels, but which are expanding or may expand their offerings to the physical point of sale. These companies may process payments using in-house account transfers between parties, electronic funds transfer networks like the Automated Clearing House (ACH), or global or local networks like Visa. In some cases, these entities are both a partner and a competitor to Visa. Examples of alternate payment providers include PayPal, Alipay, and WeChat. Alipay and WeChat Pay are among the fastest growing mobile payment providers in the world and may pose a competitive challenge to Visa and other international networks outside of China.
15
Other Electronic Payments Networks like the ACH in the United States are often regulated by local governments. Historically focused on interbank transfers, many are adding capabilities that may make them more competitive for retail payments. MasterCard acquired VocaLink Holdings Limited in 2016, which provides faster payments technology that competes with our Visa Direct offering. We also compete with closed-loop payment systems, emerging payments networks like Zelle, wire transfers, and electronic benefit transfers.
Payment Processors, which we compete with for the processing of Visa transactions or which may benefit from mandates requiring them to handle processing under local regulation. For example, as a result of regulation in Europe under the Interchange Fee Regulation (IFR), we may face competition from other networks, processors, and other third-parties who could process Visa transactions directly with issuers and acquirers.
We also face increasingly intense competitive pressure on the prices we charge our financial institution clients. We believe our fundamental value proposition of acceptance, security, convenience, speed, and reliability offers us a key competitive advantage. We succeed in part because we understand the needs of the individual markets in which we operate and partner with local financial institutions, merchants, governments, non-governmental organizations, and business organizations to provide tailored solutions. We believe Visa is well-positioned competitively, due to our global brand, our broad set of Visa-branded payment products, and our proven track record of processing payment transactions securely and reliably through VisaNet.
SEASONALITY
We generally do not experience any pronounced seasonality in our business. No individual quarter of fiscal 2017 or fiscal 2016 accounted for more than 30% of our operating revenues in those years.
WORKING CAPITAL
Payments settlement due to and from our financial institution clients can represent a substantial daily working capital requirement. Most U.S. dollar settlements are settled within the same day and do not result in a receivable or payable balance, while settlement in currencies other than the U.S. dollar generally remain outstanding for one to two business days, which is consistent with industry practice for such transactions.
FINANCIAL INFORMATION ABOUT GEOGRAPHIC AREAS
For more information on the concentration of our operating revenues and other financial information, see Note 12—Enterprise-wide Disclosures and Concentration of Business to our consolidated financial statements included in Item 8—Financial Statements and Supplementary Data of this report.
GOVERNMENT REGULATION
As a global payments technology company, we are subject to complex and evolving global regulations in the various jurisdictions in which our products and services are used. The most significant government regulations that impact our business are discussed below. For further discussion of how global regulations may impact our business, see Item 1A—Risk Factors—Regulatory Risks.
Supervisory Oversight of the Payments Industry. Visa is subject to financial sector oversight and regulation in substantially all of the jurisdictions in which we operate. In the United States, for example, the Federal Financial Institutions Examination Council (FFIEC) has supervisory oversight over Visa under applicable federal banking laws and policies as a technology service provider to U.S. financial institutions. The federal banking agencies comprising the FFIEC are the Federal Reserve Board, the Comptroller of the Currency, the Federal Deposit Insurance Corporation, the National Credit Union Administration, and the Consumer Financial Protection Bureau (CFPB). Visa also may be separately examined by the CFPB as a service provider to the banks that issue Visa-branded consumer credit and debit card products. Central banks in other countries, including Russia, Ukraine, Hong Kong and the United Kingdom (as discussed below), have recognized or designated Visa, for purposes of various degrees of financial stability regulation, as a retail payment system. Visa is also subject to oversight by banking and financial sector authorities in other jurisdictions, such as Brazil, Mexico, Uruguay and Colombia.
Government-imposed Market Participation and Restrictions. Certain governments, including China, Russia, Indonesia, and India, have taken actions to advantage domestic payments systems and/or certain issuers, payments networks, or processors, including by imposing regulations that favor domestic providers, impose local ownership requirements on processors, or mandate domestic processing be done entirely in that country.
16
Interchange Rates and Fees. An increasing number of jurisdictions around the world regulate or influence debit and credit interchange reimbursement rates in their regions. For example, the Dodd-Frank Wall Street Reform and Consumer Act (Dodd-Frank Act) in the United States limits interchange reimbursement rates for certain debit card transactions, the European Union's (EU) IFR limits interchange rates in Europe (as discussed below) and the Reserve Bank of Australia regulates average permissible levels of interchange.
Network Exclusivity and Routing. In the United States, the Dodd-Frank Act limits network exclusivity and preferred routing arrangements for the debit and prepaid market segments. Other jurisdictions impose similar limitations, such as the IFR’s prohibition on restrictions that prevent multiple payment brands or functionality on the same card.
No-surcharge Rules. We have historically enforced rules that prohibit merchants from charging higher prices to consumers who pay using Visa products instead of other means. However, merchants’ ability to surcharge varies by geographic market as well as Visa product type, and continues to be impacted by litigation, regulation, and legislation.
Privacy and Data Protection. Aspects of our operations or business are subject to privacy, data use and data security regulations, which impact the way we use and handle data, operate our products and services, and even impact our ability to offer a product or service. In addition, regulators are proposing new laws or regulations which could require Visa to adopt certain cybersecurity and data handling practices. In many jurisdictions consumers must be notified in the event of a data breach, and such notification requirements continue to increase in scope and cost. The changing privacy laws in the United States, Europe and elsewhere, including the adoption by the European Union of the General Data Protection Regulation, which will become effective in May 2018, create new individual privacy rights and impose increased obligations on companies handling personal data.
Anti-corruption, Anti-money Laundering, Anti-terrorism, and Sanctions. We are subject to anti-corruption laws and regulations, including the U.S. Foreign Corrupt Practices Act (FCPA), the UK Bribery Act, and other laws that generally prohibit the making or offering of improper payments to foreign government officials and political figures for the purpose of obtaining or retaining business or to gain an unfair business advantage. We are also subject to anti-money laundering and anti-terrorist financing laws and regulations, including the U.S. Bank Secrecy Act and the USA PATRIOT Act. In addition, we are subject to economic and trade sanctions programs administered by the Office of Foreign Assets Control (OFAC) in the United States. Therefore, we do not permit financial institutions or other entities that are domiciled in countries or territories subject to comprehensive OFAC trade sanctions (currently, Cuba, Iran, North Korea, Syria, and Crimea), or that are included on OFAC's list of Specially Designated Nationals and Blocked Persons, to issue or acquire Visa-branded cards or engage in transactions using our services.
Internet Transactions. Many jurisdictions have adopted regulations that require payments system participants to monitor, identify, filter, restrict, or take other actions with regard to certain types of payment transactions on the Internet, such as gambling and the purchase of cigarettes or alcohol.
Additional Regulatory Developments. Various regulatory agencies also continue to examine a wide variety of other issues, including mobile payment transactions, tokenization, access rights for non-financial institutions, money transfer, identity theft, account management guidelines, disclosure rules, security, and marketing that could affect our financial institution clients and us.
European Regulations and Supervisory Oversight. In addition, following the Visa Europe acquisition in June 2016, we are subject to complex and evolving regulation of our business in the European Economic Area. Visa Europe has been designated as a Recognized Payment System in the United Kingdom, bringing it within the scope of the Bank of England’s oversight and subject to various requirements, including on issues such as governance and risk management designed to maintain the stability of the UK financial system. Visa Europe is also subject to the Eurosystem’s oversight, whose main focus is on the functioning of card payments, as well as the security, operational reliability, and business continuity of the schemes and their payment instruments. Furthermore, Visa Europe is regulated by the United Kingdom’s Payment Systems Regulator (PSR), which has wide ranging powers and authority to review our business practices, systems, rules and fees with respect to promoting competition and innovation in the United Kingdom, and ensuring payments meet account holder needs. It also is the regulator responsible for monitoring Visa Europe's compliance with the IFR in the United Kingdom. The IFR regulates interchange rates within Europe, requires Visa Europe to separate its payment card scheme activities from processing activities for accounting, organization, and decision making purposes within the European Union and imposes limitations on network exclusivity and routing. National competent authorities in other EU markets and the European
17
Central Bank itself have the ability not only to monitor Visa's compliance with the IFR but also to impose their own oversight regimes.
There are other regulations in the European Union that impact our business, as discussed above, including, privacy and data protection, anti-bribery, anti-money laundering, anti-terrorism and sanctions. Other recent regulatory changes in Europe such as the PSD2 require, among other things, that our financial institution clients provide certain customer account access rights to emerging non-financial institution players.
AVAILABLE INFORMATION
We are subject to the reporting requirements of the Securities Exchange Act of 1934, as amended (Exchange Act) and its rules and regulations. The Exchange Act requires us to file periodic reports, proxy statements and other information with the U.S. Securities and Exchange Commission (SEC). Copies of these reports, proxy statements and other information can be viewed at http://www.sec.gov. Our corporate website is accessible at http://corporate.visa.com. We make available, free of charge, on our investor relations website at http://investor.visa.com our annual reports on Form 10-K, our quarterly reports on Form 10-Q, our current reports on Form 8-K and any amendments to those reports as soon as reasonably practicable after they are electronically filed with, or furnished to, the SEC. We also may include supplemental financial information on our investor relations website at http://investor.visa.com and may use this website as a means of disclosing material, non-public information and for complying with our disclosure obligations under Regulation FD. Accordingly, investors should monitor such portions of our investor relations website, in addition to following SEC filings and publicly available conference calls. The information contained on, or accessible through, our corporate website, including the information contained on our investor relations website, is not incorporated by reference into this report or any other report filed with, or furnished to, the SEC.
ITEM 1A. Risk Factors
Regulatory Risks
Increased regulation of the global payments industry, including with respect to interchange reimbursement fees, operating rules, and related practices, could harm our business.
Regulators around the world have been establishing or increasing their authority to regulate certain aspects of the payments industry. See Item 1. Business —Government Regulation for more information. In the United States and many other jurisdictions, we have historically set default interchange reimbursement fees. Even though we generally do not receive any revenue related to interchange reimbursement fees in a payment transaction (those fees are paid by the acquirers to the issuers), interchange reimbursement fees are a factor on which we compete with other payments providers and are therefore an important determinant of the volume of transactions we process. Consequently, changes to these fees, whether voluntarily or by mandate, can substantially affect our overall payments volumes and revenues.
Interchange reimbursement fees, certain operating rules and related practices continue to be subject to increased government regulation globally, and regulatory authorities and central banks in a number of jurisdictions have reviewed or are reviewing these fees, rules, and practices. For example, the U.S. Federal Reserve caps the maximum U.S. debit interchange reimbursement rate received by large financial institutions at 21 cents plus 5 basis points per transaction, plus a possible fraud adjustment of 1 cent. The Dodd-Frank Act also limits issuers' and our ability to adopt network exclusivity and preferred routing in the debit and prepaid area, which also impacts our business. The EU’s IFR places an effective cap on consumer credit and consumer debit interchange fees for both domestic and cross-border transactions within Europe (30 basis points and 20 basis points, respectively). EU member states have the ability to further restrict these interchange levels within their territories. More recently, in March 2017, Argentina's central bank passed regulations that cap interchange fees on credit and debit transactions.
In addition to the regulation of interchange reimbursement fees, a number of regulators impose restrictions on other aspects of our payments business. For example, government regulations or pressure may require us to allow other payments networks to support Visa products or services, or to have the other network's functionality or brand marks on our products. As innovations in payment technology have enabled us to expand into new products and services, they have also expanded the potential scope of regulatory influence. In addition, the European Union’s requirement to separate scheme and processing adds costs and continues to impact the efficient integration of Visa Europe; the execution of our commercial, innovation and product strategies; our ability to provide effective account holder services; the amount of data available for use in fraud and risk systems; and loyalty services.
18
We are also subject to central bank oversight in some markets, including the United Kingdom and within the European Union. This oversight could result in new governance, reporting, licensing, cybersecurity, processing infrastructure, capital, or credit risk management requirements. We could also be required to adopt policies and practices designed to mitigate settlement and liquidity risks, including increased requirements to maintain sufficient levels of capital and financial resources locally, as well as localized risk management or governance. Increased central bank oversight could also lead to new or different criteria for participation in and access to our payments system, including allowing non-traditional financial technology companies to act as issuers or acquirers. Additionally, regulators in other jurisdictions are considering or adopting approaches based on similar regulatory principles.
Regulators around the world increasingly take note of each other’s approaches to regulating the payments industry. Consequently, a development in one jurisdiction may influence regulatory approaches in another. The risks created by a new law or regulation in one jurisdiction have the potential to be replicated and to negatively affect our business in another jurisdiction or in other product offerings. Similarly, new regulations involving one product offering may prompt regulators to extend the regulations to other product offerings. For example, credit payments could become subject to similar regulation as debit payments. Additionally, regulation in an individual country could expand. For example, the Reserve Bank of Australia initially capped credit interchange, but subsequently capped debit interchange as well.
When we cannot set default interchange reimbursement rates at optimal levels, issuers and acquirers may find our payments system less attractive. This may increase the attractiveness of other payments systems, such as our competitors' closed-loop payments systems with direct connections to both merchants and consumers. We believe some issuers may react to such regulations by charging new or higher fees, or reducing certain benefits to consumers, which make our products less appealing to consumers. Some acquirers may elect to charge higher merchant discount rates regardless of the Visa interchange reimbursement rate, causing merchants not to accept our products or to steer customers to alternate payments systems or forms of payment. In addition, in an effort to reduce the expense of their payment programs, some issuers and acquirers have obtained, and may continue to obtain, incentives from us, including reductions in the fees that we charge, which may directly impact our revenues. For these reasons, increased global regulation of the payments industry may make our products less desirable, diminish our ability to compete, reduce our transaction volumes, and harm our business.
Government-imposed restrictions on payment systems may prevent us from competing against providers in certain countries, including significant markets such as China and Russia.
Governments in a number of jurisdictions shield domestic payment card networks, brands, and processors from international competition by imposing market access barriers and preferential domestic regulations. To varying degrees, these policies and regulations affect the terms of competition in the marketplace and undermine the competitiveness of international payments networks. In the future, public authorities may impose regulatory requirements that favor domestic providers or mandate that domestic payments processing be performed entirely within that country, which would prevent us from managing the end-to-end processing of certain transactions.
In Russia, legislation effectively prevents us from processing domestic transactions. The central bank controlled national payment card system (NSPK) is the only entity allowed to process domestically. In China, UnionPay remains the sole processor of domestic payment card transactions and operates the sole domestic acceptance mark. Although we have filed an application with the People's Bank of China (PBOC) to operate a Bank Card Clearing Institution (BCCI) in China, the timing and the procedural steps remain uncertain. The approval process might require several years, and there is no guarantee that the license to operate a BCCI will be approved or, if we obtain such license, that we will be able to successfully compete with domestic payments networks. Furthermore, due to our inability to manage the end-to-end processing of transactions for cards in certain countries, we depend on our close working relationships with our clients or third-party processors to ensure transactions involving our products are processed effectively. Our ability to do so may be adversely affected by regulatory requirements and policies pertaining to transaction routing or on-shore processing.
Co-badging and co-residency regulations may pose additional challenges in markets where Visa competes with national schemes for issuance and routing. For example, in China, certain banks have issued dual-branded cards for which domestic transactions in China are processed by UnionPay and transactions outside of China are processed by us or other international payments networks. The PBOC is contemplating that dual-branded cards could be phased out over time as new licenses are issued to international companies to participate in China’s domestic payments market. Accordingly, we have been working with Chinese issuers to issue Visa-only branded cards for international travel, and later for domestic transactions after we obtain a BCCI license. However, notwithstanding such efforts, the phase out of dual-branded cards may decrease our payment volumes and impact the revenue we generate in China.
19
Mir and UnionPay have grown rapidly in Russia and China, respectively, and are actively pursuing international expansion plans. Although regulatory barriers shield Mir and UnionPay from competition in Russia and China, respectively, alternate payment providers such as Alipay and WeChat Pay have rapidly expanded into e-commerce, offline, and cross-border payments, which could make it difficult for us to compete even if our license is approved in China. Earlier this year, with strong backing from China’s government, a new digital transaction routing system known as Netlink was established. The PBOC allowed Alipay and other digital payment providers to invest in Netlink. It and other such systems could have a competitive advantage in comparison with other international payments networks.
In general, national laws that protect domestic processing may increase our costs; decrease our payments volumes and impact the revenue we generate in those countries; decrease the number of Visa products issued or processed; impede us from utilizing our global processing capabilities and controlling the quality of the services supporting our brands; restrict our activities; limit our growth and the ability to introduce new products, services and innovations; force us to leave countries or prevent us from entering new markets; and create new competitors, all of which could harm our business.
We are subject to complex and evolving global regulations that could harm our business and financial results.
As a global payments technology company, we are subject to complex and evolving regulations that govern our operations. See Item 1—Business—Government Regulation for more information on the most significant areas of regulation that affect our business. The impact of these regulations on us, our clients, and other third parties could limit our ability to enforce our payments system rules; require us to adopt new rules or change existing rules; affect our existing contractual arrangements; increase our compliance costs; require us to make our technology or intellectual property available to third parties, including competitors, in an undesirable manner; and reduce our revenue opportunities. We may face differing rules and regulations in matters like interchange reimbursement rates, preferred routing, domestic processing requirements, currency conversion, point-of-sale transaction rules and practices, privacy, data use or protection, and associated product technology. As a result, the Visa rules and our other contractual commitments may differ from country to country or by product offering. Complying with these and other regulations increases our costs and could reduce our revenue opportunities.
If widely varying regulations come into existence worldwide, we may have difficulty rapidly adjusting our product offerings, services, fees, and other important aspects of our business in the various regions where we operate. Our compliance programs and policies are designed to support our compliance with a wide array of regulations and laws, such as anti-money laundering, sanctions and anti-corruption, and we continually enhance our compliance programs as regulations evolve. However, we cannot guarantee that our practices will be deemed compliant by all applicable regulatory authorities. In the event our controls should fail or we are found to be out of compliance for other reasons, we could be subject to monetary damages, civil and criminal penalties, litigation, investigations and proceedings, and damage to our global brands and reputation. Furthermore, the evolving and increased regulatory focus on the payments industry could negatively impact or reduce the number of Visa products our clients issue, the volume of payments we process, our revenues, our brands, our competitive positioning, our ability to use our intellectual property to differentiate our products and services, the quality and types of products and services we offer, the countries in which our products are used, and the types of consumers and merchants who can obtain or accept our products, all of which could harm our business.
Laws and regulations regarding the handling of personal data and information may impede our services or result in increased costs, legal claims, or fines against us.
Our business relies on the processing of data in many jurisdictions and the movement of data across national borders. Legal requirements relating to the collection, storage, handling, use, disclosure, transfer, and security of personal data continue to evolve, and regulatory scrutiny in this area is increasing around the world. Significant uncertainty exists as privacy and data protection laws may be interpreted and applied differently from country to country and may create inconsistent or conflicting requirements. For example, the GDPR, which becomes effective in May 2018, extends the scope of the EU data protection law to all companies processing data of EU residents, regardless of the company’s location. The law requires companies to meet new requirements regarding the handling of personal data, including new rights such as the “portability” of personal data. Although we have an extensive program underway to address GDPR requirements, our efforts to comply with GDPR and other privacy and data protection laws may entail substantial expenses, may divert resources from other initiatives and projects, and could limit the services we are able to offer. Furthermore, enforcement actions and investigations by regulatory authorities related to data security incidents and privacy violations continue to increase. The enactment of more restrictive laws, rules, regulations, or future enforcement actions or investigations could impact us through increased costs or restrictions on our business, and noncompliance could result in regulatory penalties and significant legal liability.
20
We may be subject to tax examinations or disputes, or changes in tax laws.
We exercise significant judgment in calculating our worldwide provision for income taxes and other tax liabilities. Although we believe our tax estimates are reasonable, many factors may limit their accuracy. We are currently under examination by, or in disputes with, the U.S. Internal Revenue Service, the UK’s HM Revenue & Customs as well as tax authorities in other jurisdictions, and we may be subject to additional examinations or disputes in the future. Relevant tax authorities may disagree with our tax treatment of certain material items and thereby increase our tax liability. Failure to sustain our position in these matters could harm our cash flow and financial position. In addition, changes in existing laws, such as recent proposals for fundamental U.S. and international tax reform or those resulting from the Base Erosion and Profit Shifting project being conducted by the Organization for Economic Cooperation and Development, may also increase our effective tax rate. A substantial increase in our tax payments could have a material, adverse effect on our financial results. See also Note 18—Income Taxes to our consolidated financial statements included in Item 8—Financial Statements and Supplementary Data of this report.
Litigation Risks
We may be adversely affected by the outcome of litigation or investigations, despite certain protections that are in place.
We are involved in numerous litigation matters, investigations, and proceedings asserted by civil litigants, governments, and enforcement bodies alleging violations of competition and antitrust law, consumer protection law, and intellectual property law, among others (these are referred to as "actions" in this section). Details of the most significant actions we face are described more fully in Note 19—Legal Matters to our consolidated financial statements included in Item 8—Financial Statements and Supplementary Data of this report. These actions are inherently uncertain, expensive, and disruptive to our operations. In the event we are found liable in any material action, particularly in a large class action lawsuit or an antitrust claim entitling the plaintiff to treble damages, or arising from a government investigation, we may be required to pay significant awards, settlements, or fines. In addition, settlement terms, judgments, or pressures resulting from actions may harm our business by requiring us to modify the default interchange reimbursement rates we set, revise the Visa rules, or the way in which we enforce our rules, modify our fees or pricing, or modify the way we do business. The outcome of these actions may also influence regulators, investigators, governments, or civil litigants in the same or other jurisdictions, which may lead to the assertion of additional actions against Visa. Finally, we are required by some of our commercial agreements to indemnify other entities for litigation asserted against them, even if Visa is not a defendant.
For certain actions like the U.S. covered litigation and the VE territory covered litigation, which are described in Note 3—U.S. and Europe Retrospective Responsibility Plans and Note 19—Legal Matters to our consolidated financial statements included in Item 8—Financial Statements and Supplementary Data of this report, we have certain protections as provided in the respective retrospective responsibility plans. The two retrospective responsibility plans are different in the protections they provide and the mechanisms by which we are able to either fund settlements or judgments in the case of the U.S. covered litigation or recoup covered losses in the case of the VE territory covered litigation. The failure of one or both of the retrospective responsibility plans to adequately insulate us from the impact of such settlements, judgments, losses, or liabilities could materially harm our financial condition or cash flows, or even cause us to become insolvent.
Business Risks
We face intense competition in our industry.
The global payments space is intensely competitive. As technology evolves, new competitors emerge and existing clients, and competitors assume different roles. Our products compete with cash, checks, electronic funds, virtual currency payments, global or multi-regional networks, other closed-loop payments systems, and alternate payment providers primarily focused on enabling payments through ecommerce and mobile channels. As the global payments space becomes more complex, we face increasing competition from our clients, emerging payment providers, and other digital and technology companies. Many of these providers have developed payments systems enabled through online activity in ecommerce and mobile channels, and are seeking to expand into other channels that compete with or replace our products and services.
21
Additionally, some of our competitors may develop substantially better technology, more widely adopted delivery channels or have greater financial resources. They may offer more innovative or a wider range of programs, products, and services. They may use more effective advertising and marketing strategies that result in broader brand recognition, and greater issuance and merchant acceptance. They may also develop better security solutions or more favorable pricing arrangements. Moreover, even if we successfully adapt to technological change and the proliferation of alternative types of payment services by developing and offering our own services in these areas, such services may provide less favorable financial terms for us than we currently receive from VisaNet transactions, which could hurt our financial results and prospects.
Certain of our competitors operate with different business models, have different cost structures, or participate in different market segments. Those business models may ultimately prove more successful or more adaptable to regulatory, technological, and other developments. In some cases, these competitors have the support of government mandates that prohibit, limit, or otherwise hinder our ability to compete for transactions within certain countries and regions.
Some of our competitors, including American Express, Discover, private-label card networks, virtual currency providers, technology companies that enable the exchange of digital assets, and certain alternate payments systems, operate closed-loop payments systems, with direct connections to both merchants and consumers. Government actions or initiatives such as the Dodd-Frank Act or the U.S. Federal Reserve’s Faster Payments initiatives may provide them with increased opportunities to derive competitive advantages from these business models. Similarly, regulation in Europe under PSD2 and the IFR, and in the United Kingdom through the PSR, may require us to open up access to, and allow participation in, our network to additional participants, and reduce the infrastructure investment and regulatory burden on potential competitors. We also run the risk of disintermediation due to factors such as emerging technologies, including mobile payments, alternate payment credentials, other ledger technologies or payment forms, and by virtue of increasing bilateral agreements between entities that prefer not to use our payments network for processing transactions. For example, merchants could process transactions directly with issuers, or processors could process transactions directly with issuers and acquirers.
We expect the competitive landscape to continue to shift and evolve. For example:
• | competitors, clients and others are developing alternate payment networks or products that could disintermediate us from the transaction processing or the value-added services we provide to support such processing. Examples include initiatives from The Clearing House, an association comprised of large financial institutions that is developing its own faster payments system, and Early Warning Services, which operates Zelle, a bank-offered alternative network that provides another platform for faster funds or real-time payments across a variety of payment types, including P2P, corporate and government disbursement, bill pay and deposit check transactions; |
• | similarly, multiple countries are developing or promoting real-time payment systems or mandating local networks with clients that also present a risk of disintermediation to our business; |
• | competition may increase from alternate types of payment services, such as mobile payment services, ecommerce payment services, P2P payment services, faster payment initiatives and payment services that permit ACH or direct debits from consumer checking accounts; |
• | parties that process our transactions may try to minimize or eliminate our position in the payments value chain; |
• | parties that access our payment credentials, tokens and technologies, including clients, technology solution providers or others might be able to migrate account holders and other clients to alternate payment methods or use our payment credentials, tokens and technologies to establish or help bolster alternate payment methods and platforms; |
• | we may need to adjust our local rules and practices to remain competitive amidst evolving regulatory landscapes and competitors’ practices; |
• | we may be asked to develop or customize certain aspects of our payment services for use by consumers, processors or other third parties, thereby increasing operational costs; |
22
• | we may need to agree to business arrangements that may be less protective of Visa’s proprietary technology and interests in order to compete and we may face increasing risk of litigation concerning intellectual property, as more technology companies compete with our offerings; |
• | participants in the payments industry may merge, form joint ventures or enable or enter into other business combinations that strengthen their existing business propositions or create new, competing payment services; |
• | as this landscape is quickly evolving, we may not be able to foresee or respond sufficiently to emerging risks associated with new business, products, services and practices; or |
• | new or revised industry standards related to EMV chip payment technology, cloud-based payments, tokenization or other technologies set by organizations such as the International Organization for Standardization, American National Standards Institute and EMVCo may result in additional costs and expenses for Visa and its clients, or otherwise negatively impact the functionality and competitiveness of our products and services. |
Our failure to compete effectively in light of any such developments could harm our business and prospects for future growth.
Our revenues and profits are dependent on our client and merchant base, which may be costly to win, retain, and maintain.
Our financial institution clients and merchants can reassess their commitments to us at any time or develop their own competitive services. While we have certain contractual protections, our clients, including some of our largest clients, generally have flexibility to issue non-Visa products. Further, in certain circumstances, our financial institution clients may decide to terminate our contractual relationship on relatively short notice without paying significant early termination fees. Because a significant portion of our operating revenues is concentrated among our largest clients, the loss of business from any one of these larger clients could harm our business, results of operations, and financial condition.
In order to stay competitive, we offer incentives to our clients to increase payments volume, enter new market segments, and expand their use and acceptance of Visa products and services. These include up-front cash payments, fee discounts, rebates, credits, performance-based incentives, marketing, and other support payments that impact our revenues and profitability. In addition, we offer incentives to certain merchants or acquirers to win routing preference in situations where other network functionality is enabled on our products and there is a choice of network routing options. Market pressures on providing incentives, fee discounts, and rebates could moderate our growth. If we are not able to implement cost containment and productivity initiatives in other areas of our business or increase our volumes in other ways to offset the financial impact of these incentives, fee discounts, and rebates, it may harm our net revenues and profits.
In addition, it may be difficult or costly for us to acquire or conduct business with financial institutions or merchants that have longstanding exclusive, or nearly exclusive, relationships with our competitors. These financial institutions or merchants may be more successful and may grow more quickly than our existing clients or merchants. In addition, if there is a consolidation or acquisition of one or more of our largest clients or co-brand partners by a financial institution client or merchant with a strong relationship with one of our competitors, it could result in our business shifting to a competitor, which could put us at a competitive disadvantage and harm our business.
Merchants' and processors' continued push to lower acceptance costs and challenge industry practices could harm our business.
We rely in part on merchants and their relationships with our clients to maintain and expand the acceptance of Visa products. Certain large retail merchants have been exercising their influence in the global payments system in certain jurisdictions, such as the United States, to attempt to lower their acceptance costs by lobbying for new legislation, seeking regulatory enforcement, filing lawsuits and in some cases, refusing to accept Visa products. If they are successful in their efforts, we may face increased compliance and litigation expenses and issuers may decrease their issuance of our products. For example, in the United States, the cost of payment card acceptance has emerged in the context of payment security. A number of merchant trade associations claim that EMV cards without PIN cardholder verification are not worth the investment. The October 2015 liability shift and ongoing transition to EMV resulted in calls for a PIN verification mandate. U.S. merchant-affiliated groups and processors have expressed concerns regarding the EMV certification process. Some policymakers have called upon U.S. competition authorities to consider potential
23
concerns arising from the roles of industry bodies such as EMVCo and the Payment Card Industry Security Standards Council. Additionally, some merchants and processors have advocated for changes to industry practices and Visa acceptance requirements at the point of sale, including the ability for merchants to accept only certain types of Visa products, to mandate only PIN authenticated transactions, to differentiate or steer among Visa product types issued by different financial institutions, and to impose surcharges on customers presenting Visa products as their form of payment. If successful, these efforts could adversely impact consumers' usage of our products, lead to regulatory enforcement and/or litigation, increase our compliance and litigation expenses, and harm our business.
We depend on relationships with our financial institution clients, acquirers, merchants, and other third parties.
We depend significantly on relationships with our financial institution clients and on their relationships with account holders and merchants to support our programs and services, and thereby compete effectively in the marketplace. Our relationships with industry participants are complex and require us to balance the interests of multiple third parties. For example, in the United States, the EMV migration has been resisted by certain merchants, leading to conflicts and litigation concerning the timing and scope of the liability shift, chargebacks, and debit routing, among others.
We engage in discussions with merchants, acquirers, and processors to provide incentives to promote routing preference and acceptance growth. We engage in many payment card co-branding efforts with merchants, who receive incentives from us. As these and other relationships become more prevalent and take on a greater importance to our business, our success will increasingly depend on our ability to sustain and grow these relationships.
In addition, we depend on third parties, including suppliers, and our financial institution clients to provide various services associated with our payments network on our behalf. To the extent that such parties fail to perform or deliver adequate services, our business and reputation could be harmed.
If we are not able to maintain and enhance our brands, if events occur that damage our reputation or brands or we experience brand disintermediation, it could harm our business.
Our brands are globally recognized and are key assets of our business. We believe that our clients and account holders associate our brands with acceptance, security, convenience, speed, and reliability. Our success depends in large part on our ability to maintain the value of our brands and reputation of our products and services in the payments ecosystem, elevate the brand through new and existing products, services and partnerships, and uphold our corporate reputation. The increased use or popularity of products that we have developed in partnership with large technology and financial institution companies could result in consumer confusion or brand disintermediation and decrease the value of our brand. We may not succeed in addressing consumer confusion and brand disintermediation due to the challenges of evolving digital form factors and ecommerce technologies. Our brands and reputation may be negatively impacted by a number of factors, including data security breaches; compliance failures; negative perception of our industry or the industries of our clients; actions by clients or other third parties, such as sponsorship partners that do not reflect our views or are inconsistent with our own business practices; and fraudulent, controversial or illegal activities using our payment products. If we are unable to maintain our reputation, our reputation is damaged or any threatened or resulting claims arise as a result, the value of our brands may be impaired, which could harm our relationships with clients, account holders, and the public, as well as impact our business.
Global economic, political, market, and social events or conditions may harm our business.
Our revenues are dependent on the volume and number of payment transactions made by consumers, governments, and businesses, whose spending patterns may be affected by prevailing economic conditions. In addition, almost half of our operating revenues are earned outside the United States. International transaction revenues represent a significant part of our revenue and are an important part of our growth strategy. Therefore, adverse macroeconomic conditions, including recessions, inflation, high unemployment, currency fluctuations, actual or anticipated large-scale defaults or failures, or slowdown of global trade, could decrease consumer and corporate confidence and reduce consumer, government, and corporate spending, which have a direct impact on our revenues. In addition, outbreaks of illnesses, pandemics, or other local or global health issues, political uncertainties, international hostilities, armed conflict, or unrest, and natural disasters could impact our operations, our clients, our activities in a particular location, and cross-border travel and spend. Geopolitical trends towards nationalism, protectionism, and restrictive visa requirements, as well as continued activity and uncertainty around economic sanctions could also reduce cross-border travel and spend. Any such decline in cross-border activity could impact the number of cross-border transactions we process and our currency exchange activities, which in turn would reduce our international transaction revenues.
24
A decline in economic conditions could impact our clients as well, and their decisions to reduce the number of cards, accounts, and credit lines of their account holders, which ultimately impact our revenues. They may also implement cost-reduction initiatives that reduce or eliminate marketing budgets, and decrease spending on optional or enhanced, value-added services from us.
Any events or conditions that impair the functioning of the financial markets, tighten the credit market, or lead to a downgrade of our current credit rating could increase our future borrowing costs and impair our ability to access the capital and credit markets on favorable terms, which could affect our liquidity and capital resources, or significantly increase our cost of capital. If clients default on their settlement obligations, it may also impact our liquidity. Any of these events could adversely affect the growth of our volumes and revenue.
Our indemnification obligation to fund settlement losses of our clients exposes us to significant risk of loss and may reduce our liquidity.
We indemnify issuers and acquirers for settlement losses they may suffer due to the failure of another issuer or acquirer to honor its settlement obligations in accordance with the Visa rules. In certain instances, we may indemnify issuers or acquirers even in situations in which a transaction is not processed by our system. This indemnification creates settlement risk for us due to the timing difference between the date of a payment transaction and the date of subsequent settlement. Our indemnification exposure is generally limited to the amount of unsettled Visa payment transactions at any point in time and any subsequent amounts that may fall due relating to adjustments for previously processed transactions. Concurrent settlement failures involving more than one of our largest clients, several of our smaller clients, or systemic operational failures could negatively impact our financial position. Even if we have sufficient liquidity to cover a settlement failure, we may be unable to recover the amount of such payment. This could expose us to significant losses and harm our business. See Note 10—Settlement Guarantee Management to our consolidated financial statements included in Item 8—Financial Statements and Supplementary Data of this report.
The United Kingdom’s withdrawal from the European Union could harm our business and financial results.
In June 2016, voters in the United Kingdom approved the withdrawal of the United Kingdom from the European Union (commonly referred to as "Brexit"). In March 2017, the UK government initiated the exit process under Article 50 of the Treaty of the European Union, commencing a period of up to two years for the United Kingdom and the other EU member states to negotiate the terms of the withdrawal. Uncertainty over the terms of the United Kingdom’s departure from the European Union could cause political and economic uncertainty in the United Kingdom and the rest of Europe, which could harm our business and financial results.
Brexit could lead to legal uncertainty and potentially divergent national laws and regulations in the United Kingdom and European Union. We, as well as our clients who have significant operations in the United Kingdom, may incur additional costs and expenses as we adapt to potentially divergent regulatory frameworks from the rest of the European Union and as a result, our Visa rules and contractual commitments in the United Kingdom may be impacted. In addition, because we conduct business in and have operations in the United Kingdom, we may need to apply for regulatory authorization and permission in separate EU member states. These factors may impact our ability to operate in the European Union and United Kingdom seamlessly. Any of these effects of Brexit, among others, could harm our business and financial results.
Technology and Cybersecurity Risks
Failure to anticipate, adapt to or keep pace with new technologies in the payments industry could harm our business and impact our future growth.
The global payments industry is undergoing significant and rapid technological change, including mobile and other proximity payment and acceptance technologies, ecommerce, tokenization, crypto-currencies, new authentication technologies, including biometrics, distributed ledger and blockchain technologies, and as a result we expect new services and technologies to continue to emerge and evolve. In addition to our own initiatives and innovations, we work closely with third parties, including some potential competitors, for the development of and access to new technologies. It is difficult, however, to predict which technological developments or innovations will become widely adopted and how these technologies may be regulated. Moreover, some of these new technologies could be subject to intellectual property-related lawsuits or assertions, potentially impacting our development efforts and/or requiring us to obtain licenses. If we or our partners fail to adapt or keep pace with new technologies in the payments
25
space in a timely manner, it could harm our ability to compete, decrease the value of our products and services to our clients, impact our intellectual property or licensing rights, and harm our business and impact our future growth.
A failure in or breach of our networks or systems, including as a result of cyber-attacks, could harm our business.
Our cybersecurity and processing systems, as well as those of financial institutions, merchants, and third-party service providers, may experience damage or disruption from a number of causes, including power outages, computer and telecommunication failures, computer viruses, malware or other destructive software, internal design, manual or usage errors, cyber-attacks, terrorism, workplace violence or wrongdoing, catastrophic events, natural disasters and severe weather conditions. Our visibility and role in the global payments industry may also put us at a greater risk of being targeted by hackers. In the normal course of our business, we have been the target of malicious cyber-attack attempts. We may also be impacted by breaches of our financial institution clients, merchants or third-party processors. For instance, several merchants have encountered substantial data breaches affecting their customers, some of whom were Visa account holders. Although these merchant breaches have not had a direct, material impact on us, we believe these incidents are likely to continue and we are unable to predict the direct or indirect impact of these future attacks to our business.
In addition, numerous and evolving cybersecurity threats, including advanced and persistent cyber-attacks, phishing and social engineering schemes, particularly on our internet applications, could compromise the confidentiality, availability, and integrity of data in our systems. The security measures and procedures we, our clients, merchants, and third-party service providers have in place to protect sensitive consumer data and other information may not be successful or sufficient to counter all data breaches, cyber-attacks, or system failures. Although we devote significant resources to our cybersecurity programs and have implemented security measures to protect our systems and data, and to prevent, detect and respond to data security incidents, there can be no assurance that our efforts will prevent these threats.
Because the techniques used to obtain unauthorized access, or to disable or degrade systems change frequently, have become increasingly more complex and sophisticated, and may be difficult to detect for periods of time, we may not anticipate these acts or respond adequately or timely. As these threats continue to evolve and increase, we may be required to devote significant additional resources in order to modify and enhance our security controls and to identify and remediate any security vulnerabilities.
If we are sued in connection with any data security breach or system failure, we could be involved in protracted litigation. If unsuccessful in defending such lawsuits, we may have to pay damages or change our business practices, any of which could harm our business. In addition, any reputational damage resulting from a data security breach or system failure at one or more of our clients, merchants or other third parties could decrease the use and acceptance of our products, which could harm our payments volume, revenues and future growth prospects. Finally, a breach or failure may also subject Visa to additional regulations or governmental or regulatory investigations, which could result in significant compliance costs, fines or enforcement actions, or potential restrictions imposed by regulators on our ability to process transactions.
We may experience errors, interruptions, delays, or cessations of service in our information technology infrastructure and processing systems, which could significantly disrupt our operations; impact our clients and consumers; damage our reputation; result in litigation, violations of applicable privacy and other laws, and regulatory fines or penalties; decrease the overall use and acceptance of our products; and be costly, time consuming and difficult to remedy. In the event of damage or disruption to our business due to these occurrences, we may not be able to successfully and quickly recover all of our critical business functions, assets, and data through our business continuity program. Furthermore, while we maintain insurance, our coverage may not sufficiently cover all types of losses or claims that may arise.
Structural and Organizational Risks
Failure to maintain interoperability with Visa Europe's systems during the integration could damage the business and global perception of our brands.
In June 2016, we acquired Visa Europe. While Visa Europe's systems are being integrated with our legacy systems, we will continue to maintain mostly separate authorization, clearing, and settlement systems. As a result, we have to ensure that the two systems can process every transaction involving both of our territories, regardless of where the transaction originates. Visa Europe's independent system operations could present challenges to our business in
26
the event of increasing costs or difficulties in maintaining the interoperability of our respective systems during the integration phase. The separation of payment card scheme and processing may also exacerbate this risk. Any inconsistency in the payment processing services and products between Visa Europe and our legacy operations could negatively affect the experience of consumers using Visa products globally. Moreover, we are beginning the process of migrating European activity onto VisaNet's systems in 2018 and successfully integrating our systems is expected to be time consuming, costly and technologically challenging. Failure to authorize, clear, and settle inter-territory transactions quickly and accurately could harm our business and impair the global perception of our brands.
We may not achieve the anticipated benefits of our acquisitions or strategic investments, and may face risks and uncertainties as a result.
As part of our overall business strategy, we may make acquisitions and strategic investments. For example, we believe the acquisition of Visa Europe positions us to create additional value through increased scale, efficiencies realized by the integration of both businesses, and benefits related to Visa Europe’s transition from an association to a for-profit enterprise, although there can be no guarantee that we will realize these benefits. Our current and future acquisitions and strategic investments may involve significant risks and uncertainties, including:
• | disruption to our ongoing business, including diversion of resources and management’s attention from our existing business; |
• | greater than expected investment of resources or operating expenses; |
• | failure to develop the acquired business adequately; |
• | difficulty implementing controls, procedures, and policies at the acquired company; |
• | challenges of integrating new employees, business cultures, business systems, and technologies; |
• | failure to retain employees, clients, or partners of the acquired business; |
• | in the case of foreign acquisitions, risks related to the integration of operations across different cultures and languages, and the economic, political, and regulatory risks associated with operating in new regions or countries. For more information on regulatory risks, please see Item 1—Business—Government Regulations and Item 1A—Risk Factors—Regulatory Risks above; |
• | discovery of unidentified issues after the acquisition or investment was made; |
• | failure to mitigate the liabilities of the acquired business; |
• | dilutive issuance of equity securities, if new securities are issued; |
• | the incurrence of debt; |
• | negative impact on our financial position and/or statement of operations; and |
• | anticipated benefits, synergies, or value of the investment or acquisition not materializing. |
We may be unable to attract, hire, and retain a highly qualified and diverse workforce, including key management.
The talents and efforts of our employees, particularly our key management, are vital to our success. Our management team has significant industry experience and would be difficult to replace. We may be unable to retain them or to attract other highly qualified employees, particularly if we do not offer employment terms that are competitive with the rest of the labor market. Changes in laws and policies regarding immigration and work authorizations could make it more difficult for employees to work in, or transfer among, jurisdictions in which we have operations and could impair our ability to attract and retain qualified employees. Failure to attract, hire, develop, motivate, and retain highly qualified and diverse employee talent, or failure to develop and implement an adequate succession plan for the management team, could disrupt our operations and adversely affect our business and our future success.
27
The conversions of our class B and class C common stock or series B and series C preferred stock into shares of class A common stock would result in voting dilution to, and could impact the market price of, our existing class A common stock.
The market price of our class A common stock could fall as a result of many factors. Under our U.S. retrospective responsibility plan, upon final resolution of our U.S. covered litigation, all class B common stock will become convertible into class A common stock. In connection with the acquisition of Visa Europe, we issued series B and series C preferred stock, which will become convertible into class A common stock in stages based on developments in current and potential litigation and will become fully convertible no later than 2028 (subject to a holdback to cover any pending claims). Conversion of our class B and class C common stock into class A common stock, or our series B and series C preferred stock into class A common stock, would increase the amount of class A common stock outstanding, which could adversely affect the market price of our existing class A common stock and would dilute the voting power of existing class A common stockholders.
Holders of our class B and C common stock and series B and series C preferred stock may have different interests than our class A common stockholders concerning certain significant transactions.
Although their voting rights are limited, holders of our class B and C common stock and, in certain specified circumstances, holders of our series B and series C preferred stock, can vote on certain significant transactions. With respect to our class B and C common stock, these transactions include a proposed consolidation or merger, a decision to exit our core payments business and any other vote required under Delaware law. With respect to our series B and series C preferred stock, voting rights are limited to proposed consolidations or mergers in which holders of the series B and series C preferred stock would either (i) receive shares of stock or other equity securities with preferences, rights and privileges that are not substantially identical to the preferences, rights and privileges of the applicable series of preferred stock or (ii) receive securities, cash or other property that is different from what our class A common stockholders would receive. Because the holders of classes of capital stock other than class A common stock are our current and former financial institution clients, they may have interests that diverge from our class A common stockholders. As a result, the holders of these classes of capital stock may not have the same incentive to approve a corporate action that may be favorable to the holders of class A common stock, and their interests may otherwise conflict with interests of our class A common stockholders.
Delaware law, provisions in our certificate of incorporation and bylaws, and our capital structure could make a merger, takeover attempt, or change in control difficult.
Provisions contained in our certificate of incorporation and bylaws, and our capital structure could delay or prevent a merger, takeover attempt, or change in control that our stockholders may consider favorable. For example, except for limited exceptions:
• | no person may beneficially own more than 15% of our class A common stock (or 15% of our total outstanding common stock on an as-converted basis), unless our board of directors approves the acquisition of such shares in advance; |
• | no competitor or an affiliate of a competitor may hold more than 5% of our total outstanding common stock on an as-converted basis; |
• | the affirmative votes of the class B and C common stock and series B and series C preferred stock are required for certain types of consolidations or mergers; |
• | our stockholders may only take action during a stockholders’ meeting and may not act by written consent; and |
• | only the board of directors, Chairman, or CEO may call a special meeting of stockholders. |
ITEM 1B. | Unresolved Staff Comments |
Not applicable.
28
ITEM 2. | Properties |
At September 30, 2017, we owned or leased 100 offices in 69 countries around the world. Our corporate headquarters are located in owned and leased premises in the San Francisco Bay Area.
In addition, we own three data processing centers in the United States and the United Kingdom, and we lease three data processing centers in Japan, Singapore and the United Kingdom.
We believe that these facilities are suitable and adequate to support our ongoing business needs.
ITEM 3. | Legal Proceedings |
Refer to Note 19—Legal Matters to our consolidated financial statements included in Item 8—Financial Statements and Supplementary Data of this report.
ITEM 4. | Mine Safety Disclosures |
Not applicable.
29
PART II
ITEM 5. | Market for Registrant's Common Equity, Related Stockholder Matters and Issuer Purchases of Equity Securities |
Price Range of Common Stock
Our class A common stock has been listed on the New York Stock Exchange under the symbol “V” since March 19, 2008. At November 10, 2017, we had 362 stockholders of record of our class A common stock. The number of beneficial owners is substantially greater than the number of record holders, because a large portion of our class A common stock is held in "street name" by banks and brokers. The following table sets forth the intra-day high and low sale prices for our class A common stock in each of our last eight fiscal quarters:
Fiscal 2017 | High | Low | |||||
First Quarter | $ | 83.96 | $ | 75.17 | |||
Second Quarter | $ | 92.05 | $ | 78.49 | |||
Third Quarter | $ | 96.60 | $ | 88.13 | |||
Fourth Quarter | $ | 106.84 | $ | 93.19 | |||
Fiscal 2016 | High | Low | |||||
First Quarter | $ | 81.01 | $ | 68.36 | |||
Second Quarter | $ | 77.00 | $ | 66.12 | |||
Third Quarter | $ | 81.73 | $ | 73.25 | |||
Fourth Quarter | $ | 83.79 | $ | 73.83 | |||
There is currently no established public trading market for our class B or C common stock. There were 1,604 and 608 holders of record of our class B and C common stock, respectively, as of November 10, 2017.
Dividend Declaration and Policy
During the fiscal years ended September 30, 2017 and 2016, we paid the following quarterly cash dividends per share of our class A common stock (determined in the case of class B and C common stock and series B and C preferred stock, on an as-converted basis) to all holders of record of our common and preferred stock on the respective record dates.
Fiscal 2017 | Dividend Per Share | ||
First Quarter | $ | 0.165 | |
Second Quarter | $ | 0.165 | |
Third Quarter | $ | 0.165 | |
Fourth Quarter | $ | 0.165 | |
Fiscal 2016 | Dividend Per Share | ||
First Quarter | $ | 0.14 | |
Second Quarter | $ | 0.14 | |
Third Quarter | $ | 0.14 | |
Fourth Quarter | $ | 0.14 | |
Additionally, in October 2017, our board of directors declared a quarterly cash dividend of $0.195 per share of class A common stock (determined in the case of class B and C common stock and series B and C preferred stock on an as-converted basis) payable on December 5, 2017, to holders of record as of November 17, 2017 of our common and preferred stock.
30
Subject to legally available funds, we expect to continue paying quarterly cash dividends on our outstanding common and preferred stock in the future. However, the declaration and payment of future dividends is at the sole discretion of our board of directors after taking into account various factors, including our financial condition, settlement indemnifications, operating results, available cash and current and anticipated cash needs.
Issuer Purchases of Equity Securities
The table below sets forth our purchases of common stock during the quarter ended September 30, 2017.
Period | Total Number Of Shares Purchased (1) | Average Price Paid Per Share | Total Number Of Shares Purchased As Part Of Publicly Announced Plans Or Programs (2),(3) | Approximate Dollar Value Of Shares That May Yet Be Purchased Under The Plans Or Programs (2),(3) | |||||||||
July 1-31, 2017 | 2,311,218 | $ | 95.02 | 2,294,983 | $ | 5,310,521,927 | |||||||
August 1-31, 2017 | 5,594,044 | $ | 102.11 | 5,594,044 | $ | 4,739,175,366 | |||||||
September 1-30, 2017 | 9,019,355 | $ | 104.72 | 9,019,355 | $ | 3,794,467,851 | |||||||
Total | 16,924,617 | $ | 102.54 | 16,908,382 | |||||||||
(1) | Includes 16,235 shares of class A common stock withheld at an average price of $99.15 per share (per the terms of grants under the Visa 2007 Equity Incentive Compensation Plan) to offset tax withholding obligations that occur upon vesting and release of restricted shares. |
(2) | The figures in the table reflect transactions according to the trade dates. For purposes of our consolidated financial statements included in this Form 10-K, the impact of these repurchases is recorded according to the settlement dates. |
(3) | Our board of directors from time to time authorizes the repurchase of shares of our common stock up to a certain monetary limit. In April 2017, our board of directors authorized a share repurchase program for $5.0 billion. This authorization has no expiration date. All share repurchase programs authorized prior to April 2017 have been completed. |
EQUITY COMPENSATION PLAN INFORMATION
The table below presents information as of September 30, 2017, for the Visa 2007 Equity Incentive Compensation Plan (the "EIP") and the Visa Inc. Employee Stock Purchase Plan (the "ESPP"), which were approved by our stockholders. We do not have any equity compensation plans that have not been approved by our stockholders. For a description of the awards issued under the EIP and the ESPP, see Note 15—Share-based Compensation to our consolidated financial statements included in Item 8—Financial Statements and Supplementary Data of this report.
Plan Category | (a) Number Of Shares Of Class A Common Stock Issuable Upon Exercise Of Outstanding Options And Rights | Weighted-Average Exercise Price Of Outstanding Options | Number Of Shares Of Class A Common Stock Remaining Available For Future Issuance Under Equity Compensation Plans (Excluding Shares Reflected In Column (a)) | |||||||
Equity compensation plans approved by stockholders | 13,081,232 | (1) | $ | 50.17 | (2) | 166,492,598 | (3) | |||
(1) | The maximum number of shares issuable as of September 30, 2017 consisted of 7,115,876 outstanding options, 4,673,701 outstanding restricted stock units and 937,675 outstanding performance shares under the EIP and 353,980 purchase rights outstanding under the ESPP. |
(2) | The weighted-average exercise price is calculated based solely on the exercise prices of the outstanding stock options and does not reflect the shares that will be issued upon the vesting of outstanding restricted stock units and performance shares, which have no exercise price. Additionally, it excludes the weighted-average exercise price of the outstanding purchase rights under the ESPP, as the exercise price is based on the future stock price, net of discount, at the end of each monthly purchase over the offering period. |
(3) | In January 2015, our class A stockholders approved the ESPP which permits eligible employees to purchase shares of Class A common stock at a 15% discount to the stock price on the purchase date, subject to certain restrictions. See Note 15—Share-based Compensation to our consolidated financial statements included in Item 8—Financial Statements and Supplementary Data of this report. As of September 30, 2017, 149 million shares and 18 million shares remain available for issuance under the EIP and the ESPP, respectively. |
31
ITEM 6. | Selected Financial Data |
The following tables present selected Visa Inc. financial data for the past five fiscal years. The data below should be read in conjunction with Item 7—Management's Discussion and Analysis of Financial Condition and Results of Operations and Item 8—Financial Statements and Supplementary Data of this report.
Selected Financial Data
Fiscal Year Ended September 30, | ||||||||||||||||||||
Statement of Operations Data: | 2017(1) | 2016(1) | 2015 | 2014 | 2013 | |||||||||||||||
(in millions, except per share data) | ||||||||||||||||||||
Operating revenues | $ | 18,358 | $ | 15,082 | $ | 13,880 | $ | 12,702 | $ | 11,778 | ||||||||||
Operating expenses | $ | 6,214 | $ | 7,199 | (3) | $ | 4,816 | $ | 5,005 | $ | 4,539 | |||||||||
Operating income | $ | 12,144 | $ | 7,883 | $ | 9,064 | $ | 7,697 | $ | 7,239 | ||||||||||
Net income | $ | 6,699 | (2) | $ | 5,991 | $ | 6,328 | $ | 5,438 | $ | 4,980 | |||||||||
Basic earnings per share—class A common stock(4) | $ | 2.80 | $ | 2.49 | $ | 2.58 | $ | 2.16 | $ | 1.90 | ||||||||||
Diluted earnings per share—class A common stock(4) | $ | 2.80 | $ | 2.48 | $ | 2.58 | $ | 2.16 | $ | 1.90 | ||||||||||
At September 30, | ||||||||||||||||||||
Balance Sheet Data: | 2017(1) | 2016(1) | 2015 | 2014 | 2013 | |||||||||||||||
(in millions, except per share data) | ||||||||||||||||||||
Total assets | $ | 67,977 | $ | 64,035 | $ | 39,367 | $ | 37,543 | $ | 35,495 | ||||||||||
Accrued litigation | $ | 982 | $ | 981 | $ | 1,024 | $ | 1,456 | (5) | $ | 5 | (5) | ||||||||
Long-term debt | $ | 16,618 | (6) | $ | 15,882 | (6) | $ | — | $ | — | $ | — | ||||||||
Total equity | $ | 32,760 | $ | 32,912 | $ | 29,842 | $ | 27,413 | $ | 26,870 | ||||||||||
Dividend declared and paid per common share(4) | $ | 0.66 | $ | 0.56 | $ | 0.48 | $ | 0.40 | $ | 0.33 | ||||||||||
(1) | Our results of operations for fiscal 2017 and the last quarter of fiscal 2016, and the financial position as of September 30, 2017 and 2016, include Visa Europe's financial results. |
(2) | During fiscal 2017, in connection with our legal entity reorganization, we eliminated deferred tax balances originally recognized upon the acquisition of Visa Europe, resulting in the recognition of a non-recurring, non-cash income tax provision of $1.5 billion. |
(3) | During 2016, upon consummation of the Visa Europe acquisition, we recorded a non-recurring loss of $1.9 billion, before tax, in operating expense resulting from the effective settlement of the Framework Agreement between us and Visa Europe. Net of related tax benefit of $693 million, determined by applying applicable federal and state tax rates, the adjustment to net income was an increase of $1.2 billion. |
(4) | The per share amounts for the prior periods presented have been retroactively adjusted to reflect the four-for-one stock split effected in the second quarter of fiscal 2015. |
(5) | During fiscal 2013, we made payments from the U.S. litigation escrow account totaling $4.4 billion in connection with the U.S. covered litigation. During fiscal 2014, the court entered the final judgment order approving the settlement with the class plaintiffs in the interchange multidistrict litigation proceedings. Certain merchants in the settlement classes objected to the settlement and filed opt-out claims. Takedown payments of approximately $1.1 billion related to the opt-out merchants were received and deposited into the U.S. litigation escrow account, and a related increase in accrued litigation to address the opt-out claims were recorded in the second quarter of fiscal 2014. See Note 3—U.S. and Europe Retrospective Responsibility Plans and Note 19—Legal Matters to our consolidated financial statements included in Item 8—Financial Statements and Supplementary Data of this report. |
(6) | During fiscal 2017 and fiscal 2016, we issued fixed-rate senior notes in an aggregate principal amount of $2.5 billion and $16.0 billion, respectively. See Note 8—Debt to our consolidated financial statements included in Item 8—Financial Statements and Supplementary Data of this report. |
32
ITEM 7. | Management’s Discussion and Analysis of Financial Condition and Results of Operations |
This management’s discussion and analysis provides a review of the results of operations, financial condition and liquidity and capital resources of Visa Inc. and its subsidiaries (“Visa,” “we,” "us," “our” and the “Company”) on a historical basis and outlines the factors that have affected recent earnings, as well as those factors that may affect future earnings. The following discussion and analysis should be read in conjunction with the consolidated financial statements and related notes included in Item 8 of this report.
Overview
Visa is a global payments technology company that enables fast, secure and reliable electronic payments across more than 200 countries and territories. We facilitate global commerce through the transfer of value and information among a global network of consumers, merchants, financial institutions, businesses, strategic partners and government entities. Our advanced transaction processing network, VisaNet, enables authorization, clearing and settlement of payment transactions and allows us to provide our financial institution and merchant clients a wide range of products, platforms and value-added services.
Overall economic conditions. Our business is affected by overall economic conditions and consumer spending. Our business performance during fiscal 2017 reflects continued uneven economic growth around the world.
Legal entity reorganization. In February 2017, we completed a reorganization of Visa Europe and certain other legal entities to align our corporate structure to the geographic jurisdictions in which we conduct business operations. As a result of the reorganization, during fiscal 2017, we recorded a non-recurring, non-cash income tax provision of $1.5 billion primarily related to the elimination of deferred tax balances originally recognized upon the acquisition of Visa Europe. Associated with this reorganization, the newly-formed Visa Foundation received all Visa Inc. shares held by Visa Europe, which were previously recorded as treasury stock.
Debt issuance. In September 2017, we issued fixed-rate senior notes in an aggregate principal amount of $2.5 billion, with maturities ranging between 5 and 30 years. Subsequent to our fiscal year-end, in October 2017, we used the majority of the proceeds from this new debt to redeem the $1.75 billion of senior notes that was scheduled to mature in December 2017. See Note 8—Debt to our consolidated financial statements included in Item 8—Financial Statements and Supplementary Data of this report.
Financial highlights. Our financial results for fiscal 2017 include the impact of several significant one-time items. Our as-reported U.S. GAAP and adjusted non-GAAP net income and diluted earnings per share are shown in the table below.
Fiscal Year Ended September 30, | % Change(1) | ||||||||||||||||
2017 | 2016 | 2015 | 2017 vs. 2016 | 2016 vs. 2015 | |||||||||||||
(in millions, except percentages) | |||||||||||||||||
Net income, as reported | $ | 6,699 | $ | 5,991 | $ | 6,328 | 12 | % | (5 | )% | |||||||
Diluted earnings per share, as reported(2) | $ | 2.80 | $ | 2.48 | $ | 2.58 | 13 | % | (4 | )% | |||||||
Net income, as adjusted(3) | $ | 8,335 | $ | 6,862 | $ | 6,438 | 21 | % | 7 | % | |||||||
Diluted earnings per share, as adjusted(2),(3) | $ | 3.48 | $ | 2.84 | $ | 2.62 | 22 | % | 8 | % | |||||||
(1) | Figures in the table may not recalculate exactly due to rounding. Percentage changes are calculated based on unrounded numbers. |
(2) | The per share amounts for the prior periods presented have been retroactively adjusted to reflect the four-for-one stock split effected in the second quarter of fiscal 2015. |
(3) | Adjusted net income and adjusted diluted earnings per share in fiscal 2017, 2016 and 2015 exclude the impact of certain significant items that we believe are not indicative of our operating performance, as they were either non-recurring or had no cash impact. For a full reconciliation of our adjusted financial results, see tables in Adjusted financial results below. |
We recorded net operating revenues of $18.4 billion for fiscal 2017, an increase of 22% over the prior year primarily reflecting the operating revenues of Visa Europe and continued growth in nominal payments volume, processed transactions and nominal cross-border volume. The effect of exchange rate movements, as partially mitigated by our hedging program, resulted in an approximately negative one and a half percentage point impact to our total operating growth.
33
Total operating expenses for fiscal 2017 were $6.2 billion, compared to $7.2 billion in fiscal 2016. The decrease over the prior year was primarily due to the $1.9 billion loss in fiscal 2016 resulting from the effective settlement of the Framework Agreement between us and Visa Europe upon consummation of the transaction, offset by the inclusion of Visa Europe's operating expenses following the acquisition.
During fiscal 2015, we recognized a tax benefit of $296 million resulting from the resolution of uncertain tax positions with taxing authorities. Of the $296 million benefit, $239 million relates to prior fiscal years. See Note 18—Income Taxes to our consolidated financial statements included in Item 8—Financial Statements and Supplementary Data of this report.
Adjusted financial results. Our financial results for fiscal 2017, 2016 and 2015 reflect the impact of certain significant items that we do not believe are indicative of our ongoing operating performance in the prior or future years, as they were either non-recurring or had no cash impact. As such, we believe the presentation of adjusted financial results excluding the following items provides a clearer understanding of our operating performance for the periods presented.
• | Elimination of deferred tax balances. During the second quarter of fiscal 2017, in connection with our legal entity reorganization, we eliminated deferred tax balances originally recognized upon the acquisition of Visa Europe, resulting in the recognition of a non-recurring, non-cash income tax provision of $1.5 billion. |
• | Charitable contribution. During the second quarter of fiscal 2017, associated with our legal entity reorganization, we recognized a non-recurring, non-cash general and administrative expense of $192 million, before tax, related to the charitable donation of Visa Inc. shares that were acquired as part of the Visa Europe acquisition and held as treasury stock. Net of the related cash tax benefit of $71 million, determined by applying applicable tax rates, adjusted net income increased by $121 million. |
• | Severance cost. In the fourth quarter of fiscal 2016, we recorded a $110 million charge for severance costs related to personnel reductions, including planned reductions at Visa Europe. Although we routinely record severance expenses, these charges are larger than any past quarterly accrual due to the acquisition and integration of Visa Europe. Net of related tax benefit of $38 million, determined by applying applicable tax rates, the adjustment to net income was an increase of $72 million. |
• | Remeasurement of deferred tax liability. In September 2016, we recorded a non-cash, non-recurring $88 million gain upon the remeasurement of a deferred tax liability, recorded upon the acquisition of Visa Europe, to reflect a tax rate change in the United Kingdom. |
• | Acquisition-related costs. During fiscal 2016, we incurred $152 million of non-recurring acquisition costs in operating expense as a result of the Visa Europe transaction. This amount is comprised of $60 million of transaction expenses recorded in professional fees, and $92 million of UK stamp duty recorded in general and administrative expenses. Net of related tax benefit of $56 million, determined by applying applicable federal and state tax rates, the adjustment to net income was an increase of $96 million. |
• | Visa Europe Framework Agreement loss. Upon consummation of the transaction, on June 21, 2016, we recorded a non-recurring loss of $1.9 billion, before tax, in operating expense resulting from the effective settlement of the Framework Agreement between us and Visa Europe. Net of related tax benefit of $693 million, determined by applying applicable federal and state tax rates, the adjustment to net income was an increase of $1.2 billion. |
• | Net gains on currency forward contracts. During fiscal 2016, we entered into currency forward contracts to mitigate a portion of our foreign currency exchange rate risk associated with the upfront cash consideration paid in the Visa Europe acquisition. As a result, we recorded non-recurring, net gains of $74 million, before tax, in other non-operating income. Net of related tax expense of $27 million, determined by applying applicable federal and state tax rates, the adjustment to net income was a decrease of $47 million. |
• | Foreign exchange gain on euro deposits. During fiscal 2016, we recorded a non-recurring foreign exchange gain of $145 million, before tax, in other non-operating income as a result of holding euro-denominated bank balances for a short period in advance of the closing of the Visa Europe acquisition. Net of related tax expense of $54 million, determined by applying applicable federal and state tax rates, the impact to net income was a decrease of $91 million. |
34
• | Revaluation of Visa Europe put option. During the first quarter of fiscal 2016 and the third quarter of fiscal 2015, we recorded a decrease of $255 million and an increase of $110 million, respectively, in the fair value of the Visa Europe put option, resulting in the recognition of non-cash income and expense in other non-operating income. These amounts are not subject to income tax and therefore have no impact on our reported income tax provision. |
Adjusted operating expenses, operating margin, non-operating (expense) income, income taxes, net income and diluted earnings per share are non-GAAP financial measures and should not be relied upon as substitutes for measures calculated in accordance with U.S. GAAP. The following tables reconcile our as-reported financial measures calculated in accordance with U.S. GAAP to the respective non-GAAP adjusted financial measures for fiscal 2017, 2016 and 2015:
Fiscal 2017 | ||||||||||||||||||||||
(in millions, except percentages and per share data) | Operating Expenses | Operating Margin (1),(2) | Non-operating (Expense) Income | Income Taxes | Net Income | Diluted Earnings Per Share(2) | ||||||||||||||||
As reported | $ | 6,214 | 66 | % | $ | (450 | ) | $ | 4,995 | $ | 6,699 | $ | 2.80 | |||||||||
Elimination of deferred tax balances | — | — | % | — | (1,515 | ) | 1,515 | 0.63 | ||||||||||||||
Charitable contribution | (192 | ) | 1 | % | — | 71 | 121 | 0.05 | ||||||||||||||
As adjusted | $ | 6,022 | 67 | % | $ | (450 | ) | $ | 3,551 | $ | 8,335 | $ | 3.48 | |||||||||
Fiscal 2016 | ||||||||||||||||||||||
(in millions, except percentages and per share data) | Operating Expenses | Operating Margin (1),(2) | Non-operating (Expense) Income | Income Taxes | Net Income | Diluted Earnings Per Share(2) | ||||||||||||||||
As reported | $ | 7,199 | 52 | % | $ | 129 | $ | 2,021 | $ | 5,991 | $ | 2.48 | ||||||||||
Severance cost | (110 | ) | 1 | % | — | 38 | 72 | 0.03 | ||||||||||||||
Remeasurement of deferred tax liability | — | — | % | — | 88 | (88 | ) | (0.04 | ) | |||||||||||||
Acquisition-related costs | (152 | ) | 1 | % | — | 56 | 96 | 0.04 | ||||||||||||||
Visa Europe Framework Agreement loss | (1,877 | ) | 12 | % | — | 693 | 1,184 | 0.49 | ||||||||||||||
Net gains on currency forward contracts | — | — | % | (74 | ) | (27 | ) | (47 | ) | (0.02 | ) | |||||||||||
Foreign exchange gain on euro deposits | — | — | % | (145 | ) | (54 | ) | (91 | ) | (0.04 | ) | |||||||||||
Revaluation of Visa Europe put option | — | — | % | (255 | ) | — | (255 | ) | (0.11 | ) | ||||||||||||
As adjusted | $ | 5,060 | 66 | % | $ | (345 | ) | $ | 2,815 | $ | 6,862 | $ | 2.84 | |||||||||
Fiscal 2015 | ||||||||||||||||||||||
(in millions, except percentages and per share data) | Operating Expenses | Operating Margin (1),(2) | Non-operating (Expense) Income | Income Taxes | Net Income | Diluted Earnings Per Share (2),(3) | ||||||||||||||||
As reported | $ | 4,816 | 65 | % | $ | (69 | ) | $ | 2,667 | $ | 6,328 | $ | 2.58 | |||||||||
Revaluation of Visa Europe put option | — | — | % | 110 | — | 110 | 0.04 | |||||||||||||||
As adjusted | $ | 4,816 | 65 | % | $ | 41 | $ | 2,667 | $ | 6,438 | $ | 2.62 | ||||||||||
(1) | Operating margin is calculated as operating income divided by net operating revenues. |
(2) | Figures in the table may not recalculate exactly due to rounding. Operating margin, diluted earnings per share and their respective totals are calculated based on unrounded numbers. |
(3) | The per share amounts for the prior periods presented have been retroactively adjusted to reflect the four-for-one stock split effected in the second quarter of fiscal 2015. |
Common stock repurchases. During fiscal 2017, we repurchased 77 million shares of our class A common stock in the open market using $6.9 billion of cash on hand. As of September 30, 2017, we had remaining authorized funds of $3.9 billion. All share repurchase programs authorized prior to April 2017 have been completed. See Note 13—Stockholders' Equity to our consolidated financial statements included in Item 8—Financial Statements and Supplementary Data of this report.
35
Nominal payments volume and transaction counts. Payments volume is the primary driver for our service revenues, and the number of processed transactions is the primary driver for our data processing revenues. Nominal payments volume over the prior year posted double-digit growth in the United States, driven mainly by consumer credit. Nominal international payments volume growth was positively impacted due to the inclusion of nominal payments volume related to Visa Europe for the 12 months ended June 30, 2017(1). Growth on a constant-dollar basis, which excludes the impact of exchange rate movements, on our international payments volume was not significantly different from growth on a nominal-dollar basis for the 12 months ended June 30, 2017(1) and was 13% for the 12 months ended June 30, 2016(1). Growth in processed transactions reflects the inclusion of Visa Europe's processed transactions for the 12 months ended September 30, 2017 and three months ended September 30, 2016.
The following tables present nominal payments volume.(2)
United States | International | Visa Inc. | ||||||||||||||||||||||||||||||
12 months ended June 30,(1) | 12 months ended June 30,(1) | 12 months ended June 30,(1) | ||||||||||||||||||||||||||||||
2017 | 2016 | % Change | 2017 | 2016 | % Change | 2017 | 2016 | % Change | ||||||||||||||||||||||||
(in billions, except percentages) | ||||||||||||||||||||||||||||||||
Nominal payments volume | ||||||||||||||||||||||||||||||||
Consumer credit | $ | 1,309 | $ | 1,079 | 21 | % | $ | 2,224 | $ | 1,720 | 29 | % | $ | 3,533 | $ | 2,799 | 26 | % | ||||||||||||||
Consumer debit(3) | 1,372 | 1,320 | 4 | % | 1,545 | 454 | 241 | % | 2,917 | 1,774 | 64 | % | ||||||||||||||||||||
Commercial(4) | 506 | 450 | 12 | % | 309 | 147 | 110 | % | 815 | 598 | 36 | % | ||||||||||||||||||||
Total nominal payments volume(5) | $ | 3,187 | $ | 2,849 | 12 | % | $ | 4,078 | $ | 2,321 | 76 | % | $ | 7,265 | $ | 5,170 | 41 | % | ||||||||||||||
Cash volume | 543 | 520 | 5 | % | 2,357 | 1,775 | 33 | % | 2,900 | 2,294 | 26 | % | ||||||||||||||||||||
Total nominal volume(5),(6) | $ | 3,730 | $ | 3,369 | 11 | % | $ | 6,435 | $ | 4,095 | 57 | % | $ | 10,165 | $ | 7,464 | 36 | % | ||||||||||||||
United States | International | Visa Inc. | ||||||||||||||||||||||||||||||
12 months ended June 30,(1) | 12 months ended June 30,(1) | 12 months ended June 30,(1) | ||||||||||||||||||||||||||||||
2016 | 2015 | % Change | 2016 | 2015 | % Change | 2016 | 2015 | % Change | ||||||||||||||||||||||||
(in billions, except percentages) | ||||||||||||||||||||||||||||||||
Nominal payments volume | ||||||||||||||||||||||||||||||||
Consumer credit | $ | 1,079 | $ | 980 | 10 | % | $ | 1,720 | $ | 1,676 | 3 | % | $ | 2,799 | $ | 2,656 | 5 | % | ||||||||||||||
Consumer debit(3) | 1,320 | 1,201 | 10 | % | 454 | 462 | (2 | )% | 1,774 | 1,663 | 7 | % | ||||||||||||||||||||
Commercial(4) | 450 | 412 | 9 | % | 147 | 150 | (2 | )% | 598 | 562 | 6 | % | ||||||||||||||||||||
Total nominal payments volume(5) | $ | 2,849 | $ | 2,594 | 10 | % | $ | 2,321 | $ | 2,288 | 1 | % | $ | 5,170 | $ | 4,882 | 6 | % | ||||||||||||||
Cash volume | 520 | 491 | 6 | % | 1,775 | 2,015 | (12 | )% | 2,294 | 2,506 | (8 | )% | ||||||||||||||||||||
Total nominal volume(5),(6) | $ | 3,369 | $ | 3,085 | 9 | % | $ | 4,095 | $ | 4,303 | (5 | )% | $ | 7,464 | $ | 7,388 | 1 | % | ||||||||||||||
36
The following table presents nominal and constant payments volume growth.(2)
International | Visa Inc. | ||||||||||||||||||||||
12 months ended June 30, 2017 vs 2016(1) | 12 months ended June 30, 2016 vs 2015(1) | 12 months ended June 30, 2017 vs 2016(1) | 12 months ended June 30, 2016 vs 2015(1) | ||||||||||||||||||||
Nominal | Constant(7) | Nominal | Constant(7) | Nominal | Constant(7) | Nominal | Constant(7) | ||||||||||||||||
Payments volume growth | |||||||||||||||||||||||
Consumer credit | 29 | % | 30 | % | 3 | % | 13 | % | 26 | % | 27 | % | 5 | % | 12 | % | |||||||
Consumer debit(3) | 241 | % | 238 | % | (2 | )% | 15 | % | 64 | % | 64 | % | 7 | % | 11 | % | |||||||
Commercial(4) | 110 | % | 105 | % | (2 | )% | 12 | % | 36 | % | 36 | % | 6 | % | 10 | % | |||||||
Total payments volume growth(5) | 76 | % | 76 | % | 1 | % | 13 | % | 41 | % | 41 | % | 6 | % | 11 | % | |||||||
Cash volume growth | 33 | % | 33 | % | (12 | )% | 4 | % | 26 | % | 26 | % | (8 | )% | 4 | % | |||||||
Total volume growth(5) | 57 | % | 57 | % | (5 | )% | 9 | % | 36 | % | 36 | % | 1 | % | 9 | % | |||||||
(1) | Service revenues in a given quarter are assessed based on nominal payments volume in the prior quarter. Therefore, service revenues reported for the 12 months ended September 30, 2017, 2016 and 2015, were based on nominal payments volume reported by our financial institution clients for the 12 months ended June 30, 2017, 2016 and 2015, respectively. |
(2) | Figures in the tables may not recalculate exactly due to rounding. Percentage changes are calculated based on unrounded numbers. |
(3) | Includes consumer prepaid volume and interlink volume. |
(4) | Includes large, middle and small business credit and debit, as well as commercial prepaid volume. |
(5) | Our nominal payments volume, total payments volume growth and total volume growth for the 12 months ended June 30, 2016 does not reflect the related nominal payments volume of $477 billion and cash volume of $177 billion for Visa Europe for the three months ended June 30, 2016, which impacts our service revenues for the fourth quarter of fiscal 2016. |
(6) | Total nominal volume is the sum of total nominal payments volume and cash volume. Total nominal payments volume is the total monetary value of transactions for goods and services that are purchased on cards carrying the Visa, Visa Electron, Interlink and V PAY brands. Cash volume generally consists of cash access transactions, balance access transactions, balance transfers and convenience checks. Total nominal volume is provided by our financial institution clients, subject to review by Visa. On occasion, previously presented volume information may be updated. Prior period updates are not material. |
(7) | Growth on a constant-dollar basis excludes the impact of foreign currency fluctuations against the U.S. dollar. |
The following table provides the number of transactions involving Visa, Visa Electron, Interlink, VPAY and PLUS cards processed on Visa's networks during the fiscal periods presented.(1),(2)
2017 | 2016(3) | 2015(3) | 2017 vs. 2016 % Change | 2016 vs. 2015 % Change(3) | ||||||||||
(in millions, except percentages) | ||||||||||||||
Visa processed transactions | 111,215 | 83,159 | 70,968 | 34 | % | 17 | % | |||||||
(1) | Figures in the table may not recalculate exactly due to rounding. Percentage changes are calculated based on unrounded numbers. On occasion, previously presented information may be updated. Prior period updates are not material. Our operating revenues and related processed transactions for fiscal 2016 do not reflect the financial results or related processed transactions of Visa Europe from the acquisition date, June 21, 2016, through June 30, 2016 as the impact was immaterial. See Note 2—Visa Europe to our consolidated financial statements included in Item 8—Financial Statements and Supplementary Data of this report. |
(2) | Visa processed transactions in fiscal 2017 and fourth quarter of fiscal 2016 include transactions processed by Visa Europe. |
(3) | As a result of changes in Russian National Payment System law, we transitioned the processing of Russian domestic transactions to the Russian NSPK during the third quarter of fiscal 2015. The number of transactions processed by the Visa network does not reflect Russian domestic transactions processed after this transition. |
Results of Operations
Operating Revenues
Our operating revenues are primarily generated from payments volume on Visa products for purchased goods and services, as well as the number of transactions processed on our network. We do not earn revenues from, or bear credit risk with respect to, interest or fees paid by account holders on Visa products. Our issuing clients have the responsibility for issuing cards and other payment products, and determining the interest rates and fees paid by account holders. We generally do not earn revenues from the fees that merchants are charged for acceptance by the acquirers, including the merchant discount rate. Our acquiring clients are generally responsible for soliciting merchants, and establishing and earning these fees.
37
The following sets forth the components of our operating revenues:
Service revenues consist mainly of revenues earned for services provided in support of client usage of Visa products. Current quarter service revenues are primarily assessed using a calculation of current pricing applied to the prior quarter's payments volume. Service revenues also include assessments designed to support ongoing acceptance and volume growth initiatives, which are recognized in the same period the related volume is transacted.
Data processing revenues are earned for authorization, clearing, settlement, network access and other maintenance and support services that facilitate transaction and information processing among our clients globally. Data processing revenues are recognized in the same period the related transactions occur or services are rendered.
International transaction revenues are earned for cross-border transaction processing and currency conversion activities. Cross-border transactions arise when the country of origin of the issuer is different from that of the merchant. International transaction revenues are primarily generated by cross-border payments and cash volume.
Other revenues consist mainly of license fees for use of the Visa brand, fees for account holder services, certification and licensing, and other activities related to our acquired entities, and with respect to fiscal 2016 and 2015, revenues earned from Visa Europe in accordance with the Visa Europe Framework Agreement prior to the completion of the Visa Europe acquisition. Other revenues also include optional service or product enhancements, such as extended account holder protection and concierge services.
Client incentives consist of long-term contracts with financial institution clients, merchants and strategic partners for various programs designed to build payments volume, increase Visa product acceptance, win merchant routing transactions over our network and drive innovation. These incentives are primarily accounted for as reductions to operating revenues.
Operating Expenses
Personnel expenses include salaries, employee benefits, incentive compensation, share-based compensation, severance charges and contractor expense.
Marketing expenses include expenses associated with advertising and marketing campaigns, sponsorships and other related promotions of the Visa brand.
Network and processing expenses mainly represent expenses for the operation of our processing network, including maintenance, equipment rental and fees for other data processing services.
Professional fees mainly consist of fees for consulting, legal and other professional services.
Depreciation and amortization expenses include depreciation expense for property and equipment, as well as amortization of purchased and internally developed software. Also included in this amount is amortization of finite-lived intangible assets primarily obtained through acquisitions.
General and administrative expenses mainly consist of product enhancements, facilities costs, travel activities, foreign exchange gains and losses and other corporate expenses incurred in support of our business, and with respect to fiscal 2016, transaction costs related to the Visa Europe acquisition.
Litigation provision is an estimate of litigation expense and is based on management's understanding of our litigation profile, the specifics of the cases, advice of counsel to the extent appropriate and management's best estimate of incurred loss as of the balance sheet date.
Visa Europe Framework Agreement loss is a one-time loss incurred upon consummation of the Visa Europe acquisition on June 21, 2016, resulting from the effective settlement of the Framework Agreement between us and Visa Europe.
Non-operating (Expense) Income
Non-operating (expense) income primarily includes interest expense, gains and losses earned on investments and derivative instruments not associated with our core operations, and with respect to fiscal 2016 and 2015, changes in the fair value of the Visa Europe put option and income.
38
Visa Inc. Fiscal 2017, 2016 and 2015
Operating Revenues
The following table sets forth our operating revenues earned in the United States, internationally and in accordance with the Framework Agreement prior to the Visa Europe acquisition on June 21, 2016. Visa Europe revenue earned for fiscal 2017 and the fourth quarter of fiscal 2016 is included in International.
Fiscal Year Ended September 30, | $ Change | % Change(1) | |||||||||||||||||||||||
2017 | 2016(2) | 2015 | 2017 vs. 2016 | 2016 vs. 2015 | 2017 vs. 2016 | 2016 vs. 2015 | |||||||||||||||||||
(in millions, except percentages) | |||||||||||||||||||||||||
United States | $ | 8,704 | $ | 7,851 | $ | 7,406 | $ | 853 | $ | 445 | 11 | % | 6 | % | |||||||||||
International | 9,654 | 7,040 | 6,219 | 2,614 | 821 | 37 | % | 13 | % | ||||||||||||||||
Revenues earned under the Framework Agreement(3) | — | 191 | 255 | (191 | ) | (64 | ) | (100 | )% | (25 | )% | ||||||||||||||
Net operating revenues | $ | 18,358 | $ | 15,082 | $ | 13,880 | $ | 3,276 | $ | 1,202 | 22 | % | 9 | % | |||||||||||
(1) | Figures in the table may not recalculate exactly due to rounding. Percentage changes are calculated based on unrounded numbers. |
(2) | Our operating revenues for fiscal 2016 do not reflect revenues earned by Visa Europe from the acquisition date, June 21, 2016, through June 30, 2016 as the impact was immaterial. |
(3) | Reflects revenues earned from Visa Europe prior to the acquisition, in accordance with the Framework Agreement that provided for trademark and technology licenses and bilateral services. The Framework Agreement was effectively settled upon the closing of the acquisition. |
The increase in operating revenues primarily reflects the operating revenues of Visa Europe and continued growth in nominal payments volume, processed transactions and nominal cross-border volume. These benefits were partially offset by increases in client incentives.
Our operating revenues, primarily service revenues, international transaction revenues, and client incentives, are impacted by the overall strengthening or weakening of the U.S. dollar as payments volume and related revenues denominated in local currencies are converted to U.S. dollars. The effect of exchange rate movements in fiscal 2017, as partially mitigated by our hedging program, resulted in an approximately negative one and a half percentage point impact to our net operating revenue growth.
The following table sets forth the components of our net operating revenues, including operating revenues earned by Visa Europe for fiscal 2017 and the fourth quarter of fiscal 2016. Other revenues in fiscal 2016 and 2015 also included revenue earned from Visa Europe in accordance with the Framework Agreement prior to its acquisition on June 21, 2016.
Fiscal Year Ended September 30, | $ Change | % Change(1) | |||||||||||||||||||||||
2017 | 2016(2) | 2015 | 2017 vs. 2016 | 2016 vs. 2015 | 2017 vs. 2016 | 2016 vs. 2015 | |||||||||||||||||||
(in millions, except percentages) | |||||||||||||||||||||||||
Service revenues | $ | 7,975 | $ | 6,747 | $ | 6,302 | $ | 1,228 | $ | 445 | 18 | % | 7 | % | |||||||||||
Data processing revenues | 7,786 | 6,272 | 5,552 | 1,514 | 720 | 24 | % | 13 | % | ||||||||||||||||
International transaction revenues | 6,321 | 4,649 | 4,064 | 1,672 | 585 | 36 | % | 14 | % | ||||||||||||||||
Other revenues | 841 | 823 | 823 | 18 | — | 2 | % | — | % | ||||||||||||||||
Client incentives | (4,565 | ) | (3,409 | ) | (2,861 | ) | (1,156 | ) | (548 | ) | 34 | % | 19 | % | |||||||||||
Net operating revenues | $ | 18,358 | $ | 15,082 | $ | 13,880 | $ | 3,276 | $ | 1,202 | 22 | % | 9 | % | |||||||||||
(1) | Figures in the table may not recalculate exactly due to rounding. Percentage changes are calculated based on unrounded numbers. |
(2) | Our operating revenues for fiscal 2016 do not reflect revenues earned by Visa Europe from the acquisition date, June 21, 2016, through June 30, 2016 as the impact was immaterial. |
• | Service revenues increased in fiscal 2017 and 2016 primarily due to 41% and 6% growth in nominal payments volume, respectively. The growth in service revenues was slower than the growth in payments volume during fiscal 2017, reflecting the inclusion of Visa Europe revenue and the resulting impact on our service revenue yield. Fiscal 2017 and 2016 growth also reflected select pricing modifications. |
39
• | Data processing revenues increased in fiscal 2017 and 2016 due to overall growth in processed transactions of 34% and 17%, respectively. The growth in data processing revenues was slower than the growth in processed transactions, reflecting the inclusion of data processing revenues earned by Visa Europe and the resulting impact on our data processing revenue yield. |
• | International transaction revenues increased in fiscal 2017 and 2016 primarily due to nominal cross-border volume growth of 79% and 37%, respectively, which includes revenues earned by Visa Europe and the resulting impact on our corresponding yield. International transaction revenue growth in fiscal 2017 and 2016 also reflected select pricing modifications, which was partially offset in fiscal 2017 by lower volatility in a broad range of currencies. |
• | Client incentives increased in fiscal 2017 and 2016, reflecting overall growth in global payments volume, incentives incurred on long-term client contracts that were initiated or renewed during fiscal 2017 and 2016 and the inclusion of Visa Europe's incentives for fiscal 2017 and the fourth quarter of fiscal 2016. The amount of client incentives we record in future periods will vary based on changes in performance expectations, actual client performance, amendments to existing contracts or the execution of new contracts. |
Operating Expenses
The following table sets forth the components of our total operating expenses.
Fiscal Year Ended September 30, | $ Change | % Change(1) | |||||||||||||||||||||||
2017 | 2016(2) | 2015 | 2017 vs. 2016 | 2016 vs. 2015 | 2017 vs. 2016 | 2016 vs. 2015 | |||||||||||||||||||
(in millions, except percentages) | |||||||||||||||||||||||||
Personnel | $ | 2,628 | $ | 2,226 | $ | 2,079 | $ | 402 | $ | 147 | 18 | % | 7 | % | |||||||||||
Marketing | 922 | 869 | 872 | 53 | (3 | ) | 6 | % | — | % | |||||||||||||||
Network and processing | 620 | 538 | 474 | 82 | 64 | 15 | % | 13 | % | ||||||||||||||||
Professional fees | 409 | 389 | 336 | 20 | 53 | 5 | % | 16 | % | ||||||||||||||||
Depreciation and amortization | 556 | 502 | 494 | 54 | 8 | 11 | % | 2 | % | ||||||||||||||||
General and administrative | 1,060 | 796 | 547 | 264 | 249 | 33 | % | 46 | % | ||||||||||||||||
Litigation provision | 19 | 2 | 14 | 17 | (12 | ) | NM | (86 | )% | ||||||||||||||||
Visa Europe Framework Agreement loss | — | 1,877 | — | (1,877 | ) | 1,877 | (100 | )% | NM | ||||||||||||||||
Total operating expenses(3) | $ | 6,214 | $ | 7,199 | $ | 4,816 | $ | (985 | ) | $ | 2,383 | (14 | )% | 49 | % | ||||||||||
(1) | Figures in the table may not recalculate exactly due to rounding. Percentage changes are calculated based on unrounded numbers. |
(2) | Our operating expenses for fiscal 2016 do not reflect the expenses incurred by Visa Europe from the acquisition date, June 21, 2016, through June 30, 2016 as the impact was immaterial. |
(3) | Operating expenses for fiscal 2017 and 2016 include significant items that we do not believe are indicative of our operating performance as they are related to the charitable donation or the Visa Europe acquisition. See Overview within this Item 7—Management's Discussion and Analysis of Financial Condition and Results of Operations. |
Total operating expenses decreased primarily due to the $1.9 billion loss related to the effective settlement of the Framework Agreement between Visa and Visa Europe recorded during fiscal 2016. The remaining components of total operating expenses increased in fiscal 2017 primarily due to the inclusion of Visa Europe expenses. Additional factors impacting our operating expenses are discussed below.
• | Personnel expenses increased in fiscal 2017 driven by higher incentive compensation, combined with continued increase in headcount reflecting our strategy to invest for future growth. The increase in fiscal 2016 was primarily due to a severance charge related to personnel reductions including planned reductions at Visa Europe. This increase was partially offset by a decrease in contractor costs, an increase in personnel costs that were invested in and capitalized as part of technology development projects and lower incentive compensation. |
• | Network and processing expenses increased in fiscal 2017 and 2016 due to fees associated with the processing of Russian domestic transactions that transitioned to the Russian NSPK during the third quarter of fiscal 2015. |
• | Professional fees increased in fiscal 2016 primarily due to transaction costs incurred in connection with our acquisition of Visa Europe in 2016. |
40
• | Depreciation and amortization expenses increased in fiscal 2017 primarily due to additional depreciation from our ongoing investments in technology assets and infrastructure to support our digital solutions and core business initiatives. |
• | General and administrative expenses increased in fiscal 2017 primarily due to $192 million of expense related to the Visa Inc. shares held by Visa Europe that were received by the newly-formed Visa Foundation, as well as an increase in expense to provide product benefits to our account holders as a result of business growth. The increase in 2016 was mainly due to costs incurred related to our acquisition of Visa Europe in 2016 as well as net foreign exchange losses incurred as a result of changes in the U.S. dollar exchange rate against other currencies in which we transact. |
Non-operating (Expense) Income
The following table sets forth the components of our non-operating (expense) income.
Fiscal Year Ended September 30, | $ Change | % Change(1) | ||||||||||||||||||||||
2017 | 2016(2) | 2015 | 2017 vs. 2016 | 2016 vs. 2015 | 2017 vs. 2016 | 2016 vs. 2015 | ||||||||||||||||||
(in millions, except percentages) | ||||||||||||||||||||||||
Interest expense | $ | (563 | ) | $ | (427 | ) | $ | (3 | ) | $ | (136 | ) | $ | (424 | ) | 32 | % | NM | ||||||
Other | 113 | 556 | (66 | ) | (443 | ) | 622 | (80 | )% | NM | ||||||||||||||
Total non-operating (expense) income | $ | (450 | ) | $ | 129 | $ | (69 | ) | $ | (579 | ) | $ | 198 | NM | NM | |||||||||
(1) | Figures in the table may not recalculate exactly due to rounding. Percentage changes are calculated based on unrounded numbers. |
(2) | Fiscal 2016 non-operating (expense) income includes financial results of Visa Europe for the fourth quarter of fiscal 2016, but does not reflect the financial results of Visa Europe from the acquisition date, June 21, 2016, through June 30, 2016 as the impact was immaterial. |
• | Interest expense increased during fiscal 2017 and 2016 primarily due to the issuance of fixed-rate senior notes in each respective period. See Note 8—Debt to our consolidated financial statements included in Item 8—Financial Statements and Supplementary Data of this report. |
• | Other non-operating (expense) income in fiscal 2016 and 2015 was primarily comprised of the following: |
▪ | net gains of $74 million in fiscal 2016 related to currency forward contracts entered into to mitigate a portion of our foreign currency exchange rate risk associated with the upfront cash consideration paid in the Visa Europe acquisition; |
▪ | a foreign exchange gain of $145 million in fiscal 2016 on euro deposits as a result of holding euro-denominated bank balances for a short period in advance of the closing of the Visa Europe acquisition; |
▪ | a non-cash adjustment of $255 million in the first quarter of fiscal 2016 to decrease the fair value of the Visa Europe put option, which is not subject to tax, reducing the fair value of the liability to zero; and |
▪ | a non-cash adjustment of $110 million in the third quarter of fiscal 2015 to increase the fair value of the unamended Visa Europe put option, which is not subject to tax. |
See Note 4—Fair Value Measurements and Investments and Note 11—Derivative and Non-derivative Financial Instruments to our consolidated financial statements included in Item 8—Financial Statements and Supplementary Data of this report.
Effective Income Tax Rate
In February 2017, to align our corporate structure to the geographic jurisdictions in which we conduct business operations, we completed a reorganization of Visa Europe and certain other legal entities. As a result of the reorganization, we recorded a non-recurring, non-cash income tax provision of $1.5 billion primarily related to the elimination of deferred tax balances originally recognized upon the acquisition of Visa Europe. Associated with this reorganization, the newly-formed Visa Foundation received all Visa Inc. shares held by Visa Europe that were previously recorded as treasury stock.
41
The effective income tax rate was 43% in fiscal 2017 and 25% in fiscal 2016. The effective tax rate in fiscal 2017 differs from the effective tax rate in fiscal 2016 primarily due to:
• | the aforementioned $1.5 billion non-recurring, non-cash income tax provision related to the legal entity reorganization recorded in fiscal 2017; |
• | $71 million tax benefit related to Visa Foundation's receipt of Visa Inc. shares mentioned above, recorded in fiscal 2017; |
• | $70 million of excess tax benefits related to share-based payments recorded in fiscal 2017, as a result of the early adoption of Accounting Standards Update 2016-09. See Note 1—Summary of Significant Accounting Policies to our consolidated financial statements included in Item 8—Financial Statements and Supplementary Data of this report; and |
• | the absence of: |
▪ | the effect of one-time items related to the Visa Europe acquisition recorded during fiscal 2016, the most significant of which was the $1.9 billion U.S. loss related to the effective settlement of the Framework Agreement between Visa and Visa Europe. These one-time items impacted the geographic mix of our global income, resulting in a reduced effective tax rate in fiscal 2016; |
▪ | an $88 million one-time tax benefit due to the remeasurement of deferred tax liabilities as a result of the reduction in the UK tax rate enacted in fiscal 2016; and |
▪ | the non-taxable $255 million revaluation of the Visa Europe put option recorded in fiscal 2016. |
The effective income tax rate was 25% in fiscal 2016 and 30% in fiscal 2015. The effective rate in fiscal 2016 differs from the effective tax rate in fiscal 2015 primarily due to:
• | the effect of one-time items related to the Visa Europe acquisition, as mentioned above, that impacted the geographic mix of global income resulting in a reduced effective tax rate in fiscal 2016; |
• | an $88 million one-time tax benefit due to the remeasurement of deferred tax liabilities as a result of the reduction in the UK tax rate enacted in fiscal 2016; |
• | the non-taxable $255 million revaluation of the Visa Europe put option recorded in fiscal 2016; and |
• | the absence of a $296 million tax benefit recognized in fiscal 2015 resulting from the resolution of uncertain tax positions with taxing authorities. Included in the $296 million was a one-time $239 million tax benefit that related to prior fiscal years. |
Adjusted effective income tax rate. Our financial results for fiscal 2017 and 2016 reflect the impact of certain significant items that we do not believe are indicative of our ongoing operating performance in the prior or future years, as they are either non-recurring or have no cash impact. As such, we have presented our adjusted effective income tax rate in the tables below, which we believe provides a clearer understanding of our operating performance in fiscal 2017 and 2016. See Overview—Adjusted financial results within this Management's Discussion and Analysis of Financial Condition and Results of Operations for descriptions of the adjustments in the table below.
Fiscal 2017 | ||||||||||
Income Before Income Taxes | Income Tax Provision | Effective Income Tax Rate(1) | ||||||||
As reported | $ | 11,694 | $ | 4,995 | 42.7 | % | ||||
Elimination of deferred tax balances | — | (1,515 | ) | |||||||
Charitable contribution | 192 | 71 | ||||||||
As adjusted | $ | 11,886 | $ | 3,551 | 29.9 | % | ||||
42
Fiscal 2016 | ||||||||||
Income Before Income Taxes | Income Tax Provision | Effective Income Tax Rate(1) | ||||||||
As reported | $ | 8,012 | $ | 2,021 | 25.2 | % | ||||
Severance cost | 110 | 38 | ||||||||
Remeasurement of deferred tax liability | — | 88 | ||||||||
Acquisition-related costs | 152 | 56 | ||||||||
Visa Europe Framework Agreement loss | 1,877 | 693 | ||||||||
Net gains on currency forward contracts | (74 | ) | (27 | ) | ||||||
Foreign exchange gain on euro deposits | (145 | ) | (54 | ) | ||||||
Revaluation of Visa Europe put option | (255 | ) | — | |||||||
As adjusted | $ | 9,677 | $ | 2,815 | 29.1 | % | ||||
(1) | Figures in the table may not recalculate exactly due to rounding. Effective income tax rate changes are calculated based on unrounded numbers. |
Liquidity and Capital Resources
Management of Our Liquidity
We regularly evaluate cash requirements for current operations, commitments, development activities and capital expenditures, and we may elect to raise additional funds for these purposes in the future through the issuance of either debt or equity. Our treasury policies provide management with the guidelines and authority to manage liquidity risk in a manner consistent with our corporate objectives.
The objectives of our treasury policies are to:
• | provide adequate liquidity to cover operating expenditures and liquidity contingency scenarios; |
• | ensure timely completion of payments settlement activities; |
• | ensure payments on required litigation settlements; |
• | make planned capital investments in our business; |
• | pay dividends and repurchase our shares at the discretion of our board of directors; and |
• | invest excess cash in securities that enable us to first meet our working capital and liquidity needs, and earn additional income. |
Based on our current cash flow budgets and forecasts of our short-term and long-term liquidity needs, we believe that our projected sources of liquidity will be sufficient to meet our projected liquidity needs for more than the next 12 months. We will continue to assess our liquidity position and potential sources of supplemental liquidity in view of our operating performance, current economic and capital market conditions, and other relevant circumstances.
Cash Flow Data
The following table summarizes our cash flow activity for the fiscal years presented:
2017 | 2016 | 2015 | |||||||||
(in millions) | |||||||||||
Total cash provided by (used in): | |||||||||||
Operating activities | $ | 9,208 | $ | 5,574 | $ | 6,584 | |||||
Investing activities | 735 | (10,916 | ) | (1,435 | ) | ||||||
Financing activities | (5,924 | ) | 7,477 | (3,603 | ) | ||||||
Effect of exchange rate changes on cash and cash equivalents | 236 | (34 | ) | 1 | |||||||
Increase in cash and cash equivalents | $ | 4,255 | $ | 2,101 | $ | 1,547 | |||||
43
Operating activities. Cash provided by operating activities in fiscal 2017 was impacted by the inclusion of Visa Europe in our results for the full year, while fiscal 2016 had one quarter of results that included Visa Europe. Other factors impacting cash provided by operating activities include:
• | $1.9 billion of the consideration paid in the Visa Europe acquisition during fiscal 2016 related to the effective settlement of the Framework Agreement between us and Visa Europe; |
• | payments of $489 million and $244 million of interest on the outstanding senior notes during fiscal 2017 and 2016, respectively; and |
• | payments of $426 million made from the U.S. litigation escrow account and a related decrease of approximately $157 million of income taxes paid during fiscal 2015. |
The cash inflows and outflows related to the U.S. litigation escrow account are also reflected as offsetting cash flows within financing activities for their respective years as they are covered by the U.S. retrospective responsibility plan. See Note 3—U.S. and Europe Retrospective Responsibility Plans and Note 19—Legal Matters to our consolidated financial statements included in Item 8—Financial Statements and Supplementary Data of this report.
Investing activities. Cash provided by investing activities in fiscal 2017 reflected net proceeds from maturities and sales of available-for-sale investment securities. Cash used in investing activities in fiscal 2016 primarily reflected the up-front cash consideration paid in the Visa Europe acquisition, offset by $2.8 billion of cash held by Visa Europe at the closing of the transaction in fiscal 2016. See Note 2—Visa Europe to our consolidated financial statements included in Item 8—Financial Statements and Supplementary Data of this report. Cash used in investing activities in fiscal 2015 reflected net purchases of available-for-sale securities.
Financing activities. Cash used in financing activities in fiscal 2017 primarily reflected $6.9 billion used to repurchase class A common stock in the open market and $1.6 billion of dividend payments, partially offset by $2.5 billion net aggregate proceeds received from our debt issuance completed in September 2017. Cash provided by financing activities in fiscal 2016 primarily reflected $15.9 billion net aggregate proceeds received from our debt issuance completed in December 2015, partially offset by $7.0 billion used to repurchase class A common stock in the open market and $1.4 billion of dividend payments. Cash used in financing activities in fiscal 2015 reflected payments of $426 million made from the U.S. litigation escrow account in connection with the interchange multidistrict litigation that offset the impacts discussed above within operating activities, as they are covered by the U.S. retrospective responsibility plan. See Note 3—U.S. and Europe Retrospective Responsibility Plans, Note 8—Debt, Note 13—Stockholders' Equity and Note 19—Legal Matters to our consolidated financial statements included in Item 8—Financial Statements and Supplementary Data of this report.
Sources of Liquidity
Our primary sources of liquidity are cash on hand, cash flow from our operations, our investment portfolio and access to various equity and borrowing arrangements. Funds from operations are maintained in cash and cash equivalents and short-term or long-term available-for-sale investment securities based upon our funding requirements, access to liquidity from these holdings, and the return that these holdings provide. We believe that cash flow generated from operations, in conjunction with access to our other sources of liquidity, will be more than sufficient to meet our ongoing operational needs.
Cash and cash equivalents and short-term and long-term available-for-sale investment securities held by our foreign subsidiaries, primarily attributable to undistributed earnings, totaled $6.9 billion at September 30, 2017. Following our legal entity reorganization in the second quarter of fiscal 2017, we returned net $5.0 billion of cash held by our foreign subsidiaries to the United States in fiscal 2017. This transaction did not constitute a return of undistributed earnings and was not subject to U.S. income taxes. If it were necessary to repatriate the undistributed earnings of our foreign subsidiaries for use in the United States, we would be required to pay U.S. income taxes on the repatriated earnings. It is our intent to indefinitely reinvest the majority of the undistributed earnings outside of the United States. As such, we have not accrued any U.S. income tax provision in our financial results related to approximately $12.9 billion of undistributed earnings of our foreign subsidiaries. The amount of income taxes that would have resulted had these undistributed earnings been repatriated is not practicably determinable.
Available-for-sale investment securities. Our investment portfolio is designed to invest excess cash in securities which enables us to meet our working capital and liquidity needs. Our investment portfolio primarily consists of debt securities issued by the U.S. Treasury or U.S. government-sponsored agencies. The majority of these investments, $3.5 billion, are classified as current and are available to meet short-term liquidity needs. The remaining non-current investments have stated maturities of more than one year from the balance sheet date, however, are also generally available to meet short-term liquidity needs.
44
Factors that may impact the liquidity of our investment portfolio include, but are not limited to, changes to credit ratings of the securities, uncertainty related to regulatory developments, actions by central banks and other monetary authorities, and the ongoing strength and quality of credit markets. We will continue to review our portfolio in light of evolving market and economic conditions. However, if current market conditions deteriorate, the liquidity of our investment portfolio may be impacted and we could determine that some of our investments are impaired, which could adversely impact our financial results. We have policies that limit the amount of credit exposure to any one financial institution or type of investment.
Commercial paper program. We maintain a commercial paper program to support our working capital requirements and for other general corporate purposes. Under the program, we are authorized to issue up to $3.0 billion in outstanding notes, with maturities up to 397 days from the date of issuance. We had no outstanding obligations under the program at September 30, 2017. See Note 8—Debt to our consolidated financial statements included in Item 8—Financial Statements and Supplementary Data of this report.
Credit facility. On January 27, 2016, we entered into an unsecured $4.0 billion revolving credit facility. On January 27, 2017, we extended the term of the credit facility, which will now expire on January 27, 2022. There were no borrowings under the credit facility as of September 30, 2017 and we were in compliance with all related covenants as of and during the year ended September 30, 2017. See Note 8—Debt to our consolidated financial statements included in Item 8—Financial Statements and Supplementary Data of this report.
Universal shelf registration statement. In July 2015, we filed a registration statement with the SEC using a shelf registration process. As permitted by the registration statement, we may, from time to time, sell shares of debt or equity securities in one or more transactions. This registration statement expires in July 2018.
Long-term debt. In September 2017, we issued fixed-rate senior notes in an aggregate principal amount of $2.5 billion, with maturities ranging between 5 and 30 years. We also issued in December 2015 fixed-rate senior notes in an aggregate principal amount of $16.0 billion, with maturities ranging between 2 and 30 years. Subsequent to our fiscal year-end, in October 2017, we used the majority of the proceeds from the September 2017 debt issuance to redeem the $1.75 billion of senior notes that was scheduled to mature in December 2017. We are not subject to any financial covenants and did not experience any changes to our investment credit ratings as a result of these debt issuances. See Note 8—Debt to our consolidated financial statements included in Item 8—Financial Statements and Supplementary Data of this report.
U.S. Litigation escrow account. Pursuant to the terms of the U.S. retrospective responsibility plan, we maintain a U.S. litigation escrow account from which monetary liabilities from settlements of, or judgments in, the U.S. covered litigation will be payable. When we fund the U.S. litigation escrow account, the shares of class B common stock held by our stockholders are subject to dilution through an adjustment to the conversion rate of the shares of class B common stock to shares of class A common stock. See Note 3—U.S. and Europe Retrospective Responsibility Plans and Note 19—Legal Matters to our consolidated financial statements included in Item 8—Financial Statements and Supplementary Data of this report. The balance in this account at September 30, 2017, was $1.0 billion and is reflected as restricted cash in our consolidated balance sheet. As these funds are restricted for the sole purpose of making payments related to the U.S. covered litigation matters, as described below under Uses of Liquidity, we do not rely on them for other operational needs.
Credit Ratings
At September 30, 2017, our credit ratings by Standard and Poor’s and Moody’s were as follows:
Standard and Poor’s | Moody’s | ||||||
Debt type | Rating | Outlook | Rating | Outlook | |||
Short-term unsecured debt | A-1 | Stable | P-1 | Stable | |||
Long-term unsecured debt | A+ | Stable | A1 | Stable | |||
Various factors affect our credit ratings, including changes in our operating performance, the economic environment, conditions in the electronic payment industry, our financial position and changes in our business strategy. We do not currently foresee any reasonable circumstances under which our credit ratings would be significantly downgraded. If a downgrade were to occur, it could adversely impact, among other things, our future borrowing costs and access to capital markets.
45
Uses of Liquidity
Payments settlement. Payments settlement due to and from our financial institution clients can represent a substantial daily liquidity requirement. Most U.S. dollar settlements are settled within the same day and do not result in a net receivable or payable balance, while settlements in currencies other than the U.S. dollar generally remain outstanding for one to two business days, which is consistent with industry practice for such transactions. In general, during fiscal 2017, we were not required to fund settlement-related working capital. Our average daily net settlement position was a net payable of $426 million. We hold about $7 billion of available liquidity, in the form of cash, cash equivalents and available-for-sale investment securities, to fund daily settlement in the event one or more of our financial institution clients are unable to settle.
U.S. covered litigation. We are parties to legal and regulatory proceedings with respect to a variety of matters, including certain litigation that we refer to as the U.S. covered litigation. As noted above, monetary liabilities from settlements of, or judgments in, the U.S. covered litigation are payable from the U.S. litigation escrow account. During fiscal 2017, we made no covered litigation payments that were funded from the U.S. litigation escrow account. At September 30, 2017, the U.S. litigation escrow account had an available balance of $1.0 billion. In June 2016, the approval of the 2012 Settlement Agreement was reversed by the U.S. Court of Appeals for the Second Circuit. Until the appeals process is complete, it is uncertain whether the Company will be able to resolve the class plaintiffs' claims as contemplated by the Settlement Agreement. If the Settlement Agreement is terminated and no further agreement is reached regarding funds previously paid from the litigation account into settlement funds pursuant to the Settlement Agreement, we will have the right to approximately $3.0 billion, which would be returned to the U.S. litigation escrow account. This will increase our taxable income, thereby increasing our taxes to be paid by approximately $1.1 billion. See Note 3—U.S. and Europe Retrospective Responsibility Plans and Note 19—Legal Matters to our consolidated financial statements included in Item 8—Financial Statements and Supplementary Data of this report.
Other litigation. Judgments in and settlements of litigation, other than the U.S. covered litigation, including VE territory covered litigation or other fines imposed in investigations and proceeding, could give rise to future liquidity needs.
Common stock repurchases. During fiscal 2017, we repurchased 77 million shares of our class A common stock in the open market using $6.9 billion of cash on hand. As of September 30, 2017, we had remaining authorized funds of $3.9 billion. In April 2017 our board of directors authorized a share repurchase program for $5.0 billion. This authorization has no expiration date. All share repurchase programs authorized prior to April 2017 have been completed. See Note 13—Stockholders' Equity to our consolidated financial statements included in Item 8—Financial Statements and Supplementary Data of this report.
Dividends. During fiscal 2017, we declared and paid $1.6 billion in dividends. In October 2017, our board of directors declared a quarterly dividend in the aggregate amount of $0.195 per share of class A common stock (determined in the case of class B and C common stock and series B and C preferred stock on an as-converted basis). We expect to pay approximately $459 million in connection with this dividend on December 5, 2017. See Note 13—Stockholders' Equity to our consolidated financial statements included in Item 8—Financial Statements and Supplementary Data of this report. We expect to continue paying quarterly dividends in cash, subject to approval by the board of directors. All preferred and class B and C common stock will share ratably on an as-converted basis in such future dividends.
Pension and other postretirement benefits. We sponsor various qualified and non-qualified defined benefit pension and other postretirement benefit plans that provide for retirement and medical benefits for substantially all employees residing in the United States. As a result of the acquisition of Visa Europe, we assumed the obligations related to Visa Europe's defined benefit plan, primarily consisting of the UK pension plans. Our policy with respect to our U.S. qualified pension plan is to contribute annually in September of each year, an amount not less than the minimum required under the Employee Retirement Income Security Act. Our U.S. non-qualified pension and other postretirement benefit plans are funded on a current basis. In relation to the Visa Europe UK pension plans, our funding policy is to contribute in accordance with the appropriate funding requirements agreed with the trustees of our UK pension plans. Additional amounts may be agreed with the UK pension plan trustees. In fiscal 2017, 2016 and 2015, we made contributions to our U.S. pension and other postretirement benefit plans of $12 million, $4 million and $19 million, respectively. For Visa Europe's UK pension plans, we made contributions of $5 million and $102 million in fiscal 2017 and 2016, respectively, subsequent to the acquisition date as agreed upon with the trustees to improve the funding level of the plans. In fiscal 2018, given current projections and assumptions, we anticipate funding our U.S. pension and other postretirement benefit plans and Visa Europe's UK defined benefit pension plans by approximately $3 million and $5 million, respectively. The actual contribution amount will vary depending upon the funded status of the pension plan,
46
movements in the discount rate, performance of the plan assets and related tax consequences. See Note 9—Pension, Postretirement and Other Benefits to our consolidated financial statements included in Item 8—Financial Statements and Supplementary Data of this report.
Capital expenditures. Our capital expenditures increased during fiscal 2017, due to investments in technology, infrastructure and growth initiatives. We expect to continue investing in technology assets and payments system infrastructure to support our digital solutions and core business initiatives.
Acquisitions. In February 2017, we acquired a business using $302 million of cash on hand, primarily reflecting total purchase price less cash received. The acquisition will help Visa's clients and merchant partners accelerate digital commerce. On June 21, 2016, we acquired 100% of the share capital of Visa Europe, a payments technology business. The acquisition positions us to create additional value through increased scale, efficiencies realized by the integration of both businesses, and benefits related to Visa Europe's transition from an association to a for-profit enterprise. We paid up-front cash consideration of €12.2 billion ($13.9 billion) and issued preferred stock convertible upon certain conditions into approximately 79 million shares of class A common stock, equivalent to a value of €5.3 billion ($6.1 billion) at the closing stock price of $77.33 on June 21, 2016. Also, in connection with the purchase, we will pay an additional €1.0 billion, plus 4% compound annual interest, on the third anniversary of the closing of the acquisition. See Note 2—Visa Europe and Note 6—Intangible Assets and Goodwill to our consolidated financial statements included in Item 8—Financial Statements and Supplementary Data of this report.
Fair Value Measurements—Financial Instruments
The assessment of fair value of our financial instruments is based on a fair value hierarchy that requires an entity to maximize the use of observable inputs and minimize the use of unobservable inputs when measuring fair value. Observable inputs are obtained from independent sources and can be validated by a third party, whereas unobservable inputs reflect assumptions regarding what a third party would use in pricing an asset or liability. As of September 30, 2017, our financial instruments measured at fair value on a recurring basis included approximately $14.3 billion of assets and $98 million of liabilities. None of these instruments were valued using significant unobservable inputs. See Note 4—Fair Value Measurements and Investments to our consolidated financial statements included in Item 8—Financial Statements and Supplementary Data of this report.
Off-Balance Sheet Arrangements
Our off-balance sheet arrangements are primarily comprised of guarantees and indemnifications. Visa has no off-balance sheet debt, other than lease and purchase order commitments, as discussed below and reflected in our contractual obligations table.
Indemnifications
We indemnify our financial institution clients for settlement losses suffered due to the failure of any other client to fund its settlement obligations in accordance with our rules. The amount of the indemnification is limited to the amount of unsettled Visa payment transactions at any point in time. We maintain global credit settlement risk policies and procedures to manage settlement risk, which may require clients to post collateral if certain credit standards are not met. See Note 1—Summary of Significant Accounting Policies and Note 10—Settlement Guarantee Management to our consolidated financial statements included in Item 8—Financial Statements and Supplementary Data of this report.
In the ordinary course of business, we enter into contractual arrangements with financial institutions and other clients and partners under which we may agree to indemnify the client for certain types of losses incurred relating to the services we provide or otherwise relating to our performance under the applicable agreement.
Contractual Obligations
Our contractual commitments will have an impact on our future liquidity. The contractual obligations identified in the table below include both on- and off-balance sheet transactions that represent a material, expected or contractually committed future obligation as of September 30, 2017. We believe that we will be able to fund these obligations through cash generated from our operations and available credit facilities.
47
Payments Due by Period | |||||||||||||||||||
Less than 1 Year | 1-3 Years | 3-5 Years | More than 5 Years | Total | |||||||||||||||
(in millions) | |||||||||||||||||||
Long-term debt(1) | $ | 2,298 | $ | 1,074 | $ | 4,974 | $ | 18,386 | $ | 26,732 | |||||||||
Purchase orders(2) | 827 | 124 | 26 | 2 | 979 | ||||||||||||||
Leases(3) | 155 | 187 | 121 | 163 | 626 | ||||||||||||||
Client incentives(4) | 6,306 | 8,475 | 6,663 | 5,344 | 26,788 | ||||||||||||||
Marketing and sponsorship(5) | 124 | 235 | 73 | — | 432 | ||||||||||||||
Dividends(6) | 459 | — | — | — | 459 | ||||||||||||||
Deferred purchase consideration(7) | — | 1,331 | — | — | 1,331 | ||||||||||||||
Total(8),(9) | $ | 10,169 | $ | 11,426 | $ | 11,857 | $ | 23,895 | $ | 57,347 | |||||||||
(1) | Amounts presented include payments for both interest and principal. Also see Note 8—Debt to our consolidated financial statements included in Item 8—Financial Statements and Supplementary Data of this report. |
(2) | Represents agreements to purchase goods and services that specify significant terms, including: fixed or minimum quantities to be purchased, minimum or variable price provisions, and the approximate timing of the transaction. |
(3) | Includes operating leases for premises, equipment and software licenses, which range in terms from less than one year to twenty years. |
(4) | Future cash payments for long-term contracts with financial institution clients and other business partners is unknowable due to the inherent unpredictability of payment and transaction volume. These agreements, which range in terms from one to sixteen years, can provide card issuance and/or conversion support, volume/growth targets and marketing and program support based on specific performance requirements. These payment amounts are our best estimates and will likely change materially based on actual client performance, amendments to existing contracts or the execution of new contracts. Related amounts disclosed in Note 16—Commitments and Contingencies to our consolidated financial statements represent the associated expected reduction of revenue related to these agreements, which are also estimates that will likely change materially due to the same factors described above. |
(5) | Visa is a party to contractual sponsorship agreements ranging from approximately two to sixteen years. These contracts are designed to increase Visa brand recognition, drive Visa product usage, and differentiate Visa against competition. Over the life of these contracts, Visa is required to make payments in exchange for certain advertising and promotional rights. In connection with these contractual commitments, Visa has an obligation to spend certain minimum amounts for advertising and marketing promotion over the life of the contract. For obligations where the individual years of spend are not specified in the contract, we have estimated the timing of when these amounts will be spent. |
(6) | Includes expected dividend amount of $459 million as dividends were declared in October 2017 and will be paid on December 5, 2017 to all holders of record of Visa's common stock as of November 17, 2017. |
(7) | On June 21, 2016, we acquired 100% of the share capital of Visa Europe. In connection with the purchase, we will pay an additional €1.0 billion, plus 4% compound annual interest, on the third anniversary of the closing of the Visa Europe acquisition. Amount presented was converted to U.S. dollar at the September 30, 2017 exchange rate. See Note 2—Visa Europe to our consolidated financial statements included in Item 8—Financial Statements and Supplementary Data of this report. |
(8) | We have liabilities for uncertain tax positions of $1.1 billion. At September 30, 2017, we had also accrued $84 million of interest and $34 million of penalties associated with our uncertain tax positions. We cannot determine the range of cash payments that will be made and the timing of the cash settlements, if any, associated with our uncertain tax positions. Therefore, no amounts related to these obligations have been included in the table. |
(9) | We evaluate the need to make contributions to our pension plan after considering the funded status of the pension plan, movements in the discount rate, performance of the plan assets and related tax consequences. Expected contributions to our pension plan have not been included in the table as such amounts are dependent upon the considerations discussed above, and may result in a wide range of amounts. See Note 9—Pension, Postretirement and Other Benefits to our consolidated financial statements included in Item 8—Financial Statements and Supplementary Data of this report and the Liquidity and Capital Resources section of this Management's Discussion and Analysis of Financial Condition and Results of Operations. |
Critical Accounting Estimates
Our consolidated financial statements are prepared in accordance with accounting principles generally accepted in the United States of America which require us to make judgments, assumptions and estimates that affect the amounts reported. See Note 1—Summary of Significant Accounting Policies to our consolidated financial statements included in Item 8—Financial Statements and Supplementary Data of this report. We have established policies and control procedures which seek to ensure that estimates and assumptions are appropriately governed and applied consistently from period to period. However, actual results could differ from our assumptions and estimates, and such differences could be material.
We believe that the following accounting estimates are the most critical to fully understand and evaluate our reported financial results, as they require our most subjective or complex management judgments, resulting from the need to make estimates about the effect of matters that are inherently uncertain and unpredictable.
Revenue Recognition—Client Incentives
48
Critical estimates. We enter into incentive agreements with financial institution clients, merchants and other business partners for various programs designed to build payments volume, increase Visa product acceptance and win merchant routing transactions over our network. These incentives are primarily accounted for as reductions to operating revenues; however, if a separate identifiable benefit at fair value can be established, they are accounted for as operating expenses. We generally capitalize advance incentive payments under these agreements if select criteria are met. The capitalization criteria include the existence of future economic benefits to Visa, the existence of legally enforceable recoverability language (e.g., early termination clauses), management's ability and intent to enforce the recoverability language and the ability to generate future earnings from the agreement in excess of amounts deferred. Capitalized amounts are amortized over the shorter of the period of contractual recoverability or the corresponding period of economic benefit. Incentives not yet paid are accrued systematically and rationally based on management's estimate of each client's performance. These accruals are regularly reviewed and estimates of performance are adjusted as appropriate, based on changes in performance expectations, actual client performance, amendments to existing contracts or the execution of new contracts.
Assumptions and judgment. Estimation of client incentives relies on forecasts of payments volume, card issuance and card conversion. Performance is estimated using client-reported information, transactional information accumulated from our systems, historical information and discussions with our clients, merchants and business partners.
Impact if actual results differ from assumptions. If actual performance or recoverable cash flows are not consistent with our estimates, client incentives may be materially different than initially recorded. Increases in incentive payments are generally driven by increased payments and transaction volume, which drive our net revenues. As a result, in the event incentive payments exceed estimates, such payments are not expected to have a material effect on our financial condition, results of operations or cash flows. The cumulative impact of a revision in estimates is recorded in the period such revisions become probable and estimable. For the year ended September 30, 2017, client incentives represented 20% of gross operating revenues.
Legal and Regulatory Matters
Critical estimates. We are currently involved in various legal proceedings, the outcomes of which are not within our complete control or may not be known for prolonged periods of time. Management is required to assess the probability of loss and amount of such loss, if any, in preparing our financial statements.
Assumptions and judgment. We evaluate the likelihood of a potential loss from legal or regulatory proceedings to which we are a party. We record a liability for such claims when a loss is deemed probable and the amount can be reasonably estimated. Significant judgment may be required in the determination of both probability and whether an exposure is reasonably estimable. Our judgments are subjective based on the status of the legal or regulatory proceedings, the merits of our defenses and consultation with in-house and outside legal counsel. As additional information becomes available, we reassess the potential liability related to pending claims and may revise our estimates.
Our U.S. retrospective responsibility plan only addresses monetary liabilities from settlements of, or final judgments in, the U.S. covered litigation. The plan's mechanisms include the use of the U.S. litigation escrow account. The accrual related to the U.S. covered litigation could be either higher or lower than the U.S. litigation escrow account balance. We did not record an accrual for the U.S. covered litigation during fiscal 2017. Our Europe retrospective responsibility plan only covers Visa Europe territory covered litigation (and resultant liabilities and losses) relating to the covered period, subject to certain limitations, and does not cover any fines or penalties incurred in the European Commission proceedings or any other matter. See Note 3—U.S. and Europe Retrospective Responsibility Plans and Note 19—Legal Matters to our consolidated financial statements included in Item 8—Financial Statements and Supplementary Data of this report.
Impact if actual results differ from assumptions. Due to the inherent uncertainties of the legal and regulatory processes in the multiple jurisdictions in which we operate, our judgments may be materially different than the actual outcomes, which could have material adverse effects on our business, financial conditions and results of operations. See Note 19—Legal Matters to our consolidated financial statements included in Item 8—Financial Statements and Supplementary Data of this report.
49
Income Taxes
Critical estimates. In calculating our effective income tax rate, we make judgments regarding certain tax positions, including the timing and amount of deductions and allocations of income among various tax jurisdictions.
Assumptions and judgment. We have various tax filing positions with regard to the timing and amount of deductions and credits, the establishment of liabilities for uncertain tax positions and the allocation of income among various tax jurisdictions. We are also required to inventory, evaluate and measure all uncertain tax positions taken or to be taken on tax returns and to record liabilities for the amount of such positions that may not be sustained, or may only be partially sustained, upon examination by the relevant taxing authorities.
Impact if actual results differ from assumptions. Although we believe that our estimates and judgments are reasonable, actual results may differ from these estimates. Some or all of these judgments are subject to review by the taxing authorities. If one or more of the taxing authorities were to successfully challenge our right to realize some or all of the tax benefit we have recorded, and we were unable to realize this benefit, it could have a material adverse effect on our financial results and cash flows.
ITEM 7A. | Quantitative and Qualitative Disclosures about Market Risk |
Market risk is the potential economic loss arising from adverse changes in market factors. Our exposure to financial market risks results primarily from fluctuations in foreign currency exchange rates, interest rates and equity prices. Aggregate risk exposures are monitored on an ongoing basis.
Foreign Currency Exchange Rate Risk
We are exposed to adverse fluctuations in foreign currency exchange rates. Risks from foreign currency exchange rate fluctuations are primarily related to adverse changes in the functional currency value of revenues generated from foreign currency-denominated transactions and adverse changes in the functional currency value of payments in foreign currencies. We manage these risks by entering into foreign currency forward contracts that hedge exposures of the variability in the functional currency equivalent of anticipated non-functional currency denominated cash flows. Our foreign currency exchange rate risk management program reduces, but does not entirely eliminate, the impact of foreign currency exchange rate movements.
The aggregate notional amounts of our foreign currency forward contracts outstanding in our exchange rate risk management program, including contracts not designated for cash flow hedge accounting, were $3.1 billion and $2.7 billion at September 30, 2017 and 2016, respectively. The aggregate notional amount outstanding at September 30, 2017 is fully consistent with our strategy and treasury policy aimed at reducing foreign exchange risk below a predetermined and approved threshold. However, actual results could materially differ from our forecast. The effect of a hypothetical 10% increase or decrease in the value of the functional currencies is estimated to create an additional fair value gain of approximately $210 million or loss of approximately $250 million, respectively, on our foreign currency forward contracts outstanding at September 30, 2017. See Note 1—Summary of Significant Accounting Policies and Note 11—Derivative and Non-derivative Financial Instruments to our consolidated financial statements included in Item 8—Financial Statements and Supplementary Data of this report.
On June 21, 2016, we acquired 100% of the share capital of Visa Europe. On the third anniversary of the Closing, we will pay additional purchase consideration of €1 billion, plus 4.0% compounded annual interest. See Note 2—Visa Europe to our consolidated financial statements included in Item 8—Financial Statements and Supplementary Data of this report. As such, we are exposed to foreign currency exchange rate risk with respect to fluctuations of the U.S. dollar against the euro. A hypothetical 10% decline in the U.S. dollar against the euro, compared to the exchange rate at September 30, 2017, would increase the deferred purchase consideration liability by $130 million, including interest.
50
We are further exposed to foreign currency exchange rate risk as the functional currency of Visa Europe is the euro. Translation from the euro to the U.S. dollar is performed for balance sheet accounts using exchange rates in effect at the balance sheet date and for revenue and expense accounts using an average exchange rate for the period. Resulting translation adjustments are reported as a component of accumulated other comprehensive income or loss on the consolidated balance sheets. A hypothetical 10% change in the euro against the U.S. dollar compared to the exchange rate at September 30, 2017, would result in a foreign currency translation adjustment of $2 billion. We designate a portion of our euro-denominated deferred consideration liability as a net investment hedge against a portion of the foreign exchange rate exposure of our net investment of $18.8 billion in Visa Europe. Changes in the value of the deferred cash consideration liability, attributable to a change in exchange rates at the end of each reporting period, partially offset the foreign currency translation of the Company's net investment recorded in accumulated other comprehensive income in the Company's consolidated balance sheet. See Note 1—Summary of Significant Accounting Policies and Note 11—Derivative and Non-derivative Financial Instruments to our consolidated financial statements included in Item 8—Financial Statements and Supplementary Data of this report.
We are also subject to foreign currency exchange risk in daily settlement activities. This risk arises from the timing of rate setting for settlement with clients relative to the timing of market trades for balancing currency positions. Risk in settlement activities is limited through daily operating procedures, including the utilization of Visa settlement systems and our interaction with foreign exchange trading counterparties.
Interest Rate Risk
Our investment portfolio assets are held in both fixed-rate and adjustable-rate securities. These assets are included in cash equivalents and short-term or long-term available-for-sale investments. Investments in fixed-rate instruments carry a degree of interest rate risk. The fair value of fixed-rate securities may be adversely impacted due to a rise in interest rates. Additionally, a falling-rate environment creates reinvestment risk because as securities mature, the proceeds are reinvested at a lower rate, generating less interest income. Historically, we have been able to hold investments until maturity. Neither our operating results or cash flows have been, nor are they expected to be, materially impacted by a sudden change in market interest rates.
The fair value balances of our fixed-rate investment securities at September 30, 2017 and 2016 were $6.4 billion and $5.1 billion, respectively. A hypothetical 100 basis point increase or decrease in interest rates would create an estimated change in fair value of approximately $29 million on our fixed-rate investment securities at September 30, 2017. The fair value balances of our adjustable-rate debt securities were $1.8 billion and $2.2 billion at September 30, 2017 and 2016, respectively.
Pension Plan Risk
At September 30, 2017 and 2016, our U.S. defined benefit pension plan assets were $1.1 billion at each year end, and projected benefit obligations were $0.9 billion and $1.1 billion, respectively. A material adverse decline in the value of pension plan assets and/or the discount rate for benefit obligations would result in a decrease in the funded status of the pension plan, an increase in pension cost and an increase in required funding. A hypothetical 10% decrease in the value of pension plan assets and a 1% decrease in the discount rate would result in an aggregate decrease of approximately $241 million in the funded status and an increase of approximately $44 million in pension cost.
At September 30, 2017 and 2016, our non-U.S. defined benefit pension plan assets were $433 million and $415 million, respectively, and projected benefit obligations were $433 million and $474 million, respectively. A material adverse decline in the value of pension plan assets and/or the discount rate for benefit obligations would result in a decrease in the funded status of the pension plan, an increase in pension cost and an increase in required funding. A hypothetical 10% decrease in the value of pension plan assets and a 1% decrease in the discount rate would result in an aggregate decrease of approximately $157 million in the funded status and an increase of approximately $11 million in pension cost.
We will continue to monitor the performance of pension plan assets and market conditions as we evaluate the amount of our contribution to the pension plan for fiscal 2018, if any, which would be made in September 2018.
51
ITEM 8. | Financial Statements and Supplementary Data |
VISA INC.
INDEX TO CONSOLIDATED FINANCIAL STATEMENTS
Page | |
As of September 30, 2017 and 2016 and for the years ended September 30, 2017, 2016 and 2015 | |
52
Report of Independent Registered Public Accounting Firm
The Board of Directors and Stockholders
Visa Inc.:
We have audited the accompanying consolidated balance sheets of Visa Inc. and subsidiaries as of September 30, 2017 and 2016, and the related consolidated statements of operations, comprehensive income, changes in equity, and cash flows for each of the years in the three-year period ended September 30, 2017. We also have audited Visa Inc.’s internal control over financial reporting as of September 30, 2017, based on Internal Control – Integrated Framework (2013) issued by the Committee of Sponsoring Organizations of the Treadway Commission (COSO). Visa Inc.’s management is responsible for these consolidated financial statements, for maintaining effective internal control over financial reporting, and for its assessment of the effectiveness of internal control over financial reporting, included in the accompanying Management’s Report on Internal Control over Financial Reporting. Our responsibility is to express an opinion on these consolidated financial statements and an opinion on the Company’s internal control over financial reporting based on our audits.
We conducted our audits in accordance with the standards of the Public Company Accounting Oversight Board (United States). Those standards require that we plan and perform the audits to obtain reasonable assurance about whether the financial statements are free of material misstatement and whether effective internal control over financial reporting was maintained in all material respects. Our audits of the consolidated financial statements included examining, on a test basis, evidence supporting the amounts and disclosures in the financial statements, assessing the accounting principles used and significant estimates made by management, and evaluating the overall financial statement presentation. Our audit of internal control over financial reporting included obtaining an understanding of internal control over financial reporting, assessing the risk that a material weakness exists, and testing and evaluating the design and operating effectiveness of internal control based on the assessed risk. Our audits also included performing such other procedures as we considered necessary in the circumstances. We believe that our audits provide a reasonable basis for our opinions.
A company’s internal control over financial reporting is a process designed to provide reasonable assurance regarding the reliability of financial reporting and the preparation of financial statements for external purposes in accordance with generally accepted accounting principles. A company’s internal control over financial reporting includes those policies and procedures that (1) pertain to the maintenance of records that, in reasonable detail, accurately and fairly reflect the transactions and dispositions of the assets of the company; (2) provide reasonable assurance that transactions are recorded as necessary to permit preparation of financial statements in accordance with generally accepted accounting principles, and that receipts and expenditures of the company are being made only in accordance with authorizations of management and directors of the company; and (3) provide reasonable assurance regarding prevention or timely detection of unauthorized acquisition, use, or disposition of the company’s assets that could have a material effect on the financial statements.
Because of its inherent limitations, internal control over financial reporting may not prevent or detect misstatements. Also, projections of any evaluation of effectiveness to future periods are subject to the risk that controls may become inadequate because of changes in conditions, or that the degree of compliance with the policies or procedures may deteriorate.
In our opinion, the consolidated financial statements referred to above present fairly, in all material respects, the financial position of Visa Inc. and subsidiaries as of September 30, 2017 and 2016, and the results of their operations and their cash flows for each of the years in the three-year period ended September 30, 2017, in conformity with U.S. generally accepted accounting principles. Also in our opinion, Visa Inc. maintained, in all material respects, effective internal control over financial reporting as of September 30, 2017, based on Internal Control – Integrated Framework (2013) issued by the Committee of Sponsoring Organizations of the Treadway Commission (COSO).
/s/ KPMG LLP
Santa Clara, California
November 16, 2017
53
VISA INC.
CONSOLIDATED BALANCE SHEETS
September 30, 2017 | September 30, 2016 | ||||||
(in millions, except par value data) | |||||||
Assets | |||||||
Cash and cash equivalents | $ | 9,874 | $ | 5,619 | |||
Restricted cash—U.S. litigation escrow (Note 3) | 1,031 | 1,027 | |||||
Investment securities (Note 4): | |||||||
Trading | 82 | 71 | |||||
Available-for-sale | 3,482 | 3,248 | |||||
Settlement receivable | 1,422 | 1,467 | |||||
Accounts receivable | 1,132 | 1,041 | |||||
Customer collateral (Note 10) | 1,106 | 1,001 | |||||
Current portion of client incentives | 344 | 284 | |||||
Prepaid expenses and other current assets | 550 | 555 | |||||
Total current assets | 19,023 | 14,313 | |||||
Investment securities, available-for-sale (Note 4) | 1,926 | 3,931 | |||||
Client incentives | 591 | 448 | |||||
Property, equipment and technology, net (Note 5) | 2,253 | 2,150 | |||||
Other assets | 1,226 | 893 | |||||
Intangible assets, net (Note 2 and Note 6) | 27,848 | 27,234 | |||||
Goodwill (Note 2 and Note 6) | 15,110 | 15,066 | |||||
Total assets | $ | 67,977 | $ | 64,035 | |||
Liabilities | |||||||
Accounts payable | $ | 179 | $ | 203 | |||
Settlement payable | 2,003 | 2,084 | |||||
Customer collateral (Note 10) | 1,106 | 1,001 | |||||
Accrued compensation and benefits | 757 | 673 | |||||
Client incentives | 2,089 | 1,976 | |||||
Accrued liabilities (Note 7) | 1,129 | 1,128 | |||||
Current maturities of long-term debt (Note 8) | 1,749 | — | |||||
Accrued litigation (Note 19) | 982 | 981 | |||||
Total current liabilities | 9,994 | 8,046 | |||||
Long-term debt (Note 8) | 16,618 | 15,882 | |||||
Deferred tax liabilities (Note 18) | 5,980 | 4,808 | |||||
Deferred purchase consideration | 1,304 | 1,225 | |||||
Other liabilities (Note 7) | 1,321 | 1,162 | |||||
Total liabilities | 35,217 | 31,123 | |||||
Commitments and contingencies (Note 16) | |||||||
Equity | |||||||
Preferred stock, $0.0001 par value, 25 shares authorized and 5 shares issued and outstanding as follows: | |||||||
Series A convertible participating preferred stock, none issued (Note 2 and Note 13) | — | — | |||||
Series B convertible participating preferred stock, 2 shares issued and outstanding at September 30, 2017 and 2016 (Note 2 and Note 13) | 2,326 | 2,516 | |||||
Series C convertible participating preferred stock, 3 shares issued and outstanding at September 30, 2017and 2016 (Note 2 and Note 13) | 3,200 | 3,201 | |||||
Class A common stock, $0.0001 par value, 2,001,622 shares authorized, 1,818 and 1,871 shares issued and outstanding at September 30, 2017 and 2016, respectively (Note 13) | — | — | |||||
Class B common stock, $0.0001 par value, 622 shares authorized, 245 shares issued and outstanding at September 30, 2017 and 2016 (Note 13) | — | — | |||||
Class C common stock, $0.0001 par value, 1,097 shares authorized, 13 and 17 shares issued and outstanding at September 30, 2017 and 2016, respectively (Note 13) | — | — | |||||
Treasury stock (Note 13) | — | (170 | ) | ||||
Right to recover for covered losses (Note 3) | (52 | ) | (34 | ) | |||
Additional paid-in capital | 16,900 | 17,395 | |||||
Accumulated income | 9,508 | 10,462 | |||||
Accumulated other comprehensive income (loss), net: | |||||||
Investment securities, available-for-sale | 73 | 36 | |||||
Defined benefit pension and other postretirement plans | (76 | ) | (225 | ) | |||
Derivative instruments classified as cash flow hedges | (36 | ) | (50 | ) | |||
Foreign currency translation adjustments | 917 | (219 | ) | ||||
Total accumulated other comprehensive income (loss), net | 878 | (458 | ) | ||||
Total equity | 32,760 | 32,912 | |||||
Total liabilities and equity | $ | 67,977 | $ | 64,035 | |||
See accompanying notes, which are an integral part of these consolidated financial statements.
54
VISA INC.
CONSOLIDATED STATEMENTS OF OPERATIONS
For the Years Ended September 30, | |||||||||||
2017 | 2016 (1) | 2015 | |||||||||
(in millions, except per share data) | |||||||||||
Operating Revenues | |||||||||||
Service revenues | $ | 7,975 | $ | 6,747 | $ | 6,302 | |||||
Data processing revenues | 7,786 | 6,272 | 5,552 | ||||||||
International transaction revenues | 6,321 | 4,649 | 4,064 | ||||||||
Other revenues | 841 | 823 | 823 | ||||||||
Client incentives | (4,565 | ) | (3,409 | ) | (2,861 | ) | |||||
Net operating revenues | 18,358 | 15,082 | 13,880 | ||||||||
Operating Expenses | |||||||||||
Personnel | 2,628 | 2,226 | 2,079 | ||||||||
Marketing | 922 | 869 | 872 | ||||||||
Network and processing | 620 | 538 | 474 | ||||||||
Professional fees | 409 | 389 | 336 | ||||||||
Depreciation and amortization | 556 | 502 | 494 | ||||||||
General and administrative | 1,060 | 796 | 547 | ||||||||
Litigation provision (Note 19) | 19 | 2 | 14 | ||||||||
Visa Europe Framework Agreement loss | — | 1,877 | — | ||||||||
Total operating expenses | 6,214 | 7,199 | 4,816 | ||||||||
Operating income | 12,144 | 7,883 | 9,064 | ||||||||
Non-operating (Expense) Income | |||||||||||
Interest expense | (563 | ) | (427 | ) | (3 | ) | |||||
Other (Note 4 and Note 11) | 113 | 556 | (66 | ) | |||||||
Total non-operating (expense) income | (450 | ) | 129 | (69 | ) | ||||||
Income before income taxes | 11,694 | 8,012 | 8,995 | ||||||||
Income tax provision (Note 18) | 4,995 | 2,021 | 2,667 | ||||||||
Net income | $ | 6,699 | $ | 5,991 | $ | 6,328 | |||||
Basic earnings per share (Note 14) | |||||||||||
Class A common stock | $ | 2.80 | $ | 2.49 | $ | 2.58 | |||||
Class B common stock | $ | 4.62 | $ | 4.10 | $ | 4.26 | |||||
Class C common stock | $ | 11.21 | $ | 9.94 | $ | 10.33 | |||||
Basic weighted-average shares outstanding (Note 14) | |||||||||||
Class A common stock | 1,845 | 1,906 | 1,954 | ||||||||
Class B common stock | 245 | 245 | 245 | ||||||||
Class C common stock | 14 | 19 | 22 | ||||||||
Diluted earnings per share (Note 14) | |||||||||||
Class A common stock | $ | 2.80 | $ | 2.48 | $ | 2.58 | |||||
Class B common stock | $ | 4.61 | $ | 4.09 | $ | 4.25 | |||||
Class C common stock | $ | 11.19 | $ | 9.93 | $ | 10.30 | |||||
Diluted weighted-average shares outstanding (Note 14) | |||||||||||
Class A common stock | 2,395 | 2,414 | 2,457 | ||||||||
Class B common stock | 245 | 245 | 245 | ||||||||
Class C common stock | 14 | 19 | 22 | ||||||||
(1) | The Company did not include Visa Europe's financial results in the Company's consolidated statements of operations from the acquisition date, June 21, 2016, through June 30, 2016 as the impact was immaterial. The Company's consolidated statement of operations for the year ended September 30, 2016 includes Visa Europe's financial results for the three months ended September 30, 2016. See Note 2—Visa Europe. |
See accompanying notes, which are an integral part of these consolidated financial statements.
55
VISA INC.
CONSOLIDATED STATEMENTS OF COMPREHENSIVE INCOME
For the Years Ended September 30, | |||||||||||
2017 | 2016 | 2015 | |||||||||
(in millions) | |||||||||||
Net income | $ | 6,699 | $ | 5,991 | $ | 6,328 | |||||
Other comprehensive income (loss), net of tax: | |||||||||||
Investment securities, available-for-sale: | |||||||||||
Net unrealized gain (loss) | 60 | 51 | (21 | ) | |||||||
Income tax effect | (24 | ) | (18 | ) | 8 | ||||||
Reclassification adjustment for net loss (gain) realized in net income | 1 | (3 | ) | (21 | ) | ||||||
Income tax effect | — | 1 | 8 | ||||||||
Defined benefit pension and other postretirement plans: | |||||||||||
Net unrealized actuarial gain (loss) and prior service credit | 183 | (106 | ) | (122 | ) | ||||||
Income tax effect | (54 | ) | 36 | 45 | |||||||
Amortization of actuarial loss (gain) and prior service credit realized in net income | 32 | 10 | (1 | ) | |||||||
Income tax effect | (12 | ) | (4 | ) | 1 | ||||||
Derivative instruments classified as cash flow hedges: | |||||||||||
Net unrealized (loss) gain | (22 | ) | (74 | ) | 172 | ||||||
Income tax effect | 15 | 9 | (51 | ) | |||||||
Reclassification adjustment for net loss (gain) realized in net income | 33 | (103 | ) | (102 | ) | ||||||
Income tax effect | (12 | ) | 35 | 26 | |||||||
Foreign currency translation adjustments | 1,136 | (218 | ) | 1 | |||||||
Other comprehensive income (loss), net of tax | 1,336 | (384 | ) | (57 | ) | ||||||
Comprehensive income | $ | 8,035 | $ | 5,607 | $ | 6,271 | |||||
See accompanying notes, which are an integral part of these consolidated financial statements.
56
VISA INC.
CONSOLIDATED STATEMENTS OF CHANGES IN EQUITY
Common Stock | Additional Paid-In Capital | Accumulated Income | Accumulated Other Comprehensive Loss | Total Equity | ||||||||||||||||||||
Class A | Class B | Class C | ||||||||||||||||||||||
(in millions, except per share data) | ||||||||||||||||||||||||
Balance as of September 30, 2014 | 1,978 | 245 | 22 | $ | 18,299 | $ | 9,131 | $ | (17 | ) | $ | 27,413 | ||||||||||||
Net income | 6,328 | 6,328 | ||||||||||||||||||||||
Other comprehensive loss, net of tax | (57 | ) | (57 | ) | ||||||||||||||||||||
Comprehensive income | 6,271 | |||||||||||||||||||||||
Conversion of class C common stock upon sale into public market | 11 | (2 | ) | — | ||||||||||||||||||||
Issuance and vesting of restricted stock and performance-based shares | 4 | — | ||||||||||||||||||||||
Share-based compensation, net of forfeitures (Note 15) | (1 | ) | (1) | 187 | 187 | |||||||||||||||||||
Restricted stock and performance-based shares settled in cash for taxes | (1 | ) | (108 | ) | (108 | ) | ||||||||||||||||||
Excess tax benefit for share-based compensation | 84 | 84 | ||||||||||||||||||||||
Cash proceeds from issuance of common stock under employee equity plans | 3 | 82 | 82 | |||||||||||||||||||||
Cash dividends declared and paid, at a quarterly amount of $0.12 per as-converted share | (1,177 | ) | (1,177 | ) | ||||||||||||||||||||
Repurchase of class A common stock | (44 | ) | (471 | ) | (2,439 | ) | (2,910 | ) | ||||||||||||||||
Balance as of September 30, 2015 | 1,950 | 245 | 20 | $ | 18,073 | $ | 11,843 | $ | (74 | ) | $ | 29,842 | ||||||||||||
(1) | Decrease in Class A common stock related to forfeitures of restricted stock awards. |
See accompanying notes, which are an integral part of these consolidated financial statements.
57
VISA INC.
CONSOLIDATED STATEMENTS OF CHANGES IN EQUITY—(Continued)
Preferred Stock(1) | Common Stock | Preferred Stock | Treasury Stock | Right to Recover for Covered Losses | Additional Paid-In Capital | Accumulated Income | Accumulated Other Comprehensive Loss | Total Equity | ||||||||||||||||||||||||||||||||||
Series B | Series C | Class A | Class B | Class C | ||||||||||||||||||||||||||||||||||||||
(in millions, except per share data) | ||||||||||||||||||||||||||||||||||||||||||
Balance as of September 30, 2015 | — | — | 1,950 | 245 | 20 | $ | — | $ | — | $ | — | $ | 18,073 | $ | 11,843 | $ | (74 | ) | $ | 29,842 | ||||||||||||||||||||||
Net income | 5,991 | 5,991 | ||||||||||||||||||||||||||||||||||||||||
Other comprehensive loss, net of tax | (384 | ) | (384 | ) | ||||||||||||||||||||||||||||||||||||||
Comprehensive income | 5,607 | |||||||||||||||||||||||||||||||||||||||||
Issuance of preferred stock (Note 2 and Note 13) | 2 | 3 | 5,717 | 5,717 | ||||||||||||||||||||||||||||||||||||||
VE territory covered losses incurred (Note 3) | (34 | ) | (34 | ) | ||||||||||||||||||||||||||||||||||||||
Class C common stock held by Visa Europe, a wholly-owned subsidiary of Visa Inc. (Note 13) | (1 | ) | (170 | ) | (170 | ) | ||||||||||||||||||||||||||||||||||||
Conversion of class C common stock upon sale into public market | 8 | (2 | ) | — | ||||||||||||||||||||||||||||||||||||||
Issuance and vesting of restricted stock and performance-based shares | 2 | — | ||||||||||||||||||||||||||||||||||||||||
Share-based compensation, net of forfeitures (Note 15) | — | (2) | 221 | 221 | ||||||||||||||||||||||||||||||||||||||
Restricted stock and performance-based shares settled in cash for taxes | (1 | ) | (92 | ) | (92 | ) | ||||||||||||||||||||||||||||||||||||
Excess tax benefit for share-based compensation | 63 | 63 | ||||||||||||||||||||||||||||||||||||||||
Cash proceeds from issuance of common stock under employee equity plans | 3 | 95 | 95 | |||||||||||||||||||||||||||||||||||||||
Cash dividends declared and paid, at a quarterly amount of $0.14 per as-converted share | (1,350 | ) | (1,350 | ) | ||||||||||||||||||||||||||||||||||||||
Repurchase of class A common stock (Note 13) | (91 | ) | (965 | ) | (6,022 | ) | (6,987 | ) | ||||||||||||||||||||||||||||||||||
Balance as of September 30, 2016 | 2 | 3 | 1,871 | 245 | 17 | $ | 5,717 | $ | (170 | ) | $ | (34 | ) | $ | 17,395 | $ | 10,462 | $ | (458 | ) | $ | 32,912 | ||||||||||||||||||||
(1) | Series B and C preferred stock are alternatively referred to as UK&I and Europe preferred stock, respectively. |
(2) | Decrease in Class A common stock related to forfeitures of restricted stock awards is less than one million shares. |
See accompanying notes, which are an integral part of these consolidated financial statements.
58
VISA INC.
CONSOLIDATED STATEMENTS OF CHANGES IN EQUITY—(Continued)
Preferred Stock(1) | Common Stock | Preferred Stock | Treasury Stock | Right to Recover for Covered Losses | Additional Paid-In Capital | Accumulated Income | Accumulated Other Comprehensive Loss | Total Equity | ||||||||||||||||||||||||||||||||||
Series B | Series C | Class A | Class B | Class C | ||||||||||||||||||||||||||||||||||||||
(in millions, except per share data) | ||||||||||||||||||||||||||||||||||||||||||
Balance as of September 30, 2016 | 2 | 3 | 1,871 | 245 | 17 | $ | 5,717 | $ | (170 | ) | $ | (34 | ) | $ | 17,395 | $ | 10,462 | $ | (458 | ) | $ | 32,912 | ||||||||||||||||||||
Net income | 6,699 | 6,699 | ||||||||||||||||||||||||||||||||||||||||
Other comprehensive income, net of tax | 1,336 | 1,336 | ||||||||||||||||||||||||||||||||||||||||
Comprehensive income | 8,035 | |||||||||||||||||||||||||||||||||||||||||
VE territory covered losses incurred (Note 3) | (209 | ) | (209 | ) | ||||||||||||||||||||||||||||||||||||||
Recovery through conversion rate adjustment (Note 3 and Note 13) | (191 | ) | 191 | — | ||||||||||||||||||||||||||||||||||||||
Charitable contribution of Visa Inc. shares (Note 13 and Note 18) | 2 | 170 | 170 | |||||||||||||||||||||||||||||||||||||||
Treasury stock appreciation, net of tax | 14 | 14 | ||||||||||||||||||||||||||||||||||||||||
Conversion of class C common stock upon sales into public market | 17 | (4 | ) | — | ||||||||||||||||||||||||||||||||||||||
Issuance and vesting of restricted stock and performance-based shares | 2 | — | ||||||||||||||||||||||||||||||||||||||||
Share-based compensation, net of forfeitures (Note 15) | — | (2) | 235 | 235 | ||||||||||||||||||||||||||||||||||||||
Restricted stock and performance-based shares settled in cash for taxes | (1 | ) | (76 | ) | (76 | ) | ||||||||||||||||||||||||||||||||||||
Cash proceeds from issuance of common stock under employee equity plans | 4 | 149 | 149 | |||||||||||||||||||||||||||||||||||||||
Cash dividends declared and paid, at a quarterly amount of $0.165 per as-converted share (Note 13) | (1,579 | ) | (1,579 | ) | ||||||||||||||||||||||||||||||||||||||
Repurchase of class A common stock (Note 13) | (77 | ) | (817 | ) | (6,074 | ) | (6,891 | ) | ||||||||||||||||||||||||||||||||||
Balance as of September 30, 2017 | 2 | 3 | 1,818 | 245 | 13 | $ | 5,526 | $ | — | $ | (52 | ) | $ | 16,900 | $ | 9,508 | $ | 878 | $ | 32,760 | ||||||||||||||||||||||
(1) | Series B and C preferred stock are alternatively referred to as UK&I and Europe preferred stock, respectively. |
(2) | Decrease in Class A common stock related to forfeitures of restricted stock awards is less than one million shares. |
See accompanying notes, which are an integral part of these consolidated financial statements.
59
VISA INC.
CONSOLIDATED STATEMENTS OF CASH FLOWS
For the Years Ended September 30, | |||||||||||
2017 | 2016 | 2015 | |||||||||
(in millions, except noted otherwise) | |||||||||||
Operating Activities | |||||||||||
Net income | $ | 6,699 | $ | 5,991 | $ | 6,328 | |||||
Adjustments to reconcile net income to net cash provided by operating activities: | |||||||||||
Client incentives | 4,565 | 3,409 | 2,861 | ||||||||
Fair value adjustment for the Visa Europe put option | — | (255 | ) | 110 | |||||||
Share-based compensation (Note 15) | 235 | 221 | 187 | ||||||||
Excess tax benefit for share-based compensation | — | (63 | ) | (84 | ) | ||||||
Depreciation and amortization of property, equipment, technology and intangible assets | 556 | 502 | 494 | ||||||||
Deferred income taxes | 1,700 | (764 | ) | 195 | |||||||
Right to recover for covered losses recorded in equity (Note 3) | (209 | ) | (9 | ) | — | ||||||
Charitable contribution of Visa Inc. shares (Note 13 and Note 18) | 192 | — | — | ||||||||
Other | 50 | 64 | 24 | ||||||||
Change in operating assets and liabilities: | |||||||||||
Settlement receivable | 94 | 391 | 378 | ||||||||
Accounts receivable | (54 | ) | (65 | ) | (19 | ) | |||||
Client incentives | (4,628 | ) | (3,508 | ) | (2,970 | ) | |||||
Other assets | (252 | ) | (315 | ) | (41 | ) | |||||
Accounts payable | (30 | ) | 43 | (13 | ) | ||||||
Settlement payable | (176 | ) | (302 | ) | (552 | ) | |||||
Accrued and other liabilities | 465 | 277 | 118 | ||||||||
Accrued litigation (Note 19) | 1 | (43 | ) | (432 | ) | ||||||
Net cash provided by operating activities | 9,208 | 5,574 | 6,584 | ||||||||
Investing Activities | |||||||||||
Purchases of property, equipment, technology and intangible assets | (707 | ) | (523 | ) | (414 | ) | |||||
Proceeds from sales of property, equipment and technology | 12 | — | 10 | ||||||||
Investment securities, available-for-sale: | |||||||||||
Purchases | (3,238 | ) | (10,426 | ) | (2,850 | ) | |||||
Proceeds from maturities and sales | 5,012 | 9,119 | 1,925 | ||||||||
Acquisitions, net of $2.8 billion cash received from Visa Europe (Note 2) | (302 | ) | (9,082 | ) | (93 | ) | |||||
Purchases of / contributions to other investments | (46 | ) | (10 | ) | (25 | ) | |||||
Proceeds / distributions from other investments | 4 | 6 | 12 | ||||||||
Net cash provided by (used in) investing activities | 735 | (10,916 | ) | (1,435 | ) | ||||||
Financing Activities | |||||||||||
Repurchase of class A common stock (Note 13) | (6,891 | ) | (6,987 | ) | (2,910 | ) | |||||
Treasury stock—class C common stock (Note 13) | — | (170 | ) | — | |||||||
Dividends paid (Note 13) | (1,579 | ) | (1,350 | ) | (1,177 | ) | |||||
Proceeds from issuance of senior notes (Note 8) | 2,488 | 15,971 | — | ||||||||
Debt issuance costs (Note 8) | (15 | ) | (98 | ) | — | ||||||
Payments from U.S. litigation escrow account—U.S. retrospective responsibility plan (Note 3 and Note 19) | — | 45 | 426 | ||||||||
Cash proceeds from issuance of common stock under employee equity plans | 149 | 95 | 82 | ||||||||
Restricted stock and performance-based shares settled in cash for taxes | (76 | ) | (92 | ) | (108 | ) | |||||
Excess tax benefit for share-based compensation | — | 63 | 84 | ||||||||
Net cash (used in) provided by financing activities | (5,924 | ) | 7,477 | (3,603 | ) | ||||||
Effect of exchange rate changes on cash and cash equivalents | 236 | (34 | ) | 1 | |||||||
Increase in cash and cash equivalents | 4,255 | 2,101 | 1,547 | ||||||||
Cash and cash equivalents at beginning of year | 5,619 | 3,518 | 1,971 | ||||||||
Cash and cash equivalents at end of year | $ | 9,874 | $ | 5,619 | $ | 3,518 | |||||
Supplemental Disclosure | |||||||||||
Series B and C convertible participating preferred stock issued in Visa Europe acquisition (Note 3) | $ | — | $ | 5,717 | $ | — | |||||
Deferred purchase consideration recorded for Visa Europe acquisition (Note 2) | $ | — | $ | 1,236 | $ | — | |||||
Income taxes paid, net of refunds | $ | 3,038 | $ | 2,842 | $ | 2,486 | |||||
Interest payments on debt | $ | 489 | $ | 244 | $ | — | |||||
Accruals related to purchases of property, equipment, technology and intangible assets | $ | 50 | $ | 42 | $ | 81 | |||||
See accompanying notes, which are an integral part of these consolidated financial statements.
60
VISA INC.
NOTES TO CONSOLIDATED FINANCIAL STATEMENTS
September 30, 2017
Note 1—Summary of Significant Accounting Policies
Organization. Visa Inc. ("Visa" or the "Company") is a global payments technology company that enables fast, secure and reliable electronic payments across more than 200 countries and territories. Visa and its wholly-owned consolidated subsidiaries, including Visa U.S.A. Inc. ("Visa U.S.A."), Visa International Service Association ("Visa International"), Visa Worldwide Pte. Limited, Visa Europe Limited ("Visa Europe"), Visa Canada Corporation ("Visa Canada"), Inovant LLC and CyberSource Corporation, operate one of the world's largest retail electronic payments network — VisaNet — which facilitates authorization, clearing and settlement of payment transactions and enables us to provide its financial institution and merchant clients a wide range of products, platforms and value-added services. VisaNet also offers fraud protection for account holders and assured payment for merchants. Visa is not a bank and does not issue cards, extend credit or set rates and fees for account holders on Visa products. In most cases, account holder and merchant relationships belong to, and are managed by, Visa's financial institution clients.
On June 21, 2016, Visa acquired 100% of the share capital of Visa Europe. See Note 2—Visa Europe. In February 2017, the Company completed a reorganization of Visa Europe and certain other legal entities to align the Company's corporate structure to the geographic jurisdictions in which it conducts business operations. Associated with this reorganization, the newly-formed Visa Foundation received all Visa Inc. shares held by Visa Europe that were previously recorded as treasury stock. See Note 18—Income Taxes.
Consolidation and basis of presentation. The consolidated financial statements include the accounts of Visa and its consolidated entities and are presented in accordance with accounting principles generally accepted in the United States of America (“U.S. GAAP”). The Company consolidates its majority-owned and controlled entities, including variable interest entities (“VIEs”) for which the Company is the primary beneficiary. The Company's investments in VIEs have not been material to its consolidated financial statements as of and for the periods presented. All significant intercompany accounts and transactions are eliminated in consolidation.
On March 18, 2015, the Company completed a four-for-one split of its class A common stock effected in the form of a stock dividend. All per share amounts and number of shares outstanding in the consolidated financial statements and accompanying notes are presented on a post-split basis. See Note 13—Stockholders' Equity.
The Company's activities are interrelated, and each activity is dependent upon and supportive of the other. All significant operating decisions are based on analysis of Visa as a single global business. Accordingly, the Company has one reportable segment, Payment Services.
The Company revised certain fiscal 2016 amounts on the consolidated statements of cash flows to correct a presentation error in gross investing activity. Purchases and proceeds from maturities and sales of investment securities were each reduced by $17.6 billion, from $28.0 billion and $26.7 billion, respectively, to $10.4 billion and $9.1 billion, respectively. The previously reported amounts included purchases and sales of securities, using the proceeds of the Company's December 2015 debt offering, that had a maturity of 90 days or less. These securities are therefore considered cash and cash equivalents for financial reporting purposes and should not have been included in the gross investing activity. The correction did not affect the Company's total cash flows from investing activities, and there was no impact on the Company's financial position, total operating revenues, net income, or comprehensive income as of and for the periods presented.
Use of estimates. The preparation of consolidated financial statements in conformity with U.S. GAAP requires management to make estimates and assumptions about future events. These estimates and assumptions affect the reported amounts of assets and liabilities and disclosure of contingent assets and liabilities at the date of the consolidated financial statements and reported amounts of revenues and expenses during the reporting period. Future actual results could differ materially from these estimates. The use of estimates in specific accounting policies is described further below as appropriate.
Cash and cash equivalents. Cash and cash equivalents include cash and certain highly liquid investments with original maturities of 90 days or less from the date of purchase. Cash equivalents are primarily recorded at cost, which approximates fair value due to their generally short maturities.
61
Restricted cash—U.S. litigation escrow. The Company maintains an escrow account from which monetary liabilities from settlements of, or judgments in, the U.S. covered litigation are paid. See Note 3—U.S. and Europe Retrospective Responsibility Plans and Note 19—Legal Matters for a discussion of the U.S. covered litigation. The escrow funds are held in money market investments, together with the interest earned, less applicable taxes payable, and classified as restricted cash on the consolidated balance sheets. Interest earned on escrow funds is included in non-operating income on the consolidated statements of operations.
Investments and fair value. The Company measures certain assets and liabilities at fair value. Fair value is the price that would be received to sell an asset or paid to transfer a liability in an orderly transaction between market participants at the measurement date. Fair value measurements are reported under a three-level valuation hierarchy. See Note 4—Fair Value Measurements and Investments. The classification of the Company’s financial assets and liabilities within the hierarchy is as follows:
Level 1—Inputs to the valuation methodology are unadjusted quoted prices in active markets for identical assets or liabilities. The Company’s Level 1 assets include money market funds, publicly-traded equity securities and U.S. Treasury securities.
Level 2—Inputs to the valuation methodology can include: (1) quoted prices in active markets for similar (not identical) assets or liabilities; (2) quoted prices for identical or similar assets in non-active markets; (3) inputs other than quoted prices that are observable for the asset or liability; or (4) inputs that are derived principally from or corroborated by observable market data. The Company's Level 2 assets and liabilities include commercial paper, U.S. government-sponsored debt securities, corporate debt securities and foreign exchange derivative instruments.
Level 3—Inputs to the valuation methodology are unobservable and cannot be corroborated by observable market data. The Company did not have any Level 3 assets or liabilities at September 30, 2017 and 2016.
Trading investment securities include mutual fund equity security investments related to various employee compensation and benefit plans. Trading activity in these investments is at the direction of the Company's employees. These investments are held in a trust and are not available for the Company's operational or liquidity needs. Interest and dividend income and changes in fair value are recorded in non-operating income, and offset in personnel expense on the consolidated statements of operations.
Available-for-sale investment securities include investments in debt and equity securities. These securities are recorded at cost at the time of purchase and are carried at fair value. The Company considers these securities to be available-for-sale to meet working capital and liquidity needs. Investments with original maturities of greater than 90 days and stated maturities of less than one year from the balance sheet date, or investments that the Company intends to sell within one year, are classified as current assets, while all other securities are classified as non-current assets. These investments are generally available to meet short-term liquidity needs. Unrealized gains and losses are reported in accumulated other comprehensive income or loss on the consolidated balance sheets until realized. The specific identification method is used to calculate realized gain or loss on the sale of marketable securities, which is recorded in non-operating income on the consolidated statements of operations. Dividend and interest income are recognized when earned and are included in non-operating income on the consolidated statements of operations.
The Company evaluates its debt and equity securities for other-than-temporary impairment, or OTTI, on an ongoing basis. When there has been a decline in fair value of a debt or equity security below the amortized cost basis, the Company recognizes OTTI if: (1) it has the intent to sell the security; (2) it is more likely than not that it will be required to sell the security before recovery of the amortized cost basis; or (3) it does not expect to recover the entire amortized cost basis of the security.
The Company applies the equity method of accounting for investments in other entities when it holds between 20% and 50% ownership in the entity or when it exercises significant influence. Under the equity method, the Company’s share of each entity’s profit or loss is reflected in non-operating income on the consolidated statements of operations. The equity method of accounting is also used for flow-through entities such as limited partnerships and limited liability companies when the investment ownership percentage is equal to or greater than 5% of outstanding ownership interests, regardless of whether the Company has significant influence over the investees.
62
The Company applies the cost method of accounting for investments in other entities when it holds less than 20% ownership in the entity and does not exercise significant influence, or for flow-through entities when the investment ownership is less than 5% and the Company does not exercise significant influence. These investments consist of equity holdings in non-public companies and are recorded in other assets on the consolidated balance sheets.
The Company regularly reviews investments accounted for under the cost and equity methods for possible impairment, which generally involves an analysis of the facts and changes in circumstances influencing the investment, expectations of the entity’s cash flows and capital needs, and the viability of its business model.
Financial instruments. The Company considers the following to be financial instruments: cash and cash equivalents, restricted cash—U.S. litigation escrow, trading and available-for-sale investment securities, settlement receivable and payable, customer collateral, non-marketable equity investments, settlement risk guarantee, and derivative instruments. See Note 4—Fair Value Measurements and Investments.
Settlement receivable and payable. The Company operates systems for authorizing, clearing and settling payment transactions worldwide. Most U.S. dollar settlements with the Company's financial institution clients are settled within the same day and do not result in a receivable or payable balance, while settlements in currencies other than the U.S. dollar generally remain outstanding for one to two business days, resulting in amounts due from and to clients. These amounts are presented as settlement receivable and settlement payable on the consolidated balance sheets.
Customer collateral. The Company holds cash deposits and other non-cash assets from certain clients in order to ensure their performance of settlement obligations arising from Visa payment products are processed in accordance with the Company's rules. The cash collateral assets are restricted and fully offset by corresponding liabilities and both balances are presented on the consolidated balance sheets, excluding cash collateral held by Visa Europe as its clients retain beneficial ownership and the cash is only accessible to the Company in the event of default by the client on its settled obligations. Non-cash collateral assets are held on behalf of the Company by a third party and are not recorded on the consolidated balance sheets. See Note 10—Settlement Guarantee Management.
Property, equipment and technology, net. Property, equipment and technology are recorded at historical cost less accumulated depreciation and amortization, which are computed on a straight-line basis over the asset’s estimated useful life. Depreciation and amortization of technology, furniture, fixtures and equipment are computed over estimated useful lives ranging from 2 to 10 years. Capital leases are amortized over the lease term and leasehold improvements are amortized over the shorter of the useful life of the asset or lease term. Building improvements are depreciated between 3 and 40 years, and buildings are depreciated over 40 years. Improvements that increase functionality of the asset are capitalized and depreciated over the asset’s remaining useful life. Land and construction-in-progress are not depreciated. Fully depreciated assets are retained in property, equipment and technology, net, until removed from service.
Technology includes purchased and internally developed software, including technology assets obtained through acquisitions. Internally developed software represents software primarily used by the VisaNet electronic payments network. Internal and external costs incurred during the preliminary project stage are expensed as incurred. Qualifying costs incurred during the application development stage are capitalized. Once the project is substantially complete and ready for its intended use these costs are amortized on a straight-line basis over the technology's estimated useful life. Acquired technology assets are initially recorded at fair value and amortized on a straight-line basis over the estimated useful life.
The Company evaluates the recoverability of long-lived assets for impairment annually or more frequently if events or changes in circumstances indicate that the carrying amount of an asset or asset group may not be recoverable. If the sum of expected undiscounted net future cash flows is less than the carrying amount of an asset or asset group, an impairment loss is recognized to the extent that the carrying amount of the asset or asset group exceeds its fair value. See Note 5—Property, Equipment and Technology, Net.
Leases. The Company enters into operating and capital leases for the use of premises, software and equipment. Rent expense related to operating lease agreements, which may or may not contain lease incentives, is primarily recorded on a straight-line basis over the lease term.
63
Intangible assets, net. The Company records identifiable intangible assets at fair value on the date of acquisition and evaluates the useful life of each asset.
Finite-lived intangible assets primarily consist of customer relationships, reacquired rights, reseller relationships and trade names obtained through acquisitions. Finite-lived intangible assets are amortized on a straight-line basis and are tested for recoverability if events or changes in circumstances indicate that their carrying amounts may not be recoverable. These intangibles have useful lives ranging from 3 to 15 years. No events or changes in circumstances indicate that impairment existed as of September 30, 2017. See Note 6—Intangible Assets and Goodwill.
Indefinite-lived intangible assets consist of trade name, customer relationships and reacquired rights. Intangible assets with indefinite useful lives are not amortized but are evaluated for impairment annually or more frequently if events or changes in circumstances indicate that impairment may exist. The Company first assesses qualitative factors to determine whether it is necessary to perform a quantitative impairment test for indefinite-lived intangible assets. The Company assesses each category of indefinite-lived intangible assets for impairment on an aggregate basis, which may require the allocation of cash flows and/or an estimate of fair value to the assets or asset group. Impairment exists if the fair value of the indefinite-lived intangible asset is less than the carrying value. The Company relies on a number of factors when completing impairment assessments, including a review of discounted net future cash flows, business plans and the use of present value techniques.
The Company completed its annual impairment review of indefinite-lived intangible assets as of February 1, 2017, and concluded there was no impairment as of that date. No recent events or changes in circumstances indicate that impairment of the Company's indefinite-lived intangible assets existed as of September 30, 2017.
Goodwill. Goodwill represents the excess of the purchase price over the fair value of the net assets acquired in a business combination. Goodwill is not amortized but is evaluated for impairment at the reporting unit level annually as of February 1, or more frequently if events or changes in circumstances indicate that impairment may exist.
The Company evaluated its goodwill for impairment on February 1, 2017, and concluded there was no impairment as of that date. No recent events or changes in circumstances indicate that impairment existed as of September 30, 2017.
Accrued litigation. The Company evaluates the likelihood of an unfavorable outcome in legal or regulatory proceedings to which it is a party and records a loss contingency when it is probable that a liability has been incurred and the amount of the loss can be reasonably estimated. These judgments are subjective, based on the status of such legal or regulatory proceedings, the merits of the Company's defenses and consultation with corporate and external legal counsel. Actual outcomes of these legal and regulatory proceedings may differ materially from the Company's estimates. The Company expenses legal costs as incurred in professional fees in the consolidated statements of operations. See Note 19—Legal Matters.
Revenue recognition. The Company's operating revenues are comprised principally of service revenues, data processing revenues, international transaction revenues and other revenues, reduced by costs incurred under client incentives arrangements. The Company recognizes revenue, net of sales and other similar taxes, when the price is fixed or determinable, persuasive evidence of an arrangement exists, the service is performed and collectability of the resulting receivable is reasonably assured.
Service revenues consist of revenues earned for services provided in support of client usage of Visa products. Current quarter service revenues are primarily assessed using a calculation of current pricing applied to the prior quarter's payments volume. The Company also earns revenues from assessments designed to support ongoing acceptance and volume growth initiatives, which are recognized in the same period the related volume is transacted.
Data processing revenues consist of revenues earned for authorization, clearing, settlement, network access and other maintenance and support services that facilitate transaction and information processing among the Company's clients globally. Data processing revenues are recognized in the same period the related transactions occur or services are rendered.
64
International transaction revenues are earned for cross-border transaction processing and currency conversion activities. Cross-border transactions arise when the country of origin of the issuer is different from that of the merchant. International transaction revenues are primarily generated by cross-border payments and cash volume.
Other revenues consist mainly of license fees for use of the Visa brand, fees for account holder services, licensing and certification and other activities related to the Company's acquired entities. Other revenues also include optional service or product enhancements, such as extended account holder protection and concierge services. Other revenues are recognized in the same period the related transactions occur or services are rendered. Prior to the acquisition of Visa Europe (see Note 2—Visa Europe), other revenues also included revenues earned from Visa Europe in connection with the Visa Europe Framework Agreement.
Client incentives. The Company enters into long-term contracts with financial institution clients, merchants and strategic partners for various programs designed to build payments volume, increase Visa product acceptance, win merchant routing transactions over Visa's network and drive innovation. These incentives are primarily accounted for as reductions to operating revenues or as operating expenses if a separate identifiable benefit at fair value can be established. The Company generally capitalizes advance incentive payments under these agreements if select criteria are met. The capitalization criteria include the existence of future economic benefits to Visa, the existence of legally enforceable recoverability language (e.g., early termination clauses), management's ability and intent to enforce the recoverability language and the ability to generate future earnings from the agreement in excess of amounts deferred. Capitalized amounts are amortized over the shorter of the period of contractual recoverability or the corresponding period of economic benefit. Incentives not yet paid are accrued systematically and rationally based on management's estimate of each client's performance. These accruals are regularly reviewed and estimates of performance are adjusted, as appropriate, based on changes in performance expectations, actual client performance, amendments to existing contracts or the execution of new contracts. See Note 16—Commitments and Contingencies.
Marketing. The Company expenses costs for the production of advertising as incurred. The cost of media advertising is expensed when the advertising takes place. Sponsorship costs are recognized over the period in which the Company benefits from the sponsorship rights. Promotional items are expensed as incurred, when the related services are received, or when the related event occurs.
Income taxes. The Company's income tax expense consists of two components: current and deferred. Current income tax expense represents taxes paid or payable for the current period. Deferred tax assets and liabilities are recognized to reflect the future tax consequences attributable to temporary differences between the financial statement carrying amounts and the respective tax basis of existing assets and liabilities, and operating loss and credit carryforwards. Deferred tax assets and liabilities are measured using enacted tax rates expected to apply to taxable income in the years in which those temporary differences are expected to be recovered or settled. In assessing whether deferred tax assets are realizable, management considers whether it is more likely than not that some portion or all of the deferred tax assets will not be realized. A valuation allowance is recorded for the portions that are not expected to be realized based on the level of historical taxable income, projections of future taxable income over the periods in which the temporary differences are deductible, and qualifying tax planning strategies.
Where interpretation of the tax law may be uncertain, the Company recognizes, measures and discloses income tax uncertainties. The Company accounts for interest expense and penalties related to uncertain tax positions as non-operating expense in the consolidated statements of operations. The Company files a consolidated federal income tax return and, in certain states, combined state tax returns. The Company elects to claim foreign tax credits in any given year if such election is beneficial to the Company. See Note 18—Income Taxes.
Pension and other postretirement benefit plans. The Company’s defined benefit pension and other postretirement benefit plans are actuarially evaluated, incorporating various critical assumptions including the discount rate and the expected rate of return on plan assets (for qualified pension plans). The discount rate is based on a cash flow matching analysis, with the projected benefit payments matching spot rates from a yield curve developed from high-quality corporate bonds. The expected rate of return on pension plan assets considers the current and expected asset allocation, as well as historical and expected returns on each plan asset class. Any difference between actual and expected plan experience, including asset return experience, in excess of a 10% corridor is recognized in net periodic pension cost over the expected average employee future service period, which is approximately 9 years for the U.S. plans and 11 years for the Visa Europe UK pension plan. Other assumptions involve demographic factors such as
65
retirement age, mortality, attrition and the rate of compensation increases. The Company evaluates assumptions annually and modifies them as appropriate.
The Company recognizes the funded status of its benefit plans in its consolidated balance sheets as other assets, accrued liabilities and other liabilities. The Company recognizes settlement losses when it settles pension benefit obligations, including making lump-sum cash payments to plan participants in exchange for their rights to receive specified pension benefits, when certain thresholds are met. See Note 9—Pension, Postretirement and Other Benefits.
Foreign currency remeasurement and translation. The Company's functional currency is the U.S. dollar for the majority of its foreign operations except for Visa Europe whose functional currency is the euro. Transactions denominated in currencies other than the applicable functional currency are converted to the functional currency at the exchange rate on the transaction date. At period end, monetary assets and liabilities are remeasured to the functional currency using exchange rates in effect at the balance sheet date. Non-monetary assets and liabilities are remeasured at historical exchange rates. Resulting foreign currency transaction gains and losses related to conversion and remeasurement are recorded in general and administrative expense in the consolidated statements of operations and were not material for fiscal 2017, 2016 and 2015.
Where a non-U.S. currency is the functional currency, translation from that functional currency to the U.S. dollar is performed for balance sheet accounts using exchange rates in effect at the balance sheet date and for revenue and expense accounts using an average exchange rate for the period. Resulting translation adjustments are reported as a component of accumulated other comprehensive income or loss on the consolidated balance sheets.
Derivative financial instruments. The Company uses foreign exchange forward derivative contracts to reduce its exposure to foreign currency rate changes on forecasted non-functional currency denominated operational cash flows. To qualify for cash flow hedge accounting treatment, the Company formally documents, at inception of the hedge, all relationships between the hedging transactions and the hedged items, as well as the Company's risk management objective and strategy for undertaking various hedge transactions. The Company also formally assesses whether the derivatives that are used in hedging transactions are highly effective in offsetting changes in the cash flows of the hedged items and whether those derivatives may be expected to remain highly effective in future periods.
Derivatives are carried at fair value on a gross basis in either prepaid and other current assets, non-current other assets, accrued liabilities or non-current other liabilities on the consolidated balance sheets. At September 30, 2017, derivatives outstanding mature within 12 months or less. Gains and losses resulting from changes in fair value of designated derivative instruments are accounted for either in accumulated other comprehensive income or loss on the consolidated balance sheets, or in the consolidated statements of operations in the corresponding account where revenue or expense is hedged, or to general and administrative for hedge amounts determined to be ineffective. Gains and losses resulting in changes in fair value of derivative instruments not designated for hedge accounting are recorded in general and administrative for hedges of operating activity, or non-operating income (expense) for hedges of non-operating activity. See Note 11—Derivative and Non-derivative Financial Instruments.
Non-derivative financial instrument designated as a net investment hedge. The Company designated the euro-denominated deferred cash consideration liability, a non-derivative financial instrument, as a hedge against a portion of the Company's euro-denominated net investment in Visa Europe. Changes in the value of the deferred cash consideration liability, attributable to the change in exchange rates at the end of each reporting period, partially offset the foreign currency translation adjustments resulting from the euro-denominated net investment, are reported as a component of accumulated other comprehensive income or loss on the Company's consolidated balance sheet. See Note 11—Derivative and Non-derivative Financial Instruments.
Guarantees and indemnifications. The Company recognizes an obligation at inception for guarantees and indemnifications that qualify for recognition, regardless of the probability of occurrence. The Company indemnifies its financial institution clients for settlement losses suffered due to the failure of any other client to fund its settlement obligations in accordance with the Visa rules. The estimated fair value of the liability for settlement indemnification is included in accrued liabilities on the consolidated balance sheets and is described in Note 10—Settlement Guarantee Management.
66
Share-based compensation. The Company recognizes share-based compensation cost using the fair value method of accounting. The Company recognizes compensation cost for awards with only service conditions on a straight-line basis over the requisite service period, which is generally the vesting period. Compensation cost for performance and market-condition-based awards is recognized on a graded-vesting basis. The amount is initially estimated based on target performance and is adjusted as appropriate based on management's best estimate throughout the performance period. See Note 15—Share-based Compensation.
Earnings per share. The Company calculates earnings per share using the two-class method to reflect the different rights of each class and series of outstanding common stock. The dilutive effect of incremental common stock equivalents is reflected in diluted earnings per share by application of the treasury stock method. See Note 14—Earnings Per Share.
Recently Issued Accounting Pronouncements
In May 2014, the Financial Accounting Standards Board (FASB) issued Accounting Standards Update (ASU) No. 2014-09, which requires an entity to recognize the amount of revenue to which it expects to be entitled for the transfer of goods or services to customers. The ASU will replace existing revenue recognition guidance in U.S. GAAP when it becomes effective. Subsequently, the FASB also issued a series of amendments to the new revenue standard. The Company will adopt the standard effective October 1, 2018, and expects to adopt the standard using the modified retrospective transition method. The Company expects that the new standard will primarily impact recognition timing for certain fixed incentives and price discounts provided to clients, and the classification of certain client incentives between contra revenues and operating expenses. The Company is still in the process of quantifying the full effect that ASU 2014-09 and all of its related subsequent updates will have on its consolidated financial statements and related disclosures.
In June 2014, the FASB issued ASU No. 2014-12, which requires a performance target in stock compensation awards that affects vesting, and is achievable after the requisite service period, be treated as a performance condition. The Company adopted the standard effective October 1, 2016. The adoption did not have a material impact on the consolidated financial statements.
In April 2015, the FASB issued ASU No. 2015-05, which provides guidance about a customer's accounting for fees paid in a cloud computing arrangement. The amendment will help entities evaluate whether such an arrangement includes a software license, which should be accounted for consistent with the acquisition of other software licenses; otherwise, it should be accounted for as a service contract. The Company adopted the standard effective October 1, 2016. The adoption did not have a material impact on the consolidated financial statements.
In January 2016, the FASB issued ASU 2016-01, which amends certain aspects of recognition, measurement, presentation and disclosure of financial instruments, including the requirement to measure certain equity investments at fair value with changes in fair value recognized in net income. The Company will adopt the standard effective October 1, 2018. The adoption is not expected to have a material impact on the consolidated financial statements.
In February 2016, the FASB issued ASU 2016-02, which requires the recognition of lease assets and lease liabilities arising from operating leases in the statement of financial position. The Company will adopt the standard effective October 1, 2019 and does not anticipate that this new accounting guidance will have a material impact on its consolidated statement of operations. The Company estimates the value of leased assets and liabilities that may be recognized could be in the hundreds of millions of dollars. The actual impact will depend on the Company's lease portfolio at the time of adoption.
67
In March 2016, the FASB issued ASU 2016-09, which simplifies several aspects of the accounting for share-based payments, including the accounting for excess tax benefits and deficiencies, forfeitures, and statutory tax withholding requirements, as well as classification on the statement of cash flows related to excess tax benefits and employee taxes paid when an employer withholds shares for tax-withholding purposes. The Company elected to early adopt the standard effective October 1, 2016. The adoption had the following impact on the consolidated financial statements:
• | The Company recorded excess tax benefits of $70 million in its provision for income taxes rather than as an increase to additional paid-in capital for the year ended September 30, 2017 on a prospective basis. Therefore, the prior period presented has not been adjusted. |
• | The Company excluded the excess tax benefits from the assumed proceeds available to repurchase shares in the computation of diluted earnings per share, which did not have a material impact on the Company's diluted earnings per share for the year ended September 30, 2017. |
• | The Company elected to apply the presentation requirement for cash flows related to excess tax benefits prospectively, and thus, the prior period presented has not been adjusted. This adoption resulted in an increase to both net cash provided by operating activities and net cash used in financing of $70 million for the year ended September 30, 2017. |
In October 2016, the FASB issued ASU 2016-16, which requires that entities recognize the income tax consequences of an intra-entity transfer of an asset, other than inventory, when the transfer occurs. The Company will adopt the standard effective October 1, 2018. The Adoption is not expected to have a material impact on the consolidated financial statements.
In November 2016, the FASB issued ASU 2016-18, which requires that a statement of cash flows includes the total of cash, cash equivalents, and amounts generally described as restricted cash or restricted cash equivalents when reconciling the beginning-of-period and end-of-period total amounts. The Company will adopt the standard effective October 1, 2018. The adoption will impact the presentation of transactions related to the U.S. litigation escrow account on the consolidated statements of cash flows.
In January 2017, the FASB issued ASU 2017-04, which simplifies the test for goodwill impairment by eliminating a previously required step. The Company will adopt the standard effective October 1, 2020. The adoption is not expected to have a material impact on the consolidated financial statements.
In March 2017, the FASB issued ASU 2017-07, which requires that the service cost component of net periodic pension and postretirement benefit cost be presented in the same line item as other employee compensation costs, while the other components be presented separately as non-operating income (expense). Currently, all net periodic pension and postretirement benefit costs are presented in personnel expense on the Company's consolidated statement of operations. The Company will adopt the standard effective October 1, 2018. The adoption is not expected to have a material impact on the consolidated financial statements.
In May 2017, the FASB issued ASU 2017-09, which amends the scope of modification accounting for share-based payment arrangements. Specifically, an entity would not apply modification accounting if the fair value, vesting conditions, and classification of the awards are the same immediately before and after the modification. The Company will adopt the standard effective October 1, 2018. The adoption is not expected to have a material impact on the consolidated financial statements.
In August 2017, the FASB issued ASU 2017-12, which improves the financial reporting of hedging relationships to better portray the economic results of an entity's risk management activities in its financial statements. The amendments in this update also make certain targeted improvements to simplify the application of the hedge accounting guidance. The standard will be effective for the Company on October 1, 2019. However, the Company is evaluating the effect that ASU 2017-12 will have on its consolidated financial statements and is considering early adoption of the standard.
68
Note 2—Visa Europe
On June 21, 2016, the Company acquired 100% of the share capital of Visa Europe, a payments technology business. The acquisition positions Visa to create additional value through increased scale, efficiencies realized by the integration of both businesses, and benefits related to Visa Europe's transition from an association to a for-profit enterprise. At the closing of the transaction (the "Closing"), the Company:
•paid up-front cash consideration of €12.2 billion ($13.9 billion);
• | issued preferred stock of the Company convertible upon certain conditions into approximately 79 million shares of class A common stock of the Company, as described below, equivalent to a value of €5.3 billion ($6.1 billion) at the closing stock price of $77.33 on June 21, 2016; and |
• | agreed to pay an additional €1.0 billion, plus 4% compound annual interest, on the third anniversary of the Closing. |
Preferred stock. In connection with the transaction, three new series of preferred stock of the Company were created:
• | series A convertible participating preferred stock, par value $0.0001 per share, which is generally designed to be economically equivalent to the Company’s class A common stock (the “class A equivalent preferred stock”); |
• | series B convertible participating preferred stock, par value $0.0001 per share (the “UK&I preferred stock”); and |
• | series C convertible participating preferred stock, par value $0.0001 per share (the “Europe preferred stock”). |
The Company issued 2,480,466 shares of UK&I preferred stock to Visa Europe’s member financial institutions in the United Kingdom and Ireland entitled to receive preferred stock at the Closing, and 3,156,823 shares of Europe preferred stock to Visa Europe’s other member financial institutions entitled to receive preferred stock at the Closing. Under certain conditions described below, the UK&I and Europe preferred stock is convertible into shares of class A common stock or class A equivalent preferred stock, at an initial conversion rate of 13.952 shares of class A common stock for each share of UK&I preferred stock and Europe preferred stock. The conversion rates may be reduced from time to time to offset certain liabilities, which may be incurred by the Company, Visa Europe or their affiliates as a result of certain existing and potential litigation relating to the setting of multilateral interchange fee rates in the Visa Europe territory (the "VE territory covered litigation"), where, generally, the relevant claims (and resultant liabilities and losses) relate to the period before the Closing. See Note 3—U.S. and Europe Retrospective Responsibility Plans.
Final purchase price allocation
Upon the Closing, total purchase consideration of $18.8 billion was allocated to the tangible and identifiable intangible assets acquired and liabilities assumed based on a preliminary valuation. Based on additional information that became available, which impacted certain of the assumptions used, the Company finalized the purchase price allocation in the third quarter of fiscal 2017.
69
The following table summarizes the final purchase price allocation.
Preliminary Purchase Price Allocation | Measurement Period Adjustments | Final Purchase Price Allocation | |||||||||
(in millions) | |||||||||||
Current assets(1) | $ | 4,457 | $ | — | $ | 4,457 | |||||
Non-current assets(2) | 258 | (46 | ) | 212 | |||||||
Current liabilities(3) | (2,731 | ) | (36 | ) | (2,767 | ) | |||||
Non-current liabilities(2) | (2,605 | ) | 607 | (1,998 | ) | ||||||
Tangible assets and liabilities | (621 | ) | 525 | (96 | ) | ||||||
Intangible assets — customer relationships and reacquired rights(2) | 16,137 | (232 | ) | 15,905 | |||||||
Goodwill(4) | 3,268 | (293 | ) | 2,975 | |||||||
Fair value of net assets acquired | $ | 18,784 | $ | — | $ | 18,784 | |||||
(1) | Current assets are largely comprised of cash and cash equivalents and settlement receivable. |
(2) | Intangible assets consist of customer relationships and reacquired rights, which have been valued as a single composite intangible asset as they are inextricably linked. These intangibles are considered indefinite-lived assets as the associated customer relationships have historically not experienced significant attrition, and the reacquired rights are based on the Framework Agreement, which has a perpetual term. Non-current assets and liabilities include deferred tax assets and liabilities that result in net deferred tax liabilities of $1.7 billion, which are primarily related to these indefinite-lived intangible assets, based on the final valuation. In February 2017, the Company completed a legal entity reorganization, resulting in the elimination of most of these deferred tax assets and liabilities. See Note 18—Income Taxes. |
(3) | Current liabilities assumed mainly include settlement payable, client incentives liabilities and accrued liabilities. |
(4) | The excess of purchase consideration over net assets acquired was recorded as goodwill, which represents the value that is expected from increased scale and synergies as a result of the integration of both businesses. |
Note 3—U.S. and Europe Retrospective Responsibility Plans
U.S. Retrospective Responsibility Plan
The Company has established several related mechanisms designed to address potential liability under certain litigation referred to as the “U.S. covered litigation." These mechanisms are included in and referred to as the U.S. retrospective responsibility plan and consist of a U.S. litigation escrow agreement, the conversion feature of the Company's shares of class B common stock, the indemnification obligations of the Visa U.S.A. members, an interchange judgment sharing agreement, a loss sharing agreement and an omnibus agreement, as amended.
U.S. covered litigation consists of a number of matters that have been settled or otherwise fully or substantially resolved, as well as the following:
• | the Interchange Multidistrict Litigation. In re Payment Card Interchange Fee and Merchant Discount Antitrust Litigation, 1:05-md-01720-JG-JO (E.D.N.Y.) or MDL 1720, including all cases currently included in MDL 1720, any other case that includes claims for damages relating to the period prior to the Company's IPO that has been or is transferred for coordinated or consolidated pre-trial proceedings at any time to MDL 1720 by the Judicial Panel on Multidistrict Litigation or otherwise included at any time in MDL 1720 by order of any court of competent jurisdiction; |
• | any claim that challenges the reorganization or the consummation thereof; provided that such claim is transferred for coordinated or consolidated pre-trial proceedings at any time to MDL 1720 by the Judicial Panel on Multidistrict Litigation or otherwise included at any time in MDL 1720 by order of any court of competent jurisdiction; and |
• | any case brought after October 22, 2015, by a merchant that opted out of the Rule 23(b)(3) settlement class pursuant to the 2012 Settlement Agreement in MDL 1720 that arises out of facts or circumstances substantially similar to those alleged in MDL 1720 and that is not transferred to or otherwise included in MDL 1720. See Note 19—Legal Matters. |
70
U.S. litigation escrow agreement. In accordance with the U.S. litigation escrow agreement, the Company maintains an escrow account, from which settlements of, or judgments in, the U.S. covered litigation are paid. The amount of the escrow is determined by the board of directors and the Company's litigation committee, all members of which are affiliated with, or act for, certain Visa U.S.A. members. The escrow funds are held in money market investments along with the interest earned, less applicable taxes, and are classified as restricted cash on the consolidated balance sheets.
The following table sets forth the changes in the restricted cash—U.S. litigation escrow account:
Fiscal 2017 | Fiscal 2016 | ||||||
(in millions) | |||||||
Balance at October 1 | $ | 1,027 | $ | 1,072 | |||
Payments to opt-out merchants and interest earned on escrow funds(1) | 4 | (45 | ) | ||||
Balance at September 30 | $ | 1,031 | $ | 1,027 | |||
(1) | These payments are associated with the interchange multidistrict litigation. See Note 19—Legal Matters. |
An accrual for the U.S. covered litigation and a change to the litigation provision are recorded when loss is deemed to be probable and reasonably estimable. In making this determination, the Company evaluates available information, including but not limited to recommendations made by the litigation committee. The accrual related to the U.S. covered litigation could be either higher or lower than the U.S. litigation escrow account balance. The Company did not record an additional accrual for the U.S. covered litigation during fiscal 2017 and fiscal 2016. See Note 19—Legal Matters.
Conversion feature. Under the terms of the plan, when the Company funds the U.S. litigation escrow account, the shares of class B common stock are subject to dilution through an adjustment to the conversion rate of the shares of class B common stock to shares of class A common stock. This has the same economic effect on diluted class A common stock earnings per share as repurchasing the Company's class A common stock, because it reduces the class B conversion rate and consequently the as-converted class A common stock share count. See Note 13—Stockholders' Equity.
Indemnification obligations. To the extent that amounts available under the U.S. litigation escrow arrangement and other agreements in the plan are insufficient to fully resolve the U.S. covered litigation, the Company will use commercially reasonable efforts to enforce the indemnification obligations of Visa U.S.A.'s members for such excess amount, including but not limited to enforcing indemnification obligations pursuant to Visa U.S.A.'s certificate of incorporation and bylaws and in accordance with their membership agreements.
Interchange judgment sharing agreement. Visa U.S.A. and Visa International have entered into an interchange judgment sharing agreement with certain Visa U.S.A. members that have been named as defendants in the interchange multidistrict litigation, which is described in Note 19—Legal Matters. Under this judgment sharing agreement, Visa U.S.A. members that are signatories will pay their membership proportion of the amount of a final judgment not allocated to the conduct of MasterCard.
Loss sharing agreement. Visa has entered into a loss sharing agreement with Visa U.S.A., Visa International and certain Visa U.S.A. members. The loss sharing agreement provides for the indemnification of Visa U.S.A., Visa International and, in certain circumstances, Visa with respect to: (i) the amount of a final judgment paid by Visa U.S.A. or Visa International in the U.S. covered litigation after the operation of the interchange judgment sharing agreement, plus any amounts reimbursable to the interchange judgment sharing agreement signatories; or (ii) the damages portion of a settlement of a U.S. covered litigation that is approved as required under Visa U.S.A.'s certificate of incorporation by the vote of Visa U.S.A.'s specified voting members. The several obligation of each bank that is a party to the loss sharing agreement will equal the amount of any final judgment enforceable against Visa U.S.A., Visa International or any other signatory to the interchange judgment sharing agreement, or the amount of any approved settlement of a U.S. covered litigation, multiplied by such bank's then-current membership proportion as calculated in accordance with Visa U.S.A.'s certificate of incorporation.
On October 22, 2015, Visa entered into an amendment to the loss sharing agreement. The amendment includes within the scope of U.S. covered litigation any action brought after the amendment by an opt out from the Rule 23(b)(3) Settlement Class in MDL 1720 that arises out of facts or circumstances substantially similar to those alleged in
71
MDL 1720 and that is not transferred to or otherwise included in MDL 1720. On the same date, Visa entered into amendments to the interchange judgment sharing agreement and omnibus agreement that include any such action within the scope of those agreements as well.
Omnibus agreement. Visa entered into an omnibus agreement with MasterCard and certain Visa U.S.A. members that confirmed and memorialized the signatories’ intentions with respect to the loss sharing agreement, the interchange judgment sharing agreement and other agreements relating to the interchange multidistrict litigation, see Note 19—Legal Matters. Under the omnibus agreement, the monetary portion of any settlement of the interchange multidistrict litigation covered by the omnibus agreement would be divided into a MasterCard portion at 33.3333% and a Visa portion at 66.6667%. In addition, the monetary portion of any judgment assigned to Visa-related claims in accordance with the omnibus agreement would be treated as a Visa portion. Visa would have no liability for the monetary portion of any judgment assigned to MasterCard-related claims in accordance with the omnibus agreement, and if a judgment is not assigned to Visa-related claims or MasterCard-related claims in accordance with the omnibus agreement, then any monetary liability would be divided into a MasterCard portion at 33.3333% and a Visa portion at 66.6667%. The Visa portion of a settlement or judgment covered by the omnibus agreement would be allocated in accordance with specified provisions of the Company's U.S. retrospective responsibility plan. The litigation provision on the consolidated statements of operations was not impacted by the execution of the omnibus agreement.
On August 26, 2014, Visa entered into an amendment to the omnibus agreement. The omnibus amendment makes applicable to certain settlements in opt-out cases in the interchange multidistrict litigation the settlement-sharing provisions of the omnibus agreement, pursuant to which the monetary portion of any settlement of the interchange multidistrict litigation covered by the omnibus agreement would be divided into a MasterCard portion at 33.3333% and a Visa portion at 66.6667%. The omnibus amendment also provides that in the event of termination of the class settlement agreement, Visa and MasterCard would make mutually acceptable arrangements so that Visa shall have received two-thirds and MasterCard shall have received one-third of the total of (i) the sums paid to defendants as a result of the termination of the settlement agreement and (ii) the takedown payments previously made to defendants.
Europe Retrospective Responsibility Plan
UK loss sharing agreement. The Company has entered into a loss sharing agreement with Visa Europe and certain of Visa Europe’s member financial institutions located in the United Kingdom (the "UK LSA members"). Each of the UK LSA members has agreed, on a several and not joint basis, to compensate the Company for certain losses which may be incurred by the Company, Visa Europe or their affiliates as a result of certain existing and potential litigation relating to the setting and implementation of domestic multilateral interchange fee rates in the United Kingdom prior to the Closing, subject to the terms and conditions set forth therein and, with respect to each UK LSA member, up to a maximum amount of the up-front cash consideration received by such UK LSA member. The UK LSA members’ obligations under the UK loss sharing agreement are conditional upon, among other things, either (a) losses valued in excess of the sterling equivalent on June 21, 2016 of €1.0 billion having arisen in UK covered claims (and such losses having reduced the conversion rate of the UK&I preferred stock accordingly), or (b) the conversion rate of the UK&I preferred stock having been reduced to zero pursuant to losses arising in claims relating to multilateral interchange fee rate setting in the Visa Europe territory.
Litigation management deed. The Company has entered into a litigation management deed with Visa Europe which sets forth the agreed upon procedures for the management of the VE territory covered litigation, the allocation of losses resulting from this litigation (the "VE territory covered losses") between the UK&I and Europe preferred stock, and any accelerated conversion or reduction in the conversion rate of the shares of UK&I and Europe preferred stock. The litigation management deed applies only to VE territory covered litigation (and resultant losses and liabilities). The litigation management deed provides that the Company will generally control the conduct of the VE territory covered litigation, subject to certain obligations to report and consult with the litigation management committees for VE territory covered litigation (the "VE territory litigation management committees"). The VE territory litigation management committees, which are composed of representatives of certain Visa Europe members, have also been granted consent rights to approve certain material decisions in relation to the VE territory covered litigation.
72
The Company obtained certain protections for VE territory covered losses through the UK&I and Europe preferred stock, the UK loss sharing agreement, and the litigation management deed, referred to as the "Europe retrospective responsibility plan." The plan covers VE territory covered litigation (and resultant liabilities and losses) relating to the covered period, which generally refers to the period before the Closing. Visa's protection from the plan is further limited to 70% of any liabilities where the claim relates to inter-regional multilateral interchange fee rates where the issuer is located outside the Visa Europe territory, and the merchant is located within the Visa Europe territory. The plan does not protect the Company in Europe against all types of litigation or remedies or fines imposed in competition law enforcement proceedings, only the interchange litigation specifically covered by the plan's terms.
Unlike the U.S. retrospective responsibility plan, the Europe retrospective responsibility plan does not have an escrow account that is used to fund settlements or judgments. The Company is entitled to recover VE territory covered losses through a periodic adjustment to the class A common stock conversion rates applicable to the UK&I and Europe preferred stock. The total amount of protection available through the preferred stock component of the Europe retrospective responsibility plan is equivalent to the as-converted value of the preferred stock, which can be calculated at any point in time as the product of: (a) the outstanding number of shares of preferred stock; (b) the current conversion rate applicable to each class of preferred stock; and (c) Visa's class A common stock price. This amount differs from the value of the preferred stock recorded within stockholders' equity on the Company's consolidated balance sheet. The book value of the preferred stock reflects its historical value recorded at the Closing less VE territory covered losses recovered through a reduction of the applicable conversion rate. The book value does not reflect changes in the underlying class A common stock price subsequent to the Closing.
Visa Inc. net income will not be impacted by VE territory covered losses as long as the as-converted value of the preferred stock is greater than the covered loss. VE territory covered losses will be recorded when the loss is deemed to be probable and reasonably estimable, or in the case of attorney's fees, when incurred. Concurrently, the Company will record a reduction to stockholders' equity and operating expenses, which represents the Company's right to recover such losses through adjustments to the conversion rate applicable to the preferred stock. The reduction to stockholders' equity is recorded in a contra-equity account referred to as "right to recover for covered losses."
VE territory covered losses may be recorded before the corresponding adjustment to the applicable conversion rate is effected. Adjustments to the conversion rate may be executed once in any six-month period unless a single, individual loss greater than €20 million is incurred, in which case, the six-month limitation does not apply. When the adjustment to the conversion rate is made, the amount previously recorded in "right to recover for covered losses" as contra-equity will then be recorded against the book value of the preferred stock within stockholders' equity.
During the year ended September 30, 2017, the Company recovered $191 million of VE territory covered losses through adjustments to the class A common stock conversion rates applicable to the UK&I and Europe preferred stock. The conversion rate applicable to both the UK&I and Europe preferred stock of 13.952 at September 30, 2016 was adjusted to 13.077 and 13.948, respectively, as of September 30, 2017. As of September 30, 2017, the Company had recorded $52 million in the "right to recover for covered losses" related to VE territory covered losses, of which $25 million was incurred prior to the Closing.
The following table sets forth the activities related to VE territory covered losses in preferred stock and "right to recover for covered losses" within equity during the year ended September 30, 2017. VE territory covered losses incurred reflect settlements with merchants and additional legal costs. See Note 19—Legal Matters.
Preferred Stock | Right to Recover for Covered Losses | ||||||||||
UK&I | Europe | ||||||||||
(in millions) | |||||||||||
Balance as of September 30, 2016 | $ | 2,516 | $ | 3,201 | $ | (34 | ) | ||||
VE territory covered losses incurred | — | — | (209 | ) | |||||||
Recovery through conversion rate adjustment | (190 | ) | (1 | ) | 191 | ||||||
Balance as of September 30, 2017 | $ | 2,326 | $ | 3,200 | $ | (52 | ) | ||||
73
The following table sets forth the as-converted value of the preferred stock available to recover VE territory covered losses compared to the book value of preferred shares recorded in stockholders' equity within the Company's consolidated balance sheets as of September 30, 2017 and 2016.(1)
September 30, 2017 | September 30, 2016 | ||||||||||||||
As-Converted Value of Preferred Stock(2) | Book Value of Preferred Stock | As-Converted Value of Preferred Stock(3) | Book Value of Preferred Stock | ||||||||||||
(in millions) | |||||||||||||||
UK&I preferred stock | $ | 3,414 | $ | 2,326 | $ | 2,862 | $ | 2,516 | |||||||
Europe preferred stock | 4,634 | 3,200 | 3,642 | 3,201 | |||||||||||
Total | 8,048 | 5,526 | 6,504 | 5,717 | |||||||||||
Less: right to recover for covered losses | (52 | ) | (52 | ) | (34 | ) | (34 | ) | |||||||
Total recovery for covered losses available | $ | 7,996 | $ | 5,474 | $ | 6,470 | $ | 5,683 | |||||||
(1) | Figures in the table may not recalculate exactly due to rounding. As-converted and book values of preferred stock are based on unrounded numbers. |
(2) | The as-converted value of preferred stock is calculated as the product of: (a) 2 million and 3 million shares of the UK&I and Europe preferred stock outstanding, respectively, as of September 30, 2017; (b) 13.077 and 13.948, the class A common stock conversion rate applicable to the UK&I and Europe preferred stock outstanding, respectively, as of September 30, 2017; and (c) $105.24, Visa's class A common stock closing stock price as of September 30, 2017. Earnings per share is calculated based on unrounded numbers. |
(3) | The as-converted value of preferred stock is calculated as the product of: (a) 2 million and 3 million shares of the UK&I and Europe preferred stock outstanding, respectively, as of September 30, 2016; (b) the 13.952 class A common stock conversion rate applicable to both the UK&I and Europe preferred stock as of September 30, 2016; and (c) $82.70, Visa's class A common stock closing stock price as of September 30, 2016. Earnings per share is calculated based on unrounded numbers. |
74
Note 4—Fair Value Measurements and Investments
Fair Value Measurements
The Company measures certain assets and liabilities at fair value. See Note 1—Summary of Significant Accounting Policies.
Assets and Liabilities Measured at Fair Value on a Recurring Basis
Fair Value Measurements at September 30 Using Inputs Considered as | |||||||||||||||
Level 1 | Level 2 | ||||||||||||||
September 30, 2017 | September 30, 2016 | September 30, 2017 | September 30, 2016 | ||||||||||||
(in millions) | |||||||||||||||
Assets | |||||||||||||||
Cash equivalents and restricted cash: | |||||||||||||||
Money market funds | $ | 5,935 | $ | 4,537 | |||||||||||
U.S. government-sponsored debt securities | $ | 2,870 | $ | 196 | |||||||||||
Investment securities, trading: | |||||||||||||||
Equity securities | $ | 82 | $ | 71 | |||||||||||
Investment securities, available-for-sale: | |||||||||||||||
U.S. government-sponsored debt securities | 3,663 | 4,699 | |||||||||||||
U.S. Treasury securities | 1,621 | 2,178 | |||||||||||||
Equity securities | 124 | 53 | |||||||||||||
Corporate debt securities | — | 249 | |||||||||||||
Prepaid and other current assets: | |||||||||||||||
Foreign exchange derivative instruments | 18 | 50 | |||||||||||||
Other Assets: | |||||||||||||||
Foreign exchange derivative instruments | 6 | ||||||||||||||
Total | $ | 7,762 | $ | 6,839 | $ | 6,551 | $ | 5,200 | |||||||
Liabilities | |||||||||||||||
Accrued liabilities: | |||||||||||||||
Foreign exchange derivative instruments | $ | 98 | $ | 116 | |||||||||||
Other liabilities: | |||||||||||||||
Foreign exchange derivative instruments | — | 20 | |||||||||||||
Total | $ | — | $ | — | $ | 98 | $ | 136 | |||||||
There were no transfers between Level 1 and Level 2 assets during fiscal 2017.
Level 1 assets measured at fair value on a recurring basis. Money market funds, publicly-traded equity securities and U.S. Treasury securities are classified as Level 1 within the fair value hierarchy, as fair value is based on quoted prices in active markets.
Level 2 assets and liabilities measured at fair value on a recurring basis. The fair value of U.S. government-sponsored debt securities and corporate debt securities, as provided by third-party pricing vendors, is based on quoted prices in active markets for similar, not identical, assets. The pricing data obtained from outside sources is reviewed internally for reasonableness, compared against benchmark quotes from independent pricing sources, then confirmed or revised accordingly. Foreign exchange derivative instruments are valued using inputs that are observable in the market or can be derived principally from or corroborated by observable market data. There were no substantive changes to the valuation techniques and related inputs used to measure fair value during fiscal 2017.
75
Assets Measured at Fair Value on a Non-recurring Basis
Non-marketable equity investments and investments accounted for under the equity method. These investments are classified as Level 3 due to the absence of quoted market prices, the inherent lack of liquidity, and the fact that inputs used to measure fair value are unobservable and require management's judgment. When certain events or circumstances indicate that impairment may exist, the Company revalues the investments using various assumptions, including the financial metrics and ratios of comparable public companies. There were no significant impairment charges incurred during fiscal 2017, 2016 and 2015. At September 30, 2017 and 2016, these investments totaled $94 million and $46 million, respectively. These assets are classified in other assets on the consolidated balance sheets.
Non-financial assets and liabilities. Long-lived assets such as goodwill, indefinite-lived intangible assets, finite-lived intangible assets, and property, equipment and technology are considered non-financial assets. The Company does not have any non-financial liabilities measured at fair value on a non-recurring basis. Finite-lived intangible assets primarily consist of customer relationships, trade names, and reseller relationships, all of which were obtained through acquisitions. See Note 6—Intangible Assets and Goodwill.
If the Company were required to perform a quantitative assessment for impairment testing of goodwill and indefinite-lived intangible assets, the fair values would generally be estimated using an income approach. As the assumptions employed to measure these assets on a non-recurring basis are based on management's judgment using internal and external data, these fair value determinations are classified as Level 3 in the fair value hierarchy. The Company completed its annual impairment review of its indefinite-lived intangible assets and goodwill as of February 1, 2017, and concluded that there was no impairment. No recent events or changes in circumstances indicate that impairment existed at September 30, 2017. See Note 1—Summary of Significant Accounting Policies.
Other Fair Value Disclosures
Long-term debt. Debt instruments are measured at amortized cost on the Company's consolidated balance sheet at September 30, 2017. The fair value of these notes, as provided by third-party pricing vendors, is based on quoted prices in active markets for similar, not identical, assets. The pricing data obtained from outside sources is reviewed internally for reasonableness, compared against benchmark quotes from independent pricing sources, then confirmed or revised accordingly. If measured at fair value in the financial statements, these instruments would be classified as Level 2 in the fair value hierarchy.
The following table presents the carrying amount and estimated fair value of the Company’s debt in order of maturity:
September 30, 2017 | September 30, 2016 | ||||||||||||||
Carrying Amount | Estimated Fair Value | Carrying Amount | Estimated Fair Value | ||||||||||||
(in millions) | |||||||||||||||
1.20% Senior Notes due December 2017 | $ | 1,749 | $ | 1,751 | $ | 1,746 | $ | 1,754 | |||||||
2.20% Senior Notes due December 2020 | 2,990 | 3,031 | 2,988 | 3,077 | |||||||||||
2.15% Senior Notes due September 2022 | 993 | 997 | — | — | |||||||||||
2.80% Senior Notes due December 2022 | 2,240 | 2,301 | 2,238 | 2,359 | |||||||||||
3.15% Senior Notes due December 2025 | 3,967 | 4,098 | 3,964 | 4,225 | |||||||||||
2.75% Senior Notes due September 2027 | 740 | 737 | — | — | |||||||||||
4.15% Senior Notes due December 2035 | 1,485 | 1,637 | 1,485 | 1,698 | |||||||||||
4.30% Senior Notes due December 2045 | 3,463 | 3,873 | 3,461 | 4,045 | |||||||||||
3.65% Senior Notes due September 2047 | 740 | 746 | — | — | |||||||||||
Total | $ | 18,367 | $ | 19,171 | $ | 15,882 | $ | 17,158 | |||||||
76
Other Financial Instruments not Measured at Fair Value
The following financial instruments are not measured at fair value on the Company's consolidated balance sheet at September 30, 2017, but require disclosure of their fair values: time deposits recorded in prepaid expenses and other current assets, settlement receivable and payable, and customer collateral. The estimated fair value of such instruments at September 30, 2017 approximates their carrying value due to their generally short maturities. If measured at fair value in the financial statements, these financial instruments would be classified as Level 2 in the fair value hierarchy.
Investments
Trading Investment Securities
Trading investment securities include mutual fund equity security investments related to various employee compensation and benefit plans. Trading activity in these investments is at the direction of the Company's employees. These investments are held in trust and are not available for the Company's operational or liquidity needs. Interest and dividend income and changes in fair value are recorded in non-operating income, and offset in personnel expense on the consolidated statements of operations. As of September 30, 2017 and 2016, trading investment securities totaled $82 million and $71 million, respectively.
Available-for-sale Investment Securities
The amortized cost, unrealized gains and losses and fair value of available-for-sale investment securities are as follows:
September 30, 2017 | September 30, 2016 | ||||||||||||||||||||||||||||||
Amortized Cost | Gross Unrealized | Fair Value | Amortized Cost | Gross Unrealized | Fair Value | ||||||||||||||||||||||||||
Gains | Losses | Gains | Losses | ||||||||||||||||||||||||||||
(in millions) | |||||||||||||||||||||||||||||||
U.S. government-sponsored debt securities | $ | 3,664 | $ | 1 | $ | (2 | ) | $ | 3,663 | $ | 4,693 | $ | 6 | $ | — | $ | 4,699 | ||||||||||||||
U.S. Treasury securities | 1,623 | — | (2 | ) | 1,621 | 2,176 | 3 | — | 2,179 | ||||||||||||||||||||||
Equity securities | 5 | 119 | — | 124 | 7 | 46 | — | 53 | |||||||||||||||||||||||
Corporate debt securities | — | — | — | — | 248 | — | — | 248 | |||||||||||||||||||||||
Auction rate securities | — | — | — | — | — | — | — | — | |||||||||||||||||||||||
Total | $ | 5,292 | $ | 120 | $ | (4 | ) | $ | 5,408 | $ | 7,124 | $ | 55 | $ | — | $ | 7,179 | ||||||||||||||
Less: current portion of available-for-sale investment securities | $ | (3,482 | ) | $ | (3,248 | ) | |||||||||||||||||||||||||
Long-term available-for-sale investment securities | $ | 1,926 | $ | 3,931 | |||||||||||||||||||||||||||
77
Available-for-sale investment securities primarily include U.S. Treasury securities, U.S. government-sponsored debt securities and corporate debt securities. Available-for-sale debt securities are presented below in accordance with their stated maturities. A portion of these investments, $1.9 billion, are classified as non-current, as they have stated maturities of more than one year from the balance sheet date. However, these investments are generally available to meet short-term liquidity needs.
Amortized Cost | Fair Value | ||||||
(in millions) | |||||||
September 30, 2017: | |||||||
Due within one year | $ | 3,360 | $ | 3,358 | |||
Due after 1 year through 5 years | 1,927 | 1,926 | |||||
Due after 5 years through 10 years | — | — | |||||
Due after 10 years | — | — | |||||
Total | $ | 5,287 | $ | 5,284 | |||
Investment Income
Investment income is recorded as non-operating income in the Company's consolidated statements of operations and consisted of the following:
For the Years Ended September 30, | |||||||||||
2017 | 2016 | 2015 | |||||||||
(in millions) | |||||||||||
Interest and dividend income on cash and investments | $ | 92 | $ | 75 | $ | 31 | |||||
Gain on other investments | 6 | 5 | 3 | ||||||||
Investment securities, trading: | |||||||||||
Unrealized gains (losses), net | 6 | 3 | (6 | ) | |||||||
Realized gains, net | 2 | — | 2 | ||||||||
Investment securities, available-for-sale: | |||||||||||
Realized (losses) gains, net | (1 | ) | 3 | 21 | |||||||
Other-than-temporary impairment on investments | — | (4 | ) | (5 | ) | ||||||
Investment income | $ | 105 | $ | 82 | $ | 46 | |||||
Note 5—Property, Equipment and Technology, Net
Property, equipment and technology, net, consisted of the following:
September 30, 2017 | September 30, 2016 | ||||||
(in millions) | |||||||
Land | $ | 72 | $ | 74 | |||
Buildings and building improvements | 865 | 839 | |||||
Furniture, equipment and leasehold improvements | 1,534 | 1,382 | |||||
Construction-in-progress | 139 | 125 | |||||
Technology | 2,533 | 2,378 | |||||
Total property, equipment and technology | 5,143 | 4,798 | |||||
Accumulated depreciation and amortization | (2,890 | ) | (2,648 | ) | |||
Property, equipment and technology, net | $ | 2,253 | $ | 2,150 | |||
78
Technology consists of both purchased and internally developed software. Internally developed software primarily represents software utilized by the VisaNet electronic payments network. At September 30, 2017 and 2016, accumulated amortization for technology was $1.7 billion and $1.5 billion, respectively.
At September 30, 2017, estimated future amortization expense on technology was as follows:
Fiscal: | 2018 | 2019 | 2020 | 2021 | 2022 and thereafter | Total | ||||||||||||||||||
(in millions) | ||||||||||||||||||||||||
Estimated future amortization expense | $ | 265 | $ | 222 | $ | 159 | $ | 107 | $ | 76 | $ | 829 | ||||||||||||
Depreciation and amortization expense related to property, equipment and technology was $500 million, $452 million and $431 million for fiscal 2017, 2016 and 2015, respectively. Included in those amounts was amortization expense on technology of $285 million, $259 million and $251 million for fiscal 2017, 2016 and 2015, respectively.
Note 6—Intangible Assets and Goodwill
Indefinite-lived and finite-lived intangible assets consisted of the following:
September 30, 2017 | September 30, 2016 | ||||||||||||||||||||||
Gross | Accumulated Amortization | Net | Gross | Accumulated Amortization | Net | ||||||||||||||||||
(in millions) | |||||||||||||||||||||||
Finite-lived intangible assets: | |||||||||||||||||||||||
Customer relationships | $ | 438 | $ | (237 | ) | $ | 201 | $ | 351 | $ | (220 | ) | $ | 131 | |||||||||
Trade names | 195 | (93 | ) | 102 | 192 | (80 | ) | 112 | |||||||||||||||
Reseller relationships | 95 | (79 | ) | 16 | 95 | (70 | ) | 25 | |||||||||||||||
Other | 17 | (9 | ) | 8 | 18 | (9 | ) | 9 | |||||||||||||||
Total finite-lived intangible assets | 745 | (418 | ) | 327 | 656 | (379 | ) | 277 | |||||||||||||||
Indefinite-lived intangible assets: | |||||||||||||||||||||||
Customer relationships and reacquired rights | 23,437 | — | 23,437 | 22,873 | — | 22,873 | |||||||||||||||||
Visa trade name | 4,084 | — | 4,084 | 4,084 | — | 4,084 | |||||||||||||||||
Total indefinite-lived intangible assets | 27,521 | — | 27,521 | 26,957 | — | 26,957 | |||||||||||||||||
Total intangible assets | $ | 28,266 | $ | (418 | ) | $ | 27,848 | $ | 27,613 | $ | (379 | ) | $ | 27,234 | |||||||||
Amortization expense related to finite-lived intangible assets was $56 million, $50 million and $63 million for fiscal 2017, 2016 and 2015, respectively. At September 30, 2017, estimated future amortization expense on finite-lived intangible assets is as follows:
Fiscal: | 2018 | 2019 | 2020 | 2021 | 2022 and thereafter | Total | ||||||||||||||||||
(in millions) | ||||||||||||||||||||||||
Estimated future amortization expense | $ | 40 | $ | 40 | $ | 40 | $ | 40 | $ | 71 | $ | 231 | ||||||||||||
There was no impairment related to the Company’s indefinite-lived or finite-lived intangible assets during fiscal 2017, 2016 or 2015.
In February 2017, the Company acquired a business for a total purchase consideration net of cash received of approximately $302 million, paid primarily with cash on hand. Total purchase consideration has been allocated to the tangible and identifiable intangible assets acquired, and to liabilities assumed based on their respective fair values on the acquisition date. Related finite-lived intangible assets recorded totaled $104 million with a weighted-average useful life of eight years. Goodwill of $181 million was recorded to reflect the excess purchase consideration over net assets acquired. The consolidated financial statements include the operating results of the acquired business from the date
79
of acquisition. Pro forma information related to the acquisition has not been presented as the impact is not material to the Company's financial results.
The increase in total net intangible assets and goodwill during 2017 was primarily related to foreign currency translation, which is recorded as a component of accumulated other comprehensive income in the consolidated balance sheet, as well as the additions described above, partially offset by measurement period adjustments as the Company finalized the Visa Europe purchase price allocation during fiscal 2017. See Note 2—Visa Europe.
Note 7—Accrued and Other Liabilities
Accrued liabilities consisted of the following:
September 30, 2017 | September 30, 2016 | ||||||
(in millions) | |||||||
Accrued operating expenses | $ | 434 | $ | 347 | |||
Accrued interest expenses | 149 | 145 | |||||
Accrued income taxes (See Note 18—Income Taxes) | 243 | 153 | |||||
Other | 303 | 483 | |||||
Total | $ | 1,129 | $ | 1,128 | |||
Other non-current liabilities consisted of the following:
September 30, 2017 | September 30, 2016 | ||||||
(in millions) | |||||||
Accrued income taxes (See Note 18—Income Taxes) | $ | 1,092 | $ | 911 | |||
Employee benefits | 62 | 137 | |||||
Other | 167 | 114 | |||||
Total | $ | 1,321 | $ | 1,162 | |||
80
Note 8—Debt
The Company had outstanding debt as follows:
September 30, 2017 | September 30, 2016 | |||||||||||||||||||||||||
Principal Amount | Unamortized Discounts and Debt Issuance Costs | Carrying Amount | Principal Amount | Unamortized Discounts and Debt Issuance Costs | Carrying Amount | Effective Interest Rate | ||||||||||||||||||||
(in millions, except percentages) | ||||||||||||||||||||||||||
1.20% Senior Notes due 2017 (the "2017 Notes") | $ | 1,750 | $ | (1 | ) | $ | 1,749 | $ | — | $ | — | $ | — | 1.37 | % | |||||||||||
Total current maturities of long-term debt | 1,750 | (1 | ) | 1,749 | — | — | — | |||||||||||||||||||
1.20% Senior Notes due 2017 (the "2017 Notes") | — | — | — | 1,750 | (4 | ) | 1,746 | 1.37 | % | |||||||||||||||||
2.20% Senior Notes due 2020 (the "2020 Notes") | 3,000 | (10 | ) | 2,990 | 3,000 | (12 | ) | 2,988 | 2.30 | % | ||||||||||||||||
2.15% Senior Notes due September 2022 (the "September 2022 Notes") | 1,000 | (7 | ) | 993 | — | — | — | 2.30 | % | |||||||||||||||||
2.80% Senior Notes due December 2022 (the "December 2022 Notes") | 2,250 | (10 | ) | 2,240 | 2,250 | (12 | ) | 2,238 | 2.89 | % | ||||||||||||||||
3.15% Senior Notes due 2025 (the "2025 Notes") | 4,000 | (33 | ) | 3,967 | 4,000 | (36 | ) | 3,964 | 3.26 | % | ||||||||||||||||
2.75% Senior Notes due 2027 (the "2027 Notes") | 750 | (10 | ) | 740 | — | — | — | 2.91 | % | |||||||||||||||||
4.15% Senior Notes due 2035 (the "2035 Notes") | 1,500 | (15 | ) | 1,485 | 1,500 | (15 | ) | 1,485 | 4.23 | % | ||||||||||||||||
4.30% Senior Notes due 2045 (the "2045 Notes") | 3,500 | (37 | ) | 3,463 | 3,500 | (39 | ) | 3,461 | 4.37 | % | ||||||||||||||||
3.65% Senior Notes due 2047 (the "2047 Notes") | 750 | (10 | ) | 740 | — | — | — | 3.73 | % | |||||||||||||||||
Total long-term debt | 16,750 | (132 | ) | 16,618 | 16,000 | (118 | ) | 15,882 | ||||||||||||||||||
Total debt | $ | 18,500 | $ | (133 | ) | $ | 18,367 | $ | 16,000 | $ | (118 | ) | $ | 15,882 | ||||||||||||
Senior Notes
In September 2017, the Company issued fixed-rate senior notes (the September 2022 Notes, 2027 Notes and 2047 Notes, or collectively, the "Notes issued in 2017") in an aggregate principal amount of $2.5 billion, with maturities ranging between 5 and 30 years. Interest on the Notes issued in 2017 is payable semi-annually on March 15 and September 15 of each year, commencing March 15, 2018. The net aggregate proceeds from the Notes issued in 2017, after deducting discounts and debt issuance costs, were approximately $2.5 billion.
Use of Proceeds from Notes issued in 2017. On September 11, 2017, the Company called for redemption of all of the $1.75 billion principal amount outstanding of the 2017 Notes in accordance with the optional redemption provisions set forth in the governing indenture. Subsequent to fiscal 2017, on October 11, 2017, the redemption date, the Company redeemed all of the $1.75 billion principal amount. The redemption was funded with the proceeds from the Notes issued in 2017.
In December 2015, the Company issued fixed-rate senior notes (the 2017 Notes, 2020 Notes, December 2022 Notes, 2025 Notes, 2035 Notes and 2045 Notes, or collectively, the "Notes issued in 2015") in an aggregate principal amount of $16.0 billion, with maturities ranging between 2 and 30 years. Interest on the Notes issued in 2015 is payable semi-annually. The net aggregate proceeds from the Notes issued in 2015, after deducting discounts and debt issuance costs, were $15.9 billion.
81
The discounts and debt issuance costs are amortized over the respective term of each note using the effective interest method. The indenture governing the Notes issued in 2017 and the Notes issued in 2015, or collectively, the "Notes", contains customary event of default provisions. The Notes are senior unsecured obligations of the Company, ranking equally and ratably among themselves and with the Company's existing and future unsecured and unsubordinated debt. The Notes are not secured by any assets of the Company and are not guaranteed by any of the Company's subsidiaries. The Company was in compliance with all related covenants as of September 30, 2017.
The Company recognized related interest expense of $505 million and $399 million in fiscal 2017 and fiscal 2016, respectively, as non-operating expense.
Each series of Notes may be redeemed as a whole or in part at the Company’s option at any time, prior to either their maturity date (2017 Notes) or the applicable par call date (the remaining series of notes, as set forth in the table below), at a price equal to the greater of:
• | 100% of the principal amount of such Notes; and |
• | the sum of the present value of the remaining scheduled payments of principal and interest through the maturity or par call date for each of the Notes below at the treasury rate defined under the terms of the Notes, plus the applicable spread for such Notes (as set forth in the table below), |
plus, in each case, accrued and unpaid interest to, but excluding, the date of redemption.
Series | Maturity/Par Call Date | Spread | ||
2020 Notes | November 14, 2020 | 10 bps | ||
September 2022 Notes | August 15, 2022 | 10 bps | ||
December 2022 Notes | October 14, 2022 | 12.5 bps | ||
2025 Notes | September 14, 2025 | 15 bps | ||
2027 Notes | June 15, 2027 | 12.5 bps | ||
2035 Notes | June 14, 2035 | 20 bps | ||
2045 Notes | June 14, 2045 | 20 bps | ||
2047 Notes | March 15, 2047 | 15 bps | ||
On or after the applicable par call date, the Notes, except the 2017 Notes, may be redeemed as a whole or in part, at the Company’s option at any time, at a redemption price equal to 100% of the principal amount of the Notes being redeemed plus accrued interest.
Future principal payments on the Company's outstanding debt are as follows:
Fiscal Year | 2018 | 2019 | 2020 | 2021 | 2022 | Thereafter | Total | ||||||||||||||||||||
(in millions) | $ | 1,750 | $ | — | $ | — | $ | 3,000 | $ | 1,000 | $ | 12,750 | $ | 18,500 | |||||||||||||
Commercial Paper Program
Visa maintains a commercial paper program to support its working capital requirements and for other general corporate purposes. Under the program, the Company is authorized to issue up to $3.0 billion in outstanding notes, with maturities up to 397 days from the date of issuance. During fiscal 2017, the Company issued $567 million of commercial paper, with a weighted-average interest rate of 0.79%, and subsequently repaid its outstanding obligation. The Company had no outstanding obligations under the program at September 30, 2017.
Credit Facility
The Company is a party to a credit agreement for a 5-year, unsecured $4.0 billion revolving credit facility (the "Credit Facility") that was entered into on January 27, 2016. On January 27, 2017, the Company extended the term of the credit facility, which will now expire on January 27, 2022.
82
The Credit Facility provides a borrowing capacity of up to $4.0 billion. Borrowings under the Credit Facility are available for general corporate purposes. Interest on the borrowings under the Credit Facility would be charged at the London Interbank Offered Rate (LIBOR) or an alternative base rate, in each case plus applicable margins that fluctuate based on the applicable rating of senior unsecured long-term securities of the Company. The Borrowers have agreed to pay a commitment fee which will fluctuate based on such applicable rating of the Company.
Other material terms are:
• | a financial covenant which requires the Company to maintain a Consolidated Indebtedness to Consolidated EBITDA Ratio (as defined in the Credit Facility) of not greater than 3.75 to 1.00; |
• | customary restrictive covenants, which limit the Borrowers' ability to, among other things, create certain liens, effect fundamental changes to their business, or merge or dispose substantially all of their assets, subject in each case to customary exceptions and amounts; |
• | customary events of default, upon the occurrence of which, after any applicable grace period, the requisite lenders will have the ability to accelerate all outstanding loans thereunder and terminate the commitments; and |
• | other customary and standard terms and conditions. |
The Company had no borrowings under the Credit Facility as of September 30, 2017, and was in compliance with all related covenants as of and during the year ended September 30, 2017.
Note 9—Pension, Postretirement and Other Benefits
The Company sponsors various qualified and non-qualified defined benefit pension and other postretirement benefit plans that provide for retirement and medical benefits for all eligible employees residing in the United States. The Company also sponsors other pension benefit plans that provide benefits for internationally-based employees at certain non-U.S. locations. As a result of the acquisition of Visa Europe, the Company assumed the obligations related to Visa Europe's defined benefit plan, primarily consisting of the UK funded and unfunded pension plans.
Disclosures presented below include the U.S. pension plans and the non-U.S. plans, comprising only the Visa Europe plans. Disclosures relating to other non-U.S. pension benefit plans are not included as they are immaterial, individually and in aggregate. The Company uses a September 30 measurement date for its pension and other postretirement benefit plans.
Defined benefit pension plans. The U.S. pension benefits under the defined benefit pension plan were earned based on a cash balance formula. An employee’s cash balance account was credited with an amount equal to 6% of eligible compensation plus interest based on 30-year Treasury securities. In October 2015, the Company's board of directors approved an amendment of the U.S. qualified defined benefit pension plan such that the Company discontinued employer provided credits after December 31, 2015. Plan participants continue to earn interest credits on existing balances at the time of the freeze. As a result, a curtailment gain totaling $8 million was recognized in fiscal 2016 as part of the Company's net periodic benefit cost.
The funding policy for the U.S. pension benefits is to contribute annually no less than the minimum required contribution under ERISA.
Under the Visa Europe UK pension plans, presented below under "non-U.S. plans", retirement benefits are provided based on the participants' final pensionable pay and are currently closed to new entrants. However, future benefits continue to accrue for active participants. The funding policy is to contribute in accordance with the appropriate funding requirements agreed with the trustees of the UK pension plans. Additional amounts may be agreed with the UK pension plan trustees.
Postretirement benefits plan. The postretirement benefits plan provides medical benefits for retirees and dependents who meet minimum age and service requirements. Benefits are provided from retirement date until age 65. Retirees must contribute on a monthly basis for the comparable coverage that is generally available to active employees and their dependents. The Company’s contributions are funded on a current basis.
83
Summary of Plan Activities
Change in Benefit Obligation:
U.S. Plans | Non-U.S. Plans | ||||||||||||||||||||||
Pension Benefits | Other Postretirement Benefits | Pension Benefits | |||||||||||||||||||||
September 30, | September 30, | September 30, | |||||||||||||||||||||
2017 | 2016 | 2017 | 2016 | 2017 | 2016 | ||||||||||||||||||
(in millions) | |||||||||||||||||||||||
Benefit obligation—beginning of fiscal year | $ | 1,072 | $ | 1,005 | $ | 14 | $ | 18 | $ | 474 | $ | — | |||||||||||
Visa Europe acquisition | — | — | — | — | — | 381 | |||||||||||||||||
Service cost | — | 13 | — | — | 6 | 1 | |||||||||||||||||
Interest cost | 36 | 40 | 1 | 1 | 11 | 3 | |||||||||||||||||
Actuarial loss (gain) | (58 | ) | 86 | (1 | ) | (2 | ) | (52 | ) | 86 | |||||||||||||
Benefit payments | (137 | ) | (64 | ) | (3 | ) | (3 | ) | (14 | ) | (1 | ) | |||||||||||
Plan amendment | — | (8 | ) | — | — | — | — | ||||||||||||||||
Foreign currency exchange rate changes | — | — | — | — | 8 | 4 | |||||||||||||||||
Benefit obligation—end of fiscal year | $ | 913 | $ | 1,072 | $ | 11 | $ | 14 | $ | 433 | $ | 474 | |||||||||||
Accumulated benefit obligation | $ | 913 | $ | 1,072 | NA | NA | $ | 433 | $ | 474 | |||||||||||||
Change in Plan Assets: | |||||||||||||||||||||||
Fair value of plan assets—beginning of fiscal year | $ | 1,077 | $ | 1,022 | $ | — | $ | — | $ | 415 | $ | — | |||||||||||
Visa Europe acquisition | — | — | — | — | — | 287 | |||||||||||||||||
Actual return on plan assets | 125 | 118 | — | — | 17 | 25 | |||||||||||||||||
Company contribution | 9 | 1 | 3 | 3 | 5 | 102 | |||||||||||||||||
Benefit payments | (137 | ) | (64 | ) | (3 | ) | (3 | ) | (14 | ) | (1 | ) | |||||||||||
Foreign currency exchange rate changes | — | — | — | — | 10 | 2 | |||||||||||||||||
Fair value of plan assets—end of fiscal year | $ | 1,074 | $ | 1,077 | $ | — | $ | — | $ | 433 | $ | 415 | |||||||||||
Funded status at end of fiscal year | $ | 161 | $ | 5 | $ | (11 | ) | $ | (14 | ) | $ | — | $ | (59 | ) | ||||||||
Recognized in Consolidated Balance Sheets: | |||||||||||||||||||||||
Non-current asset | $ | 168 | $ | 22 | $ | — | $ | — | $ | — | $ | — | |||||||||||
Current liability | (1 | ) | (9 | ) | (2 | ) | (3 | ) | (5 | ) | (6 | ) | |||||||||||
Non-current liability | (6 | ) | (8 | ) | (9 | ) | (11 | ) | 5 | (53 | ) | ||||||||||||
Funded status at end of fiscal year | $ | 161 | $ | 5 | $ | (11 | ) | $ | (14 | ) | $ | — | $ | (59 | ) | ||||||||
84
Amounts recognized in accumulated other comprehensive income before tax:
U.S. Plans | Non-U.S. Plans | ||||||||||||||||||||||
Pension Benefits | Other Postretirement Benefits | Pension Benefits | |||||||||||||||||||||
September 30, | September 30, | September 30, | |||||||||||||||||||||
2017 | 2016 | 2017 | 2016 | 2017 | 2016 | ||||||||||||||||||
(in millions) | |||||||||||||||||||||||
Net actuarial loss (gain) | $ | 97 | $ | 241 | $ | (4 | ) | $ | (5 | ) | $ | 9 | $ | 66 | |||||||||
Prior service credit | — | — | — | (2 | ) | — | — | ||||||||||||||||
Total | $ | 97 | $ | 241 | $ | (4 | ) | $ | (7 | ) | $ | 9 | $ | 66 | |||||||||
Amounts from accumulated other comprehensive income to be amortized into net periodic benefit cost in fiscal 2018:
U.S. Plans | Non-U.S. Plans | ||||||||||
Pension Benefits | Other Postretirement Benefits | Pension Benefits | |||||||||
(in millions) | |||||||||||
Actuarial loss (gain) | $ | — | $ | (1 | ) | $ | — | ||||
Prior service credit | — | — | — | ||||||||
Total | $ | — | $ | (1 | ) | $ | — | ||||
Benefit obligations in excess of plan assets related to the Company's U.S. non-qualified plan and the non-U.S. pension plans(1) :
U.S. Plans | Non-U.S. Plans(1) | ||||||||||||||
September 30, | September 30, | ||||||||||||||
2017 | 2016 | 2017 | 2016 | ||||||||||||
(in millions) | |||||||||||||||
Accumulated benefit obligation in excess of plan assets | |||||||||||||||
Accumulated benefit obligation—end of year | $ | (7 | ) | $ | (16 | ) | $ | (5 | ) | $ | (474 | ) | |||
Fair value of plan assets—end of year | $ | — | $ | — | $ | — | $ | 415 | |||||||
Projected benefit obligation in excess of plan assets | |||||||||||||||
Benefit obligation—end of year | $ | (7 | ) | $ | (16 | ) | $ | (5 | ) | $ | (474 | ) | |||
Fair value of plan assets—end of year | $ | — | $ | — | $ | — | $ | 415 | |||||||
(1) | For fiscal 2017, the non-U.S. non-qualified pension plan had benefit obligations in excess of plan assets. For fiscal 2016, both non-U.S. pension plans had benefit obligations in excess of plan assets. |
85
Net periodic pension and other postretirement plan cost:
U.S. Plans | Non-U.S. Plans(1) | ||||||||||||||||||||||||||||||
Pension Benefits | Other Postretirement Benefits | Pension Benefits | |||||||||||||||||||||||||||||
Fiscal | |||||||||||||||||||||||||||||||
2017 | 2016 | 2015 | 2017 | 2016 | 2015 | 2017 | 2016 | ||||||||||||||||||||||||
(in millions) | |||||||||||||||||||||||||||||||
Service cost | $ | — | $ | 13 | $ | 47 | $ | — | $ | — | $ | — | $ | 6 | $ | 1 | |||||||||||||||
Interest cost | 36 | 40 | 40 | 1 | 1 | 1 | 11 | 3 | |||||||||||||||||||||||
Expected return on assets | (70 | ) | (69 | ) | (72 | ) | — | — | — | (16 | ) | (4 | ) | ||||||||||||||||||
Amortization of: | |||||||||||||||||||||||||||||||
Prior service credit | — | (1 | ) | (7 | ) | (2 | ) | (3 | ) | (3 | ) | — | — | ||||||||||||||||||
Actuarial loss (gain) | 15 | 7 | 1 | (2 | ) | (2 | ) | (2 | ) | 2 | — | ||||||||||||||||||||
Net benefit cost | $ | (19 | ) | $ | (10 | ) | $ | 9 | $ | (3 | ) | $ | (4 | ) | $ | (4 | ) | $ | 3 | $ | — | ||||||||||
Curtailment gain | — | (8 | ) | — | — | — | — | — | — | ||||||||||||||||||||||
Settlement loss | 15 | 13 | 7 | — | — | — | — | — | |||||||||||||||||||||||
Total net periodic benefit cost | $ | (4 | ) | $ | (5 | ) | $ | 16 | $ | (3 | ) | $ | (4 | ) | $ | (4 | ) | $ | 3 | $ | — | ||||||||||
(1) | For fiscal 2016, it represents Visa Europe's UK pension plans' net pension benefit cost recognized from the Closing through September 30, 2016. |
Other changes in plan assets and benefit obligations recognized in other comprehensive income:
U.S. Plans | Non-U.S. Plans | ||||||||||||||||||||||
Pension Benefits | Other Postretirement Benefits | Pension Benefits | |||||||||||||||||||||
2017 | 2016 | 2017 | 2016 | 2017 | 2016 | ||||||||||||||||||
(in millions) | |||||||||||||||||||||||
Current year actuarial loss (gain) | $ | (113 | ) | $ | 30 | $ | — | $ | (2 | ) | $ | (53 | ) | $ | 66 | ||||||||
Amortization of actuarial (loss) gain | (30 | ) | (20 | ) | 2 | 2 | (2 | ) | — | ||||||||||||||
Current year prior service credit | — | — | — | — | — | — | |||||||||||||||||
Amortization of prior service credit | — | 9 | 2 | 3 | — | — | |||||||||||||||||
Total recognized in other comprehensive income | $ | (143 | ) | $ | 19 | $ | 4 | $ | 3 | $ | (55 | ) | $ | 66 | |||||||||
Total recognized in net periodic benefit cost and other comprehensive income | $ | (147 | ) | $ | 14 | $ | 1 | $ | (1 | ) | $ | (52 | ) | $ | 66 | ||||||||
86
Weighted-Average Actuarial Assumptions:
U.S. Plans | Non-U.S. Plans | |||||||||||||
Fiscal | ||||||||||||||
2017 | 2016 | 2015 | 2017 | 2016 | ||||||||||
Discount rate for benefit obligation:(1) | ||||||||||||||
Pension | 3.84 | % | 3.62 | % | 4.33 | % | 2.70 | % | 2.40 | % | ||||
Postretirement | 2.44 | % | 1.91 | % | 2.43 | % | NA | NA | ||||||
Discount rate for net periodic benefit cost: | ||||||||||||||
Pension | 3.62 | % | 4.33 | % | 4.27 | % | 2.40 | % | 3.10 | % | ||||
Postretirement | 1.91 | % | 2.43 | % | 2.59 | % | NA | NA | ||||||
Expected long-term rate of return on plan assets(2) | 7.00 | % | 7.00 | % | 7.00 | % | 4.50 | % | 3.92 | % | ||||
Rate of increase in compensation levels for:(3) | ||||||||||||||
Benefit obligation | NA | NA | 4.00 | % | 3.20 | % | 3.20 | % | ||||||
Net periodic benefit cost | NA | NA | 4.00 | % | 3.20 | % | 3.00 | % | ||||||
(1) | Represents a single weighted-average discount rate derived based on a cash flow matching analysis, with the projected benefit payments matching spot rates from a yield curve developed from high-quality corporate bonds. |
(2) | Primarily based on the targeted allocation, and evaluated for reasonableness by considering such factors as: (i) actual return on plan assets; (ii) historical rates of return on various asset classes in the portfolio; (iii) projections of returns on various asset classes; and (iv) current and prospective capital market conditions and economic forecasts. |
(3) | This assumption is not applicable for the U.S. plans in fiscal 2017 and 2016 due to the amendment of the U.S. qualified defined benefit pension plan in October 2015, which discontinued the employer provided credits effective after December 31, 2015. |
The assumed annual rate of future increases in health benefits for the other postretirement benefits plan is 7% for fiscal 2018. The rate is assumed to decrease to 5% by 2025 and remain at that level thereafter. These trend rates reflect management’s expectations of future rates. Increasing or decreasing the healthcare cost trend by 1% would change the postretirement plan benefit obligation by less than $1 million.
Pension Plan Assets
Pension plan assets are managed with a long-term perspective to ensure that there is an adequate level of assets to support benefit payments to participants over the life of the pension plan. Pension plan assets are managed by external investment managers. Investment manager performance is measured against benchmarks for each asset class on a quarterly basis. An independent consultant assists management with investment manager selections and performance evaluations.
Pension plan assets are broadly diversified to maintain a prudent level of risk and to provide adequate liquidity for benefit payments. The Company generally evaluates and rebalances the pension plan assets, as appropriate, to ensure that allocations are consistent with target allocation ranges. The weighted-average targeted allocation for U.S. pension plan assets is as follows: equity securities of 50% to 80%, fixed income securities of 25% to 35% and other, primarily consisting of cash equivalents to meet near term expected benefit payments and expenses, of up to 7%. At September 30, 2017, U.S. pension plan asset allocations for these categories were 64%, 33% and 3%, respectively, which were within target allocation ranges.
The weighted-average targeted allocation for non-U.S. pension plans is as follows: equity securities of 28%, fixed income securities of 47% and other of 25%, consisting of cash, multi-asset funds, and property. At September 30, 2017, non-U.S. pension plan asset allocations for these categories were 31%, 44% and 25%, respectively, which were generally aligned with the target allocations.
87
The following tables set forth by level, within the fair value hierarchy, the pension plan’s investments at fair value as of September 30, 2017 and 2016, including the impact of transactions that were not settled at the end of September:
U.S. Plans | |||||||||||||||||||||||||||||||
Fair Value Measurements at September 30, | |||||||||||||||||||||||||||||||
Level 1 | Level 2 | Level 3 | Total | ||||||||||||||||||||||||||||
2017 | 2016 | 2017 | 2016 | 2017 | 2016 | 2017 | 2016 | ||||||||||||||||||||||||
(in millions) | |||||||||||||||||||||||||||||||
Cash equivalents | $ | 31 | $ | 39 | $ | 31 | $ | 39 | |||||||||||||||||||||||
Collective investment funds | $ | 540 | $ | — | 540 | — | |||||||||||||||||||||||||
Corporate debt securities | 197 | 185 | 197 | 185 | |||||||||||||||||||||||||||
U.S. government-sponsored debt securities | 47 | 30 | 47 | 30 | |||||||||||||||||||||||||||
U.S. Treasury securities | 75 | 100 | 75 | 100 | |||||||||||||||||||||||||||
Asset-backed securities | $ | 39 | $ | 51 | 39 | 51 | |||||||||||||||||||||||||
Equity securities | 145 | 672 | 145 | 672 | |||||||||||||||||||||||||||
Total | $ | 251 | $ | 811 | $ | 784 | $ | 215 | $ | 39 | $ | 51 | $ | 1,074 | $ | 1,077 | |||||||||||||||
Non-U.S. Plans | |||||||||||||||||||||||||||||||
Fair Value Measurements at September 30, | |||||||||||||||||||||||||||||||
Level 1 | Level 2 | Level 3 | Total | ||||||||||||||||||||||||||||
2017 | 2016 | 2017 | 2016 | 2017 | 2016 | 2017 | 2016 | ||||||||||||||||||||||||
(in millions) | |||||||||||||||||||||||||||||||
Cash equivalents | $ | 1 | $ | 105 | $ | 1 | $ | 105 | |||||||||||||||||||||||
Corporate debt securities | $ | 39 | $ | 39 | 39 | 39 | |||||||||||||||||||||||||
UK Treasury securities | 150 | 52 | 150 | 52 | |||||||||||||||||||||||||||
Asset-backed securities | $ | 32 | $ | 29 | 32 | 29 | |||||||||||||||||||||||||
Equity securities | 134 | 116 | 134 | 116 | |||||||||||||||||||||||||||
Multi-asset securities (1) | 77 | 74 | 77 | 74 | |||||||||||||||||||||||||||
Total | $ | 285 | $ | 273 | $ | 116 | $ | 113 | $ | 32 | $ | 29 | $ | 433 | $ | 415 | |||||||||||||||
(1) | Multi-asset securities represent pension plan assets that are invested in funds comprised of broad ranges of assets. |
Level 1 assets. Cash equivalents (money market funds, time deposits and treasury bills), U.S. and UK Treasury securities and equity securities are classified as Level 1 within the fair value hierarchy, as fair value is based on quoted prices in active markets.
Level 2 assets. Collective investment funds are unregistered investment vehicles that commingle the assets of multiple fiduciary clients, such as pension and other employee benefit plans, to invest in portfolio of stocks, bonds or other securities. Although the collective investment funds held by the plan are ultimately invested in the common stocks of companies in the S&P 500 Index and S&P 500 Completion Index, their own unit values are not directly observable, and therefore they are classified as Level 2. The fair values of corporate debt, multi-asset and U.S. government-sponsored securities are based on quoted prices in active markets for similar assets as provided by third-party pricing vendors. This pricing data is reviewed internally for reasonableness through comparisons with benchmark quotes from independent third-party sources. Based on this review, the valuation is confirmed or revised accordingly.
Level 3 assets. Asset-backed securities are bonds that are backed by various types of assets and primarily consist of mortgage-backed securities. Asset-backed securities are classified as Level 3 due to a lack of observable inputs in measuring fair value.
88
There were no transfers between Level 1 and Level 2 assets during fiscal 2017 or 2016. A separate roll-forward of Level 3 plan assets measured at fair value is not presented because activities during fiscal 2017 and 2016 were immaterial.
Cash Flows
U.S. Plans | Non-U.S. Plans | ||||||||||
Pension Benefits | Other Postretirement Benefits | Pension Benefits | |||||||||
Actual employer contributions | (in millions) | ||||||||||
2017 | $ | 9 | $ | 3 | $ | 5 | |||||
2016 | $ | 1 | $ | 3 | $ | 102 | |||||
Expected employer contributions | |||||||||||
2018 | $ | 1 | $ | 2 | $ | 5 | |||||
Expected benefit payments | |||||||||||
2018 | $ | 161 | $ | 2 | $ | 5 | |||||
2019 | $ | 83 | $ | 2 | $ | 5 | |||||
2020 | $ | 82 | $ | 2 | $ | 5 | |||||
2021 | $ | 80 | $ | 1 | $ | 5 | |||||
2022 | $ | 75 | $ | 1 | $ | 5 | |||||
2023-2027 | $ | 323 | $ | 1 | $ | 29 | |||||
Other Benefits
The Company sponsors a defined contribution plan, or 401(k) plan, that covers substantially all of its employees residing in the United States. Personnel costs included $58 million, $55 million and $49 million in fiscal 2017, 2016 and 2015, respectively, for expenses attributable to the Company’s employees under the 401(k) plan. The Company’s contributions to this 401(k) plan are funded on a current basis, and the related expenses are recognized in the period that the payroll expenses are incurred.
Note 10—Settlement Guarantee Management
The Company indemnifies its clients for settlement losses suffered due to failure of any other client to fund its settlement obligations in accordance with the Visa rules. This indemnification creates settlement risk for the Company due to the difference in timing between the date of a payment transaction and the date of subsequent settlement. Settlement at risk, or exposure, is primarily calculated using: (1) an average daily card volume multiplied by an estimated number of days to settle plus a safety margin; (2) four months of rolling average chargebacks volume; and (3) the total balance for outstanding Visa Travelers Cheques.
The Company maintains and regularly reviews global settlement risk policies and procedures to manage settlement exposure, which may require clients to post collateral if certain credit standards are not met.
The Company's settlement exposure is limited to the amount of unsettled Visa payment transactions at any point in time. The Company's estimated maximum settlement exposure was $67.7 billion for the year ended September 30, 2017 compared to $67.8 billion for the year ended September 30, 2016. Of these amounts, $2.8 billion and $2.9 billion at September 30, 2017 and 2016, respectively, were covered by collateral. The total available collateral balances presented below were greater than the settlement exposure covered by customer collateral held due to instances in which the available collateral exceeded the total settlement exposure for certain financial institutions at each date presented.
89
The Company maintained collateral as follows:
September 30, 2017 | September 30, 2016 | ||||||
(in millions) | |||||||
Cash equivalents(1) | $ | 1,490 | $ | 1,295 | |||
Pledged securities at market value | 167 | 170 | |||||
Letters of credit | 1,316 | 1,311 | |||||
Guarantees | 941 | 1,418 | |||||
Total | $ | 3,914 | $ | 4,194 | |||
(1) | Cash collateral held by Visa Europe is not included on the Company's consolidated balance sheet as its clients retain beneficial ownership and the cash is only accessible to the Company in the event of default by the client on its settlement obligations. |
Cash equivalents collateral, excluding cash collateral held by Visa Europe, is reflected in customer collateral on the consolidated balance sheets as it is held in escrow in the Company's name. All other collateral is excluded from the consolidated balance sheets. Pledged securities are held by third parties in trust for the Company and clients. Letters of credit are provided primarily by client financial institutions to serve as irrevocable guarantees of payment. Guarantees are provided primarily by parent financial institutions to secure the obligations of their subsidiaries. The Company routinely evaluates the financial viability of institutions providing the guarantees.
The fair value of the settlement risk guarantee is estimated using a proprietary model which considers statistically derived loss factors based on historical experience, estimated settlement exposures at period end and a standardized grading process for clients (using, where available, third-party estimates of the probability of client failure). Historically, the Company experienced minimal losses, which has contributed to an estimated probability-weighted value of the guarantee of approximately $3 million and $2 million at September 30, 2017 and 2016, respectively. These amounts were reflected in accrued liabilities on the consolidated balance sheets.
Note 11—Derivative and Non-derivative Financial Instruments
Derivative Financial Instruments
Designated derivative financial instrument hedges. The aggregate notional amount of the Company's derivative contracts outstanding in its hedge program was $1.8 billion at September 30, 2017 and $1.6 billion at September 30, 2016. As of September 30, 2017, the Company’s cash flow hedges in an asset position totaled $8 million and were classified in prepaid expenses and other current assets on the consolidated balance sheet, while cash flow hedges in a liability position totaled $64 million and were classified in accrued liabilities on the consolidated balance sheet. These amounts are subject to master netting agreements, which provide the Company with a legal right to net settle multiple payable and receivable positions with the same counterparty, in a single currency through a single payment. However, the Company presents fair values on a gross basis on the consolidated balance sheets. See Note 1—Summary of Significant Accounting Policies.
The Company uses regression analysis to assess hedge effectiveness prospectively and retrospectively. The effectiveness tests are performed on the foreign exchange forward contracts based on changes in the spot rate of the derivative instrument compared to changes in the spot rate of the forecasted hedged transaction. Forward points are excluded for effectiveness testing and measurement purposes. The excluded forward points are reported in earnings. For fiscal 2017, 2016 and 2015, the amounts by which earnings were reduced relating to excluded forward points were $18 million, $30 million and $29 million, respectively.
The effective portion of changes in the fair value of derivative contracts is recorded as a component of accumulated other comprehensive income or loss on the consolidated balance sheets. When the forecasted transaction occurs and is recognized in earnings, the amount in accumulated other comprehensive income or loss related to that hedge is reclassified to operating revenue or expense. The Company expects to reclassify $49 million of pre-tax losses to earnings during fiscal 2018.
90
Non-designated derivative financial instrument hedges. Subsequent to the acquisition of Visa Europe, the Company entered into currency forward contracts to offset Visa Europe hedges outstanding at the date of the acquisition that did not qualify for cash flow hedge accounting treatment in accordance with U.S. GAAP or the Company’s accounting policy.
The Company utilizes foreign exchange derivative contracts to hedge against foreign currency exchange rate fluctuations related to certain monetary assets and liabilities denominated in foreign currency held by Visa Europe. As of September 30, 2017 and 2016, the aggregate notional amount of these balance sheet hedges was $1.0 billion and $1.1 billion, respectively.
Credit and market risks. The Company's derivative financial instruments are subject to both credit and market risk. The Company monitors the credit-worthiness of the financial institutions that are counterparties to its derivative financial instruments and does not consider the risks of counterparty nonperformance to be significant. The Company mitigates this risk by entering into master netting agreements, and except for derivative instruments entered into by Visa Europe, such agreements require each party to post collateral against its net liability position with the respective counterparty. As of September 30, 2017, the Company has received collateral of $2 million, from counterparties, which is included in accrued liabilities in the consolidated balance sheet, and posted collateral of $51 million, which is included in other assets in the consolidated balance sheet. Notwithstanding the Company’s efforts to manage foreign exchange risk, there can be no absolute assurance that its hedging activities will adequately protect against the risks associated with foreign currency fluctuations. Credit and market risks related to derivative instruments were not considered significant at September 30, 2017.
Non-derivative Financial Instrument Designated as a Net Investment Hedge
As of September 30, 2017, the Company had designated $1.2 billion of its euro-denominated deferred cash consideration liability, a non-derivative financial instrument, as a hedge against a portion of the foreign currency exchange rate exposure of the Company's euro-denominated net investment of $18.8 billion in Visa Europe. During fiscal 2017, changes in the euro exchange rate against the U.S. dollar resulted in net foreign currency translation adjustments of $1.1 billion.
Note 12—Enterprise-wide Disclosures and Concentration of Business
The Company’s long-lived net property, equipment and technology assets are classified by major geographic areas as follows:
September 30, 2017 | September 30, 2016 | ||||||
(in millions) | |||||||
United States | $ | 2,003 | $ | 1,827 | |||
International | 250 | 323 | |||||
Total | $ | 2,253 | $ | 2,150 | |||
Revenue by geographic market is primarily based on the location of the issuing financial institution. Revenues earned in the United States were approximately 47% of net operating revenues in fiscal 2017, 52% in fiscal 2016 and 53% in fiscal 2015. No individual country, other than the United States, generated more than 10% of net operating revenues in these years.
A significant portion of Visa’s operating revenues is concentrated among its largest clients. Loss of business from any of these clients could have an adverse effect on the Company. The Company did not have any customer that generated greater than 10% of its net operating revenues in fiscal 2017, 2016 or 2015.
91
Note 13—Stockholders' Equity
Visa Europe acquisition. In connection with the Visa Europe acquisition, three new series of preferred stock of the Company were created. Upon issuance, all of the preferred stock participate on an as-converted basis in regular quarterly cash dividends declared on the Company's class A common stock. Additionally, Visa Europe held shares of Visa Inc.'s class C common stock, which were treated as treasury stock in purchase accounting. During fiscal 2017, the newly-formed Visa Foundation received all Visa Inc. shares that were previously recorded as treasury stock. See Note 2—Visa Europe and Note 18—Income Taxes
Class A common stock split. In January 2015, Visa’s board of directors declared a four-for-one split of its class A common stock. Each class A common stockholder as of the record date received a dividend of three additional shares for every share held as of the record date. Holders of class B and C common stock did not receive a stock dividend. Instead, the conversion rate for class B common stock increased to 1.6483 shares of class A common stock per share of class B common stock, and the conversion rate for class C common stock increased to 4.0 shares of class A common stock per share of class C common stock. Immediately following the split, the class A, B and C stockholders retained the same relative ownership percentages that they had prior to the stock split. All per share amounts and number of shares outstanding in these consolidated financial statements and accompanying notes are presented on a post-split basis. As a result of the stock split, all historical per share data and number of shares outstanding presented have been retroactively adjusted.
As-converted class A common stock. The UK&I and Europe preferred stock, issued in the Visa Europe acquisition, is convertible upon certain conditions into shares of class A common stock or class A equivalent preferred stock, at an initial conversion rate of 13.952 shares of class A common stock for each share of UK&I preferred stock and Europe preferred stock. The conversion rates may be reduced from time to time to offset certain liabilities. See Note 2—Visa Europe and Note 3—U.S. and Europe Retrospective Responsibility Plans.
The number of shares of each series and class, and the number of shares of class A common stock on an as-converted basis at September 30, 2017, are as follows:
(in millions, except conversion rate) | Shares Outstanding | Conversion Rate Into Class A Common Stock | As-converted Class A Common Stock (1) | |||||
UK&I preferred stock | 2 | 13.0770 | 32 | |||||
Europe preferred stock | 3 | 13.9480 | 44 | |||||
Class A common stock (2) | 1,818 | — | 1,818 | |||||
Class B common stock | 245 | 1.6483 | (3) | 405 | ||||
Class C common stock | 13 | 4.0000 | 51 | |||||
Total | 2,350 | |||||||
(1) | Figures in the table may not recalculate exactly due to rounding. As-converted class A common stock is calculated based on unrounded numbers. |
(2) | Class A common stock shares outstanding reflect repurchases settled on or before September 30, 2017. |
(3) | The class B to class A common stock conversion rate is presented on a rounded basis. Conversion calculations for dividend payments are based on a conversion rate rounded to the tenth decimal. |
Reduction in as-converted shares. During fiscal 2017, total as-converted class A common stock was reduced by 79 million shares at an average price of $89.92 per share. Of the 79 million shares, 77 million were repurchased in the open market using $6.9 billion of operating cash on hand. Additionally, the Company recovered $191 million of VE territory covered losses in accordance with the Europe retrospective responsibility plan. The recovery has the same economic effect on earnings per share as repurchasing the Company's class A common stock, because it reduces the UK&I and Europe preferred stock conversion rates and consequently, the as-converted class A common stock share count. See Note 3—U.S. and Europe Retrospective Responsibility Plans.
92
The following table presents share repurchases in the open market during the following fiscal years(1):
(in millions, except per share data) | 2017 | 2016 | |||||||
Shares repurchased in the open market(2) | 77 | 91 | |||||||
Average repurchase price per share(3) | $ | 89.98 | $ | 77.05 | |||||
Total cost | $ | 6,891 | $ | 6,987 | |||||
(1) | Shares repurchased in the open market reflect repurchases settled during fiscal 2017. These amounts include repurchases traded but not yet settled on or before September 30, 2016 for fiscal 2017 or September 30, 2015 for fiscal 2016 and exclude repurchases traded but not yet settled on or before September 30, 2017 for fiscal 2017 or September 30, 2016 for fiscal 2016. |
(2) | All shares repurchased in the open market have been retired and constitute authorized but unissued shares. |
(3) | Figures in the table may not recalculate exactly due to rounding. Average repurchase price per share is calculated based on unrounded numbers. |
In April 2017, the Company's board of directors authorized an additional $5.0 billion share repurchase program. As of September 30, 2017, the share repurchase program had remaining authorized funds of $3.9 billion. All share repurchase programs authorized prior to April 2017 have been completed.
Under the terms of the Europe retrospective responsibility plan, the Company is entitled to recover VE territory covered losses through periodic adjustments to the class A common stock conversion rates applicable to the UK&I and Europe preferred stock. See Note 3—U.S. and Europe Retrospective Responsibility Plans.
The following table presents as-converted UK&I and Europe preferred stock, after the Company recovered VE territory covered losses through conversion rate adjustments, for fiscal 2017. There was no comparable adjustment recorded for Europe preferred stock during fiscal 2016.
UK&I Preferred Stock | Europe Preferred Stock | |||||||
(in millions, except per share and conversion rate data) | 2017 | 2017 | ||||||
Reduction in equivalent number of shares of class A common stock | 2 | — | (1) | |||||
Effective price per share (2) | $ | 88.70 | $ | 85.01 | ||||
Recovery through conversion rate adjustment | $ | 190 | $ | 1 | ||||
(1) | The reduction in equivalent number of shares of class A common stock was less than one million shares. |
(2) | Effective price per share is calculated using the volume-weighted average price of the Company's class A common stock over a pricing period in accordance with the Company's current certificates of designations for its series B and C convertible participating preferred stock. |
Class B common stock. The class B common stock is not convertible or transferable until the date on which all of the U.S. covered litigation has been finally resolved. This transfer restriction is subject to limited exceptions, including transfers to other holders of class B common stock. After termination of the restrictions, the class B common stock will be convertible into class A common stock if transferred to a person that was not a Visa Member (as defined in the current certificate of incorporation) or similar person or an affiliate of a Visa Member or similar person. Upon such transfer, each share of class B common stock will automatically convert into a number of shares of class A common stock based upon the applicable conversion rate in effect at the time of such transfer.
Adjustment of the conversion rate occurs upon: (i) the completion of any follow-on offering of class A common stock completed to increase the size of the U.S. litigation escrow account (or any cash deposit by the Company in lieu thereof) resulting in a further corresponding decrease in the conversion rate; or (ii) the final resolution of the U.S. covered litigation and the release of funds remaining on deposit in the U.S. litigation escrow account to the Company resulting in a corresponding increase in the conversion rate. There were no deposits into the U.S. litigation escrow account in fiscal 2017 or 2016. See Note 3—U.S. and Europe Retrospective Responsibility Plans.
Class C common stock. As of September 30, 2017, all of the shares of class C common stock have been released from transfer restrictions. A total of 139 million shares have been converted from class C to class A common stock upon their sale into the public market.
93
Preferred stock. Preferred stock may be issued as redeemable or non-redeemable, and has preference over any class of common stock with respect to the payment of dividends and distribution of the Company’s assets in the event of a liquidation or dissolution. The Company had 5 million shares of UK&I and Europe preferred stock outstanding at the end of fiscal 2017 and 2016. The shares of UK&I and Europe preferred stock are subject to restrictions on transfer and may become convertible in stages based on developments in the VE territory covered litigation. The shares of UK&I and Europe preferred stock will become fully convertible on the 12th anniversary of the Closing, subject only to a holdback to cover any then-pending claims. Upon any such conversion of the UK&I or Europe preferred stock (whether by such 12th anniversary, or thereafter with respect to claims pending on such anniversary), the holder would receive either class A common stock or class A equivalent preferred stock (for those who are not eligible to hold class A common stock pursuant to the Company's charter). The class A equivalent preferred stock will be freely transferable and each share of class A equivalent preferred stock will automatically convert into 100 shares of class A common stock upon a transfer to any holder that is eligible to hold class A common stock under the charter. See Note 2—Visa Europe and Note 3—U.S. and Europe Retrospective Responsibility Plans.
Voting rights. The holders of the UK&I and Europe preferred stock have no right to vote on any matters, except for certain defined matters, including, in specified circumstances, any consolidation, merger, combination or similar transaction of the Company in which the preferred stockholders would either (i) receive shares of common stock or other equity securities of the Company with preferences, rights and privileges that are not substantially identical to the preferences, rights and privileges of the applicable series of preferred stock or (ii) receive securities, cash or other property that is different from what the Company's class A common stockholders would receive. With respect to these limited matters on which the holders of preferred stock may vote, approval by the preferred stockholders requires the affirmative vote of the outstanding voting power of each such series of preferred stock, each such series voting as a single class. In either case, the UK&I and Europe preferred stockholders are entitled to cast a number of votes equal to the number of shares held by each such holder. Holders of the class A equivalent preferred stock, upon issuance at conversion, will have similar voting rights to the rights of the holders of the UK&I and Europe preferred stock.
Class A common stockholders have the right to vote on all matters on which stockholders generally are entitled to vote. Class B and C common stockholders have no right to vote on any matters, except for certain defined matters, including (i) any decision to exit the core payments business, in which case the class B and C common stockholders will vote together with the class A common stockholders in a single class, and (ii) in specified circumstances, any consolidation, merger, combination or similar transaction of the Company, in which case the class B and C common stockholders will vote together as a single class. In either case, the class B and C common stockholders are entitled to cast a number of votes equal to the number of shares of class B or C common stock held multiplied by the applicable conversion rate in effect on the record date. Holders of the Company's common stock have no right to vote on any amendment to the current certificate of incorporation that relates solely to any series of preferred stock.
Dividends declared. The Company declared and paid $1.6 billion in dividends in fiscal 2017 at a quarterly rate of $0.165 per share. In October 2017, the Company’s board of directors declared a quarterly cash dividend of $0.195 per share of class A common stock (determined in the case of class B and C common stock and UK&I and Europe preferred stock on an as-converted basis), which will be paid on December 5, 2017, to all holders of record of the Company’s common and preferred stock as of November 17, 2017.
Note 14—Earnings Per Share
Basic earnings per share is computed by dividing net income available to each class by the weighted-average number of shares of common stock outstanding and participating securities during the period. Net income is allocated to each class of common stock and participating securities based on its proportional ownership on an as-converted basis. The weighted-average number of shares of each class of common stock outstanding reflects changes in ownership over the periods presented. See Note 13—Stockholders' Equity.
Diluted earnings per share is computed by dividing net income available by the weighted-average number of shares of common stock outstanding, participating securities and, if dilutive, potential class A common stock equivalent shares outstanding during the period. Dilutive class A common stock equivalents may consist of: (1) shares of class A common stock issuable upon the conversion of UK&I and Europe preferred stock and class B and C common stock based on the conversion rates in effect through the period, and (2) incremental shares of class A common stock
94
calculated by applying the treasury stock method to the assumed exercise of employee stock options, the assumed purchase of stock under the Employee Stock Purchase Plan and the assumed vesting of unearned performance shares.
The following table presents earnings per share for fiscal 2017.(1)
Basic Earnings Per Share | Diluted Earnings Per Share | |||||||||||||||||||||
(in millions, except per share data) | ||||||||||||||||||||||
Income Allocation (A) (2) | Weighted- Average Shares Outstanding (B) | Earnings per Share = (A)/(B) | Income Allocation (A) (2) | Weighted- Average Shares Outstanding (B) | Earnings per Share = (A)/(B) | |||||||||||||||||
Class A common stock | $ | 5,170 | 1,845 | $ | 2.80 | $ | 6,699 | 2,395 | (3) | $ | 2.80 | |||||||||||
Class B common stock | 1,134 | 245 | $ | 4.62 | $ | 1,132 | 245 | $ | 4.61 | |||||||||||||
Class C common stock | 163 | 14 | $ | 11.21 | $ | 162 | 14 | $ | 11.19 | |||||||||||||
Participating securities(4) | 232 | Not presented | Not presented | $ | 232 | Not presented | Not presented | |||||||||||||||
Net income | $ | 6,699 | ||||||||||||||||||||
The following table presents earnings per share for fiscal 2016.(1)
Basic Earnings Per Share | Diluted Earnings Per Share | |||||||||||||||||||||
(in millions, except per share data) | ||||||||||||||||||||||
Income Allocation (A) (2) | Weighted- Average Shares Outstanding (B) | Earnings per Share = (A)/(B) | Income Allocation (A) (2) | Weighted- Average Shares Outstanding (B) | Earnings per Share = (A)/(B) | |||||||||||||||||
Class A common stock | $ | 4,738 | 1,906 | $ | 2.49 | $ | 5,991 | 2,414 | (3) | $ | 2.48 | |||||||||||
Class B common stock | 1,006 | 245 | $ | 4.10 | $ | 1,004 | 245 | $ | 4.09 | |||||||||||||
Class C common stock | 185 | 19 | $ | 9.94 | $ | 185 | 19 | $ | 9.93 | |||||||||||||
Participating securities(4) | 62 | Not presented | Not presented | $ | 61 | Not presented | Not presented | |||||||||||||||
Net income | $ | 5,991 | ||||||||||||||||||||
The following table presents earnings per share for fiscal 2015.(1)
Basic Earnings Per Share | Diluted Earnings Per Share | |||||||||||||||||||||
(in millions, except per share data) | ||||||||||||||||||||||
Income Allocation (A) (2) | Weighted- Average Shares Outstanding (B) | Earnings per Share = (A)/(B) | Income Allocation (A) (2) | Weighted- Average Shares Outstanding (B) | Earnings per Share = (A)/(B) | |||||||||||||||||
Class A common stock | $ | 5,044 | 1,954 | $ | 2.58 | $ | 6,328 | 2,457 | (3) | $ | 2.58 | |||||||||||
Class B common stock | 1,045 | 245 | $ | 4.26 | $ | 1,042 | 245 | $ | 4.25 | |||||||||||||
Class C common stock | 224 | 22 | $ | 10.33 | $ | 223 | 22 | $ | 10.30 | |||||||||||||
Participating securities(4) | 15 | Not presented | Not presented | $ | 15 | Not presented | Not presented | |||||||||||||||
Net income | $ | 6,328 | ||||||||||||||||||||
(1) | Figures in the table may not recalculate exactly due to rounding. Earnings per share is calculated based on unrounded numbers. The number of shares and per share amounts for the prior periods presented have been retroactively adjusted to reflect the four-for-one stock split effected in the second quarter of fiscal 2015. See Note 13—Stockholders' Equity. |
(2) | Net income is allocated based on proportional ownership on an as-converted basis. The weighted-average number of shares of as-converted class B common stock used in the income allocation was 405 million for fiscal 2017, 2016 and 2015. The weighted-average number of shares of as-converted class C common stock used in the income allocation was 58 million, 75 million and 87 million for fiscal 2017, 2016 and 2015, respectively. The weighted-average number of shares of preferred stock, included within participating securities, was 33 million of as-converted UK&I preferred stock, and 44 million of as-converted Europe preferred stock for fiscal 2017. |
(3) | Weighted-average diluted shares outstanding are calculated on an as-converted basis, and include incremental common stock equivalents, as calculated under the treasury stock method. The computation includes 5 million common stock equivalents for fiscal 2017 and 2016 and 6 million common stock equivalents for fiscal 2015, because their effect would have been dilutive. The computation excludes 2 million of common stock equivalents for fiscal 2017, 2016 and 2015, because their effect would have been anti-dilutive. |
(4) | Participating securities include preferred stock outstanding and unvested share-based payment awards that contain non-forfeitable rights to dividends or dividend equivalents, such as the Company's UK&I and Europe preferred stock, restricted stock awards, restricted stock units and earned performance-based shares. UK&I and Europe preferred stock were issued as part of the purchase price consideration in connection |
95
with the Visa Europe acquisition and are convertible into a number of shares of class A common stock or class A equivalent preferred stock upon certain conditions. Participating securities' income is allocated based on the weighted-average number of shares of as-converted stock. See Note 2—Visa Europe and Note 13—Stockholders' Equity.
Note 15—Share-based Compensation
2007 Equity Incentive Compensation Plan
The Company’s 2007 Equity Incentive Compensation Plan, or the EIP, authorizes the compensation committee of the board of directors to grant non-qualified stock options ("options"), restricted stock awards ("RSAs"), restricted stock units ("RSUs") and performance-based shares to its employees and non-employee directors, for up to 236 million shares of class A common stock. Shares available for award may be either authorized and unissued or previously issued shares subsequently acquired by the Company. The EIP will continue to be in effect until all of the common stock available under the EIP is delivered and all restrictions on those shares have lapsed, unless the EIP is terminated earlier by the Company’s board of directors. Awards may be granted under the plan until January 31, 2022.
Share-based compensation cost is recorded net of estimated forfeitures on a straight-line basis for awards with service conditions only, and on a graded-vesting basis for awards with service, performance and market conditions. The Company’s estimated forfeiture rate is based on an evaluation of historical, actual and trended forfeiture data. For fiscal 2017, 2016 and 2015, the Company recorded share-based compensation cost related to the EIP of $224 million, $211 million and $184 million, respectively, in personnel expense on its consolidated statements of operations. The related tax benefits were $67 million, $62 million and $54 million for fiscal 2017, 2016 and 2015, respectively. The amount of capitalized share-based compensation cost was immaterial during fiscal 2017, 2016 and 2015.
All per share amounts and number of shares outstanding presented below reflect the four-for-one stock split that was effected in the second quarter of fiscal 2015. See Note 13—Stockholders' Equity.
Options
Options issued under the EIP expire 10 years from the date of grant and primarily vest ratably over 3 years from the date of grant, subject to earlier vesting in full under certain conditions.
During fiscal 2017, 2016 and 2015, the fair value of each stock option was estimated on the date of grant using a Black-Scholes option pricing model with the following weighted-average assumptions:
2017 | 2016 | 2015 | ||||||||||
Expected term (in years)(1) | 4.23 | 4.35 | 4.55 | |||||||||
Risk-free rate of return(2) | 1.6 | % | 1.5 | % | 1.5 | % | ||||||
Expected volatility(3) | 20.2 | % | 21.7 | % | 22.0 | % | ||||||
Expected dividend yield(4) | 0.8 | % | 0.7 | % | 0.8 | % | ||||||
Fair value per option granted | $ | 13.90 | $ | 15.01 | $ | 12.04 | ||||||
(1) | This assumption is based on the Company's historical option exercises and those of a set of peer companies that management believes is generally comparable to Visa. The Company's data is weighted based on the number of years between the measurement date and Visa's initial public offering as a percentage of the options' contractual term. The relative weighting placed on Visa's data and peer data in fiscal 2017 was approximately 87% and 13%, respectively, and 77% and 23% in fiscal 2016, respectively and 67% and 33% in fiscal 2015, respectively. |
(2) | Based upon the zero coupon U.S. treasury bond rate over the expected term of the awards. |
(3) | Based on the Company’s implied and historical volatility. The expected volatility was 20% in fiscal 2017 and ranged from 20% to 23% in fiscal 2016 and 21% to 23% in fiscal 2015. |
(4) | Based on the Company’s annual dividend rate on the date of grant. |
96
The following table summarizes the Company’s option activity for fiscal 2017:
Options | Weighted- Average Exercise Price Per Share | Weighted- Average Remaining Contractual Term (in years) | Aggregate Intrinsic Value (1) (in millions) | |||||||
Outstanding at October 1, 2016 | 8,876,484 | $ | 38.42 | |||||||
Granted | 1,671,344 | $ | 80.82 | |||||||
Forfeited | (386,136 | ) | $ | 75.01 | ||||||
Exercised | (3,045,816 | ) | $ | 29.62 | ||||||
Outstanding at September 30, 2017 | 7,115,876 | $ | 50.17 | 5.4 | $392 | |||||
Options exercisable at September 30, 2017 | 4,463,008 | $ | 33.39 | 3.6 | $321 | |||||
Options exercisable and expected to vest at September 30, 2017(2) | 6,773,571 | $ | 48.73 | 5.3 | $383 | |||||
(1) | Calculated using the closing stock price on the last trading day of fiscal 2017 of $105.24, less the option exercise price, multiplied by the number of instruments. |
(2) | Applies a forfeiture rate to unvested options outstanding at September 30, 2017 to estimate the options expected to vest in the future. |
For the options exercised during fiscal 2017, 2016 and 2015, the total intrinsic value was $178 million, $103 million and $134 million, respectively, and the tax benefit realized was $62 million, $35 million and $86 million, respectively. As of September 30, 2017, there was $19 million of total unrecognized compensation cost related to unvested options, which is expected to be recognized over a weighted-average period of approximately 0.4 years.
Restricted Stock Awards and Restricted Stock Units
RSAs and RSUs issued under the EIP primarily vest ratably over 3 years from the date of grant, subject to earlier vesting in full under certain conditions.
Upon vesting, the RSAs are settled in class A common stock on a one-for-one basis. During the vesting period, RSA award recipients are eligible to receive dividends and participate in the same voting rights as those granted to the holders of the underlying class A common stock. Upon vesting, RSUs can be settled in class A common stock on a one-for-one basis or in cash, or a combination thereof, at the Company’s option. The Company does not currently intend to settle any RSUs in cash. During the vesting period, RSU award recipients are eligible to receive dividend equivalents, but do not participate in the voting rights granted to the holders of the underlying class A common stock. The company discontinued granting RSAs in fiscal 2016 but will continue to grant RSUs under the EIP.
The fair value and compensation cost before estimated forfeitures for RSAs and RSUs is calculated using the closing price of class A common stock on the date of grant. The weighted-average grant-date fair value of RSAs granted during fiscal 2015 was $63.71. No RSAs were granted during fiscal 2017 and 2016. The weighted-average grant-date fair value of RSUs granted during fiscal 2017, 2016 and 2015 was $81.67, $79.77 and $62.88, respectively. The total grant-date fair value of RSAs and RSUs vested during fiscal 2017, 2016 and 2015 was $163 million, $142 million and $132 million, respectively.
97
The following table summarizes the Company's RSA and RSU activity for fiscal 2017:
Restricted Stock | Weighted- Average Grant Date Fair Value | Weighted- Average Remaining Contractual Term (in years) | Aggregate Intrinsic Value (1) (in millions) | ||||||||||||||||||
Awards | Units | RSA | RSU | RSA | RSU | RSA | RSU | ||||||||||||||
Outstanding at October 1, 2016 | 1,766,582 | 3,146,954 | $ | 59.26 | $ | 75.48 | |||||||||||||||
Granted | — | 3,268,327 | $ | — | $ | 81.67 | |||||||||||||||
Vested | (1,210,176 | ) | (1,299,187 | ) | $ | 57.37 | $ | 72.20 | |||||||||||||
Forfeited | (90,399 | ) | (442,393 | ) | $ | 61.90 | $ | 79.34 | |||||||||||||
Outstanding at September 30, 2017 | 466,007 | 4,673,701 | $ | 63.37 | $ | 80.37 | 0.2 | 1.6 | $49 | $492 | |||||||||||
(1) | Calculated by multiplying the closing stock price on the last trading day of fiscal 2017 of $105.24 by the number of instruments. |
At September 30, 2017, there was $7 million and $215 million of total unrecognized compensation cost related to unvested RSAs and RSUs, respectively, which is expected to be recognized over a weighted-average period of approximately 0.2 years for RSAs and 1.6 years for RSUs.
Performance-based Shares
The following table summarizes the maximum number of performance-based shares which could be earned and related activity for fiscal 2017:
Shares | Weighted- Average Grant Date Fair Value | Weighted- Average Remaining Contractual Term (in years) | Aggregate Intrinsic Value (1) (in millions) | |||||||
Outstanding at October 1, 2016 | 1,042,012 | $ | 78.24 | |||||||
Granted(2) | 634,651 | $ | 86.37 | |||||||
Vested and earned | (345,797 | ) | $ | 72.50 | ||||||
Unearned | (97,531 | ) | $ | 72.50 | ||||||
Forfeited | (295,660 | ) | $ | 85.13 | ||||||
Outstanding at September 30, 2017 | 937,675 | $ | 84.20 | 1.0 | $98 | |||||
(1) | Calculated by multiplying the closing stock price on the last trading day of fiscal 2017 of $105.24 by the number of instruments. |
(2) | Represents the maximum number of performance-based shares which could be earned. |
For the Company's performance-based shares, in addition to service conditions, the ultimate number of shares to be earned depends on the achievement of both performance and market conditions. The performance condition is based on the Company's earnings per share target. The market condition is based on the Company's total shareholder return ranked against that of other companies that are included in the Standard & Poor's 500 Index. The fair value of the performance-based shares, incorporating the market condition, is estimated on the grant date using a Monte Carlo simulation model. The grant-date fair value of performance-based shares granted in fiscal 2017, 2016 and 2015 was $86.37, $92.71 and $69.78 per share, respectively. Earned performance shares granted in fiscal 2017, 2016 and 2015 vest approximately three years from the initial grant date. All performance awards are subject to earlier vesting in full under certain conditions.
Compensation cost for performance-based shares is initially estimated based on target performance. It is recorded net of estimated forfeitures and adjusted as appropriate throughout the performance period. At September 30, 2017, there was $33 million of total unrecognized compensation cost related to unvested performance-based shares, which is expected to be recognized over a weighted-average period of approximately 1.0 years.
98
Employee Stock Purchase Plan
In January 2015, the Company's class A stockholders approved the Visa Inc. Employee Stock Purchase Plan (the “ESPP”), under which substantially all employees are eligible to participate. The ESPP permits eligible employees to purchase the Company’s class A common stock at a 15% discount of the stock price on the purchase date, subject to certain restrictions. A total of 20 million shares of class A common stock have been reserved for issuance under the ESPP. The first offering date was April 1, 2015. ESPP did not have a material impact on the consolidated financial statements in fiscal 2017, 2016 or 2015.
Note 16—Commitments and Contingencies
Commitments. The Company leases certain premises and equipment throughout the world with varying expiration dates. The Company incurred total rent expense of $159 million, $134 million and $136 million in fiscal 2017, 2016 and 2015, respectively. Future minimum payments on leases, and marketing and sponsorship agreements per fiscal year, at September 30, 2017, are as follows:
2018 | 2019 | 2020 | 2021 | 2022 | Thereafter | Total | |||||||||||||||||||||
(in millions) | |||||||||||||||||||||||||||
Operating leases | $ | 155 | $ | 119 | $ | 68 | $ | 64 | $ | 57 | $ | 163 | $ | 626 | |||||||||||||
Marketing and sponsorships | 124 | 123 | 112 | 40 | 33 | — | 432 | ||||||||||||||||||||
Total | $ | 279 | $ | 242 | $ | 180 | $ | 104 | $ | 90 | $ | 163 | $ | 1,058 | |||||||||||||
Select sponsorship agreements require the Company to spend certain minimum amounts for advertising and marketing promotion over the life of the contract. For commitments where the individual years of spend are not specified in the contract, the Company has estimated the timing of when these amounts will be spent. In addition to the fixed payments stated above, select sponsorship agreements require the Company to undertake marketing, promotional or other activities up to stated monetary values to support events which the Company is sponsoring. The stated monetary value of these activities typically represents the value in the marketplace, which may be significantly higher than the actual costs incurred by the Company.
Client incentives. The Company has agreements with financial institution clients and other business partners for various programs designed to build payments volume, increase Visa product acceptance and win merchant routing transactions. These agreements, with terms ranging from one year to sixteen years, can provide card issuance and/or conversion support, volume/growth targets and marketing and program support based on specific performance requirements.
Client incentives are recognized primarily as a reduction to operating revenue in the period the related volumes and transactions occur, based on management's estimate of the client's performance in accordance with the terms of the incentive agreement. The agreements may or may not limit the amount of client incentive payments.
The table below sets forth the estimated expected future reduction of revenue per fiscal year for client incentive agreements in effect at September 30, 2017:
(in millions) | 2018 | 2019 | 2020 | 2021 | 2022 | Thereafter | Total | ||||||||||||||||||||
Client incentives | $ | 5,049 | $ | 4,654 | $ | 4,117 | $ | 3,658 | $ | 3,102 | $ | 5,080 | $ | 25,660 | |||||||||||||
The amount of client incentives that will be recorded as a reduction of revenue in future periods under the Company's incentive agreements is unknowable due to the inherent unpredictability of payment and transaction volume, and will likely change materially from the estimates above due to changes in performance expectations, actual client performance, amendments to existing contracts or the execution of new contracts. Increases in client incentive payments are generally driven by increases in payment and transaction volume and hence, an associated increase in revenue. As a result, in the event client incentives exceed the above estimates, it is not expected to have a material effect on the Company's financial condition, results of operations or cash flows.
99
Deferred purchase consideration. On June 21, 2016, the Company acquired 100% of the share capital of Visa Europe. In connection with the purchase, the Company will pay an additional €1.0 billion, plus 4% compound annual interest, on the third anniversary of the Closing. See Note 2—Visa Europe.
Note 17—Related Parties
Visa considers an entity to be a related party for purposes of this disclosure if that entity owns more than 10% of Visa’s total voting common stock at the end of the fiscal year, or if an officer or employee of that entity also serves on the Company's board of directors. The Company considers an investee to be a related party if the Company’s: (i) ownership interest in the investee is greater than or equal to 10% or (ii) if the investment is accounted for under the equity method of accounting. At September 30, 2017 and 2016, no entity owned more than 10% of the Company’s total voting common stock. There were no significant transactions with related parties during fiscal 2017, 2016 and 2015.
Note 18—Income Taxes
The Company’s income before taxes by fiscal year consisted of the following:
2017 | 2016 | 2015 | |||||||||
(in millions) | |||||||||||
U.S. | $ | 8,440 | $ | 5,839 | $ | 7,214 | |||||
Non-U.S. | 3,254 | 2,173 | 1,781 | ||||||||
Total income before taxes | $ | 11,694 | $ | 8,012 | $ | 8,995 | |||||
U.S. income before taxes included $2.9 billion, $2.5 billion and $2.4 billion of the Company's U.S. entities' income from operations outside of the U.S. for fiscal 2017, 2016 and 2015, respectively.
Income tax provision by fiscal year consisted of the following:
2017 | 2016 | 2015 | |||||||||
(in millions) | |||||||||||
Current: | |||||||||||
U.S. federal | $ | 2,377 | $ | 2,250 | $ | 1,991 | |||||
State and local | 291 | 181 | 168 | ||||||||
Non-U.S. | 629 | 368 | 300 | ||||||||
Total current taxes | 3,297 | 2,799 | 2,459 | ||||||||
Deferred: | |||||||||||
U.S. federal | 1,607 | (508 | ) | 181 | |||||||
State and local | 66 | (63 | ) | 1 | |||||||
Non-U.S. | 25 | (207 | ) | 26 | |||||||
Total deferred taxes | 1,698 | (778 | ) | 208 | |||||||
Total income tax provision | $ | 4,995 | $ | 2,021 | $ | 2,667 | |||||
100
The tax effect of temporary differences that give rise to significant portions of deferred tax assets and liabilities at September 30, 2017 and 2016, are presented below:
2017 | 2016 | ||||||
(in millions) | |||||||
Deferred Tax Assets: | |||||||
Accrued compensation and benefits | $ | 194 | $ | 277 | |||
Comprehensive loss | 29 | 106 | |||||
Accrued litigation obligation | 373 | 373 | |||||
Client incentives | 272 | 266 | |||||
Net operating loss carryforwards | 45 | 32 | |||||
Federal benefit of state taxes | 236 | 195 | |||||
Federal benefit of foreign taxes | — | 1,214 | |||||
Other | 193 | 280 | |||||
Valuation allowance | (35 | ) | (31 | ) | |||
Deferred tax assets | 1,307 | 2,712 | |||||
Deferred Tax Liabilities: | |||||||
Property, equipment and technology, net | (391 | ) | (278 | ) | |||
Intangible assets | (6,756 | ) | (7,013 | ) | |||
Foreign taxes | (59 | ) | (106 | ) | |||
Other | — | (101 | ) | ||||
Deferred tax liabilities | (7,206 | ) | (7,498 | ) | |||
Net deferred tax liabilities | $ | (5,899 | ) | $ | (4,786 | ) | |
In February 2017, the Company completed a reorganization of Visa Europe and certain other legal entities to align the Company's corporate structure to the geographic jurisdictions in which it conducts business operations. As a result of the reorganization, the Company recorded a $1.5 billion non-recurring, non-cash income tax provision primarily related to the elimination of deferred tax balances originally recognized upon the acquisition of Visa Europe in fiscal 2016. The increase in net deferred tax liabilities reflects the elimination of the deferred tax balances.
At September 30, 2017 and 2016, net deferred tax assets of $81 million and $22 million, respectively, are reflected in other assets on the consolidated balance sheets.
In assessing the realizability of deferred tax assets, management considers whether it is more likely than not that all or some portion of the deferred tax assets will not be realized. The ultimate realization of the deferred tax assets is dependent upon the generation of future taxable income during the periods in which those temporary differences are deductible. The fiscal 2017 and 2016 valuation allowances relate primarily to foreign net operating losses from subsidiaries acquired in recent years.
As of September 30, 2017, the Company had $42 million federal, $27 million state and $140 million foreign net operating loss carryforwards. The federal and state net operating loss carryforwards will expire in fiscal 2026 through 2037. The foreign net operating loss may be carried forward indefinitely. The Company expects to fully utilize the federal and state net operating loss carryforwards in future years.
As of September 30, 2017, the Company had $30 million of federal foreign tax credit carryforwards, which will expire in fiscal 2027. The Company expects to realize the benefit of the credit carryforwards in future years.
101
The income tax provision differs from the amount of income tax determined by applying the applicable U.S. federal statutory rate of 35% to pretax income, as a result of the following:
For the Years Ended September 30, | ||||||||||||||||||||
2017 | 2016 | 2015 | ||||||||||||||||||
Dollars | Percent | Dollars | Percent | Dollars | Percent | |||||||||||||||
(in millions, except percentages) | ||||||||||||||||||||
U.S. federal income tax at statutory rate | $ | 4,093 | 35 | % | $ | 2,804 | 35 | % | $ | 3,148 | 35 | % | ||||||||
State income taxes, net of federal benefit | 200 | 2 | % | 135 | 2 | % | 194 | 2 | % | |||||||||||
Non-U.S. tax effect, net of federal benefit | (641 | ) | (5 | )% | (553 | ) | (7 | )% | (327 | ) | (4 | )% | ||||||||
Reorganization of Visa Europe and other legal entities | 1,515 | 13 | % | — | — | % | — | — | % | |||||||||||
Remeasurement of deferred tax liability | — | — | % | (88 | ) | (1 | )% | — | — | % | ||||||||||
Reversal of prior years tax reserves related to the resolution of uncertain tax positions | — | — | % | — | — | % | (239 | ) | (2 | )% | ||||||||||
Revaluation of Visa Europe put option | — | — | % | (89 | ) | (1 | )% | — | — | % | ||||||||||
Other, net | (172 | ) | (2 | )% | (188 | ) | (3 | )% | (109 | ) | (1 | )% | ||||||||
Income tax provision | $ | 4,995 | 43 | % | $ | 2,021 | 25 | % | $ | 2,667 | 30 | % | ||||||||
As mentioned above, the February 2017 reorganization of Visa Europe and certain other legal entities resulted in a non-recurring, non-cash income tax provision of $1.5 billion primarily related to the elimination of deferred tax balances. Associated with this reorganization, the newly-formed Visa Foundation received all Visa Inc. shares held by Visa Europe that were previously recorded as treasury stock.
The effective income tax rate was 43% in fiscal 2017 and 25% in fiscal 2016. The effective tax rate in fiscal 2017 differs from the effective tax rate in fiscal 2016 primarily due to:
• | the aforementioned $1.5 billion non-recurring, non-cash income tax provision related to the legal entity reorganization recorded in fiscal 2017; |
• | $71 million tax benefit related to Visa Foundation's receipt of Visa Inc. shares mentioned above, recorded in fiscal 2017; |
• | $70 million of excess tax benefits related to share-based payments recorded in fiscal 2017, as a result of the early adoption of Accounting Standards Update 2016-09. See Note 1—Summary of Significant Accounting Policies; and |
• | the absence of: |
▪ | the effect of one-time items related to the Visa Europe acquisition recorded during fiscal 2016, the most significant of which was the $1.9 billion U.S. loss related to the effective settlement of the Framework Agreement between Visa and Visa Europe. These one-time items impacted the geographic mix of global income, resulting in a reduced effective tax rate in fiscal 2016; |
▪ | an $88 million one-time tax benefit due to the remeasurement of deferred tax liabilities as a result of the reduction in the UK tax rate enacted in fiscal 2016; and |
▪ | the non-taxable $255 million revaluation of the Visa Europe put option recorded in fiscal 2016. |
The effective income tax rate was 25% in fiscal 2016 and 30% in fiscal 2015. The effective tax rate in fiscal 2016 differs from the effective tax rate in fiscal 2015 primarily due to:
• | the effect of one-time items related to the Visa Europe acquisition, as mentioned above, that impacted the geographic mix of global income resulting in a reduced effective tax rate in fiscal 2016; |
• | an $88 million one-time tax benefit due to the remeasurement of deferred tax liabilities as a result of the reduction in the UK tax rate enacted in fiscal 2016; |
• | the non-taxable $255 million revaluation of the Visa Europe put option recorded in fiscal 2016; and |
• | the absence of a $296 million tax benefit recognized in fiscal 2015 resulting from the resolution of uncertain tax positions with taxing authorities. Included in the $296 million was a one-time $239 million tax benefit that related to prior fiscal years. |
102
Current income taxes receivable were $148 million and $232 million at September 30, 2017 and 2016, respectively. Non-current income taxes receivable of $755 million and $731 million were included in other assets at September 30, 2017 and 2016, respectively. At September 30, 2017 and 2016, income taxes payable of $243 million and $153 million, respectively, were included in accrued income taxes as part of accrued liabilities, and accrued income taxes of $1.1 billion and $911 million, respectively, were included in other long-term liabilities. See Note 7—Accrued and Other Liabilities.
Cumulative undistributed earnings of the Company’s international subsidiaries that are intended to be reinvested indefinitely outside the United States amounted to $12.9 billion at September 30, 2017. The amount of income taxes that would have resulted had such earnings been repatriated is not practicably determinable.
The Company’s largest operating hub outside the United States is located in Singapore. It operates under a tax incentive agreement which is effective through September 30, 2023, and is conditional upon meeting certain business operations and employment thresholds in Singapore. The tax incentive agreement decreased Singapore tax by $252 million, $235 million and $192 million, and the benefit of the tax incentive agreement on diluted earnings per share was $0.11, $0.10 and $0.08 in fiscal 2017, 2016 and 2015, respectively.
In accordance with Accounting Standards Codification 740—Income Taxes, the Company is required to inventory, evaluate and measure all uncertain tax positions taken or to be taken on tax returns, and to record liabilities for the amount of such positions that may not be sustained, or may only partially be sustained, upon examination by the relevant taxing authorities.
At September 30, 2017 and 2016, the Company’s total gross unrecognized tax benefits were $1.4 billion and $1.2 billion, respectively, exclusive of interest and penalties described below. Included in the $1.4 billion and $1.2 billion are $1.1 billion and $926 million of unrecognized tax benefits, respectively, that if recognized, would reduce the effective tax rate in a future period.
A reconciliation of beginning and ending unrecognized tax benefits by fiscal year is as follows:
2017 | 2016 | ||||||
(in millions) | |||||||
Beginning balance at October 1 | $ | 1,160 | $ | 1,051 | |||
Increases of unrecognized tax benefits related to prior years | 56 | 153 | |||||
Decreases of unrecognized tax benefits related to prior years | (59 | ) | (180 | ) | |||
Increases of unrecognized tax benefits related to current year | 197 | 138 | |||||
Reductions related to lapsing statute of limitations | (1 | ) | (2 | ) | |||
Ending balance at September 30 | $ | 1,353 | $ | 1,160 | |||
It is the Company’s policy to account for interest expense and penalties related to uncertain tax positions in non-operating expense in its consolidated statements of operations. The Company recognized $23 million and $15 million of interest expense in fiscal 2017 and 2016, respectively, and reversed $6 million of interest expense in fiscal 2015, related to uncertain tax positions. The Company accrued $1 million, $3 million and $1 million of penalties in fiscal 2017, 2016 and 2015, respectively, related to uncertain tax positions. At September 30, 2017 and 2016, the Company had accrued interest of $84 million and $61 million, respectively, and accrued penalties of $34 million and $17 million, respectively, related to uncertain tax positions in its other long-term liabilities. At September 30, 2017 and 2016, accrued interest and penalties balances included amounts related to the Visa Europe acquisition and measurement period adjustments.
103
The Company's fiscal 2009 through 2012 U.S. federal income tax returns are currently under Internal Revenue Service (IRS) examination. The Company has filed a federal refund claim for fiscal year 2008, which is also currently under IRS examination. Except for the refund claim, the federal statutes of limitations have expired for fiscal years prior to 2009. The Company's fiscal years 2006 through 2011 California tax returns are currently under examination. The California statutes of limitations have expired for fiscal years prior to 2006.
During fiscal 2013, the Canada Revenue Agency (CRA) completed its examination of the Company's fiscal 2003 through 2009 Canadian tax returns and proposed certain assessments. Based on the findings of its examination, the CRA also proposed certain assessments to the Company's fiscal 2010 through 2016 Canadian tax returns. The Company filed notices of objection against these assessments and, in fiscal 2015, completed the appeals process without reaching a settlement with the CRA. In April 2016, the Company petitioned the Tax Court of Canada to overturn the CRA's assessments. Legal proceedings continue to be in progress. The Company continues to believe that its income tax provision adequately reflects its obligations to the CRA.
The Company is also subject to examinations by various state and foreign tax authorities. All material state and foreign tax matters have been concluded for years through fiscal 2002. The timing and outcome of the final resolutions of the federal, state and foreign tax examinations and refund claims are uncertain. As such, it is not reasonably possible to estimate the impact that the final outcomes could have on the Company's unrecognized tax benefits in the next 12 months.
Note 19—Legal Matters
The Company is party to various legal and regulatory proceedings. Some of these proceedings involve complex claims that are subject to substantial uncertainties and unascertainable damages. Accordingly, except as disclosed, the Company has not established reserves or ranges of possible loss related to these proceedings, as at this time in the proceedings, the matters do not relate to a probable loss and/or the amount or range of losses are not reasonably estimable. Although the Company believes that it has strong defenses for the litigation and regulatory proceedings described below, it could, in the future, incur judgments or fines or enter into settlements of claims that could have a material adverse effect on the Company's financial position, results of operations or cash flows. From time to time, the Company may engage in settlement discussions or mediations with respect to one or more of its outstanding litigation matters, either on its own behalf or collectively with other parties.
The litigation accrual is an estimate and is based on management's understanding of its litigation profile, the specifics of each case, advice of counsel to the extent appropriate and management's best estimate of incurred loss as of the balance sheet date.
The following table summarizes the activity related to accrued litigation.
Fiscal 2017 | Fiscal 2016 | ||||||
(in millions) | |||||||
Balance at October 1 | $ | 981 | $ | 1,024 | |||
Provision for uncovered legal matters | 19 | 2 | |||||
Accrual for VE territory covered litigation | 186 | 2 | |||||
Payments on legal matters | (204 | ) | (47 | ) | |||
Balance at September 30 | $ | 982 | $ | 981 | |||
104
Accrual Summary—U.S. Covered Litigation
Visa Inc., Visa U.S.A. and Visa International are parties to certain legal proceedings that are covered by the U.S. retrospective responsibility plan, which the Company refers to as the U.S. covered litigation. See Note 3—U.S. and Europe Retrospective Responsibility Plans. An accrual for the U.S. covered litigation and a charge to the litigation provision are recorded when loss is deemed to be probable and reasonably estimable. In making this determination, the Company evaluates available information, including but not limited to actions taken by the litigation committee. The total accrual related to the U.S. covered litigation could be either higher or lower than the escrow account balance.
The following table summarizes the activity related to U.S. covered litigation.
Fiscal 2017 | Fiscal 2016 | ||||||
(in millions) | |||||||
Balance at October 1 | $ | 978 | $ | 1,023 | |||
Payments on U.S. covered litigation | — | (45 | ) | ||||
Balance at September 30 | $ | 978 | $ | 978 | |||
On January 14, 2014, the MDL 1720 court entered a final judgment order approving a settlement with class plaintiffs in the interchange multidistrict litigation proceedings. As a result of appeals brought by certain merchants, however, the final judgment order was reversed by the court of appeals on June 30, 2016, and the case was remanded to the MDL 1720 court for further proceedings. Subsequently, on March 3, 2017, the MDL 1720 court ordered, among other things, that the deadline to terminate the class settlement agreement be modified to extend indefinitely and that the settlement funds continue to be administered by the settlement escrow agent until such time as the settlement agreement is finally terminated. See further discussion below under Interchange Multidistrict Litigation (MDL) – Putative Class Actions. Visa initially made a payment of approximately $4.0 billion from the U.S. litigation escrow account into the settlement fund pursuant to the class settlement agreement. Thereafter, on January 27, 2014, Visa received and deposited into the Company's U.S. litigation escrow account "takedown payments" of approximately $1.1 billion, which Visa was entitled to receive under the class settlement agreement based on payment card sales volume attributable to merchants who opted out of the 2012 class settlement agreement. The deposit into the U.S. litigation escrow account and a related increase in accrued litigation to address "opt-out" claims were recorded in the second quarter of fiscal 2014. An additional accrual of $450 million associated with these opt-out claims was recorded in the fourth quarter of fiscal 2014. Payments totaling $528 million were made from fiscal 2014 through 2017 from the U.S. litigation escrow account reflecting settlements with a number of individual merchants that had opted out of the class settlement, resulting in an accrued balance of $978 million related to U.S. covered litigation as of September 30, 2017. See further discussion below under Interchange Multidistrict Litigation (MDL) – Individual Merchant Actions and Note 3—U.S. and Europe Retrospective Responsibility Plans.
Accrual Summary—VE Territory Covered Litigation
Visa Inc., Visa International and Visa Europe are parties to certain legal proceedings that are covered by the Europe retrospective responsibility plan. Unlike the U.S. retrospective responsibility plan, the Europe retrospective responsibility plan does not have an escrow account that is used to fund settlements or judgments. The Company is entitled to recover VE territory covered losses through a periodic adjustment to the conversion rates applicable to the UK&I preferred stock and Europe preferred stock. An accrual for the VE territory covered losses and a reduction to stockholders' equity will be recorded when the loss is deemed to be probable and reasonably estimable. See further discussion below under VE Territory Covered Litigation and Note 3—U.S. and Europe Retrospective Responsibility Plans.
105
The following table summarizes the activity related to VE territory covered litigation.
Fiscal 2017 | Fiscal 2016 | ||||||
(in millions) | |||||||
Balance at October 1 | $ | 2 | $ | — | |||
Accrual for VE territory covered litigation | 186 | 2 | |||||
Payments on VE territory covered litigation | (187 | ) | — | ||||
Balance at September 30 | $ | 1 | $ | 2 | |||
U.S. Covered Litigation
Interchange Multidistrict Litigation (MDL) – Putative Class Actions
Beginning in May 2005, a series of complaints (the majority of which were styled as class actions) were filed in U.S. federal district courts by merchants against Visa U.S.A., Visa International and/or MasterCard, and in some cases, certain Visa member financial institutions. The complaints challenged, among other things, Visa's and MasterCard's purported setting of interchange reimbursement fees, their "no surcharge" rules, and alleged tying and bundling of transaction fees under the federal antitrust laws, and, in some cases, certain state unfair competition laws. The Judicial Panel on Multidistrict Litigation issued an order transferring the cases to the U.S. District Court for the Eastern District of New York for coordination of pre-trial proceedings in MDL 1720. A group of purported class plaintiffs subsequently filed a Second Consolidated Amended Class Action Complaint which, together with the complaints brought by individual merchants, sought money damages alleged to range in the tens of billions of dollars (subject to trebling), as well as attorneys' fees and injunctive relief. The class plaintiffs also filed a Second Supplemental Class Action Complaint against Visa Inc. and certain member financial institutions challenging Visa's reorganization and IPO under the antitrust laws and seeking unspecified money damages and declaratory and injunctive relief, including an order that the IPO be unwound.
The Company and certain individual merchants whose claims were consolidated with the MDL signed a settlement agreement to resolve their claims against the Company for approximately $350 million. This payment was made from the U.S. litigation escrow account on October 29, 2012, and the court has dismissed those claims with prejudice.
In addition, Visa Inc., Visa U.S.A., Visa International, MasterCard Incorporated, MasterCard International Incorporated, various U.S. financial institution defendants, and the class plaintiffs signed a settlement agreement (the "2012 Settlement Agreement") to resolve the class plaintiffs' claims. The terms of the 2012 Settlement Agreement included, among other terms, (1) a comprehensive release of claims asserted in the litigation and protection against future litigation regarding default interchange and other U.S. rules; (2) settlement payments from the Company of approximately $4.0 billion and a further distribution of 10 basis points of default interchange for an eight-month period; (3) certain modifications to the Company's rules, including modifications to permit surcharging on credit transactions under certain circumstances; and (4) the Company's agreement to meet with merchant buying groups that seek to collectively negotiate interchange rates. On December 10, 2012, Visa paid approximately $4.0 billion from the U.S. litigation escrow account into a settlement fund established pursuant to the 2012 Settlement Agreement.
On January 14, 2014, the court entered a final judgment order approving the settlement, from which a number of objectors appealed. On June 30, 2016, the U.S. Court of Appeals for the Second Circuit vacated the lower court's certification of the merchant class and reversed the approval of the settlement. The Second Circuit determined that the class plaintiffs were inadequately represented, and remanded the case to the lower court for further proceedings not inconsistent with its decision. On November 23, 2016, class plaintiffs that signed the 2012 Settlement Agreement filed a petition for writ of certiorari with the U.S. Supreme Court seeking review of the Second Circuit's decision. The Supreme Court denied the petition on March 27, 2017.
106
On November 30, 2016, the district court entered an order appointing interim counsel for two putative classes of plaintiffs, a “Damages Class” and an “Injunctive Relief Class.” Following the district court’s order, on February 8, 2017, plaintiffs purporting to act on behalf of the putative Damages Class sought leave to file a Third Consolidated Amended Class Action Complaint. The complaint sought money damages alleged to range in the tens of billions of dollars (subject to trebling), as well as attorneys' fees and injunctive relief, and named as defendants Visa Inc., Visa U.S.A., Visa International, MasterCard Incorporated and MasterCard International Incorporated, and certain U.S. financial institutions. The plaintiffs asserted that the proposed complaint updated, among other things, claims for damages and accounted for industry developments. Defendants opposed the Damages Class plaintiffs’ motion on March 10, 2017. On September 27, 2017, the magistrate judge granted in part and denied in part the motion seeking leave to amend the complaint, and plaintiffs objected to the portions of the magistrate judge's order denying their motion on October 23, 2017. Plaintiffs filed the Third Consolidated Amended Class Action Complaint on October 27, 2017.
A new group of purported class plaintiffs, acting on behalf of the putative Injunctive Relief Class, filed a class action complaint seeking declaratory and injunctive relief, as well as attorneys’ fees. That complaint seeks, among other things, an injunction against: the setting of default interchange rates; certain Visa rules relating to merchants, including the honor-all-cards rule; and various transaction fees, including the fixed acquirer network fee. The complaint names as defendants Visa Inc., MasterCard Incorporated and MasterCard International Incorporated, and certain U.S. financial institutions.
The putative class actions are considered U.S. covered litigation for purposes of the U.S. retrospective responsibility plan. See Note 3—U.S. and Europe Retrospective Responsibility Plans.
Interchange Multidistrict Litigation (MDL) – Individual Merchant Actions
Beginning in May 2013, more than 50 cases have been filed in various federal district courts by hundreds of merchants who had opted out of the damages portion of the 2012 Settlement Agreement, generally pursuing damages claims on allegations similar to those raised in MDL 1720. A number of the cases also include allegations that Visa has monopolized, attempted to monopolize, and/or conspired to monopolize debit card-related market segments. In addition, some of the cases seek an injunction against the setting of default interchange rates; certain Visa rules relating to merchants, including the honor-all-cards rule; and various transaction fees, including the fixed acquirer network fee. One merchant's complaint also asserts that Visa, MasterCard and their member banks conspired to prevent the adoption of chip-and-PIN authentication in the U.S. or otherwise circumvent competition in the debit market. The cases name as defendants Visa Inc., Visa U.S.A., Visa International, MasterCard Incorporated and MasterCard International Incorporated, although some also include certain U.S. financial institutions as defendants. Wal-Mart Stores Inc. and its subsidiaries filed a complaint that also adds Visa Europe Limited and Visa Europe Services Inc. as defendants.
Beginning on February 8, 2017, certain individual merchants filed motions in existing actions in MDL 1720 requesting leave to amend their complaints. The proposed amended complaints, among other things, added claims for injunctive relief and updated claims for damages. As with the Damages Class’s motion, the magistrate judge granted in part and denied in part the motions seeking leave to amend these complaints and, on October 23, 2017, these plaintiffs also objected to the portion of the magistrate judge's order denying their motions. The individual merchants then filed the amended complaints on October 27, 2017. In addition, certain individual merchants have filed new actions in federal court which were subsequently included in MDL 1720.
In addition to the cases filed by individual merchants, Visa, MasterCard, and certain U.S. financial institution defendants in MDL 1720 filed a complaint in the Eastern District of New York against certain named class representative plaintiffs who had opted out or stated their intention to opt out of the damages portion of the 2012 Settlement Agreement. In addition, Visa filed three more similar complaints in the Eastern District of New York against Wal-Mart Stores Inc.; against The Home Depot, Inc. and Home Depot U.S.A.; and against Sears Holdings Corporation. All four complaints seek a declaration that, from January 1, 2004 to November 27, 2012, the time period for which opt-outs could seek damages under the 2012 Settlement Agreement, Visa's conduct in, among other things, continuing to set default interchange rates, maintaining its "honor all cards" rule, enforcing certain rules relating to merchants, and restructuring itself, did not violate federal or state antitrust laws.
107
All the cases filed in federal court have been either assigned to the judge presiding over MDL 1720, or have been transferred or are being considered for transfer by the Judicial Panel on Multidistrict Litigation for inclusion in MDL 1720. The court has entered an order confirming that In re Payment Card Interchange Fee and Merchant Discount Antitrust Litigation, 1:05-md-01720-JG-JO (E.D.N.Y.), includes (1) all current and future actions transferred to MDL 1720 by the Judicial Panel on Multidistrict Litigation or other order of any court for inclusion in coordinated or pretrial proceedings, and (2) all actions filed in the Eastern District of New York that arise out of operative facts as alleged in the cases subject to the transfer orders of the Judicial Panel on Multidistrict Litigation. Cases that have been transferred to or otherwise included in MDL 1720 are U.S. covered litigation for purposes of the U.S. retrospective responsibility plan, unless otherwise noted. See Note 3—U.S. and Europe Retrospective Responsibility Plans.
A number of individual merchant actions previously filed have been settled, and remain settled. In addition, following the automatic termination of the settlement agreement with Wal-Mart Stores Inc., Visa and Wal-Mart Stores Inc. entered into a new, unconditional settlement agreement on October 31, 2017. Consequently, as of the filing date, Visa has reached settlement agreements with individual merchants representing approximately 51% of the Visa-branded payment card sales volume of merchants who opted out of the 2012 Settlement Agreement.
Finally, certain merchants filed actions in state courts, generally pursuing claims on allegations similar to those raised in MDL 1720. On July 12, 2016, Broadway Grill, Inc. ("Broadway Grill"), on behalf of itself and a putative class of California merchants that have accepted Visa-branded cards since January 1, 2004, filed a lawsuit against Visa Inc., Visa International and Visa U.S.A. in California state court. On February 17, 2017, a merchant filed a case in Texas state court. Both cases were subsequently removed from their respective state courts to federal district courts and, thereafter, the Judicial Panel on Multidistrict Litigation issued orders transferring the cases to MDL 1720. Both matters are U.S. covered litigation for purposes of the U.S. retrospective responsibility plan. See Note 3—U.S. and Europe Retrospective Responsibility Plans.
While the Company believes that it has substantial defenses in these matters, the final outcome of individual legal claims is inherently unpredictable. The Company could incur judgments, enter into settlements or revise its expectations regarding the outcome of individual merchant claims, and such developments could have a material adverse effect on the Company's financial results in the period in which the effect becomes probable and reasonably estimable.
VE Territory Covered Litigation
UK Merchant Litigation
Since July 2013, in excess of 300 Merchants (the capitalized term "Merchant," when used in this section, means a merchant together with subsidiary/affiliate companies that are party to the same claim) have commenced proceedings against Visa Europe, Visa Inc. and Visa International relating to interchange rates in Europe. They seek damages for alleged anti-competitive conduct in relation to one or more of the following types of interchange fees for credit and debit card transactions: UK domestic, Irish domestic, other European domestic, intra-European Economic Area and/or other inter-regional. As of the filing date, Visa Europe, Visa Inc. and Visa International have settled the claims asserted by over 75 Merchants, leaving more than 200 Merchants with outstanding claims.
In November 2016, a trial commenced relating to claims filed by a number of Merchants. All of these Merchants except one settled before the trial concluded in March 2017. A decision is pending with respect to that remaining Merchant. If the Merchant prevails, the amount of any loss it suffered will be determined in a separate trial in the future.
In addition, over 30 additional Merchants have threatened to commence similar proceedings. Standstill agreements have been entered into with respect to some of those Merchants’ claims. While the amount of interchange being challenged could be substantial, these claims have not yet been filed and their full scope is not yet known. The Company has learned that several additional European entities have indicated that they may also bring similar claims and the Company anticipates additional claims in the future.
The full scope of damages is not yet known because not all Merchant claims have been served and Visa has substantial defenses. However, the total damages sought in the outstanding claims that have been issued, served and/or preserved likely amounts to more than one billion dollars.
108
Other Litigation
European Commission Proceedings
Inter-regional Interchange Investigation. Following the issuance of a Statement of Objections in 2009 concerning, among other things, the alleged default application of Visa Inc.'s inter-regional interchange fees to intra-regional and domestic consumer debit and credit card transactions in the European Economic Area (EEA), the European Commission (EC) served a Supplementary Statement of Objections (SSO) on Visa Inc. and Visa International in 2013 and a revised SSO in August 2017. The revised SSO concerns only the application of Visa Inc.'s inter-regional interchange fees to transactions involving Visa consumer debit and credit cards issued outside of the Visa Europe region and used at merchants located within the EEA. The EC continues to claim that inter-regional interchange fees violate EEA competition law and may impose fines in the event that it adopts an infringement decision. The potential amount of any fine cannot be estimated at this time. The Commission may also require Visa to reduce the default inter-regional interchange rates the Company sets, revise the Visa rules or the way in which the Company enforces its rules, or otherwise modify the way the Company does business.
All issues relating to intra-regional or domestic consumer debit and credit card transactions acquired in the EEA were settled by commitments offered by Visa Europe Limited in 2010 and 2014 respectively, and endorsed by the EC. The debit commitments have expired, but the credit commitments apply until March 2018. Following its acquisition of Visa Europe Limited in June 2016, the credit commitments are binding upon Visa Inc.
DCC Investigation. In 2013, the EC opened an investigation against Visa Europe, based on a complaint alleging that Visa Europe's pricing of and rules relating to Dynamic Currency Conversion (DCC) transactions infringe EU competition rules. This investigation is pending.
Canadian Competition Proceedings
Merchant Litigation. Beginning in December 2010, a number of class action lawsuits were filed in Quebec, British Columbia, Ontario, Saskatchewan and Alberta against Visa Canada, MasterCard and ten financial institutions on behalf of merchants that accept payment by Visa and/or MasterCard credit cards. Three separate actions were filed (including one against Visa Canada Corporation and Visa Inc., two MasterCard entities and smaller Canadian issuing banks), but those three cases have been discontinued. The remaining cases allege a violation of Canada's price-fixing law and various common law claims based on separate Visa and MasterCard conspiracies in respect of default interchange and certain of the networks' rules. Five of the named financial institutions have now settled with the plaintiffs, and one of these settlements is awaiting court approval.
On March 26, 2014, the British Columbia Supreme Court, in one of the class action suits noted above, Watson v. Bank of America Corporation, et al., granted the plaintiff's application for class certification in part. On appeal from both the defendants and the plaintiff, the British Columbia Court of Appeal allowed the class proceedings to advance but limited the time period of plaintiff's main price-fixing claim to prior to March 2010. The related lawsuits in Ontario, Alberta, and Saskatchewan have effectively been stayed pending further proceedings in British Columbia. The Quebec case is proceeding to class authorization in November 2017.
On June 2, 2017, Visa executed an agreement with merchant class plaintiffs to settle, on a national basis, the active class actions filed in Quebec, British Columbia, Ontario, Saskatchewan and Alberta. The agreement is subject to final court approval across all of these provinces.
109
Data Pass Litigation
On November 19, 2010, a consumer filed an amended class action complaint against Webloyalty.com, Inc., Gamestop Corporation, and Visa Inc. in Connecticut federal district court, seeking damages, restitution and injunctive relief on the grounds that consumers who made online purchases at merchants were allegedly deceived into incurring charges for services from Webloyalty.com through the unauthorized passing of cardholder account information during the sales transaction ("data pass"), in violation of federal and state consumer protection statutes and common law. On October 15, 2015, the court dismissed the case in its entirety, without leave to replead. Plaintiff filed a notice of appeal on November 12, 2015. On December 20, 2016, the U.S. Court of Appeals for the Second Circuit affirmed the dismissal as to certain claims against Gamestop Corporation, Webloyalty.com, Inc. and Visa, vacated the dismissal as to certain claims against Webloyalty and Gamestop, and remanded the case to the district court for further proceedings on the remaining claims.
U.S. ATM Access Fee Litigation
National ATM Council Class Action. In October 2011, the National ATM Council and thirteen non-bank ATM operators filed a purported class action lawsuit against Visa (Visa Inc., Visa International, Visa U.S.A. and Plus System, Inc.) and MasterCard in the U.S. District Court for the District of Columbia. The complaint challenges Visa's rule (and a similar MasterCard rule) that if an ATM operator chooses to charge consumers an access fee for a Visa or Plus transaction, that fee cannot be greater than the access fee charged for transactions on other networks. Plaintiffs claim that the rule violates Section 1 of the Sherman Act, and seek treble damages, injunctive relief, and attorneys’ fees.
Consumer Class Actions. In October 2011, a purported consumer class action was filed against Visa and MasterCard in the same federal court challenging the same ATM access fee rules. Two other purported consumer class actions challenging the rules, later combined, were also filed in October 2011 in the same federal court naming Visa, MasterCard and three financial institutions as defendants. Plaintiffs seek treble damages, restitution, injunctive relief, and attorneys' fees where available under federal and state law, including under Section 1 of the Sherman Act and consumer protection statutes.
These cases are proceeding in the district court.
U.S. Department of Justice Civil Investigative Demand
On March 13, 2012, the Antitrust Division of the United States Department of Justice (the "Division") issued a Civil Investigative Demand, or "CID," to Visa Inc. seeking documents and information regarding a potential violation of Section 1 or 2 of the Sherman Act, 15 U.S.C. §§ 1, 2. The CID focuses on PIN-Authenticated Visa Debit and Visa's competitive responses to the Dodd-Frank Act, including Visa's fixed acquirer network fee. Visa is cooperating with the Division in connection with the CID.
Pulse Network
On November 25, 2014, Pulse Network LLC filed suit against Visa Inc. in federal district court in Texas. Pulse alleges that Visa has monopolized and attempted to monopolize debit card network services markets. Pulse also alleges that Visa has entered into agreements in restraint of trade, engaged in unlawful exclusive dealing and tying, violated the Texas Free Enterprise and Antitrust Act and engaged in tortious interference with prospective business relationships. Pulse seeks unspecified treble damages, attorneys' fees and injunctive relief, including to enjoin the fixed acquirer network fee structure, Visa's conduct regarding PIN-Authenticated Visa Debit and Visa agreements with merchants and acquirers relating to debit acceptance. On January 23, 2015, Visa filed a motion to dismiss the complaint. On December 17, 2015, the court denied Visa's motion to dismiss the complaint. On August 15, 2017, Visa moved for summary judgment.
New Mexico Attorney General
On December 23, 2014, a case was filed in New Mexico state court by New Mexico's attorney general on behalf of the state, state agencies and citizens of the state, generally pursuing claims on allegations similar to those raised in MDL 1720. On May 15, 2015, defendants filed a partial motion to dismiss, which the court granted in part; the court’s order, among other things, narrowed the state antitrust damages claims.
110
EMV Chip Liability Shift
Following their initial complaint filed on March 8, 2016, B&R Supermarket, Inc., d/b/a Milam's Market, and Grove Liquors LLC filed an amended class action complaint on July 15, 2016, against Visa Inc., Visa U.S.A., MasterCard, Discover, American Express, EMVCo and certain financial institutions in the U.S. District Court for the Northern District of California. The amended complaint asserts that defendants, through EMVCo, conspired to shift liability for fraudulent, faulty or otherwise rejected payment card transactions from defendants to the purported class of merchants, defined as those merchants throughout the United States who have been subjected to the "Liability Shift" since October 2015. Plaintiffs claim that the so-called "Liability Shift" violates Sections 1 and 3 of the Sherman Act and certain state laws, and seek treble damages, injunctive relief and attorneys' fees.
On September 30, 2016, the court granted motions to dismiss the amended complaint filed by EMVCo and the financial institution defendants, but denied motions to dismiss filed by Visa Inc., Visa U.S.A., MasterCard, American Express and Discover. On March 10, 2017, the plaintiffs filed a motion for class certification. On May 4, 2017, the district court granted a motion to transfer the action to the U.S. District Court for the Eastern District of New York, which has clarified that this case is not part of MDL 1720.
Walmart Acceptance Agreement
On May 10, 2016, Wal-Mart Stores Inc. and various affiliates ("Walmart") filed a lawsuit against Visa U.S.A. in New York County Supreme Court. Walmart seeks a declaratory judgment that certain of its practices related to the acceptance of Visa debit cards did not previously and would not in the future constitute a breach of the acceptance agreement entered into between Walmart and Visa. Walmart also seeks attorneys' fees and a declaratory judgment that certain of Visa's actions violated the same agreement. On June 29, 2016, Visa answered the complaint and filed counterclaims seeking declaratory and injunctive relief, as well as costs and other remedies. In its counterclaims, Visa alleges that certain of Walmart's conduct and practices relating to the acceptance of Visa debit cards constitute a breach of the acceptance agreement and a breach of the implied duty of good faith and fair dealing, and that Walmart fraudulently induced Visa to enter into the acceptance agreement.
In February 2017, the Court granted Walmart’s motion to dismiss Visa’s counterclaim for fraudulent inducement. Thereafter, Walmart filed a motion for summary judgment on its declaratory judgment claim, and Visa subsequently filed a motion to dismiss Walmart's claim. The parties then reached a settlement agreement, and the case has been dismissed.
Kroger
On June 27, 2016, The Kroger Co. ("Kroger") filed a lawsuit against Visa Inc. in the U.S. District Court for the Southern District of Ohio. In its complaint, Kroger seeks a declaratory judgment that certain of Visa's rules related to the acceptance of Visa debit cards are inconsistent with the Dodd-Frank Act. Kroger also seeks damages and other relief related to certain state law claims. On September 29, 2017, the court granted Visa's motion to dismiss Kroger's claims for declaratory judgment but denied Visa’s motion to dismiss Kroger's state law claims for damages and other relief. Kroger subsequently amended its complaint, adding claims for declaratory judgment that certain of its actions or policies did not violate a commercial agreement between Kroger and Visa and seeking other relief under additional state law claims. On November 13, 2017, Visa filed a motion to dismiss the amended complaint.
Nuts for Candy
On April 5, 2017, plaintiff Nuts for Candy, on behalf of itself and a putative class of California merchants that have accepted Visa-branded cards since January 1, 2004, filed a lawsuit against Visa Inc., Visa International and Visa U.S.A. in California state court. Similar to plaintiff Broadway Grill, discussed above in Interchange Multidistrict Litigation (MDL) – Individual Merchant Actions, Nuts for Candy pursues claims under California state antitrust and unfair business statutes. Nuts for Candy seeks damages, costs and other remedies. On September 6, 2017, Visa moved to stay Nuts for Candy’s action pending the outcome of the Broadway Grill action, which was denied by the court on October 5. On November 9, 2017, Visa moved for summary adjudication of Nuts for Candy's California unfair business statute claims.
111
Korea Fair Trade Commission
Following complaints lodged by certain financial institutions in Korea, in November 2016, the Korea Fair Trade Commission (KFTC) initiated an investigation into certain pricing changes applicable to Visa financial institutions in Korea. Visa is cooperating with the KFTC.
Ohio Attorney General Civil Investigative Demand
On January 19, 2017, the State of Ohio Office of the Attorney General issued an investigative demand to Visa seeking documents and information focusing on Visa's rules related to the acceptance of Visa debit cards, as well as cardholder verification methods and the routing of Visa debit transactions. Visa is cooperating with the Attorney General.
112
Selected Quarterly Financial Data (Unaudited)
The following tables show selected quarterly operating results for each quarter and full year of fiscal 2017 and 2016 for the Company:
Quarter Ended (unaudited) | Fiscal Year | ||||||||||||||||||
Visa Inc. | September 30, 2017 | June 30, 2017 | March 31, 2017 (1) | December 31, 2016 | 2017 Total | ||||||||||||||
(in millions, except per share data) | |||||||||||||||||||
Operating revenues | $ | 4,855 | $ | 4,565 | $ | 4,477 | $ | 4,461 | $ | 18,358 | |||||||||
Operating income | $ | 3,212 | $ | 3,024 | $ | 2,808 | $ | 3,100 | $ | 12,144 | |||||||||
Net income | $ | 2,140 | $ | 2,059 | $ | 430 | $ | 2,070 | $ | 6,699 | |||||||||
Basic earnings per share | |||||||||||||||||||
Class A common stock | $ | 0.91 | $ | 0.87 | $ | 0.18 | $ | 0.86 | $ | 2.80 | |||||||||
Class B common stock | $ | 1.49 | $ | 1.43 | $ | 0.30 | $ | 1.41 | $ | 4.62 | |||||||||
Class C common stock | $ | 3.62 | $ | 3.46 | $ | 0.72 | $ | 3.43 | $ | 11.21 | |||||||||
Diluted earnings per share | |||||||||||||||||||
Class A common stock | $ | 0.90 | $ | 0.86 | $ | 0.18 | $ | 0.86 | $ | 2.80 | |||||||||
Class B common stock | $ | 1.49 | $ | 1.42 | $ | 0.29 | $ | 1.41 | $ | 4.61 | |||||||||
Class C common stock | $ | 3.61 | $ | 3.45 | $ | 0.72 | $ | 3.42 | $ | 11.19 | |||||||||
Quarter Ended (unaudited) | Fiscal Year | ||||||||||||||||||
Visa Inc. | September 30, 2016 (1) | June 30, 2016 (1),(2) | March 31, 2016 (1) | December 31, 2015 (1) | 2016 Total | ||||||||||||||
(in millions, except per share data) | |||||||||||||||||||
Operating revenues | $ | 4,261 | $ | 3,630 | $ | 3,626 | $ | 3,565 | $ | 15,082 | |||||||||
Operating income | $ | 2,625 | $ | 428 | $ | 2,434 | $ | 2,396 | $ | 7,883 | |||||||||
Net income | $ | 1,931 | $ | 412 | $ | 1,707 | $ | 1,941 | $ | 5,991 | |||||||||
Basic earnings per share | |||||||||||||||||||
Class A common stock | $ | 0.79 | $ | 0.17 | $ | 0.71 | $ | 0.80 | $ | 2.49 | |||||||||
Class B common stock | $ | 1.31 | $ | 0.29 | $ | 1.17 | $ | 1.32 | $ | 4.10 | |||||||||
Class C common stock | $ | 3.17 | $ | 0.69 | $ | 2.85 | $ | 3.20 | $ | 9.94 | |||||||||
Diluted earnings per share | |||||||||||||||||||
Class A common stock | $ | 0.79 | $ | 0.17 | $ | 0.71 | $ | 0.80 | $ | 2.48 | |||||||||
Class B common stock | $ | 1.30 | $ | 0.28 | $ | 1.17 | $ | 1.32 | $ | 4.09 | |||||||||
Class C common stock | $ | 3.16 | $ | 0.69 | $ | 2.84 | $ | 3.20 | $ | 9.93 | |||||||||
(1) | The Company's unaudited consolidated statement of operations include the impact of several significant one-time items. See Overview within Item 7—Management's Discussion and Analysis of Financial Condition and Results of Operations of this report. |
(2) | The Company did not include Visa Europe's financial results in the Company's unaudited consolidated financial statements of operations from the acquisition date, June 21, 2016, through June 30, 2016 as the impact was immaterial. The dilutive impact of the outstanding shares of series B and C convertible participating preferred stock from June 21, 2016 through June 30, 2016 was also not included in the calculation of basic or diluted earnings per share as the effect was immaterial. See Note 2—Visa Europe and Note 14—Earnings Per Share to the consolidated financial statements included in Item 8—Financial Statements and Supplementary Data of this report. |
113
ITEM 9. | Changes in and Disagreements with Accountants on Accounting and Financial Disclosures |
Not applicable.
ITEM 9A. | Controls and Procedures |
Evaluation of Disclosure Controls and Procedures
We maintain a system of disclosure controls and procedures (as defined in the Rules 13a-15(e) and 15d-15(e) under the Securities Exchange Act of 1934, as amended (the “Exchange Act”)) that is designed to ensure that information required to be disclosed in our Exchange Act reports is recorded, processed, summarized and reported within the time periods specified in the SEC’s rules and forms, and that such information is accumulated and communicated to our management, including our Chief Executive Officer and Chief Financial Officer, as appropriate, to allow timely decisions regarding required disclosures.
Under the supervision and with the participation of our management, including our Chief Executive Officer and Chief Financial Officer, we conducted an evaluation of our disclosure controls and procedures. Based on this evaluation, our Chief Executive Officer and our Chief Financial Officer concluded that, as of September 30, 2017, our disclosure controls and procedures were effective at the reasonable assurance level.
There are inherent limitations to the effectiveness of any system of disclosure controls and procedures. These limitations include the possibility of human error, the circumvention or overriding of the controls and procedures and reasonable resource constraints. In addition, because we have designed our system of controls based on certain assumptions, which we believe are reasonable, about the likelihood of future events, our system of controls may not achieve its desired purpose under all possible future conditions. Accordingly, our disclosure controls and procedures provide reasonable assurance, but not absolute assurance, of achieving their objectives.
Management’s Report on Internal Control over Financial Reporting
The Company’s management is responsible for establishing and maintaining adequate internal control over financial reporting for the Company. Management assessed the effectiveness of the Company’s internal control over financial reporting as of September 30, 2017. Based on management’s assessment, management has concluded that the Company’s internal control over financial reporting was effective as of September 30, 2017 using the criteria set forth in Internal Control—Integrated Framework issued by the Committee of Sponsoring Organizations of the Treadway Commission (2013 framework).
Our internal control over financial reporting is designed to provide reasonable, but not absolute, assurance regarding the reliability of financial reporting and the preparation of financial statements in accordance with U.S. generally accepted accounting principles. There are inherent limitations to the effectiveness of any system of internal control over financial reporting. These limitations include the possibility of human error, the circumvention or overriding of the system and reasonable resource constraints. Because of its inherent limitations, our internal control over financial reporting may not prevent or detect misstatements. Projections of any evaluation of effectiveness to future periods are subject to the risks discussed in Item 1A—Risk Factors of this report.
The effectiveness of our internal control over financial reporting as of September 30, 2017, has been audited by KPMG LLP, an independent registered public accounting firm and is included in Item 8 of this report.
Changes in Internal Control over Financial Reporting
In preparation for management’s report on internal control over financial reporting, we documented and tested the design and operating effectiveness of our internal control over financial reporting. During fiscal 2017, there were no significant changes in our internal controls over financial reporting that occurred during the year ended September 30, 2017, that have materially affected, or are reasonably likely to materially affect, the Company’s internal control over financial reporting.
ITEM 9B. | Other Information |
Not applicable.
114
PART III
Certain information required by Part III is omitted from this Report and the Company will file a definitive proxy statement pursuant to Regulation 14A under the Exchange Act (the “Proxy Statement”) not later than 120 days after the end of the fiscal year ended September 30, 2017, and certain information included therein is incorporated herein by reference. Only those sections of the Proxy Statement that specifically address the items set forth herein are incorporated by reference. Such incorporation does not include the report of the Audit and Risk Committee included in the Proxy Statement.
ITEM 10. | Directors, Executive Officers and Corporate Governance |
The information required by this item concerning the Company's directors, executive officers, the Code of Business Conduct and Ethics and corporate governance matters is incorporated herein by reference to the sections entitled “Director Nominee Biographies,” “Executive Officers” and “Corporate Governance” in our Proxy Statement.
The information required by this item regarding compliance with Section 16(a) of the Exchange Act pursuant to Item 405 of Regulation S-K is incorporated herein by reference to the section entitled “Section 16(a) Beneficial Ownership Reporting Compliance” in our Proxy Statement.
Our Code of Business Conduct and Ethics, Code of Ethics for Senior Financial Officers and our Corporate Governance Guidelines are available on the Investor Relations page of our website at http://investor.visa.com, under “Corporate Governance.” Printed copies of these documents are also available to stockholders without charge upon written request directed to Corporate Secretary, Visa Inc., P.O. Box 193243, San Francisco, California 94119.
ITEM 11. | Executive Compensation |
The information required by this item concerning director and executive compensation is incorporated herein by reference to the sections entitled “Compensation of Non-Employee Directors” and “Executive Compensation” in our Proxy Statement.
The information required by this item pursuant to Item 407(e)(4) of Regulation S-K is incorporated herein by reference to the section entitled “Compensation Committee Interlocks and Insider Participation” in our Proxy Statement.
The information required by this item pursuant to Item 407(e)(5) of Regulation S-K is incorporated herein by reference to the section entitled “Compensation Committee Report” in our Proxy Statement.
ITEM 12. | Security Ownership of Certain Beneficial Owners and Management and Related Stockholder Matters |
The information required by this item pursuant to Item 403 of Regulation S-K is incorporated herein by reference to the section entitled “Beneficial Ownership of Equity Securities” in our Proxy Statement.
For the information required by item 201(d) of Regulation S-K, refer to Item 5 in this report.
ITEM 13. | Certain Relationships and Related Transactions, and Director Independence |
The information required by this item concerning related party transactions pursuant to Item 404 of Regulation S-K is incorporated herein by reference to the section entitled “Certain Relationships and Related Person Transactions” in our Proxy Statement.
The information required by this item concerning director independence pursuant to Item 407(a) of Regulation S-K is incorporated herein by reference to the section entitled “Independence of Directors” in our Proxy Statement.
ITEM 14. | Principal Accountant Fees and Services |
The information required by this Item is incorporated herein by reference to the section entitled “Independent Registered Public Accounting Firm Fees” in our Proxy Statement.
115
PART IV
ITEM 15. | Exhibits and Financial Statement Schedules |
The following documents are filed as part of this report:
1. | Consolidated Financial Statements |
See Index to Consolidated Financial Statements in Item 8—Financial Statements and Supplementary Data of this report.
2. | Consolidated Financial Statement Schedules |
None.
3. | The following exhibits are filed as part of this report or, where indicated, were previously filed and are hereby incorporated by reference: |
Refer to the Exhibit Index herein.
116
SIGNATURES
Pursuant to the requirements of Section 13 or 15(d) of the Securities Exchange Act of 1934, as amended, the registrant has duly caused this Annual Report on Form 10-K to be signed on its behalf by the undersigned, thereunto duly authorized.
VISA INC. | ||
By: | /s/ Alfred F. Kelly,Jr. | |
Name: | Alfred F. Kelly, Jr. | |
Title: | Chief Executive Officer | |
Date: | November 16, 2017 | |
Pursuant to the requirements of the Securities Exchange Act of 1934, as amended, this report has been signed below by the following persons on behalf of the registrant in the capacities and on the dates indicated:
117
Signature | Title | Date | ||
/s/ Alfred F. Kelly, Jr. | Chief Executive Officer and Director | November 16, 2017 | ||
Alfred F. Kelly, Jr. | (Principal Executive Officer) | |||
/s/ Vasant M. Prabhu | Chief Financial Officer | November 16, 2017 | ||
Vasant M. Prabhu | (Principal Financial Officer) | |||
/s/ James H. Hoffmeister | Global Corporate Controller and | November 16, 2017 | ||
James H. Hoffmeister | Chief Accounting Officer | |||
(Principal Accounting Officer) | ||||
/s/ Robert W. Matschullat | Independent Chair | November 16, 2017 | ||
Robert W. Matschullat | ||||
/s/ Lloyd A. Carney | Director | November 16, 2017 | ||
Lloyd A. Carney | ||||
/s/ Mary B. Cranston | Director | November 16, 2017 | ||
Mary B. Cranston | ||||
/s/ Francisco Javier Fernández-Carbajal | Director | November 16, 2017 | ||
Francisco Javier Fernández-Carbajal | ||||
/s/ Gary A. Hoffman | Director | November 16, 2017 | ||
Gary A. Hoffman | ||||
/s/ John F. Lundgren | Director | November 16, 2017 | ||
John F. Lundgren | ||||
/s/ Suzanne Nora Johnson | Director | November 16, 2017 | ||
Suzanne Nora Johnson | ||||
/s/ John A. C. Swainson | Director | November 16, 2017 | ||
John A. C. Swainson | ||||
/s/ Maynard G. Webb, Jr. | Director | November 16, 2017 | ||
Maynard G. Webb, Jr. | ||||
118
EXHIBIT INDEX
Incorporated by Reference | ||||||||||
Exhibit | Exhibit | File | Exhibit | Filing | ||||||
Number | Description | Form | Number | Number | Date | |||||
2.1 | Amended and Restated Transaction Agreement, dated as of May 10, 2016, between Visa Inc. and Visa Europe Limited # | 8-K | 001-33977 | 5/10/2016 | ||||||
3.1 | Sixth Amended and Restated Certificate of Incorporation of Visa Inc. | 8-K | 001-33977 | 1/29/2015 | ||||||
3.2 | Certificate of Correction of the Certificate of Incorporation of Visa Inc. | 8-K | 001-33977 | 2/27/2015 | ||||||
3.3 | Amended and Restated Bylaws of Visa Inc. | 10-K | 001-33977 | 11/20/2015 | ||||||
4.1 | Form of stock certificate of Visa Inc. | S-4/A | 333-143966 | 9/13/2007 | ||||||
4.2 | Form of specimen certificate for class B common stock of Visa Inc. | 8-A | 000-53572 | 1/28/2009 | ||||||
4.3 | Form of specimen certificate for class C common stock of Visa Inc. | 8-A | 000-53572 | 1/28/2009 | ||||||
4.5 | Indenture dated December 14, 2015 between Visa Inc. and U.S. Bank National Association | 8-K | 001-33977 | 12/14/2015 | ||||||
4.6 | Form of 2.200% Senior Note due 2020 | 8-K | 001-33977 | 12/14/2015 | ||||||
4.7 | Form of 2.150% Senior Note due 2022 | 8-K | 001-33977 | 9/11/2017 | ||||||
4.8 | Form of 2.800% Senior Note due 2022 | 8-K | 001-33977 | 12/14/2015 | ||||||
4.9 | Form of 3.150% Senior Note due 2025 | 8-K | 001-33977 | 12/14/2015 | ||||||
4.1 | Form of 2.750% Senior Note due 2027 | 8-K | 001-33977 | 9/11/2017 | ||||||
4.11 | Form of 4.150% Senior Note due 2035 | 8-K | 001-33977 | 12/14/2015 | ||||||
4.12 | Form of 4.300% Senior Note due 2045 | 8-K | 001-33977 | 12/14/2015 | ||||||
4.13 | Form of 3.650% Senior Note due 2047 | 8-K | 001-33977 | 9/11/2017 | ||||||
4.14 | Certificate of Designations of Series A Convertible Participating Preferred Stock of Visa Inc. | 8-K | 001-33977 | 6/21/2016 | ||||||
4.15 | Certificate of Designations of Series B Convertible Participating Preferred Stock of Visa Inc. | 8-K | 001-33977 | 6/21/2016 | ||||||
4.16 | Certificate of Designations of Series C Convertible Participating Preferred Stock of Visa Inc. | 8-K | 001-33977 | 6/21/2016 | ||||||
10.1 | Form of Indemnity Agreement | 8-K | 001-33977 | 10/25/2012 | ||||||
119
10.2 | Amended and Restated Global Restructuring Agreement, dated August 24, 2007, by and among Visa Inc., Visa International Service Association, Visa U.S.A. Inc., Visa Europe Limited, Visa Canada Association, Inovant LLC, Inovant, Inc., Visa Europe Services, Inc., Visa International Transition LLC, VI Merger Sub, Inc., Visa USA Merger Sub Inc. and 1734313 Ontario Inc. | S-4/A | 333-143966 | 9/13/2007 | ||||||
10.3 | Form of Escrow Agreement by and among Visa Inc., Visa U.S.A. Inc. and the escrow agent | S-4 | 333-143966 | 6/22/2007 | ||||||
10.4 | Form of Framework Agreement by and among Visa Inc., Visa Europe Limited, Inovant LLC, Visa International Services Association and Visa U.S.A. Inc. † | S-4/A | 333-143966 | 7/24/2007 | ||||||
10.5 | Five Year Revolving Credit Agreement, amended and restated as of January 27, 2017, by and among Visa Inc., Visa International Service Association, Visa U.S.A. Inc., as borrowers, Bank of America, N.A., as administrative agent, JPMorgan Chase Bank N.A., as syndication agent, and the lenders referred to therein # | 10-Q | 001-33977 | 4/21/2017 | ||||||
10.6 | Form of Interchange Judgment Sharing Agreement by and among Visa International Service Association and Visa U.S.A. Inc., and the other parties thereto † | S-4/A | 333-143966 | 7/24/2007 | ||||||
10.7 | Interchange Judgment Sharing Agreement Schedule | 8-K | 001-33977 | 2/8/2011 | ||||||
10.8 | Amendment of Interchange Judgment Sharing Agreement | 10-K | 001-33977 | 11/20/2015 | ||||||
10.9 | Form of Loss Sharing Agreement by and among Visa U.S.A. Inc., Visa International Service Association, Visa Inc. and various financial institutions | S-4/A | 333-143966 | 7/24/2007 | ||||||
10.10 | Loss Sharing Agreement Schedule | 8-K | 001-33977 | 2/8/2011 | ||||||
10.11 | Amendment of Loss Sharing Agreement | 10-K | 001-33977 | 11/20/2015 | ||||||
10.12 | Form of Litigation Management Agreement by and among Visa Inc., Visa International Service Association, Visa U.S.A. Inc. and the other parties thereto | S-4/A | 333-143966 | 8/22/2007 | ||||||
10.13 | Omnibus Agreement, dated February 7, 2011, regarding Interchange Litigation Judgment Sharing and Settlement Sharing by and among Visa Inc., Visa U.S.A. Inc., Visa International Service Association, MasterCard Incorporated, MasterCard International Incorporated and the parties thereto | 8-K | 001-33977 | 7/16/2012 | ||||||
120
10.14 | Amendment, dated August 26, 2014, to the Omnibus Agreement regarding Interchange Litigation Judgment Sharing and Settlement Sharing by and among Visa Inc., Visa U.S.A. Inc., Visa International Service Association, MasterCard Incorporated, MasterCard International Incorporated and the parties thereto | 10-K | 001-33977 | 11/21/2014 | ||||||
10.15 | Second Amendment, dated October 22, 2015, to Omnibus Agreement regarding Interchange Litigation Judgment Sharing and Settlement Sharing | 10-K | 001-33977 | 11/20/2015 | ||||||
10.16 | Settlement Agreement, dated October 19, 2012, by and among Visa Inc., Visa U.S.A. Inc., Visa International Service Association, MasterCard Incorporated, MasterCard International Incorporated, various U.S. financial institution defendants, and the class plaintiffs to resolve the class plaintiffs' claims in the matter styled In re Payment Card Interchange Fee and Merchant Discount Antitrust Litigation, No. 05-MD-1720 | 10-Q | 001-33977 | 2/6/2013 | ||||||
10.17 | Loss Sharing Agreement, dated as of November 2, 2015, among the UK Members listed on Schedule 1 thereto, Visa Inc. and Visa Europe Limited | 8-K | 001-33977 | 11/2/2015 | ||||||
10.18 | Litigation Management Deed, dated as of June 21, 2016, by and among the VE Member Representative, Visa Inc., the LMC Appointing Members, the UK&I DCC Appointing Members, the Europe DCC Appointing Members and the UK&I DCC Interested Members | 8-K | 001-33977 | 6/21/2016 | ||||||
10.19* | Visa 2005 Deferred Compensation Plan, effective as of August 12, 2015 | 10-K | 001-33977 | 11/20/2015 | ||||||
10.20* | Visa Directors Deferred Compensation Plan, as amended and restated as of July 22, 2014 | 10-K | 001-33977 | 11/21/2014 | ||||||
10.21* | Visa Inc. 2007 Equity Incentive Compensation Plan, as amended and restated as of February 3, 2016 | DEFA 14A | 001-33977 | 1/12/2016 | ||||||
10.22* | Visa Inc. Incentive Plan, as amended and restated as of February 3, 2016 | DEF 14A | 001-33977 | 12/11/2015 | ||||||
10.23* | Visa Excess Thrift Plan, as amended and restated as of January 1, 2008 | 10-K | 001-33977 | 11/21/2008 | ||||||
10.24* | Visa Excess Retirement Benefit Plan, as amended and restated as of January 1, 2008 | 10-K | 001-33977 | 11/21/2008 | ||||||
10.25* | First Amendment, effective January 1, 2011, of the Visa Excess Retirement Benefit Plan, as amended and restated as of January 1, 2008 | 10-K | 001-33977 | 11/18/2011 | ||||||
10.26* | Visa Inc. Executive Severance Plan, effective as of November 3, 2010 | 8-K | 001-33977 | 11/9/2010 | ||||||
121
10.27* | Visa Inc. 2015 Employee Stock Purchase Plan | DEF 14A | 001-33977 | 12/12/2014 | ||||||
10.28* | Form of Visa Inc. 2007 Equity Incentive Compensation Plan Stock Option Award Agreement for awards granted after November 18, 2013 | 10-Q | 001-33977 | 1/30/2014 | ||||||
10.29* | Form of Visa Inc. 2007 Equity Incentive Compensation Plan Restricted Stock Award Agreement for awards granted after November 18, 2013 | 10-Q | 001-33977 | 1/30/2014 | ||||||
10.30* | Form of Visa Inc. 2007 Equity Incentive Compensation Plan Restricted Stock Unit Award Agreement for awards granted after November 18, 2013 | 10-Q | 001-33977 | 1/30/2014 | ||||||
10.31* | Form of Visa Inc. 2007 Equity Incentive Compensation Plan Performance Share Award Agreement for awards granted after November 18, 2013 | 10-Q | 001-33977 | 1/30/2014 | ||||||
10.32* | Form of Alternate Visa Inc. 2007 Equity Incentive Compensation Plan Stock Option Award Agreement for awards granted after November 18, 2013 | 10-Q | 001-33977 | 1/30/2014 | ||||||
10.33* | Form of Alternate Visa Inc. 2007 Equity Incentive Compensation Plan Restricted Stock Award Agreement for awards granted after November 18, 2013 | 10-Q | 001-33977 | 1/30/2014 | ||||||
10.34* | Form of Alternate Visa Inc. 2007 Equity Incentive Compensation Plan Restricted Stock Unit Award Agreement for awards granted after November 18, 2013 | 10-Q | 001-33977 | 1/30/2014 | ||||||
10.35* | Form of Visa Inc. 2007 Equity Incentive Compensation Plan Director Restricted Stock Unit Award Agreement for awards granted after November 18, 2013 | 10-Q | 001-33977 | 1/30/2014 | ||||||
10.36* | Form of Visa Inc. 2007 Equity Incentive Compensation Plan Director Restricted Stock Unit Award Agreement for awards granted after November 1, 2014 | 10-K | 001-33977 | 11/21/2014 | ||||||
10.37* | Form of Visa Inc. 2007 Equity Incentive Compensation Plan Stock Option Award Agreement for awards granted after November 1, 2014 | 10-K | 001-33977 | 11/21/2014 | ||||||
10.38* | Form of Visa Inc. 2007 Equity Incentive Compensation Plan Restricted Stock Award Agreement for awards granted after November 1, 2014 | 10-K | 001-33977 | 11/21/2014 | ||||||
10.39* | Form of Visa Inc. 2007 Equity Incentive Compensation Plan Restricted Stock Unit Award Agreement for awards granted after November 1, 2014 | 10-K | 001-33977 | 11/21/2014 | ||||||
122
10.40* | Form of Visa Inc. 2007 Equity Incentive Compensation Plan Performance Share Award Agreement for awards granted after November 1, 2014 | 10-K | 001-33977 | 11/21/2014 | ||||||
10.41* | Form of Alternate Visa Inc. 2007 Equity Incentive Compensation Plan Stock Option Award Agreement for awards granted after November 1, 2014 | 10-K | 001-33977 | 11/21/2014 | ||||||
10.42* | Form of Alternate Visa Inc. 2007 Equity Incentive Compensation Plan Restricted Stock Award Agreement for awards granted after November 1, 2014 | 10-K | 001-33977 | 11/21/2014 | ||||||
10.43* | Form of Alternate Visa Inc. 2007 Equity Incentive Compensation Plan Restricted Stock Unit Award Agreement for awards granted after November 1, 2014 | 10-K | 001-33977 | 11/21/2014 | ||||||
10.44* | Form of Visa Inc. 2007 Equity Incentive Compensation Plan Stock Option Award Agreement for awards granted after November 1, 2015 | 10-Q | 001-33977 | 1/28/2016 | ||||||
10.45* | Form of Visa Inc. 2007 Equity Incentive Compensation Plan Restricted Stock Unit Award Agreement for awards granted after November 1, 2015 | 10-Q | 001-33977 | 1/28/2016 | ||||||
10.46* | Form of Visa Inc. 2007 Equity Incentive Compensation Plan Performance Share Award Agreement for awards granted after November 1, 2015 | 10-Q | 001-33977 | 1/28/2016 | ||||||
10.47* | Form of Visa Inc. 2007 Equity Incentive Compensation Plan Restricted Stock Unit Award Agreement for the CEO, for the Make-Whole Award. | 10-K | 001-33977 | 11/15/2016 | ||||||
10.48* | Form of Letter Agreement relating to Visa Inc. Executive Severance Plan | 8-K | 001-33977 | 11/9/2010 | ||||||
10.49* | Aircraft Time Sharing Agreement, dated November 7, 2012, between Visa Inc. and Charles W. Scharf | 8-K | 001-33977 | 11/9/2012 | ||||||
10.50* | Amendment No. 1 to the Aircraft Time Sharing Agreement, effective December 13, 2013, between Visa Inc. and Charles W. Scharf | 10-K | 001-33977 | 11/21/2014 | ||||||
10.51* | Offer Letter, dated October 17, 2016, between Visa Inc. and Alfred F. Kelly, Jr. | 8-K | 001-33977 | 10/21/2016 | ||||||
10.52* | Aircraft Time Sharing Agreement, dated November 9, 2016, between Visa Inc. and Alfred F. Kelly, Jr. | 10-K | 001-33977 | 11/15/2016 | ||||||
10.53* | Offer Letter and One-Time Cash Award Agreement, dated January 27, 2015, between Visa Inc. and Vasant M. Prabhu | 8-K | 001-33977 | 2/2/2015 | ||||||
123
Statement of Computation of Ratio of Earnings to Fixed Charges | ||||||||||
List of Significant Subsidiaries of Visa Inc. | ||||||||||
Consent of KPMG LLP, Independent Registered Public Accounting Firm | ||||||||||
Certification of the Chief Executive Officer pursuant to Exchange Act Rules 13a-14(a) and 15d-14(a), as adopted pursuant to Section 302 of the Sarbanes-Oxley Act of 2002 | ||||||||||
Certification of the Chief Financial Officer pursuant to Exchange Act Rules 13a-14(a) and 15d-14(a), as adopted pursuant to Section 302 of the Sarbanes-Oxley Act of 2002 | ||||||||||
Certification of the Chief Executive Officer pursuant to 18 U.S.C. Section 1350, as adopted pursuant to Section 906 of the Sarbanes-Oxley Act of 2002 | ||||||||||
Certification of the Chief Financial Officer pursuant to 18 U.S.C. Section 1350, as adopted pursuant to Section 906 of the Sarbanes-Oxley Act of 2002 | ||||||||||
101.INS | XBRL Instance Document | |||||||||
101.SCH | XBRL Taxonomy Extension Schema Document | |||||||||
101.CAL | XBRL Taxonomy Extension Calculation Linkbase Document | |||||||||
101.DEF | XBRL Taxonomy Extension Definition Linkbase Document | |||||||||
101.LAB | XBRL Taxonomy Extension Label Linkbase Document | |||||||||
101.PRE | XBRL Taxonomy Extension Presentation Linkbase Document | |||||||||
_______________
† | Confidential treatment has been requested for portions of this agreement. A completed copy of the agreement, including the redacted portions, has been filed separately with the SEC. |
* | Management contract, compensatory plan or arrangement. |
+ | Filed or furnished herewith. |
# | Schedules have been omitted pursuant to Item 601(b)(2) of Regulation S-K. A copy of any omitted schedule will be furnished supplementally to the SEC upon request; provided, however, that the parties may request confidential treatment pursuant to Rule 24b-2 of the Exchange Act for any document so furnished. |
124