Attached files
| file | filename |
|---|---|
| EX-99.1 - EX-99.1 - OFG BANCORP | d373065dex991.htm |
| EX-99.3 - EX-99.3 - OFG BANCORP | d373065dex993.htm |
| 8-K - FORM 8-K - OFG BANCORP | d373065d8k.htm |
 Acquisition of
BBVA’s Puerto Rico Operations Investor Conference Call
June 28, 2012
1
Exhibit 99.2 |
 2
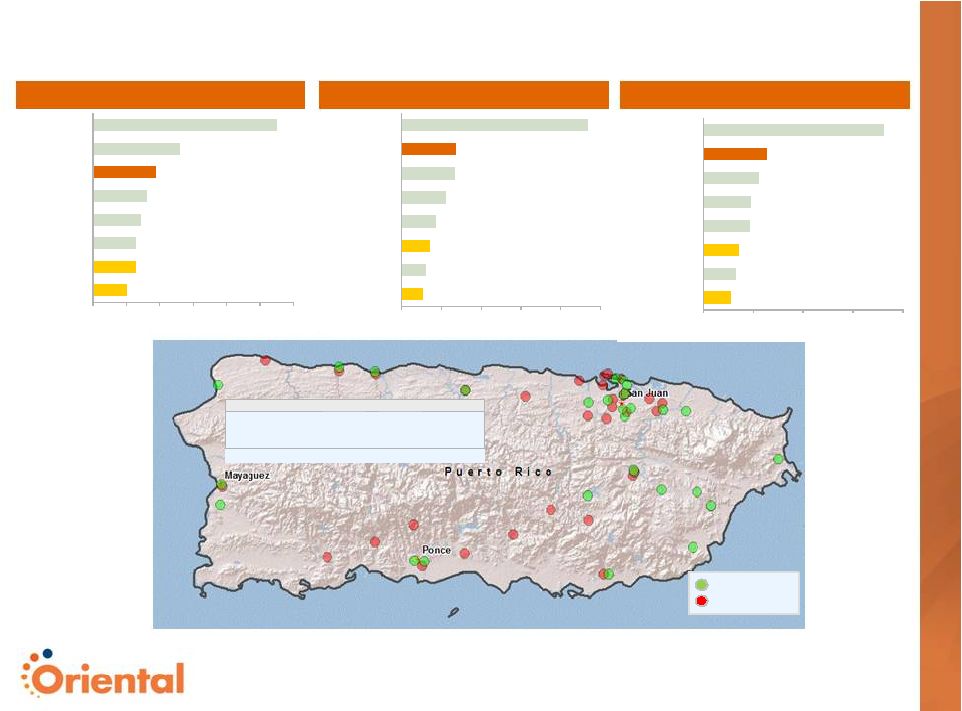
Disclaimer
The information contained in this presentation (the “Presentation”) is preliminary,
may not be complete and may be changed. Unless otherwise indicated or unless the
context requires otherwise, all references to “Oriental,” “we,” “us,” “our” or similar references means Oriental Financial Group Inc.
The Presentation includes forward-looking statements about Oriental. These
forward-looking statements may relate to Oriental’s financial condition, results of
operations, plans, objectives, future performance and business, including, but not limited to,
statements with respect to the proposed acquisition described herein, the pro forma
effect of such acquisition and related transactions, and our ability to finance such acquisition. All statements contained herein that are not clearly
historical in nature are forward-looking, and the words “anticipate,”
“believe,” “continues,” “expect,” “estimate,” “intend,” “project” and similar expressions and
future or conditional verbs such as “will,” “would,” “should,”
“could,” “might,” “can,” “may,” or similar expressions are generally intended to identify forward-looking
statements.
Forward-looking statements provide our expectations or predictions of future conditions,
events or results. They are not guarantees of future performance, and actual results
may differ materially. By their nature, these forward-looking statements involve numerous assumptions and uncertainties, both general and specific, including
those discussed in Oriental’s Annual Report on Form 10-K for the year ended December
31, 2011 (the “2011 10-K”), Oriental’s Quarterly Report on Form 10-Q for the
three-month period ended March 31, 2012 (the “1Q 10-Q”), and other filings
we make with the Securities and Exchange Commission. These statements speak only as of
the date they are made. We do not undertake to update forward-looking statements to reflect the impact of circumstances or events that arise after the date
the forward looking statements were made. These statements are not
guarantees of future performance and involve certain risks, uncertainties, estimates and assumptions by management that are difficult to
predict. Various factors, some of which, by their nature are beyond Oriental’s control,
could cause actual results to differ materially from those expressed in, or implied
by, such forward-looking statements, including with respect to market conditions. Factors that might cause such a difference include, but are not limited to
those included under the “Risk Factors” section of the 2011 10-K and the 1Q
10-Q or the risk factors included in the materials provided to you in connection with this
transaction. You are urged to read the “Risk Factors” section of the 2011 10-K
and the 1Q 10-Q as well as the risk factors included in the materials provided to you in
connection with this transaction. Market data used in the
Presentation has been obtained from industry sources and publications as well as from research reports prepared for other purposes.
Furthermore, certain information has been obtained from Banco Bilbao Vizcaya Argentaria, S.A.
(“BBVA”) and BBVA does not assume any responsibility therefore. We have not
independently verified any the data obtained from these sources, and we cannot assure you of the accuracy or completeness of the data. In addition,
information regarding the combined company included in this presentation is based in part on
certain assumptions regarding the transaction and the value of the acquired assets and
liabilities that we believe are reasonable. We cannot assure you that our assumptions will prove to be accurate over time.
This Presentation does not constitute an offer to sell, or a solicitation of an offer to buy,
any securities by any person in any jurisdiction in which it is unlawful for such
person to make an offer or solicitation.
The Presentation contains unaudited non-GAAP financial and other performance measures.
Oriental presents non-GAAP and other performance measures when its management
believes that the additional information is useful and meaningful to investors. Non-GAAP and other performance measures do not have any standardized
meaning and are therefore unlikely to be comparable to similar measures presented by other
companies. The presentation of non-GAAP and other performance measures is not
intended to be a substitute for, and should not be considered in isolation from, the financial measures reported in accordance with GAAP. See Appendix
for definitions and reconciliations of certain non-GAAP measures to the comparable GAAP
measures and for definitions of certain other performance measures used in this
presentation. |
 3
I. Transaction Overview and Rationale |
 4
Acquisition Overview and Rationale
Signed
definitive
agreement
to
purchase
BBVA’s
Puerto
Rico
operations
(1)
for
$500 million in cash
–
Closing (subject to customary regulatory approvals) targeted before December 31, 2012
Effective use of excess capital which enhances financial performance, franchise
and shareholder value
–
Generates significant earnings per share accretion (over 50% in 2014)
–
Combines two of the healthiest lenders in Puerto Rico to create a market leading bank
–
Provides an expanded customer base and complementary products and services
–
Enhances Oriental’s competitive position on the Island with #2 core deposit share
Accelerates the transformation of Oriental’s balance sheet
–
Larger and more diversified loan portfolio
–
Far less reliance on investment securities and wholesale funding
–
Improves earnings stability
Well timed: Puerto Rico’s economy has stabilized and fiscal situation has
improved (1)
Acquisition targets include BBVA PR’s commercial bank and insurance brokerage which are
subsidiaries of BBVA PR Holding Corporation, a bank holding company, and BBVA
Securities of Puerto Rico, Inc. which is a separate subsidiary.
Description
Rationale |
 5
Pricing and Financing
Oriental /
BBVA PR
Comparable
Transactions
(2)
Price / Tangible Book Value Per Share
1.03x
1.65x
Price / Marked Tangible Book Value Per Share
1.37x
2.01x
Price / Earnings
(1)
14.0x
27.5x
Attractive
Purchase
Valuation for
Healthy
Commercial
Bank Target
Financing
Designed to
Minimize
Shareholder
Dilution and
Maximize EPS
Accretion
$350 million of balance sheet cash
Signing
of
purchase
agreements
for
$84
million
private
placement
of
noncumulative
convertible perpetual preferred stock occurred in connection with the signing of the
acquisition agreement
–
Conversion price of $11.77 and dividend of 8.75%
Incremental
$65-$70
million
of
Tier
1
capital
to
be
raised
before
closing
of
the
acquisition
–
Approximately equal amounts of non-convertible perpetual preferred equity and
common equity
$1.8
billion
deleveraging
of
the
investment
securities
portfolio
and
wholesale
funding
emphasizes shift towards core commercial banking platform
Source: SNL Financial, regulatory filings.
(1)
Annualized earnings for BBVA PR in 1Q 2012 and the most recent quarter prior to announcement
of comparable transactions. (2)
Includes U.S. nationwide transactions announced since June 30, 2010 with deal value between
$200 million and $6 billion. Median metrics. |
 6
Acquisition Benefits
Financial
Metrics Are
Very Favorable
EPS Accretion
~35% accretive to 2013 EPS (Assumes 12/31/12 close)
(1)
~52% accretive to 2014 EPS
Tangible Book
Value per Share
and Earn Back
Period
Tangible book value per share dilution of ~23% at close
Less
than
2
years
earn-back
period
(2)
based
on
combined
company’s
earnings
Less
than
5
years
earn-back
period
(3)
based
on
earnings
contributed
by
acquisition
IRR
~20%
Pro Forma
Accretion and
Profitability
Provide
Attractive
Relative
Valuation
Oriental
Median of
Current
Pro Forma
U.S. Bank Peers
(5)
Price to:
2014E EPS
7.3x
4.8x
11.1x
Tangible Book Value
0.66
0.86
1.41
2014E Profitability Metrics
ROAA
0.90%
1.07%
1.13%
ROATCE
8.2
16.8
10.7
Note: Financial metrics and pro forma capital ratios assume December 31, 2012 transaction
close. Combined metrics include acquisition adjustments and are pro forma for $150 million capital raise and $1.8
billion in deleverage transactions to be conducted at time of acquisition close. Assumes
constant OFG stock price of $10.46 as of June 27, 2012. (1) Excludes impact of one-time restructuring costs.
(2) Tangible book value per share earn-back period defined as
tangible book value per share dilution at acquisition close divided by 2014 EPS.
(3) Tangible book value per share earn-back period defined as
tangible book value per share dilution at acquisition close divided by dollars of 2014 EPS accretion.
(4) Oriental current EPS assumes First Call 2013 median estimated
diluted EPS of $1.32 grown at the First Call median long-term EPS growth rate of 8%.
(5) Includes publicly-traded U.S. banks between $5 billion and $15
billion in assets. 2014E profitability metrics reflect First Call median estimates.
(4) |
 7
II. Overview of BBVA’s Puerto Rico Operations |
 8
BBVA PR Presents a Complementary Franchise with an Established History of Over 45
Years Serving Puerto Rico
BBVA PR
Operations
Highly
Complementary
to Oriental
Acquisition includes commercial bank, insurance agency business and securities brokerage
(1)
$5.2 billion in assets, $3.7 billion in loans, $3.3 billion in deposits and 36 branches
Specialist in commercial banking and auto lending with excellent
corporate banking services
Also strong in residential mortgages and consumer loans
Management team of local executives with significant retail and commercial banking
experience Foundation of
Banco de
Mayagüez
Acquisition of 98.8% of Banco de
Mayagüez by Banco Occidental
(Banco Occidental was acquired
by Banco Vizcaya in 1982)
Renamed as BBV PR
Headquarters moved
to San Juan
Acquisition of 20% of
General Electric Capital
Acquisition of
Royal Bank of PR
Acquisition of Las
Americas Trust & Co
Acquisition of Ponce
Bank and acquisition of
assets and liabilities of
Chase Manhattan Bank
Merger between BBV
and Argentaria
Renamed as BBVA PR
Acquisition of part of
Citibank’s auto
financing business
(1)
Acquisition targets include BBVA PR’s commercial bank and insurance brokerage which are
subsidiaries of BBVA PR Holding Corporation, a bank holding company, and BBVA
Securities of Puerto Rico, Inc. which is a separate subsidiary.
1967
1979
1992
1993
1994
1998
1999
2000
2001
2011
BBVA PR Historical Timeline |
 9
BBVA PR’s Credit Quality Has Stabilized
BBVA PR
Peer
Median
(1)
Source: SNL Financial and BBVA PR regulatory filings as of March
31, 2012.
(1)
Nonperforming asset formation has declined to
normalized levels
BBVA PR’s loan portfolio has consistently earned a
considerably higher yield than U.S. national peers
BBVA
PR’s
nonperforming
loan
balance
has
declined
27% since peaking in 3Q 2010
BBVA PR has been aggressive in addressing problem
assets
with
a
reserve
to
nonperforming
loans
ratio of
52%
Key Points
BBVA PR Exhibits Higher Loan Yields Versus Peers
(1)
Nonperforming Loans Have Declined and Stabilized
NPA Formation Has Declined Significantly from Peak Levels
Peers
defined
as
U.S.
banks
with
assets
between
$3
and
$10
billion.
6
7
8
9
10%
2009
Q4
2010
Q1
2010
Q2
2010
Q3
2010
Q4
2011
Q1
2011
Q2
2011
Q3
2011
Q4
2012
Q1
0.0
6.0
12.0
18.0%
2009
Q4
2010
Q1
2010
Q2
2010
Q3
2010
Q4
2011
Q1
2011
Q2
2011
Q3
2011
Q4
2012
Q1
5.0
5.5
6.0
6.5
7.0%
2009
Q4
2010
Q1
2010
Q2
2010
Q3
2010
Q4
2011
Q1
2011
Q2
2011
Q3
2011
Q4
2012
Q1 |
 10
Oriental performed extensive credit review
Process utilized Oriental’s extensive knowledge
of Puerto Rico market to generate conservative
loss estimates
Commercial loan file review covered
–
79% of construction portfolio
–
74% of nonperforming commercial real estate
–
52% of auto dealer
–
47% of corporate loans
Total nonperforming loans marked by nearly
50%
Aggregate loan mark of 7.5%
Implied cumulative losses of 16.5%
Extensive Credit Due Diligence and Conservative Loan Marks
($ in millions)
1/1/08 - 3/31/12 Average Loans, HFI Balance
$3,852
NCOs taken 1/1/08 - 3/31/12
($357)
(9.3%)
Cumulative Losses
($635)
(16.5%)
Gross Loan
Performing
Balance
Mark $
Mark %
Mortgage
$852
($37)
(4.4%)
Autos
963
0
0.0
CRE
186
(24)
(12.7)
Construction
29
(8)
(26.2)
Commercial
1,228
(69)
(5.6)
Consumer
198
(18)
(9.1)
Total Performing
$3,456
($155)
(4.5%)
Gross Loan
Non Performing
Balance
Mark $
Mark %
Mortgage
$84
($50)
(59.9%)
Autos
8
(3)
(41.4)
CRE
17
(5)
(30.1)
Construction
59
(26)
(43.2)
Commercial
79
(36)
(45.8)
Consumer
3
(2)
(73.7)
Total Nonperforming
$250
($123)
(49.0%)
Total
$3,706
($278)
(7.5%) |
 11
III. Pro Forma Impact of Acquisition |
 12
Transaction Significantly Enhances the Competitive Position of the Oriental Franchise
Core Deposit Funded
Enhanced Scale
Island-wide Retail Branch Network
12
(1)
Puerto Rico core deposits are estimated on a pro-rata basis based on proportion of Puerto
Rico deposits to total deposits disclosed in 2012 Q1 10-Q and 2011 10-K for Popular and First BanCorp.,
respectively. Actual Puerto Rico core deposits may differ.
Source: SNL Financial, public SEC and regulatory filings.
Note: Companies shown include Puerto Rico-based banks. Data as of March 31, 2012. Pro
forma data represented as if financing and acquisition transactions occurred March 31, 2012, included for illustrative purposes.
Combined metrics include acquisition adjustments and are pro forma for $150 million capital
raise and $1.8 billion in deleverage transactions to be conducted at time of acquisition close. See page 20 and 21 for key
pro forma and deleverage assumptions, respectively.
47%
14%
14%
11%
9%
7%
6%
6%
0%
10%
20%
30%
40%
50%
Popular
PF Oriental / BBVA PR
Banco Santander
First BanCorp
Scotia
BBVA PR
Doral
Oriental
Market Share of Core Deposits
$28
$13
$9
$8
$7
$7
$6
$5
$0
$5
$10
$15
$20
$25
$30
Popular
First BanCorp.
PF Oriental / BBVA PR
Doral
Banco Santander
Scotia
Oriental
BBVA PR
Total Assets ($B)
182
64
56
48
47
36
33
28
0
50
100
150
200
Popular
PF Oriental / BBVA PR
Banco Santander
First BanCorp.
Scotia
BBVA PR
Doral
Oriental
Branches
($ mm)
OFG
BBVA PR
Pro Forma
Deposits
$2,275
$3,269
$5,544
Branches
28
36
64
Dep. / Branch
$81
$91
$87
(1)
(1)
OFG
BBVA PR |
 13
60%
34%
36%
57%
4%
9%
1Q 2012
Standalone
Pro Forma
Brokered Deposits
Core Deposits
Borrowings
Acquisition of BBVA PR Accelerates Ongoing Transformation of Oriental
Source: SNL Financial, public SEC and regulatory filings.
Note: Combined metrics include acquisition adjustments and are pro forma for $150 million
capital raise and $1.8 billion in deleverage transactions to be conducted at time of acquisition close. See page 20 and 21 for
key pro forma and deleverage assumptions, respectively.
(1)Pro forma data as if financing and acquisition transactions occurred March 31, 2012
included for illustrative purposes. (2)Covered loans benefit from FDIC loss share
agreements. Earning Asset Composition
Funding Composition
(1)
The transaction creates a more attractive earning asset and funding composition, with an
increased proportion of loans and core deposits
–
Includes $1.8 billion deleveraging of investment securities portfolio and wholesale
funding 14%
22%
57%
15%
21%
15%
9%
6%
41%
1Q 2012
Standalone
Pro Forma
Marked Loans
Covered Loans
Non-Covered Loans
Government Sponsored RMBS
Other Securities and Cash Equivalents |
 14
Source: SNL Financial, Oriental and BBVA PR SEC and regulatory filings.
Note: Financial data as of March 31, 2012.
(1)
Pro forma data as if financing and acquisition transactions occurred March 31, 2012 included
for illustrative purposes. Combined metrics include acquisition adjustments and are pro
forma for $150 million capital raise and $1.8 billion in deleverage transactions to be
conducted at time of acquisition close. See page 20 and 21 for key pro forma and deleverage assumptions, respectively.
(2)
Other loans and leases include home equity, agricultural production, institutional /
government, and floor plan loans. BBVA PR Diversifies Oriental’s Loan Portfolio and
Enhances its Funding Base 14
Pro Forma
Total: $5.2 BN
Autos
19%
Commercial
Banking
30%
Residential
Mortgages
35%
Consumer
and
Other
(2)
Loans &
Leases
17%
Oriental
Total: $1.8 BN
Commercial
Banking
37%
Residential
Mortgages
55%
Consumer
and Other
Loans &
Leases
(2)
8%
Diversifies Loan Composition Across Commercial and Retail Credits
(1)
Oriental
Total: $2.3 BN
Jumbo
Time
16%
Retail Time
29%
Non-
Interest
Bearing
8%
Other
Interest
Bearing
47%
Pro Forma
Total: $5.5 BN
Jumbo
Time
23%
Retail Time
23%
Non-
Interest
Bearing
17%
Other
Interest
Bearing
37%
(1)
Deposit Composition is Improved with Additional Core Deposits |
 15
Source: SNL Financial, public SEC and regulatory filings.
Note: Financial data as of March 31, 2012. Pro forma data as if financing and acquisition
transactions occurred March 31, 2012, included for illustrative purposes. Combined metrics include acquisition adjustments and are
pro forma for $150 million capital raise and $1.8 billion in deleverage transactions to be
conducted at time of acquisition close. See page 20 and 21 for key pro forma and deleverage assumptions, respectively.
NPAs / Total Assets
Marked Loans / Total Loans
Loans / Deposits
Pro Forma Company Has a Low-Risk Balance Sheet
2.4%
2.6%
3.7%
5.3%
6.2%
6.3%
9.5%
11.7%
0%
2%
4%
6%
8%
10%
12%
14%
Oriental
Scotia
PF Oriental /
BBVA PR
Santander
BBVA PR
Popular
First BanCorp.
Doral
76%
56%
30%
22%
0%
0%
0%
0%
0%
20%
40%
60%
80%
100%
PF Oriental / BBVA PR
Scotiabank
Oriental
Popular
Doral
First BanCorp.
BBVA PR
Santander
77%
92%
93%
104%
104%
113%
139%
139%
0%
50%
100%
150%
Oriental
Popular
PF Oriental /
BBVA PR
First BanCorp.
Santander
BBVA PR
Scotiabank
Doral |
 16
Transaction Results in a Well-Capitalized Balance Sheet
Capital Ratios
Reported
Oriental (3/31/12A)
Pro Forma with
BBVA PR (12/31/12E)
TCE / TA
9.6%
5.6% -
5.8%
Tier 1 Common Capital
27.3%
7.9% -
8.2%
Tier 1 Risk Based Capital
32.3%
12.2% -
12.5%
Tier 1 Leverage
10.3%
6.8% -
7.0%
Summary Key Balance Sheet Items
($ in billions)
3/31/12A
12/31/12E
Oriental
BBVA PR
Pro Forma
Assets
Gross Loans
$1.8
$3.7
$5.2
Securities
3.6
0.7
2.2
Intangible Assets
0.0
0.1
0.1
Liabilities and Equity
Deposits
$2.3
$3.3
$5.5
Borrowings
3.4
1.2
2.9
Equity
0.7
0.6
0.8 |
 17
IV. Conclusions |
 18
Acquisition Highlights and Strategic Rationale
Repositions
balance
sheet
composition
away
from
wholesale
assets
and
liabilities
to
predominately loans and deposits
Well capitalized and over 75% of loans will have been marked by purchase accounting
Strong
credit
quality
and
asset
and
liability
composition
create
a
more
stable,
higher
quality
earnings stream
Creates a More
Stable Balance
Sheet and
Consistent
Earnings
Accelerates
Strategic
Transformation
Oriental avoided significant asset quality problems through the financial crisis and has been
generating organic growth in commercial banking
The acquisition of BBVA PR accelerates strategy with the addition of a large, profitable and
diversified institution
Purchase price of 1.03x tangible book value
(1)
and 14x MRQ net income is well below
comparable transactions
BBVA PR has produced six straight quarters of profitability
Estimated post acquisition EPS increases over 50% in 2014
Improves all key profitability ratios
Attractive
Valuation for a
Healthy Bank
Target Generates
Positive Financial
Impact
Establishes Oriental as a winner in the Puerto Rico bank recovery and consolidation cycle
|
 19
V. Appendix |
 20
Key Assumptions Underlying Pro Forma Analysis
Transaction Assumptions
Consideration
100% cash consideration to BBVA of $500 million
Financing
$150 million Tier 1 Capital issuance by Oriental
Remaining funds to be paid from cash on Oriental Bank & Trust’s balance sheet at
consummation of the transaction
Assumes 2.8% pre-tax cost of cash
Loan Credit Mark
7.5% of loans outstanding on March 31, 2012 ($278 million)
Core Deposit Intangibles
1.25% of core deposits, amortized on a straight line basis over 10 years
Balance Sheet Restructuring
$454
million
and
$1.3
billion
deleverage
from
BBVA
PR
and
OFG’s
respective
balance
sheets
(1)
Assumptions on Acquired BBVA PR Operations
Net Interest Margin
4.3% -
4.8%
Non-Interest Income
~$35 million per annum
Cost Savings
20% of BBVA PR’s non-interest expense
50% realized in 2013, 100% thereafter
Restructuring Expenses
~$40 million (pre-tax)
Deposit Run-off
$250 million; 8% of BBVA PR’s total deposits
Taxes
30% tax rate
Closing
December 31, 2012 closing date
(1)
See page 21 for transaction deleverage details. |
 21
Anticipated Deleverage Allocates Capital for Building Oriental’s Core Banking Business
$1.3 billion in securities sold to delever liabilities
consisting of hedged repurchase agreements and FHLB
advances
One time after-tax loss on settlement of repurchase
agreements estimated at $9 million
Estimated net income impact of:
($12) million in 2013
($8) million in 2014
Oriental’s Balance Sheet
$454 million in securities sold to delever liabilities
consisting of repurchase agreements
Mark to market loss on early settlement of repurchase
agreements estimated at $23 million (purchase
accounting mark)
Estimated net income impact of:
$7 million in 2013
Acquired BBVA PR Balance Sheet
$1.8 billion in combined deleverage from both
companies’
balance sheets
Deleverage expected to occur at acquisition close
Assets and liabilities sold are selected based upon
expected cost to unwind
Leverages core funding base to support higher yielding
assets
Optimizes Oriental’s utilization of capital
Reduces interest rate sensitivity
Deleverage
Strategic Rationale |
 22
Conservative Loan Mark
Source: SNL Financial, SEC and regulatory filings.
(1)
Cumulative mark based on gross loan mark and total NCOs since January 1, 2008 through
announcement of acquisition. (2)
Includes nationwide transactions since June 30, 2010 with deal value between $200 million and
$6 billion. Data at announcement of acquisition. (3)
Includes “Recent Transactions”
referenced in footnote 2 above with seller over 5% NPLs / Loans. Data at announcement of
acquisition. BBVA PR’s loan portfolio exhibits a higher loan yield and lower loss
severity than precedent targets Precedent Transaction Credit Mark Analysis
BBVA PR
Recent Transaction
Median
(2)
Comparable
Transaction Median
(3)
Gross Loan Mark / Loans
7.5 %
4.4 %
12.2 %
Cumulative Mark / Average Loans
(1)
16.5
8.1
14.7
NPLs / Loans
6.9
1.9
6.8
LTM NCOs / Average Loans
1.7
0.8
2.7
LTM NCOs / Average NPLs
22.9
31.3
42.5
Loan Yield
6.4
5.3
4.6 |
 23
Tier 1 Common Equity:
Common Stockholders' Equity
$621
Unrealized Gains on Available-for-Sale Securties
(74)
Unrealized Losses on Cash Flow Hedges
44
Disallowed Deferred Tax Assets
(25)
Disallowed Servicing Assets
(1)
Intangible Assets
(4)
Total Tier 1 common equity
$561
Risk-weighted assets:
Balance sheet items
$2,000
Off-balance sheet items
53
Total Risk-Weighted Assets
$2,053
Tier 1 Common Equity to Risk-Weighted Assets
27.3%
Definitions/Reconciliation of Non-GAAP and Other Performance Measures
TCE / TA
Tier 1 Common Capital
($ in millions)
Tangible Common Equity:
Total Stockholders' Equity
$689
Preferred Stock
(68)
Intangible Assets
(4)
Total Tangible Common Equity
$617
Tangible Assets:
Total Assets
$6,461
Intangible Assets
(4)
Total Tangible Assets
$6,458
Tangible Common Equity to Tangible Assets
9.6%
Source: SNL Financial, Oriental public SEC filings, regulatory filings.
Other Non-GAAP and Performance Measures
•
Tangible book value and tangible common equity are defined as total common equity less total
intangible assets. •
Marked tangible book value defined as total common equity less total intangible assets and
mark-to-market adjustments. •
Internal Rate of Return (“IRR”) represents the annualized effective rate of return
on investment. •
Return on average assets (“ROAA”) is calculated as projected 2014 net income
available to common shareholders divided by projected 2014 average assets. Assets are
assumed to grow consistently over the course of 2014. •
Return on average tangible common equity (“ROATCE”) calculated as projected 2014 net
income available to common shareholders divided by average projected 2014 tangible
common equity. Tangible common equity is assumed to grow consistently over the course of 2014.
•
Nonperforming loans defined as nonaccrual loans and loans over 90 days past due.
•
NPA formation defined as the gross amount of loans placed on nonaccrual status since prior
period end annualized, expressed as a percentage of average total assets.
•
Core deposits defined as total deposits less brokered deposits.
•
Nonperforming assets are defined as nonaccrual loans and other real estate owned.
|