Attached files
| file | filename |
|---|---|
| 8-K - 8-K - W R GRACE & CO | a12-14929_18k.htm |
Exhibit 99.1
|
|
W. R. Grace & Co. Investment Highlights June 18, 2012 |

|
|
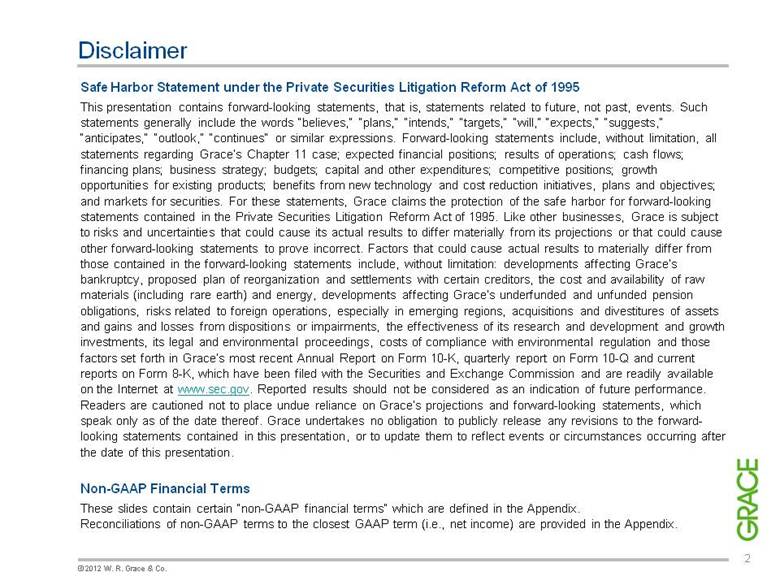
Safe Harbor Statement under the Private Securities Litigation Reform Act of 1995 This presentation contains forward-looking statements, that is, statements related to future, not past, events. Such statements generally include the words “believes,” “plans,” “intends,” “targets,” “will,” “expects,” “suggests,” “anticipates,” “outlook,” “continues” or similar expressions. Forward-looking statements include, without limitation, all statements regarding Grace’s Chapter 11 case; expected financial positions; results of operations; cash flows; financing plans; business strategy; budgets; capital and other expenditures; competitive positions; growth opportunities for existing products; benefits from new technology and cost reduction initiatives, plans and objectives; and markets for securities. For these statements, Grace claims the protection of the safe harbor for forward-looking statements contained in the Private Securities Litigation Reform Act of 1995. Like other businesses, Grace is subject to risks and uncertainties that could cause its actual results to differ materially from its projections or that could cause other forward-looking statements to prove incorrect. Factors that could cause actual results to materially differ from those contained in the forward-looking statements include, without limitation: developments affecting Grace’s bankruptcy, proposed plan of reorganization and settlements with certain creditors, the cost and availability of raw materials (including rare earth) and energy, developments affecting Grace’s underfunded and unfunded pension obligations, risks related to foreign operations, especially in emerging regions, acquisitions and divestitures of assets and gains and losses from dispositions or impairments, the effectiveness of its research and development and growth investments, its legal and environmental proceedings, costs of compliance with environmental regulation and those factors set forth in Grace’s most recent Annual Report on Form 10-K, quarterly report on Form 10-Q and current reports on Form 8-K, which have been filed with the Securities and Exchange Commission and are readily available on the Internet at www.sec.gov. Reported results should not be considered as an indication of future performance. Readers are cautioned not to place undue reliance on Grace’s projections and forward-looking statements, which speak only as of the date thereof. Grace undertakes no obligation to publicly release any revisions to the forward-looking statements contained in this presentation, or to update them to reflect events or circumstances occurring after the date of this presentation. Non-GAAP Financial Terms These slides contain certain “non-GAAP financial terms” which are defined in the Appendix. Reconciliations of non-GAAP terms to the closest GAAP term (i.e., net income) are provided in the Appendix. Disclaimer |
|
|
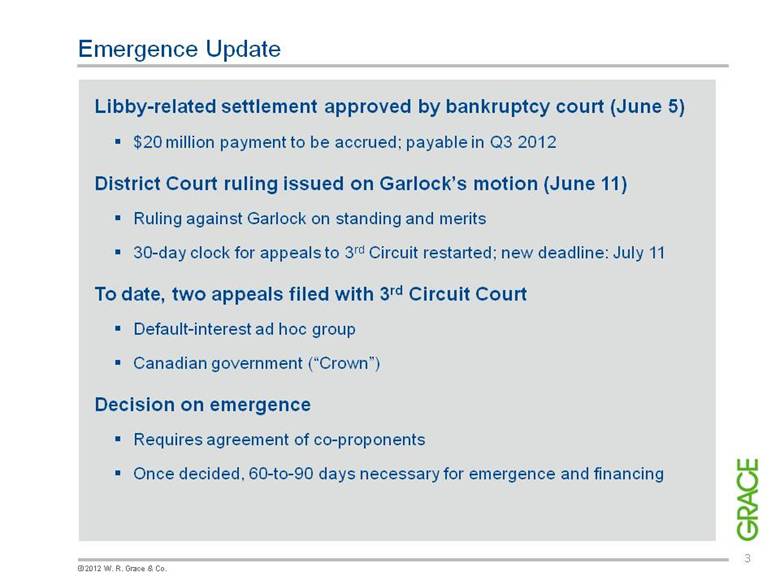
Emergence Update Libby-related settlement approved by bankruptcy court (June 5) $20 million payment to be accrued; payable in Q3 2012 District Court ruling issued on Garlock’s motion (June 11) Ruling against Garlock on standing and merits 30-day clock for appeals to 3rd Circuit restarted; new deadline: July 11 To date, two appeals filed with 3rd Circuit Court Default-interest ad hoc group Canadian government (“Crown”) Decision on emergence Requires agreement of co-proponents Once decided, 60-to-90 days necessary for emergence and financing |
|
|
Catalysts Technologies Construction Products Materials Technologies $1.3 billion $0.9 billion $1.0 billion North America Western Europe Emerging Regions Developed Asia Impact of European economic weakness in Q2 2012: Catalysts: announced refinery shutdowns Materials: destocking due to uncertainty and slowdown Construction Products: continuing low levels of activity All segments: euro translation exposure 2011 Segment Sales by Region |
|
|
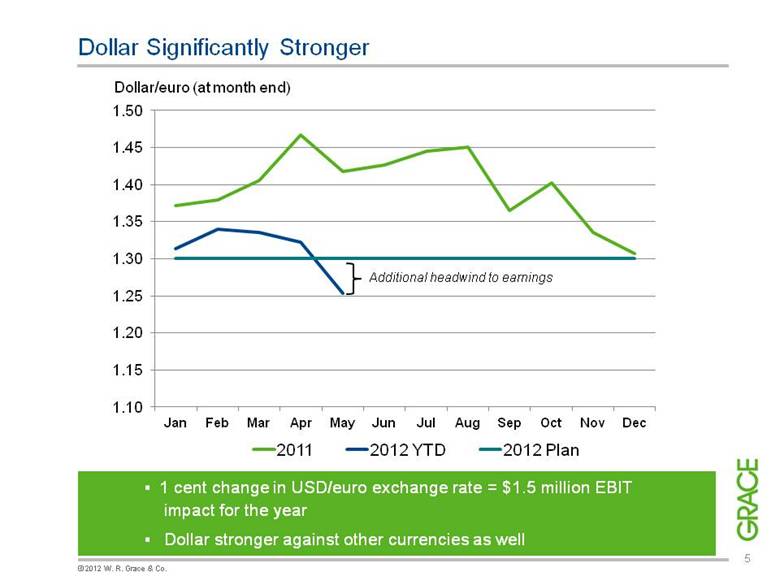
1 cent change in USD/euro exchange rate = $1.5 million EBIT impact for the year Dollar stronger against other currencies as well Dollar Significantly Stronger Dollar/euro (at month end) |
|
|
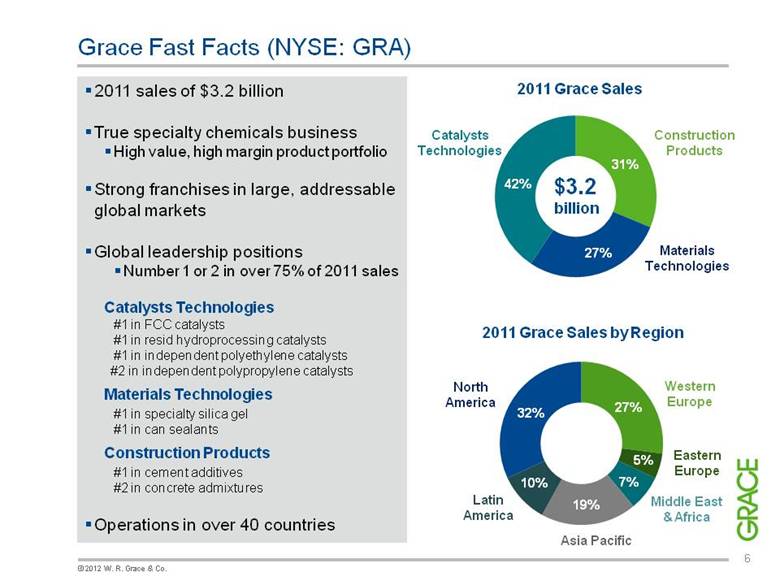
Grace Fast Facts (NYSE: GRA) 2011 sales of $3.2 billion True specialty chemicals business High value, high margin product portfolio Strong franchises in large, addressable global markets Global leadership positions Number 1 or 2 in over 75% of 2011 sales Catalysts Technologies #1 in FCC catalysts #1 in resid hydroprocessing catalysts #1 in independent polyethylene catalysts #2 in independent polypropylene catalysts Materials Technologies #1 in specialty silica gel #1 in can sealants Construction Products #1 in cement additives #2 in concrete admixtures Operations in over 40 countries 2011 Grace Sales 2011 Grace Sales by Region Construction Products Materials Technologies Latin America North America Western Europe Asia Pacific Catalysts Technologies $3.2 billion 42% 31% 27% 27% 32% 10% 19% Middle East & Africa 7% Eastern Europe 5% |
|
|
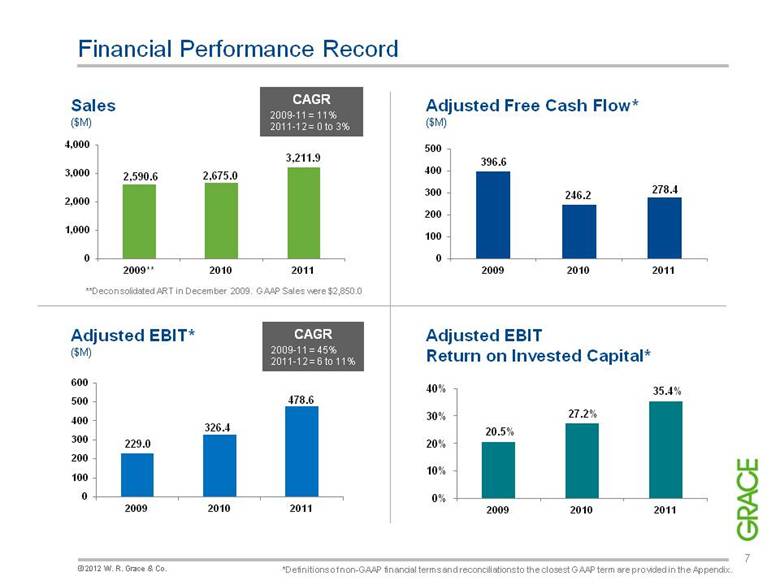
Sales ($M) Adjusted Free Cash Flow* ($M) Adjusted EBIT* ($M) Adjusted EBIT Return on Invested Capital* 27.2% 35.4% *Definitions of non-GAAP financial terms and reconciliations to the closest GAAP term are provided in the Appendix. 20.5% 396.6 246.2 278.4 Financial Performance Record **Deconsolidated ART in December 2009. GAAP Sales were $2,850.0 CAGR 2009-11 = 11% 2011-12 = 0 to 3% CAGR 2009-11 = 45% 2011-12 = 6 to 11% |
|
|
Track Record of Increasing Profitability *Definitions of Non-GAAP financial terms and reconciliations to the closest GAAP term are provided in the Appendix. Sales and Gross Margin ($B) Profitability Drivers Sales Growth Capital-efficient capacity additions Growth in emerging economies leverages existing infrastructure Growth in advanced economies scales fixed costs Bolt-on acquisitions with clear cost synergies Product Margins Pricing power during periods of increasing raw materials costs Product innovation focused on increasing margins Lean manufacturing prioritized to higher margin products Global sourcing of raw materials and raw materials substitution Productivity Increasing manufacturing flexibility and reducing fixed costs Investing in supply chain function Disciplined Six Sigma approach to back office productivity Reducing inventories and inventory costs Adjusted EBITDA* ($M) |
|
|
ROIC Performance Grace has invested over $440 million in its businesses since 2009 ROIC increased from 21% to 35% ROIC Drivers Higher Adjusted EBIT Disciplined net working capital management Manufacturing scale and flexibility Construction Products capital-light business model ROIC key in investment decisions, but not a barrier to growth Adjusted EBIT Return On Invested Capital* *Definitions of non-GAAP financial terms and reconciliations to the closest GAAP term are provided in the Appendix. High ROIC: An Operating and Investment Priority Net Working Capital Days 2012 Target ~ 53 20.5% 27.2% 35.4% 34 - 36% 0% 5% 10% 15% 20% 25% 30% 35% 40% 2009 2010 2011 2012E |
|
|
Strategies Focused to Deliver Long-Term Performance Focus on core franchises in big, global markets Differentiate products at the customer level Use our cash flow as an asset for investment and growth; build capabilities in emerging markets Reduce complexity to drive productivity Adjusted EBITDA: $850 million by 2014 12% CAGR 2011-2014 High ROIC/ Strong cash flow Materials Science Expertise Customer Focus Innovation Core Competencies Strategies Long-Term Performance Goals *Definitions of Non-GAAP financial terms and reconciliations to the closest GAAP term are provided in the Appendix. |
|
|
Catalyst Markets Represent Significant Opportunity * excludes environmental catalysts Source: Company estimates, Proprietary research Where we play: Refining FCC: ~$1.0 B HPC: ~$350 MM Polyolefin ~$300 MM Chemical ~$50 MM GRA: $1.7 billion market leader in $16 billion market space $6.5 B $5.6 B $3.9 B Global Catalyst Market Value* ~$16 Billion Refining Polymers Chemicals |
|
|
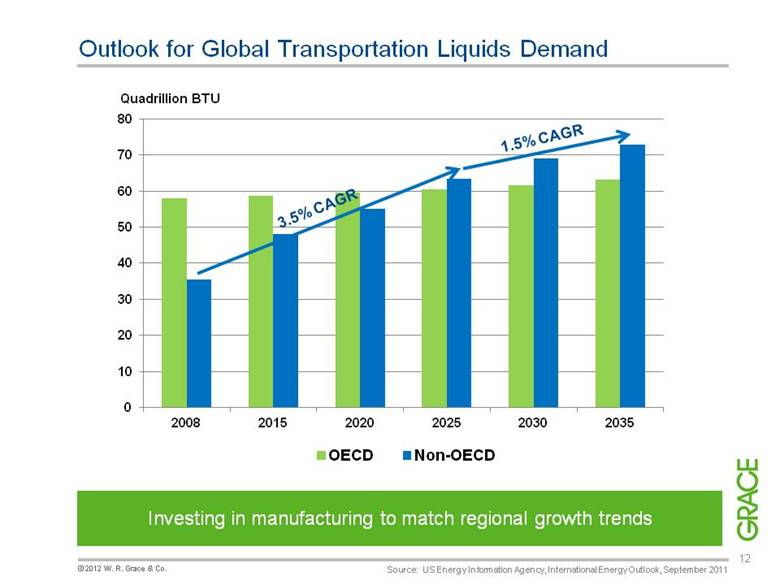
Outlook for Global Transportation Liquids Demand Quadrillion BTU Source: US Energy Information Agency, International Energy Outlook, September 2011 Investing in manufacturing to match regional growth trends 1.5% CAGR 3.5% CAGR |
|
|
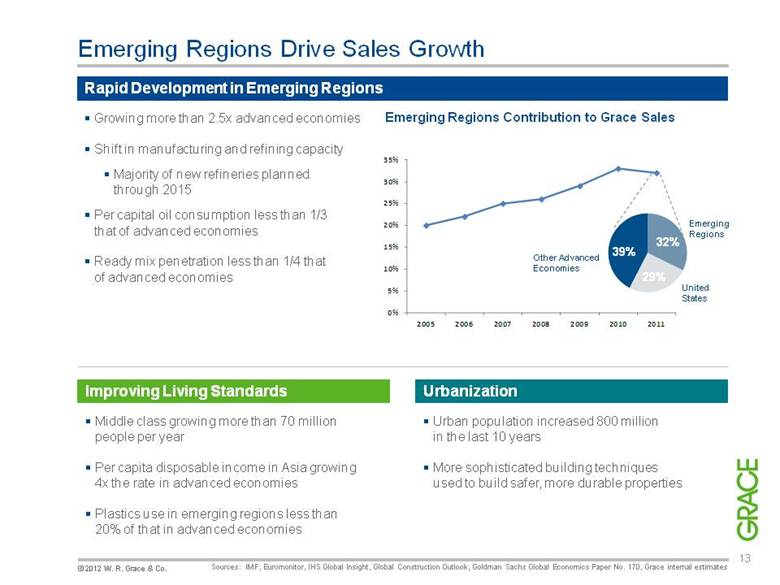
Emerging Regions Drive Sales Growth Emerging Regions Contribution to Grace Sales Improving Living Standards Middle class growing more than 70 million people per year Per capita disposable income in Asia growing 4x the rate in advanced economies Plastics use in emerging regions less than 20% of that in advanced economies Urbanization Urban population increased 800 million in the last 10 years More sophisticated building techniques used to build safer, more durable properties Rapid Development in Emerging Regions Growing more than 2.5x advanced economies Shift in manufacturing and refining capacity Majority of new refineries planned through 2015 Per capital oil consumption less than 1/3 that of advanced economies Ready mix penetration less than 1/4 that of advanced economies Sources: IMF, Euromonitor, IHS Global Insight, Global Construction Outlook, Goldman Sachs Global Economics Paper No. 170, Grace internal estimates 39% 32% 29% Emerging Regions United States Other Advanced Economies 0% 5% 10% 15% 20% 25% 30% 35% 2005 2006 2007 2008 2009 2010 2011 |
|
|
Adjusted EBITDA Goal: $850 MM by 2014 $599 $50-100 $0-50 $850 $150-200 New Products Geographic Expansion Capital Investments Operating Leverage Productivity Improvements Pricing *Definitions of Non-GAAP financial terms and reconciliations to the closest GAAP term are provided in the Appendix. |
|
|
Uses of Capital Investment priorities Catalysts Technologies investments and alliances Product and geographic extensions in Materials Technologies and Construction Products Typical capital expenditures 4-5% of sales Strong preference for bolt-ons with clear cost synergies More than 25 bolt-on acquisitions since 2001 Portfolio accretive to earnings and return on invested capital Financial flexibility to invest in growth Exit financing requirement about 0.9x Adjusted EBITDA Returning excess cash flow to shareholders Repurchase warrant if available at the right price Repurchase shares to offset option dilution after emergence *Definitions of Non-GAAP financial terms and reconciliations to the closest GAAP term are provided in the Appendix. |
|
|
Well Positioned for Continued Earnings Growth Strong foundation for growth: Leading product portfolio Growth-oriented geographic footprint Customer-focused innovation and technical support are distinct competitive advantages Strategies in place to achieve long-term performance goals: Adjusted EBITDA: $850 million by 2014 Sales growth: 8% CAGR to 2014 High ROIC/strong cash flow Management track record reinforces confidence in delivering results |
|
|
For additional information, please visit www.grace.com or contact: J. Mark Sutherland Vice President, Investor Relations T: +1 410.531.4590 E: Mark.Sutherland@grace.com |
|
|
Appendices: Appendix I – Definitions and Reconciliations of Non-GAAP Measures Appendix II – Chapter 11 Information Appendix III – Additional Valuation Considerations |
|
|
Appendix I – Definitions and Reconciliations of Non-GAAP Measures Non-GAAP Financial Terms Adjusted EBIT (Earnings Before Interest and Taxes) is net income adjusted for interest income and expense, income taxes, net Chapter 11- and asbestos- related costs, restructuring expenses and related asset impairments, divestment expenses, and gains and losses on sales of product lines and other investments. Adjusted EBITDA (Earnings Before Interest, Taxes, Depreciation and Amortization) is Adjusted EBIT plus depreciation and amortization expenses. Segment Operating Income is Adjusted EBIT adjusted for defined benefit pension expense and corporate costs. Adjusted Free Cash Flow is net cash provided by or used for operating activities minus capital expenditures plus the net cash flow from Chapter 11 expenses paid, cash paid to resolve contingencies subject to Chapter 11, accelerated payments under defined pension arrangements, and expenditures for asbestos - related environmental remediation. Adjusted EBIT Return On Invested Capital is Adjusted EBIT (on a trailing four quarters basis) divided by the sum of net working capital, properties and equipment and certain other assets and liabilities. Adjusted EBIT, Adjusted EBITDA, Adjusted EPS, Segment Operating Income, Adjusted Free Cash Flow and Adjusted EBIT Return On Invested Capital do not purport to represent income or cash flow measures as defined under U.S. generally accepted accounting principles (GAAP), and should not be used as alternatives to such measures as an indicator of Grace’s performance. These measures are provided to investors and others to improve the period - to - period comparability and peer - to - peer comparability of Grace’s financial results, and to ensure that investors understand the information we use to evaluate the performance of our businesses. Adjusted EBIT has material limitations as an operating performance measure because it excludes Chapter 11 - and asbestos - related costs and may exclude income and expenses from restructuring and divestment activities, which historically have been material components of Grace’s net income. Adjusted EBITDA also has material limitations as an operating performance measure because it excludes the impact of depreciation and amortization expense. Grace’s business is substantially dependent on the successful deployment of capital, and depreciation and amortization expense is a necessary element of Grace’s costs. Adjusted Free Cash Flow also has material limitations as a liquidity measure because it excludes the cash flow effects of capital expenditures plus the net cash flow from Chapter 11 expenses paid, cash paid to resolve contingencies subject to Chapter 11, accelerated payments under defined pension arrangements, and expenditures for asbestos - related environmental remediation, which historically have been material components of Grace’s operations. Grace compensates for the limitations of these measurements by using these indicators together with net income as measured under GAAP to present a complete analysis of its results of operations. Adjusted EBIT, Adjusted EBITDA and Adjusted Free Cash Flow should be evaluated together with net income measured under GAAP for a complete understanding of Grace’s results of operations. Investors should evaluate these measures in conjunction with Grace’s Consolidated Financial Statements as presented in Grace’s annual reports on Form 10-K for a more complete analysis of its financial results. |
|
|
Appendix I –Reconciliations of Non-GAAP Measures (continued) (in millions) 2009 2010 2011 Adjusted EBIT (Non-GAAP) $229.0 $326.4 $478.6 Adjustments: Chapter 11- and asbestos-related costs, net (109.9) (35.3) (44.7) Restructuring expenses and related asset impairments (33.4) (11.2) (6.9) Gains (loss) on sales of product lines 33.9 0.0 (0.4) Divestment expenses 0.0 0.0 (0.4) EBIT 119.6 279.9 426.2 Benefit from (provision for) income taxes (11.5) (32.5) (114.7) Interest income of non-Debtor subsidiaries 1.4 1.0 1.2 Interest expense (38.3) (41.3) (43.3) Net Income (GAAP) $71.2 $207.1 $269.4 Chapter 11- and asbestos-related costs, net: Chapter 11 expenses, net of filing entity interest income $48.0 $17.7 $20.0 Legal defense costs 36.0 0.1 0.0 Asbestos administration costs 7.9 6.1 4.5 Provision for environmental remediation related to asbestos 4.7 3.7 16.3 Payments from insurance carriers related to asbestos activities 0.0 0.0 0.0 D&O insurance cost related to Chapter 11 3.3 3.5 0.3 Chapter 11 financing related:* Translation effects - intercompany loans (11.0) 25.2 11.7 Value of currency forward contracts - intercompany loans 15.9 (25.4) (9.3) Certain other currency translation costs, net 6.3 4.3 1.2 COLI income, net (1.2) 0.1 0.0 Chapter 11- and asbestos-related costs, net $109.9 $35.3 $44.7 |
|
|
Appendix I –Reconciliations of Non-GAAP Measures (continued) (in millions) Adjusted Free Cash Flow: 2009 2010 2011 Net cash provided by operating activities (GAAP) $433.4 $327.7 $217.0 Adjustments to net cash provided by operating activities: Capital expenditures (93.8) (112.9) (141.6) Chapter 11 expenses paid 54.2 28.6 20.6 Cash paid to resolve contingencies subject to Chapter 11 - - - Accelerated defined benefit pension plan contributions - - 180.0 Expenditures for asbestos-related environmental remediation 2.8 2.8 2.4 Adjusted Free Cash Flow (Non-GAAP) $396.6 $246.2 $278.4 (in millions) Adjusted EBIT Return on Invested Capital (trailing four quarters): 2009 2010 2011 Adjusted EBIT (Non-GAAP) $229.0 $326.4 $478.6 Invested Capital: Trade accounts receivable 373.2 386.1 473.0 Inventories 220.6 259.3 329.1 Accounts payable (174.2) (215.6) (257.6) 419.6 429.8 544.5 Other current assets (exluding income taxes) 64.5 74.9 82.6 Properties and equipment, net 690.1 702.5 723.5 Goodwill 118.6 125.5 148.2 Investment in unconsolidated affiliates 45.7 56.4 70.8 Other assets 100.6 97.5 103.3 Other current liabilities (excluding income taxes and restructuring) (264.5) (229.1) (259.6) Other liabilities (including non-asbestos environmental remediation) (58.8) (58.3) (60.9) Total invested capital $1,115.8 $1,199.2 $1,352.4 Adjusted EBIT Return on Invested Capital (Non-GAAP) 20.5% 27.2% 35.4% |
|
|
Appendix II – Chapter 11 Information Grace will have a different balance sheet after emergence These notes may help you value Grace after emergence Complete pro forma financial disclosures in February 24, 2012 Form 8-K Exit Financing $586 million estimated exit financing requirement as of December 31, 2011 1.0x Adjusted EBITDA (as of December 31, 2011) Deferred Payments to asbestos trusts $365 million discounted present value as of December 31, 2011 $237 million discounted present value after tax deductions when paid to trusts Warrants 10 million shares, $17 strike, one-year term, issued at emergence Assumed value at $272 million as of December 31, 2011 Will repurchase warrants if available at the right price |
|
|
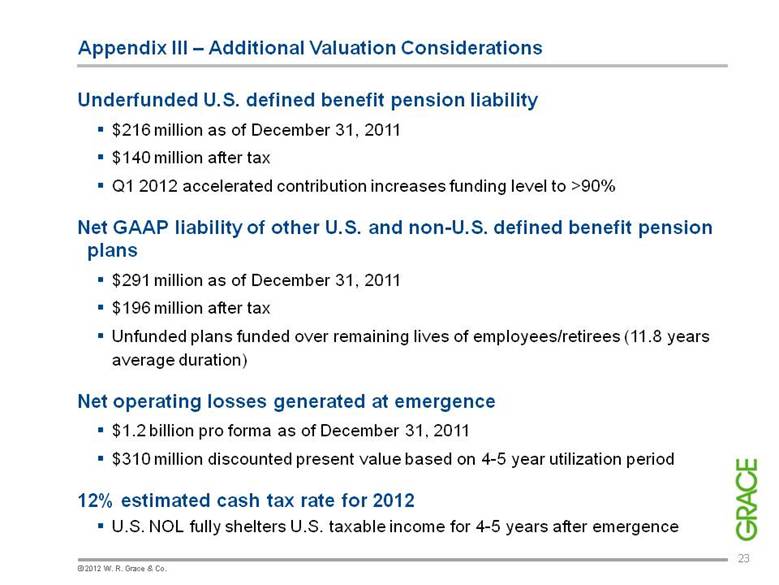
Appendix III – Additional Valuation Considerations Underfunded U.S. defined benefit pension liability $216 million as of December 31, 2011 $140 million after tax Q1 2012 accelerated contribution increases funding level to >90% Net GAAP liability of other U.S. and non-U.S. defined benefit pension plans $291 million as of December 31, 2011 $196 million after tax Unfunded plans funded over remaining lives of employees/retirees (11.8 years average duration) Net operating losses generated at emergence $1.2 billion pro forma as of December 31, 2011 $310 million discounted present value based on 4-5 year utilization period 12% estimated cash tax rate for 2012 U.S. NOL fully shelters U.S. taxable income for 4-5 years after emergence |