Attached files
| file | filename |
|---|---|
| EX-99.1 - EXHIBIT 99.1 - ZALE CORP | a50287220_ex991.htm |
| 8-K - ZALE CORPORATION 8-K - ZALE CORP | a50287220.htm |
Exhibit 99.2
Third Quarter Fiscal 2012 Earnings Call May 23, 2012 ZALE CORPORATION ZALES THE DIAMOND STORE Gordon’s Jewelers Celebrating Relationships Since 1905 ZALES Outlet THE DIAMOND STORE PEOPLES Mappins FINE JEWELLERS SINCE 1935 Piercing Pagoda 1
Forward‐Looking Statements and Use of Non‐GAAP Financial Measures • This presentation contains forward‐looking statements, including statements regarding our multi‐year plan, future sales, expenses, margins, profitability, merchandising and marketing initiatives, the future impact of the warranty revenue recognition change and industry growth forecasts. Forward‐looking statements are not guarantees of future performance and a variety of factors could cause the Company's actual results to differ materially from the results expressed in the forward‐looking statements. These factors include, but are not limited to: if the general economy continues to perform poorly, discretionary spending on goods that are, or are perceived to be, “luxuries” may decrease; the concentration of a substantial portion of the Company’s sales in three, relatively brief selling seasons means that the Company’s performance is more susceptible to disruptions; most of the Company’s sales are of products that include diamonds, precious metals and other commodities, and fluctuations in the availability and pricing of commodities could impact the Company’s ability to obtain and produce products at favorable prices; the Company’s sales are dependent upon mall traffic; the Company operates in a highly competitive industry; the financing market remains difficult, and if we are unable to meet the financial commitments in our current financing arrangements it will be difficult to replace or restructure these arrangements; and changes in regulatory requirements may increase the cost or adversely affect the Company’s operations and its ability to provide consumer credit and write credit insurance. For other factors, see the Company's filings with the Securities and Exchange Commission, including its Quarterly Report on Form 10‐Q for the fiscal quarter ended January 31, 2012. The Company disclaims any obligation to update or revise publicly or otherwise any forward‐looking statements to reflect subsequent events, new information or future circumstances, except as required by law. • This presentation contains certain non‐GAAP measures as defined by SEC rules. One of these non‐GAAP measures is EBITDA, which is defined as earnings before interest, taxes, depreciation and amortization. A second non‐GAAP measure is adjusted EBITDA, which is further adjusted to exclude charges related to store closures. We use these measurements as part of our evaluation of the performance of the Company. In addition, we believe these measures provide useful information to investors. Please refer to the appendix at the back of this presentation for a reconciliation of these non‐GAAP measures to the most comparable GAAP financial measures. 2
Q3 FY12 Highlights • Q3 Comparable Store Sales up 8.0%(1) – Six consecutive quarters of positive comps – Follows a 15.2% rise in the same quarter last year • Accelerated progress towards profitability – Operating earnings of $6 million, an improvement of $12 million compared to prior year – Net loss per share from continuing operations improved by $0.17 versus prior year • Solid revenue performance driven by: – Improved core inventory and launch of new branded merchandise – Integrated online and traditional store infrastructure – Strong execution by our customer‐facing teams – New marketing campaign 3 (1) Comparable Store Sales exclude revenue recognized from warranties. The sales results of new stores are included beginning with the thirteenth full month of operations, and the sales results of closed stores are excluded from the calculation.
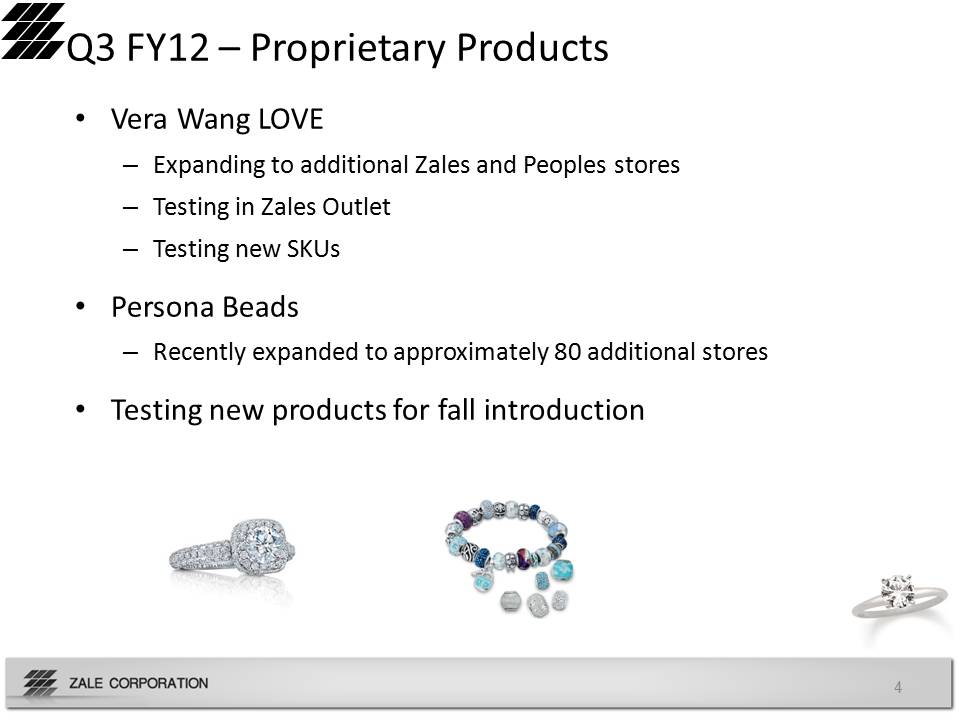
Q3 FY12 – Proprietary Products • Vera Wang LOVE – Expanding to additional Zales and Peoples stores – Testing in Zales Outlet – Testing new SKUs • Persona Beads – Recently expanded to approximately 80 additional stores • Testing new products for fall introduction 4
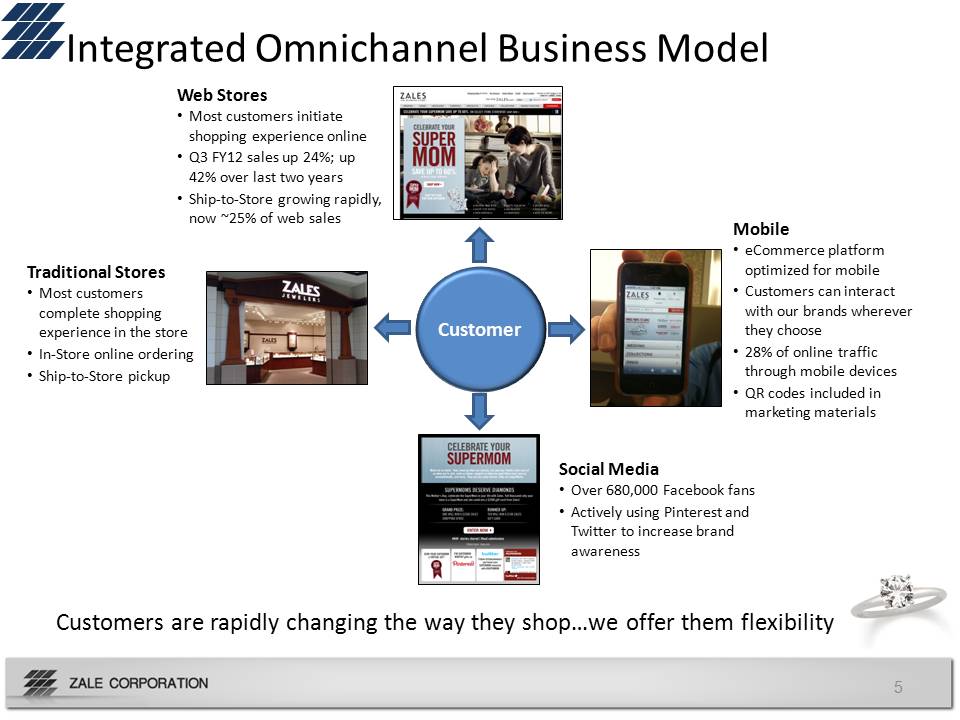
5 Customers are rapidly changing the way they shop…we offer them flexibility Traditional Stores • Most customers complete shopping experience in the store • In‐Store online ordering • Ship‐to‐Store pickup Mobile • eCommerce platform optimized for mobile • Customers can interact with our brands wherever they choose • 28% of online traffic through mobile devices • QR codes included in marketing materials Social Media • Over 680,000 Facebook fans • Actively using Pinterest and Twitter to increase brand awareness Web Stores • Most customers initiate shopping experience online • Q3 FY12 sales up 24%; up 42% over last two years • Ship‐to‐Store growing rapidly, now ~25% of web sales Customer Integrated Omnichannel Business Model
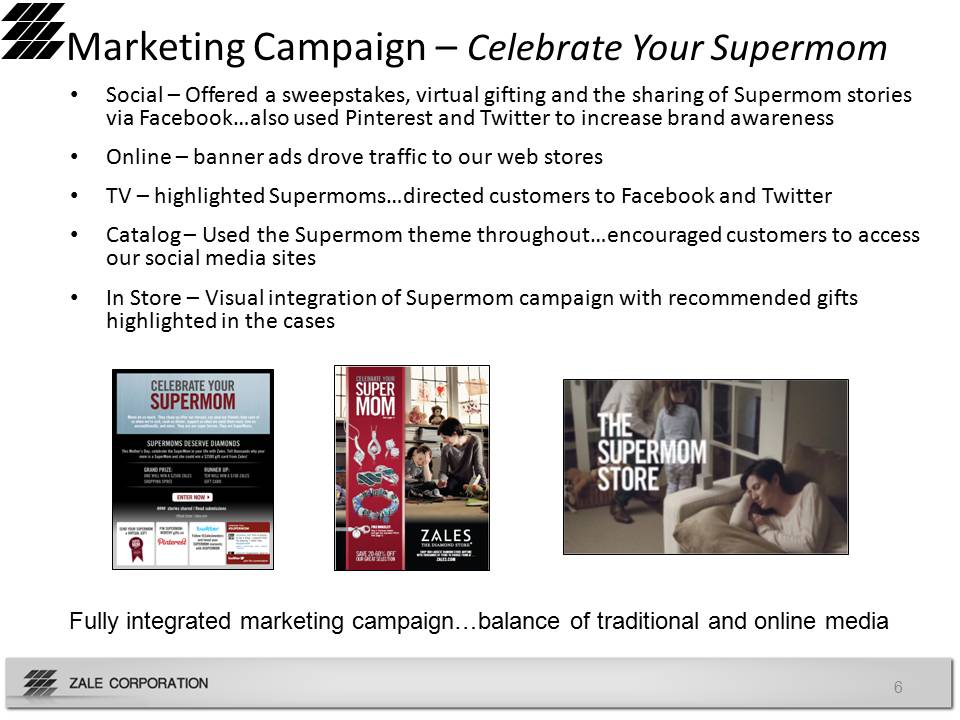
Marketing Campaign – Celebrate Your Supermom • Social – Offered a sweepstakes, virtual gifting and the sharing of Supermom stories via Facebook…also used Pinterest and Twitter to increase brand awareness • Online – banner ads drove traffic to our web stores • TV – highlighted Supermoms…directed customers to Facebook and Twitter • Catalog – Used the Supermom theme throughout…encouraged customers to access our social media sites • In Store – Visual integration of Supermom campaign with recommended gifts highlighted in the cases 6 Fully integrated marketing campaign…balance of traditional and online media
Q3 FY12 Highlights • Driving efficiencies in the business – Streamlined operations by integrating Pagoda Distribution into the Zale North America Distribution Center – Held Top 50 Vendor Summit…working with key suppliers to enhance effectiveness of our supply chain – SG&A as a percent of revenue improved 120 bps, while we continued to make investments in key growth areas • Building executive management team – Jamie Singleton joined as Senior Vice President and General Manager of Piercing Pagoda �� Experienced retail executive with background in merchandising and business development �� Will provide focus on growing the business 7
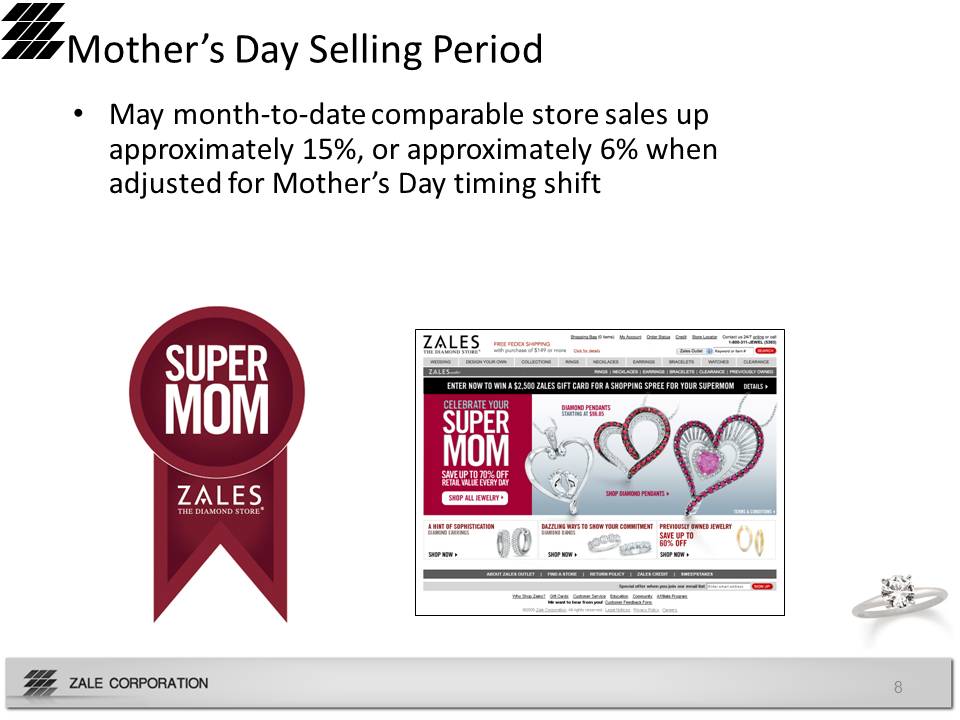
Mother’s Day Selling Period • May month‐to‐date comparable store sales up approximately 15%, or approximately 6% when adjusted for Mother’s Day timing shift 8
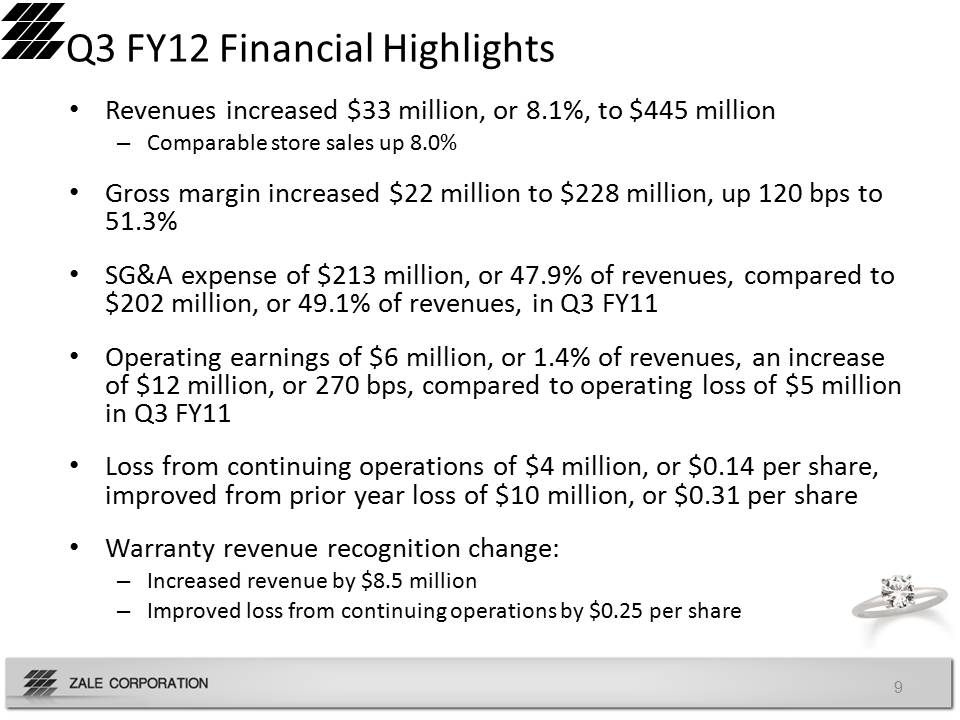
Q3 FY12 Financial Highlights • Revenues increased $33 million, or 8.1%, to $445 million – Comparable store sales up 8.0% • Gross margin increased $22 million to $228 million, up 120 bps to 51.3% • SG&A expense of $213 million, or 47.9% of revenues, compared to $202 million, or 49.1% of revenues, in Q3 FY11 • Operating earnings of $6 million, or 1.4% of revenues, an increase of $12 million, or 270 bps, compared to operating loss of $5 million in Q3 FY11 • Loss from continuing operations of $4 million, or $0.14 per share, improved from prior year loss of $10 million, or $0.31 per share • Warranty revenue recognition change: – Increased revenue by $8.5 million – Improved loss from continuing operations by $0.25 per share 9
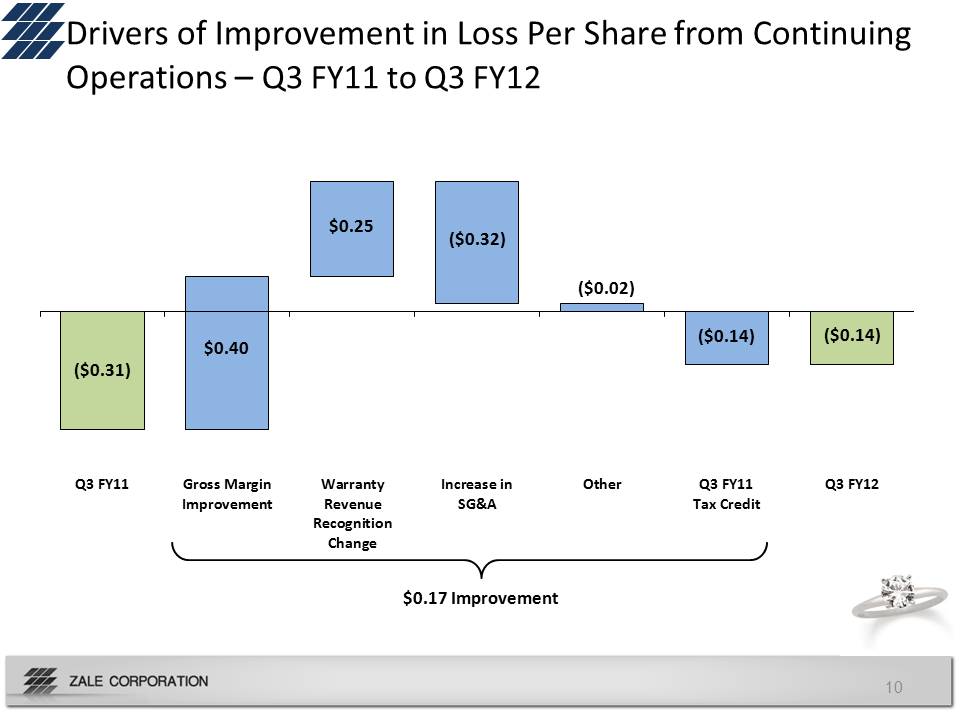
10 Drivers of Improvement in Loss Per Share from Continuing Operations – Q3 FY11 to Q3 FY12 $0.17 Improvement Q3 FY11 Gross Margin Improvement Warranty Revenue Recognition Change Increase in SG&A Other Q3 FY11 Tax Credit Q3 FY12 ($0.31) ($0.14) $0.25 ($0.32) $0.40 ($0.14) ($0.02)
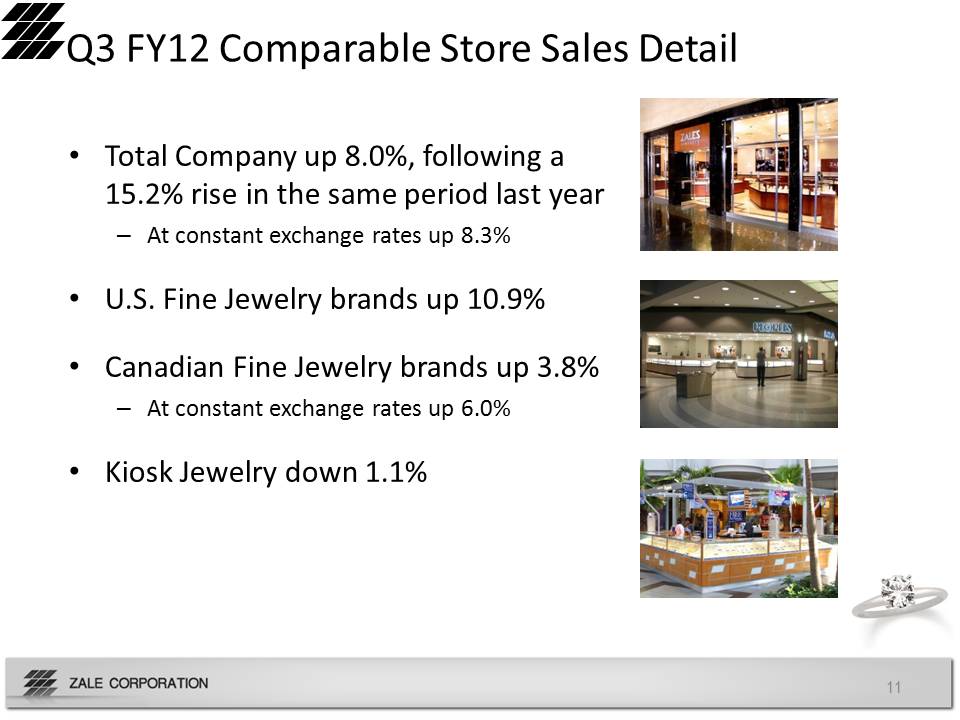
Q3 FY12 Comparable Store Sales Detail • Total Company up 8.0%, following a 15.2% rise in the same period last year – At constant exchange rates up 8.3% • U.S. Fine Jewelry brands up 10.9% • Canadian Fine Jewelry brands up 3.8% – At constant exchange rates up 6.0% • Kiosk Jewelry down 1.1% 11
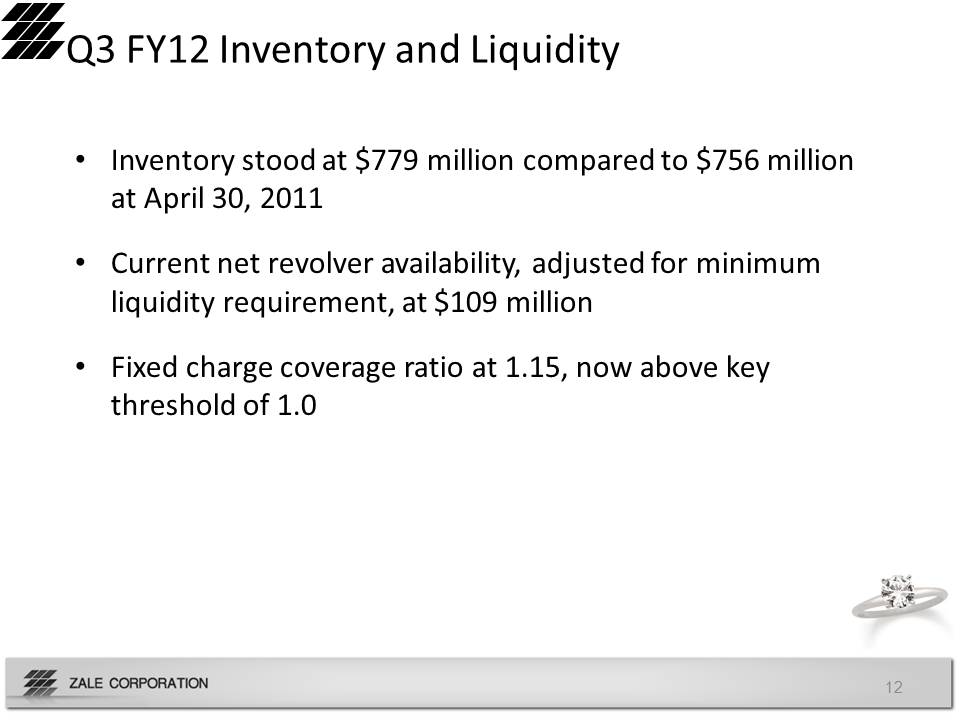
Q3 FY12 Inventory and Liquidity • Inventory stood at $779 million compared to $756 million at April 30, 2011 • Current net revolver availability, adjusted for minimum liquidity requirement, at $109 million • Fixed charge coverage ratio at 1.15, now above key threshold of 1.0 12
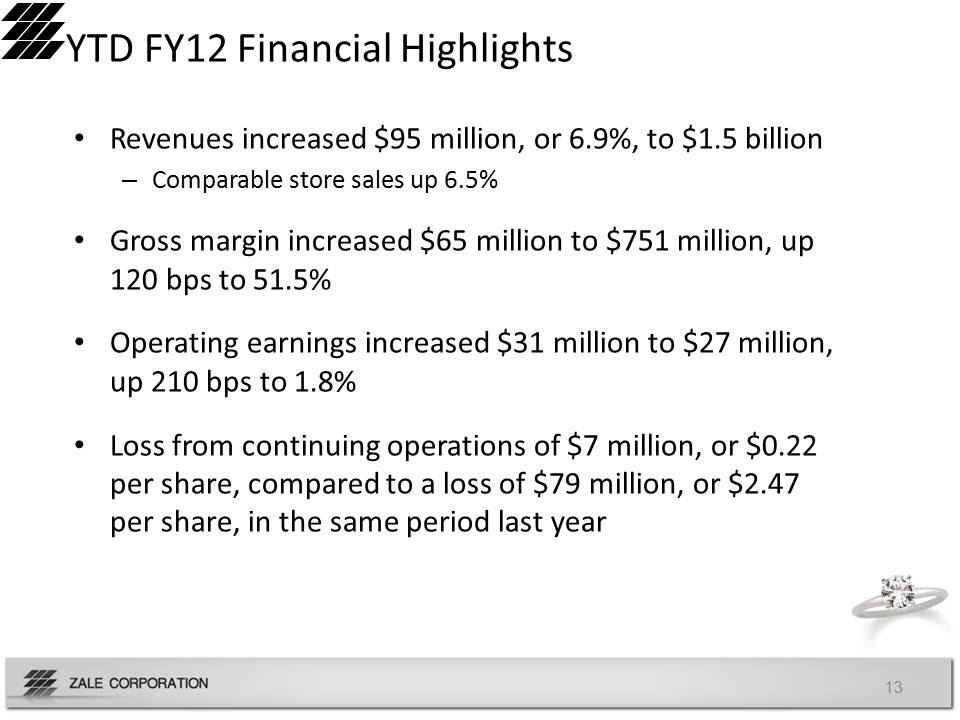
YTD FY12 Financial Highlights • Revenues increased $95 million, or 6.9%, to $1.5 billion – Comparable store sales up 6.5% • Gross margin increased $65 million to $751 million, up 120 bps to 51.5% • Operating earnings increased $31 million to $27 million, up 210 bps to 1.8% • Loss from continuing operations of $7 million, or $0.22 per share, compared to a loss of $79 million, or $2.47 per share, in the same period last year 13
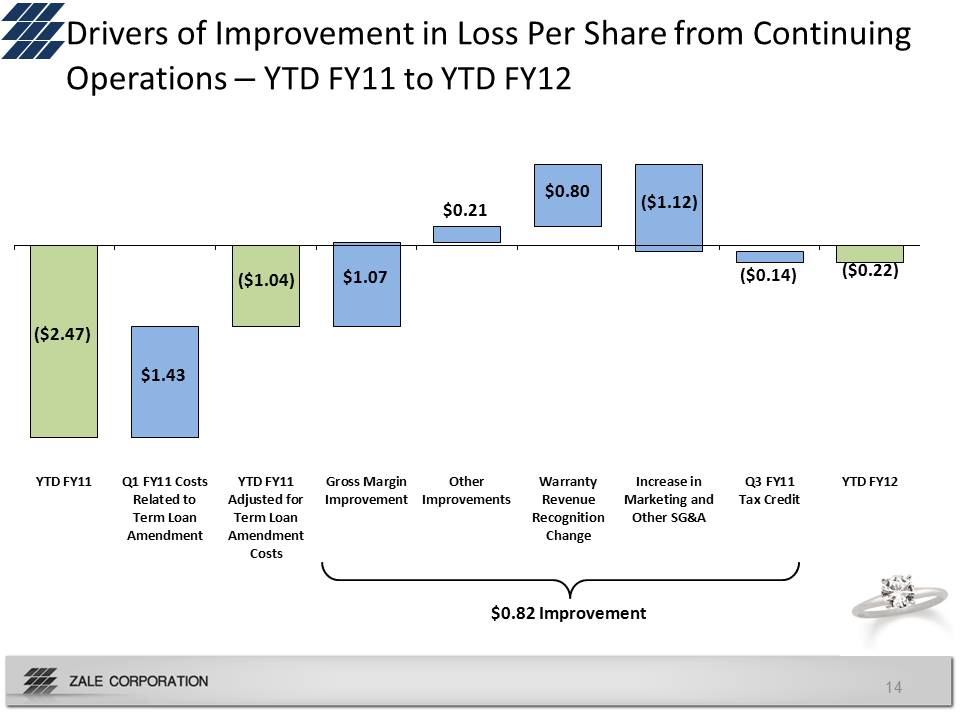
14 $0.82 Improvement YTD FY11 Q1 FY11 Costs Related to Term Loan Amendment YTD FY11 Adjusted for Term Loan Amendment Costs Gross Margin Improvement Other Improvements Warranty Revenue Recognition Change Increase in Marketing and Other SG&A Q3 FY11 Tax Credit YTD FY12 ($2.47) ($0.22) $0.21 ($1.12) $1.07 $0.80 $1.43 ($1.04) ($0.14) Drivers of Improvement in Loss Per Share from Continuing Operations – YTD FY11 to YTD FY12
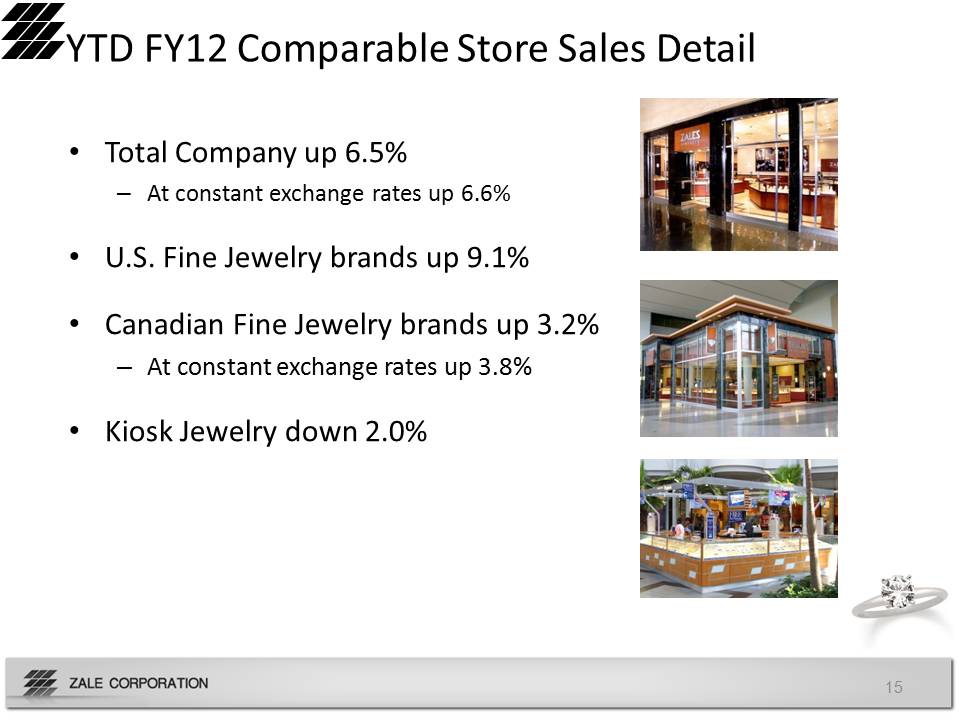
YTD FY12 Comparable Store Sales Detail • Total Company up 6.5% – At constant exchange rates up 6.6% • U.S. Fine Jewelry brands up 9.1% • Canadian Fine Jewelry brands up 3.2% – At constant exchange rates up 3.8% • Kiosk Jewelry down 2.0% 15
• Revenue growth – Continue to drive positive quarterly comps and revenue growth • Improve margins – Maintain gross margin >50% �� Focus on maximizing gross profit dollars �� Closely monitor commodity costs / pricing – We expect SG&A as a percent of revenue in Q4 FY12 to be below Q4 FY11 percent of revenue level Source: Millward Brown consumer attitude tracking study (January 22, 2011) 16 Q4 FY12
Appendix 17
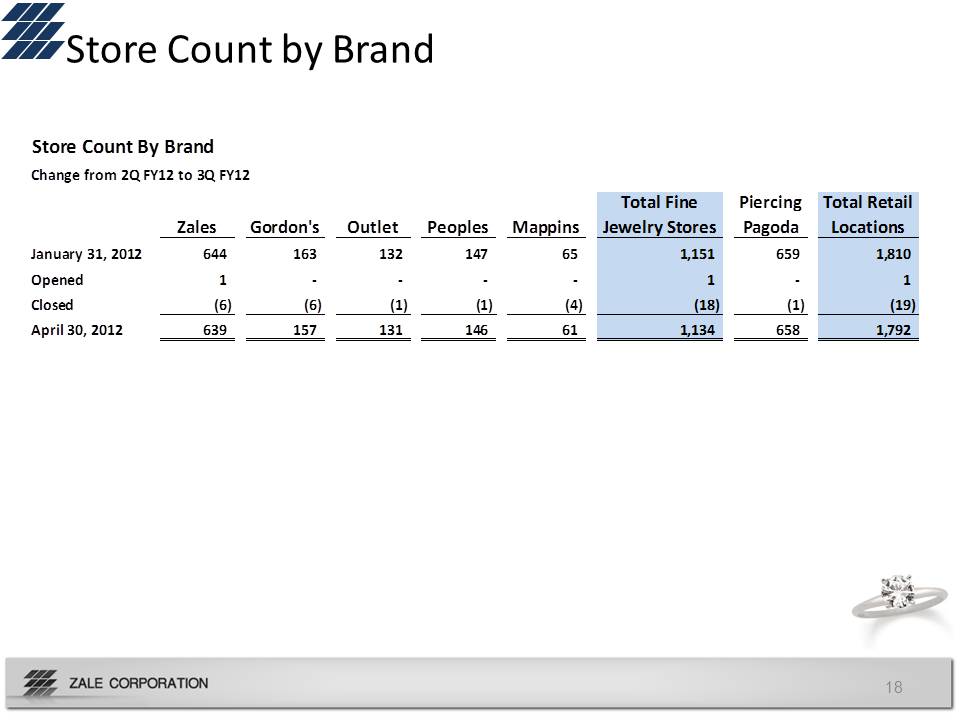
18 Store Count by Brand Store Count By Brand Change from 2Q FY12 to 3Q FY12 Zales Gordon's Outlet Peoples Mappins Total Fine Jewelry Stores Piercing Pagoda Total Retail Locations January 31, 2012 644 163 132 147 65 1,151 659 1,810 Opened 1 ‐ ‐ ‐ ‐ 1 ‐ 1 Closed (6) (6) (1) (1) (4) (18) (1) (19) April 30, 2012 639 157 131 146 61 1,134 658 1,792
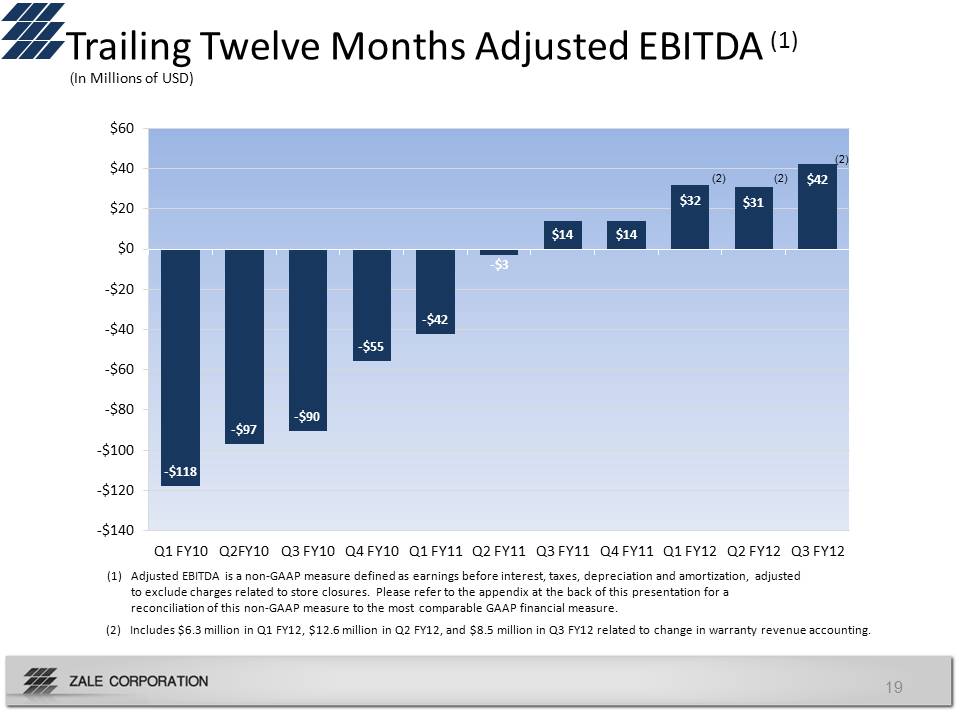
‐$118 ‐$97 ‐$90 ‐$55 ‐$42 ‐$3 $14 $14 $32 $31 $42 ‐$140 ‐$120 ‐$100 ‐$80 ‐$60 ‐$40 ‐$20 $0 $20 $40 $60 Q1 FY10 Q2FY10 Q3 FY10 Q4 FY10 Q1 FY11 Q2 FY11 Q3 FY11 Q4 FY11 Q1 FY12 Q2 FY12 Q3 FY12 Trailing Twelve Months Adjusted EBITDA (1) ($ in Millions) (1) Adjusted EBITDA is a non‐GAAP measure defined as earnings before interest, taxes, depreciation and amortization, adjusted to exclude charges related to store closures. Please refer to the appendix at the back of this presentation for a reconciliation of this non‐GAAP measure to the most comparable GAAP financial measure 19 (2) (2) Includes $6.3 million in Q1 FY12, $12.6 million in Q2 FY12, and $8.5 million in Q3 FY12 related to change in warranty revenue accounting. (In Millions of USD) (2) (2)
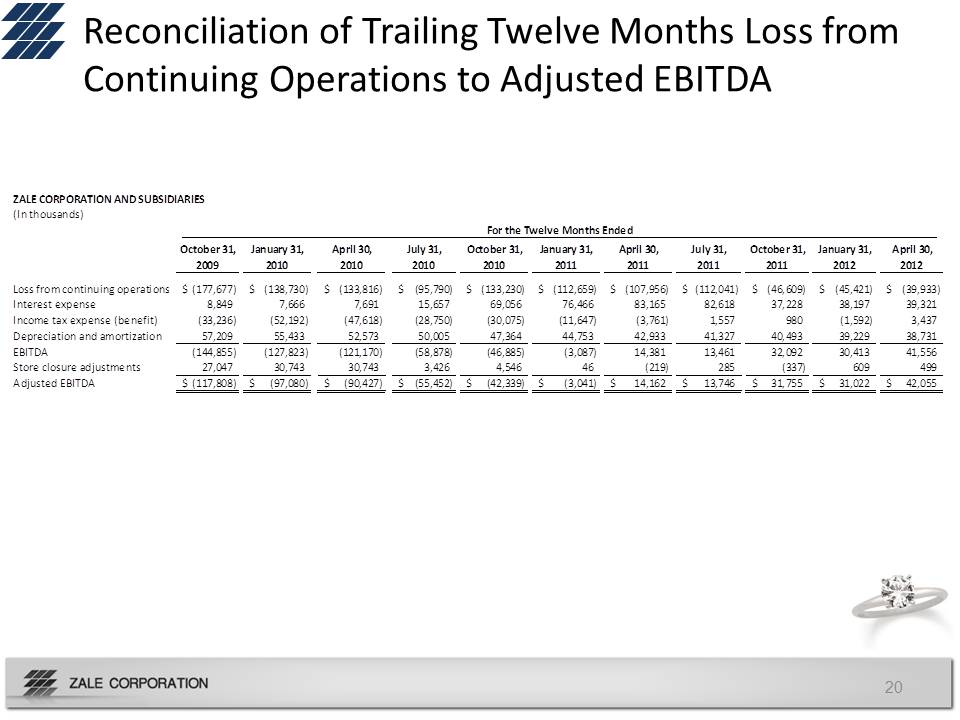
Reconciliation of Trailing Twelve Months Loss from Continuing Operations to Adjusted EBITDA ($ in Millions) 20 ZALE CORPORATION AND SUBSIDIARIES (In thousands) October 31, 2009 January 31, 2010 April 30, 2010 July 31, 2010 October 31, 2010 January 31, 2011 April 30, 2011 July 31, 2011 October 31, 2011 January 31, 2012 April 30, 2012 Loss from continuing operations (177,677) $ (138,730) $ (133,816) $ (95,790) $ (133,230) $ (112,659) $ (107,956) $ (112,041) $ (46,609) $ (45,421) $ (39,933) $ Interest expense 8,849 7,666 7,691 15,657 69,056 76,466 83,165 82,618 37,228 38,197 39,321 Income tax expense (benefit) (33,236) (52,192) (47,618) (28,750) (30,075) (11,647) (3,761) 1,557 980 (1,592) 3,437 Depreciation and amortization 57,209 55,433 52,573 50,005 47,364 44,753 42,933 41,327 40,493 39,229 38,731 EBITDA (144,855) (127,823) (121,170) (58,878) (46,885) (3,087) 14,381 13,461 32,092 30,413 41,556 Store closure adjustments 27,047 30,743 30,743 3,426 4,546 46 (219) 285 (337) 609 499 Adjusted EBITDA (117,808) $ (97,080) $ (90,427) $ (55,452) $ (42,339) $ (3,041) $ 14,162 $ 13,746 $ 31,755 $ 31,022 $ 42,055 $ For the Twelve Months Ended