Attached files
| file | filename |
|---|---|
| 8-K - FORM 8-K - ASSOCIATED BANC-CORP | d356445d8k.htm |
 Associated Banc-Corp
Investor Presentation
Second Quarter 2012
May 21, 2012
Exhibit 99.1 |
 Forward-Looking Statements
1
Statements made in this presentation which are not purely historical are forward-looking
statements, as defined in the Private Securities Litigation Reform Act of 1995. This
includes any statements regarding management’s plans, objectives, or goals for future
operations, products or services, and forecasts of its revenues, earnings, or other
measures of performance. Such forward-looking statements may be identified by the
use of words such as “believe”, “expect”, “anticipate”,
“plan”, “estimate”, “should”, “will”,
“intend”, “outlook”, or similar expressions. Forward-looking statements
are based on current management expectations and, by their nature, are subject to risks and
uncertainties. Actual results may differ materially from those contained in the
forward- looking statements. Factors which may cause actual results to differ
materially from those contained in such forward-looking statements include those
indentified in the company’s most recent Form 10-K and subsequent SEC filings.
Such factors are incorporated herein by reference.
Important
note
regarding
forward-looking
statements: |
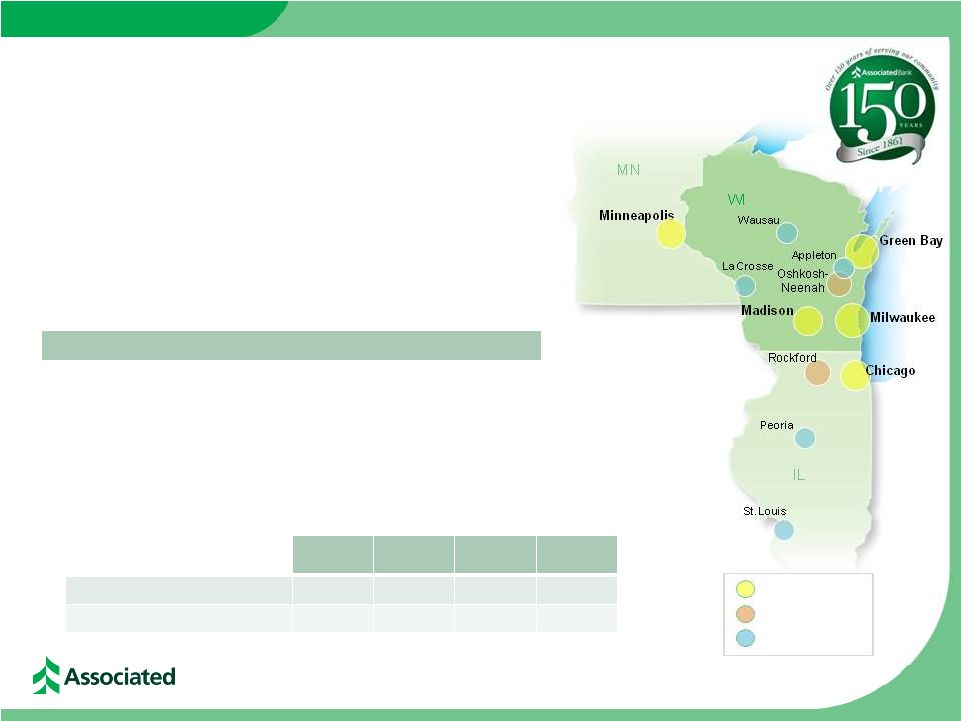 Leading Midwest Banking Franchise
2
•
Top 50 U.S. bank holding company with $22 billion in assets
•
Largest bank headquartered in Wisconsin
–
More than 250 banking offices serving over 150 communities
–
#1
mortgage
originator
in
Wisconsin
¹
–
#1
SBA
lender
in
Wisconsin
²
>$1bn
deposits
³
>$500m
deposits
³
>$250m
deposits
³
Operating in Attractive Midwest Markets
•
Wisconsin
and
Minnesota
continue
to
show
above
average
employment
levels
4
•
Midwest
Manufacturing
output
is
up
8.6%
year-over-year
(vs.
5.0%
nationally)
5
•
Midwest
Steel
output
is
up
11.2%
YoY;
Midwest
Machinery
output
is
up
10.4%
YoY
5
•
Midwest
Economy
Index
at
the
highest
level
since
March
1995
6
WI
MN
IL
U.S.
Unemployment
Rate
4
6.8%
5.8%
8.8%
8.1%
ASBC Deposits ($ in billions)
$10.7
$1.4
$3.6
$15.7
¹
Based
on
2010
number
of
funded
mortgage
loans
per
HMDA
data;
²
Based
on
2011
FY
number
of
funded
SBA loans;
3
FDIC
market
share
data
6/30/11;
4
Source:
U.S.
BLS,
Mar.
2012,
April
2012
(US);
5
Source:
FRB
Chicago Midwest
Manufacturing Index, Mar. 2012;
6
Source: FRB Midwest Economy Index, Mar. 2012 |
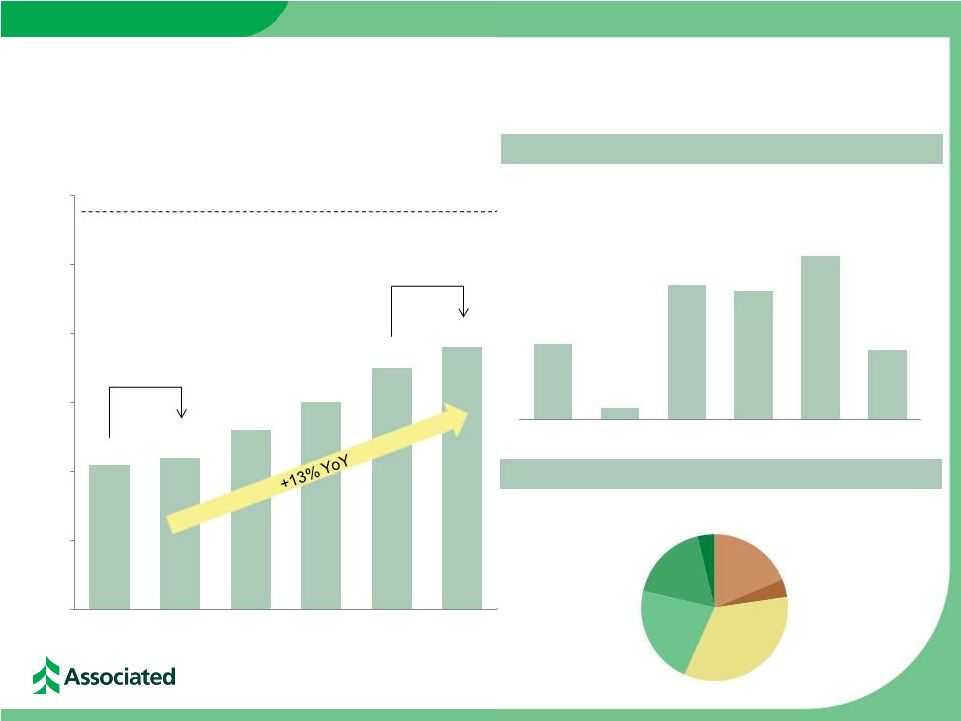 Core
Organic Loan Growth 3
Total Loans of $14.3 billion at March 31, 2012
Quarterly Net Loan Growth Trend
Total Loans ($ in billions)
+2% QoQ
Peak Loans (4Q 2008) $16.3 billion
Loan
Mix
–
1Q
2012
<1% QoQ
($ in millions)
$12.6
$12.7
$13.1
$13.5
$14.0
$14.3
$10.5
$11.5
$12.5
$13.5
$14.5
$15.5
$16.5
4Q 2010
1Q 2011
2Q 2011
3Q 2011
4Q 2011
1Q 2012
CRE Investor
19%
Construction
4%
Commercial
& Business
Lending
34%
Res Mtg
22%
Home Equity
17%
Consumer
4%
$244
$39
$434
$414
$528
$223
4Q 2010
1Q 2011
2Q 2011
3Q 2011
4Q 2011
1Q 2012 |
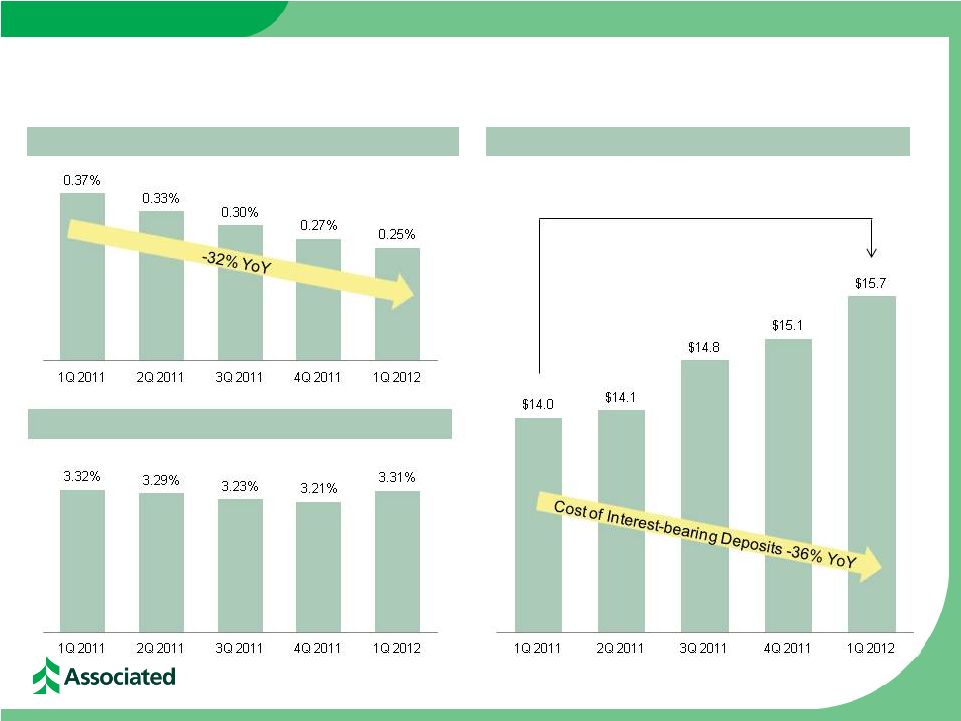 Disciplined Deposit Pricing and Stable Margins
4
Cost of Money Market Deposits
$6.2b
$5.0b
$5.0b
$5.2b
Total Deposits
($ balances in billions)
$5.2b
Total Deposits of $15.7 billion at March 31, 2012
+ 12% YoY
0.43%
0.67%
0.63%
0.56%
0.53%
Net Interest Margin |
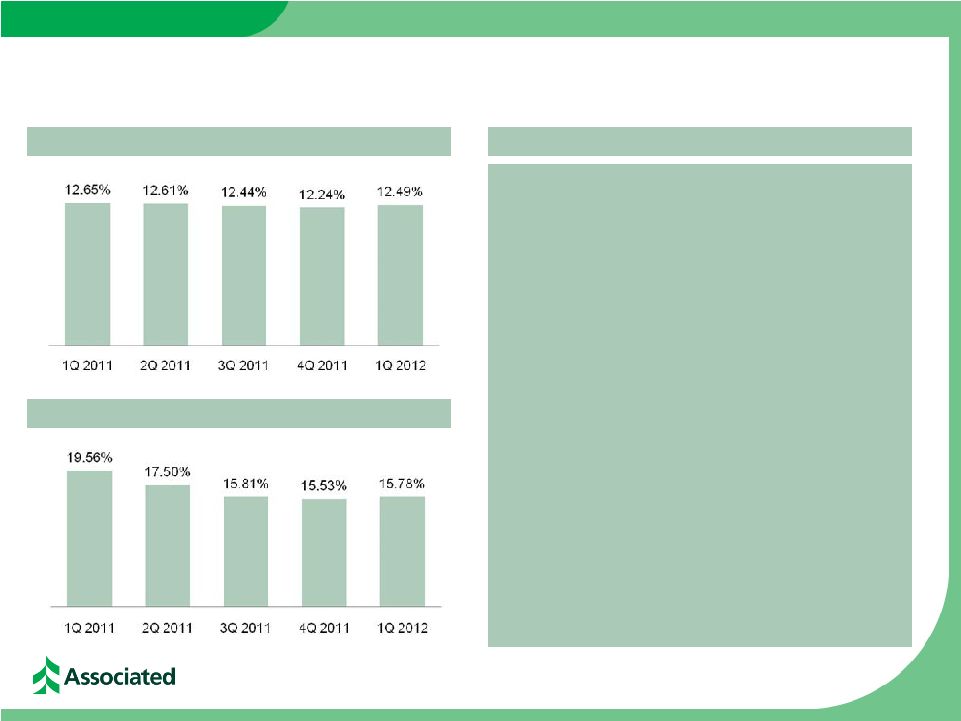 Strong Capital Profile
•
Funding organic growth
–
Re-mixing securities run-off
into loans
increases risk-weighted assets
–
Sufficient capital to fund contemplated
organic growth
•
Paying a competitive dividend
–
Increased quarterly dividend to $.05/share
•
M&A opportunities
–
Disciplined; in-market consolidation focus
•
Buy-backs of common stock & redemption of
other capital instruments
–
Announced $30 million common buy-back
& $25 million partial redemption of TOPrS
5
Tier 1 Common Equity Ratio
Total Risk-Based Capital Ratio
Capital Priorities |
 Creating Shareholder Value
6
Loan Growth
•
Approximately 3% quarterly
growth
Deposit Growth
Fee Income
Expenses
NIM
Positioned for Growth; Full-Year 2012 Outlook
Footprint
Credit
Capital
•
Continued run-off of high cost
CDs & disciplined deposit pricing
•
Sustained focus on treasury
management solutions to drive
growth in commercial deposits
•
Relatively stable on a full-year
basis compared to FY 2011
•
Modest improvement YoY;
reduced mortgage banking
income going forward
•
Low single-digit YoY growth;
including the cost of BSA
enhancements & savings from
branch consolidations
•
Net consolidation in branch
network while remodeling and
renovations continue
•
Continuing to invest in growth
markets
•
Continuing improvement in
credit trends
•
Very modest provision outlook
•
Disciplined, value-added
approach to capital
deployment over time |
 Why
Associated 7
Net Income
Available to
Common
($ in millions)
Return on Tier 1
Common Equity
Reasons to Invest
Net Income & ROT1CE
Management Team Focused on Creating
Shareholder Value
$15
$26
$34
$40
$41
3.76%
6.07%
7.83%
8.96%
9.23%
0.00%
5.00%
10.00%
15.00%
$0
$15
$30
$45
1Q 2011
2Q 2011
3Q 2011
4Q 2011
1Q 2012
•
Leading Midwest Bank Operating in
Attractive Markets
•
Core Organic Growth Opportunity
•
Disciplined Deposit Pricing & Stable Margin •
Improving Credit Quality
•
Strong Capital Profile & Opportunities for
Capital Deployment
•
Improving Earnings Profile
|
 Associated
Banc-Corp will be the most admired Midwestern financial services company,
distinguished by sound, value-added financial solutions with personal service for our
customers, built upon a strong commitment to our colleagues and the communities we serve,
resulting in exceptional value for our shareholders. |
 Appendix
9 |
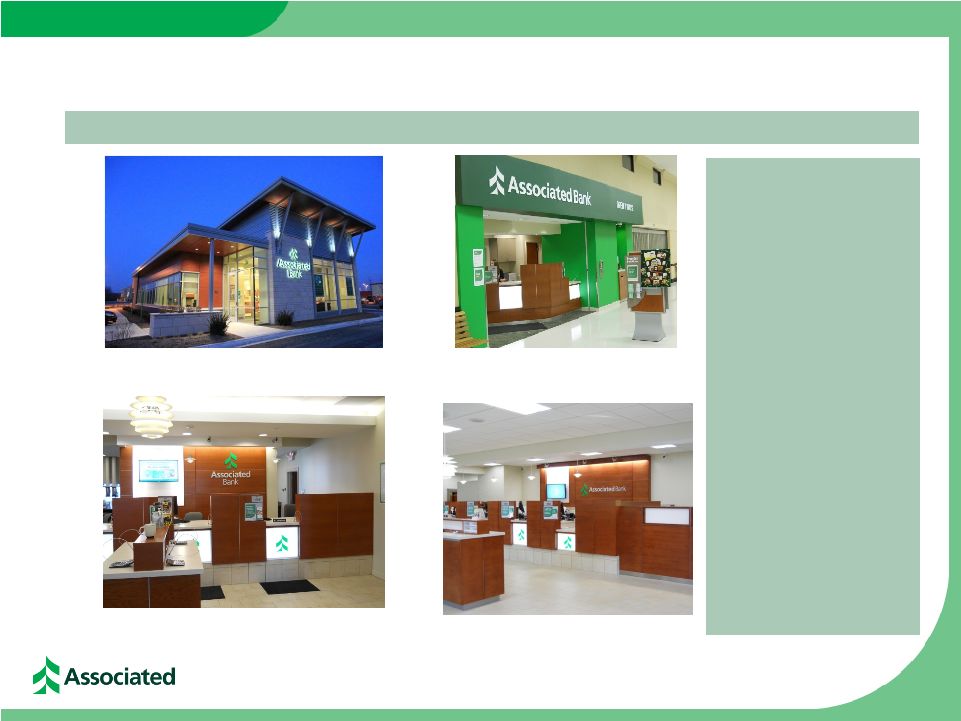 Footprint Update
10
Relocated office in Waukesha, WI
Janesville, WI Pick ‘N Save in-store remodel
Remodeled office in Muskego, WI
Remodeled office in St. Francis, WI
Differentiating Associated in Branch Banking
Highlights
•
Completed the remodel,
relocation, or new
construction of over 30
branches in 2011
•
FY 2011 PPE expense
of $77 million includes
ongoing investments in
franchise
•
Planned consolidation
of 21 branches in
1H2012
•
Announced three
additional branch sales in
Jan. 2012; these locations
are well outside of core
retail footprint
•
50 remodels planned in
2012 |
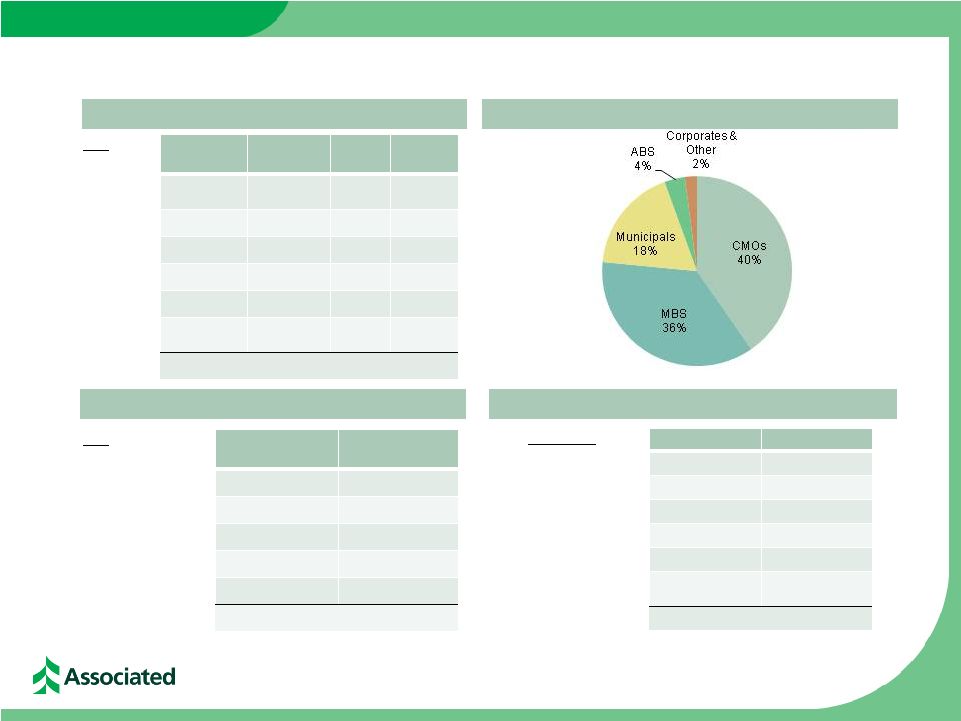 Credit Rating
Mkt Value (000’s)
% of Total
Govt & Agency
$ 3,566,112
76%
AAA
177,419
4%
AA
777,042
17%
A
104,671
2%
BAA1, BAA2 & BAA3
16,376
---
BA1 & Lower and
Non-rated
27,480
---
TOTAL
$4,669,100
100%
Market Value Composition –
March 31, 2012
Investment Portfolio –
March 31, 2012
High Quality Investment Securities Portfolio
Portfolio Composition Ratings –
March 31, 2012
Risk –
Weighted Profile –
March 31, 2012
11
Type
Mkt Value
(000’s)
% of Total
0% RWA
$ 32,241
1%
20% RWA
4,337,291
93%
50% RWA
40,116
1%
=>100% RWA
96,462
2%
Not subject to RW
162,990
3%
TOTAL
$4,669,100
100%
Type
Bk Value
(000’s)
Mkt Value
(000’s)
TEY
(%)
Duration
(Yrs)
Govt &
Agencies
$ 1,012
$ 1,008
0.34
2.35
MBS
1,604,801
1,690,263
4.12
2.35
CMOs
1,853,347
1,883,470
2.75
1.31
Municipals
792,854
835,664
5.60
4.59
ABS
163,466
163,014
0.75
0.19
Corporates &
Other
93,490
95,681
1.85
1.52
TOTAL AFS
$4,508,970
$4,669,100
3.65
2.24 |
 Continued Improvement in Credit Quality Indicators
12
($ in millions)
1Q 2011
2Q 2011
3Q 2011
4Q 2011
1Q 2012
Potential problem loans
$ 912
$ 699
$ 660
$ 566
$ 480
Nonaccruals
$ 488
$ 468
$ 403
$ 357
$ 327
Provision for loan losses
$ 31
$ 16
$ 4
$ 1
$ 0
Net charge offs
$ 53
$ 45
$ 30
$ 23
$ 22
ALLL/Total loans
3.59%
3.25%
2.96%
2.70%
2.50%
ALLL/Nonaccruals
93.07%
91.09%
99.09%
105.99%
108.93%
NPA/Assets
2.50%
2.33%
2.03%
1.82%
1.65%
Nonaccruals/Loans
3.86%
3.57%
2.99%
2.54%
2.29%
NCOs / Avg Loans
1.71%
1.37%
0.90%
0.64%
0.61% |
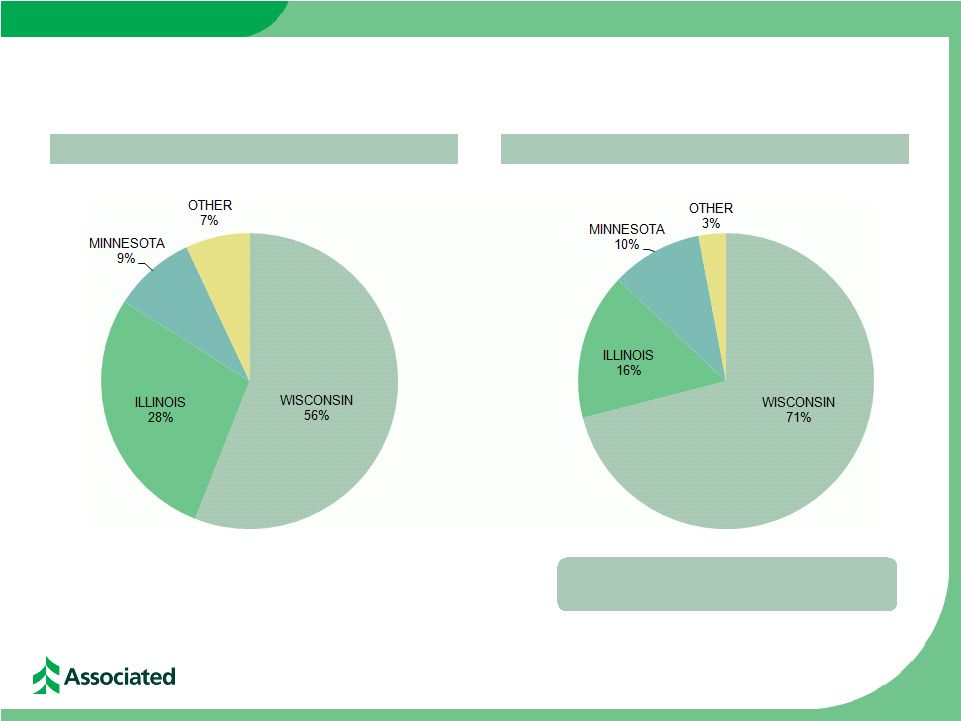 Consumer Loan Portfolios by Geography
13
(as of March 31, 2012)
Residential Mortgage Loans by State
Home Equity Loans by State
Approximately half of home equity
portfolio is in first-lien position |
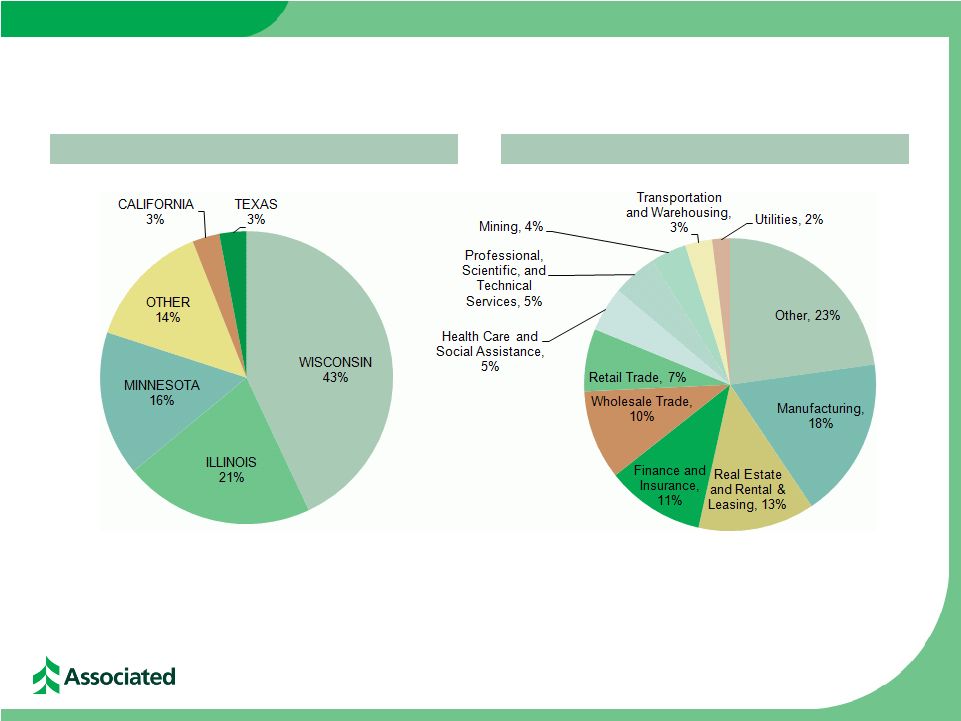 14
Commercial & Business Lending Loans
Commercial & Business Lending portfolio of $4.9 billion, or 34% of Total Loans,
at March 31, 2012 Commercial & Business Lending Loans by State
Commercial & Business Lending Loans by Industry |
 15
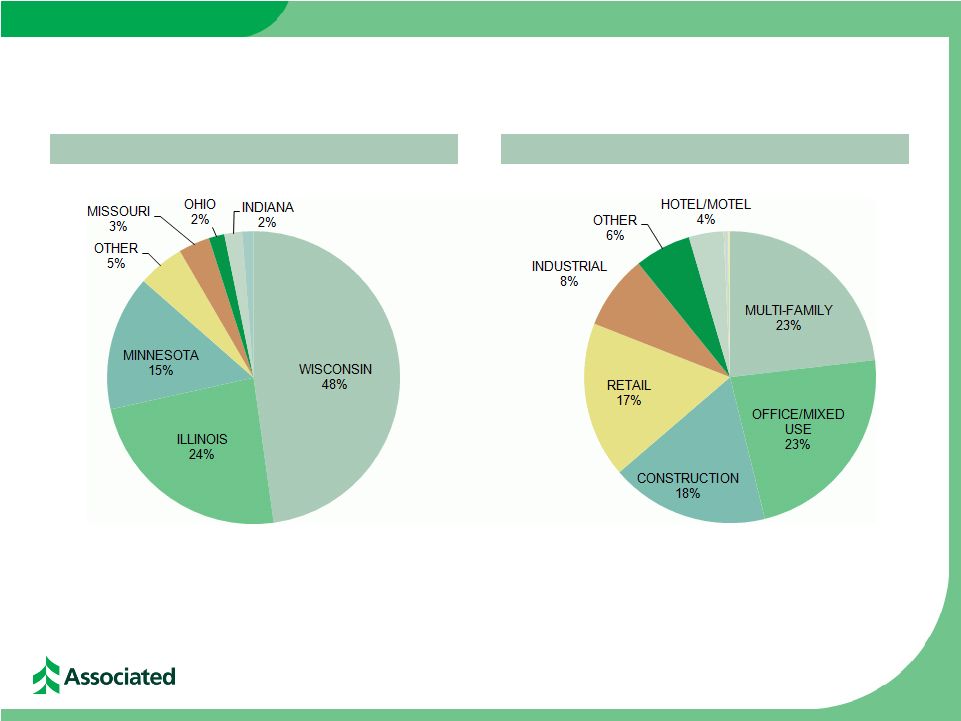
Commercial Real Estate Lending Loans
Commercial
Real
Estate
Lending
portfolio
of
$3.2
billion,
or
23%
of
Total
Loans,
at
March
31,
2012
Commercial Real Estate Lending Loans by State
Commercial Real Estate Lending Loans by Collateral |