Attached files
| file | filename |
|---|---|
| 8-K - KEATING CAPITAL, INC. 8-K - CROSSROADS LIQUIDATING TRUST | a50275788.htm |
| EX-99.1 - EXHIBIT 99.1 - CROSSROADS LIQUIDATING TRUST | a50275788ex99_1.htm |
Exhibit 99.2
Equity Partners for Companies Primed to Become Public ® May 2012 Presentation Nasdaq: KIPO www.KeatingCapital.com
Disclaimer Keating Capital, Inc. (“Keating Capital”) is a Maryland corporation that has elected to be regulated as a business development company under the Investment Company Act of 1940, as amended. Keating Investments, LLC (“Keating Investments”) is an SEC registered investment adviser and acts as an investment adviser and receives base management and/or incentive fees from Keating Capital. Keating Investments and Keating Capital operate under the generic name of Keating. This presentation is a general communication of Keating and is not intended to be a solicitation to purchase or sell any security. This presentation may contain certain forward-looking statements, including statements with regard to the future performance of Keating Capital. These forward-looking statements are subject to the inherent uncertainties in predicting future results and conditions. Certain factors that could cause actual results to differ materially are included in Keating Capital’s Form 10-K and Form 10-Q, and other SEC filings, and include uncertainties of economic, competitive, and market conditions, and future business decisions all of which are difficult or impossible to predict accurately, and many of which are beyond the control of Keating Capital. Although Keating Capital believes that the assumptions underlying the forward-looking statements included herein are reasonable, any of the assumptions could be inaccurate and therefore there can be no assurance that the forward-looking statements included herein will prove to be accurate. Except as required by the federal securities laws, Keating Capital undertakes no obligation to revise or update this presentation (including the slides presented) or any forward-looking statements contained herein, whether as a result of new information, future events or otherwise. 2
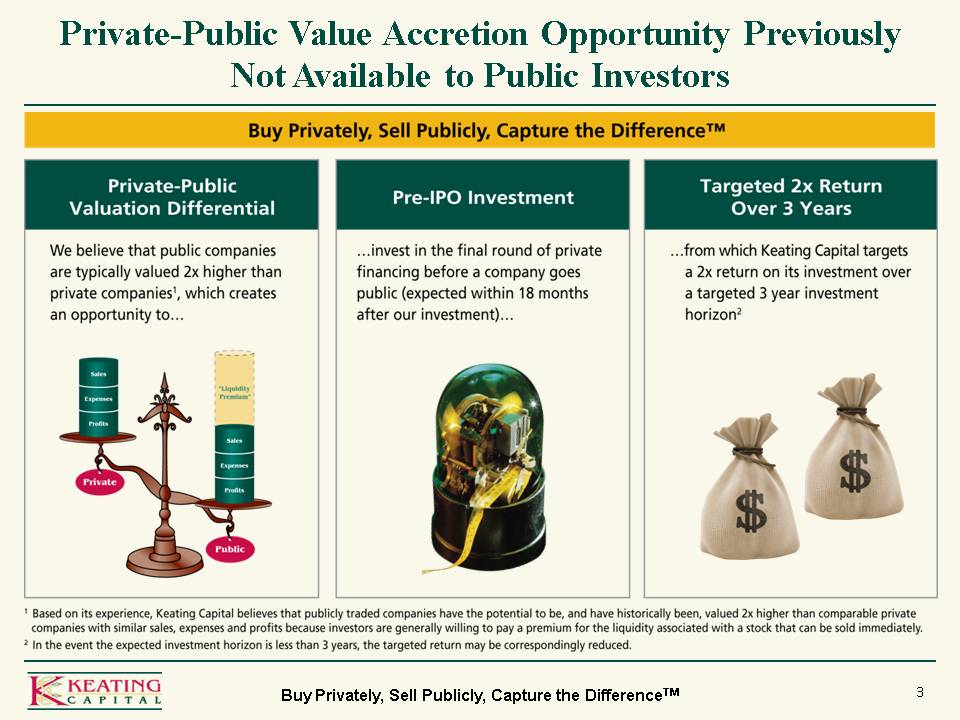
Private-Public Value Accretion Opportunity Previously Not Available to Public Investors Buy Privately, Sell Publicly, Capture the DifferenceTM Private-Public Valuation Differential Pre-IPO Investment Targeted 2x Return Over 3 Years 3
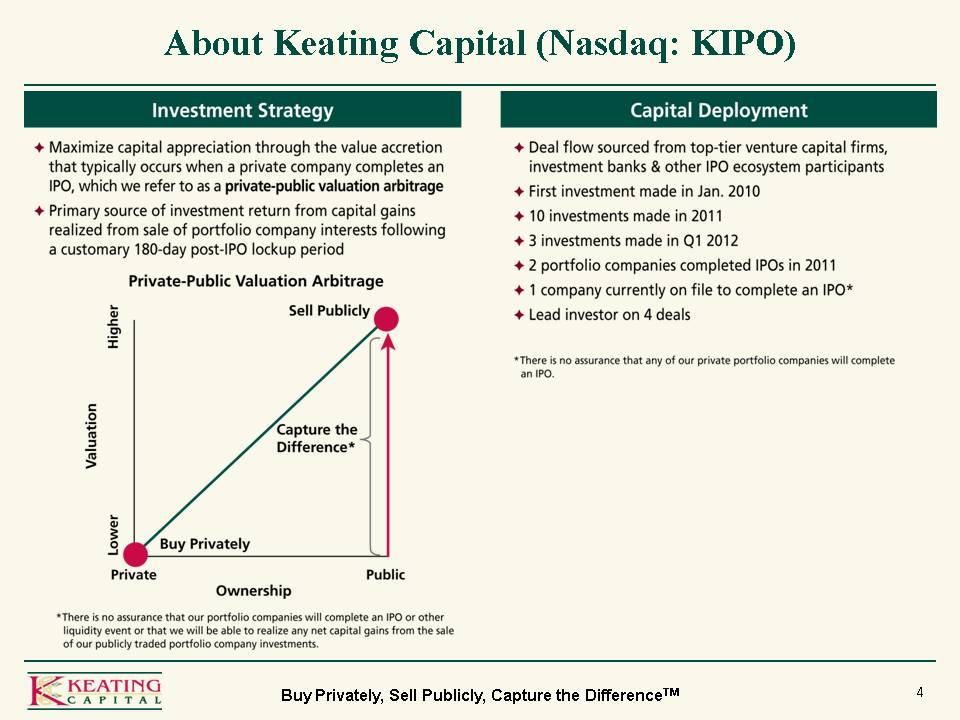
About Keating Capital (Nasdaq: KIPO) Investment Strategy Capital Deployment 4
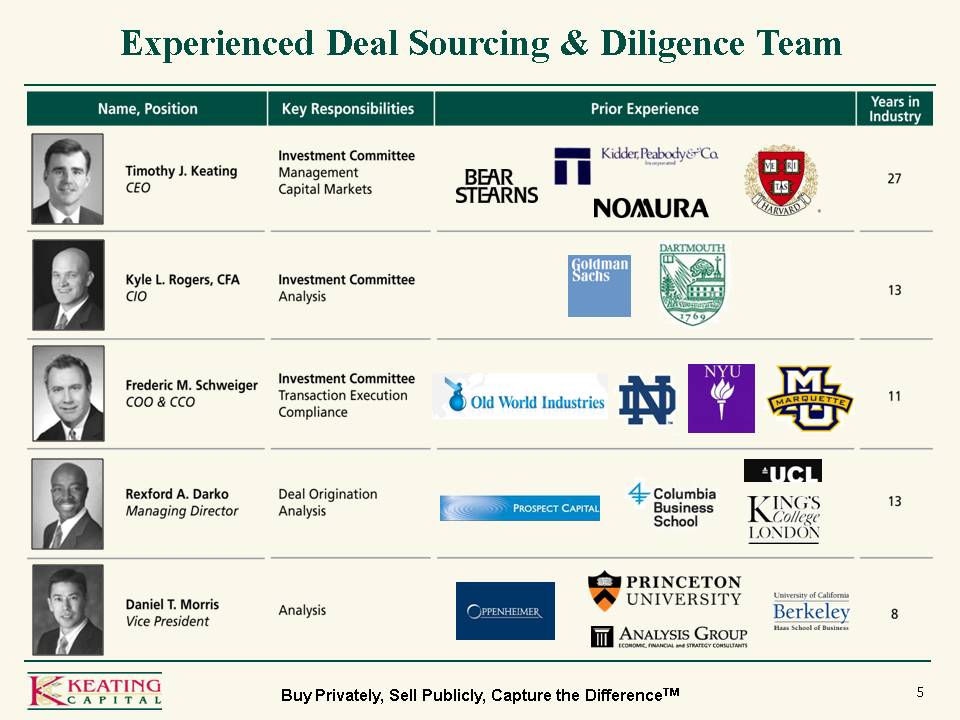
Experienced Deal Sourcing & Diligence Team 5
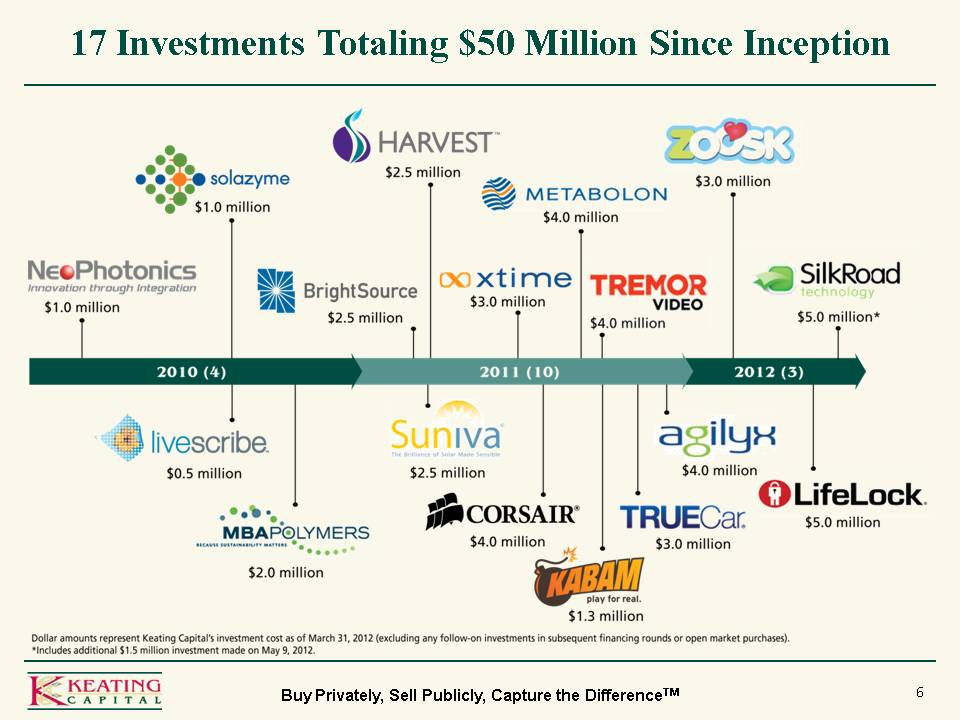
17 Investments Totaling $50 Million Since Inception 6
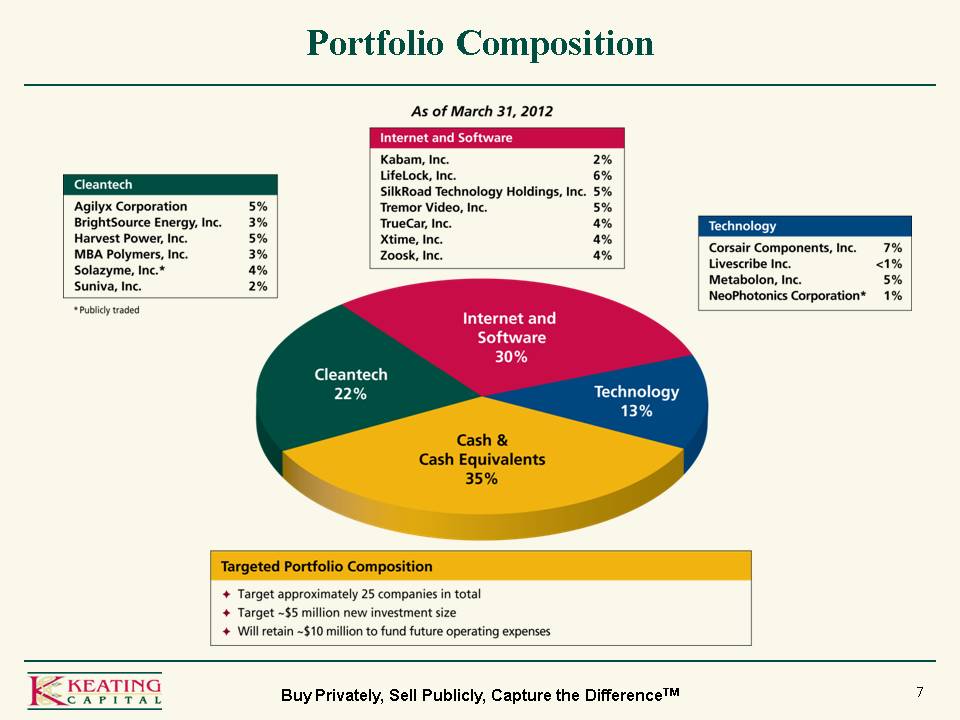
Portfolio Composition Cleantech Internet and Software Technology Targeted Portfolio Composition 7
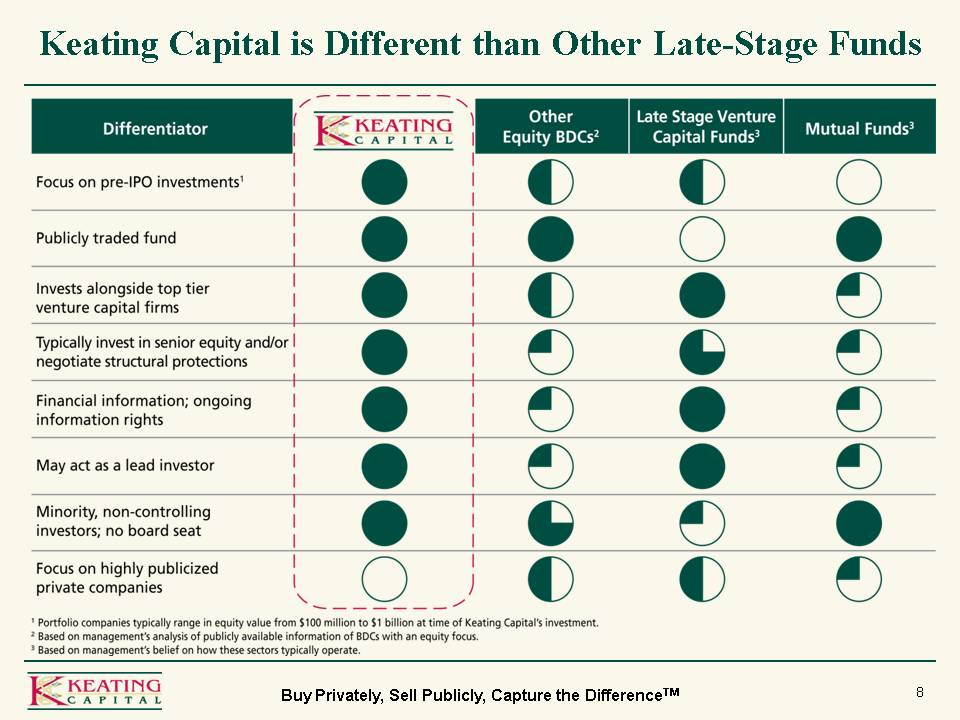
Keating Capital is Different than Other Late-Stage Funds 8
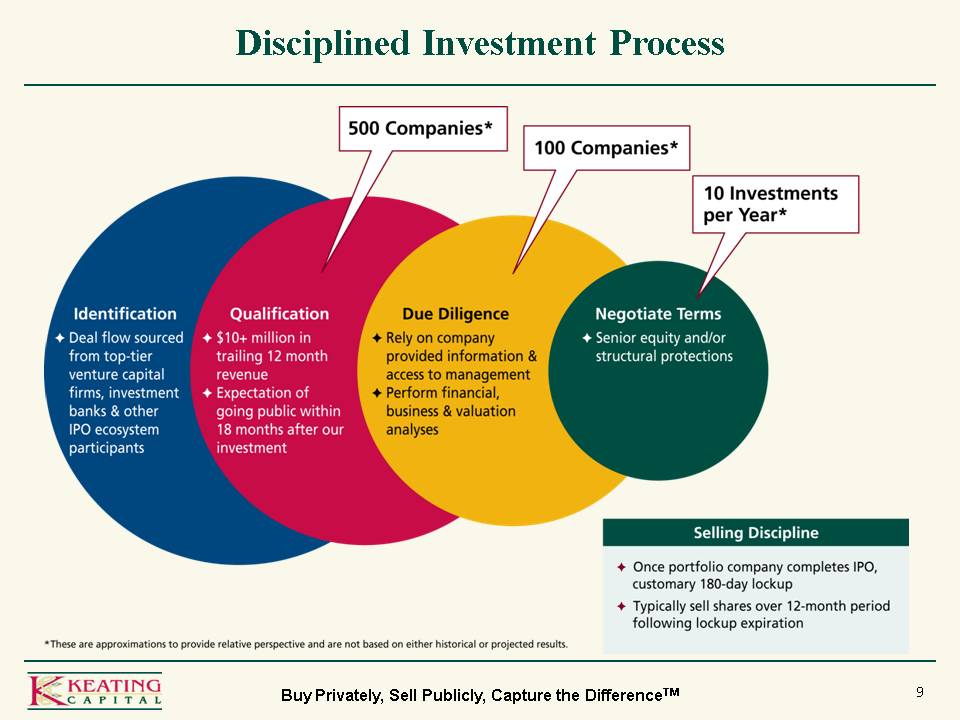
Disciplined Investment Process Selling Discipline 9
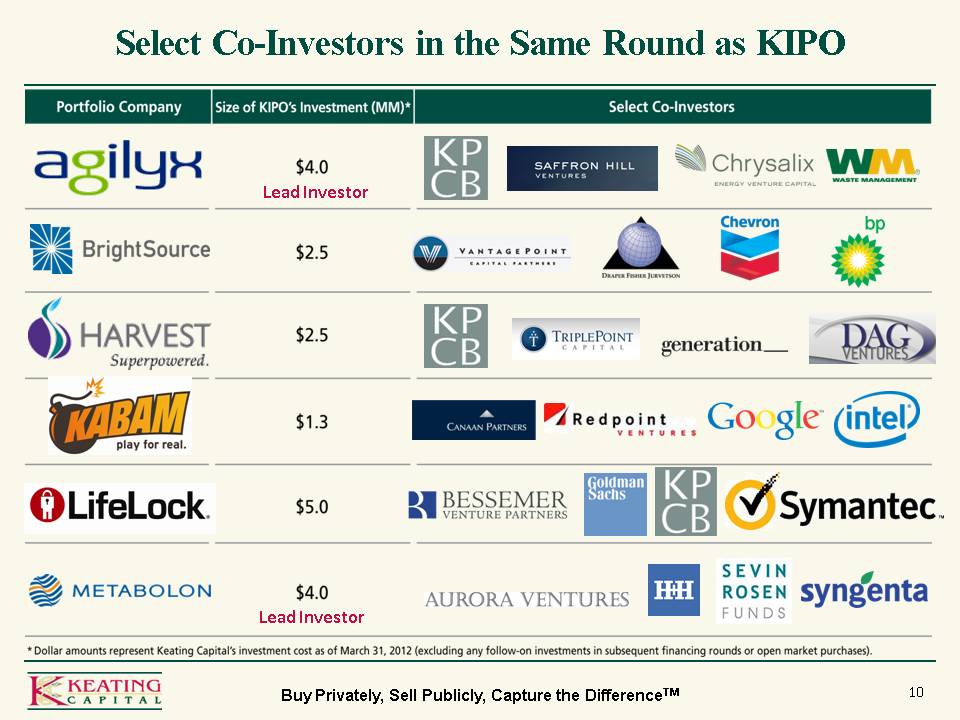
Select Co-Investors in the Same Round as KIPO 10
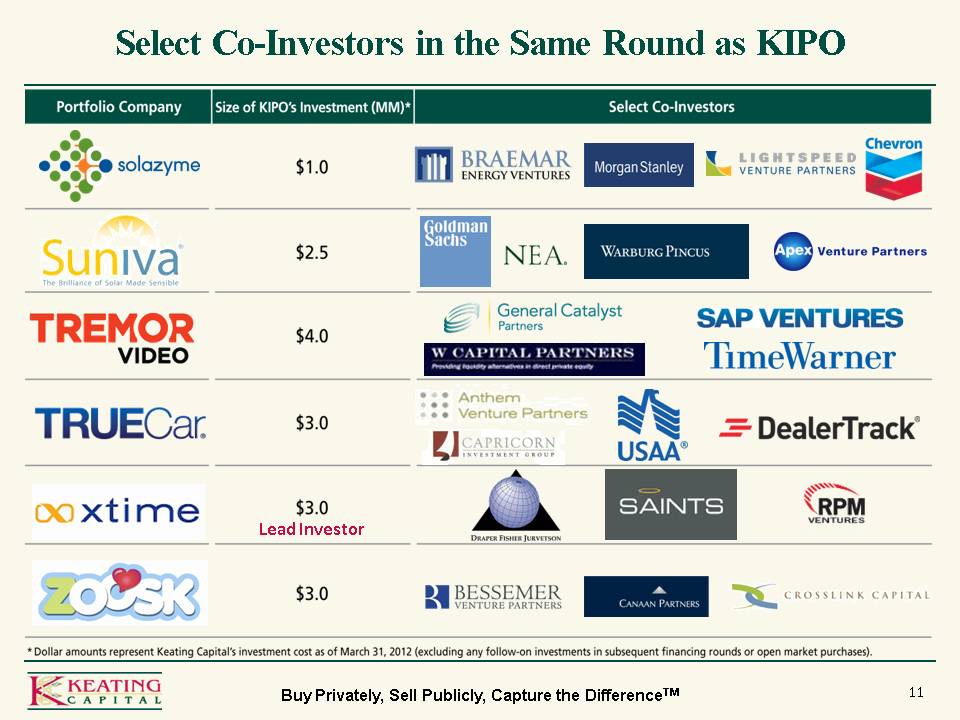
Select Co-Investors in the Same Round as KIPO 11
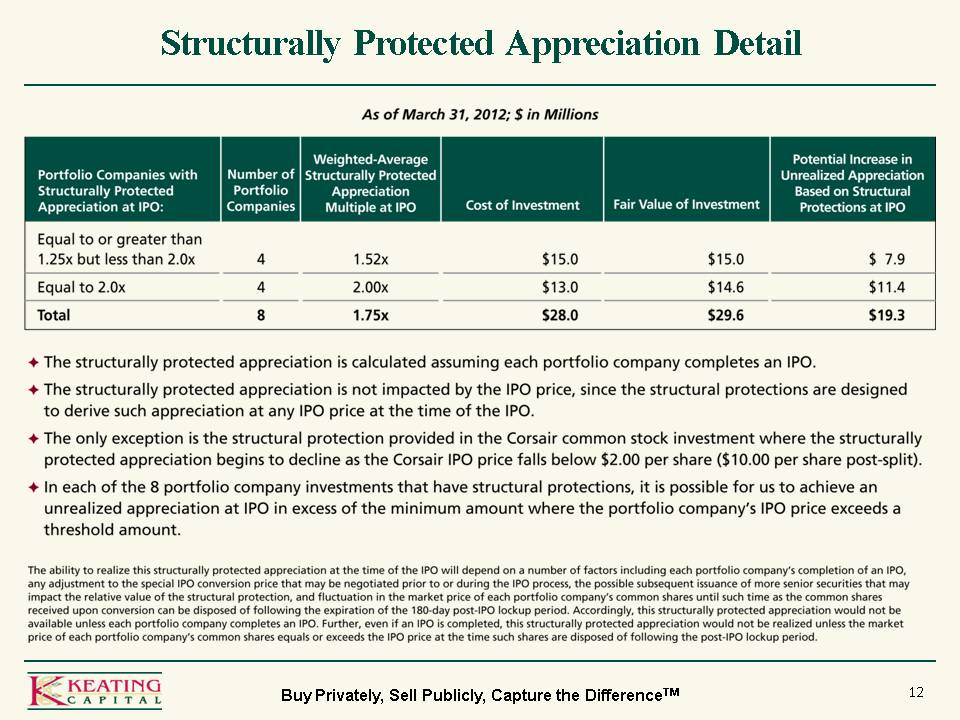
Structurally Protected Appreciation Detail 12
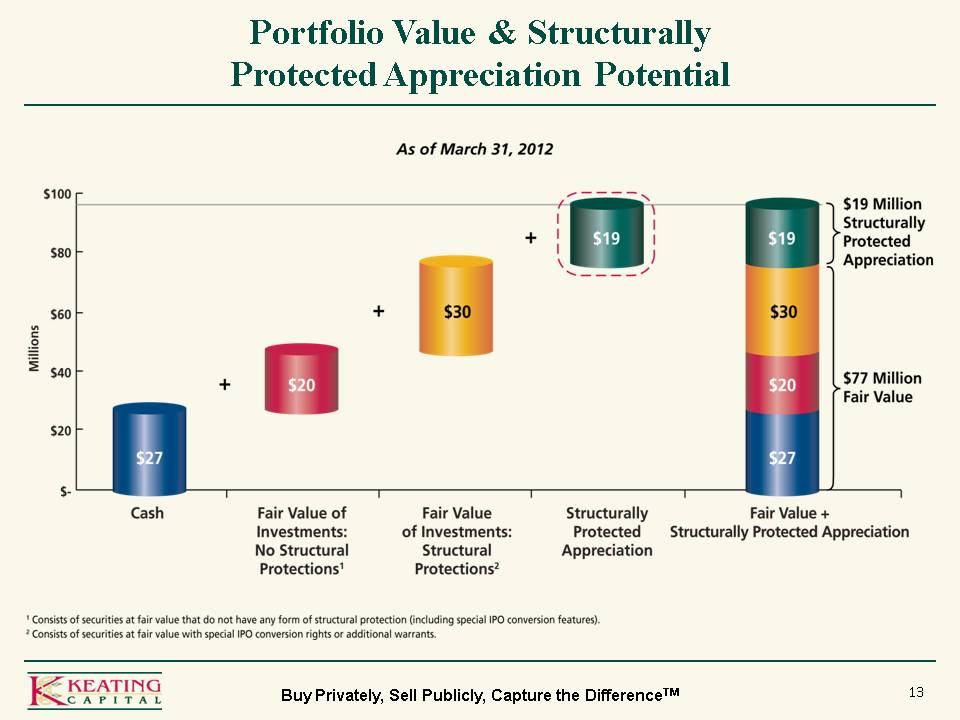
Portfolio Value & Structurally Protected Appreciation Potential 13
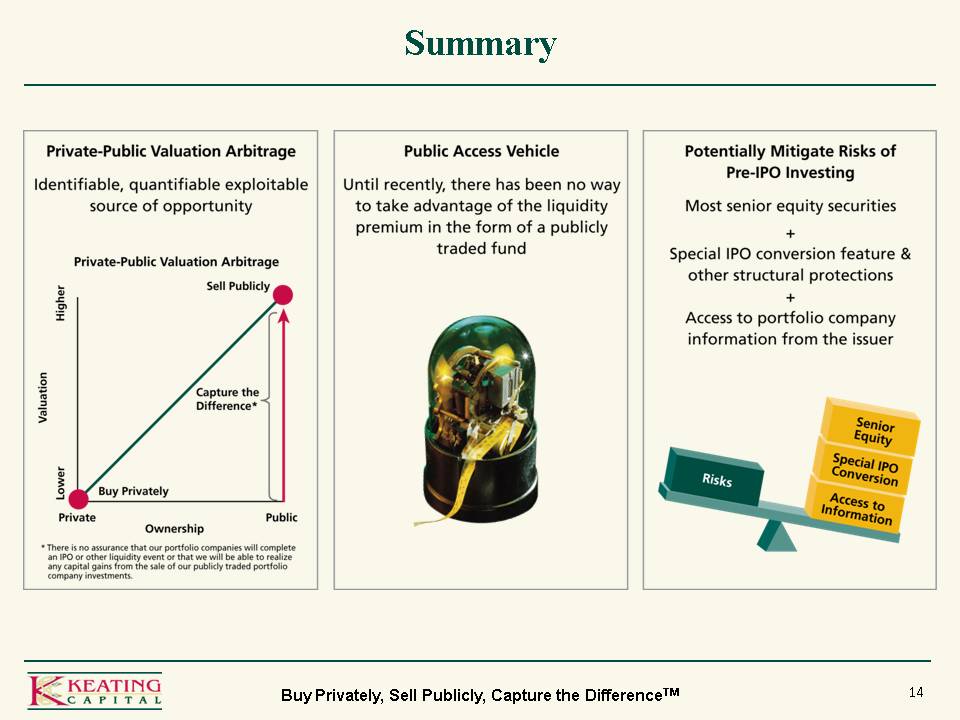
Summary Private-Public Valuation Arbitrage Public Access Vehicle Potentially Mitigate Risks of Pre-IPO Investing 14
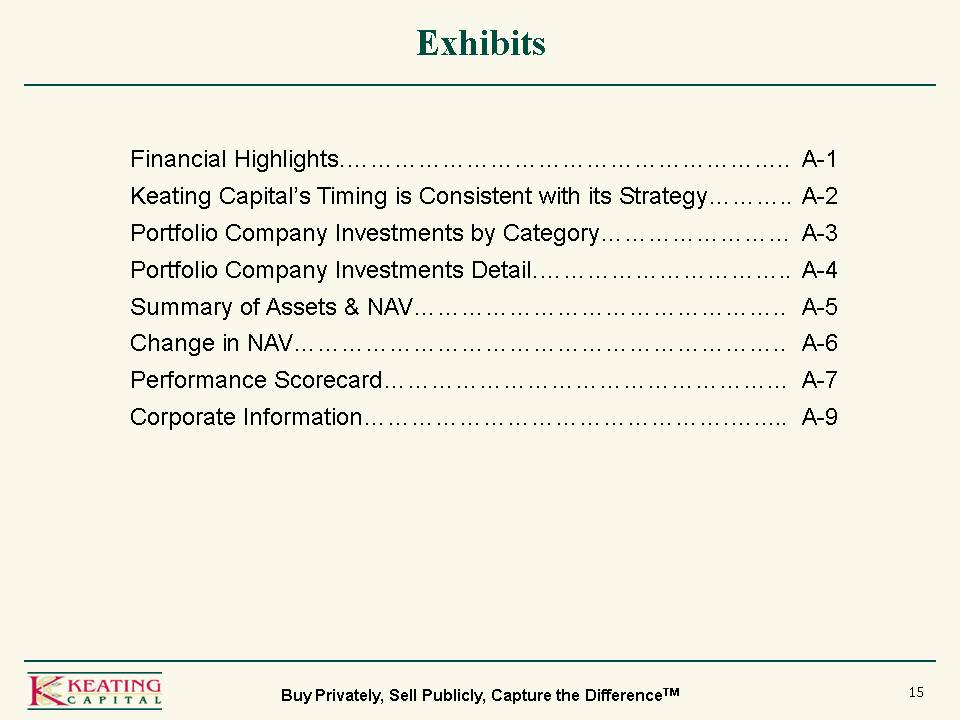
Financial Highlights A-1 Keating Capital’s Timing is Consistent with its Strategy A-2 Portfolio Company Investments by Category A-3 Portfolio Company Investments Detail A-4 Summary of Assets & NAV A-5 Change in NAV A-6 Performance Scorecard A-7 Corporate Information A-9 15
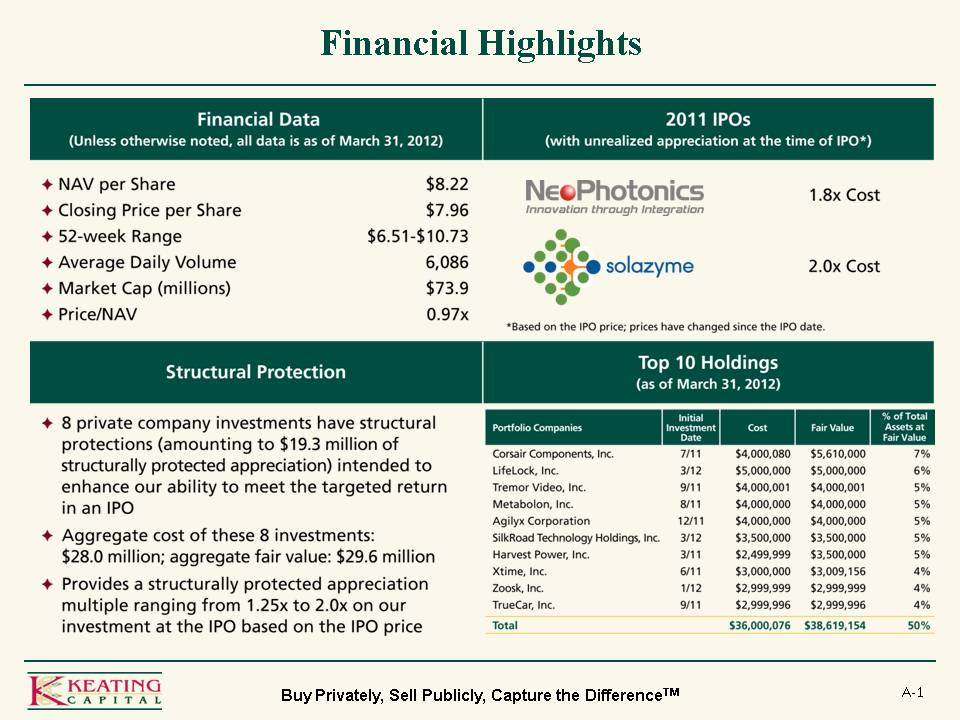
Financial Highlights Financial Data (Unless otherwise noted, all data is as of March 31, 2012) 2011 IPOs (with unrealized appreciation at the time of IPO*) Structural Protection Top 10 Holdings (as of March 31, 2012) A-1
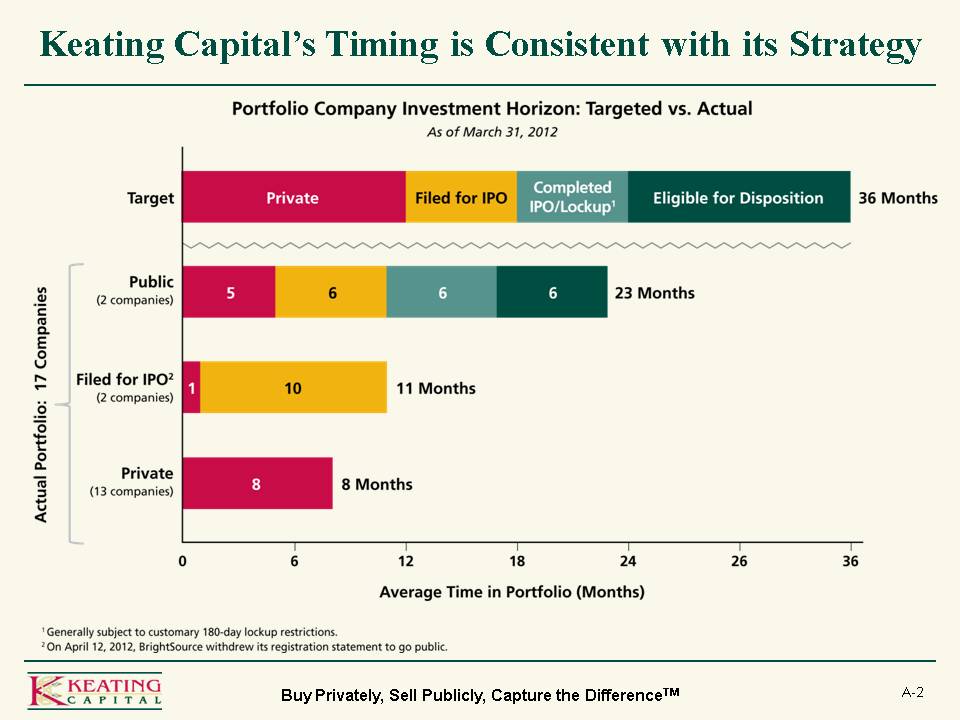
Keating Capital’s Timing is Consistent with its Strategy Portfolio Company Investment Horizon: Targeted Vs. Actual As of March 31, 2012 A-2
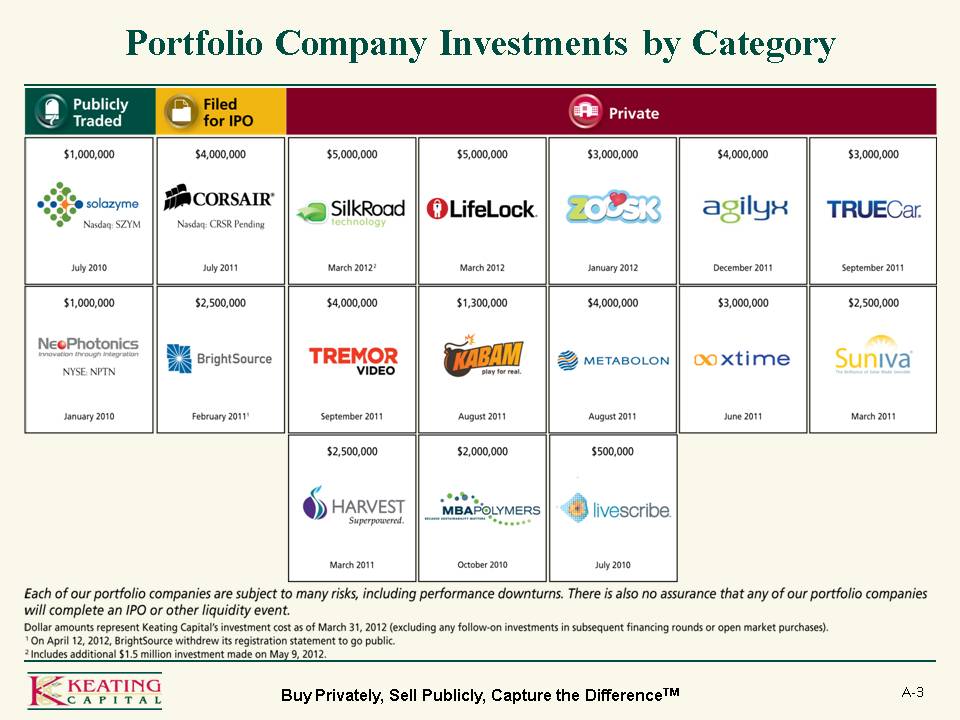
Portfolio Company Investments by Category A-3
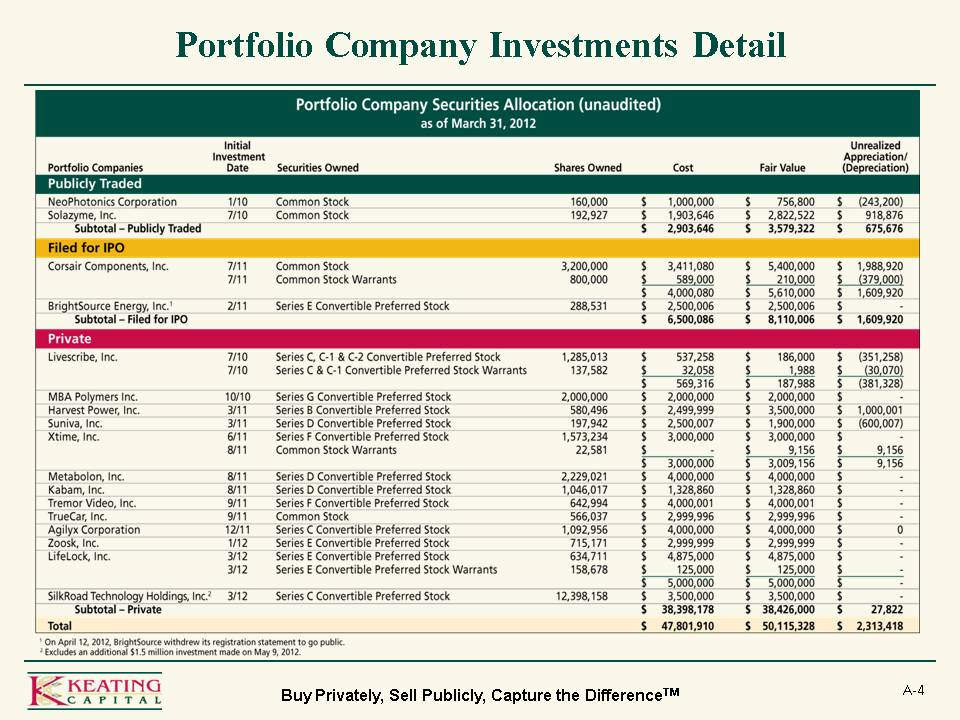
Portfolio Company Investments Detail A-4
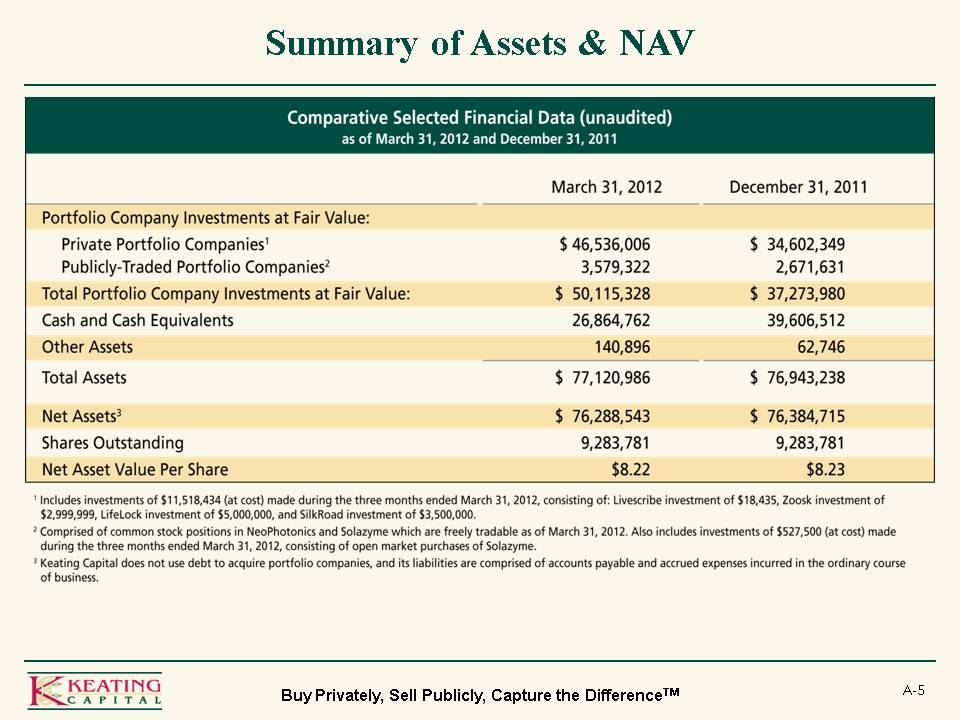
Summary of Assets & NAV Comparative Selected Financial Data (unaudited) as of March 31, 2012 and December 31, 2011 A-5
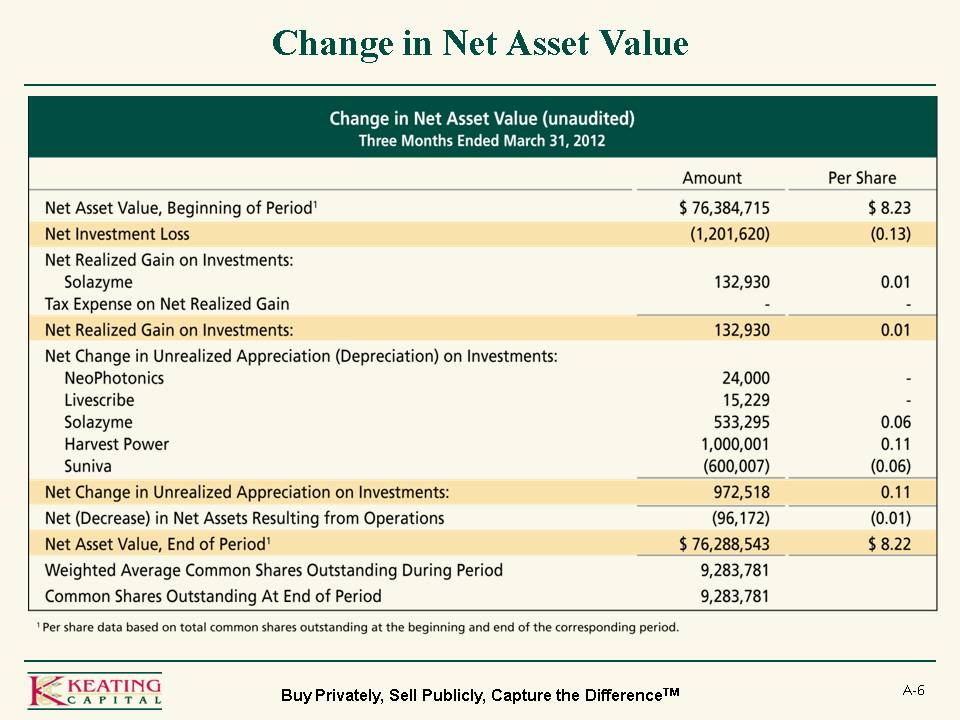
Change in Net Asset Value Change in Net Asset Value (unaudited) Three Months Ended March 31, 2012 A-6
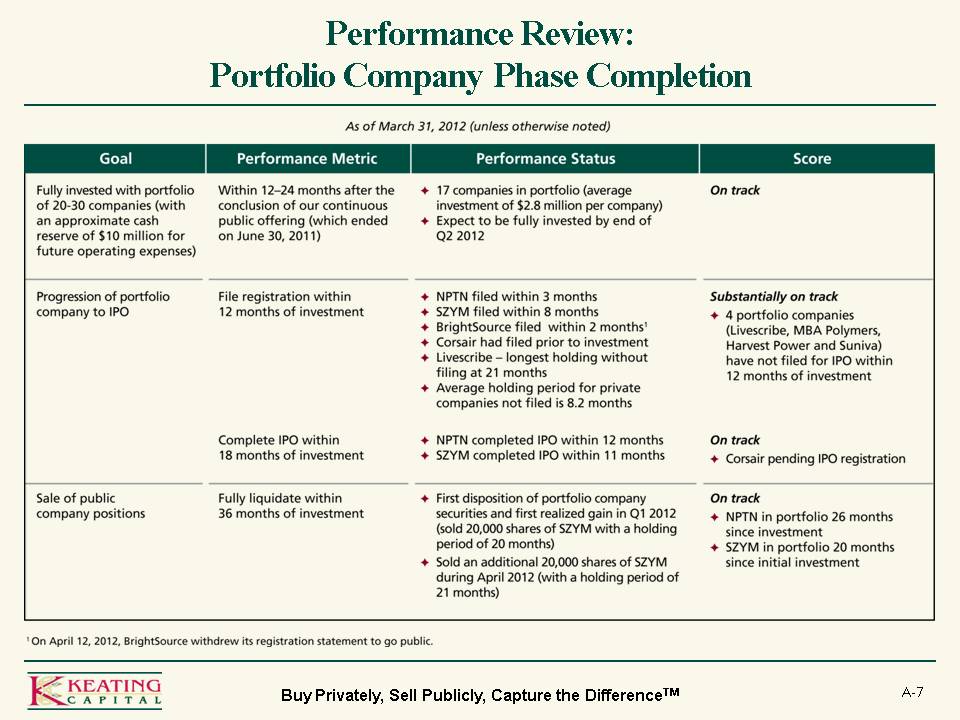
Performance Review: Portfolio Company Phase Completion A-7
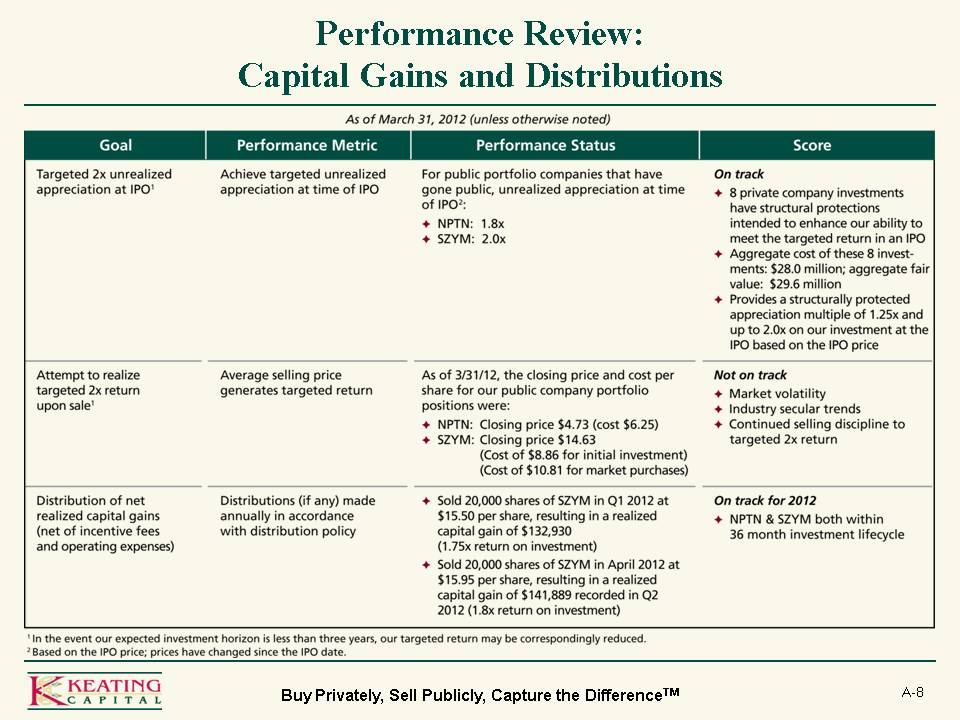
Performance Review: Capital Gains and Distributions A-8
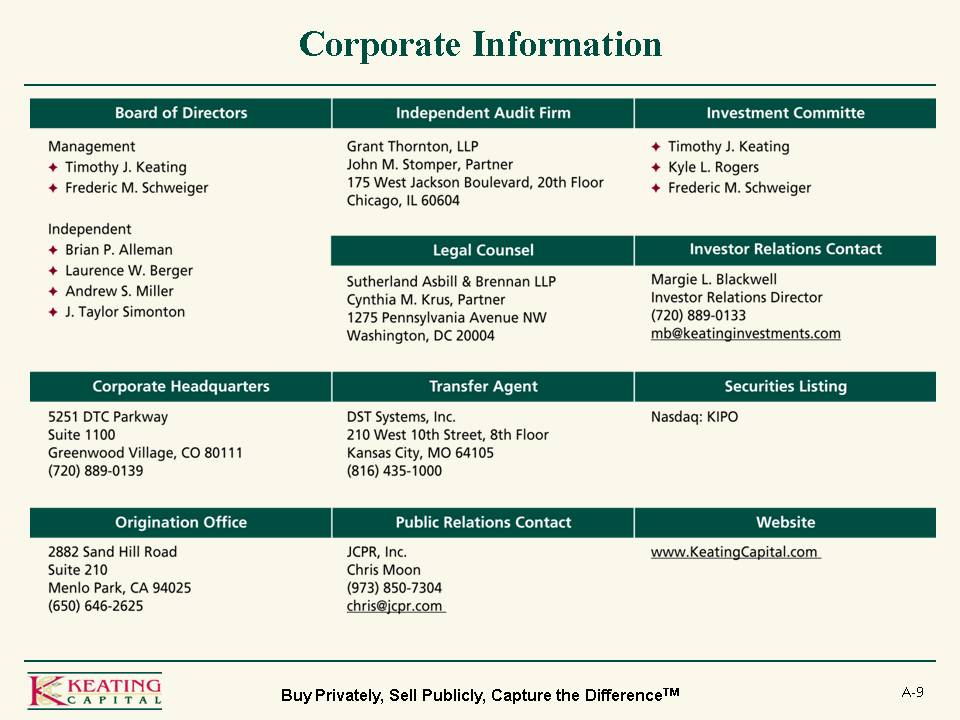
Corporate Information A-9