Attached files
| file | filename |
|---|---|
| 8-K - GOLUB CAPITAL BDC, Inc. | v311392_8k.htm |
Golub Capital BDC, Inc. Investor Presentation Quarter Ended March 31 , 2012
Some of the statements in this presentation constitute forward - looking statements, which relate to future events or our future performance or financial condition. The forward - looking statements contained in this presentation involve risks and uncertainties, including statements as to: our future operating results; our business prospects and the prospects of our portfolio companies; the effect of investments that we expect to make; our contractual arrangements and relationships with third parties; actual and potential conflicts of interest with GC Advisors LLC ("GC Advisors") and other affiliates of Golub Capital Incorporated and Golub Capital LLC (collectively, "Golub Capital"); the dependence of our future success on the general economy and its effect on the industries in which we invest; the ability of our portfolio companies to achieve their objectives; the use of borrowed money to finance a portion of our investments; the adequacy of our financing sources and working capital; the timing of cash flows, if any, from the operations of our portfolio companies; the ability of GC Advisors to locate suitable investments for us and to monitor and administer our investments; the ability of GC Advisors or its affiliates to attract and retain highly talented professionals; our ability to qualify and maintain our qualification as a regulated investment company and as a business development company; the impact on our business of the Dodd Frank Wall Street Reform and Consumer Protection Act and the rules and regulations issued thereunder; and the effect of changes to tax legislation and our tax position. Such forward - looking statements may include statements preceded by, followed by or that otherwise include the words “may,” “might,” “will,” “intend,” “should,” “could,” “can,” “would,” “expect,” “believe,” “estimate,” “anticipate,” “predict,” “potential,” “plan” or similar words. We have based the forward - looking statements included in this presentation on information available to us on the date of this presentation, and we assume no obligation to update any such forward - looking statements. Actual results could differ materially from those implied or expressed in our forward - looking statements for any reason, and future results could differ materially from historical performance. Although we undertake no obligation to revise or update any forward - looking statements, whether as a result of new information, future events or otherwise, you are advised to consult any additional disclosures that we may make directly to you or through reports that we have filed or in the future may file with the Securities and Exchange Commission, including annual reports on Form 10 - K, quarterly reports on Form 10 - Q and current reports on Form 8 - K. This presentation contains statistics and other data that have been obtained from or compiled from information made available by third - party service providers. We have not independently verified such statistics or data.
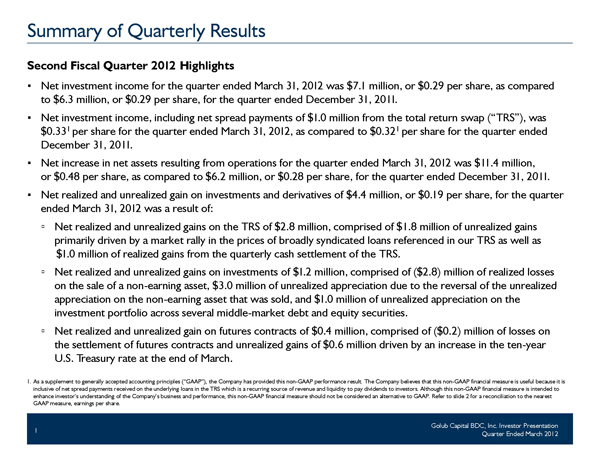
Golub Capital BDC, Inc. Investor Presentation Quarter Ended March 2012 Summary of Quarterly Results Second Fiscal Quarter 2 01 2 Highlights ▪ Net investment income for the quarter ended March 31 , 2 01 2 was $7 . 1 million, or $0.29 per share, as compared to $6.3 million, or $0.29 per share, for the quarter ended December 3 1, 20 1 1 . ▪ Net investment income, including net spread payments of $1 .0 million from the total return swap (“TRS”), was $0.33 1 per share for the quarter ended March 31 , 2 01 2, as compared to $0.32 1 per share for the quarter ended December 3 1, 20 1 1 . ▪ Net increase in net assets resulting from operations for the quarter ended March 31 , 2 01 2 was $ 1 1.4 million, or $0.48 per share, as compared to $6.2 million, or $0.28 per share, for the quarter ended December 3 1, 20 1 1 . ▪ Net realized and unrealized gain on investments and derivatives of $4.4 million, or $0 . 19 per share, for the quarter ended March 31 , 2 01 2 was a result of: ▫ Net realized and unrealized gains on the TRS of $2.8 million, comprised of $1.8 million of unrealized gains primarily driven by a market rally in the prices of broadly syndicated loans referenced in our TRS as well as $1 .0 million of realized gains from the quarterly cash settlement of the TRS. ▫ Net realized and unrealized gains on investments of $1 .2 million, comprised of ($2.8) million of realized losses on the sale of a non - earning asset, $3.0 million of unrealized appreciation due to the reversal of the unrealized appreciation on the non - earning asset that was sold, and $1 .0 million of unrealized appreciation on the investment portfolio across several middle - market debt and equity securities. ▫ Net realized and unrealized gain on futures contracts of $0.4 million, comprised of ($0.2) million of losses on the settlement of futures contracts and unrealized gains of $0.6 million driven by an increase in the ten - year U.S. Treasury rate at the end of March. 1 1. As a supplement to generally accepted accounting principles (“GAAP”), the Company has provided this non - GAAP performance result. The Company believes that this non - GAAP financial measure is useful because it is inclusive of net spread payments received on the underlying loans in the TRS which is a recurring sou rce of revenue and liquidity to pay dividends to investors. Although this non - GAAP financial measure is intended to enhance investor’s understanding of the Company’s business and performance, this non - G AAP financial measure should not be considered an alternative to GAAP. Refer to slide 2 for a reconciliation to the nearest GAAP measure, earnings per share.
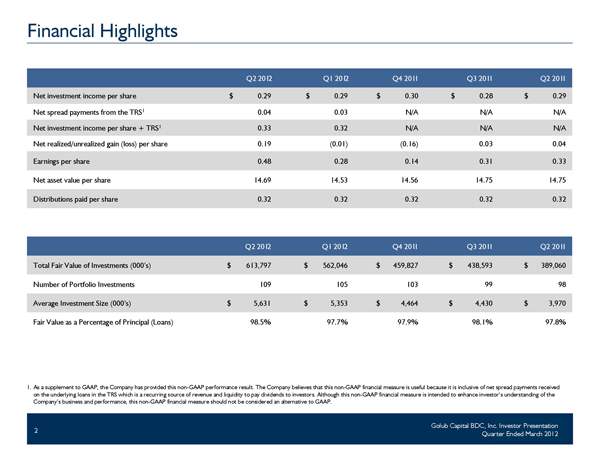
Golub Capital BDC, Inc. Investor Presentation Quarter Ended March 2012 Q2 20 12 Q1 20 12 Q4 20 1 1 Q3 20 1 1 Q2 20 1 1 Net investment income per share $ 0.29 $ 0.29 $ 0.30 $ 0.28 $ 0.29 Net spread payments from the TRS 1 0.04 0.03 N/A N/A N/A Net investment income per share + TRS 1 0.33 0.32 N/A N/A N/A Net realized /unrealized gain (loss) per share 0.19 (0.01) (0.16) 0.03 0.04 Earnings per share 0.48 0.28 0.14 0.31 0.33 Net asset value per share 14.69 14.53 14.56 14.75 14.75 Distributions paid per share 0.32 0.32 0.32 0.32 0.32 Q2 20 1 2 Q1 20 1 2 Q4 20 1 1 Q3 20 1 1 Q2 20 1 1 Total Fair Value of Investments (000’s) $ 613,797 $ 562,046 $ 459,827 $ 438,593 $ 389,060 Number of Portfolio Investments 109 105 103 99 98 Average Investment Size (000’s) $ 5,631 $ 5,353 $ 4,464 $ 4,430 $ 3,970 Fair Value as a Percentage of Principal (Loans) 98.5% 97.7% 97.9% 98.1% 97.8% Financial Highlights 2 1. As a supplement to GAAP, the Company has provided this non - GAAP performance result. The Company believes that this non - GAAP fina ncial measure is useful because it is inclusive of net spread payments received on the underlying loans in the TRS which is a recurring source of revenue and liquidity to pay dividends to in vestors. Although this non - GAAP financial measure is intended to enhance investor’s understanding of the Company’s business and performance, this non - GAAP financial measure should not be consid ered an alternative to GAAP.
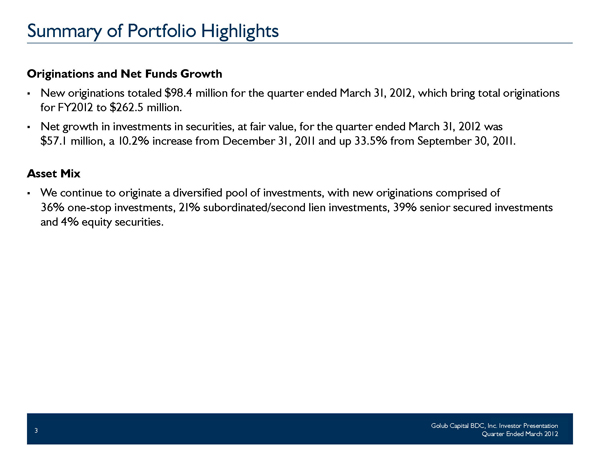
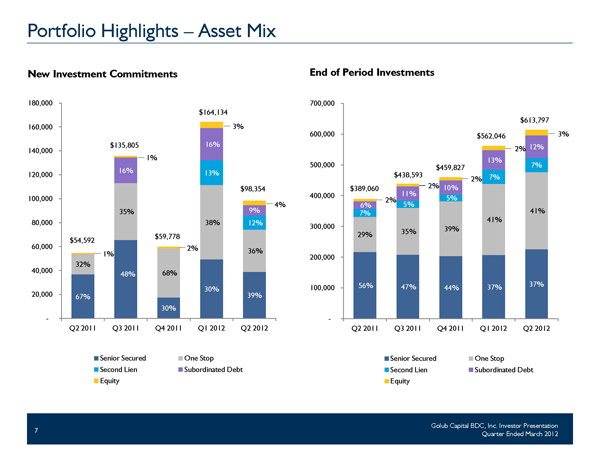
Golub Capital BDC, Inc. Investor Presentation Quarter Ended March 2012 Summary of Portfolio Highlights Originations and Net Funds Growth ▪ New originations totaled $98.4 million for the quarter ended March 31 , 2 01 2, which bring total originations for FY2 01 2 to $262.5 million. ▪ Net growth in investments in securities, at fair value, for the quarter ended March 31 , 2 01 2 was $57 . 1 million, a 1 0.2% increase from December 3 1, 2 0 1 1 and up 33.5% from September 30, 2 0 1 1 . Asset Mix ▪ We continue to originate a diversified pool of investments, with new originations comprised of 36% one - stop investments, 21 % subordinated/second lien investments, 39% senior secured investments and 4% equity securities. 3
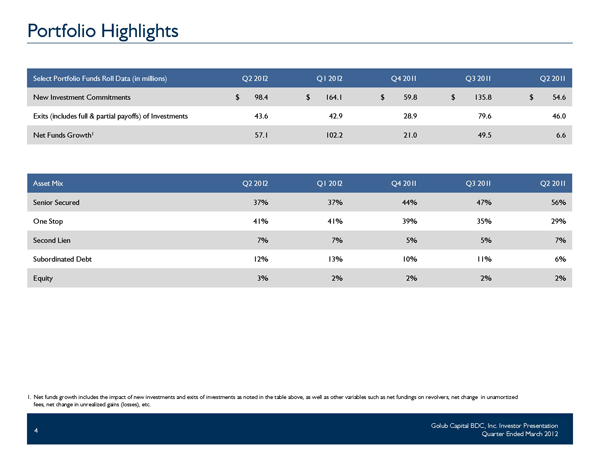
Golub Capital BDC, Inc. Investor Presentation Quarter Ended March 2012 Select Portfolio Funds Roll Data (in millions) Q2 20 1 2 Q1 20 1 2 Q4 20 1 1 Q3 20 1 1 Q2 20 1 1 New Investment Commitments $ 98.4 $ 164.1 $ 59.8 $ 135.8 $ 54.6 Exits (includes full & partial payoffs) of Investments 43.6 42.9 28.9 79.6 46.0 Net Funds Growth 1 57.1 102.2 21.0 49.5 6.6 Portfolio Highlights Asset Mix Q2 20 1 2 Q1 20 1 2 Q4 20 1 1 Q3 20 1 1 Q2 20 1 1 Senior Secured 37% 37% 44% 47% 56% One Stop 41% 41% 39% 35% 29% Second Lien 7% 7% 5% 5% 7% Subordinated Debt 12% 13% 10% 11% 6% Equity 3% 2% 2% 2% 2% 1. Net funds growth includes the impact of new investments and exits of investments as noted in the table above, as well as othe r v ariables such as net fundings on revolvers, net change in unamortized fees, net change in unrealized gains (losses), etc. 4
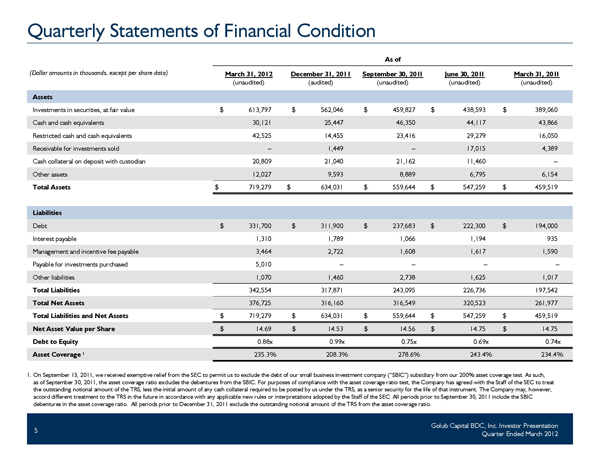
Golub Capital BDC, Inc. Investor Presentation Quarter Ended March 2012 Quarterly Statements of Financial Condition As of (Dollar amounts in thousands , except per share data) March 31, 2012 (unaudited ) December 31, 2011 (audited ) September 3 0 , 20 1 1 (unaudited) June 3 0 , 20 1 1 (unaudited) March 3 1, 20 1 1 (unaudited) Assets Investments in securities, at fair value $ 613,797 $ 562,046 $ 459,827 $ 438,593 $ 389,060 Cash and cash equivalents 30,121 25,447 46,350 44,117 43,866 Restricted cash and cash equivalents 42,525 14,455 23,416 29,279 16,050 Receivable for investments sold – 1,449 – 17,015 4,389 Cash collateral on deposit with custodian 20,809 21,040 21,162 11,460 – Other assets 12,027 9,593 8,889 6,795 6,154 Total Assets $ 719,279 $ 634,031 $ 559,644 $ 547,259 $ 459,519 Liabilities Debt $ 331,700 $ 311,900 $ 237,683 $ 222,300 $ 194,000 Interest payable 1,310 1,789 1,066 1,194 935 Management and incentive fee payable 3,464 2,722 1,608 1,617 1,590 Payable for investments purchased 5,010 – – – – Other liabilities 1,070 1,460 2,738 1,625 1,017 Total Liabilities 342,554 317,871 243,095 226,736 197,542 Total Net Assets 376,725 316,160 316,549 320,523 261,977 Total Liabilities and Net Assets $ 719,279 $ 634,031 $ 559,644 $ 547,259 $ 459,519 Net Asset Value per Share $ 14.69 $ 14.53 $ 14.56 $ 14.75 $ 14.75 Debt to Equity 0.88x 0.99x 0.75x 0.69x 0.74x Asset Coverage 1 235.3% 208.3% 278.6% 243.4% 234.4% 1. On September 13, 2011, we received exemptive relief from the SEC to permit us to exclude the debt of our small business inves tme nt company (“SBIC”) subsidiary from our 200% asset coverage test. As such, as of September 30, 2011, the asset coverage ratio excludes the debentures from the SBIC. For purposes of compliance with the asset coverage ratio test, the Company has agreed with the Staff of the SEC to treat the outstanding notional amount of the TRS, less the initial amount of any cash collateral required to be posted by us under the TRS, as a senior security for the life of that instrument. The Company may, however, accord different treatment to the TRS in the future in accordance with any applica ble new rules or interpretations adopted by the Staff of the SEC. All periods prior to September 30, 2011 include the SBIC debentures in the asset coverage ratio. All periods prior to Decemb er 31, 2011 exclude the outstanding notional amount of the TRS from the asset coverage ratio. 5
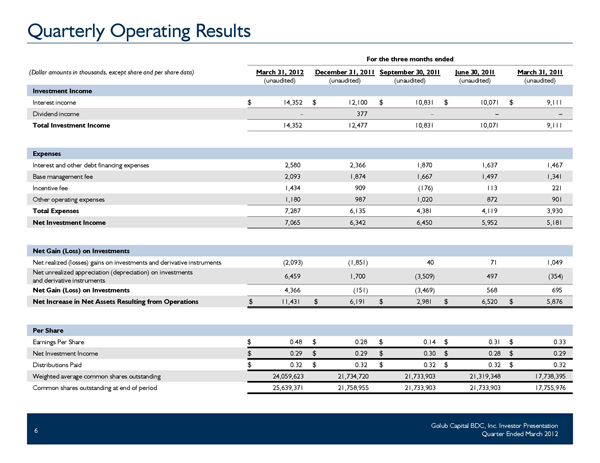
Golub Capital BDC, Inc. Investor Presentation Quarter Ended March 2012 Quarterly Operating Results For the three months ended (Dollar amounts in thousands, except share and per share data) March 31, 2012 (unaudited) December 31, 2011 (unaudited) September 3 0 , 20 1 1 (unaudited) June 3 0 , 20 1 1 (unaudited) March 3 1, 20 1 1 (unaudited) Investment Income Interest income $ 14,352 $ 12,100 $ 10,831 $ 10,071 $ 9,111 Dividend income – 377 – – – Total Investment Income 14,352 12,477 10,831 10,071 9,111 Expenses Interest and other debt financing expenses 2,580 2,366 1,870 1,637 1,467 Base management fee 2,093 1,874 1,667 1,497 1,341 Incentive fee 1,434 909 (176) 113 221 Other operating expenses 1,180 987 1,020 872 901 Total Expenses 7,287 6,135 4,381 4,119 3,930 Net Investment Income 7,065 6,342 6,450 5,952 5,181 Net Gain (Loss) on Investments Net realized (losses) gains on investments and derivative instruments (2,093) (1,851) 40 71 1,049 Net unrealized appreciation (depreciation) on investments and derivative instruments 6,459 1,700 (3,509) 497 (354) Net Gain (Loss) on Investments 4,366 (151) (3,469) 568 695 Net Increase in Net Assets Resulting from Operations $ 11,431 $ 6,191 $ 2,981 $ 6,520 $ 5,876 Per Share Earnings P er Share $ 0.48 $ 0.28 $ 0.14 $ 0.31 $ 0.33 Net Investment Income $ 0.29 $ 0.29 $ 0.30 $ 0.28 $ 0.29 Distributions Paid $ 0.32 $ 0.32 $ 0.32 $ 0.32 $ 0.32 Weighted average common shares outstanding 24,059,623 21,734,720 21,733,903 21,319,348 17,738,395 Common shares outstanding at end of period 25,639,371 21,758,955 21,733,903 21,733,903 17,755,976 6
Golub Capital BDC, Inc. Investor Presentation Quarter Ended March 2012 Portfolio Highlights – Asset Mix New Investment Commitments End of Period Investments 67% 48% 30% 30% 39% 32% 35% 68% 38% 36% 13% 12% 16% 16% 9% - 20,000 40,000 60,000 80,000 100,000 120,000 140,000 160,000 180,000 Q2 2011 Q3 2011 Q4 2011 Q1 2012 Q2 2012 Senior Secured One Stop Second Lien Subordinated Debt Equity 56% 47% 44% 37% 37% 29% 35% 39% 41% 41% 7% 5% 5% 7% 7% 6% 11% 10% 13% 12% - 100,000 200,000 300,000 400,000 500,000 600,000 700,000 Q2 2011 Q3 2011 Q4 2011 Q1 2012 Q2 2012 Senior Secured One Stop Second Lien Subordinated Debt Equity $54,592 $135,805 1 % 1% 2 % 11% 6% 7% 6% 2% 2% $389,060 $438,593 3 % 2% $459,827 2 % $59,778 $562,046 $164,134 7 4 % $98,354 3 % $613,797
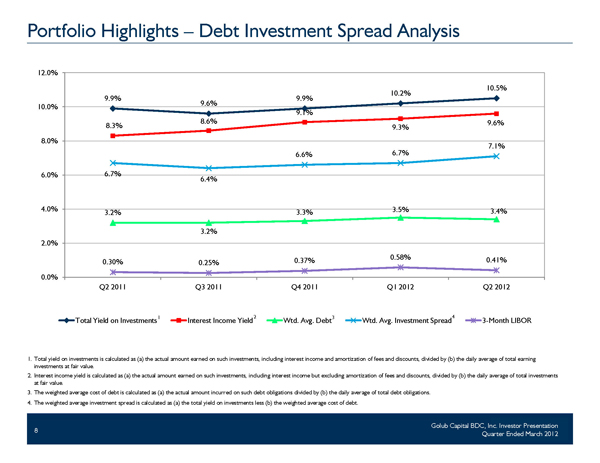
Golub Capital BDC, Inc. Investor Presentation Quarter Ended March 2012 Portfolio Highlights – Debt Investment Spread Analysis 1. Total yield on investments is calculated as (a) the actual amount earned on such investments, including interest income and a mor tization of fees and discounts, divided by (b) the daily average of total earning investments at fair value. 2. Interest income yield is calculated as (a) the actual amount earned on such investments, including interest income but exclud ing amortization of fees and discounts, divided by (b) the daily average of total investments at fair value. 3. The weighted average cost of debt is calculated as (a) the actual amount incurred on such debt obligations divided by (b) the da ily average of total debt obligations. 4. The weighted average investment spread is calculated as (a) the total yield on investments less (b) the weighted average cost of debt. 9.9% 9.6% 9.9% 10.2% 10.5% 8.3% 8.6% 9.1% 9.3% 9.6% 3.2% 3.2% 3.3% 3.5% 3.4% 6.7% 6.4% 6.6% 6.7% 7.1% 0.30% 0.25% 0.37% 0.58% 0.41% 0.0% 2.0% 4.0% 6.0% 8.0% 10.0% 12.0% Q2 2011 Q3 2011 Q4 2011 Q1 2012 Q2 2012 Total Yield on Investments Interest Income Yield Wtd. Avg. Debt Wtd. Avg. Investment Spread 3-Month LIBOR 1 2 3 4 8
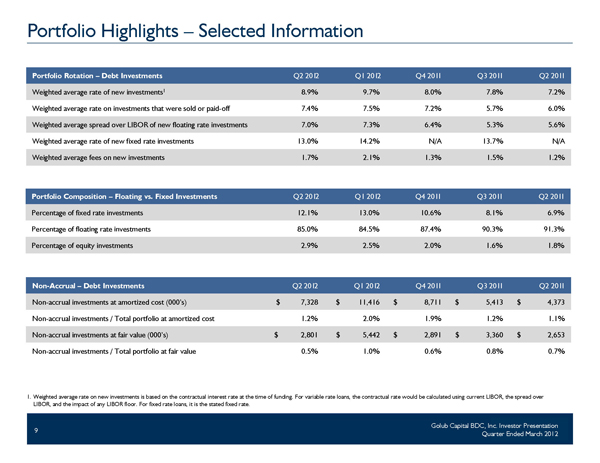
Golub Capital BDC, Inc. Investor Presentation Quarter Ended March 2012 Portfolio Highlights – Selected Information Portfolio Rotation – Debt Investments Q2 20 12 Q1 20 12 Q4 20 1 1 Q3 20 1 1 Q2 20 1 1 Weighted average rate of new investments 1 8.9% 9.7% 8.0% 7.8% 7.2% Weighted average rate on investments that were sold or paid - off 7.4% 7.5% 7.2% 5.7% 6.0% Weighted average spread over LIBOR of new floating rate investments 7.0% 7.3% 6.4% 5.3% 5.6% Weighted average rate of new fixed rate investments 13.0% 14.2% N/A 13.7% N/A Weighted average fees on new investments 1.7% 2.1% 1.3% 1.5% 1.2% Portfolio Composition – Floating vs. Fixed Investments Q2 20 12 Q1 20 12 Q4 20 1 1 Q3 20 1 1 Q2 20 1 1 Percentage of fixed rate investments 12.1% 13.0% 10.6% 8.1% 6.9% Percentage of floating rate investments 85.0% 84.5% 87.4% 90.3% 91.3% Percentage of equity investments 2.9% 2.5% 2.0% 1.6% 1.8% Non - Accrual – Debt Investments Q2 20 1 2 Q1 20 1 2 Q4 20 1 1 Q3 20 1 1 Q2 20 1 1 Non - accrual investments at amortized cost (000’s) $ 7,328 $ 11,416 $ 8,711 $ 5,413 $ 4,373 Non - accrual investments / Total portfolio at amortized cost 1.2% 2.0% 1.9% 1.2% 1.1% Non - accrual investments at fair value (000’s) $ 2,801 $ 5,442 $ 2,891 $ 3,360 $ 2,653 Non - accrual investments / Total portfolio at fair value 0.5% 1.0% 0.6% 0.8% 0.7% 1. Weighted average rate on new investments is based on the contractual interest rate at the time of funding. For variable rate loa ns, the contractual rate would be calculated using current LIBOR, the spread over LIBOR, and the impact of any LIBOR floor. For fixed rate loans, it is the stated fixed rate. 9
Golub Capital BDC, Inc. Investor Presentation Quarter Ended March 2012 Credit Quality Credit Quality – Investment Portfolio ▪ Fundamental credit quality remains strong with non - earning assets as a percentage of total investments decreasing from 1 .0% at December 31 , 2 01 1 to 0.5% at March 31 , 2 01 2 . ▪ We disposed of one non - earning account during the quarter for a small net gain compared to its fair value as of December 31 , 2 01 1 . ▪ Performance ratings on the investment portfolio have remained stable for the past several quarters and over 90.0% of the investments in our portfolio had a risk rating of 4 or higher as of March 31 , 2 01 2 . Credit Quality – Derivatives ▪ Unrealized appreciation on the TRS of $1 .8 million was primarily a result of improved market pricing on the referenced broadly syndicated loans in the TRS. ▪ Unrealized appreciation on the ten - year futures contracts of $0.6 million was driven by a spike in the 1 0 - year U.S. Treasury rate at the end of March. 10
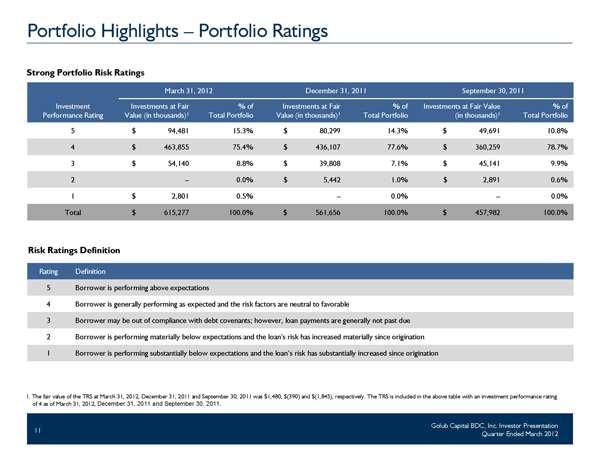
Golub Capital BDC, Inc. Investor Presentation Quarter Ended March 2012 Portfolio Highlights – Portfolio Ratings Risk Ratings Definition Rating Definition 5 Borrower is performing above expectations 4 Borrower is generally performing as expected and the risk factors are neutral to favorable 3 Borrower may be out of compliance with debt covenants; however, loan payments are generally not past due 2 Borrower is performing materially below expectations and the loan’s risk has increased materially since origination 1 Borrower is p erforming substantially below expectations and the loan’s risk has substantially increased since origination Strong Portfolio Risk Ratings 1. The fair value of the TRS at March 31, 2012, December 31, 2011 and September 30, 2011 was $1,480, $(390) and $(1,845), res pec tively. The TRS is included in the above table with an investment performance rating of 4 as of March 31, 2012, December 31, 2011 and September 30, 2011 . March 31, 2012 December 31, 2011 September 30, 2011 Investment Performance Rating Investments at Fair Value (in thousands) 1 % of Total Portfolio Investments at Fair Value (in thousands) 1 % of Total Portfolio Investments at Fair Value (in thousands) 1 % of Total Portfolio 5 $ 94,481 15.3% $ 80,299 14.3% $ 49,691 10.8% 4 $ 463,855 75.4% $ 436,107 77.6% $ 360,259 78.7% 3 $ 54,140 8.8% $ 39,808 7.1% $ 45,141 9.9% 2 – 0.0% $ 5,442 1.0% $ 2,891 0.6% 1 $ 2,801 0.5% – 0.0% – 0.0% Total $ 615,277 100.0% $ 561,656 100.0% $ 457,982 100.0% 11
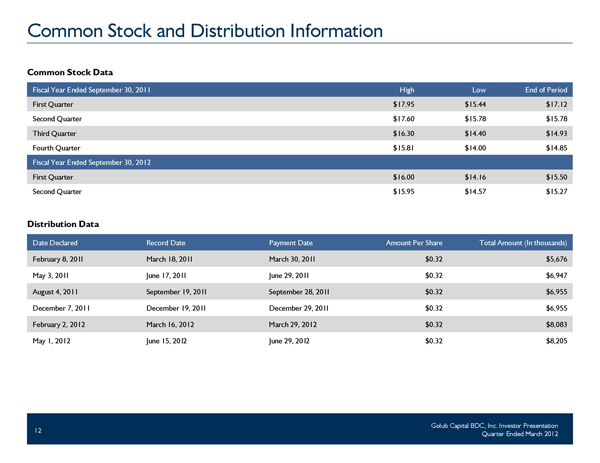
Golub Capital BDC, Inc. Investor Presentation Quarter Ended March 2012 Common Stock and Distribution Information Common Stock Data Distribution Data Date Declared Record Date Payment Date Amount Per Share Total Amount (In thousands) February 8, 20 1 1 March 18, 20 1 1 March 30, 20 1 1 $0.32 $5,676 May 3, 20 1 1 June 17, 20 1 1 June 29, 20 1 1 $0.32 $6,947 August 4, 2011 September 19, 20 1 1 September 28, 20 1 1 $0.32 $6,955 December 7, 2011 December 19, 20 1 1 December 29, 20 1 1 $0.32 $6,955 February 2, 2012 March 16, 2012 March 29, 2012 $0.32 $8,083 May 1, 2012 June 15, 20 1 2 June 29, 20 1 2 $0.32 $8,205 12 Fiscal Year Ended September 30, 2011 High Low End of Period First Quarter $17.95 $15.44 $17.12 Second Quarter $17.60 $15.78 $15.78 Third Quarter $16.30 $14.40 $14.93 Fourth Quarter $15.81 $14.00 $14.85 Fiscal Year Ended September 30, 2012 First Quarter $16.00 $14.16 $15.50 Second Quarter $15.95 $14.57 $15.27
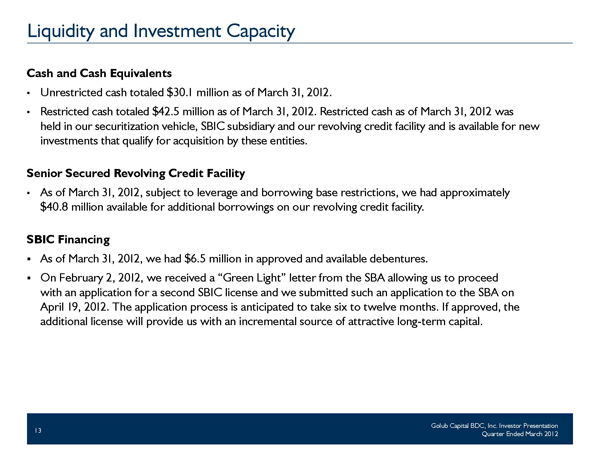
Golub Capital BDC, Inc. Investor Presentation Quarter Ended March 2012 Liquidity and Investment Capacity Cash and Cash Equivalents ▪ Unrestricted cash totaled $30 . 1 million as of March 31 , 2 01 2 . ▪ Restricted cash totaled $42.5 million as of March 31 , 2 01 2. Restricted cash as of March 31 , 2 01 2 was held in our securitization vehicle, SBIC subsidiary and our revolving credit facility and is available for new investments that qualify for acquisition by these entities. Senior Secured Revolving Credit Facility ▪ As of March 31 , 2 01 2 , subject to leverage and borrowing base restrictions, we had approximately $40.8 million available for additional borrowings on our revolving credit facility. SBIC Financing ▪ As of March 31 , 2 01 2 , we had $6.5 million in approved and available debentures. ▪ On February 2, 2 01 2 , we received a “Green Light” letter from the SBA allowing us to proceed with an application for a second SBIC license and we submitted such an application to the SBA on April 1 9, 2 01 2 . The application process is anticipated to take six to twelve months. If approved, the additional license will provide us with an incremental source of attractive long - term capital. 13
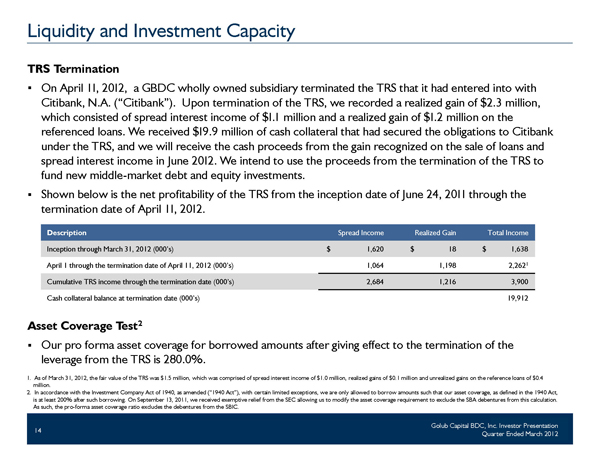
Golub Capital BDC, Inc. Investor Presentation Quarter Ended March 2012 Liquidity and Investment Capacity TRS Termination ▪ On April 1 1 , 2 01 2, a GBDC wholly owned subsidiary terminated the TRS that it had entered into with Citibank, N.A. (“Citibank”). Upon termination of the TRS, we recorded a realized gain of $2.3 million, which consisted of spread interest income of $1. 1 million and a realized gain of $1 .2 million on the referenced loans. We received $1 9.9 million of cash collateral that had secured the obligations to Citibank under the TRS, and we will receive the cash proceeds from the gain recognized on the sale of loans and spread interest income in June 2 01 2. We intend to use the proceeds from the termination of the TRS to fund new middle - market debt and equity investments. ▪ Shown below is the net profitability of the TRS from the inception date of June 24, 2 0 1 1 through the termination date of April 1 1 , 2 01 2. 14 Description Spread Income Realized Gain Total Income Inception through March 31, 2012 (000’s) $ 1,620 $ 18 $ 1,638 April 1 through the termination date of April 11, 2012 (000’s) 1,064 1,198 2,262 1 Cumulative TRS income through the termination date (000’s) 2,684 1,216 3,900 Cash collateral balance at termination date (000’s) 19,912 Asset Coverage Test 2 ▪ Our pro forma asset c overage for borrowed amounts after giving effect to the termination of the leverage from the TRS is 280.0%. 1. As of March 31, 2012, the fair value of the TRS was $1.5 million, which was comprised of spread interest income of $1.0 m ill ion, realized gains of $0.1 million and unrealized gains on the reference loans of $0.4 million. 2. In accordance with the Investment Company Act of 1940, as amended (“1940 Act”), with certain limited exceptions, we are o nly allowed to borrow amounts such that our asset coverage, as defined in the 1940 Act, is at least 200% after such borrowing. On September 13, 2011, we received exemptive relief from the SEC allowing us to modify the asset coverage requirement to exclude the SBA debentures from this calculation. As such, the pro - forma asset coverage ratio excludes the debentures from the SBIC.
Golub Capital BDC, Inc. Investor Presentation Quarter Ended March 2012 Summary of Debt Facilities Debt Securitization ▪ Size: $1 7 4.0 million in Aaa/AAA Class A Notes ▪ Cost: LIBOR + 2.40% ▪ Reinvestment period: Expires July 1 6, 2 01 3; 2 - year extension if specific conditions are met ▪ Maturity date: July 20, 20 2 1 ▪ Effective yield 1 : 3.3% for the three months ended March 31 , 2 01 2 Revolving Credit Facility ▪ Size: $75.0 million maximum commitment; $34.2 million outstanding at March 31 , 2 01 2 ▪ Cost: LIBOR + 2.25% ▪ Reinvestment period: Expires October 20, 2 01 2 ▪ Maturity date: October 21 , 2 01 5 ▪ Effective yield 1 : 3.0% for the three months ended March 31 , 2 01 2 Small Business Administration (“SBA”) Debentures ▪ Size: SBIC subsidiary may borrow up to $1 50 million; $1 23.5 million outstanding at March 31 , 2 01 2 ▪ Cost: Fixed semi - annually (“pooling date”) for 1 0 years at 1 0 - year treasury rate + market spread ▪ Maturity date: 1 0 - year maturity after drawn ▪ Fixed rate: As of March 31 , 2 01 2, we had $1 00 million of SBA debentures with rates that were fixed at various pooling dates and have an average annualized rate of 3.5%. 15 1. The quarterly effective yield is annualized and includes amortization of debt issuance costs. The quarterly effective annual ize d yield on the revolving credit facility excludes fees and amortization of debt issuance costs on the unfunded portion of the revolver.