Attached files
| file | filename |
|---|---|
| 8-K - FORM 8-K - TIDEWATER INC | d324202d8k.htm |
 March 27, 2012
QUINN P. FANNING
QUINN P. FANNING
Executive VP and CFO
Executive VP and CFO
DEAN E. TAYLOR
DEAN E. TAYLOR
Chairman, President and CEO
Chairman, President and CEO
Exhibit 99.1
HOWARD
WEIL
40
ANNUAL
ENERGY CONFERENCE
HOWARD
HOWARD
WEIL
WEIL
40
40
ANNUAL
ANNUAL
ENERGY CONFERENCE
ENERGY CONFERENCE
th
th |
 Phone:
504.568.1010
Fax:
504.566.4580
Web:
www.tdw.com
Email:
connect@tdw.com
FORWARD-LOOKING STATEMENTS
FORWARD-LOOKING STATEMENTS
FORWARD-LOOKING STATEMENTS
2
In accordance with the safe harbor provisions of the Private Securities Litigation Reform Act
of 1995, the Company notes that certain statements set forth in this presentation provide
other than historical information and are forward looking. The actual achievement of any
forecasted results, or the unfolding of future economic or business developments in a way
anticipated or projected by the Company, involve numerous risks and uncertainties that
may cause the Company’s actual performance to be materially different from that
stated or implied in the forward-looking statement. Among those risks and
uncertainties, many of which are beyond the control of the Company, include, without
limitation, volatility in worldwide energy demand and oil and gas prices; fleet additions
by competitors and industry overcapacity; changes in capital spending by customers in the
energy industry for offshore exploration, field development and production; changing
customer demands for vessel specifications, which may make some of our older
vessels technologically obsolete for certain customer projects or in certain markets;
uncertainty of global financial market conditions and difficulty in accessing credit or
capital; acts of terrorism and piracy; significant weather conditions; unsettled
political conditions, war, civil unrest and governmental actions, such as expropriation,
especially in higher risk countries where we operate; foreign currency fluctuations; labor
influences proposed by international conventions; increased regulatory burdens and
oversight following the Deepwater Horizon incident; and enforcement of laws related to
the environment, labor and foreign corrupt practices. Readers should consider
all of these risk factors as well as other information contained in this report. |
 3
•
Culture of safety & operating excellence
•
Macro
picture
improving
–
stable
oil
prices,
increased
E&P
spending,
improving rig count
•
History of earnings growth and solid returns
•
Unmatched scale and scope of operations
•
World’s largest and newest fleet provides basis for continued
earnings growth
•
Strong balance sheet allows us to act upon available opportunities
KEY TAKEAWAYS
KEY TAKEAWAYS
KEY TAKEAWAYS |
 4
SAFETY RECORD RIVALS
LEADING COMPANIES
SAFETY RECORD RIVALS
SAFETY RECORD RIVALS
LEADING COMPANIES
LEADING COMPANIES
0.00
0.10
0.20
0.30
0.40
0.50
0.60
0.70
0.80
2002
2003
2004
2005
2006
2007
2008
2009
2010
CALENDAR YEARS
TOTAL RECORDABLE INCIDENT RATES
TIDEWATER
DOW CHEMICAL
CHEVRON
EXXON/MOBIL
4 |
 5
Source: ODS-Petrodata and Tidewater
June 2008
(Peak)
Jan. 2011
March 2012
Working Rigs
603
538
612
Rigs Under
Construction
186
118
176
OSV Global
Population
2,033
2,599
2,723
OSV’s Under
Construction
736
367
436
OSV/Rig Ratio
3.37
4.83
4.45
DRIVERS OF OUR BUSINESS
“Peak to Present”
DRIVERS OF OUR BUSINESS
DRIVERS OF OUR BUSINESS
“Peak to Present”
“Peak to Present” |
 6
Source: ODS-Petrodata and Tidewater
As of mid-March 2012, there are approximately 436 additional AHTS and
PSV’s (~16% of the global fleet) under construction.
Global
fleet
estimated
at
2,723
vessels,
including
464
vessels
that
are
30+
yrs
old
(17%),
and
another
277
vessels
that
are
25-29
yrs
old
(10%)
THE WORLDWIDE OSV FLEET –
RETIREMENTS
EXPECTED TO EXCEED NEW DELIVERIES
(Includes AHTS and PSV’s only) Estimated as of January 2012
THE WORLDWIDE OSV FLEET –
THE WORLDWIDE OSV FLEET –
RETIREMENTS
RETIREMENTS
EXPECTED TO EXCEED NEW DELIVERIES
EXPECTED TO EXCEED NEW DELIVERIES
(Includes AHTS and PSV’s only) Estimated as of January 2012
Vessels > 25 years old today |
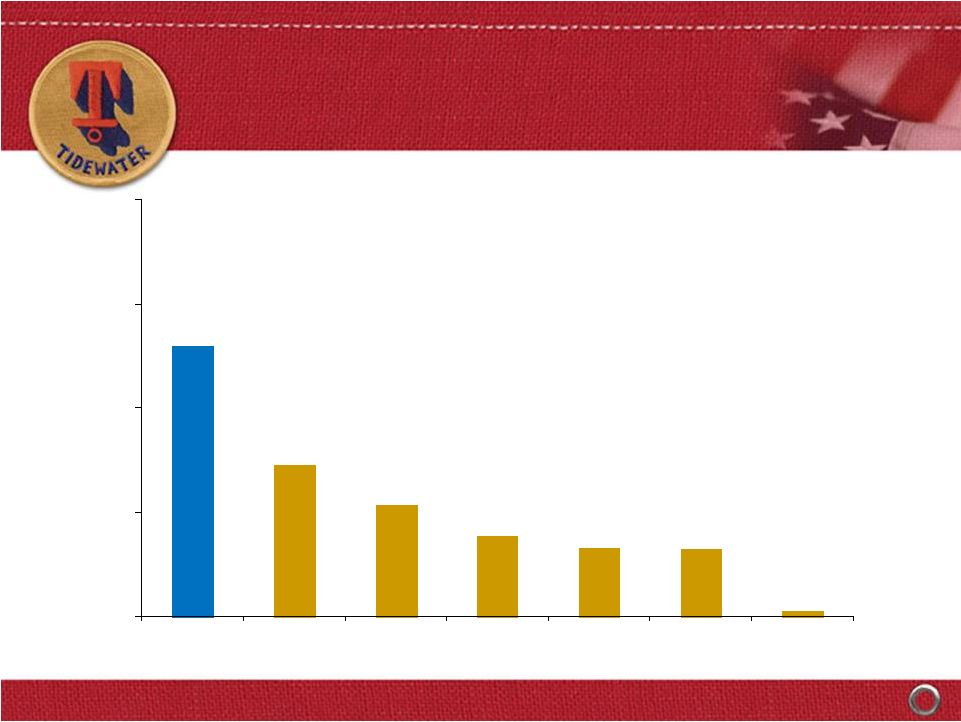 7
VESSEL POPULATION BY OWNER
(AHTS and PSV’s only) –
Estimated as of Mid-March 2012
VESSEL POPULATION BY OWNER
(AHTS and PSV’s only) –
Estimated as of Mid-March 2012
Source: ODS-Petrodata and Tidewater
Tidewater
Competitor #2
Competitor #3
Competitor #4
Competitor # 5
Competitor #1
Avg.
All Others (1,993 total
vessels for
350+ owners)
Tidewater
AHTS
and
PSV
fleet
includes
165
vessel
additions
since
2000
260
145
107
77
66
65
5
0
100
200
300
400 |
 **
EPS in Fiscal 2004 is exclusive of the $.30 per share after tax impairment
charge. EPS in Fiscal 2006 is exclusive of the $.74 per share after tax gain from
the
sale
of
six
KMAR
vessels.
EPS
in
Fiscal
2007
is
exclusive
of
$.37
per
share
of
after
tax
gains
from
the
sale
of
14
offshore
tugs.
EPS
in
Fiscal
2010
is
exclusive of $.66 per share Venezuelan provision, a $.70 per share tax benefit
related to favorable resolution of tax litigation and a $0.22 per share charge
for the proposed settlement with the SEC of the company’s FCPA matter. EPS in Fiscal 2011 is exclusive of total $0.21 per share charges for
settlements
with
DOJ
and
Government
of
Nigeria
for
FCPA
matters,
a
$0.08
per
share
charge
related
to
participation
in
a
multi-company
U.K.-based
pension plan and a $0.06 per share impairment charge related to certain
vessels. Adjusted Return
On Avg. Equity
4.3% 7.2%
12.4%
18.5% 18.3%
19.5%
11.4% 4.0%
Adjusted EPS**
Adjusted EPS**
HISTORY OF EARNINGS GROWTH
AND SOLID THROUGH-CYCLE RETURNS
HISTORY OF EARNINGS GROWTH
HISTORY OF EARNINGS GROWTH
AND SOLID THROUGH-CYCLE RETURNS
AND SOLID THROUGH-CYCLE RETURNS
8
$2.40
$5.20
$7.89
$1.03
$1.78
$3.33
$5.94
$6.39
$0.00
$2.00
$4.00
$6.00
$8.00
Fiscal
2004
Fiscal
2005
Fiscal
2006
Fiscal
2007
Fiscal
2008
Fiscal
2009
Fiscal
2010
Fiscal
2011 |
 9
OUR GLOBAL FOOTPRINT
Vessel Distribution by Region
(excludes stacked vessels –
as of 12/31/11)
OUR GLOBAL FOOTPRINT
OUR GLOBAL FOOTPRINT
Vessel Distribution by Region
Vessel Distribution by Region
(excludes stacked vessels –
(excludes stacked vessels –
as of 12/31/11)
as of 12/31/11)
In 3Q
FY
2012,
~5%
of
vessels/revenue
was
generated
in
U.S.
GOM;
however,
38
total
active U.S.-flagged vessels provide good optionality to a recovery in the U.S.
GOM. Americas
65
(25%)
SS Africa/Europe
129
(49%)
MENA
37
(14%)
Asia/Pac
33
(12%) |
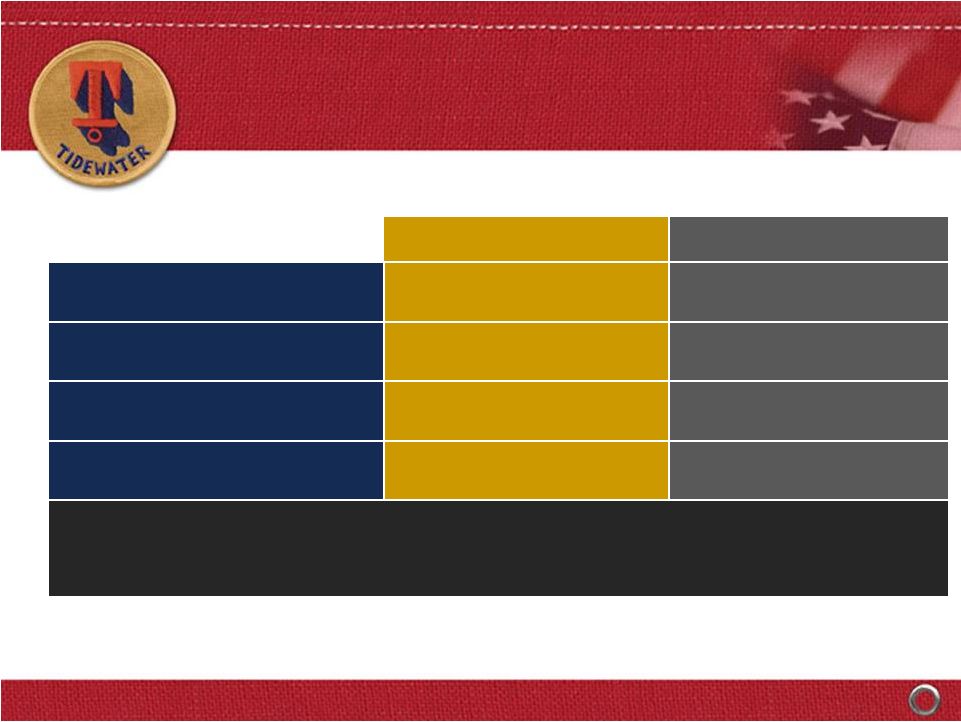 10
Vessel Count
Estimated Cost
AHTS
101
$1,765m
PSV’s
89
$1,927m
Crewboats & Tugs
71
$302m
TOTALS:
261
$3,994m
(1)
.
At 12/31/11, 211 new vessels were in our fleet with ~4.9 year average age
Vessel Commitments
Jan. ’00 –
December ‘11
(1)
$3,574m (89%) funded through 12/31/11
THE LARGEST MODERN OSV FLEET
IN THE INDUSTRY….
THE LARGEST MODERN OSV FLEET
THE LARGEST MODERN OSV FLEET
IN THE INDUSTRY….
IN THE INDUSTRY…. |
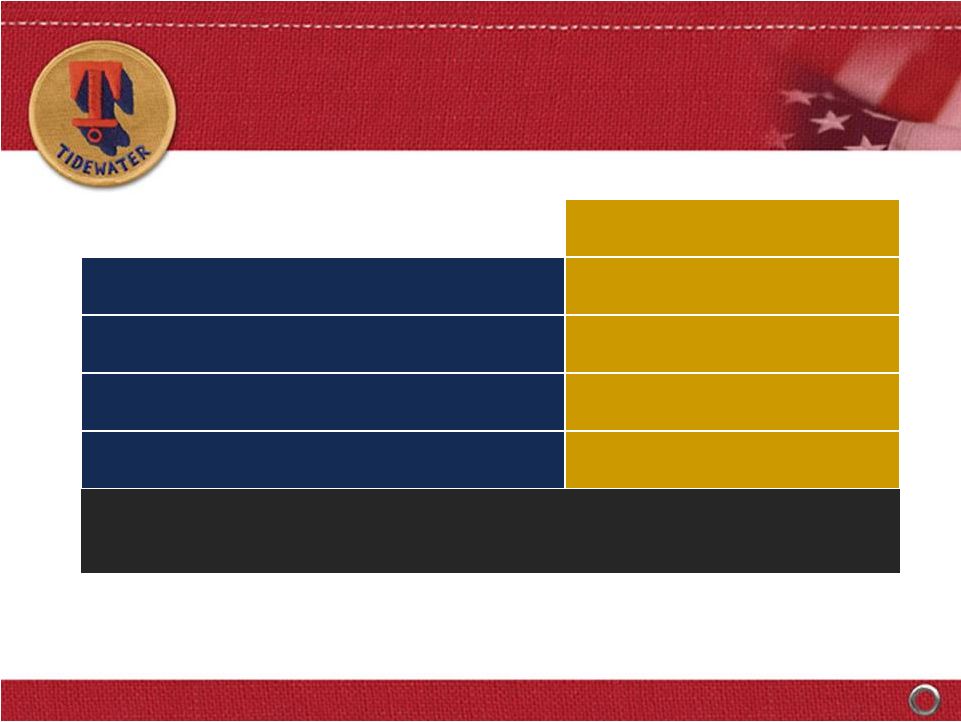 11
Count
AHTS
6
PSV
19
Crew and Tug
5
Total
30
Vessels Under Construction*
As of December 31, 2011
* Includes 7 new vessel purchase commitments at 12/31/11
Estimated
delivery
schedule
–
7
in
FY
‘12,
13
in
FY
‘13
and
10
thereafter.
CAPX of $99m in remainder of FY ‘12, $246m in FY ‘13 and $75m in FY
’14. …. AND MORE TO COME
…. AND MORE TO COME
…. AND MORE TO COME |
 Fiscal Year
Actual vessel deliveries through 12/31/11; estimated vessel deliveries based on
commitments to build or acquire as of 12/31/11
Through 12/31/11, vessel
commitments include 261 vessels
with a capital cost of $3.994 billion
THROUGH-CYCLE, EVA-BASED INVESTMENT;
BALANCE BETWEEN “BUY”
and “BUILD”
THROUGH-CYCLE, EVA-BASED INVESTMENT;
THROUGH-CYCLE, EVA-BASED INVESTMENT;
BALANCE BETWEEN “BUY”
BALANCE BETWEEN “BUY”
and “BUILD”
and “BUILD”
12 |
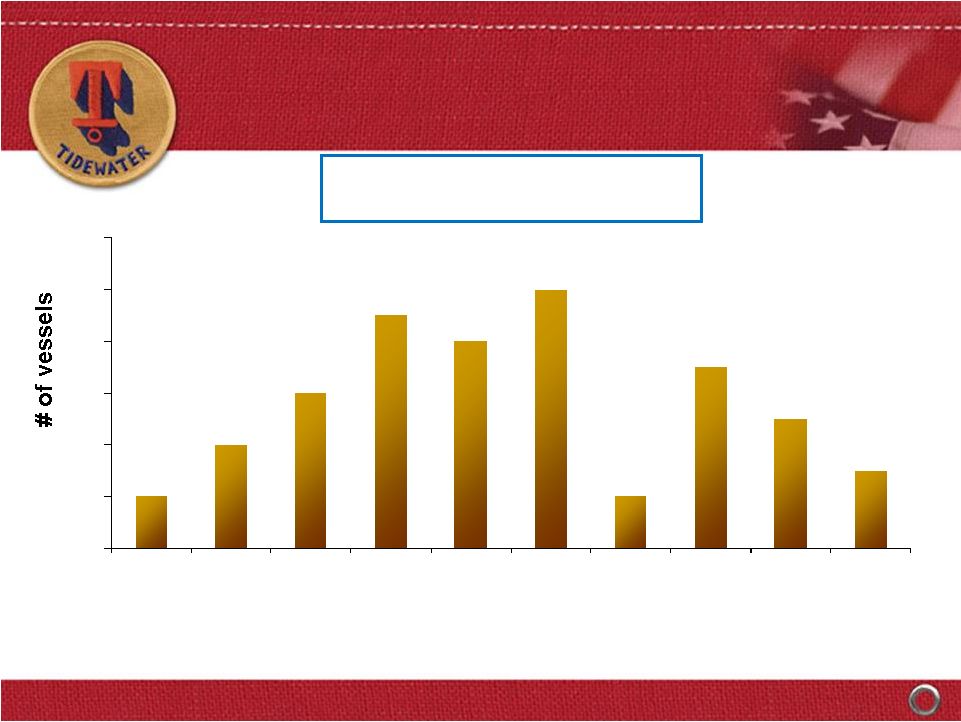 13
RECENT VESSEL COMMITMENTS
RECENT VESSEL COMMITMENTS
RECENT VESSEL COMMITMENTS
0
2
4
6
8
10
12
9/30/09
Qtr
12/31/09
Qtr
3/31/10
Qtr
6/30/10
Qtr
9/30/10
Qtr
12/31/10
Qtr
3/31/11
Qtr
6/30/11
Qtr
9/30/11
Qtr
12/31/11
Qtr
Amounts
depict
vessel
count
and
total
cost
in
quarter
commitment
was
made
to
acquire
(not
when
delivery
or
payments
were
made)
$96M
$55M
$72M
$179M
1 MPSV
1 PSV
4 AHTS
6 AHTS
6 AHTS
3 PSV’s
54 vessels over last 2+ years with
a total capital cost of ~$1 billion
$177M
4 PSV’s
4 AHTS
1 PSV
9 AHTS
$139M
$101M
2 PSV’s
4 PSV
1 AHTS
$100M
$24M
1 AHTS
4 CREW
$83M
3 PSV |
 14
Over a 12-year period, Tidewater has invested $3.8 billion in CapEx ($3.3
billion in the “new” fleet),
and paid out $995 million through dividends and share repurchases. Over the
same period, CFFO and proceeds from dispositions were $3.4 billion and $690
million, respectively $ in millions
CFFO
Fiscal Year
FLEET RENEWAL & EXPANSION
FUNDED BY CFFO THROUGH FISCAL 2011
FLEET RENEWAL & EXPANSION
FLEET RENEWAL & EXPANSION
FUNDED BY CFFO THROUGH FISCAL 2011
FUNDED BY CFFO THROUGH FISCAL 2011
$0
$100
$200
$300
$400
$500
$600
$700
2000
2001
2002
2003
2004
2005
2006
2007
2008
2009
2010
2011
Dividend
CAPX
Share Repurchase |
 15
Senior Unsecured Notes
$590 million
Average Life to Maturity (as of 12/31/11)
~ 8.5 years
Weighted Average Coupon
4.30%
Term Loan
$125 million
Revolving Line of Credit
$450 million
Remaining Term
~ 4½
years
Interest Rate
LIBOR plus 1.5% to
2.25%, based on leverage
Private Placement Financings:
Private Placement Financings:
New Credit Facilities:
New Credit Facilities:
Term Loan drawn in January 2012
RECENT FINANCINGS WILL FUND GROWTH
AT AN ATTRACTIVE RELATIVE COST
RECENT FINANCINGS WILL FUND GROWTH
RECENT FINANCINGS WILL FUND GROWTH
AT AN ATTRACTIVE RELATIVE COST
AT AN ATTRACTIVE RELATIVE COST |
 16
As of December 31, 2011
Cash & Cash Equivalents
$188 million
Total Debt
$825 million
Shareholders Equity
$2,502 million
Net Debt / Net Capitalization
20%
Total Debt / Capitalization
25%
~$750 million of pro forma liquidity as of 12/31/11, including $125 million Term Loan
(drawn in January 2012) and $450 million of availability under bank credit
facilities. STRONG FINANCIAL POSITION PROVIDES
ADDITIONAL STRATEGIC OPTIONALITY
STRONG FINANCIAL POSITION PROVIDES
STRONG FINANCIAL POSITION PROVIDES
ADDITIONAL STRATEGIC OPTIONALITY
ADDITIONAL STRATEGIC OPTIONALITY |
 17
Vessel Revenue ($)
Average Fleet Count
205 Average New Vessels in Q3 2012
$270
million
Vessels
Revenue
in
Q3
2012
(87% from New Vessels)
NEW FLEET DRIVING RESULTS
NEW FLEET DRIVING RESULTS
NEW FLEET DRIVING RESULTS |
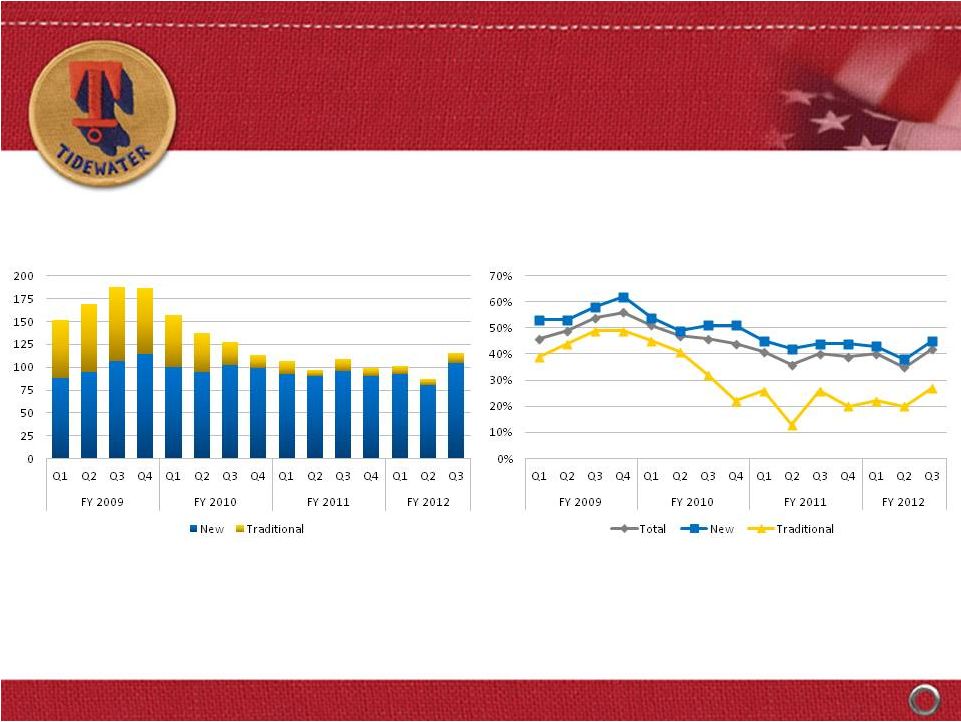 18
Vessel Cash Operating Margin ($)
Vessel Cash Operating Margin (%)
$115
million
Vessel
Margin
in
Q3
2012
(91% from New Vessels)
Q3 2012 Vessel Margin: 42%
CYCLICAL UPTURN
SHOULD DRIVE MARGIN EXPANSION
CYCLICAL UPTURN
CYCLICAL UPTURN
SHOULD DRIVE MARGIN EXPANSION
SHOULD DRIVE MARGIN EXPANSION |
 19
WHERE COULD FISCAL 2014 FIND US?
Potential for Earnings Acceleration
WHERE COULD FISCAL 2014 FIND US?
WHERE COULD FISCAL 2014 FIND US?
Potential for Earnings Acceleration
Potential for Earnings Acceleration
Avg. Dayrates
$14,835*
$16,319
(+ 10%)
$17,950
(+ 10%)
83.4%*
85.0%
90.0%
~$3.00
EPS
~$5.60
EPS
~$9.25
EPS
266 vessel assumption (211 current new vessels + 30 under construction + ~ 20
additional new vessels per year for next one and a quarter years).
* 12/31/11 quarterly actual stats
This info is not meant to be a
prediction of future earnings
performance, but simply an
indication of earning sensitivities
resulting from future fleet
additions and reductions and
varying operating assumptions
~$375M+
EBITDA
~$525M
EBITDA
~$750M
EBITDA |
 20
FINANCIAL STRATEGY FOCUSED
ON CREATING LONG-TERM
SHAREHOLDER VALUE
FINANCIAL STRATEGY FOCUSED
FINANCIAL STRATEGY FOCUSED
ON CREATING LONG-TERM
ON CREATING LONG-TERM
SHAREHOLDER VALUE
SHAREHOLDER VALUE
Maintain
Maintain
Financial Strength
Financial Strength
EVA-Based Investments
EVA-Based Investments
On Through-cycle Basis
On Through-cycle Basis
Deliver Results
Deliver Results |
 HOWARD
WEIL
40
ANNUAL
ENERGY CONFERENCE
HOWARD
HOWARD
WEIL
WEIL
40
40
ANNUAL
ANNUAL
ENERGY CONFERENCE
ENERGY CONFERENCE
March 27, 2012
March 27, 2012
QUINN P. FANNING
QUINN P. FANNING
Executive VP and CFO
Executive VP and CFO
DEAN E. TAYLOR
DEAN E. TAYLOR
Chairman, President and CEO
Chairman, President and CEO
th
th |
 22
APPENDIX
APPENDIX
APPENDIX |
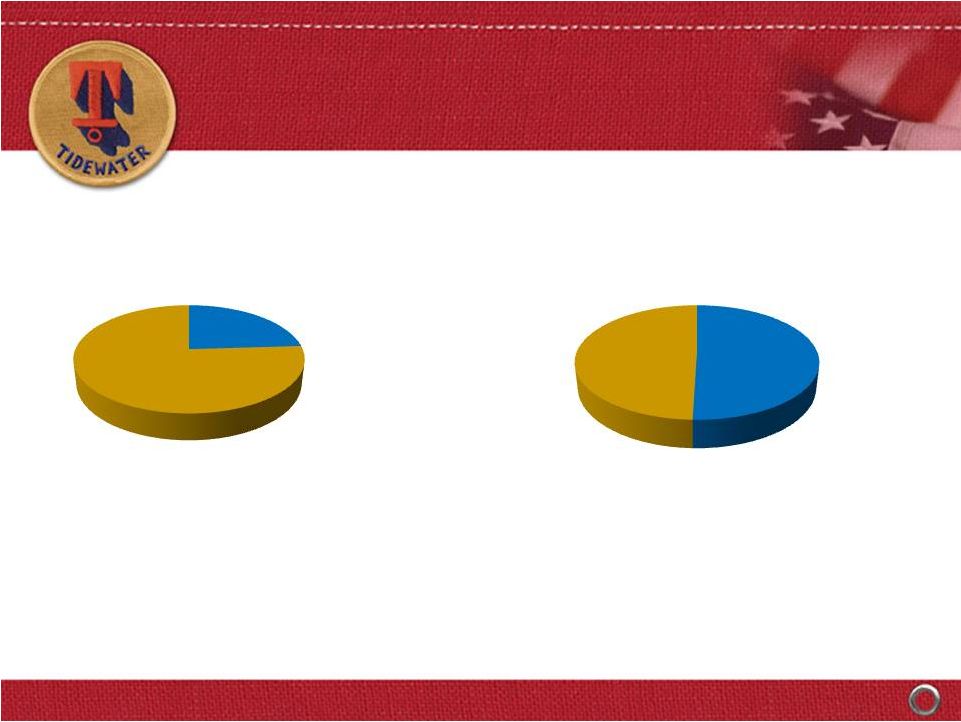
 23
CURRENT REVENUE MIX
Quality of Customer Base
CURRENT REVENUE MIX
CURRENT REVENUE MIX
Quality of Customer Base
Quality of Customer Base
Super Majors
36%
NOC's
28%
Others
36%
Our top 10 customers in Fiscal 2011 (5 Super Majors,
3 NOC’s and 2 large independents) accounted for 63% of our revenue
|
 24
Other Operators
Top 10 Customers
Tidewater’s top 10 customers contract ~23% of the working worldwide
jackup fleet and ~50% of the working worldwide floater fleet
Jackups
(348 Working Rigs)
Floater Rigs
(223 Working Rigs)
81
267
110
Source: ODS-Petrodata and Tidewater
Other Operators
Top 10 customers
113
RIGS CONTRACTED BY OUR
TOP 10 CUSTOMERS
(Estimated as of January 2012)
RIGS CONTRACTED BY OUR
RIGS CONTRACTED BY OUR
TOP 10 CUSTOMERS
TOP 10 CUSTOMERS
(Estimated as of January 2012)
(Estimated as of January 2012) |
 25
FLEET CASH OPERATING MARGINS
FLEET CASH OPERATING MARGINS
FLEET CASH OPERATING MARGINS
Traditional Vessels
New Vessels
Note: Cash operating margins are defined as vessel revenue less
vessel operating expenses
Cash Oper Margin 38.6%
37.6%
46.5%
41.9%
36.9%
38.7%
49.1%
54.6%
51.9%
51.3%
46.8%
39.3% |
 26
Nine Months Ended
12/31/11
12/31/10
Revenues
$778
$801
Net Earnings*
$76
$94
EPS*
$1.47
$1.82
Net Cash from Operations
$158
$218
Capital Expenditures
$297
$509
* Excludes $22.1 million, or $0.43 per share, goodwill impairment charge in
September 2011 $ in Millions, Except Per Share Data
RECENT FINANCIAL RESULTS
REFLECT CYCLICAL DOWNTURN
RECENT FINANCIAL RESULTS
RECENT FINANCIAL RESULTS
REFLECT CYCLICAL DOWNTURN
REFLECT CYCLICAL DOWNTURN |
 27
SIGNIFICANT AVERAGE
AGE IMPROVEMENT
SIGNIFICANT AVERAGE
SIGNIFICANT AVERAGE
AGE IMPROVEMENT
AGE IMPROVEMENT
Assumptions: 1) Average 45 vessel disposals per year in future (versus an
average of 52 vessel dispositions per year over last 3 years). 2) Includes 30
vessels under construction, including 7 vessel purchase commitments (based on current estimated delivery
schedule), plus additional newbuilds/acquisitions of ~20 vessels per year
(approximately $500 million in new capital commitments per year). Tidewater
is not committed to spending $500 million annually, but we use this assumption in
estimating average fleet age in the future.
20
14
6 |
 28
VESSEL UTILIZATION BY SEGMENT
VESSEL UTILIZATION BY SEGMENT
VESSEL UTILIZATION BY SEGMENT |
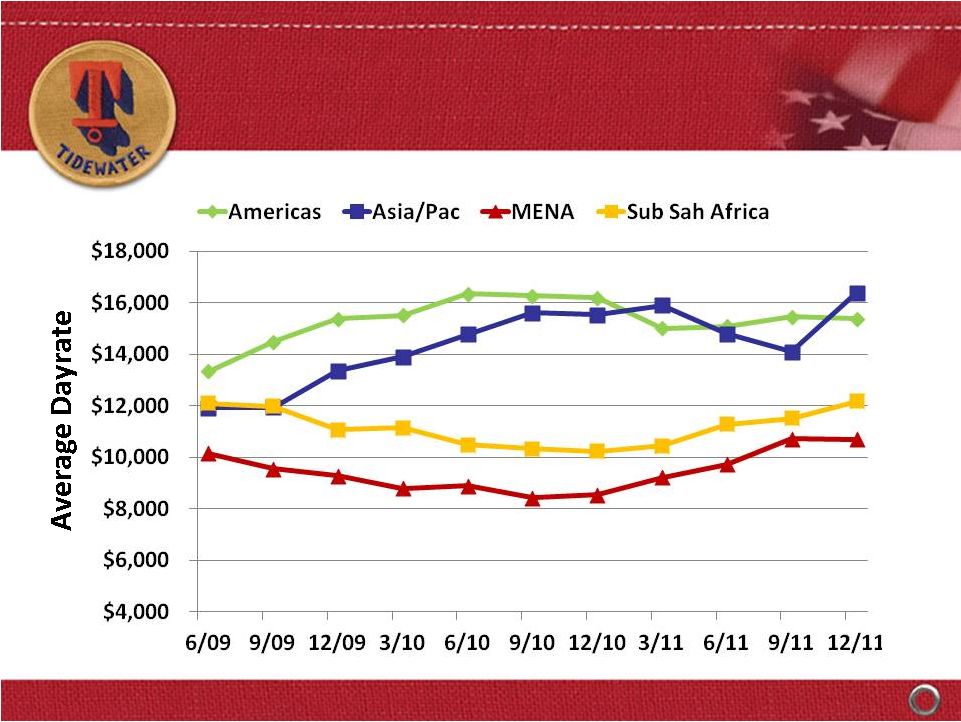 29
VESSEL DAYRATES BY SEGMENT
VESSEL DAYRATES BY SEGMENT
VESSEL DAYRATES BY SEGMENT |