Attached files
| file | filename |
|---|---|
| EXCEL - IDEA: XBRL DOCUMENT - SERVICESOURCE INTERNATIONAL, INC. | Financial_Report.xls |
| EX-31.2 - CERTIFICATION OF PRINCIPAL FINANCIAL OFFICER - SERVICESOURCE INTERNATIONAL, INC. | d279883dex312.htm |
| EX-23.1 - CONSENT OF PRICEWATERHOUSECOOPERS LLP - SERVICESOURCE INTERNATIONAL, INC. | d279883dex231.htm |
| EX-31.1 - CERTIFICATION OF PRINCIPAL EXECUTIVE OFFICER - SERVICESOURCE INTERNATIONAL, INC. | d279883dex311.htm |
| EX-21.1 - LIST OF SUBSIDIARIES - SERVICESOURCE INTERNATIONAL, INC. | d279883dex211.htm |
| EX-32.2 - CERTIFICATION OF CHIEF FINANCIAL OFFICER - SERVICESOURCE INTERNATIONAL, INC. | d279883dex322.htm |
| EX-32.1 - CERTIFICATION OF CHIEF EXECUTIVE OFFICER - SERVICESOURCE INTERNATIONAL, INC. | d279883dex321.htm |
| EX-10.18 - ACKERMAN EMPLOYMENT AGREEMENT - SERVICESOURCE INTERNATIONAL, INC. | d279883dex1018.htm |
Table of Contents
UNITED STATES
SECURITIES AND EXCHANGE COMMISSION
Washington, D.C. 20549
FORM 10-K
| x | ANNUAL REPORT PURSUANT TO SECTION 13 OR 15(d) OF THE SECURITIES EXCHANGE ACT OF 1934 |
For the fiscal year ended December 31, 2011
or
| ¨ | TRANSITION REPORT PURSUANT TO SECTION 13 OR 15(d) OF THE SECURITIES EXCHANGE ACT OF 1934 |
For the transition period from to
Commission file number 001-35108
SERVICESOURCE INTERNATIONAL, INC.
(Exact name of registrant as specified in its charter)
| Delaware | No. 81-0578975 | |
| (State or Other Jurisdiction of Incorporation or Organization) |
(I.R.S. Employer Identification No.) | |
| 634 Second Street San Francisco, California |
94107 | |
| (Address of Principal Executive Offices) | (Zip Code) | |
Registrant’s telephone number, including area code: (415) 901-6030
| Securities registered pursuant to Section 12(b) |
Name of each exchange on which registered | |
| Common Stock, $0.0001 Par Value | The NASDAQ Stock Market LLC |
Securities registered pursuant to Section 12(g) of the Act:
None
Indicate by check mark if the registrant is a well-known seasoned issuer, as defined in Rule 405 of the Securities Act. Yes ¨ No x
Indicate by check mark if the registrant is not required to file reports pursuant to Section 13 or Section 15(d) of the Act. Yes ¨ No x
Indicate by check mark whether the registrant (1) has filed all reports required to be filed by Section 13 or 15(d) of the Securities Exchange Act 1934 during the preceding 12 months (or for such shorter period that the registrant was required to file such reports), and (2) has been subject to such filing requirements for the past 90 days. Yes x No ¨
Indicate by check mark whether the registrant has submitted electronically and posted on its corporate Web site, if any, every Interactive Data File required to be submitted and posted pursuant to Rule 405 of Regulation S-T (§232.405 of this chapter) during the preceding 12 months (or for such shorter period that the registrant was required to submit and post such files). Yes x No ¨
Indicate by check mark if disclosure of delinquent filers pursuant to Item 405 of Regulation S-K (§29.405 of this chapter) is not contained herein, and will not be contained, to the best of registrant’s knowledge, in definitive proxy or information statements incorporated by reference in Part III of this Form 10-K or any amendment to this Form 10-K. ¨
Indicate by check mark whether the registrant is a large accelerated filer, an accelerated filer, a non-accelerated filer or a smaller reporting company. See definition of “large accelerated filer, “accelerated filer” and “smaller reporting company” in Rule 12b-2 of the Exchange Act. (Check one):
| Large accelerated filer | ¨ | Accelerated filer | ¨ | |||
| Non-accelerated filer | x | Smaller reporting company | ¨ | |||
Indicate by check mark whether the registrant is a shell company (as defined in Rule 12b-2 of the Exchange Act). Yes ¨ No x
The aggregate market value of the voting and non-voting common stock held by non-affiliates of the registrant, computed by reference to the closing price at which the common stock was sold on June 30, 2011, the last business day of the registrant’s most recently completed second fiscal quarter, as reported on The NASDAQ Global Market, was approximately $697,362,879. Shares of common stock held by each executive officer, director and holder of 5% or more of the outstanding common stock have been excluded in that such persons may be deemed to be affiliates. This determination of affiliate status does not reflect a determination that such persons are affiliates of the registrant for any other purpose.
As of February 28, 2012, there were approximately 74,081,978 shares of the registrant’s common stock outstanding.
DOCUMENTS INCORPORATED BY REFERENCE
Portions of the registrant’s definitive Proxy Statement for its 2012 Annual Meeting of Stockholders are incorporated by reference in Part III of this Annual Report on Form 10-K. Such Proxy Statement will be filed with the U.S. Securities and Exchange Commission within 120 days after the end of the fiscal year to which this report relates. Except with respect to information specifically incorporated by reference in this Form 10-K, the Proxy Statement is not deemed to be filed as part of this Form 10-K.
Table of Contents
i
Table of Contents
SPECIAL NOTE REGARDING FORWARD LOOKING STATEMENTS AND INDUSTRY DATA
This Annual Report on Form 10-K contains certain statements that constitute “forward looking statements” within the meaning of Section 27A of the Securities Act of 1933 and Section 21E of the Securities Exchange Act of 1934. These forward looking statements are based on our management’s beliefs and assumptions and on information currently available to our management. The forward looking statements are contained principally in “Business,” “Risk Factors” and “Management’s Discussion and Analysis of Financial Condition and Results of Operations.” Forward looking statements include information concerning our possible or assumed future results of operations; estimates of service revenue opportunity under management; our ability to improve our customers’ renewal rates, margins and profitability; our ability to increase our revenue and contribution margin over time from new and existing customers; business strategies; technology development and the monetization of our cloud applications; protection of our intellectual property; investment and financing plans; liquidity; competitive position; the effects of competition; industry environment; and potential growth opportunities. Forward looking statements include all statements that are not historical facts and can be identified by terms such as “anticipates,” “believes,” “could,” “estimates,” “expects,” “intends,” “may,” “might,” “likely,” “plans,” “potential,” “predicts,” “projects,” “seeks,” “should,” “will,” “would” or similar expressions and the negatives of those terms.
Forward looking statements involve known and unknown risks, uncertainties and other factors that may cause our actual results, performance or achievements to be materially different from any future results, performance or achievements expressed or implied by the forward looking statements. We discuss these risks in greater detail in “Risk Factors” and elsewhere in this Annual Report on Form 10-K. Given these uncertainties, you should not place undue reliance on these forward looking statements. Also, forward looking statements represent our management’s beliefs and assumptions only as of the date of this Annual Report on Form 10-K. You should read this Annual Report on Form 10-K and the documents that we have filed as exhibits hereto, completely and with the understanding that our actual future results may be materially different from what we expect.
Except as required by law, we assume no obligation to update these forward looking statements publicly, or to update the reasons actual results could differ materially from those anticipated in these forward looking statements, even if new information becomes available in the future.
In addition, projections, assumptions and estimates of our future performance and the future performance of the industry in which we operate is necessarily subject to a high degree of uncertainty and risk due to a variety of factors, including those described in “Risk Factors” and elsewhere in this Annual Report on Form 10-K. These and other factors could cause results to differ materially from those expressed in the estimates made by the independent parties and by us.
PART I
| ITEM 1. | BUSINESS |
Overview
ServiceSource is the global leader in service revenue management, partnering with technology and technology enabled companies to optimize maintenance, support and subscription revenue streams, while also improving customer relationships and loyalty. We deliver these results via a cloud-based solution, combining our Services Revenue Performance Suite of applications with dedicated service sales teams, leveraging a proprietary Service Revenue Intelligence Platform of transaction data, benchmarks and best practices. By integrating software, managed services and data, we provide end-to-end management and optimization of the service contract renewals process, including data management, quoting, selling and service revenue business intelligence. Our business is built on our pay-for-performance model, whereby customers pay us a commission based on renewal sales that we generate on their behalf, enabling a success-driven, shared-risk partnership with our customers. As of December 31, 2011, we managed over 120 engagements across approximately 70 customers, representing over $7 billion in service revenue opportunity under management. Service revenue opportunity under management (“opportunity under management”) is a forward-looking metric and is our estimate, as of a given date, of the value of all end customer service contracts that we will have the opportunity to sell on behalf of our customers over the subsequent twelve-month period.
1
Table of Contents
The scalability of our solution enables us to sell in over 40 languages from five sales centers around the globe. Our solution is designed to provide optimized service revenue performance across different revenue models, distribution models, and segments within technology and technology-enabled healthcare and life sciences industries, including hardware, software software-as-a-service and industrial systems.
Our total revenue was $205.5 million, $152.9 million and $110.7 million for the years ended December 31, 2011, 2010 and 2009, respectively. For summarized financial information by geographic area, see Note 14 of the Notes to Consolidated Financial Statements. For a discussion of the development of our business over the last year, see “Management’s Discussion and Analysis of Financial Condition and Results of Operations—Overview.”
Our Solution
Our solution is based on a decade of experience pioneering the service revenue management category and is designed to optimize service revenue performance for our customers. It addresses the critical elements of the renewals process, including data management, quoting, selling and service revenue business intelligence. We believe our solution, which tightly integrates software, managed services and data, reflects the growing trend of delivering enterprise services via the cloud. We believe this approach is critical to addressing the unique requirements of effective service revenue management.
The components of our solution consist of our Service Revenue Performance Suite™ of applications, our proprietary Service Revenue Intelligence Platform™, and our dedicated service sales teams. The foundation of our solution is our Service Revenue Intelligence Platform, a data warehouse of transactional, analytical and industry data that grows with each service renewal transaction and customer. Our suite of cloud applications increase visibility and control of service revenue streams and are utilized by customers, channel partners, end customers and our service sales teams. Our dedicated service sales teams have specific expertise in our customers’ businesses, are deployed under our customers’ brands and follow a sales process tailored specifically to increase service contract renewals.
Key benefits of our solution include:
Financial Benefits
| • | Increased service revenue. Our solution is designed to increase service revenues for our customers. Each customer engagement begins with an in-depth analysis of customers’ current renewal rates, which we call our Service Performance Assessment (“SPA”). We actively monitor the service contract renewal rates we drive on behalf of our customers in each engagement. When we generate higher renewal rates, we not only drive incremental service revenue for the associated period, but also have a compounding effect in increasing the base number of contracts eligible for renewal in subsequent periods, which expands the opportunity to generate greater revenue in future periods. |
| • | Increased margin and profitability. We believe that the costs associated with delivering maintenance, support and subscription services by many of our customers can be relatively fixed, and thus growth of service revenue can benefit our customers’ bottom line. In addition, customers that deploy our solution can avoid infrastructure expenditures and personnel costs that would otherwise be associated with managing service renewals internally. As a result, each incremental dollar of service revenue generated by our solution can drive greater profitability for our customers. |
Operational Benefits
| • | Improved end customer satisfaction. Our regular dialogue with end customers allows us to communicate the value of our customers’ maintenance, support and subscription services, and capture and address questions and concerns about our customers’ products, thus driving higher end customer satisfaction. |
2
Table of Contents
| • | Greater business insight and analytics. Our Service Revenue Intelligence Platform™ allows us to analyze our customers’ renewals against similar transactions and to identify areas for improvement, enabling greater insight into their renewals business. All transactions, whether or not resulting in a successful renewal by an end customer, are recorded in our intelligence platform. We leverage this platform to provide benchmarking, end customer metrics, sales efficiency data and insight into successful and unsuccessful renewal efforts. The breadth of our data allows us to provide powerful analysis across regions, industries, channel partners and product segments. |
| • | Greater visibility and forecasting tools. Our Service Revenue Performance Suite™ of cloud applications deliver real-time analytics and visibility into a customer’s service revenue performance, sales efficiency and forecasts. We measure service revenue performance across over 100 Key Performance Indicators (“KPIs”) that are housed in our intelligence platform and provide real-time data to our customers through a clear and impactful web-based interface. CFOs and other executives rely on our applications to assist in forecasting their results and to measure progress against their forecasts on a real-time basis. |
| • | Strengthened channel loyalty. Our Channel Sales Cloud application and service sales teams empower our customers’ channel partners to generate higher sales by providing accurate, real-time data on their renewal opportunities and performance relative to quota, as well as tools to sell more effectively to end customers. These cloud applications help our customers develop a closer relationship with their channel partners and enable our customers to increase renewals through the channel. |
| • | Global consistency. We are able to maintain a globally consistent renewals process for our customers as all of our five sales centers leverage a unified intelligence platform. Our solution automates the application of best practices to the service renewals process and provides all relevant constituencies with a consistent view of the data. This facilitates service renewals and provides reliable performance management and analytics. |
Our Strategy
We intend to continue our industry leadership in service revenue management with the following strategies:
| • | Expand customer base within existing industry verticals. We believe there is a significant opportunity to increase our service revenue opportunity under management. We currently have approximately 70 customers and believe there are over 800 companies in our addressable market. We intend to increase investment in our sales and marketing organization to win new customers in technology and technology-enabled industries. |
| • | Increase footprint with existing customers to drive greater revenue per customer. Our goal is to manage a greater portion of each customer’s service revenue. Typically, we initially manage one component of a customer’s service revenue, such as a specific product, market segment or geographic region. With our pay-for-performance model, we are able to quantify our results for the customer, frequently leading to an increase of service revenue opportunity under management for that customer, and ultimately greater revenue. |
| • | Continue to build, deploy and increase the revenue we generate from our cloud applications. We intend to continue to invest in our Service Revenue Performance Suite™ of cloud applications. We have created a variety of applications for channel partners, direct sellers and end customers that we provide as part of our offerings. In addition to extending and strengthening our suite of applications, we are identifying new opportunities to package and price these applications separately from our managed services. |
| • | Develop new solutions on our technology platform. We have developed an intelligence platform and suite of applications that drive increases in efficiency and help to automate tasks associated with service revenue management. For example, we have created a quoting application to automate the |
3
Table of Contents
| service contract quoting process. By continuing to automate processes and innovate on our technology platform, we can lower operating costs, increase the efficiency of our solutions and ultimately enhance our profitability and cash flow. |
| • | Add new customers from additional industry verticals. We recognize that service revenue opportunities exist in sectors beyond the technology industry. We currently have a small number of technology-enabled healthcare and life sciences and industrial systems customers for whom we manage equipment maintenance and support contracts. We believe there are additional industry verticals that can benefit from our expertise and best practices, and we intend to pursue these opportunities. |
The Components of Our Solution
Our solution consists of our Service Revenue Intelligence Platform™, cloud applications and dedicated service sales teams.
Service Revenue Intelligence Platform™
Since our inception, we have developed and evolved our Service Revenue Intelligence Platform™, a data warehouse of transactional, analytical and industry data that powers our solution, provides insight into the business we manage on behalf of our customers, and enables us to deliver higher performance for those customers.
| • | Transactional data. An integral part of our renewals process is the broad data capture we perform to ensure we have documented the important information about each transaction. With over four million transactions completed since inception, we have been able to build a robust data warehouse of service revenue and renewals information. |
| • | Analytical data. We track and leverage the 100 KPIs and benchmarks in our intelligence platform across our business. The data has been analyzed across a number of dimensions, such as by region, customer segment, and contract dollar value, among others. |
| • | Industry data. At the core of the intelligence platform is a service revenue-specific data model and benchmarking database that allows us to extract transactional data from customers and capture other structured and unstructured analytical data in a consistent manner. This allows us to benchmark performance across industries and perform cohort analyses to understand where we can apply best practices to increase performance. |
The intelligence platform improves with every renewal we manage, every customer we engage, and every benchmarking study we complete. We believe this is the most comprehensive data warehouse built exclusively for managing and optimizing service revenue from maintenance, support and subscription agreements on behalf of third-party customers.
Supporting the intelligence platform is our Data Management Engine. We have found that source data related to customer service renewals is almost universally embedded in fragmented information technology systems.
Our Data Management Engine extracts data from enterprise systems, such as ERP, CRM, billing and order management. This data is typically contained in different formats with disparate levels of completeness, quality and timeliness. After loading the data into our system, the Data Management Engine reconciles, cleanses and reorganizes our customers’ data providing our service sales teams with more accurate and relevant data, such as an inventory of the assets owned by end users, service quote history and current service contract terms.
4
Table of Contents
We leverage our Service Revenue Intelligence Platform™ across critical business processes, including:
| • | Service Performance Analysis. During the SPA process, we conduct interviews of our prospective customers, analyze their historical performance and future opportunity, and evaluate their service revenue business on a number of dimensions. The intelligence platform enables us to benchmark and identify service renewal opportunities and calculate our ability to improve performance based on our performance with similar types of businesses and opportunities. |
| • | Business Case, Pricing and Contract Structuring. We utilize our reservoir of data and benchmarks from the intelligence platform to estimate the critical components of the business case and pricing model that we use in discussions with prospective customers. This intelligence is fundamental to our pay-for-performance business model. |
| • | Service Revenue Performance. Once a partnership is in place with our customer, we leverage the intelligence platform to enable, measure, analyze, benchmark, optimize, and continuously improve the performance of our service sales teams. |
| • | Customer Benchmarking and Continuous Improvement. Our intelligence platform serves as the foundation to benchmark our customers’ evolving service revenue performance against industry peers and previous period performance. We convene quarterly business review meetings and annual partnership reviews with our customers to review performance, identify potential weaknesses and opportunities, and make recommendations that we believe will allow our customers and us to achieve higher levels of performance and efficiencies. |
| • | Developing and Delivering Applications. The intelligence platform includes the data warehouse that fuels the opportunity data, sales methodologies, metrics, and reporting dashboards that we engineer into our applications. Accordingly, we design our applications to leverage the transactional, analytical and industry data housed in our intelligence platform. |
Cloud Applications
We have developed a suite of applications, our Service Revenue Performance Suite™, designed to optimize specific elements of the renewals process. Our applications reflect our experience in optimizing service revenue and are tested for usability and impact inside our own operations. Our Service Revenue Performance Suite™ includes:
| • | Analytics Cloud. Our Analytics Cloud serves as an analytics and reporting application. It provides customers with dashboards to view and analyze service revenue performance by customer, revenue tier, channel partner, product line and region. It also provides real-time visibility into expected results, conversion and up-sells, territory analysis, benchmarking and other trending reports. This tool enables the executive staff of our customers to identify trends and update sales strategies. |
| • | Service Sales Cloud™. Our Service Sales Cloud™ provides renewals analytics and pipeline management used by our service sales teams. It includes an analytics dashboard for our teams to view their current sales pipeline, top deals and overall performance. It also includes an opportunity management view that incorporates our best practice renewal sales methodology to enable teams to focus on selling by quickly accessing quotes and customer information to maximize performance. |
| • | Channel Sales Cloud. Our Channel Sales Cloud provides channel partners and resellers with online access to their specific renewals opportunities and their performance. The application includes an executive dashboard that enables partners to view their renewals pipeline, their performance against key performance targets and how they are trending compared to previous quarters. In addition, an opportunity view allows partners to manage each upcoming renewal opportunity, find account, contact and asset information specific to that opportunity, download pre-built quotes and request assistance from ServiceSource to support the sales process. |
5
Table of Contents
| • | eCommerce Cloud. Our eCommerce Cloud provides self-service capabilities to end customers through a secure, online portal. End customers can view their support contract information, modify their support coverage, obtain updated quotes, renew service contracts and secure on-line payment to our customers. In addition, it allows end customers to reach our service sales team should they require assistance or wish to make a purchase offline. |
| • | Installed Base Intelligence Cloud. Our Installed Base Intelligence Cloud provides a single repository for cleansed installed base data and deep business intelligence to analyze the integrity and completeness of the data to flag anomalies and missing data elements and to identify cross-sell and up-sell opportunities. The application is tightly integrated with the Service Sales Cloud™ and Channel Sales Cloud to provide resellers, distributors and sales representatives with an accurate view of the installed base, including information on end customer purchases and usage. The Installed Base Intelligence Cloud also facilitates workflow between sales representatives, channel partners and the ServiceSource sales operations teams to correct installed base data issues in the source systems. |
| • | Dynamic Quoting Cloud. Our Dynamic Quoting Cloud provides an easy-to-use tool for sales representatives and channel partners to create and modify service renewal quotes. This application can be deployed through the Channel Sales Cloud and Service Sales Cloud™ and is tightly integrated with a configurable product and price rules engine. |
Service Sales Teams
Our service sales teams consist of individuals with specific expertise in our customers’ businesses, selling under our customers’ brand and following sales processes tailored specifically to increase contract renewals, all of which is aimed at maximizing the value of the service revenue opportunity. These teams are deployed in direct sales or channel enablement models, and in each case manage the key components of the renewals process. Our service sales teams currently sell in over 40 languages from five sales centers around the globe and are supported by a global operations support center. Our service sales teams are grouped into two primary areas:
| • | Global Selling. We employ service sales personnel that interact directly with end customers to sell service renewals. They also provide active sales enablement, support and management of channel partners. Our service sales teams act as an extension of our customers’ brands. |
| • | Sales Operations. We provide service revenue forecasting tailored to fit our customers’ bookings, revenue targets and specific reporting requirements. We supply a dedicated team of resources and tools to build and update customer and channel partner quotes and distribute them to the sales teams, channel partners and customers. Finally, we offer a business analytics team that provides analysis to maximize service revenue performance and provide insight into end customers, competitors and channel partners. |
Customers
We sell our solutions to technology and technology-enabled healthcare and life sciences companies. As of December 31, 2011, we managed over 120 engagements across approximately 70 customers, representing over $7 billion in service revenue opportunity under management.
Our top ten customers accounted for approximately 47%, 54% and 65% of our revenue in 2011, 2010 and 2009, respectively. One and two customers represented over 10% of our revenue in 2011 and 2010, respectively.
Sales and Marketing
We sell our solutions through our global sales organization. Our sales representatives are organized by geographic regions, including NALA, EMEA and APJ, and by industry verticals. We deploy quota-carrying sales and solution design professionals to target specific regions and industry verticals.
6
Table of Contents
We generate customer leads, accelerate sales opportunities and build brand awareness through our marketing programs. Our marketing programs target sales, services and finance executives within technology and technology-enabled healthcare and life sciences and industrial systems industries. Our marketing teams and programs are organized by geography and industry segment to focus on the unique needs of customers within the specific target markets.
We host an annual executive summit in each of our three sales geographic regions where customers and industry players participate in a variety of programs designed to share information about the issues of service revenue performance. The summits feature a variety of prominent keynote and customer speakers, panelists and presentations. These events also bring together partners, customers and other key participants in the service revenue management industry. Attendees gain insight into our technology roadmap and participate in interactive sessions that encourage them to express opinions on new features and functionality.
We are actively involved in the Service Executive Industry Board (“SEIB”), an independent industry board we founded to share best practices and address issues impacting the industry. The board members consist of 21 senior executives, including three of our executives, who manage and grow service revenue at leading technology-based hardware, software, and healthcare companies. SEIB meets regularly to establish industry standards and best practices for benchmarking and measuring the health of global maintenance, support and subscription service revenue and customer satisfaction.
Operations
Our cloud based solution is hosted in a secure third-party data center in the San Francisco Bay Area of California. Physical security features at this facility include 24x7 manned security with biometric access controls. Our technical redundancy features include redundant power, on-site backup generators, and environmental controls and monitoring. Our technology employs a wide range of security features, such as firewalls, server and user authentication access controls, data encryption, secured hosting, multi-tenant database, a global redundant network and secure encrypted offsite backup of sensitive data. We conduct regular security audits and tests for vulnerability and analysis of our infrastructure. We adhere to strict change management procedures and security policies when updating our technology. We proactively monitor and manage our infrastructure at all times for capacity, security and reliability. Our applications are secured via SSL protocols with data contained in a storage area network for high availability and security. Data backups are offsite, encrypted both during the transmission and at rest.
Research and Development
We focus our research and development efforts on enhancing our product and service offerings as well as complementary new capabilities as part of our proprietary solution. Our development strategy is to identify features, business intelligence, applications and other technology elements that are, or are expected to be, needed by service sales professionals, customers, channel partners and end customers to optimize service revenue performance. We are also investing in the development of additional cloud applications to serve our customers’ needs and enable greater operational efficiencies in our organization.
Our research and development expenses were $13.1 million in 2011, $7.2 million in 2010 and $2.1 million in 2009. In addition, we capitalize certain expenditures related to the development and enhancement of internal-use software. Capitalized software expenses were $6.0 million in 2011, $4.7 million in 2010, and $5.0 million in 2009.
Competition
The market for service revenue management is evolving. Historically, technology companies have managed their service renewals through internal personnel and relied upon technology ranging from Excel spreadsheets to internally-developed software to customized versions of traditional business intelligence tools and CRM or ERP
7
Table of Contents
software from vendors such as Oracle, SAP, salesforce.com and NetSuite. Some companies have made further investments in this area using firms such as Accenture and McKinsey for technology consulting and education services focused on service renewals. These internally-developed solutions represent the primary alternative to our integrated approach of combining software, managed services and data to provide end-to-end optimized service revenue performance.
We believe the principal competitive factors in our markets include the following:
| • | service revenue industry expertise, best practices, and benchmarks; |
| • | performance-based pricing of solutions; |
| • | ability to increase service revenue, renewal rates and close rates; |
| • | global capabilities; |
| • | completeness of solution; |
| • | ability to effectively represent customer brands to end customers and channel partners; |
| • | size of upfront investment; and |
| • | size and financial stability of operations. |
Although we believe we compete or compare favorably with respect to many of these factors and currently have few direct competitors that offer integrated solutions at our scale, we believe that other competitors will emerge who have greater name recognition, longer operating histories, well-established relationships with customers in our markets and substantially greater financial, technical, personnel and other resources than we have. We expect competition and competitive pressure, from both new and existing competitors, to increase in the future.
Intellectual Property
We rely upon a combination of copyrights, trade secrets and trademarks, in addition to contractual restrictions such as confidentiality agreements, to establish and protect our proprietary rights. We currently have one registered copyright in the United States, and have registered trademarks for “ServiceSource” in the United States, the European Community, Japan and Singapore. We also have pending trademark applications for the name ServiceSource in other locations and for other trade names in various locations.
Despite our efforts to protect our proprietary rights, unauthorized parties may attempt to copy or obtain and use our technology and/or brand names to develop products with the same functionality as our solution. Policing unauthorized use of our technology is difficult. The laws of other countries in which we market our solutions may offer little or no effective protection of our proprietary technology. Our competitors could also independently develop technologies equivalent to ours, and our intellectual property rights may not be broad enough for us to prevent competitors from selling products incorporating those technologies. Reverse engineering, unauthorized copying or other misappropriation of our proprietary technology could enable third parties to benefit from our technology without paying us for it, which would significantly harm our business.
We expect that technology solutions in our industry may be increasingly subject to third-party patent infringement claims as the number of competitors grows and the functionality of products in different industry segments overlaps. Such competitors could make a claim alleging that we infringe one or more of their patents, and we do not own any patents which could be asserted against them. Third parties may currently have, or may eventually be issued, patents upon which our current solution or future technology infringe. Any of these third parties might make a claim of infringement against us at any time.
Employees
As of December 31, 2011, we had 2,110 employees. None of our employees is represented by a labor union with respect to his or her employment with us.
8
Table of Contents
| ITEM 1A. | RISK FACTORS |
You should carefully consider the risks and uncertainties described below, together with all of the other information in this Annual Report on Form 10-K. If any of the following risks is realized, our business, financial condition, results of operations, cash flows, the trading price of our common stock and prospects could be materially and adversely affected. The risks described below are not the only risks facing us. Risks and uncertainties not currently known to us or that we currently deem to be immaterial also may materially affect our business, financial condition, results of operations, cash flows, the trading price of our common stock and prospects.
Risks Related to Our Business and Industry
Our quarterly results of operations may fluctuate as a result of numerous factors, many of which may be outside of our control.
Our quarterly operating results are likely to fluctuate. Some of the important factors that may cause our revenue, operating results and cash flows to fluctuate from quarter to quarter include:
| • | our ability to attract new customers and retain existing customers; |
| • | fluctuations in the value of end customer contracts delivered to us; |
| • | fluctuations in close rates; |
| • | changes in our commission rates; |
| • | seasonality; |
| • | loss of customers for any reason including due to acquisition; |
| • | the mix of new customers as compared to existing customers; |
| • | the length of the sales cycle for our solution, and our level of upfront investments prior to the period we begin generating sales associated with such investments; |
| • | the timing of customer payments and payment defaults by customers; |
| • | the amount and timing of operating costs and capital expenditures related to the operations of our business; |
| • | the rate of expansion and productivity of our direct sales force; |
| • | the cost and timing of the introduction of new technologies or new services, including additional investments in our cloud applications; |
| • | general economic conditions; |
| • | technical difficulties or interruptions in delivery of our solution; |
| • | changes in foreign currency exchange rates; |
| • | changes in the effective tax rates; |
| • | regulatory compliance costs, including with respect to data privacy; |
| • | costs associated with acquisitions of companies and technologies; |
| • | extraordinary expenses such as litigation or other dispute-related settlement payments; and |
| • | the impact of new accounting pronouncements. |
Many of the above factors are discussed in more detail elsewhere in these Risk Factors. Many of these factors are outside our control, and the variability and unpredictability of such factors could result in our failing to meet our revenue or operating results expectations for a given period. In addition, the occurrence of one or
9
Table of Contents
more of these factors might cause our operating results to vary widely which could lead to negative impacts on our margins, short-term liquidity or ability to retain or attract key personnel, and could cause other unanticipated issues. Accordingly, we believe that quarter-to-quarter comparisons of our revenue, operating results and cash flows may not be meaningful and should not be relied upon as an indication of future performance.
The market for our solution is relatively undeveloped and may not grow.
The market for service revenue management is still relatively undeveloped, has not yet achieved widespread acceptance and may not grow quickly or at all. Our success will depend to a substantial extent on the willingness of companies to engage a third party such as us to manage the sales of their support, maintenance and subscription contracts. Many companies have invested substantial personnel, infrastructure and financial resources in their own internal service revenue organizations and therefore may be reluctant to switch to a solution such as ours. Companies may not engage us for other reasons, including a desire to maintain control over all aspects of their sales activities and customer relations, concerns about end customer reaction, a belief that they can sell their support, maintenance and subscription services more cost-effectively using their internal sales organizations, perceptions about the expenses associated with changing to a new approach and the timing of expenses once they adopt a new approach, general reluctance to adopt any new and different approach to old ways of doing business, or other considerations that may not always be evident. New concerns or considerations may also emerge in the future. Particularly because our market is undeveloped, we must address our potential customers’ concerns and explain the benefits of our approach in order to convince them to change the way that they manage the sales of support, maintenance and subscription contracts. If companies are not sufficiently convinced that we can address their concerns and that the benefits of our solution are compelling, then the market for our solution may not develop as we anticipate and our business will not grow.
Our customer relationships and overall business will suffer if we encounter significant problems migrating customers to our next- generation technology platform, or if the new platform does not meet expectations.
We have announced plans to launch our next-generation service revenue management platform (code named Avalon) in the latter part of 2012, and we intend to migrate all of our customers to this new technology platform over time. This new platform will be the core foundation for our customer-facing cloud applications, in addition to those we use for our internal operations. We have limited experience migrating customers from one platform to another. Given the complexity and significance of this transition, our customer relationships, our reputation, and our overall business could be severely damaged if these migrations go poorly. Similarly, even if the migrations go smoothly, our business operations and customer relationships will be at high risk if the new platform does not meet our performance expectations, or those of our customers. This could harm our business in numerous ways including, without limitation, a loss of revenue, lost customer contracts, and damage to our reputation.
Delayed or unsuccessful investment in new technology, services and markets may harm our financial results.
We plan to continue to invest significant resources in research and development in order to enhance our existing offerings and introduce new offerings that will appeal to customers and potential customers. We have undertaken the development of new technology to offer improved and more scalable service revenue management, including enhancements to our applications. The development of new products and services entails a number of risks that could adversely affect our business and operating results, including:
| • | the risk of diverting the attention of our management and our employees from the day-to-day operations of the business; |
| • | insufficient revenue to offset increased expenses associated with research, development, operational and marketing activities; and |
| • | write-offs of the value of such technology investments as a result of unsuccessful implementation or otherwise. |
10
Table of Contents
If our new or modified technology does not work as intended, is not responsive to user preferences or industry or regulatory changes, is not appropriately timed with market opportunity, or is not effectively brought to market, we may lose existing and potential customers or related service revenue opportunities, in which case our results of operations may suffer. The cost of future development of new service revenue management offerings or technologies also could require us to raise additional debt or equity financing. These actions could negatively impact the ownership percentages of our existing stockholders, our financial condition or our results of operations.
We may choose to sell subscriptions to our cloud applications separately from our integrated solution, which may not be successful and could impact revenue from our existing solution.
We currently derive a small portion of our revenue from subscriptions to our cloud applications for a few customers, and we are exploring alternatives for packaging and pricing these applications to generate more revenues from them. In the event we choose to expand our technology subscriptions in this manner, we may not find a successful market for our applications. In addition, because we have limited prior experience selling technology subscriptions on a stand-alone basis, we may encounter technical and execution challenges that undermine the quality of the technology offering or cause us to fall short of customer expectations. We also have little experience in pricing our technology subscriptions separately, which could result in under pricing that damages our profit margins and other financial performance. It is also possible that selling a technology solution separate from our integrated solution will result in a reduction in sales of our current offerings that we might otherwise have sold. An unsuccessful expansion of our business to promote a stand-alone subscription model for any of the foregoing reasons or otherwise would lead to a diversion of financial and managerial resources from our existing business and an inability to generate sufficient revenue to offset our investment costs.
Our estimates of service revenue opportunity under management and other metrics may prove inaccurate.
We use various estimates in formulating our business plans and analyzing our potential and historical performance, including our estimate of service revenue opportunity under management. We base our estimates upon a number of assumptions that are inherently subject to significant business and economic uncertainties and contingencies, many of which are beyond our control. Our estimates therefore may prove inaccurate.
Service revenue opportunity under management (“opportunity under management”) is a forward-looking metric and is our estimate, as of a given date, of the value of all end customer service contracts that we will have the opportunity to sell on behalf of our customers over the subsequent twelve-month period. Opportunity under management is not a measure of our expected revenue. We estimate the value of such end customer contracts based on a combination of factors, including the value of end customer contracts made available to us by customers in past periods, the minimum value of end customer contracts that our customers are required to give us the opportunity to sell pursuant to the terms of their contracts with us, periodic internal business reviews of our expectations as to the value of end customer contracts that will be made available to us by customers, the value of end customer contracts included in the Service Performance Analysis (“SPA”) and collaborative discussions with our customers assessing their expectations as to the value of service contracts that they will make available to us for sale. While the minimum value of end customer contracts that our customers are required to give us represents a portion of our estimated opportunity under management, a significant portion of the opportunity under management is estimated based on the other factors described above.
When estimating service revenue opportunity under management and other similar metrics, we must, to a large degree, rely on the assumptions described above, which may prove incorrect. These assumptions are inherently subject to significant business and economic uncertainties and contingencies, many of which are beyond our control. Our estimates therefore may prove inaccurate, causing the actual value of end customer contracts delivered to us in a given twelve-month period to differ from our estimate of opportunity under management. These factors include:
| • | the extent to which customers deliver a greater or lesser value of end customer contracts than may be required or otherwise expected; |
11
Table of Contents
| • | roll-overs of unsold service contract renewals from prior periods to the current period or future periods; |
| • | changes in the pricing or terms of service contracts offered by our customers; |
| • | increases or decreases in the end customer base of our customers; |
| • | the extent to which the renewal rates we achieve on behalf of a customer early in an engagement affect the amount of opportunity that the customer makes available to us later in the engagement; |
| • | customer cancellations of their contracts with us due to acquisitions or otherwise; and |
| • | changes in our customers’ businesses, sales organizations, sales processes or priorities. |
In addition, opportunity under management reflects our estimate for a forward twelve-month period and should not be used to estimate our opportunity for any particular quarter within that period.
If our security measures are breached or fail, resulting in unauthorized access to customer data, our solution may be perceived as insecure, the attractiveness of our solution to current or potential customers may be reduced and we may incur significant liabilities.
Our solution involves the storage and transmission of the proprietary information and protected data that we receive from our customers. We rely on proprietary and commercially available systems, software, tools and monitoring, as well as other processes, to provide security for processing, transmission and storage of such information. If our security measures are breached or fail as a result of third-party action, employee negligence, error, malfeasance or otherwise, unauthorized access to customer or end customer data may occur. Improper activities by third parties, advances in computer and software capabilities and encryption technology, new tools and discoveries and other events or developments may facilitate or result in a compromise or breach of our computer systems. Techniques used to obtain unauthorized access or to sabotage systems change frequently and generally are not recognized until launched against a target, and we may be unable to anticipate these techniques or implement adequate preventive measures. Our security measures may not be effective in preventing these types of activities, and the security measures of our third-party data centers and service providers may not be adequate.
Our customer contracts generally provide that we will indemnify our customers for data privacy breaches. If such a breach occurs, we could face contractual damages, damages and fees arising from our indemnification obligations, penalties for violation of applicable laws or regulations, possible lawsuits by affected individuals and significant remediation costs and efforts to prevent future occurrences. In addition, whether there is an actual or a perceived breach of our security, the market perception of the effectiveness of our security measures could be harmed significantly and we could lose current or potential customers.
We may be liable to our customers or third parties if we make errors in providing our solution or fail to properly safeguard their confidential information.
The solution we offer is complex, and we make errors from time to time. These may include human errors made in the course of managing the sales process for our customers as we interact with their end customers, or errors arising from our technology solution as it interacts with our customers’ systems and the disparate data contained on such systems. The costs incurred in correcting any material errors may be substantial. In addition, as part of our business, we collect, process and analyze confidential information provided by our customers and prospective customers. Although we take significant steps to safeguard the confidentiality of customer information, we could be subject to claims that we disclosed their information without appropriate authorization or used their information inappropriately. Any claims based on errors or unauthorized disclosure or use of information could subject us to exposure for damages, significant legal defense costs, adverse publicity and reputational harm, regardless of the merits or eventual outcome of such claims.
12
Table of Contents
If close rates fall short of our predictions, our revenue will suffer and our ability to grow and achieve broader market acceptance of our solution could be harmed.
Given our pay-for-performance pricing model, our revenue is directly tied to close rates. Close rates represent the percentage of the actual opportunity delivered that we renew on behalf of our customers. If the close rate for a particular customer is lower than anticipated, then our revenue for that customer will also be lower than projected. If close rates fall short of expectations across a broad range of customers, or if they fall below expectations for a particularly large customer, then the impact on our revenue and our overall business will be significant. In the event close rates are lower than expected for a given customer, our margins will suffer because we will have already incurred a certain level of costs in both personnel and infrastructure to support the engagement. This risk is compounded by the fact that many of our customer relationships are terminable if we fail to meet certain specified sales targets over a sustained period of time. If actual close rates fall to a level at which our revenue and customer contracts are at risk, then our financial performance will decline and we will be severely compromised in our ability to retain and attract customers. Increasing our customer base and achieving broader market acceptance of our solution depends, to a large extent, on how effectively our solution increases service sales. As a result, poor performance with respect to our close rates, in addition to causing our revenue, margins and earnings to suffer, will likely damage our reputation and prevent us from effectively developing and maintaining awareness of our brand or achieving widespread acceptance of our solution, in which case we could fail to grow our business and our revenue, margins and earnings would suffer.
Our revenue will decline if there is a decrease in the overall demand for our customers’ products and services for which we provide service revenue management.
Our revenue is based on a pay-for-performance model under which we are paid a commission based on the service contracts we sell on behalf of our customers. If a particular customer’s products or services fail to appeal to its end customers, our revenue may decline. In addition, if end customer demand decreases for other reasons, such as negative news regarding our customers or their products, unfavorable economic conditions, shifts in strategy by our customers away from promoting the service contracts we sell in favor of selling their other products or services to their end customers, or if end customers experience financial constraints and fail to renew the service contracts we sell, we may experience a decrease in our revenue as the demand for our customers’ service contracts declines.
If we are unable to compete effectively against current and future competitors, our business and operating results will be harmed.
The market for service revenue management is evolving. Historically, technology companies have managed their service renewals through internal personnel and relied upon technology ranging from Excel spreadsheets to internally-developed software to customized versions of traditional business intelligence tools and CRM or ERP software from vendors such as Oracle, SAP, salesforce.com and NetSuite. Some companies have made further investments in this area using firms such as Accenture and McKinsey for technology consulting and education services focused on service renewals. These internally-developed solutions represent the primary alternative to our integrated approach. We also face direct competition from smaller companies that offer specialized service revenue management solutions, typically providing technology for use by their customers’ internal sales personnel.
We believe the principal competitive factors in our markets include the following:
| • | service revenue industry expertise, best practices, and benchmarks; |
| • | performance-based pricing of solutions; |
| • | ability to increase service revenue, renewal rates, and close rates; |
| • | global capabilities; |
| • | completeness of solution; |
13
Table of Contents
| • | ability to effectively represent customer brands to end customers and channel partners; |
| • | size of upfront investment; and |
| • | size and financial stability of operations. |
We believe that more competitors will emerge. These competitors may have greater name recognition, longer operating histories, well-established relationships with customers in our markets and substantially greater financial, technical, personnel and other resources than we have. Potential competitors of any size may be able to respond more quickly and effectively than we can to new or changing opportunities, technologies, standards or customer or end customer requirements. Even if our solution is more effective than competing solutions, potential customers might choose new entrants unless we can convince them of the advantages of our integrated solution. We expect competition and competitive pressure, from both new and existing competitors, to increase in the future.
If there is a widespread shift away from business customers purchasing maintenance and support service contracts, we could be adversely impacted if we are not able to adapt to new trends or expand our target markets.
As a result of our historical concentration in the software and hardware industries, a significant portion of our revenue comes from the sale of maintenance and support service contracts for the software and hardware products used by our customers’ end customers. Although we also sell other types of renewals, such as subscriptions to software-as-a-service offerings, those sales have to date constituted a relatively small portion of our revenue. The emergence of cloud computing and other alternative technology purchasing models, in which technology services are provided on a remote-access basis, may have a significant impact on the size of the market for traditional maintenance and support contracts. If these alternative models continue gaining traction and reduce the size of our traditional market, we will need to continue to adapt our solution to capitalize on these trends or our results of operations will suffer.
The loss of one or more of our key customers could slow our revenue growth or cause our revenue to decline.
A substantial portion of our revenue has to date come from a relatively small number of customers. During the year ended December 31, 2011, our top ten customers accounted for 47% of our revenue with one customer representing over 10% of our revenue. A relatively small number of customers may continue to account for a significant portion of our revenue for the foreseeable future. The loss of any of our significant customers for any reason, including the failure to renew our contracts, a change of relationship with any of our key customers or their acquisition as discussed below, may cause a significant decrease in our revenue.
Supporting our existing and growing customer base could strain our personnel resources and infrastructure, and if we cannot scale our operations and increase productivity, we may be unsuccessful in implementing our business plan.
In recent periods, we have experienced significant growth in our customer base, which has placed a strain on our management, administrative, operational and financial infrastructure. We anticipate that additional investments in sales personnel, information technology, infrastructure and research and development spending will be required to:
| • | scale our operations and increase productivity; |
| • | address the needs of our customers; |
| • | further develop and enhance our solution and offerings; |
| • | develop new technology; and |
| • | expand our markets and opportunity under management, including into new industry verticals and geographic areas. |
14
Table of Contents
Our success will depend in part upon our ability to manage our growth effectively. To do so, we must continue to increase the productivity of our existing employees and to hire, train and manage new employees as needed. To manage domestic and international growth of our operations and personnel, we will need to continue to improve our operational, financial and management controls and our reporting processes and procedures, and implement more extensive and integrated financial and business information systems. These additional investments will increase our operating costs, which will make it more difficult for us to offset any future revenue shortfalls by reducing expenses in the short term. Moreover, if we fail to scale our operations successfully and increase productivity, our overall business will be at risk.
Consolidation in the technology sector is continuing at a rapid pace, which could harm our business in the event that our customers are acquired and their contracts are cancelled.
Consolidation among technology companies in our target market has been robust in recent years, and this trend poses a risk for us. Acquisitions of our customers could lead to cancellation of our contracts with those customers by the acquiring companies and could reduce the number of our existing and potential customers. For example, Oracle has acquired a number of our customers in recent years, including our then largest customer, Sun Microsystems, in January 2010, and another customer, BEA Systems, in April 2008. Oracle has elected to terminate our service contracts with each customer because Oracle conducts its service revenue management internally. If mergers and acquisitions continue, we expect that some of the acquiring companies, and Oracle in particular, will terminate, renegotiate and/or elect not to renew our contracts with the companies they acquire, which would reduce our revenue.
We enter into long-term, commission-based contracts with our customers, and our failure to correctly price these contracts may negatively affect our profitability.
We enter into long-term contracts with our customers that are priced based on multiple factors determined in large part by the SPA we conduct for our customers. These factors include opportunity size, anticipated close rates and expected commission rates at various levels of sales performance. Some of these factors require forward looking assumptions that may prove incorrect. If our assumptions are inaccurate, or if we otherwise fail to correctly price our customer contracts, particularly those with lengthy contract terms, then our revenue, profitability and overall business operations may suffer. Further, if we fail to anticipate any unexpected increase in our cost of providing services, including the costs for employees, office space or technology, we could be exposed to risks associated with cost overruns related to our required performance under our contracts, which could have a negative effect on our margins and earnings.
Many of our customer contracts allow termination for our failure to meet certain performance conditions.
Although most of our customer contracts are subject to multi-year terms, these agreements often have termination rights if we fail to meet specified sales targets. During the SPA and contract negotiation phase with a customer, we typically negotiate minimum performance levels for the engagement. If we fail to meet our required targets and our customers choose to exercise their termination rights, our revenue could decline. These termination rights may also create instability in our revenue forecasts and other forward looking financial metrics.
Our business may be harmed if our customers rely upon our service revenue forecasts in their business and actual results are materially different.
The contracts that we enter into with our customers provide for sharing of information with respect to forecasts and plans for the renewal of maintenance, support and subscription agreements of our customers. Our customers may use such forecasted data for a variety of purposes related to their business. Our forecasts are based upon the data our customers provide to us, and are inherently subject to significant business, economic and competitive uncertainties, many of which are beyond our control. In addition, these forecasted expectations are
15
Table of Contents
based upon historical trends and data that may not be true in subsequent periods. Any material inaccuracies related to these forecasts could lead to claims on the part of our customers related to the accuracy of the forecasted data we provide to them, or the appropriateness of our methodology. Any liability that we incur or any harm to our brand that we suffer because of inaccuracies in the forecasted data we provide to our customers could impact our ability to retain existing customers and harm our brand and, ultimately, our business.
Changing global economic conditions and large scale economic shifts may impact our business.
Our overall performance depends in part on worldwide economic conditions that impact the technology sector and other technology-enabled industries such as healthcare, life sciences and industrial systems. For example, the recent economic downturn resulted in many businesses deferring technology investments, including purchases of new software, hardware and other equipment, and purchases of additional or supplemental maintenance, support and subscription services. To a certain extent, these businesses also slowed the rate of renewals of maintenance, support and subscription services for their existing technology base. A future downturn could cause business customers to stop renewing their existing maintenance, support and subscription agreements or contracting for additional maintenance services as they look for ways to further cut expenses, in which case our business could suffer.
Conversely, a significant upturn in global economic conditions could cause business purchasers to purchase new hardware, software and other technology products, which we generally do not sell, instead of renewing or otherwise purchasing maintenance, support and subscription services for their existing products. A general shift toward new product sales could reduce our near term opportunities for these contracts, which could lead to a decline in our revenue.
Our inability to expand our target markets could adversely impact our business and operating results.
We derive substantially all of our revenue from customers in certain sectors in the technology and technology-enabled healthcare and life sciences industries, and an important part of our strategy is to expand our existing customer base and win new customers in these industries. In addition, because of the service revenue opportunities that we believe exist beyond these industries, we intend to target new customers in additional industry vertical markets, such as technology-enabled building services. In connection with the expansion of our target markets, we may not have familiarity with such additional industry verticals, and our execution of such expansion could face risks where our Service Revenue Intelligence Platform is less developed within a particular new vertical. We may encounter customers in these previously untapped markets that have different pricing and other business sensitivities than we are used to managing. As a result of these and other factors, our efforts to expand our solution to additional industry vertical markets may not succeed, may divert management resources from our existing operations and may require us to commit significant financial resources to unproven parts of our business, all of which may harm our financial performance.
Our business and growth depend substantially on customers renewing their agreements with us and expanding their use of our solution for additional available markets. Any decline in our customer renewals or failure to expand their relationships with us could harm our future operating results.
In order for us to improve our operating results and grow, it is important that our customers renew their agreements with us when the initial contract term expires and that we expand our customer relationships to add new market opportunities and related service revenue opportunity under management. Our customers may elect not to renew their contracts with us after the initial terms have expired, and we cannot assure you that our customers will renew service contracts with us at the same or higher level of service, if at all, or provide us with the opportunity to manage additional opportunity. Although our renewal rates have been historically higher than those achieved by our customers prior to their using our solution, some customers have elected not to renew their agreements with us. Our customers’ renewal rates may decline or fluctuate as a result of a number of factors, including their satisfaction or dissatisfaction with our solution and results, our pricing, mergers and acquisitions
16
Table of Contents
affecting our customers or their end customers, the effects of economic conditions or reductions in our customers’ or their end customers’ spending levels. If our customers do not renew their agreements with us, renew on less favorable terms or fail to contract with us for additional service revenue management opportunities, our revenue may decline and we may not realize improved operating results and growth from our customer base.
A substantial portion of our business consists of supporting our customers’ channel partners in the sale of service contracts. If those channel partners become unreceptive to our solution, our business could be harmed.
Many of our customers, including some of our largest customers, sell service contracts through their channel partners and engage our solution to help those channel partners become more effective at selling service contract renewals. These channel partners may have access to some of our cloud applications, such as our Channel Sales Cloud, in addition to other sales support services we provide. In this context, the ultimate buyers of the service contracts are end customers of those channel partners, who then receive the actual services from our customers. In the event our customers’ channel partners become unreceptive to our involvement in the renewals process, those channel partners could discourage our current or future customers from engaging our solution to support channel sales. This risk is compounded by the fact that large channel partners may have relationships with more than one of our customers or prospects, in which case the negative reaction of one or more of those large channel partners could impact multiple customer relationships. Accordingly, with respect to those customers and prospective customers who sell service contracts through channel partners, any significant resistance to our solution by their channel partners could harm our ability to attract or retain customers, which would damage our overall business operations.
We face long sales cycles to secure new customer contracts, making it difficult to predict the timing of specific new customer relationships.
We face a variable selling cycle to secure new customer agreements, typically spanning a number of months and requiring our effort to obtain and analyze our prospect’s business through the SPA, for which we are not paid. Moreover, even if we succeed in developing a relationship with a potential new customer, the scope of the potential service revenue management engagement frequently changes over the course of the business discussions and, for a variety of reasons, our sales discussions may fail to result in new customer acquisitions. Consequently, we have only a limited ability to predict the timing and size of specific new customer relationships.
If we experience significant fluctuations in our anticipated growth rate and fail to balance our expenses with our revenue forecasts, our results could be harmed.
Due to our evolving business model, the uncertain size of our markets and the unpredictability of future general economic and financial market conditions, we may not be able to accurately forecast our growth rate. We plan our expense levels and investments based on estimates of future sales performance for our customers with respect to their end customers, future revenue and future customer acquisition. If our assumptions prove incorrect, we may not be able to adjust our spending quickly enough to offset the resulting decline in growth and revenue. Consequently, we expect that our gross margins, operating margins and cash flows may fluctuate significantly on a quarterly basis.
If we cannot efficiently implement our offering for customers, we may be delayed in generating revenue, fail to generate revenue and/or incur significant costs.
In general, our customer engagements are complex and may require lengthy and significant work to implement our offerings. As a result, we generally incur sales and marketing expenses related to the commissions owed to our sales representatives and make upfront investments in technology and personnel to support the engagements one to three months before we begin selling end customer contracts. Each customer’s situation may
17
Table of Contents
be different, and unanticipated difficulties and delays may arise as a result of our failure, or that of our customer, to meet respective implementation responsibilities. If the customer implementation process is not executed successfully or if execution is delayed, we could incur significant costs without yet generating revenue, and our relationships with some of our customers may be adversely impacted.
Because competition for our target employees is intense, we may be unable to attract and retain the highly skilled employees we need to support our planned growth.
To continue to execute on our growth plan, we must attract and retain highly qualified sales representatives, engineers and other key employees in the international markets in which we have operations. Competition for these personnel is intense, especially for highly educated, qualified sales representatives. We have from time to time in the past experienced, and we expect to continue to experience in the future, difficulty in hiring and retaining highly skilled key employees with appropriate qualifications. If we fail to attract new sales representatives, engineers and other key employees, or fail to retain and motivate our most successful employees, our business and future growth prospects could be harmed.
The length of time it takes our newly-hired sales representatives to become productive could adversely impact our success rate, the execution of our overall business plan and our costs.
It can take twelve months or longer before our internal sales representatives are fully trained and productive in selling our solution to prospects and customers. This long ramp period presents a number of operational challenges as the cost of recruiting, hiring and carrying new sales representatives cannot be offset by the revenue such new sales representatives produce until after they complete their long ramp periods. Further, given the length of the ramp period, we often cannot determine if a sales representative will succeed until he or she has been employed for a year or more. If we cannot reliably develop our sales representatives to a productive level, or if we lose productive representatives in whom we have heavily invested, our future growth rates and revenue will suffer.
If we lose our top executives, or if we are unable to attract, hire, integrate and retain key personnel and other necessary employees, our business will be harmed.
Our future success depends on the continued contributions of our executives, each of whom may be difficult to replace. Our future success also depends in part on our ability to attract, hire, integrate and retain qualified service sales personnel, sales representatives and management level employees to oversee such sales forces. In particular, Michael Smerklo, our chairman of the board of directors and chief executive officer, is critical to the management of our business and operations and the development of our strategic direction. The loss of Mr. Smerklo’s services or those of our other executives, or our inability to continue to attract and retain high-quality talent, could harm our business.
We depend on revenue from sources outside the United States, and our international business operations and expansion plans are subject to risks related to international operations, and may not increase our revenue growth or enhance our business operations.
For the year ended December 31, 2011, approximately 38% of our revenue was generated from sales centers located outside of the United States. As a result of our continued focus on international markets, we expect that future revenue derived from international sources will continue to represent a significant portion of our total revenue.
A portion of the sales commissions earned from our international customers is paid in foreign currencies. As a result, fluctuations in the value of these foreign currencies may make our solution more expensive or cause resulting fluctuations in cost for international customers, which could harm our business. We currently do not undertake hedging activities to manage these currency fluctuations. In addition, if the effective price of the
18
Table of Contents
contracts we sell to the end customers were to increase as a result of fluctuations in the exchange rate of the relevant currencies, demand for such contracts could fall, which in turn would reduce our revenue.
Our growth strategy includes further expansion into international markets. Our international expansion may require significant additional financial resources and management attention, and could negatively affect our financial condition, cash flows and operating results. In addition, we may be exposed to associated risks and challenges, including:
| • | the need to localize and adapt our solution for specific countries, including translation into foreign languages and associated expenses; |
| • | difficulties in staffing and managing foreign operations; |
| • | different pricing environments, longer sales cycles and longer accounts receivable payment cycles and difficulties in collecting accounts receivable; |
| • | new and different sources of competition; |
| • | weaker protection for our intellectual property than in the United States and practical difficulties in enforcing our rights abroad; |
| • | laws and business practices favoring local competitors; |
| • | compliance obligations related to multiple, conflicting and changing foreign governmental laws and regulations, including employment, tax, privacy and data protection laws and regulations; |
| • | increased financial accounting and reporting burdens and complexities; |
| • | restrictions on the transfer of funds; |
| • | adverse tax consequences; and |
| • | unstable regional and economic political conditions. |
We cannot assure you we will succeed in creating additional international demand for our solution or that we will be able to effectively sell service agreements in all of the international markets we enter.
We could experience significant problems implementing various new business software applications, including our new financial ERP system, which may negatively impact our internal operations.
We are in the process of upgrading and/or replacing various software systems, including our financial ERP system. If the implementations of these new applications are delayed, or if we encounter unforeseen problems with our new systems or in migrating away from our existing applications and systems, our operations and our ability to plan and forecast our business could be negatively impacted.
We incur increased costs and demands upon management as a result of complying with the laws and regulations affecting public companies, which could adversely affect our operating results.
As a newly public company, we incur significant legal, accounting and other expenses that we did not incur as a private company, and greater expenditures may be necessary in the future with the advent of new laws, regulations and stock exchange listing requirements pertaining to public companies. The Sarbanes-Oxley Act of 2002 and the Dodd-Frank Act of 2010, as well as rules subsequently implemented by the Securities and Exchange Commission and The NASDAQ Stock Market LLC, impose various requirements on public companies, including establishing effective internal controls and certain corporate governance practices. Our management and other personnel devote a substantial amount of time to these compliance initiatives, and additional laws and regulations may divert further management resources. Moreover, if we are not able to comply with the requirements of new compliance initiatives in a timely manner, the market price of our stock
19
Table of Contents
could decline, and we could be subject to investigations and other actions by The NASDAQ Stock Market LLC, the Securities and Exchange Commission, or other regulatory authorities, which would require additional financial and management resources.
In particular, we are required to evaluate our internal control over financial reporting in connection with Section 404 of the Sarbanes-Oxley Act, and our independent registered public accounting firm will be required to attest to our internal control over financial reporting starting with our Annual Report on Form 10-K for 2012. This assessment will need to include disclosure of any material weaknesses in our internal control over financial reporting identified by our management, as well as our independent registered public accounting firm’s report on our internal control over financial reporting. Compiling the system and processing documentation needed to comply with such requirements is costly and challenging, and as a public company and to manage our growth, we are required to implement and maintain various other control and business systems related to our equity, finance, treasury, information technology, other recordkeeping systems and other operations. We may not be able to complete our evaluation, testing and any required remediation in a timely fashion. During the evaluation and testing processes, if we identify one or more material weaknesses in our internal control over financial reporting, we will be unable to assert that our internal control over financial reporting is effective. If we are unable to assert that our internal control over financial reporting is effective, if our independent registered public accounting firm is unable to express an opinion on the effectiveness of our internal control over financial reporting, or if we are unable to remedy any material weakness in our internal control over financial reporting or implement or maintain other effective control or business systems, our financial statements may be inaccurate, we may face restricted access to the capital markets and our stock price may be adversely affected.
Changes in the U.S. and foreign legal and regulatory environment that affect our operations, including those relating to privacy, data security and cross-border data flows, could pose a significant risk to our company by disrupting our business and increasing our expenses.
We are subject to a wide variety of laws and regulations in the United States and the other jurisdictions in which we operate, and changes in the level of government regulation of our business have the potential to materially alter our business practices with resultant increases in costs and decreases in profitability. Depending on the jurisdiction, those changes may come about through new legislation, the issuance of new regulations or changes in the interpretation of existing laws and regulations by a court, regulatory body or governmental official. Sometimes those changes may have both prospective and retroactive effect, which is particularly true when a change is made through reinterpretation of laws or regulations that have been in effect for some time.
Privacy and data security are rapidly evolving areas of regulation, and additional regulation in those areas, some of it potentially difficult and costly for us to accommodate, is frequently proposed and occasionally adopted. Laws in many countries and jurisdictions, particularly in the European Union and Canada, govern the requirements related to how we store, transfer or otherwise process the private data provided to us by our customers. In addition, the centralized nature of our information systems at the data and operations centers that we use requires the routine flow of data relating to our customers and their respective end customers across national borders, both with respect to the jurisdictions within which we have operations and the jurisdictions in which we provide services to our customers. If this flow of data becomes subject to new or different restrictions, our ability to serve our customers and their respective customers could be seriously impaired for an extended period of time. For example, we participate in the U.S. Department of Commerce Safe Harbor Framework to govern our treatment of data and data flow with respect to our customers and their respective customers across various jurisdictions. We also have entered into various model contracts and related contractual provisions to enable these data flows. For any jurisdictions in which these measures are not recognized or otherwise not compliant with the laws of the countries in which we process data, or where more stringent data privacy laws are enacted irrespective of international treaty arrangements or other existing compliance mechanisms, we could face increased compliance expenses and face penalties for violating such laws or be excluded from those markets altogether, in which case our operations could be materially damaged.
20
Table of Contents
If we do not adequately protect our intellectual property rights, our competitive position and our business may suffer.
We rely upon a combination of trademark, copyright and trade secret law and contractual terms to protect our intellectual property rights, all of which provide only limited protection. Our success depends, in part, upon our ability to establish, protect and enforce our intellectual property and other proprietary rights. If we fail to protect or effectively enforce our intellectual property rights, others may be able to compete against us using intellectual property that is the same as or similar to our own. In addition, we cannot assure you that our intellectual property rights are sufficient to provide us with a competitive advantage against others who offer services similar to ours.
While we have no patents or pending patent applications, we may file patent applications in the future. If we do file patent applications, we cannot assure you that any issued patents arising from future applications will provide the protection we seek, or that any future patents issued to us will not be challenged, invalidated or circumvented. Also, we cannot assure you that we will obtain any copyright or trademark registrations from our pending or future applications or that any of our trademarks will be enforceable or provide adequate protection of our proprietary rights.
We also rely in some circumstances on trade secrets to protect our technology. Trade secrets may lose their value if not properly protected. We endeavor to enter into non-disclosure agreements with our employees, customers, contractors and business partners to limit access to and disclosure of our proprietary information. The steps we have taken, however, may not prevent unauthorized use of our technology, and adequate remedies may not be available in the event of unauthorized use or disclosure of our trade secrets and proprietary technology. However, trade secret protection does not prevent others from reverse engineering or independently developing similar technologies. In addition, reverse engineering, unauthorized copying or other misappropriation of our trade secrets could enable third parties to benefit from our technology without paying for it.
Accordingly, despite our efforts, we may be unable to prevent third parties from infringing or misappropriating our intellectual property and using our technology for their competitive advantage. Any such infringement or misappropriation could have a material adverse effect on our business, results of operations and financial condition. Monitoring infringement of our intellectual property rights can be difficult and costly, and enforcement of our intellectual property rights may require us to bring legal actions against infringers. Infringement actions are inherently uncertain and therefore may not be successful, even when our rights have been infringed. Even if such actions are successful, they may require a substantial amount of resources and divert our management’s attention.
Claims by others that we infringe or violate their intellectual property could force us to incur significant costs and require us to change the way we conduct our business.
Numerous technology companies including potential competitors protect their intellectual property rights by means such as patents, trade secrets, copyrights and trademarks. We have not conducted an independent review of patents issued to third parties. Additionally, because patent applications in the United States and many other jurisdictions are kept confidential for 18 months before they are published, we may be unaware of pending patent applications that relate to our proprietary technology. From time to time we may receive letters from other parties alleging, or inquiring about, possible breaches of their intellectual property rights.
Any party asserting that we infringe its proprietary rights would force us to defend ourselves, and possibly our customers, against the alleged infringement. The technology industry is characterized by the existence of a large number of patents, copyrights, trademarks and trade secrets and by frequent litigation based on allegations of infringement or other violations of intellectual property rights. Moreover, the risk of such a lawsuit will likely increase as we become larger, the scope of our solution and technology expands and the number of competitors in our market increases. Any such claims or litigation could:
| • | be time-consuming and expensive to defend, and deplete our financial resources, whether meritorious or not; |
21
Table of Contents
| • | require us to stop providing the services that use the technology that infringes the other party’s intellectual property; |
| • | divert the attention of our technical and managerial resources away from our business; |
| • | require us to enter into royalty or licensing agreements with third parties, which may not be available on terms that we deem acceptable, if at all; |
| • | prevent us from operating all or a portion of our business or force us to redesign our technology, which could be difficult and expensive and may make the performance or value of our solution less attractive; |
| • | subject us to significant liability for damages or result in significant settlement payments; or |
| • | require us to indemnify our customers as we are required by contract to indemnify some of our customers for certain claims based upon the infringement or alleged infringement of any third party’s intellectual property rights resulting from our customers’ use of our intellectual property. |
During the course of any intellectual property litigation, confidential information may be disclosed in the form of documents or testimony in connection with discovery requests, depositions or trial testimony. Disclosure of our confidential information and our involvement in intellectual property litigation could harm us. In addition, any uncertainties resulting from the initiation and continuation of any litigation could significantly limit our ability to continue our operations and could harm our relationships with current and prospective customers. Any of the foregoing could disrupt our business and have a material adverse effect on our operating results and financial condition.
In addition, we may incorporate open source software into our technology solution. The terms of many open source licenses have not been interpreted by United States or foreign courts, and there is a risk that such licenses could be construed in a manner that imposes unanticipated conditions or restrictions on our commercialization of any of our solutions that may include open source software. As a result, we will be required to analyze and monitor our use of open source software closely. As a result of the use of open source software, we could be required to seek licenses from third parties in order to develop such future products, re-engineer our products, discontinue sales of our solutions or release our software code under the terms of an open source license to the public. Given the nature of open source software, there is also a risk that third parties may assert copyright and other intellectual property infringement claims against us based on any use of such open source software, as more generally discussed with respect to general intellectual property claims.
Various risks could affect our worldwide operations, including numerous events outside of our control, exposing us to significant costs that could adversely affect our operations and customer confidence.
We conduct operations throughout the world, including our headquarters in the United States and various operations in Ireland, Malaysia, Singapore and the United Kingdom. Such worldwide operations expose us to potential operational disruptions and costs as a result of a wide variety of events, including local inflation or economic downturn, currency exchange fluctuations, political turmoil, labor issues, terrorism, natural disasters and pandemics. Any such disruptions or costs could have a negative effect on our ability to provide our solution or meet our contractual obligations, the cost of our solution, customer satisfaction, our ability to attract or maintain customers, and, ultimately, our profits.
Natural disasters or other catastrophic events may cause damage or disruption to our operations, international commerce and the global economy, and thus could have a strong negative effect on us. Our business operations are subject to interruption by natural disasters, fire, power shortages, pandemics and other events beyond our control. Such events could make it difficult or impossible for us to deliver our solution to our customers, and could decrease demand for our solution. The majority of our research and development activities, corporate headquarters, information technology systems and other critical business operations are located near major seismic faults in the San Francisco Bay Area. Because we may not have insurance coverage that would
22
Table of Contents
cover quake-related losses, and significant recovery time could be required to resume operations, our financial condition and operating results could be materially adversely affected in the event of a major earthquake or catastrophic event.
Terrorist attacks and other acts of violence or war may adversely affect worldwide financial markets and could potentially lead to economic recession, which could adversely affect our business, results of operations, financial condition and cash flows. These events could adversely affect our customers’ levels of business activity and precipitate sudden significant changes in regional and global economic conditions and cycles.
The technology we currently use may not operate properly, which could damage our reputation, give rise to claims against us or divert application of our resources from other purposes, any of which could harm our business and operating results.
The technology we currently use, which includes our cloud based applications as well as the technology components of our Service Revenue Intelligence Platform, may contain or develop unexpected defects or errors. There can be no assurance that performance problems or defects in our technology will not arise in the future. Errors may result from receipt, entry or interpretation of customer or end customer information or from the interface of our technology with legacy systems and data that are outside of our control. Despite testing, defects or errors may arise in our solution. Any defects and errors that we discover in our technology and any failure by us to identify and effectively address them could result in loss of revenue or market share, liability to customers or others, failure to achieve market acceptance or expansion, diversion of development resources, injury to our reputation, and increased costs. Defects or errors in our technology may discourage existing or potential customers from contracting with us. Correction of defects or errors could prove impossible or impracticable. The costs incurred in correcting any defects or errors or in responding to resulting claims or liability may be substantial and could adversely affect our operating results.
Disruptions in service or damage to the data center that hosts our data and our locations could adversely affect our business.
Our operations depend on our ability to maintain and protect our data servers and cloud applications, which are located in a data center operated for us by a third party. We cannot control or assure the continued or uninterrupted availability of this third-party data center. In addition, our information technologies and systems, as well as our data center, are vulnerable to damage or interruption from various causes, including natural disasters, war and acts of terrorism and power losses, computer systems failures, Internet and telecommunications or data network failures, operator error, losses of and corruption of data and similar events. Although we conduct business continuity planning and maintain certain insurance for certain events, the situations for which we plan, and the amount of insurance coverage we maintain, may prove inadequate in any particular case. In addition, the occurrence of any of these events could result in interruptions, delays or cessations in the delivery of the solutions we offer to our customers. Any of these events could impair or prohibit our ability to provide our solution, reduce the attractiveness of our solution to current or potential customers and adversely impact our financial condition and results of operations.
In addition, despite the implementation of security measures, our infrastructure, data center, operations and other centers or systems that we interface with, including the Internet and related systems, may be vulnerable to physical intrusions, hackers, improper employee or contractor access, computer viruses, programming errors, denial-of-service attacks or other attacks by third parties.
Any failure or interruptions in the Internet infrastructure, bandwidth providers, data center providers, other third parties or our own systems for providing our solution to customers could negatively impact our business.
Our ability to deliver our solution is dependent on the development and maintenance of the infrastructure of the Internet and other telecommunications services by third parties. Such services include maintenance of a reliable network backbone with the necessary speed, data capacity and security for providing reliable Internet access and services and reliable telecommunications systems that connect our global operations. While our
23
Table of Contents
solution is designed to operate without interruption, we have experienced and expect that we will in the future experience interruptions and delays in services and availability from time to time. We rely on internal systems as well as third-party vendors, including data center, bandwidth, and telecommunications equipment providers, to provide our solution. We do not maintain redundant systems or facilities for some of these services. In the event of a catastrophic event with respect to one or more of these systems or facilities, we may experience an extended period of system unavailability, which could negatively impact our relationship with our customers.
Additional government regulations may reduce the size of market for our solution, harm demand for our solution and increase our costs of doing business.
Any changes in government regulations that impact our customers or their end customers could have a harmful effect on our business by reducing the size of our addressable market or otherwise increasing our costs. For example, with respect to our technology-enabled healthcare and life sciences customers, any change in U.S. Food and Drug Administration or foreign equivalent regulation of, or denial, withholding or withdrawal of approval of, our customers’ products could lead to a lack of demand for service revenue management with respect to such products. Other changes in government regulations, in areas such as privacy, export compliance or anti-bribery statutes, such as the U.S. Foreign Corrupt Practices Act, could require us to implement changes in our services or operations that increase our cost of doing business and thereby hurt our financial performance.
The future success of our business depends upon the continued use of the Internet as a primary medium for commerce, communication and business applications. Federal, state or foreign government bodies or agencies have in the past adopted, and may in the future adopt, laws or regulations affecting data privacy and the use of the Internet as a commercial medium. In addition, government agencies or private organizations may begin to impose taxes, fees or other charges for accessing the Internet. These laws or charges could limit the growth of Internet-related commerce or communications generally, result in a decline in the use of the Internet and the viability of Internet-based applications such as ours and reduce the demand for our solution.
We operate and offer our services in many jurisdictions and, therefore, may be subject to state, local and foreign taxes that could harm our business.
We operate service sales centers in multiple locations. Some of the jurisdictions in which we operate, such as Ireland, give us the benefit of either relatively low tax rates, tax holidays or government grants, in each case that are dependent on how we operate or how many jobs we create and employees we retain. We plan on utilizing such tax incentives in the future as opportunities are made available to us. Any failure on our part to operate in conformity with applicable requirements to remain qualified for any such tax incentives or grants may result in an increase in our taxes. In addition, jurisdictions may choose to increase rates at any time due to economic or other factors, such as the current economic situation in Ireland. Any such rate increases may harm our results of operations.
In addition, we may lose sales or incur significant costs should various tax jurisdictions impose taxes on either a broader range of services or services that we have performed in the past. We may be subject to audits of the taxing authorities in any such jurisdictions that would require us to incur costs in responding to such audits. Imposition of such taxes on our services could result in substantial unplanned costs, would effectively increase the cost of such services to our customers and may adversely affect our ability to retain existing customers or to gain new customers in the areas in which such taxes are imposed.
If we acquire companies or technologies in the future, they could prove difficult to integrate, disrupt our business, dilute stockholder value and adversely affect our operating results and the value of our common stock.
As part of our business strategy, we may acquire, enter into joint ventures with, or make investments in companies, services and technologies that we believe to be complementary. Acquisitions and investments involve numerous risks, including:
| • | difficulties in identifying and acquiring technologies or businesses that will help our business; |
24
Table of Contents
| • | difficulties in integrating operations, technologies, services and personnel; |
| • | diversion of financial and managerial resources from existing operations; |
| • | the risk of entering new markets in which we have little to no experience; |
| • | risks related to the assumption of known and unknown liabilities; |
| • | potential litigation by third parties, such as claims related to intellectual property or other assets acquired or liabilities assumed; |
| • | the risk of write-offs of goodwill and other intangible assets; |
| • | delays in customer engagements due to uncertainty and the inability to maintain relationships with customers of the acquired businesses; |
| • | inability to generate sufficient revenue to offset acquisition or investment costs; |
| • | incurrence of acquisition-related costs; |
| • | harm to our existing business relationships with business partners and customers as a result of the acquisition; |
| • | the key personnel of the acquired entity or business may decide not to work for us or may not perform according to our expectations; and |
| • | use of substantial portions of our available cash or dilutive issuances of equity securities or the incurrence of debt to consummate the acquisition. |
As a result, if we fail to properly evaluate acquisitions or investments, we may not achieve the anticipated benefits of any such acquisitions, we may incur costs in excess of what we anticipate and management resources and attention may be diverted from other necessary or valuable activities.
Risks Relating to Owning Our Common Stock
Our share price has been volatile and is likely to be volatile in the future.
The trading price of our common stock is likely to be highly volatile and could be subject to wide fluctuations in response to various factors. Further, our common stock has a limited trading history. In addition to the risks described in this section, factors that may cause the market price of our common stock to fluctuate include:
| • | fluctuations in our quarterly financial results or the quarterly financial results of companies perceived to be similar to us as discussed in more detail elsewhere in these “Risk Factors;” |
| • | failing to achieve our revenue or earnings expectations, or those of investors or analysts; |
| • | changes in estimates of our financial results or recommendations by securities analysts; |
| • | recruitment or departure of key personnel; |
| • | investors’ general perception of us; |
| • | volatility inherent in prices of technology company stocks; |
| • | adverse publicity; |
| • | the volume of trading in our common stock, including sales upon exercise of outstanding options; |
| • | sales of shares of our common stock by existing stockholders; |
| • | regulatory developments in our target markets affecting us, our customers or our competitors; |
25
Table of Contents
| • | terrorist attacks or natural disasters or other such events impacting countries where we or our customers have operations; and |
| • | actual or perceived changes in general economic, industry and market conditions. |
In addition, if the stock market in general experiences a loss of investor confidence, the trading price of our common stock could decline for reasons unrelated to our business, financial condition or results of operations.
Some companies that have had volatile market prices for their securities have had securities class actions filed against them. If a suit were filed against us, regardless of its merits or outcome, it would likely result in substantial costs and divert management’s attention and resources. This could have a material adverse effect on our business, operating results and financial condition.
Our actual results may differ significantly from any guidance that we may issue in the future.
From time to time, we may release financial guidance or other forward looking statements in our earnings releases, earnings conference calls or otherwise, regarding our future performance that represent our management’s estimates as of the date of release. If given, this guidance will be based on forecasts prepared by our management. These forecasts are not prepared with a view toward compliance with published accounting guidelines, and neither our registered public accountants nor any other independent expert or outside party compiles or examines the forecasts and, accordingly, no such person expresses any opinion or any other form of assurance with respect to such forecasts. The principal reason that we may release guidance is to provide a basis for our management to discuss our business outlook with analysts and investors. We do not accept any responsibility for any projections or reports published by any such third persons. Guidance is necessarily speculative in nature, and it can be expected that some or all of the assumptions of any future guidance furnished by us may not materialize or may vary significantly from actual future results.
Concentration of ownership among our existing executive officers, directors and their affiliates may prevent new investors from influencing significant corporate decisions.
Our directors and executive officers and their affiliates beneficially own, in the aggregate, approximately 41% of our outstanding common stock as of December 31, 2011. As a result, these stockholders will be able to determine substantially all matters requiring stockholder approval, including the election of directors and approval of significant corporate transactions, such as a merger or other sale of our company or its assets. This concentration of ownership could limit the ability of other stockholders to influence corporate matters and may have the effect of delaying or preventing a third party from acquiring control over us.
Anti-takeover provisions contained in our certificate of incorporation and by laws, as well as provisions of Delaware law, could impair a takeover attempt.
Our certificate of incorporation, by laws and Delaware law contain provisions that could have the effect of rendering more difficult or discouraging an acquisition deemed undesirable by our board of directors. Our corporate governance documents include provisions:
| • | authorizing blank check preferred stock, which could be issued by our board of directors without stockholder approval, with voting, liquidation, dividend and other rights superior to our common stock; |
| • | classifying our board of directors, staggered into three classes, only one of which is elected at each annual meeting; |
| • | limiting the liability of, and providing indemnification to, our directors and officers; |
| • | limiting the ability of our stockholders to call and bring business before special meetings and to take action by written consent in lieu of a meeting; |
26
Table of Contents
| • | requiring advance notice of stockholder proposals for business to be conducted at meetings of our stockholders and for nominations of candidates for election to our board of directors; |
| • | controlling the procedures for the conduct and scheduling of stockholder meetings; |
| • | providing the board of directors with the express power to postpone previously scheduled annual meetings and to cancel previously scheduled special meetings; |
| • | limiting the determination of the number of directors on our board and the filling of vacancies or newly created seats on the board to our board of directors then in office; and |
| • | providing that directors may be removed by stockholders only for cause. |
These provisions, alone or together, could delay hostile takeovers and changes in control or changes in our management.
As a Delaware corporation, we are also subject to provisions of Delaware law, including Section 203 of the Delaware General Corporation law, which limits the ability of stockholders owning in excess of 15% of our outstanding common stock to merge or combine with us.
Any provision of our certificate of incorporation, by laws or Delaware law that has the effect of delaying or deterring a change in control could limit the opportunity for our stockholders to receive a premium for their shares of our common stock, and could also affect the price that some investors are willing to pay for our common stock.
If securities or industry analysts do not publish or cease publishing research or reports about us, our business or our market, or if they change their recommendations regarding our stock, our stock price and trading volume could decline.
The trading market for our common stock will depend in part on the research and reports that securities or industry analysts publish about us or our business. If any of these analysts cease coverage of our company, the trading price and trading volume of our stock could be negatively impacted. If analysts downgrade our stock or publish unfavorable research about our business, our stock price would also likely decline.
27
Table of Contents
| ITEM 1B. | UNRESOLVED STAFF COMMENTS |
None.
| ITEM 2. | PROPERTIES |
Our corporate headquarters and principal administrative, sales and marketing and product development operations are located in San Francisco, CA. We also have five globally distributed sales centers. We have two sales centers in North America, one in each of Denver and Nashville. We have additional international sales centers in Dublin, Ireland; Liverpool, United Kingdom; and Singapore. We also have a global sales operations center in Kuala Lumpur, Malaysia. We use this center to centralize key contract renewal processes that do not require regional expertise, such as customer data management and quoting. We do not own any real estate. All of our office space is leased under long-term leases with varying expiration dates. We believe that our facilities are adequate to meet our needs in the near future.
| ITEM 3. | LEGAL PROCEEDINGS |
From time to time, we are subject to litigation or threatened litigation in the general nature of business. We do not believe the resolution of these matters will have a material adverse impact on our consolidated financial position, results of operations or cash flows.
| ITEM 4. | MINE SAFETY DISCLOSURES |
Not applicable
28
Table of Contents
PART II
| ITEM 5. | MARKET FOR REGISTRANT’S COMMON EQUITY, RELATED STOCKHOLDER MATTERS, AND ISSUER PURCHASES OF EQUITY SECURITIES |
Market Information
Our common stock has traded on The NASDAQ Global Market under the symbol “SREV” since it began trading on March 25, 2011. Our initial public offering was priced at $10.00 per share on March 24, 2011. The following table sets forth, for the time period indicated, the high and low closing prices of our common stock as reported on The NASDAQ Global Market.
| 2011 | ||||||||
| High | Low | |||||||
| First Quarter (from March 25, 2011) |
$ | 12.43 | $ | 11.53 | ||||
| Second Quarter |
$ | 22.22 | $ | 11.75 | ||||
| Third Quarter |
$ | 22.29 | $ | 12.80 | ||||
| Fourth Quarter |
$ | 15.84 | $ | 12.08 | ||||
Holders
As of February 28, 2012, there were 125 holders of record of our common stock. A substantially greater number of holders of our common stock are “street name” or beneficial holders, whose shares are held by banks, brokers and other financial institutions.
Dividends
We have never declared or paid cash dividends on our common stock. We currently intend to retain all available funds and any future earnings for use in the operation of our business and do not anticipate paying any dividends on our common stock in the foreseeable future. Any future determination to declare dividends will be made at the discretion of our board of directors and will depend on our financial condition, operating results, capital requirements, general business conditions and other factors that our board of directors may deem relevant. In addition, our credit facility contains restrictions on our ability to declare and pay cash dividends on our capital stock.
Stock Performance Graph
This performance graph shall not be deemed “filed” for purposes of Section 18 of the Securities Exchange Act of 1934, as amended (the “Exchange Act”), or incorporated by reference into any filing of ServiceSource under the Securities Act of 1933, as amended, or the Exchange Act, except as shall be expressly set forth by specific reference in such filing.
The following graph shows a comparison from March 25, 2011(the date our common stock commences trading on The NASDAQ Global Market) through December 31, 2011, of the cumulative total return for (1) our common stock, (2) Morgan Stanley Technology Index, and (3) the NASDAQ Composite Index. Such returns are
29
Table of Contents
based on historical results and are not intended to suggest future performance. Data for The NASDAQ Composite Index and Morgan Stanley Technology Index assume reinvestment of dividends. We have never declared or paid cash dividends on our capital stock nor do we anticipate paying any such cash dividends in the foreseeable future.
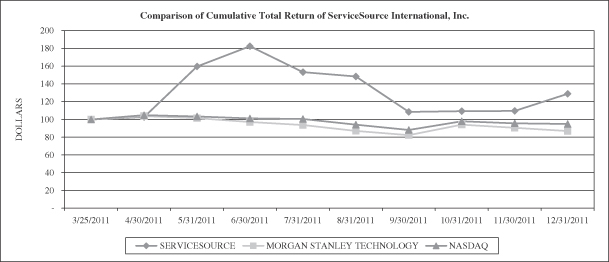
| 3/25/2011 | 4/30/2011 | 5/31/2011 | 6/30/2011 | 7/31/2011 | 8/31/2011 | 9/30/2011 | 10/31/2011 | 11/30/2011 | 12/31/2011 | |||||||||||||||||||||||||||||
| ServiceSource |
100.00 | 102.63 | 159.69 | 182.43 | 153.28 | 148.36 | 108.46 | 109.28 | 109.52 | 128.82 | ||||||||||||||||||||||||||||
| Morgan Stanley Technology Index |
100.00 | 103.71 | 101.47 | 97.07 | 93.71 | 86.98 | 82.25 | 94.11 | 90.53 | 86.91 | ||||||||||||||||||||||||||||
| NASDAQ Composite Index |
100.00 | 104.76 | 103.36 | 101.11 | 100.49 | 94.04 | 88.05 | 97.86 | 95.53 | 94.97 | ||||||||||||||||||||||||||||
Recent Sales of Unregistered Securities
None.
30
Table of Contents
Use of Proceeds
Our initial public offering of common stock was effected through a Registration Statement on Form S-1 (File No. 333-171271) that was declared effective by the Securities and Exchange Commission on March 24, 2011, which registered an aggregate of 13,731,153 shares of our common stock, including 1,791,020 shares that the underwriters had the option to purchase. On March 30, 2011, 9,791,020 shares of common stock were sold on our behalf, including 1,791,020 shares sold by us upon the exercise in full of the underwriters’ option to purchase additional shares, and 3,940,133 shares of common stock were sold on behalf of the selling stockholders, at a price to the public of $10.00 per share, for an aggregate gross offering price of $97,910,200 to us, and $39,401,330 to the selling stockholders. The underwriters of the offering were Morgan Stanley & Co. Incorporated, Deutsche Bank Securities, Inc., Piper Jaffrey & Co., JMP Securities LLC, William Blair & Company, L.L.C. and Lazard Capital Markets LLC. Following the sale of the shares in connection with the closing of our initial public offering, the offering terminated.
We paid underwriting discounts and commissions totaling approximately $6.9 million in connection with the offering. In addition, we incurred additional costs of approximately $3.2 million in connection with the offering, which when added to the underwriting discounts and commissions paid by us, amounts to total fees and costs of approximately $10.1 million. Thus, the net offering proceeds to us, after deducting underwriting discounts and commissions and offering costs, were approximately $87.7 million. No offering costs were paid directly or indirectly to any of our directors or officers (or their associates) or persons owning ten percent or more of any class of our equity securities or to any other affiliates, other than the payment of certain legal expenses on behalf of our selling stockholders.
Our follow-on offering of common stock was effected through a Registration Statement on Form S-1 (File No. 333-175626) that was declared effective by the Securities and Exchange Commission on July 28, 2011, which registered an aggregate of 10,350,000 shares of our common stock, including 1,372,061 shares of common stock sold by us (inclusive of 1,350,000 shares of common stock from the full exercise of the over-allotment option granted to the underwriters) and 8,977,939 shares of common stock sold by the selling stockholders. The price of the shares sold in the offering was $17.50 per share. The total gross proceeds from the offering to us were $24.0 million. After deducting underwriting discounts and commissions and estimated offering expenses payable by the Company, the aggregate net proceeds received by the Company totaled approximately $23.0 million. We did not receive any proceeds from the sales of shares by the selling stockholders (other than approximately $2.9 million in additional cash received from the exercise of stock options by certain of the selling stockholders). The underwriters of the offering were Morgan Stanley & Co. Incorporated, Deutsche Bank Securities, Inc., Piper Jaffrey & Co., JMP Securities LLC, William Blair & Company, L.L.C. , Lazard Capital Markets LLC, Oppenheimer & Co., Wells Fargo Securities and Credit Agricole CIB. Following the sale of the shares in connection with the closing of our follow-on offering, the offering terminated.
There was no material change in the use of proceeds from our initial and follow-on public offerings as described in our final prospectus filed with the SEC pursuant to Rule 424(b). From the effective date of the registration statement through December 31, 2011, we have used the net proceeds of the offering for repayment of a term-loan and borrowing under a revolving credit facility and for working capital and other general corporate purposes.
Purchases of Equity Securities by the Issuer and Affiliated Purchasers
None.
31
Table of Contents
| ITEM 6. | SELECTED FINANCIAL DATA |
The following selected consolidated financial data should be read in conjunction with “Management’s Discussion and Analysis of Financial Condition and Results of Operations” and our consolidated financial statements and the related notes included elsewhere in this Annual Report on Form 10-K.
| Years Ended December 31, | ||||||||||||||||||||
| 2011 | 2010 | 2009 | 2008 | 2007 | ||||||||||||||||
| (in thousands, except per share amounts) | ||||||||||||||||||||
| Net revenue |
$ | 205,501 | $ | 152,935 | $ | 110,676 | $ | 100,280 | $ | 75,189 | ||||||||||
| Cost of revenue(1) |
113,406 | 90,048 | 58,877 | 56,965 | 39,224 | |||||||||||||||
|
|
|
|
|
|
|
|
|
|
|
|||||||||||
| Gross profit |
92,095 | 62,887 | 51,799 | 43,315 | 35,965 | |||||||||||||||
|
|
|
|
|
|
|
|
|
|
|
|||||||||||
| Operating expenses |
||||||||||||||||||||
| Sales and marketing(1) |
48,520 | 35,119 | 23,182 | 20,486 | 13,119 | |||||||||||||||
| Research and development(1) |
13,073 | 7,188 | 2,054 | 1,160 | — | |||||||||||||||
| General and administrative(1) |
33,647 | 19,378 | 13,777 | 10,571 | 10,475 | |||||||||||||||
| Amortization of intangible assets(1) |
— | — | 68 | 857 | 912 | |||||||||||||||
|
|
|
|
|
|
|
|
|
|
|
|||||||||||
| Total operating expenses |
95,240 | 61,685 | 39,081 | 33,074 | 24,506 | |||||||||||||||
|
|
|
|
|
|
|
|
|
|
|
|||||||||||
| Income from operations |
(3,145 | ) | 1,202 | 12,718 | 10,241 | 11,459 | ||||||||||||||
| Interest expense |
(503 | ) | (1,271 | ) | (1,116 | ) | (2,209 | ) | (2,305 | ) | ||||||||||
| Loss on extinguishment/modification of debt |
(235 | ) | (144 | ) | — | (561 | ) | — | ||||||||||||
| Other income (expense), net |
(389 | ) | (207 | ) | 639 | (1,497 | ) | (118 | ) | |||||||||||
|
|
|
|
|
|
|
|
|
|
|
|||||||||||
| Income (loss) before provision for (benefit from) income taxes |
(4,272 | ) | (420 | ) | 12,241 | 5,974 | 9,036 | |||||||||||||
| Income tax (benefit) provision |
(19,383 | ) | 2,147 | 1,866 | 1,153 | (632 | ) | |||||||||||||
|
|
|
|
|
|
|
|
|
|
|
|||||||||||
| Net income (loss) |
$ | 15,111 | $ | (2,567 | ) | $ | 10,375 | $ | 4,821 | $ | 9,668 | |||||||||
|
|
|
|
|
|
|
|
|
|
|
|||||||||||
| Net income (loss) per common share: |
||||||||||||||||||||
| Basic |
$ | 0.23 | $ | (0.04 | ) | $ | 0.18 | $ | 0.09 | $ | 0.17 | |||||||||
|
|
|
|
|
|
|
|
|
|
|
|||||||||||
| Diluted |
$ | 0.21 | $ | (0.04 | ) | $ | 0.18 | $ | 0.08 | $ | 0.16 | |||||||||
|
|
|
|
|
|
|
|
|
|
|
|||||||||||
| Cash distributions per common share(2) |
$ | — | $ | 0.04 | $ | — | $ | 0.09 | $ | 0.09 | ||||||||||
|
|
|
|
|
|
|
|
|
|
|
|||||||||||
| Weighted-average shares used in computing net income (loss) per common share: |
||||||||||||||||||||
| Basic |
66,656 | 57,284 | 56,750 | 56,209 | 55,936 | |||||||||||||||
|
|
|
|
|
|
|
|
|
|
|
|||||||||||
| Diluted |
73,585 | 57,284 | 58,912 | 58,733 | 58,706 | |||||||||||||||
|
|
|
|
|
|
|
|
|
|
|
|||||||||||
| (1) | Reported amounts include stock-based compensation expense as follows: |
| Years Ended December 31, | ||||||||||||||||||||
| 2011 | 2010 | 2009 | 2008 | 2007 | ||||||||||||||||
| (in thousands) | ||||||||||||||||||||
| Cost of revenue |
$ | 1,877 | $ | 1,126 | $ | 914 | $ | 1,271 | $ | 1,096 | ||||||||||
| Sales and marketing |
4,456 | 2,993 | 2,340 | 1,570 | 1,100 | |||||||||||||||
| Research and development |
1,167 | 803 | 541 | — | — | |||||||||||||||
| General and administrative |
4,099 | 3,167 | 2,265 | 2,608 | 1,680 | |||||||||||||||
|
|
|
|
|
|
|
|
|
|
|
|||||||||||
| Total stock-based compensation |
$ | 11,599 | $ | 8,089 | $ | 6,060 | $ | 5,449 | $ | 3,876 | ||||||||||
|
|
|
|
|
|
|
|
|
|
|
|||||||||||
| (2) | Pursuant to our previous limited liability company agreement, we were required to pay cash distributions to our members to fund their tax obligations in respect of their equity interests. All other distributions are |
32
Table of Contents
| determined by our directors in their sole discretion. Tax distributions to members were $0, $2.5 million, $0, $5.2 million, and $5.1 million in 2011, 2010, 2009, 2008, and 2007, respectively. Effective with our initial public offering, we converted from a limited liability company into a Delaware Corporation. |
| As of December 31, | ||||||||||||||||||||
| 2011 | 2010 | 2009 | 2008 | 2007 | ||||||||||||||||
| (in thousands) | ||||||||||||||||||||
| Consolidated Balance Sheet Data: |
||||||||||||||||||||
| Cash, cash equivalents and short-term investments |
$ | 108,865 | $ | 22,652 | $ | 13,169 | $ | 3,780 | $ | 13,147 | ||||||||||
| Working capital |
134,796 | 18,135 | 19,099 | 12,319 | 15,175 | |||||||||||||||
| Total assets |
238,961 | 108,103 | 69,580 | 51,712 | 45,367 | |||||||||||||||
| Term loan, current and non-current |
— | 15,459 | 16,835 | 19,625 | 20,000 | |||||||||||||||
| Obligations under capital leases, current and non-current |
1,664 | 1,759 | 773 | 151 | — | |||||||||||||||
| Total members’/stockholders’ equity |
197,016 | 33,884 | 30,331 | 13,482 | 7,937 | |||||||||||||||
33
Table of Contents
| ITEM 7. | MANAGEMENT’S DISCUSSION AND ANALYSIS OF FINANCIAL CONDITION AND RESULTS OF OPERATIONS |
This Management’s Discussion and Analysis of Financial Condition and Results of Operations (“MD&A”) should be read in conjunction with our annual consolidated financial statements and notes thereto which appear elsewhere in this Annual Report on Form 10-K.
These discussions contain “forward-looking statements” that involve risks and uncertainties, as well as assumptions that, if they never materialize or prove incorrect, could cause our results to differ materially from those expressed or implied by such forward-looking statements. These forward-looking statements include, but are not limited to, statements related to changes in market conditions that impact our ability to generate service revenue on our customers’ behalf; errors in estimates as to the service revenue we can generate for our customers; risks associated with material defects or errors in our software or the effect of data security breaches; our ability to adapt our solution to changes in the market or new competition; our ability to improve our customers’ renewal rates, margins and profitability; our ability to increase our revenue and contribution margin over time from new and existing customers; the potential effect of mergers and acquisitions on our customer base; business strategies; technology development; protection of our intellectual property; investment and financing plans; liquidity; competitive position; the effects of competition; industry environment; and potential growth opportunities. Forward-looking statements are also often identified by the use of words such as, but not limited to, “anticipate,” “believe,” “can,” “continue,” “could,” “estimate,” “expect,” “intend,” “may,” “plan,” “project,” “seek,” “should,” “target,” “will,” “would,” and similar expressions or variations intended to identify forward-looking statements. These statements are based on the beliefs and assumptions of our management based on information currently available to management. Such forward-looking statements are subject to risks, uncertainties and other important factors that could cause actual results and the timing of certain events to differ materially from future results expressed or implied by such forward-looking statements. Factors that could cause or contribute to such differences include, but are not limited to, those identified below, and those discussed in the section of this Annual Report on Form 10-K titled “Risk Factors”. Furthermore, such forward-looking statements speak only as of the date of this report. Except as required by law, we undertake no obligation to update any forward-looking statements to reflect events or circumstances after the date of such statements.
All dollar amounts expressed as numbers in this MD&A (except per share amounts) are in millions.
Overview
We manage the service contract renewals process for renewals of maintenance, support and subscription agreements on behalf of our customers. Our integrated solution consists of a suite of cloud applications, dedicated service sales teams working under our customers’ brands and a proprietary Service Revenue Intelligence Platform. By integrating software, managed services and data, we address the critical steps of the renewals process including data management, quoting, selling and service revenue business intelligence. Our business is built on our pay-for-performance model, whereby our revenues are based on the service renewals customers achieve with our solution. As of December 31, 2011, we managed over 120 engagements across approximately 70 customers, representing over $7 billion in service revenue opportunity under management.
We were formed in November 2002 as a limited liability company, and shortly thereafter we purchased certain assets of a business originally started by service sales representatives from a major technology company. Since then we have refined our business model, developed and expanded our service sales teams, our suite of cloud based applications and our Service Revenue Intelligence Platform, and opened additional sales centers in the United States, Europe and Asia and a global sales operations center in Kuala Lumpur, Malaysia. We broadened our customer focus from technology companies to also include technology-enabled healthcare and life sciences and industrial systems companies. We have experienced rapid growth in our operations in recent periods, as indicated by the following:
| • | Our revenue has increased from $152.9 million in 2010 to $205.5 million in 2011, representing an increase of 34%. |
34
Table of Contents
| • | Our engagements have grown from approximately 100 as of December 31, 2010 to over 120 as of December 31, 2011. |
We are currently in the midst of a significant investment cycle in which we have taken steps designed to drive our future growth and profitability. We plan to offer additional cloud based applications, hire additional sales, service sales and other personnel and further build out our infrastructure to develop our technology. These steps impacted our expenses in recent periods and are expected to continue to impact our profitability in future periods.
On March 24, 2011, our registration statement on Form S-1 relating to our initial public offering (“IPO”) was declared effective by the Securities and Exchange Commission (“SEC”). The IPO closed on March 30, 2011, at which time we sold 9,791,020 shares of our common stock (inclusive of 1791,020 shares of common stock from the full exercise of the over-allotment option granted to the underwriters) and the selling stockholders sold 3,940,133 of our common stock. The price of the shares sold in the offering was $10.00 per share. After deducting underwriting discounts, commissions and estimated offering expenses payable by us, the aggregate net proceeds received by us totaled approximately $87.7 million. We did not receive any proceeds from the sales of shares by the selling stockholders.
On March 24, 2011, prior to the effective time of the IPO, we converted from a limited liability company into a Delaware corporation and changed our name from ServiceSource International, LLC to ServiceSource International, Inc. In conjunction with the conversion, all of our outstanding common shares automatically converted into shares of our common stock.
On August 3, 2011, we closed a secondary public offering of 10,350,000 shares of our common stock, which included 1,372,061 shares of common stock sold by us (inclusive of 1,350,000 shares of common stock from the full exercise of the over-allotment option granted to the underwriters) and 8,977,939 shares of common stock sold by the selling stockholders. The price of the shares sold in the offering was $17.50 per share. The total gross proceeds from the follow-on offering to us were $24.0 million. After deducting underwriting discounts, commissions and estimated offering expenses payable by us, the aggregate net proceeds received by us totaled approximately $23.0 million. We did not receive any proceeds from the sales of shares by the selling stockholders (other than approximately $2.9 million in additional cash received from the exercise of stock options by certain of the selling stockholders).
Key Business Metrics
In assessing the performance of our business, we consider a variety of business metrics in addition to the financial metrics discussed below under “—Basis of Presentation.” These key metrics include service revenue opportunity under management and number of engagements.
Service Revenue Opportunity Under Management. At December 31, 2011, we estimated our opportunity under management to be over $7 billion. Service revenue opportunity under management (“opportunity under management”) is a forward-looking metric and is our estimate, as of a given date, of the value of all end customer service contracts that we will have the opportunity to sell on behalf of our customers over the subsequent twelve-month period. Opportunity under management is not a measure of our expected revenue. In addition, opportunity under management reflects our estimate for a forward twelve-month period and should not be used to estimate our opportunity for any particular quarter within that period. The value of end customer contracts actually delivered during a twelve-month period should not be expected to occur in even quarterly increments due to seasonality and other factors impacting our customers and their end customers.
We estimate the value of such end customer contracts based on a combination of factors, including the value of end customer contracts made available to us by customers in past periods, the minimum value of end customer contracts that our customers are required to give us the opportunity to sell pursuant to the terms of their contracts with us, periodic internal business reviews of our expectations as to the value of end customer contracts that will be made available to us by customers, the value of end customer contracts included in the SPA and collaborative discussions with our customers assessing their expectations as to the value of service contracts that they will make available to us for sale. While the minimum value of end customer contracts that our customers are
35
Table of Contents
required to give us represents a portion of our estimated opportunity under management, a significant portion of the opportunity under management is estimated based on the other factors described above. As our experience with our business, our customers and their contracts has grown, we have continually refined the process, improved the assumptions and expanded the data related to our calculation of opportunity under management.
When estimating service revenue opportunity under management, we must, to a large degree, rely on the assumptions described above, which may prove incorrect. These assumptions are inherently subject to significant business and economic uncertainties and contingencies, many of which are beyond our control. Our estimates therefore may prove inaccurate, causing the actual value of end customer contracts delivered to us in a given twelve-month period to differ from our estimate of opportunity under management. These factors include:
| • | the extent to which customers deliver a greater or lesser value of end customer contracts than may be required or otherwise expected; |
| • | roll-overs of unsold service contract renewals from prior periods to the current period or future periods; |
| • | changes in the pricing or terms of service contracts offered by our customers; |
| • | increases or decreases in the end customer base of our customers; |
| • | the extent to which the renewal rates we achieve on behalf of a customer early in an engagement affect the amount of opportunity that the customer makes available to us later in the engagement; |
| • | customer cancellations of their contracts with us; and |
| • | changes in our customers’ businesses, sales organizations, sales processes or priorities. |
Our revenue also depends upon our close rates and commissions. Our close rate is the percentage of our opportunity under management that we renew on behalf of our customers. Our commission rate is an agreed-upon percentage of the renewal value of end customer contracts that we sell on behalf of our customers.
Our close rate is impacted principally by our ability to successfully sell service contracts on behalf of our customers. Other factors impacting our close rate include: the manner in which our customers price their service contracts for sale to their end customers; the stage of life-cycle associated with the products and underlying technologies covered by the service contracts offered to the end customer; the extent to which our customers or their competitors introduce new products or underlying technologies; the nature, size and age of the service contracts; and the extent to which we have managed the renewals process for similar products and underlying technologies in the past.
In determining commission rates for an individual engagement, various factors, including our close rates, as described above, are evaluated. These factors include: historical, industry-specific and customer-specific renewal rates for similar service contracts; the magnitude of the opportunity under management in a particular engagement; the number of end customers associated with these opportunities; and the opportunity to receive additional performance commissions when we exceed certain renewal levels. We endeavor to set our commission rates at levels commensurate with these factors and other factors that may be relevant to a particular engagement. Accordingly, our commission rates vary, often significantly, from engagement to engagement. In addition, we sometimes agree to lower commission rates for engagements with significant opportunity under management.
Number of Engagements. We track the number of engagements we have with our customers. We often have multiple engagements with a single customer, particularly where we manage the sales of service renewals relating to different product lines, technologies, types of contracts or geographies for the customer. When the set
36
Table of Contents
of renewals we manage on behalf of a customer is associated with a separate customer contract or a distinct product set, type of end customer contract or geography and therefore requires us to assign a dedicated service sales team to manage the renewals, we designate the set of renewals, and associated revenues and costs to us as a unique engagement. For example, we may have one engagement consisting of a dedicated service sales team selling maintenance contract renewals of a particular product for a customer in the United States and another engagement consisting of a dedicated sales team selling warranty contract renewals of a different product for the same customer in Europe. These would count as two engagements. We had approximately 120, 100 and 80 engagements as of December 31, 2011, 2010 and 2009, respectively.
Factors Affecting our Performance
Sales Cycle. We sell our integrated solution through our sales organization. At the beginning of the sales process, our quota-carrying sales representatives contact prospective customers and educate them about our offerings. Educating prospective customers about the benefits of our solution can take time, as many of these prospects have not historically relied upon integrated solutions like ours for service revenue management, nor have they typically put out a formal request for proposal or otherwise made a decision to focus on this area. As part of the education process, we utilize our solutions design team to perform the SPA of our prospect’s service revenue. The SPA includes an analysis of best practices and benchmarks the prospect’s service revenue against industry peers. Through the SPA process, which typically takes several weeks, we are able to assess the characteristics and size of the prospect’s service revenue, identify potential areas of performance improvement, and formulate our proposal for managing the prospect’s service revenue. The length of our sales cycle for a new customer, inclusive of the SPA process and measured from our first formal discussion with the customer until execution of a new customer contract, is typically longer than six months.
We generally contract with new customers to manage a specified portion of their service revenue opportunity, such as the opportunity associated with a particular product line or technology, contract type or geography. We negotiate the customized terms of our customer contracts, including commission rates, based on the output of the SPA, including the areas identified for improvement. Once we demonstrate success to a customer with respect to the opportunity under contract, we seek to expand the scope of our engagement to include other opportunities with the customer. For some customers, we manage all or substantially all of their service contract renewals.
Implementation Cycle. After entering into an engagement with a new customer, and to a lesser extent after adding an engagement with an existing customer, we incur sales and marketing expenses related to the commissions owed to our sales personnel. The commissions are based on the estimated total contract value, a material portion of which is expensed upfront and the remaining portion of which is expensed over a period of eight to fourteen months, including commissions paid on multi-year contracts. We also make upfront investments in technology and personnel to support the engagement. These expenses are typically incurred one to three months before we begin generating sales and recognizing revenue. Accordingly, in a given quarter, an increase in new customers, and, to a lesser extent, an increase in engagements with existing customers, or a significant increase in the contract value associated with such new customers and engagements, will negatively impact our gross margin and operating margins until we begin to achieve anticipated sales levels associated with the new engagements.
Although we expect new customer engagements to contribute to our operating profitability over time, in the initial periods of a customer relationship, the near term impact on our profitability can be negative due to upfront costs we incur, the lower initial level of associated service sales team productivity and lack of mature data and technology integration with the customer. As a result, an increase in the mix of new customers as a percentage of total customers may initially have a negative impact on our operating results. Similarly, a decline in the ratio of new customers to total customers may positively impact our operating results.
Although we believe the estimates and assumptions we used to estimate the expenses are reasonable, the estimated expenses and resulting direct contribution margin could vary significantly from the amounts disclosed above had we used different estimates and assumptions. Moreover, we cannot assure you that we will experience
37
Table of Contents
similar contribution margins from customers added in other years or in future periods. You should not rely on the estimated expenses or direct contribution margin as being indicative of our future performance. Because of our growing customer base, we expect that there will be times when large numbers of our customers are in the initial phases of their relationship with us or have a material expansion of their existing engagements with us. In these scenarios, our operating results will be negatively impacted over the near term. We expect, for example, that our recent addition of significant new customers, and expansion of certain existing customer relationships, will continue to impact our margins in 2012.
Contract Terms. Substantially all of our revenue comes from pay-for-performance model. Under our pay-for-performance model, we earn commissions based on the value of service contracts we sell on behalf of our customers. In some cases, we earn additional performance-based commissions for exceeding pre-determined service renewal targets.
Since 2009, our new customer contracts have typically had a term of approximately 36 months, although we sometimes have contract terms of up to 60 months. Our contracts generally require our customers to deliver a minimum value of qualifying service revenue contracts for us to renew on their behalf during a specified period. To the extent that our customers do not meet their minimum contractual commitments over a specified period, they may be subject to fees for the shortfall. Our customer contracts are cancelable on relatively short notice, subject in most cases to the payment of an early termination fee by the customer. The amount of this fee is based on the length of the remaining term and value of the contract.
We invoice our customers on a monthly basis based on commissions we earn during the prior month, and with respect to performance-based commissions, on a quarterly basis based on our overall performance during the prior quarter. Amounts invoiced to our customers are recognized as revenue in the period in which our services are performed or, in the case of performance commissions, when the performance condition is determinable. Because the invoicing for our services generally coincides with or immediately follows the sale of service contracts on behalf of our customers, we do not generate or report a significant deferred revenue balance. However, the combination of minimum contractual commitments, combined with our success in generating improved renewal rates for our customers, and our customers’ historical renewal rates, provides us with revenue visibility. In addition, the performance improvement potential identified by our SPA process provides us with revenue visibility for new customers.
M&A Activity. Our customers, particularly those in the technology sector, participate in an active environment for mergers and acquisitions. Large technology companies have maintained active acquisition programs to increase the breadth and depth of their product and service offerings and small and mid-sized companies have combined to better compete with large technology companies. A number of our customers have merged, purchased other companies or been acquired by other companies. We expect merger and acquisition activity to continue to occur in the future.
The impact of these transactions on our business can vary. Acquisitions of other companies by our customers can provide us with the opportunity to pursue additional business to the extent the acquired company is not already one of our customers. Similarly, when a customer is acquired, we may be able to use our relationship with the acquired company to build a relationship with the acquirer. In some cases we have been able to maintain our relationship with an acquired customer even where the acquiring company handles its other service contract renewals through internal resources. In other cases, however, acquirers have elected to terminate or not renew our contract with the acquired company. For example, Oracle terminated our contracts with Sun Microsystems effective as of September 30, 2010, as discussed in more detail under “Results of Operations—Years Ended December 31, 2010 and 2009—Net Revenue,” and had previously terminated our contract with another customer, BEA Systems, in April 2008.
Economic Conditions. An improving economic outlook generally has a positive, but mixed, impact on our business. As with most businesses, improved economic conditions can lead to increased end customer demand
38
Table of Contents
and sales. In particular, within the technology sector, we believe that the recent economic downturn led many companies to cut their expenses by choosing to let their existing maintenance, support and subscription agreements lapse. An improving economy may have the converse effect.
However, an improving economy may also cause companies to purchase new hardware, software and other technology products, which we generally do not sell on behalf of our customers, instead of purchasing maintenance, support and subscription services for existing products. To the extent this occurs, it would have a negative impact on our opportunities in the near term that would partially offset the benefits of an improving economy.
Adoption of “Software-as-a-Service” Solutions. Within the software industry, there is a growing trend toward providing software to customers using a software-as-a-service model. Under this model, software-as-a-service companies provide access to software applications to customers on a remote basis, and provide their customers with a subscription to use the software, rather than licensing software to their customers. Software-as-a-service companies face a distinct set of challenges with respect to customer renewals, given the potentially lower switching costs for customers utilizing their solutions, and are more reliant on renewals for their long-term revenues than traditional software companies. Given the strategic importance of renewals to their model, software-as-a-service companies may be less inclined than traditional software companies to rely on third-party solutions such as ours to manage the sale of renewals of subscription contracts. We have tailored our solution to address the needs of software-as-a-service companies in this area and expect to continue to develop and enhance our solution as this market grows.
Basis of Presentation
Net Revenue
Substantially all of our net revenue is attributable to commissions we earn from the sale of renewals of maintenance, support and subscription agreements on behalf of our customers. We generally invoice our customers for our services in arrears on a monthly basis for sales commissions, and on a quarterly basis for certain performance sales commissions; accordingly, we typically have no deferred revenue related to these services. We do not set the price, terms or scope of services in the service contracts with end customers and do not have any obligations related to the underlying service contracts between our customers and their end customers.
For a limited number of historical engagements, our services included the sale of service contracts as well as the related invoicing and cash collections on behalf of customers. Under these arrangements, commissions are considered earned when we receive cash payment from end customers. As of December 31, 2010, we no longer had any such customer engagements.
We also earn revenue from the sale of subscriptions to our cloud based applications. To date, subscription revenue has been insignificant. Subscription fees are accounted for separately from commissions and they are billed on either a monthly or quarterly basis in advance and revenue is recognized ratably over the related subscription term.
We have generated a significant portion of our revenue from a limited number of customers. For the years ended December 31, 2011, 2010 and 2009, our top ten customers in each period accounted for 47%, 54%, and 65%, of our net revenue, respectively. One customer accounted for over 10% of our revenues in 2011. In addition, during the same periods, Sun Microsystems accounted for 1%, 13% and 24%, of our net revenue, respectively. As discussed elsewhere in this Annual Report on Form 10-K, Oracle terminated our contracts with Sun Microsystems effective as of September 30, 2010. In connection with a settlement agreement with Oracle dated February 28, 2011, we recognized net revenue of approximately $1.8 million in the first quarter of 2011 from Sun Microsystems from fees associated with the transition of remaining active end user contracts to Oracle, the termination of the related account management services and as a result of our net final payment to Oracle being less than estimated as of December 31, 2010.
39
Table of Contents
Our business is geographically diversified. During 2011, 62% of our net revenue was earned in North America and Latin America (“NALA”), 28% in Europe, Middle East and Africa (“EMEA”) and 10% in Asia Pacific-Japan (“APJ”). Net revenue for a particular geography generally reflects commissions earned from sales of service contracts managed from our sales centers in that geography. Predominantly all of the service contracts sold and managed by our sales centers relate to end customers located in the same geography.
Cost of Revenue and Gross Profit
Our cost of revenue expenses include compensation, technology costs, including those related to the delivery of our cloud-based solutions, and allocated overhead costs. Compensation includes salary, bonus, benefits and stock-based compensation for our dedicated service sales teams. Our allocated overhead includes costs for facilities, information technology and depreciation, including amortization of internal-use software associated with our service revenue technology platform and cloud applications. Allocated costs for facilities consist of rent, maintenance and compensation of personnel in our facilities departments. Our allocated costs for information technology include costs associated with a third-party data center where we maintain our data servers, compensation of our information technology personnel and the cost of support and maintenance contracts associated with computer hardware and software. Our overhead costs are allocated to all departments based on headcount. To the extent our customer base or opportunity under management expands, we may need to hire additional service sales personnel and invest in infrastructure to support such growth. We currently expect that our cost of revenue will fluctuate significantly and may increase on an absolute basis and as a percentage of revenue in the near term, including for the reasons discussed above under “—Factors Affecting Our Performance—Implementation Cycle.”
Operating Expenses
Sales and Marketing. Sales and marketing expenses are the largest component of our operating expenses and consist primarily of compensation and sales commissions for our sales and marketing staff, allocated expenses and marketing programs and events. We sell our solutions through our global sales organization, which is organized across three geographic regions: NALA, EMEA and APJ. Our commission plans provide that payment of commissions to our sales representatives is contingent on their continued employment, and we recognize expense over a period that is generally between twelve and fourteen months following the execution of the applicable contract. We currently expect sales and marketing expense to increase on an absolute basis and as a percentage of revenue in the near term based on commissions earned on customer contracts entered into in prior periods, as well as continued investments in sales and marketing personnel and programs as we expand our business domestically and internationally.
Research and Development. Research and development expenses consist primarily of compensation, allocated costs and the cost of third-party service providers. We focus our research and development efforts on developing new products and adding new features to our existing technology platform. In addition, we capitalize certain expenditures related to the development and enhancement of internal-use software related to our technology platform. We expect research and development spending, and the related expenses and capitalized costs, to increase on an absolute basis as a percentage of revenue in the near term as we continue to invest in our next-generation technology platform and cloud applications.
General and Administrative. General and administrative expenses consist primarily of compensation for our executive, human resources, finance and legal functions, and related expenses for professional fees for accounting, tax and legal services, as well as allocated expenses. We expect that our general and administrative expenses will increase on an absolute basis and as a percentage of revenue in the near term as our operations continue to expand and as a result of incremental personnel, informational technology and other costs associated with being a publicly-traded company.
Amortization of Intangible Assets. Our intangible assets consist of goodwill, customer contracts and related relationships, trademarks and trade names and a non-competition agreement. Except for goodwill, which is not amortized, all of our intangible assets were fully amortized as of March 31, 2009.
40
Table of Contents
Other Income (Expense)
Other income (expense) consists primarily of interest expense associated with borrowings under our credit facility and foreign exchange transaction gains and losses, partially offset by interest income.
Income Tax (Benefit) Provision
Prior to March 1, 2011, we conducted our U.S. operations through ServiceSource International, LLC (the “LLC”), a pass-through entity for tax purposes that filed its income tax return as a partnership for federal and state income tax purposes, and through LLC’s wholly-owned U.S. taxable subsidiary. Effective March 1, 2011, the LLC elected to be taxable as a corporation for U.S. Federal and State tax purposes. Accordingly, ServiceSource International, Inc., formerly the LLC, is subject to normal U.S. corporation income taxes beginning March 1, 2011. We also have several subsidiaries formed in foreign jurisdictions which are subject to local income taxes.
For a description of our accounting practices relating to income taxes, see “—Critical Accounting Policies and Estimates—Income Taxes” below.
Results of Operations
The table below sets forth our consolidated results of operations for the periods presented. The period-to-period comparison of financial results presented below is not necessarily indicative of financial results to be achieved in future periods.
| Years Ended December 31, | ||||||||||||
| 2011 | 2010 | 2009 | ||||||||||
| (in thousands) | ||||||||||||
| Consolidated statement of operations data: |
||||||||||||
| Net revenue |
$ | 205,501 | $ | 152,935 | $ | 110,676 | ||||||
| Cost of revenue |
113,406 | 90,048 | 58,877 | |||||||||
|
|
|
|
|
|
|
|||||||
| Gross profit |
92,095 | 62,887 | 51,799 | |||||||||
|
|
|
|
|
|
|
|||||||
| Operating expenses: |
||||||||||||
| Sales and marketing |
48,520 | 35,119 | 23,182 | |||||||||
| Research and development |
13,073 | 7,188 | 2,054 | |||||||||
| General and administrative |
33,647 | 19,378 | 13,777 | |||||||||
| Amortization of intangible assets |
— | — | 68 | |||||||||
|
|
|
|
|
|
|
|||||||
| Total operating expenses |
95,240 | 61,685 | 39,081 | |||||||||
|
|
|
|
|
|
|
|||||||
| Income (loss) from operations |
(3,145 | ) | 1,202 | 12,718 | ||||||||
| Other expense, net |
(1,127 | ) | (1,622 | ) | (477 | ) | ||||||
|
|
|
|
|
|
|
|||||||
| Income (loss) before provision for (benefit from) income taxes |
(4,272 | ) | (420 | ) | 12,241 | |||||||
| Income tax provision (benefit) |
(19,383 | ) | 2,147 | 1,866 | ||||||||
|
|
|
|
|
|
|
|||||||
| Net income (loss) |
$ | 15,111 | $ | (2,567 | ) | $ | 10,375 | |||||
|
|
|
|
|
|
|
|||||||
| Includes stock-based compensation of: |
||||||||||||
| Cost of revenue |
$ | 1,877 | $ | 1,126 | $ | 914 | ||||||
| Sales and marketing |
4,456 | 2,993 | 2,340 | |||||||||
| Research and development |
1,167 | 803 | 541 | |||||||||
| General and administrative |
4,099 | 3,167 | 2,265 | |||||||||
|
|
|
|
|
|
|
|||||||
| Total |
$ | 11,599 | $ | 8,089 | $ | 6,060 | ||||||
|
|
|
|
|
|
|
|||||||
41
Table of Contents
The following table sets forth our operating results as a percentage of net revenue:
| Years Ended December 31, | ||||||||||||
| 2011 | 2010 | 2009 | ||||||||||
| (as a % of net revenue) | ||||||||||||
| Net revenue |
100 | % | 100 | % | 100 | % | ||||||
| Cost of revenue |
55 | % | 59 | % | 53 | % | ||||||
|
|
|
|
|
|
|
|||||||
| Gross profit |
45 | % | 41 | % | 47 | % | ||||||
|
|
|
|
|
|
|
|||||||
| Operating expenses: |
||||||||||||
| Sales and marketing |
24 | % | 23 | % | 21 | % | ||||||
| Research and development |
6 | % | 5 | % | 2 | % | ||||||
| General and administrative |
16 | % | 12 | % | 12 | % | ||||||
| Amortization of intangible assets |
0 | % | 0 | % | 0 | % | ||||||
|
|
|
|
|
|
|
|||||||
| Total operating expenses |
46 | % | 40 | % | 35 | % | ||||||
|
|
|
|
|
|
|
|||||||
| Income (loss) from operations |
(2 | )% | 1 | % | 12 | % | ||||||
|
|
|
|
|
|
|
|||||||
Years Ended—December 31, 2011 and 2010
Net Revenue
| Years Ended December 31, | ||||||||||||||||||||||||
| 2011 | 2010 | |||||||||||||||||||||||
| Amount | % of Net Revenue |
Amount | % of Net Revenue |
Change | % Change |
|||||||||||||||||||
| (in thousands) | ||||||||||||||||||||||||
| Net revenue by geography: |
||||||||||||||||||||||||
| NALA |
$ | 127,430 | 62 | % | $ | 102,411 | 67 | % | $ | 25,019 | 24 | % | ||||||||||||
| EMEA |
58,344 | 28 | % | 43,069 | 28 | % | 15,275 | 35 | % | |||||||||||||||
| APJ |
19,727 | 10 | % | 7,455 | 5 | % | 12,272 | 165 | % | |||||||||||||||
|
|
|
|
|
|
|
|
|
|
|
|||||||||||||||
| Total net revenue |
$ | 205,501 | 100 | % | $ | 152,935 | 100 | % | $ | 52,566 | 34 | % | ||||||||||||
|
|
|
|
|
|
|
|
|
|
|
|||||||||||||||
The 34% increase in net revenue in 2011 reflects an increase in the number of engagements and the value of service contracts sold on behalf of our customers. The number of customer engagements increased from approximately 100 as of December 31, 2010 to over 120 as of December 31, 2011. International revenue increased 55% during 2011 as compared to 2010 with this growth supported by strong performance in our foreign service sales centers around the world in closing service revenue renewals reflecting the strong demand we see for our solution internationally.
Cost of Revenue and Gross Profit
| Years Ended December 31, |
% | |||||||||||||||
| 2011 | 2010 | Change | Change | |||||||||||||
| (in thousands) | ||||||||||||||||
| Cost of revenue |
$ | 113,406 | $ | 90,048 | $ | 23,358 | 26 | % | ||||||||
| Includes stock-based compensation of: |
1,877 | 1,126 | 751 | 67 | % | |||||||||||
| Gross profit |
92,095 | 62,887 | 29,208 | 46 | % | |||||||||||
| Gross profit percentage |
45 | % | 41 | % | 4 | % | ||||||||||
The 26% increase in our cost of revenue in 2011 reflected an increase in the number of service sales personnel, primarily in APJ, resulting in a $18.1 million increase in compensation, a $2.9 million increase in allocated costs for facilities, including incremental facility costs related to an expansion of an existing facility,
42
Table of Contents
and greater allocations for information technology and depreciation and a $2.1 million increase in temporary labor to ramp up our new engagements. The improvement in our gross profit was driven primarily by the improved revenue performance we saw across all of our service sales centers in 2011 and increasing use of our applications to drive automation and operating scale across the company as well as the ramp of new engagements. Gross margins for 2011 and 2010 were favorably impacted by one-time events including $1.8 million in settlement fees and $3.8 million in contract termination fees, respectively, both of which had no direct costs.
Operating Expenses
| Years Ended December 31, | ||||||||||||||||||||||||
| 2011 | 2010 | |||||||||||||||||||||||
| Amount | % of Net Revenue |
Amount | % of Net Revenue |
Change | % Change |
|||||||||||||||||||
| (in thousands) | ||||||||||||||||||||||||
| Operating expenses: |
||||||||||||||||||||||||
| Sales and marketing |
$ | 48,520 | 24 | % | $ | 35,119 | 23 | % | $ | 13,401 | 38 | % | ||||||||||||
| Research and development |
13,073 | 6 | % | 7,188 | 5 | % | 5,885 | 82 | % | |||||||||||||||
| General and administrative |
33,647 | 16 | % | 19,378 | 12 | % | 14,269 | 74 | % | |||||||||||||||
|
|
|
|
|
|
|
|
|
|
|
|||||||||||||||
| Total operating expenses |
$ | 95,240 | 46 | % | $ | 61,685 | 40 | % | $ | 33,555 | 54 | % | ||||||||||||
|
|
|
|
|
|
|
|
|
|
|
|||||||||||||||
| Includes stock-based compensation of: |
||||||||||||||||||||||||
| Sales and marketing |
$ | 4,456 | $ | 2,993 | $ | 1,463 | ||||||||||||||||||
| Research and development |
1,167 | 803 | 364 | |||||||||||||||||||||
| General and administrative |
4,099 | 3,167 | 932 | |||||||||||||||||||||
|
|
|
|
|
|
|
|||||||||||||||||||
| Total |
$ | 9,722 | $ | 6,963 | $ | 2,759 | ||||||||||||||||||
|
|
|
|
|
|
|
|||||||||||||||||||
Sales and marketing expenses
The 38% increase in sales and marketing expenses in 2012 reflected an increase in the number of sales and marketing personnel, primarily in APJ and EMEA, resulting in a $6.7 million increase in compensation. The increase also resulted from a $3.3 million increase in marketing and consulting expenses as a result of additional investments in brand development to heighten awareness and to maximize the strength of our brand and an increase in allocations for facilities and IT of $1.5 million.
Research and development expenses
The increase in research and development expense in 2011 reflected an increase in the number of research and development personnel in NALA, resulting in a $4.5 million increase in compensation, a $1.8 million increase in outside consulting services related to contract research and development services and a $1.4 million increase in allocated costs. The increase is a result of our continued investment in the development of additional cloud based applications to enable greater operational efficiencies and enhanced functionality for our customers. The increase was partially offset by capitalization of $5.6 million of internal labor and third party costs for development of internal-use software in 2011 compared to $3.8 million of capitalized costs in 2010.
General and administrative expenses
The 74% increase in general and administrative expense in 2011 reflected a $10.3 million increase in compensation due to an increase in headcount in the general and administrative functions across all geographic segments and a $2.2 million increase in professional fees related to expenses incurred in connection with our initial public offering and follow-on offering and incremental fees related to being a public company.
43
Table of Contents
Other Expense, Net
| Years Ended December 31, | ||||||||||||||||||||||||
| 2011 | 2010 | |||||||||||||||||||||||
| Amount | % of Net Revenue |
Amount | % of Net Revenue |
Change | % Change |
|||||||||||||||||||
| (in thousands) | ||||||||||||||||||||||||
| Other expense, net |
$ | 1,127 | 1 | % | $ | 1,622 | 1 | % | $ | (495 | ) | (31 | )% | |||||||||||
The decrease in other expense in 2011 compared to 2010 resulted from a $0.7 million decrease in interest expense in 2011 due to the retirement of our term loan in March 2011, partially offset by a net increase in losses on foreign exchange transactions primarily in APJ, combined with the strengthening of the US dollar.
Income Tax Provision
| Years Ended December 31, | % | |||||||||||||||
| 2011 | 2010 | Change | Change | |||||||||||||
| (in thousands) | ||||||||||||||||
| Income tax (benefit) provision |
$ | (19,383 | ) | $ | 2,147 | $ | (21,530 | ) | * | |||||||
| * | Not meaningful. |
In 2011, we recorded a one-time non-cash tax benefit of $20.7 million as a result of recognition of deferred tax assets resulting from our election to be subject to taxation as a corporation. The computation of the effective tax rate does not include losses incurred prior to March 1, 2011 when we became subject to taxation as a corporation. Pretax earnings for 2011, excluding LLC losses incurred prior to March 1, 2011, were approximately $50,000, which would result in an effective tax rate that is not meaningful for comparison purposes. The Company would have recognized a larger tax benefit in 2011, but for projected losses in a foreign subsidiary for which no tax benefit was recognized, and nondeductible IPO and secondary offering expenses incurred.
Years Ended—December 31, 2010 and 2009
Net Revenue
| Years Ended December 31, | ||||||||||||||||||||||||
| 2010 | 2009 | |||||||||||||||||||||||
| Amount | % of Net Revenue |
Amount | % of Net Revenue |
Change | % Change |
|||||||||||||||||||
| (in thousands) | ||||||||||||||||||||||||
| Net revenue by geography: |
||||||||||||||||||||||||
| NALA |
$ | 102,411 | 67 | % | $ | 77,283 | 70 | % | $ | 25,128 | 33 | % | ||||||||||||
| EMEA |
43,069 | 28 | % | 31,995 | 29 | % | 11,074 | 35 | % | |||||||||||||||
| APJ |
7,455 | 5 | % | 1,398 | 1 | % | 6,057 | * | ||||||||||||||||
|
|
|
|
|
|
|
|
|
|
|
|||||||||||||||
| Total net revenue |
$ | 152,935 | 100 | % | $ | 110,676 | 100 | % | $ | 42,259 | 38 | % | ||||||||||||
|
|
|
|
|
|
|
|
|
|
|
|||||||||||||||
| * | Not meaningful. |
The 38% increase in net revenue in 2010 reflects an increase in the number of engagements and the value of service contracts sold on behalf of our customers. The actual value of qualified end customer contracts available for us to sell increased from $2.8 billion in 2009 to $3.7 billion in 2010. The number of customer engagements increased from approximately 80 as of December 31, 2009 to over 100 as of December 31, 2010. The $42.3 million increase in our 2010 net revenue as compared to 2009 reflected a $19.7 million net increase in
44
Table of Contents
revenues from pre-2009 engagements; a $22.8 million increase in revenues resulting from the ramp of new engagements entered into in 2009; a $6.5 million increase in revenues from new engagements entered into in 2010; and a $6.7 million decrease in revenues from our largest customer in both 2009 and 2010, Sun Microsystems. Sun Microsystems represented $26.3 million and $19.6 million of our net revenue in 2009 and 2010, respectively. Revenue from Sun Microsystems decreased following its acquisition by Oracle in the first quarter of 2010. Net revenue in 2010 included $3.8 million in fees resulting from the termination of the Sun Microsystems contracts. When expressed as a percentage of net revenue, revenue from Sun Microsystems decreased from 24% in 2009 to 13% in 2010, which reflects the offset of revenue growth from both new and existing engagements with other customers. International revenue increased 51% during 2010 as compared to 2009 with this growth supported by the addition of new service sales centers in APJ and EMEA.
Cost of Revenue and Gross Profit
| Years Ended December 31, |
% | |||||||||||||||
| 2010 | 2009 | Change | Change | |||||||||||||
| (in thousands) | ||||||||||||||||
| Cost of revenue |
$ | 90,048 | $ | 58,877 | $ | 31,171 | 53 | % | ||||||||
| Includes stock-based compensation of: |
1,126 | 914 | 212 | 23 | % | |||||||||||
| Gross profit |
62,887 | 51,799 | 11,088 | 21 | % | |||||||||||
| Gross profit percentage |
41 | % | 47 | % | (6 | )% | ||||||||||
The 53% increase in our cost of revenue in 2010 reflected an increase in the number of service sales personnel, primarily in NALA and APJ, resulting in a $22.9 million increase in compensation, a $4.3 million increase in allocated costs for facilities (due to opening of new offices in EMEA and APJ), and information technology and depreciation and a $1.4 million increase in outside fees primarily due to the recruitment of service sales personnel. Gross profit percentage decreased from 47% in 2009 to 41% in 2010. The decrease in gross profit percentage reflects additional compensation associated with staffing new and expanded engagements which typically have minimal revenue during the initial start-up phase and facility costs associated with the opening of two new international sales centers, partially offset by the favorable gross margin impact resulting from the Sun Microsystems termination fees.
Operating Expenses
| Years Ended December 31, | ||||||||||||||||||||||||
| 2010 | 2009 | |||||||||||||||||||||||
| Amount | % of Net Revenue |
Amount | % of Net Revenue |
Change | % Change |
|||||||||||||||||||
| (in thousands) | ||||||||||||||||||||||||
| Operating expenses: |
||||||||||||||||||||||||
| Sales and marketing |
$ | 35,119 | 23 | % | $ | 23,182 | 21 | % | $ | 11,937 | 51 | % | ||||||||||||
| Research and development |
7,188 | 5 | % | 2,054 | 2 | % | 5,134 | * | ||||||||||||||||
| General and administrative |
19,378 | 12 | % | 13,777 | 12 | % | 5,601 | 41 | % | |||||||||||||||
| Amortization of intangible assets |
— | 0 | % | 68 | 0 | % | (68 | ) | (100 | )% | ||||||||||||||
|
|
|
|
|
|
|
|
|
|
|
|||||||||||||||
| Total operating expenses |
$ | 61,685 | 40 | % | $ | 39,081 | 35 | % | $ | 22,604 | 58 | % | ||||||||||||
|
|
|
|
|
|
|
|
|
|
|
|||||||||||||||
| Includes stock-based compensation of: |
||||||||||||||||||||||||
| Sales and marketing |
$ | 2,993 | $ | 2,340 | $ | 653 | ||||||||||||||||||
| Research and development |
803 | 541 | 262 | |||||||||||||||||||||
| General and administrative |
3,167 | 2,265 | 902 | |||||||||||||||||||||
|
|
|
|
|
|
|
|||||||||||||||||||
| Total |
$ | 6,963 | $ | 5,146 | $ | 1,817 | ||||||||||||||||||
|
|
|
|
|
|
|
|||||||||||||||||||
| * | Not meaningful. |
45
Table of Contents
Sales and marketing expenses
The 51% increase in sales and marketing expenses in 2010 reflected an increase in the number of sales and marketing personnel, primarily in NALA and APJ, and higher sales commissions for new multi-year customer engagements, resulting in a $7.9 million increase in compensation. The increase also resulted from a $0.9 million increase in expenses due to marketing programs, a $0.9 million increase in allocated costs and a $0.8 million increase in outside fees primarily due to the recruitment of sales and marketing personnel. The increase in headcount reflected our investment in sales and marketing resources aimed at expanding our customer base.
Research and development expenses
The increase in research and development expense in 2010 reflected an increase in the number of research and development personnel in NALA, resulting in a $2.3 million increase in compensation, a $2.2 million increase in outside consulting services related to contract research and development services and a $0.3 million increase in allocated costs. The increase is a result of our continued investment in the development of additional cloud based applications to enable greater operational efficiencies and enhanced functionality for our customers.
General and administrative expenses
The 41% increase in general and administrative expense in 2010 reflected a $2.8 million increase in compensation due to an increase in headcount in the general and administrative function, primarily in NALA, a $1.1 million increase in professional fees and a $0.4 million increase in outside consulting services.
Amortization of intangible assets
The decrease in amortization of intangible assets is a result of the related assets being fully amortized as of March 31, 2009.
Other Expense, Net
| Years Ended December 31, | ||||||||||||||||||||||||
| 2010 | 2009 | |||||||||||||||||||||||
| Amount | % of Net Revenue |
Amount | % of Net Revenue |
Change | % Change |
|||||||||||||||||||
| (in thousands) | ||||||||||||||||||||||||
| Other expense, net |
$ | 1,622 | 1 | % | $ | 477 | 0 | % | $ | 1,145 | 240 | % | ||||||||||||
The increase in other expense in 2010 primarily resulted from a $0.8 million increase in losses on foreign exchange transactions due in part to a decline in the value of the U.S. dollar relative to international currencies, most notably the Canadian dollar. Also contributing to the year-over-year rise in other expense was a $0.1 million charge to reduce the carrying value of deferred debt issuance costs as a result of a modification of the term loan agreement, a $0.1 million increase in interest expense on our term loan as a result of higher interest rates and a $0.1 million increase in interest expense related to our capital lease obligations.
Income Tax Provision
| Years Ended December 31, | % | |||||||||||||||
| 2010 | 2009 | Change | Change | |||||||||||||
| (in thousands) | ||||||||||||||||
| Income tax provision |
$ | 2,147 | $ | 1,866 | $ | 281 | 15 | % | ||||||||
46
Table of Contents
Our effective tax rate in 2009 was 15% due to a portion of our income allocated to the non-taxable limited liability parent company and a taxable subsidiary subject to a lower tax rate. Because our income tax provision exceeded our consolidated pre-tax income in 2010, the effective tax rate for such period is not comparable to the prior period. In 2010, we had taxable income at our taxable subsidiaries and losses incurred by the non-taxable limited liability parent company that did not result in a tax benefit for us.
Liquidity and Capital Resources
At December 31, 2011, we had cash, cash equivalents and short-term investments of $108.9 million, which primarily consisted of money market mutual funds, municipal securities, commercial paper, and corporate bonds held by financial institutions. In addition we had a $20.0 million revolving credit facility. Our primary source of cash is receipts from revenue. The primary uses of cash are payroll-related expenses and general operating expenses including facilities, information technology, travel and marketing. Other sources of cash are proceeds from exercises of employee stock options and proceeds from our employee stock purchase plan (“ESPP”). Historically, we have financed our operations principally from cash provided by our operating activities and to a lesser extent from borrowings under various credit facilities. We believe our existing cash, cash equivalents and short-term investments and our currently available credit facility will be sufficient to meet our working capital and capital expenditure needs for at least the next twelve months.
Credit Facility
At December 31, 2011, we had a revolving credit facility which expires in February 2013 and provides borrowings of up to $20 million including amounts under letters of credit. Amounts outstanding on the facility at December 31, 2011 consisted of a letter of credit of $1.1 million as required under an operating lease agreement for office space. In February 2011 we entered into a New Facility which has a non-use fee of 0.50% per annum based on the average monthly available borrowing base. Borrowings on the facility, including amounts outstanding under letter of credit, bear interest at either: (i) the LIBOR Rate plus an additional margin; or (ii) the Base Rate (i.e., prime rate) plus an additional margin. At December 31, 2011 the interest rate for borrowings under the facility was 5.0 %.
The revolving credit facility provides us the option to terminate the facility at no cost; prior to February 25, 2012, we were subject to an early termination fee of $0.2 million.
The credit facility is collateralized by substantially all of our assets and has certain financial covenants which include a maximum consolidated leverage ratio and a minimum liquidity. At December 31, 2011 we were in compliance with our borrowing covenants.
The New Facility amended a previous credit arrangement wherein $15.5 million of term loans were converted to the new revolving credit facility which initially provided for maximum borrowings of up to $30 million. During the first quarter of 2011, an additional $7.9 million was drawn against the credit facility in connection with payments to Oracle in connection with the termination of our engagements with Sun Microsystems and to fund our operations. On March 30, 2011, net proceeds from our initial public offering were used to prepay $23.4 million borrowed under the credit facility. In April 2011, as provided for in the borrowing agreement, we elected to reduce the maximum borrowing under the facility to $20 million.
Summary Cash Flows
The following table sets forth a summary of our cash flows for the periods indicated:
| Years Ended December 31, | ||||||||||||
| 2011 | 2010 | 2009 | ||||||||||
| Net cash (used in) provided by operating activities |
$ | (11,231 | ) | $ | 22,630 | $ | 19,504 | |||||
| Net cash used in investing activities |
(57,542 | ) | (9,170 | ) | (7,476 | ) | ||||||
| Net cash provided by (used in) financing activities |
112,181 | (4,139 | ) | (2,379 | ) | |||||||
| Net increase in cash and cash equivalents, net of impact of exchange charges on cash |
$ | 43,331 | $ | 9,483 | $ | 9,389 | ||||||
47
Table of Contents
Operating Activities
In 2011, net cash used in operating activities were $11.2 million. Our net income during the period was $15.1 million which reflected a one-time non-cash tax benefit of $20.7 million as a result of recognition of deferred tax assets resulting from our election to be subject to taxation as a corporation. The net income was adjusted by non-cash charges of $9.4 million for depreciation and amortization and $11.6 million for stock-based compensation. Cash used for operations during 2011 principally resulted from $18.1 million in payments to Oracle/Sun and the related settlement of accrued payables owed to Oracle/Sun and amounts owed to us by Oracle/Sun. Additional uses of cash were related to a $1.4 million increase in prepaid expenses and other assets and a $5.0 million increase in accounts receivable. Sources of cash resulted from changes in our working capital, including a $6.9 million increase in accrued compensation and benefits, a $2.2 million increase in accounts payable, a $2.0 million increase in other accrued liabilities and a $1.8 million increase in accrued taxes.
In 2010, cash inflows from our operating activities were $22.6 million. Our net loss during the period was $2.6 million, adjusted by non-cash charges of $6.1 million for depreciation and amortization and $8.1 million for stock-based compensation. Additional sources of net cash inflows were from changes in our working capital, including a $23.6 million increase in accrued payables to customers, consisting of amounts owed to Oracle from end customers with respect to our Sun Microsystems engagements that terminated effective September 30, 2010, a $5.2 million increase in other accrued liabilities and a $3.9 million increase in accrued compensation and benefits, partially offset by a $21.2 million increase in accounts receivable.
In 2009, cash inflows from our operating activities of $19.5 million primarily resulted from our net income of $10.4 million, adjusted by non-cash charges of $6.1 million for stock-based compensation and $3.5 million for depreciation and amortization. The remainder of our sources of net cash inflows was from changes in our working capital, including a decrease in advances to customers of $3.6 million, an increase in other accrued liabilities of $2.5 million and an increase in accrued payables to customers of $2.5 million, partially offset by an increase in accounts receivable of $4.5 million and a decrease in accrued taxes of $1.9 million. The decrease in our advances to customers was due to the loss of a significant customer with whom this type of arrangement was agreed upon, hence fewer payments were due to customers before the receipt of the related amounts due from end customers. The increase in accrued payables to customers, which are reported net of our commissions, was due to an increase in the amounts of payments received from end customers which we had not yet remitted to our customers at year end. The increase in our accounts receivable reflects growth in our service revenue in the fourth quarter of 2009 as compared to the fourth quarter in 2008.
Investing Activities
In 2011 net cash used in investing activities was $57.5 million. During 2011, a portion of our proceeds from our public stock offering was used to purchase short-term investments. Our other investing activities consisted of purchases of property and equipment and costs related to capitalizing internal-use software. We expect to increase our purchases of property and equipment in future periods as we continue to invest in the infrastructure needed to operate our global service sales centers for an increasing customer and engagement base. In 2011, cash used in investing activities was principally for the purchases of short-term investments, net of sales and maturities, of $43.5 million and to a lesser extent, for purchase of property and equipment of $14.0 million, including costs capitalized for development of internal-use software.
In 2010 and 2009, net cash used in investing activities was $9.2 million and $7.5 million, respectively, and related to the purchase of property and equipment, including costs capitalized for the development of internal-use software.
Financing Activities
Cash provided by financing activities were $112.2 million during 2011 and comprised primarily of proceeds from our IPO, net of issuance costs, of $87.7 million and proceeds from our follow-on offering, net of issuance costs of $23.0 million. In addition we received proceeds of $15.0 million from the exercise of common stock
48
Table of Contents
options and the purchase of common stock under our employee stock purchase plan, partially offset by $16.3 million in net payments to payoff our term loan and for payment under capital lease obligations.
In 2010 and 2009, cash used in financing activities was $4.1 million and $2.4 million, respectively, primarily resulting from principal payments on our term loan. Additionally, during 2010 we had a $2.5 million cash distribution to our equity holders as required under our limited liability company agreement.
Off-Balance Sheet Arrangements
We do not have any relationships with other entities or financial partnerships, such as entities often referred to as structured finance or special-purpose entities, which have been established for the purpose of facilitating off-balance sheet arrangements or other contractually narrow or limited purposes.
Contractual Obligations and Commitments
Our principal commitments consist of obligations under operating leases for office space and computer equipment. At December 31, 2011, the future minimum payments under these commitments were as follows (in thousands):
| Total | Less than 1 year |
1-3 years | 3-5 years | More than 5 years |
||||||||||||||||
| Obligations under capital leases |
$ | 1,664 | $ | 706 | $ | 666 | $ | 154 | $ | 138 | ||||||||||
| Operating lease obligations |
33,639 | 7,745 | 15,374 | 6,696 | 3,824 | |||||||||||||||
|
|
|
|
|
|
|
|
|
|
|
|||||||||||
| $ | 35,303 | $ | 8,451 | $ | 16,040 | $ | 6,850 | $ | 3,962 | |||||||||||
|
|
|
|
|
|
|
|
|
|
|
|||||||||||
The contractual commitment amounts in the table above are associated with agreements that are enforceable and legally binding, which specify significant terms including payment terms, related services and the approximate timing of the transaction. Obligations under contracts that we can cancel without a significant penalty are not included in the table above.
Critical Accounting Policies and Estimates
Revenue Recognition
Substantially all of our revenue is generated from commissions earned from selling renewals of maintenance, support and subscription agreements on behalf of our customers. We recognize revenue when persuasive evidence of an arrangement exists, services have been provided, the sales price is fixed or determinable and collectibility is reasonably assured from our customer and no significant obligations remain unfulfilled. Customer contracts are generally used to determine the existence of an arrangement. Under the terms of our customer contracts, our service obligations are completed when end customer purchase orders are accepted by our customers. We assess whether our fee is fixed or determinable based on the payment terms with our customers and whether any part of our fee is subject to refund or adjustment. We assess collectibility based primarily on the creditworthiness of our customers determined primarily through financial analysis and an evaluation of the customer’s payment history with us.
Our revenue management services are limited to renewing contracts on behalf of our customers. Therefore, we have no other obligations or responsibilities to our customers after they accept purchase orders from their end customers. Moreover, we do not set the sales price, terms or scope of services contained in the service contracts we sell on behalf of our customers to their end customers. In addition, we are not a party to contracts between our customers and their end customers.
Some of our customer contracts include performance-based commissions that we earn for exceeding pre-determined performance targets, including the achievement of renewal rates in excess of specified targets. Our customer contracts also entitle us to fees and adjustments which are invoked in various circumstances,
49
Table of Contents
including the failure of our customers to provide us with a specified minimum value of service contracts or when contract renewal data is not provided to us in a timely fashion. Our contracts generally contain early termination fees. Revenue related to performance-based commissions, adjustments and early termination fees is recorded when the performance criteria have been met, or the triggering event has occurred and the amount earned is not subject to claw-back or future adjustment.
For multiple element arrangements, including deliverables such as sales of service contracts, account management services, subscriptions to our hosted technology platform and professional services, we separate each revenue stream at the inception of the arrangement on a relative fair-value basis, provided that each deliverable meets the criteria for treatment as a separate unit of accounting. An item is considered a separate unit of accounting if it has value to the customer on a stand-alone basis and there is objective and reliable fair value of the undelivered services. The fair value of the undelivered elements is determined by the price we charge when the element is sold separately, or in the cases where the item is not sold separately, by using other acceptable objective evidence.
Effective January 1, 2011, we adopted on a prospective basis an accounting standard issued by the Financial Accounting Standards Board (“FASB”) that changed the accounting for arrangements with multiple deliverables. The new standard requires that we allocate arrangement consideration at the inception of an arrangement to all of its deliverables based on their relative selling prices. When vendor specific objective evidence of selling price (VSOE) and third-party evidence of selling price (TPE) are not available for all deliverables, we use best estimated selling prices (BESP) in our allocation of arrangement consideration.
Revenue earned from sales of service contracts and account management services are contingent in nature because the fees we earn from these services are based on formulas stipulated in customer contracts based on our performance against the specific terms of each contract. Accordingly, we concluded that the updated accounting standard is not applicable to sales of service contracts on behalf of our customers. Therefore, sales of service contracts and account management services are excluded from the allocation of relative selling prices at the inception of our multiple-deliverable arrangements
We have a limited number of multiple-element arrangements where we are responsible for selling service contracts and providing subscriptions to our cloud applications and/or providing professional services. In these instances, our service sales revenue is recognized on a monthly basis as services are performed and all contingencies have been resolved, while subscription revenue is recognized ratably over the subscription term, generally one-to-three years, and professional services are recognized under proportional performance method or accepted by our customers, if applicable.
To date, professional services revenue and subscriptions earned from access to our cloud applications has been insignificant.
Under a limited number of historical customer engagements, we were responsible for selling service contracts and the related invoicing and cash collections from end customers. Under these arrangements, we collected the gross amount of payment due from end customers and remitted to our customers an amount equal to the gross billing less our sales commission and sales taxes or other indirect taxes invoiced to the end customers. Under these arrangements, revenue is recognized when the service has been delivered and the fee is fixed or determinable, which is upon receipt of cash payment from the end customer.
Stock-Based Compensation
We measure and recognize compensation expense for all stock-based payment made to employees and directors based on the grant date fair values of the awards. For stock–based awards with service-based vesting conditions, the fair value is estimated using the Black-Scholes option pricing model. The value of awards that are ultimately expected to vest is recognized as expense on a straight-line basis, net of estimated forfeitures, over the requisite service period. Stock-based compensation expenses are classified in the statements of operations based on the functional area to which the related recipients belong.
50
Table of Contents
The Black-Scholes option pricing model requires management to make assumptions and to apply judgment in determining the fair value of our awards. The most significant assumptions and judgments include estimating the fair value of our common stock, expected volatility of our common stock and estimated term between the grant date and settlement date, as discussed below. In addition, the recognition of stock-based compensation expense is impacted by estimated forfeiture rates. We estimated the fair value of each stock option granted for 2011, 2010 and 2009 using the following assumptions:
| Years Ended December 31, | ||||||
| 2011 | 2010 | 2009 | ||||
| Expected term (in years) |
5.26 | 5.4 | 4.8 | |||
| Expected volatility |
50% | 54% | 56% | |||
| Risk-free interest rate |
1.50% | 1.75 - 2.43% | 2.17 - 2.68% | |||
| Expected dividend yield |
— | — | — | |||
The expected option term was estimated by analyzing the historical period from grant to settlement of the stock option. This analysis includes exercise and forfeitures and also gives consideration to the expected holding period for those options that are still outstanding. The risk-free interest rate is based on a daily treasury yield curve rate that has a term consistent with the expected life of the stock option. We have not paid and do not anticipate paying cash dividends on our common stock, and therefore our expected dividend yield is assumed to be zero. We are required to estimate forfeiture rates at the time of grant and such estimates are revised in subsequent periods if actual forfeitures differ from those estimates. We apply an estimated forfeiture rate based on our historical forfeiture experience, which has been stratified into two relatively homogeneous groups.
As there was no public market for our common stock prior to our initial public offering, and therefore a lack of company-specific historical and implied volatility data, we have determined the share price volatility for options granted based on an analysis of reported data for a self-designated peer group of companies that grant options with substantially similar terms and conditions. The expected volatility of options granted was determined using a simple average of the historical volatility measures of this peer group of companies for a period equal to the expected life of the option. We intend to continue to consistently apply this process using the same or similar entities until a sufficient amount of historical information regarding the volatility of our own common stock share price becomes available, or unless circumstances change such that the identified entities are no longer similar to us, in which case, more suitable entities whose share prices are publicly available would be utilized in the calculation.
Upon the completion of our initial public offering on March 25, 2011, our common stock was valued by reference to its publicly traded price. Prior to our initial public offering, we historically granted stock options at exercise prices equal to the fair market value as determined by our board of directors on the date of grant, with input from management. Because there had been no public market for our common stock, our board of directors exercised significant judgment in determining the fair value of our common stock on the date of grant based on a number of objective and subjective factors. Factors considered by our board of directors included:
| • | contemporaneous independent valuations performed at periodic intervals by outside firms; |
| • | our performance, our financial condition and future financial projections at the approximate time of the option grant; |
| • | trends in the technology and technology-enabled service company industries; |
| • | the value of companies that we consider peers based on a number of factors including, but not limited to, similarity to us with respect to industry, business model, stage of growth, geographic diversification, profitability, company size, financial risk or other factors; |
| • | changes since the last time the board of directors approved option grants and made a determination of fair value, including changes in planned business from new engagements and anticipated business from existing engagements; |
51
Table of Contents
| • | amounts paid by investors for our common stock in arm’s-length purchases from our founders and employees; |
| • | the likelihood of achieving a liquidity event, such as an initial public offering or sale given prevailing market conditions and the nature and history of our business; and |
| • | any adjustment necessary to recognize a lack of marketability for our common stock. |
The valuation of our common stock was performed in accordance with the guidelines outlined in the American Institute of Certified Public Accountants Practice Aid, Valuation of Privately-Held-Company Equity Securities Issued as Compensation. In order to value our common stock, we first determined our business enterprise value and then allocated this business enterprise value to our common stock and common stock equivalents. Our business enterprise value was estimated using a combination of two generally accepted approaches: the income approach and the market-based approach. The income approach estimates enterprise value based on the estimated present value of future net cash flows the business is expected to generate over its remaining life. The estimated present value is calculated using a discount rate reflective of the risks associated with an investment in a similar company in a similar industry. The market approach measures the value of a business through an analysis of recent sales or offerings of comparable investments or assets, and in our case, focused on comparing us to the group of peer companies described above. In applying this method, valuation multiples are derived from historical operating data of the peer company group. We then apply multiples to our operating data to arrive at a range of indicated values of the company.
For each valuation, we prepared a financial forecast to be used in the computation of the value of invested capital for both the market approach and income approach. The financial forecast took into account our past results and expected future financial performance. The risk associated with achieving this forecast was assessed in selecting the appropriate discount rate. There is inherent uncertainty in these estimates as the assumptions used are highly subjective and subject to changes as a result of new operating data and economic and other conditions that impact our business.
As an additional indicator of fair value, we considered arm’s-length transactions involving sales and purchases of our common stock occurring near the respective valuation dates. Such transaction occurred in December 2008 when an existing stockholder purchased shares from our founders and certain employees at a price of $4.26 per share.
We also utilized a probability-weighted expected return method (“PWERM”) to estimate the fair value of our common stock using the methods discussed above. The growth and expansion of our business in 2009 and 2010, combined with a continuing trend of general improvement in the capital markets during the same period, provided us better visibility into the likelihood of achieving a liquidity event in the next one to two years.
Under the PWERM, the value of our common stock is estimated based upon an analysis of values for our common stock assuming the following possible future events for the company:
| • | initial public offering; |
| • | strategic merger or sale; |
| • | remaining a private company; and |
| • | dissolution of the company. |
For each of the possible events, a range of future equity values is estimated, based on the market, income or cost approaches and over a range of possible event dates, all discounted for the time-value of money. The timing of these events is based on management’s estimates. For each future equity value scenario, we determined the appropriate allocation of value to holders of our shares of common stock. The value of each share of common stock is then multiplied by a discount factor derived from the calculated discount rate and the expected timing of
52
Table of Contents
the event. The value per share of common stock is then multiplied by an estimated probability for each of the possible events based on management’s estimates. The calculated value per share of common stock under each scenario is then discounted for a lack of marketability. A probability-weighted value per share of common stock is then determined.
When using the PWERM, a market-comparable approach and an income approach were used to estimate our aggregate enterprise value at each valuation date. When choosing the market-comparable companies to be used for the market-comparable approach, we focused on the peer group of comparable companies described above operating within the technology and technology-enabled service sectors. The income approach involves applying an appropriate risk-adjusted discount rate to our projected debt-free cash flows, based on forecasted revenue and costs.
We also prepared financial forecasts for each valuation report date used in the computation of the enterprise value for both the market-comparable approach and the income approach. The financial forecasts were based on assumed revenue growth rates that took into account our past experience and contemporaneous future expectations of revenue from new and existing engagements. The risks associated with achieving these forecasts were assessed in selecting the appropriate cost of capital, which ranged from 16% to 18%.
In identifying other indicators of fair value, we considered transactions involving purchases and sales of shares, with the most recent being the previously mentioned transaction in December 2008.
Since January 1, 2009 through the completion of our initial public offering on March 24, 2011, we granted stock options with exercise prices as follows:
| Grant Date |
Number of Options Granted |
Exercise Price Per Option |
Common Stock Fair Value at Grant Date |
|||||||||
| (in thousands) | ||||||||||||
| February 4, 2009 |
186 | $ | 4.26 | $ | 4.26 | |||||||
| February 27, 2009 |
1,695 | $ | 4.26 | $ | 4.26 | |||||||
| May 8, 2009 |
148 | $ | 4.26 | $ | 4.26 | |||||||
| July 28, 2009 |
638 | $ | 4.26 | $ | 4.26 | |||||||
| November 4, 2009 |
983 | $ | 4.60 | $ | 4.60 | |||||||
| January 27, 2010 |
284 | $ | 4.65 | $ | 4.65 | |||||||
| February 9, 2010 |
1,863 | $ | 4.65 | $ | 4.65 | |||||||
| May 7, 2010 |
854 | $ | 4.70 | $ | 4.70 | |||||||
| July 28, 2010 |
1,678 | $ | 4.95 | $ | 4.95 | |||||||
| December 16, 2010 |
2,315 | $ | 5.80 | $ | 7.25 | |||||||
| February 9, 2011 |
531 | $ | 6.20 | $ | 9.20 | |||||||
Common Stock Valuations
The most significant factors considered by our board of directors in determining the fair value of our common stock at the grant dates mentioned in the table directly above were as follows:
Grants on February 4, February 27, May 8 and July 28, 2009
| • | The most recent independent contemporaneous valuation report was prepared as of December 1, 2008 utilizing the PWERM approach resulting in an indicated fair value of $4.05 to $4.26 per share of our common stock. The high end of the indicated fair value range reflects the price paid in an arm’s-length sale of our common stock by founders and certain employees to an existing stockholder in December 2008. |
53
Table of Contents
| • | The PWERM approach scenario probabilities used in the valuation report were based on our business outlook. Our management estimated a 25%-30% probability of an initial public offering, a 25%-30% probability of a sale or merger and a 40%-50% probability that we would continue as a private company. A bankruptcy scenario was deemed not probable and was assigned a 0% probability. In addition, our board recognized that management forecasts had not changed materially since the December 1, 2008 valuation report. |
| • | In determining the fair value of option awards on July 28, 2009, our board specifically considered the April 2009 public announcement by Oracle that it had entered into an agreement to acquire Sun Microsystems, our largest customer and the potential impact to our operations if this customer terminated its contracts with us. |
| • | Our board of directors determined the fair value per share of stock to be $4.26, the high end of the indicated range of value reflected in the valuation analysis. |
Grants on November 4, 2009
| • | The most recent independent contemporaneous valuation report was prepared as of September 30, 2009 utilizing the PWERM approach resulting in an indicated fair value of $4.55 to $4.75 per share of our common stock. |
| • | The PWERM approach scenario probabilities used in the valuation report were based on our business outlook. Our management estimated a 30%-35% probability of an initial public offering, an increase of five percentage points from the prior valuation; a 30%-35% probability of a sale or merger, also a five percentage point increase from the prior valuation; and a ten percentage decrease in the probability that we continue as a private company to an estimated range of 30%-40%. A bankruptcy scenario was deemed not probable and was assigned a 0% probability. In addition, our board recognized that management forecasts had not changed materially since the September 30, 2009 valuation report. |
| • | Management’s business outlook which considered the growth in revenue resulting from new customer arrangements as well as the potential impact to our business if Sun Microsystems were to terminate its relationship with us as a result of being acquired by Oracle. |
| • | The fair value per share of stock on November 4, 2009 was determined by our board to be $4.60 per share, the low end of the range of indicated fair value reflected in the valuation analysis. |
Grants on January 27 and February 9, 2010
| • | The most recent independent contemporaneous valuation report was prepared as of December 31, 2009 utilizing the PWERM approach resulting in an indicated fair value of $4.65 to $4.80 per share of our common stock. |
| • | The PWERM approach scenario probabilities used in the valuation report were based on our business outlook. Management estimated a 30%-35% probability of an initial public offering, a 30%-35% probability of a sale or merger and a 30%-40% probability that we would continue as a private company. A bankruptcy scenario was deemed not probable and was assigned a 0% probability. In addition, our board recognized that management forecasts had not changed materially since the December 31, 2009 valuation report. |
| • | Management’s business outlook continued to reflect revenue growth anticipated from new customer engagements and expected revenue from existing engagements, as well as uncertainty surrounding continuation of the Sun Microsystems engagements. |
| • | Our board of directors determined the fair value per share of stock to be $4.65, the low end of the indicated range of fair value reflected in the valuation analysis, which reflected the continued uncertainty to our business following the acquisition of Sun Microsystems by Oracle. |
54
Table of Contents
Grants on May 7, 2010
| • | The most recent independent contemporaneous valuation report was prepared as of March 31, 2010 utilizing the PWERM approach resulting in an indicated fair value of $4.70 per share of our common stock. |
| • | The PWERM approach scenario probabilities used in the valuation report were based on our business outlook. Management estimated a 33% probability of an initial public offering, a 33% probability of a sale or merger and a 33% probability that we would continue as a private company. A bankruptcy scenario was deemed not probable and was assigned a 0% probability. In addition, our board recognized that management forecasts had not changed materially since the March 31, 2010 valuation report. |
| • | Management’s business outlook continued to reflect revenue growth anticipated from new customer engagements and expected revenue from existing engagements, as well as uncertainty surrounding continuation of the Sun Microsystems engagements. |
| • | Our board of directors determined the fair value per share of stock to be $4.70, consistent with the indicated fair value reflected in the valuation analysis. |
Grants on July 28, 2010
| • | The most recent independent contemporaneous valuation report was prepared as of June 30, 2010 and indicated a fair value of $4.95 per share. |
| • | PWERM approach scenario probabilities used in the valuation report were based upon our business outlook. Our management estimated a 40% probability of an initial public offering, an increase from the 33% assumption in the prior valuation; a 30% probability of a sale or merger, down from a 33% probability used in the prior valuation; and a 30% probability that we would continue as a private company, a decrease from the 33% probability used in the prior valuation. A bankruptcy scenario was deemed not probable and was assigned a 0% probability. In addition, our board recognized that management forecasts had not changed materially since the June 30, 2010 valuation report. |
| • | While our financial forecast remained unchanged from the forecast utilized in the March 31, 2010 valuation, the increase in the fair value of our common stock as compared to the prior valuation resulted principally from the increased probability of an initial public offering as we undertook activities in this area. |
| • | Management’s business outlook continued to reflect revenue growth from new customer engagements and anticipated revenue from new engagements or revenue from expanded engagements with existing customers. Our financial forecast decreased as a result of the notice of cancellation of the Sun Microsystems contracts. |
| • | Our board of directors determined the fair value per share of stock to be $4.95, consistent with the indicated fair value reflected in the valuation analysis. |
Grants on December 16, 2010
| • | The most recent independent contemporaneous valuation report was prepared as of September 30, 2010 and indicated a fair value of $5.80 per share. |
| • | PWERM approach scenario probabilities used in the valuation report were based upon our business outlook. Our management estimated a 50% probability of an initial public offering, an increase from the 40% assumption in the prior valuation; a 25% probability of a sale or merger, down from a 30% probability used in the prior valuation; and a 25% probability that we would continue as a private company, a decrease from the 30% probability used in the prior valuation. A bankruptcy scenario was deemed not probable and was assigned a 0% probability. |
55
Table of Contents
| • | While our financial forecast remained unchanged from the forecast utilized in the March 31, 2010 valuation, the increase in the fair value of our common stock as compared to the prior valuation resulted principally from the increased probability of an initial public offering as we undertook activities in this area. |
| • | Our board of directors determined the fair value per share of stock to be $5.80, consistent with the indicated fair value reflected in the valuation analysis. |
| • | On January 25, 2011, an independent valuation specialist issued a report as of December 31, 2010 that indicated a fair value per share of stock of $6.20. Based on the proximity of this valuation report relative to the December 16, 2010 grants and in connection with the preparation of our 2010 financial statements in anticipation of a potential initial public offering, we reassessed for financial reporting purposes the estimate of fair value per share of the December 16, 2010 grants. Various factors were considered. For example, in mid-February 2011, prior to issuing our 2010 financial statements, our underwriters provided us with an estimated range of value for an initial public offering of $7.50 to $9.00 per share. Based on this estimated range, we evaluated the impact on the valuation specialist’s report as of December 31, 2010 using an initial public offering value of $8.25 per share, the midpoint of the underwriters’ initial public offering range. We evaluated the fair value of the Company’s common stock based on linear interpolation from a fair value of $4.95 per share as estimated by the valuation specialist as of June 30, 2010 to a fair value of $8.25. In addition, we also considered the impact of using $8.25 as the estimated fair value in an initial public offering scenario in the PWERM analysis, maintaining a 70% probability of such outcome, consistent with the valuation specialist’s report, which demonstrated the reasonableness of the fair value of $7.25 at December 31, 2010. While there was no certainty of completing an our initial public offering, a re-assessed fair value that considered the proposed pricing range was appropriate in concluding that the estimated per-share value of the underlying common shares for options granted on December 16, 2010 was $7.25 per share for financial reporting purposes. |
Grants on February 9, 2011
| • | The most recent independent contemporaneous valuation report was prepared as of December 31, 2010 and indicated a fair value of $6.20 per share. |
| • | PWERM approach scenario probabilities used in the valuation report were based upon our business outlook. Our management estimated a 70% probability of an initial public offering, an increase from the 50% assumption in the prior valuation; a 10% probability of a sale or merger, down from a 25% probability used in the prior valuation; and a 20% probability that we would continue as a private company, a decrease from the 25% probability used in the prior valuation. A bankruptcy scenario was deemed not probable and was assigned a 0% probability. |
| • | Management’s business outlook utilized in the December 31, 2010 valuation reflected lower operating margins as compared to the outlook utilized in the prior valuation reflecting a decrease in forecasted revenue, as well as higher forecasted operating expenses resulting from increased spending on research and development and investing in sales and marketing aimed at expanding our customer base. |
| • | Our board of directors determined the fair value per share of stock to be $6.20, consistent with the indicated fair value reflected in the valuation analysis. |
| • | On January 25, 2011, an independent valuation specialist issued a report as of December 31, 2010 that indicated a fair value per share of stock of $6.20. Based on the proximity of this valuation report relative to the February 9, 2011 grants and in connection with the preparation of our 2010 financial statements in anticipation of a potential initial public offering, we reassessed for financial reporting purposes the estimate of fair value per share of the February 9, 2011 grants. Various factors were considered. For example, in late March 2011, our initial public offering priced at $10.00 per share. Based on this we evaluated the impact on the valuation specialist’s report as of December 31, 2010 using an initial public offering value of $10 per share. We evaluated the fair value of the Company’s |
56
Table of Contents
| common stock based on linear interpolation from a fair value of $4.95 per share as estimated by the valuation specialist as of June 30, 2010 to a fair value of $10. In addition, we also considered the impact of using $10 as the estimated fair value in an initial public offering scenario in the PWERM analysis, maintaining a 70% probability of such outcome, consistent with the valuation specialist’s report, which demonstrated the reasonableness of the fair value of $9.20 per share at February 9, 2011 for financial reporting purposes. |
Nonemployee Stock-Based Compensation
We account for stock options issued to nonemployees based on the estimated fair value of the awards using the Black-Scholes option pricing model. The measurement of stock based compensation is subject to periodic adjustments as the underlying equity instruments vest, and the resulting change in value, if any, is recognized in our consolidated statements of operations during the period the related services are rendered.
Stock-based compensation expense for options granted to nonemployees in 2011 and 2010 was $0.1 million and $0.1 million respectively. There were no options granted to nonemployees in 2009.
There is inherent uncertainty in these estimates and if different assumptions had been used, the fair value of the equity instruments issued to nonemployee consultants could have been significantly different.
Capitalized Internal-Use Software
Commencing in 2007, we began incurring costs related to the development of our technology platform. In connection with these efforts, we capitalized external costs as well as internal labor costs related to the development of internal-use software associated with our technology platform. During 2011, 2010 and 2009, we capitalized $6.0 million, $4.7 million and $5.0 million, respectively, primarily related to the development of our technology platform and cloud applications. Capitalized amounts included costs of internal labor totaling $2.5 million and $0.8 million in 2011 and 2010, respectively, while the remainder of amounts capitalized during the periods related to costs of third-party developers. The increased spending during 2011 relative to the 2010 reflects increased costs related to the development of our channel sales and analytics and reporting applications.
We capitalize certain internal and external costs related to the development and enhancement of our internal-use software when we enter the application development stage and until software is substantially complete and is ready for its intended use. These capitalized costs include direct external costs of services utilized in developing or obtaining internal-use software, compensation and related expenses of employees who are directly associated with, and who devote time to, internal-use software projects. Capitalization of these costs ceases once the project is substantially complete and the software is ready for its intended use and the related costs are amortized over estimated useful lives ranging from 24 to 60 months. Post-implementation training and maintenance costs are expensed as incurred. We initiate our review of potential impairment whenever events or changes in circumstances indicate that the carrying amount of the capitalized internal-use software may not be recoverable. Recoverability of assets is assessed by a comparison of the carrying amount of an asset to the expected future undiscounted cash flows expected to be generated by the asset. If it is determined that the carrying value of the internal-use software is not recoverable, an impairment loss is recorded in the amount by which the carrying amount of the asset exceeds the fair value of the asset. There were no impairments to internal-use software in 2011, 2010 or 2009.
Income Taxes
We account for income taxes using an asset and liability method, which requires the recognition of taxes payable or refundable for the current year and deferred tax assets and liabilities for the expected future tax consequences of temporary differences that currently exist between the tax basis and the financial reporting basis of our taxable subsidiaries’ assets and liabilities using the enacted tax rates in effect for the year in which the
57
Table of Contents
differences are expected to reverse. The effect of a change in tax rates on deferred tax assets and liabilities is recognized in operations in the period that includes the enactment date. The measurement of deferred tax assets is reduced, if necessary, by the amount of any tax benefits that, based on available evidence, are not expected to be realized.
As of December 31, 2011, 2010 and, 2009, we did not have any unrecognized tax benefits that if recognized would impact our annual effective tax rate. We account for unrecognized tax benefits using a more-likely-than-not threshold for financial statement recognition and measurement of tax positions taken or expected to be taken in a tax return. We establish reserves for tax-related uncertainties based on estimates of whether, and the extent to which, additional taxes will be due. We record an income tax liability, if any, for the difference between the benefit recognized and measured and the tax position taken or expected to be taken on our tax returns. To the extent that the assessment of such tax positions change, the change in estimate is recorded in the period in which the determination is made. The reserves are adjusted in light of changing facts and circumstances, such as the outcome of a tax audit. The provision for income taxes includes the impact of reserve provisions and changes to reserves that are considered appropriate. As of December 31, 2011, 2010 and 2009, we have not recorded any liabilities for unrecognized tax benefits.
Prior to March 1, 2011, the parent company, ServiceSource International, Inc., formerly known as ServiceSource International, LLC, was a Delaware Limited Liability Company (LLC) which filed its income tax return as a partnership for federal and state income tax purposes, and recognized no federal, state, or local income taxes. The members (equity holders) of the LLC, and not the LLC itself, were subject to income tax on their allocated share of the LLC’s earnings through February 28, 2011. For all reporting periods, the parent company’s taxable subsidiaries have been included in the provision for income taxes in the accompanying consolidated financial statements as described above. For periods prior to March 1, 2011, the LLC was subject to an annual California LLC registration fee based on revenue. When the LLC was taxed as a partnership, it generally made an annual distribution to its members for their estimated tax liability on allocated net income under the terms of the limited liability company agreement. We do not plan to make any material distributions for the foreseeable future.
Recent Accounting Pronouncements
In 2011, the Financial Accounting Standards Board (“FASB”) issued new accounting guidance that amends some fair value measurement principles and disclosure requirements. The new guidance states that the concepts of highest and best use and valuation premise are only relevant when measuring the fair value of nonfinancial assets and prohibits the grouping of financial instruments for purposes of determining their fair values when the unit of account is specified in other guidance. We will adopt this accounting standard upon its effective date for periods beginning on or after December 15, 2011, and do not anticipate that this adoption will have a significant impact on our financial position or results of operations.
In 2011, the FASB issued new disclosure guidance related to the presentation of the Statement of Comprehensive Income. This guidance eliminates the current option to report other comprehensive income and its components in the consolidated statement of stockholders’ equity. The requirement to present reclassification adjustments out of accumulated other comprehensive income on the face of the consolidated statement of income has been deferred. We will adopt this accounting standard upon its effective date for periods beginning on or after December 15, 2011, and this adoption will not have any impact on our financial position or results of operations but will impact our financial statement presentation.
58
Table of Contents
| ITEM 7A. | QUANTITATIVE AND QUALITATIVE DISCLOSURES ABOUT MARKET RISK |
Foreign Currency Risk
Our results of operations and cash flows are subject to fluctuations due to changes in foreign currency exchange rates, particularly changes in the euro, British pound, Singapore dollar and Malaysian Ringgit. To date, we have not entered into any foreign currency hedging contracts, but may consider entering into such contracts in the future. We believe our operating activities act as a natural hedge for a substantial portion of our foreign currency exposure because we typically collect revenue and incur costs in the currency in the location in which we provide our solution from our sales centers. However, our global sales operations center in Kuala Lumpur incurs costs in the Malaysian Ringgit but we do not generate revenue or cash proceeds in this currency and, as a result, have some related foreign currency risk exposure. As our international operations grow, we will continue to reassess our approach to managing our risk relating to fluctuations in currency rates.
Interest Rate Risk
The primary objectives of our investment activities are to preserve principal, provide liquidity and maximize income without significantly increasing risk. By policy, we do not enter into investments for trading or speculative purposes. Some of the securities we invest in are subject to market risk. This means that a change in prevailing interest rates may cause the fair value of the investment to fluctuate. To minimize this risk, we invest in a variety of securities, which primarily consist of money market funds, commercial paper, municipal securities and other debt securities of domestic corporations. Due to the nature of these investments and relatively short duration of the underlying securities, we believe that we do not have any material exposure to changes in the fair value of our investment portfolio as a result of changes in interest rates. Declines in interest rates, however, will reduce future interest income. A 10% appreciation or depreciation in interest rates in 2011 and 2010 would not have had a material impact on our interest income or the fair value of our marketable securities.
Inflation Risk
We do not believe that inflation has had a material effect on our business, financial condition or results of operations. Nonetheless, if our costs were to become subject to significant inflationary pressures, we may not be able to fully offset such higher costs through price increases. Our inability or failure to do so could harm our business, financial condition and results of operations.
59
Table of Contents
| ITEM 8. | FINANCIAL STATEMENTS AND SUPPLEMENTARY DATA |
ServiceSource International, Inc.
ServiceSource International, Inc., the registrant whose name appears on the cover of this report, is the survivor of a merger with ServiceSource International LLC that occurred on March 24, 2011, the date of our initial public offering. The financial statements for the period covered by this report are those of ServiceSource International, Inc. for periods beginning after March 24, 2011 and those of ServiceSource International LLC for periods ended on or before March 24, 2011. Because ServiceSource International LLC was a holding company, giving retroactive effect to the merger would not affect the financial statements contained in this report, except with respect to the information regarding the membership units in the LLC. We do not differentiate between the operations and financial results of ServiceSource International, Inc. and the operations and financial results of the LLC and we refer to these entities as “the Company” throughout this report.
INDEX TO CONSOLIDATED FINANCIAL STATEMENTS AND SCHEDULE
Note: All other financial statement schedules are omitted because they are not applicable or the required information is included in the consolidated financial statements or notes thereto.
60
Table of Contents
Report of Independent Registered Public Accounting Firm
To the Board of Directors of
ServiceSource International, Inc. and Subsidiaries
In our opinion, the accompanying consolidated balance sheets and the related consolidated statements of operations, of changes in stockholders’/members’ equity and comprehensive income (loss) and of cash flows present fairly, in all material respects, the financial position of ServiceSource International, Inc. (formerly ServiceSource International, LLC) and its subsidiaries at December 31, 2011 and 2010, and the results of their operations and their cash flows for each of the three years in the period ended December 31, 2011 in conformity with accounting principles generally accepted in the United States of America. In addition, in our opinion, the financial statement schedule listed in the exhibit appearing under Item 15(a) 2. presents fairly, in all material respects, the information set forth therein when read in conjunction with the related consolidated financial statements. These financial statements and financial statement schedule are the responsibility of the Company’s management. Our responsibility is to express an opinion on these financial statements and financial statement schedule based on our audits. We conducted our audits in accordance with the standards of the Public Company Accounting Oversight Board (United States). Those standards require that we plan and perform the audit to obtain reasonable assurance about whether the financial statements are free of material misstatement. An audit includes examining, on a test basis, evidence supporting the amounts and disclosures in the financial statements, assessing the accounting principles used and significant estimates made by management, and evaluating the overall financial statement presentation. We believe that our audits provide a reasonable basis for our opinion.
/s/ PricewaterhouseCoopers LLP
March 6, 2012
San Jose, California
61
Table of Contents
ServiceSource International, Inc. and Subsidiaries
(In thousands, except per share amounts)
| December 31, | ||||||||
| 2011 | 2010 | |||||||
| Assets |
||||||||
| Current assets: |
||||||||
| Cash and cash equivalents |
$ | 65,983 | $ | 22,652 | ||||
| Short-term investments |
42,882 | — | ||||||
| Accounts receivable, net |
54,095 | 49,237 | ||||||
| Current portion of deferred income taxes |
3,526 | 1,155 | ||||||
| Prepaid expenses and other |
7,945 | 3,344 | ||||||
|
|
|
|
|
|||||
| Total current assets |
174,431 | 76,388 | ||||||
| Property and equipment, net |
26,840 | 19,418 | ||||||
| Deferred debt issuance costs, net |
123 | 273 | ||||||
| Deferred income taxes, net of current portion |
30,238 | 3,780 | ||||||
| Other assets, net |
995 | 1,910 | ||||||
| Goodwill |
6,334 | 6,334 | ||||||
|
|
|
|
|
|||||
| Total assets |
$ | 238,961 | $ | 108,103 | ||||
|
|
|
|
|
|||||
| Liabilities and Stockholders’/Members’ Equity |
||||||||
| Current liabilities: |
||||||||
| Accounts payable |
$ | 8,617 | $ | 3,710 | ||||
| Accrued taxes |
4,008 | 2,369 | ||||||
| Accrued compensation and benefits |
18,665 | 11,680 | ||||||
| Accrued payables to customers |
— | 30,640 | ||||||
| Other accrued liabilities |
7,639 | 7,575 | ||||||
| Current portion of long-term debt |
706 | 2,279 | ||||||
|
|
|
|
|
|||||
| Total current liabilities |
39,635 | 58,253 | ||||||
| Long-term debt, net of current portion |
958 | 14,939 | ||||||
| Other long-term liabilities |
1,352 | 1,027 | ||||||
|
|
|
|
|
|||||
| Total liabilities |
41,945 | 74,219 | ||||||
|
|
|
|
|
|||||
| Commitments and contingencies (Note 9) |
||||||||
| Stockholders’/members’ equity: |
||||||||
| Common shares: 99,000 authorized; 58,007 issued; and 57,506 outstanding as of December 31, 2010; none authorized or issued at December 31, 2011. |
— | 34,161 | ||||||
| Common stock; $0.0001 par value; 1,000,000 shares authorized, 72,688 shares issued and 72,567shares outstanding as of December 31, 2011; none authorized or issued at December 31, 2010 |
7 | — | ||||||
| Treasury shares / stock |
(441 | ) | (441 | ) | ||||
| Additional paid-in capital |
177,796 | — | ||||||
| Retained earnings |
19,416 | — | ||||||
| Accumulated other comprehensive income |
238 | 164 | ||||||
|
|
|
|
|
|||||
| Total stockholders’/members’ equity |
197,016 | 33,884 | ||||||
|
|
|
|
|
|||||
| Total liabilities and stockholders’/members’ equity |
$ | 238,961 | $ | 108,103 | ||||
|
|
|
|
|
|||||
The accompanying notes are an integral part of these consolidated financial statements.
62
Table of Contents
ServiceSource International, Inc, and Subsidiaries
Consolidated Statements of Operations
(In thousands, except per share amounts)
| Years Ended December 31, | ||||||||||||
| 2011 | 2010 | 2009 | ||||||||||
| Net revenue |
$ | 205,501 | $ | 152,935 | $ | 110,676 | ||||||
| Cost of revenue |
113,406 | 90,048 | 58,877 | |||||||||
|
|
|
|
|
|
|
|||||||
| Gross profit |
92,095 | 62,887 | 51,799 | |||||||||
|
|
|
|
|
|
|
|||||||
| Operating expenses |
||||||||||||
| Sales and marketing |
48,520 | 35,119 | 23,182 | |||||||||
| Research and development |
13,073 | 7,188 | 2,054 | |||||||||
| General and administrative |
33,647 | 19,378 | 13,777 | |||||||||
| Amortization of intangible assets |
— | — | 68 | |||||||||
|
|
|
|
|
|
|
|||||||
| Total operating expenses |
95,240 | 61,685 | 39,081 | |||||||||
|
|
|
|
|
|
|
|||||||
| Income (loss) from operations |
(3,145 | ) | 1,202 | 12,718 | ||||||||
| Interest expense |
(503 | ) | (1,271 | ) | (1,116 | ) | ||||||
| Loss on extinguishment / modification of debt |
(235 | ) | (144 | ) | — | |||||||
| Other (expense) income, net |
(389 | ) | (207 | ) | 639 | |||||||
|
|
|
|
|
|
|
|||||||
| Income (loss) before provision for income taxes |
(4,272 | ) | (420 | ) | 12,241 | |||||||
| Income tax provision (benefit) |
(19,383 | ) | 2,147 | 1,866 | ||||||||
|
|
|
|
|
|
|
|||||||
| Net income (loss) |
$ | 15,111 | $ | (2,567 | ) | $ | 10,375 | |||||
|
|
|
|
|
|
|
|||||||
| Net income (loss) per common share: |
||||||||||||
| Basic |
$ | 0.23 | $ | (0.04 | ) | $ | 0.18 | |||||
|
|
|
|
|
|
|
|||||||
| Diluted |
$ | 0.21 | $ | (0.04 | ) | $ | 0.18 | |||||
|
|
|
|
|
|
|
|||||||
| Weighted-average shares used in computing net income (loss) per common share: |
||||||||||||
| Basic |
66,656 | 57,284 | 56,750 | |||||||||
|
|
|
|
|
|
|
|||||||
| Diluted |
73,585 | 57,284 | 58,912 | |||||||||
|
|
|
|
|
|
|
|||||||
The accompanying notes are an integral part of these consolidated financial statements.
63
Table of Contents
ServiceSource International, Inc. and Subsidiaries
Consolidated Statements of Stockholders’/Members’ Equity and Comprehensive Income (Loss)
(In thousands)
| Common Shares | Common Stock | Treasury Shares/Stock | Additional Paid-in Capital |
Retained Earnings |
Accumulated Other Comprehensive Income (Loss) |
Total | ||||||||||||||||||||||||||||||||||
| Shares | Amount | Shares | Amount | Shares | Amount | |||||||||||||||||||||||||||||||||||
| Balances at December 31, 2008 |
56,461 | $ | 13,357 | — | $ | — | — | $ | — | $ | — | $ | — | $ | 125 | $ | 13,482 | |||||||||||||||||||||||
| Issuance of common shares from exercise of share options |
459 | 585 | — | — | — | — | — | — | — | 585 | ||||||||||||||||||||||||||||||
| Repurchase of common shares |
— | — | — | — | (35 | ) | (126 | ) | — | — | — | (126 | ) | |||||||||||||||||||||||||||
| Share-based compensation expense |
— | 6,060 | — | — | — | — | — | — | — | 6,060 | ||||||||||||||||||||||||||||||
| Excess tax benefits from exercise of share options |
— | 129 | — | — | — | — | — | — | — | 129 | ||||||||||||||||||||||||||||||
| Comprehensive income: |
||||||||||||||||||||||||||||||||||||||||
| Net income |
— | 10,375 | — | — | — | — | — | — | — | 10,375 | ||||||||||||||||||||||||||||||
| Foreign currency translation adjustments |
— | — | — | — | — | — | — | — | (174 | ) | (174 | ) | ||||||||||||||||||||||||||||
|
|
|
|||||||||||||||||||||||||||||||||||||||
| Total comprehensive income |
10,201 | |||||||||||||||||||||||||||||||||||||||
|
|
|
|
|
|
|
|
|
|
|
|
|
|
|
|
|
|
|
|
|
|||||||||||||||||||||
| Balances at December 31, 2009 |
56,920 | 30,506 | — | — | (35 | ) | (126 | ) | — | — | (49 | ) | 30,331 | |||||||||||||||||||||||||||
| Cash distributions to members |
— | (2,517 | ) | — | — | — | — | — | — | — | (2,517 | ) | ||||||||||||||||||||||||||||
| Issuance of common shares from exercise of share options |
707 | 556 | — | — | — | — | — | — | — | 556 | ||||||||||||||||||||||||||||||
| Repurchase of common shares |
— | — | — | — | (86 | ) | (315 | ) | — | — | — | (315 | ) | |||||||||||||||||||||||||||
| Share-based compensation expense |
— | 8,089 | — | — | — | — | — | — | — | 8,089 | ||||||||||||||||||||||||||||||
| Excess tax benefits from exercise of share options |
— | 94 | — | — | — | — | — | — | — | 94 | ||||||||||||||||||||||||||||||
| Comprehensive loss: |
||||||||||||||||||||||||||||||||||||||||
| Net loss |
— | (2,567 | ) | — | — | — | — | — | — | — | (2,567 | ) | ||||||||||||||||||||||||||||
| Foreign currency translation adjustments |
— | — | — | — | — | — | — | — | 213 | 213 | ||||||||||||||||||||||||||||||
|
|
|
|||||||||||||||||||||||||||||||||||||||
| Total comprehensive loss |
(2,354 | ) | ||||||||||||||||||||||||||||||||||||||
|
|
|
|
|
|
|
|
|
|
|
|
|
|
|
|
|
|
|
|
|
|||||||||||||||||||||
| Balances at December 31, 2010 |
57,627 | 34,161 | — | — | (121 | ) | (441 | ) | — | — | 164 | 33,884 | ||||||||||||||||||||||||||||
| Conversion to corporation |
(57,760 | ) | (32,573 | ) | 57,760 | 6 | — | — | 40,684 | — | — | 8,117 | ||||||||||||||||||||||||||||
| Issuance of common stock in connection with initial public offering, net of issuance costs of $10,209 |
— | — | 9,791 | 1 | — | — | 87,701 | — | — | 87,702 | ||||||||||||||||||||||||||||||
| Issuance of common stock in connection with follow-on offering, net of issuance costs of $1,055 |
— | — | 1,372 | — | — | — | 22,956 | — | — | 22,956 | ||||||||||||||||||||||||||||||
| Issuance of common stock from exercise of stock options and employee stock purchase plan |
133 | 476 | 3,765 | — | — | — | 14,569 | — | — | 15,045 | ||||||||||||||||||||||||||||||
| Stock-based compensation |
— | 2,241 | — | — | — | — | 9,358 | — | — | 11,599 | ||||||||||||||||||||||||||||||
| Excess tax benefits from exercise of stock options |
— | — | — | — | — | — | 2,528 | — | — | 2,528 | ||||||||||||||||||||||||||||||
| Comprehensive income: |
||||||||||||||||||||||||||||||||||||||||
| Net income |
— | (4,305 | ) | — | — | — | — | — | 19,416 | — | 15,111 | |||||||||||||||||||||||||||||
| Foreign currency translation adjustments |
— | — | — | — | — | — | — | — | 65 | 65 | ||||||||||||||||||||||||||||||
| Unrealized gain on investments |
— | — | — | — | — | — | — | — | 9 | 9 | ||||||||||||||||||||||||||||||
|
|
|
|||||||||||||||||||||||||||||||||||||||
| Total comprehensive income |
15,185 | |||||||||||||||||||||||||||||||||||||||
|
|
|
|
|
|
|
|
|
|
|
|
|
|
|
|
|
|
|
|
|
|||||||||||||||||||||
| Balances at December 31, 2011 |
— | $ | — | 72,688 | $ | 7 | (121 | ) | $ | (441 | ) | $ | 177,796 | $ | 19,416 | $ | 238 | $ | 197,016 | |||||||||||||||||||||
|
|
|
|
|
|
|
|
|
|
|
|
|
|
|
|
|
|
|
|
|
|||||||||||||||||||||
The accompanying notes are an integral part of these consolidated financial statements.
64
Table of Contents
ServiceSource International, Inc. and Subsidiaries
Consolidated Statements of Cash Flows
(In thousands)
| Years Ended December 31, | ||||||||||||
| 2011 | 2010 | 2009 | ||||||||||
| Cash flows from operating activities |
||||||||||||
| Net income (loss) |
$ | 15,111 | $ | (2,567 | ) | $ | 10,375 | |||||
| Adjustments to reconcile net income (loss) to net cash provided by (used in) operating activities: |
||||||||||||
| Depreciation and amortization |
9,372 | 6,137 | 3,527 | |||||||||
| Loss on disposal of fixed assets |
46 | — | — | |||||||||
| Amortization of deferred financing costs |
116 | 186 | 162 | |||||||||
| Accretion of premium on short-term investments |
276 | — | — | |||||||||
| Loss on extinguishment/modification of debt |
235 | 144 | — | |||||||||
| Deferred income taxes |
(21,021 | ) | (1,340 | ) | (1,025 | ) | ||||||
| Stock-based compensation |
11,599 | 8,089 | 6,060 | |||||||||
| Tax benefit from stock-based compensation and other |
(2,835 | ) | (94 | ) | (129 | ) | ||||||
| Changes in operating assets and liabilities: |
||||||||||||
| Accounts receivable |
(4,972 | ) | (21,222 | ) | (4,494 | ) | ||||||
| Advances to customers |
18 | 723 | 3,562 | |||||||||
| Prepaid expenses and other |
(1,420 | ) | (1,936 | ) | (1,665 | ) | ||||||
| Accounts payable |
2,235 | 1,949 | (1,063 | ) | ||||||||
| Accrued taxes |
1,812 | (216 | ) | (1,743 | ) | |||||||
| Accrued compensation and benefits |
6,868 | 3,900 | 930 | |||||||||
| Accrued payables to customers |
(30,640 | ) | 23,642 | 2,470 | ||||||||
| Other accrued liabilities |
1,969 | 5,235 | 2,537 | |||||||||
|
|
|
|
|
|
|
|||||||
| Net cash (used in) provided by operating activities |
(11,231 | ) | 22,630 | 19,504 | ||||||||
|
|
|
|
|
|
|
|||||||
| Cash flows from investing activities |
||||||||||||
| Acquisition of property and equipment |
(14,050 | ) | (9,170 | ) | (7,476 | ) | ||||||
| Purchases of marketable securities |
(53,795 | ) | — | — | ||||||||
| Sales of marketable securities |
2,113 | — | — | |||||||||
| Maturities of marketable securities |
8,190 | — | — | |||||||||
|
|
|
|
|
|
|
|||||||
| Net cash used in investing activities |
(57,542 | ) | (9,170 | ) | (7,476 | ) | ||||||
|
|
|
|
|
|
|
|||||||
| Cash flows from financing activities |
||||||||||||
| Net proceeds from issuance of common stock in initial public offering and follow-on offering. |
110,753 | — | — | |||||||||
| Proceeds from revolving credit facility |
23,424 | — | 10,600 | |||||||||
| Repayment of revolving credit facility |
(23,424 | ) | — | (10,600 | ) | |||||||
| Repayment of long-term debt |
(16,252 | ) | (1,776 | ) | (2,967 | ) | ||||||
| Payment of deferred debt issuance costs |
(200 | ) | (181 | ) | — | |||||||
| Cash distributions to members |
— | (2,517 | ) | — | ||||||||
| Proceeds from common stock issuances |
15,045 | 556 | 585 | |||||||||
| Repurchases of common shares |
— | (315 | ) | (126 | ) | |||||||
| Tax benefit from stock-based compensation and other |
2,835 | 94 | 129 | |||||||||
|
|
|
|
|
|
|
|||||||
| Net cash provided by (used in) financing activities |
112,181 | (4,139 | ) | (2,379 | ) | |||||||
|
|
|
|
|
|
|
|||||||
| Net increase in cash and cash equivalents |
43,408 | 9,321 | 9,649 | |||||||||
| Effect of exchange rate changes on cash and cash equivalents |
(77 | ) | 162 | (260 | ) | |||||||
| Cash and cash equivalents at beginning of period |
22,652 | 13,169 | 3,780 | |||||||||
|
|
|
|
|
|
|
|||||||
| Cash and cash equivalents at end of period |
$ | 65,983 | $ | 22,652 | $ | 13,169 | ||||||
|
|
|
|
|
|
|
|||||||
| Supplemental disclosure of cash flow information |
||||||||||||
| Cash paid for interest |
$ | 518 | $ | 917 | $ | 1,038 | ||||||
| Cash paid for income taxes |
2,459 | 3,626 | 5,627 | |||||||||
| Supplemental disclosure of non-cash investing and financing activities |
||||||||||||
| Acquisition of property and equipment under capital leases |
271 | 1,388 | 785 | |||||||||
| Acquisition of property and equipment through accounts payable |
1,570 | 637 | 102 | |||||||||
The accompanying notes are an integral part of these consolidated financial statements.
65
Table of Contents
ServiceSource International, Inc and Subdidiaries
NOTES TO CONSOLIDATED FINANCIAL STATEMENTS
1. The Company
ServiceSource manages the service contract renewals process of maintenance, support and subscription agreements on behalf of its customers. The Company’s integrated solution consists of a suite of cloud applications, dedicated service sales teams working under its customers’ brands and a proprietary Service Revenue Intelligence Platform. By integrating software, managed services and data, the Company provides end-to-end management and optimization of the service contract renewals process, including data management, quoting, selling and service revenue business intelligence. The Company’s business is built on a pay-for-performance model, whereby customers pay the Company based on renewal sales that the Company generates on the customers’ behalf. The Company’s corporate headquarter office is located in San Francisco, California. The Company has additional offices in Colorado, Tennessee, the United Kingdom, Ireland, Malaysia and Singapore.
On March 30, 2011, the Company closed its initial public offering (“IPO”) of 13,731,153 shares of its common stock, which included 9,791,020 shares of common stock sold by the Company (inclusive of 1,791,020 shares of common stock from the full exercise of the over-allotment option of shares granted to the underwriters) and 3,940,133 shares of common stock sold by the selling stockholders. The public offering price of the shares sold in the offering was $10.00 per share. The Company did not receive any proceeds from the sales of shares by the selling stockholders. The total gross proceeds from the offering to the Company were $97.9 million. After deducting underwriting discounts and commissions and offering expenses payable by the Company, the aggregate net proceeds received by the Company totaled approximately $87.7 million.
On August 3, 2011, the Company closed a secondary public offering of 10,350,000 shares of its common stock, which included 1,372,061 shares of common stock sold by the Company (inclusive of 1,350,000 shares of common stock from the full exercise of the over-allotment option granted to the underwriters) and 8,977,939 shares of common stock sold by the selling stockholders. The price of the shares sold in the offering was $17.50 per share. The total gross proceeds from the offering to the Company were $24.0 million. After deducting underwriting discounts, commissions and estimated offering expenses payable by the Company, the aggregate net proceeds received by the Company totaled approximately $23.0 million. The Company did not receive any proceeds from the sales of shares by the selling stockholders (other than approximately $2.9 million in additional cash received from the exercise of stock options by certain of the selling stockholders).
On March 24, 2011, ServiceSource International LLC, a Delaware limited liability company, (the “LLC”) converted into a Delaware corporation and changed its name from ServiceSource International LLC to ServiceSource International, Inc. (the “Company” or “ServiceSource”). In connection with this conversion, all of the outstanding common shares representing members’ equity automatically converted into shares of common stock.
2. Summary of Significant Accounting Policies
Basis of Consolidation
The accompanying consolidated financial statements include the accounts of ServiceSource International, Inc. and its wholly-owned subsidiaries. All intercompany balances and transactions have been eliminated in consolidation.
Use of Estimates
The preparation of consolidated financial statements in conformity with accounting principles generally accepted in the United States of America (“GAAP”) requires management to make estimates and assumptions
66
Table of Contents
that affect the reported amounts of assets and liabilities and disclosure of contingent assets and liabilities at the date of the consolidated financial statements and the reported amount of net revenue and expenses during the reporting period.
The Company’s significant accounting judgments and estimates include: revenue recognition; the valuation and recognition of stock-based compensation, recognition and measurement of current and deferred income tax assets and liabilities and uncertain tax positions and capitalization of internal-use software.
The Company bases its estimates and judgments on historical experience and on various assumptions that it believes are reasonable under the circumstances. However, future events are subject to change and estimates and judgments routinely require adjustment. Actual results may differ from these estimates, and these differences may be material.
Segments
The Company defines an operating segment on the same basis that it uses internally to evaluate performance. Management has determined that the Company operates in three segments, as it reports financial information across three geographic regions to its chief executive officer, who is the Company’s chief operating decision maker. The Company’s three operating and reportable segments are NALA (North America and Latin America), EMEA (Europe, Middle East and Africa) and APJ (Asia Pacific-Japan).
Significant Risks and Uncertainties
The Company is subject to certain risks and uncertainties that could have a material and adverse effect on its future financial position or results of operations. The Company’s customers are primarily high technology companies and any downturn in these industries, changes in customers’ sales strategies, or widespread shift away from end customers purchasing maintenance and support contracts could have an adverse impact on the Company’s consolidated results of operations and financial condition.
Financial instruments that potentially subject the Company to concentration of credit risk consist principally of cash, accounts receivable and advances to customers. The Company is also exposed to a variety of market risks, including the effects of changes in foreign currency exchange rates and interest rates.
Cash is maintained in demand accounts at U.S., European and Asian financial institutions that management believes are credit worthy. Deposits in these institutions may exceed the amount of insurance provided on these deposits.
Accounts receivable are derived from services performed for customers located primarily in the U.S., Europe and Asia. The Company attempts to mitigate the concentration of credit risk in its trade receivables through its ongoing credit evaluation process and historical collection experience. The Company maintains an allowance for doubtful accounts based upon the expected collectibility of all accounts receivable, which takes into consideration an analysis of historical bad debts and other available information.
The following table summarizes net revenue and accounts receivable from customers, as included in the NALA and EMEA geographic segments (Note 14), in excess of 10% of total net revenue and accounts receivable, respectively:
| Revenue | Accounts Receivable | |||||||||||||||||||
| Years Ended December 31, | December 31, | |||||||||||||||||||
| 2011 | 2010 | 2009 | 2011 | 2010 | ||||||||||||||||
| VMware, Inc |
12 | % | 11 | % | * | 14 | % | 10 | % | |||||||||||
| Sun Microsystems, Inc |
* | 13 | % | 24 | % | * | 20 | % | ||||||||||||
| * | Amounts represent less than 10% in the respective period. |
67
Table of Contents
The following table summarizes advances to customers and accrued payables to customers in excess of 10% of total advances and accrued payables to customers, respectively:
| Advances to Customers | Accrued Payables to Customers |
|||||||||||||||
| December 31, | December 31, | |||||||||||||||
| 2011 | 2010 | 2011 | 2010 | |||||||||||||
| Sun Microsystems, Inc |
— | 100 | % | — | 100 | % | ||||||||||
In the first quarter of 2011, under the terms of a settlement agreement, the Company repaid amounts it owed to Oracle/Sun, net of amounts owed to the Company, resulting in net cash payments to Oracle/Sun of approximately $18.1 million which were funded from existing cash and borrowings under a revolving credit facility. The Company recognized $1.8 million in additional net revenue in the quarter ended March 31, 2011 resulting from this settlement.
Fair Value Measurements
The Company measures and discloses fair value in accordance with Accounting Standards Codification (“ASC”) 820, Fair Value Measurements and Disclosures. Under this standard, fair value is defined as the price that would be received by selling an asset or paid by transferring a liability (an exit price) in the principal or most advantageous market for the asset or liability in an orderly transaction between market participants on the measurement date. The fair value hierarchy requires an entity to maximize the use of the observable inputs and minimize the use of unobservable inputs when measuring fair value. The three levels of the hierarchy are as follows:
| Level 1 | Quoted prices in active markets that are accessible at the measurement date for identical, unrestricted assets or liabilities. | |
| Level 2 | Quoted prices for similar assets and liabilities in active markets; quoted prices for identical or similar assets and liabilities in markets that are not active; and model-derived valuations in which all significant inputs and significant value drivers are observable in active markets. | |
| Level 3 | Unobservable inputs that are supported by little or no market activity and that are significant to the fair value of the assets or liabilities. Level 3 assets and liabilities include financial instruments whose value is determined using pricing models, discounted cash flow methodologies, or similar techniques, as well as instruments for which the determination of fair value requires significant management judgment or estimation. | |
A financial instrument’s level within the fair value hierarchy is based on the lowest level of input that is significant to the fair value measurement.
Fair Value of Financial Instruments
The carrying amounts of certain financial instruments, which include cash and cash equivalents, short-term investments, accounts receivable, accounts payable, accrued payables and other accrued liabilities approximates fair value due to their short-term nature. Based on borrowing rates currently available to the Company for loans with similar terms, the carrying value of long-term debt approximates fair value, assuming minimal credit risk and nonperformance risk.
Foreign Currency Translation and Remeasurement
Assets and liabilities of non-U.S. subsidiaries that operate in a local currency environment, where that local currency is the functional currency, are translated to U.S. dollars at exchange rates in effect at the balance sheet date. Net revenue and expenses are translated at monthly average exchange rates. The Company accumulates net translation adjustments in equity as a component of accumulated other comprehensive income (loss). For non-U.S. subsidiaries whose functional currency is the U.S. dollar, transactions that are denominated in foreign
68
Table of Contents
currencies have been remeasured in U.S. dollars, and any resulting gains and losses are reported in the accompanying consolidated statements of operations. Foreign currency transaction (losses) gains of $(0.7) million, $(0.2) million and $0.6 million, were included in other (expense) income, net during 2011, 2010 and 2009, respectively.
Cash, Cash Equivalents and Short-term Investments
Cash and cash equivalents consist of highly liquid fixed-income investments with original maturities of three months or less at the time of purchase, including money market funds. Short-term investments consist of readily marketable securities with a remaining maturity of more than three months from time of purchase. The Company’s short-term investments include securities with stated maturities of longer than twelve months which are classified as current assets as they are highly liquid and available to support current operations. The Company classifies all cash equivalents and short-term investments as “available for sale,” as these investments are free of trading restrictions. These marketable securities are carried at fair value, with the unrealized gains and losses, net of tax, reported as accumulated other comprehensive income and included as a separate component of stockholders’ equity. Gains and losses are recognized when realized. When the Company determines that an other-than-temporary decline in fair value has occurred, the amount of the decline that is related to a credit loss is recognized in earnings. Gains and losses are determined using the specific identification method. The Company had insignificant realized gains or losses in 2011 and none in 2010.
Accounts Receivable and Allowance for Doubtful Accounts
Accounts receivable consist of receivables from the Company’s customers and are stated at their carrying values net of an allowance for doubtful accounts. The Company evaluates the ongoing collectibility of its accounts receivable based on a number of factors such as the credit quality of its customers, the age of accounts receivable balances, collections experience and current economic conditions that may affect a customer’s ability to pay. In circumstances where the Company is aware of a specific customer’s inability to meet its financial obligations to the Company, a specific allowance for doubtful accounts is estimated and recorded, which reduces the recognized receivable to the estimated amount that management believes will ultimately be collected. Account balances are charged off against the allowance when it is probable that receivable will not be recovered.
The following are changes in the allowance for doubtful accounts during 2011, 2010 and 2009 (in thousands):
| December 31, | ||||||||||||
| 2011 | 2010 | 2009 | ||||||||||
| Balance, beginning of period |
$ | — | $ | 79 | $ | 673 | ||||||
| Additions |
32 | 76 | — | |||||||||
| Write-offs |
— | (155 | ) | (594 | ) | |||||||
|
|
|
|
|
|
|
|||||||
| Balance, end of period |
$ | 32 | $ | — | $ | 79 | ||||||
|
|
|
|
|
|
|
|||||||
Accrued Payables to Customers
For customer contracts that include both sales of customer service contracts and other account management services, the Company collects the gross amount of payment due from the end customers’ contracts and then remits such payment to the customer, net of the commissions and fees earned by the Company. An advance to customers is recorded in instances where the Company has remitted the net payment due to the customer before the receipt of the related gross amount due under the customer contract from the end customer. An accrued payables to customers is recorded by the Company for the net amount due to the customer when it has received the related gross payment from the end customer, but has not yet remitted the corresponding net payment to the customer. At December 31, 2011 and 2010, the Company did not have any active customer contracts that included both sales of customer service contracts and other account managed services.
69
Table of Contents
Property and Equipment
The Company records property and equipment at cost less accumulated depreciation and amortization. Depreciation is recorded using the straight-line method over estimated useful lives of seven years for office furniture and equipment, two to three years for computer hardware and two to five years for software. Leasehold improvements are amortized on a straight-line basis over the lesser of the lease term or the estimated useful life of the related assets, ranging from three to eight years.
Upon retirement or sale, the cost of assets and the related accumulated depreciation are removed from the accounts and any resulting gain or loss is credited or charged to the consolidated statement of operations. Repairs and maintenance costs are expensed as incurred.
Capitalized Internal-Use Software
Expenditures for software purchases and software developed or obtained for internal use are capitalized and amortized over a period of two to five years on a straight-line basis. For software developed or obtained for internal use, the Company capitalizes direct external costs associated with developing or obtaining internal-use software. In addition, the Company also capitalizes certain payroll and payroll-related costs for employees who are directly associated with the development of such applications. Costs associated with preliminary project stage activities, training, maintenance and all other post-implementation stage activities are expensed as incurred and are recorded in research and development on the accompanying consolidated statements of operations. Capitalized costs related to internal-use software under development are treated as construction-in-progress until the program, feature or functionality is ready for its intended use, at which time amortization commences.
Goodwill and Intangible Assets
In connection with an acquisition in 2003 the Company acquired certain intangible assets consisting of goodwill, customer contracts and related relationships, trade names and noncompete agreements in the NALA reporting unit. Goodwill is not amortized. Intangible assets are carried at cost, less accumulated amortization. Intangible assets are amortized using the straight-line method over estimated useful lives of six years for customer contracts and related relationships, and five years for trade name and noncompete agreements. As of December 31, 2009, the intangible assets were fully amortized.
Goodwill is tested for impairment annually in the fourth quarter of each fiscal year or whenever events or changes in circumstances indicate the carrying value of goodwill may not be recoverable. Triggering events that may indicate impairment include, but are not limited to, a significant adverse change in customer demand or business climate that could affect the value of an asset or a significant decrease in expected cash flows at a reporting unit. When impaired, the carrying value of goodwill is written down to fair value. In September 2011, the FASB approved changes to the goodwill impairment guidance which are intended to reduce the cost and complexity of the annual impairment test. The changes provide entities an option to perform a qualitative assessment to determine whether further impairment testing is necessary. The revised standard gives an entity the option to first assess qualitative factors to determine whether performing the current two-step test is necessary. If an entity believes, as a result of its qualitative assessment, that it is more-likely-than-not (i.e. > 50% chance) that the fair value of a reporting unit is less than its carrying amount, the quantitative impairment test will be required. Otherwise, no further testing will be required.
The revised guidance includes examples of events and circumstances that might indicate that a reporting unit’s fair value is less than its carrying amount. These include macro-economic conditions such as deterioration in the entity’s operating environment or industry or market considerations; entity-specific events such as increasing costs, declining financial performance, or loss of key personnel; or other events such as an expectation that a reporting unit will be sold or a sustained decrease in the stock price on either an absolute basis or relative to peers.
70
Table of Contents
The new qualitative indicators replace those currently used to determine whether an interim goodwill impairment test is required. The changes will be effective for annual and interim goodwill impairment tests performed for fiscal years beginning after December 15, 2011. However, earlier adoption is permitted. The Company has opted to early adopt this guidance for the year ended December 31, 2011.
If it is determined, as a result of the qualitative assessment, that it is more-likely-than-not that the fair value of a reporting unit is less than its carrying amount, the provisions of authoritative guidance require that the Company performs a two-step impairment test on goodwill. In the first step, the fair value of each reporting unit is compared to its carrying value. The second step (if necessary) measures the amount of impairment by applying fair-value-based tests to the individual assets and liabilities within each reporting unit.
Based on the Company’s results of its qualitative test for goodwill impairment, as of December 31, 2011, it believes that it is more-likely-than-not that the fair value of each NALA reporting unit is greater than its respective carrying value. There was no impairment of goodwill identified during 2011, 2010 and 2009.
Impairment of Long-Lived Assets
The Company’s long-lived assets consist of property and equipment, including internal-use software. The Company initiates its review of potential impairment whenever events or changes in circumstances indicate that the carrying amount of a long-lived asset may not be recoverable. Conditions that may indicate impairment include, but are not limited to, significant negative industry or economic trends which may affect operating income. Determination of recoverability of long-lived assets is based on an estimate of the undiscounted future cash flows resulting from the use of the asset and its eventual disposition. Measurement of an impairment loss for long-lived assets that management expects to hold and use is based on the difference between the fair value of the asset and its carrying value. Long-lived assets to be disposed of are reported at the lower of carrying amount or fair value, less costs to sell. No impairment charge was recorded for long-lived assets in 2011, 2010 or 2009.
Operating Leases
The Company’s operating lease agreements for office facilities include provisions for certain rent holidays, tenant incentives and escalations in the base price of the rent payment. The Company records rent holidays and rent escalations on a straight-line basis over the lease term and records the difference between expense and cash payments as deferred rent. The tenant incentives are recorded as deferred rent and amortized on a straight-line basis over the lease term. Deferred rent is included in other accrued liabilities on the accompanying consolidated balance sheets.
Deferred Debt Issuance Costs
The Company defers debt issuance costs, which consist primarily of bank and legal fees. Such costs related to the term loan (Note 8) are amortized using the effective-interest method over the term of the debt agreement. Costs related to the revolving credit facility are amortized using the straight-line method over the term of the credit facility. The amortization of deferred debt issuance costs is recorded as interest expense. Unamortized deferred debt issuance costs were $0.1 million and $0.3 million at December 31, 2011 and 2010, respectively. Amortization of deferred debt issuance costs was $0.2 million in each of the years 2011, 2010 and 2009. Estimated future amortization of deferred debt issuance costs expense will approximate $0.1 million in 2012.
Comprehensive Income (Loss)
Comprehensive income (loss) consists of two components, net income (loss) and other comprehensive income (loss). Other comprehensive income (loss) refers to revenue, expenses, gains and losses recorded as an element of equity but are excluded from net income (loss). The Company’s other comprehensive income (loss) consists of foreign currency translation adjustments from those subsidiaries not using the U.S. dollar as their functional currency and unrealized gains and losses on available-for-sale securities. The Company has disclosed accumulated comprehensive other income (loss) as a separate component of equity.
71
Table of Contents
Revenue Recognition
Substantially all of the Company’s revenue is generated from commissions earned from sales of renewals of maintenance, support and subscription contracts on behalf of its customers. Commissions are generally a fixed percentage of the overall sales value associated with the service revenue contracts sold by the Company on behalf of its customers. Revenue is recognized when persuasive evidence of an arrangement exists, services have been provided, the sales price is fixed or determinable and collectibility is reasonably assured from customers and no significant obligations remain unfulfilled by the Company. Customer contracts are used to determine the existence of an arrangement. Under the terms of the Company’s customer contracts, the Company’s service obligations are completed when the Company’s customers accept purchase orders from their end customers and no significant post-delivery obligations of the Company remain unfulfilled. The Company assesses whether the fee is fixed or determinable based on the payment terms with customers and whether any part of the fee is subject to refund or adjustment. The Company assesses collectibility based primarily on the creditworthiness of customers as determined by credit checks and analyses as well as the payment history of its customers. Commission earned from customers is recognized on a net basis primarily because the Company is not a party to the contracts between the customers and the end customers and does not provide actual services to the end customers. Also, the Company does not set the price, terms or scope of services in the contracts with end customers.
Some customer agreements include performance-based commissions based on attainment of certain performance targets, including the achievement of contract renewal rates in excess of specified targets. Certain customer arrangements also entitle the Company to fees and adjustments which are invoked in various circumstances, including the failure of customers to provide the Company with a specified minimum value of service contracts to sell on their behalf. The Company’s contracts generally contain termination fees should customers elect to cancel agreements prior to their expiration. Revenue related to commission incentives and early termination fees are recorded in the period when the performance criteria have been met, or the triggering event has occurred, and the amount earned is not subject to claw-back or future adjustment. Some customers may cancel their contracts if the Company is out of compliance with certain performance obligations, as defined in the relevant customer agreement. In addition, the Company estimates an allowance for potential cancellation of service contracts and unpaid invoices from end customers, which is calculated based on historical results and the aging of the outstanding invoices and constitutes a reduction of the revenue recorded upon the sale of service contracts.
For multiple element arrangements entered into prior to January 1, 2011 including deliverables such as sales of service contracts, account management services and subscriptions to the Company’s service revenue management solutions, the Company separates each revenue stream at the inception of the arrangement on a relative fair value basis, provided that each service element meets the criteria for treatment as a separate unit of accounting. An item is considered a separate unit of accounting if it has value to the customer on a stand-alone basis and there is objective and reliable fair value of the undelivered services. The fair value of the undelivered elements is determined by the price charged when the element is sold separately, or in cases where the item is not sold separately, by using other acceptable objective evidence.
For a limited number of customer arrangements, the Company is responsible for selling service contracts and for providing account management services such as invoicing and cash collections from end customers. Under these arrangements, revenue is recognized when the service has been delivered and the fee is fixed or determinable, which is upon receipt of cash payment from the end customer. Revenue is also reported net of sales taxes collected from end customers and remitted to state and local government authorities. As of March 31, 2011, the Company no longer had any arrangement where we were responsible for selling service contracts and the related invoicing and cash collections from end customers. Given the Company’s current contractual arrangements, the adoption of this standard did not have a material impact on the Company’s consolidated financial statements.
72
Table of Contents
For a limited number of customer engagements that include sales of service contracts and subscription fees to the Company’s hosted technology platform, fees earned for selling service contracts are recognized as revenue as services are performed, while hosting revenue is recognized ratably over the subscription term, which term is generally one year.
Effective January 1, 2011, the Company adopted on a prospective basis an accounting standard issued by the Financial Accounting Standards Board (“FASB”) that changed the accounting for arrangements with multiple deliverables. The new standard requires that the company allocate arrangement consideration at the inception of an arrangement to all of its deliverables based on their relative selling prices. When vendor-specific objective evidence of selling price (VSOE) and third-party evidence of selling price (TPE) are not available for all deliverables, the Company uses best estimated selling prices (BESP) in our allocation of arrangement consideration.
Sales Commissions
Sales commissions earned by the Company’s outside sales representatives are generally paid in two or three installments with an initial payment shortly after entering into a new customer agreement and a final payment approximately twelve months after the Company begins to sell service contracts on behalf of the customer. Commission payments are contingent upon continued employment by the sales representatives and subject to adjustments during the service period based on the estimated value of service contracts received from the customer for sale. Commission expense is recognized over the requisite service period, generally twelve to fourteen months. At the time of each payment, sales commission expense recorded is equal to or in excess of each payment.
Advertising Costs
Advertising is expensed as incurred as a component of sales and marketing expenses on the consolidated statement of operations. Advertising expense was $0.6 million during 2011 and insignificant for 2010 and 2009.
Income Taxes
The parent company, ServiceSource International, Inc., formerly known as ServiceSource International LLC, filed its income tax return as a partnership for federal and state income tax purposes for periods prior to March 1, 2011. For all such prior periods, the LLC recognized no federal, state, or local income taxes, as the members of the LLC, and not the LLC itself, were subject to income tax on their allocated share of the LLC’s earnings. The Company’s taxable subsidiaries are included in the provision for income taxes in the accompanying consolidated financial statements as further described below. The LLC was subject to an annual California LLC registration fee based on revenue. The Company generally makes an annual distribution to its limited liability company members for their estimated tax liability on allocated net income under the terms of the limited liability company agreement.
Income taxes for the parent company for periods from and after March 1, 2011 and for the Company’s taxable subsidiaries, consisting of ServiceSource Delaware, Inc, (formerly known as ServiceSource International, Inc.) and several subsidiaries formed in foreign jurisdictions, are accounted for using an asset and liability method, which requires the recognition of taxes payable or refundable for the current year and deferred tax assets and liabilities for the expected future tax consequences of temporary differences that currently exist between the tax basis and the financial reporting basis of the Company’s taxable subsidiaries’ assets and liabilities using the enacted tax rates in effect for the year in which the differences are expected to reverse. The effect of a change in tax rates on deferred tax assets and liabilities is recognized in operations in the period that includes the enactment date. The measurement of deferred tax assets is reduced, if necessary, by the amount of any tax benefits that, based on available evidence, are not expected to be realized.
The Company accounts for unrecognized tax benefits using a more-likely-than-not threshold for financial statement recognition and measurement of tax positions taken or expected to be taken in a tax return. The
73
Table of Contents
Company establishes reserves for tax-related uncertainties based on estimates of whether, and the extent to which, additional taxes will be due. The Company records an income tax liability, if any, for the difference between the benefit recognized and measured and the tax position taken or expected to be taken on the Company’s tax returns. To the extent that the assessment of such tax positions changes, the change in estimate is recorded in the period in which the determination is made. The reserves are adjusted in light of changing facts and circumstances, such as the outcome of a tax audit. The provision for income taxes includes the impact of reserve provisions and changes to reserves that are considered appropriate. As of December 31, 2011, 2010, and 2009 the Company has not recorded any liabilities for unrecognized tax benefits.
In general, it is the practice and intention of the Company to permanently reinvest the undistributed earnings of its non-US subsidiaries. Should the Company repatriate undistributed earnings, such amounts become subject to U.S. taxation giving recognition to current tax expense and foreign tax credits upon remittance of dividends and under certain other circumstances. As of December 31, 2011, 2010 and 2009 the Company did not have any significant undistributed earnings from its foreign subsidiaries.
Effective March 1, 2011, the parent company elected to be treated as a corporation under Subchapter C of Chapter 1 of the United States Internal Revenue Code, and therefore became subject to federal and state tax expense beginning March 1, 2011. As a result of this tax election, the Company recorded a net deferred tax asset and a one-time non-cash tax benefit of $20.7 million. On March 24, 2011, the Company merged with two of its corporate equity holders. The Company recorded an additional deferred tax asset of $8.1 million and a corresponding adjustment to paid-in capital as a result of the merger. Prior to March 1, 2011, the Company was subject to income tax only at certain taxable subsidiaries.
The parent company filed tax returns as a partnership for the period from January 1, 2011 through February 28, 2011. The parent company will file tax returns as a corporation for the period from March 1, 2011 through December 31, 2011. The Company’s provision for income taxes for interim reporting periods is based on an estimate of the effective tax rate for each of the periods described above. Significant management judgment is required in projecting ordinary income (loss) in order to determine the Company’s estimated effective tax rate.
The Company files U.S. federal and state and foreign income tax returns in jurisdictions with varying statutes of limitations. In the normal course of business the Company is subject to examination by taxing authorities throughout the world. These audits include questioning the timing and amount of deductions, the allocation of income among various tax jurisdictions and compliance with federal, state, local and foreign tax laws. The Company is not currently undergoing any examination of its income tax returns. The 2007 through 2011 tax years generally remain subject to examination by federal, state and foreign tax authorities. As of December 31, 2011, the Company did not have any unrecognized tax benefits that if recognized would impact the annual effective tax rate. It is difficult to predict the final timing and resolution of any particular uncertain tax position. Based on the Company’s assessment of many factors, the Company does not expect that changes in the liability for unrecognized tax benefits for the next twelve months will have a significant impact on the Company’s consolidated financial position or results of operations.
Management assessed the realizability of deferred tax assets and determined that based on the available evidence, including a history of taxable income and estimates of future taxable income, it is more likely than not that the deferred tax assets will be realized. The Company will continue to evaluate its ability to realize deferred tax assets on a quarterly basis. Significant management judgment is required in determining the provision for income taxes and deferred tax assets and liabilities. In the event that actual results differ from these estimates the Company will adjust these estimates in future periods and, the Company may need to adjust the effective rate for the current year.
Share/Stock-Based Compensation
The Company measures and recognizes compensation expense for all share-based awards made to employees and directors based on estimated fair values. The fair value of employee and director options is
74
Table of Contents
estimated on the date of grant using the Black-Scholes option-pricing model. The value of awards that are ultimately expected to vest is recognized as expense over the requisite service periods. Since share-based compensation expense is based on awards ultimately expected to vest, it is reduced for expected forfeitures.
For awards that are expected to result in a tax deduction, a deferred tax asset is established as the Company recognizes compensation expense. If the tax deduction exceeds the cumulative recorded compensation expense, the tax benefit associated with the excess deduction is considered a windfall benefit. The excess tax benefit from share compensation plans is recorded in members’ equity and classified as a financing cash flow on the consolidated statements of cash flows. The Company has elected to use the short-cut method for determining the historical pool of windfall tax benefits that accumulated prior to January 1, 2006.
Net Income (Loss) Per Common Share
Basic net income (loss) per common share is computed using the weighted-average number of common shares outstanding during the period. Diluted net income (loss) per common share is computed using the weighted-average number of common shares and potentially dilutive common shares outstanding during the period. Potential diluted shares include the dilutive effect of in-the-money options. The dilutive effect of such equity awards is calculated based on the average share price for each period using the treasury-stock method. Under the treasury-stock method, the amount the employee must pay for exercising options, the amount of compensation cost for future service that the Company has not yet recognized, and the amount of tax benefits that would be recorded in members’ equity when the award becomes deductible, are collectively assumed to be used to repurchase shares.
Recent Accounting Pronouncements
In 2011, the Financial Accounting Standards Board (“FASB”) issued new accounting guidance that amends some fair value measurement principles and disclosure requirements. The new guidance states that the concepts of highest and best use and valuation premise are only relevant when measuring the fair value of nonfinancial assets and prohibits the grouping of financial instruments for purposes of determining their fair values when the unit of account is specified in other guidance. The Company will adopt this accounting standard upon its effective date for periods beginning on or after December 15, 2011, and does not anticipate that this adoption will have a significant impact on its financial position or results of operations.
In 2011, the FASB issued new disclosure guidance related to the presentation of the Statement of Comprehensive Income. This guidance eliminates the current option to report other comprehensive income and its components in the consolidated statement of stockholders’ equity. The requirement to present reclassification adjustments out of accumulated other comprehensive income on the face of the consolidated statement of income has been deferred. The Company will adopt this accounting standard upon its effective date for periods beginning on or after December 15, 2011, and this adoption will not have any impact on its financial position or results of operations but will impact the financial statement presentation.
Reclassifications
Certain amounts in the financial statements for the prior periods have been reclassified to conform to the current presentation. These reclassifications did not change the previously reported net loss, net change in cash and cash equivalents or stockholders’/ members’ equity.
75
Table of Contents
3. Net Income (Loss) Per Common Share
The basic and diluted net income (loss) per share calculations are presented below (in thousands, except for per share amounts):
| Years Ended December 31, | ||||||||||||
| 2011 | 2010 | 2009 | ||||||||||
| Basic net income (loss) per common share |
||||||||||||
| Net income (loss) |
$ | 15,111 | $ | (2,567 | ) | $ | 10,375 | |||||
|
|
|
|
|
|
|
|||||||
| Weighted-average common shares outstanding(1) |
66,656 | 57,284 | 56,750 | |||||||||
|
|
|
|
|
|
|
|||||||
| Basic net income (loss) per share |
$ | 0.23 | $ | (0.04 | ) | $ | 0.18 | |||||
|
|
|
|
|
|
|
|||||||
| Years Ended December 31, | ||||||||||||
| 2011 | 2010 | 2009 | ||||||||||
| Diluted net income (loss) per common share |
||||||||||||
| Net income (loss) used to determine diluted earnings per common shares |
$ | 15,111 | $ | (2,567 | ) | $ | 10,375 | |||||
|
|
|
|
|
|
|
|||||||
| Weighted-average common shares outstanding used in basic calculation |
66,656 | 57,284 | 56,750 | |||||||||
| Adjustment for dilutive potential shares |
6,929 | — | 2,162 | |||||||||
|
|
|
|
|
|
|
|||||||
| Weighted-average common shares for diluted net income (loss) per share |
73,585 | 57,284 | 58,912 | |||||||||
|
|
|
|
|
|
|
|||||||
| Diluted net income (loss) per share(1) |
$ | 0.21 | $ | (0.04 | ) | $ | 0.18 | |||||
|
|
|
|
|
|
|
|||||||
| (1) | Since the Company reported a net loss for the year ended December 31, 2010 there was no dilutive effect on net loss per common share. Therefore, both basic and diluted net loss per common share were $(0.04) for 2010. |
4. Cash, cash equivalents and short-term investments
Cash equivalents consist of highly liquid fixed-income investments with original maturities of three months or less at the time of purchase, including money market funds. Short-term investments consist of readily marketable securities with a remaining maturity of more than three months from time of purchase. The Company classifies all of its cash equivalents and short-term investments as “available for sale,” as these investments are free of trading restrictions. These marketable securities are carried at fair value, with the unrealized gains and losses, net of tax, reported as accumulated other comprehensive income and included as a separate component of stockholders’ equity. Gains and losses are recognized when realized. When the Company determines that an other-than-temporary decline in fair value has occurred, the amount of the decline that is related to a credit loss is recognized in earnings. Gains and losses are determined using the specific identification method. The Company had insignificant realized gains or losses in 2011.
76
Table of Contents
Cash and cash equivalents and short-term investments consisted of the following as of December 31, 2011 (in thousands):
| Amortized Cost |
Unrealized Gains |
Unrealized Losses |
Estimated Fair Value |
|||||||||||||
| Cash |
$ | 59,033 | $ | — | $ | — | $ | 59,033 | ||||||||
|
|
|
|
|
|
|
|
|
|||||||||
| Cash equivalents: |
||||||||||||||||
| Money market mutual funds |
4,201 | — | — | 4,201 | ||||||||||||
| Commercial paper |
2,749 | — | — | 2,749 | ||||||||||||
|
|
|
|
|
|
|
|
|
|||||||||
| Total cash equivalents |
6,950 | — | — | 6,950 | ||||||||||||
|
|
|
|
|
|
|
|
|
|||||||||
| Total cash and cash equivalents |
65,983 | — | — | 65,983 | ||||||||||||
|
|
|
|
|
|
|
|
|
|||||||||
| Short-term investments: |
||||||||||||||||
| Certificate of deposit |
750 | — | (4 | ) | 746 | |||||||||||
| Municipal securities |
33,568 | 30 | (6 | ) | 33,592 | |||||||||||
| Commercial paper |
3,645 | 1 | (1 | ) | 3,645 | |||||||||||
| Corporate bonds |
4,910 | 3 | (14 | ) | 4,899 | |||||||||||
|
|
|
|
|
|
|
|
|
|||||||||
| Total short-term investments |
42,873 | 34 | (25 | ) | 42,882 | |||||||||||
|
|
|
|
|
|
|
|
|
|||||||||
| Cash, cash equivalents and short-term investments |
$ | 108,856 | $ | 34 | $ | (25 | ) | $ | 108,865 | |||||||
|
|
|
|
|
|
|
|
|
|||||||||
The following table summarizes the cost and estimated fair value of short-term fixed income securities classified as short-term investments based on stated maturities as of December 31, 2011:
| Amortized Cost |
Estimated Fair Value |
|||||||
| Less than 1 year |
$ | 30,014 | $ | 30,011 | ||||
| Due in 1 to 3 years |
12,858 | 12,871 | ||||||
|
|
|
|
|
|||||
| Total |
$ | 42,873 | $ | 42,882 | ||||
|
|
|
|
|
|||||
As of December 31, 2011, the Company did not consider any of its investments to be other-than-temporarily impaired.
5. Fair value of financial instruments
The Company measures certain financial instruments at fair value on a recurring basis. FASB has established a hierarchy, which consists of three levels, for disclosure of the inputs used to determine the fair value of its financial instruments.
Level 1 valuations are based on quoted prices in active markets for identical assets or liabilities.
Level 2 valuations are based on inputs that are observable, either directly or indirectly, other than quoted prices included within Level 1. Such inputs used in determining fair value for Level 2 valuations include quoted prices in active markets for similar assets or liabilities, quoted prices for identical or similar assets or liabilities in markets that are not active, or other inputs that are observable or can be corroborated by observable market data for substantially the full term of the assets or liabilities.
Level 3 valuations are based on information that is unobservable and significant to the overall fair value measurement.
77
Table of Contents
All of the Company’s cash equivalents and short-term investments are classified within Level 1 or Level 2. The fair values of these financial instruments were determined using the following inputs at December 31, 2011 (in thousands):
| Fair Value Measurements at December 31, 2011 Using |
||||||||||||||||
| Total | Quoted Prices in Active Markets for Identical Assets (Level 1) |
Significant Other Observable Inputs (Level 2) |
Significant Unobservable Inputs (Level 3) |
|||||||||||||
| Description |
||||||||||||||||
| Cash equivalents: |
||||||||||||||||
| Money market mutual funds |
$ | 4,201 | $ | 4,201 | $ | — | $ | — | ||||||||
| Commercial paper |
2,749 | — | 2,749 | — | ||||||||||||
|
|
|
|
|
|
|
|
|
|||||||||
| Total cash equivalents |
6,950 | 4,201 | 2,749 | — | ||||||||||||
|
|
|
|
|
|
|
|
|
|||||||||
| Short-term investments: |
||||||||||||||||
| Certificate of deposit |
746 | — | 746 | — | ||||||||||||
| Municipal securities |
33,592 | — | 33,592 | — | ||||||||||||
| Commercial paper |
3,645 | — | 3,645 | — | ||||||||||||
| Corporate bonds |
4,899 | — | 4,899 | — | ||||||||||||
|
|
|
|
|
|
|
|
|
|||||||||
| Total short-term investments |
42,882 | — | 42,882 | — | ||||||||||||
|
|
|
|
|
|
|
|
|
|||||||||
| Cash equivalents and short-term investments |
$ | 49,832 | $ | 4,201 | $ | 45,631 | $ | — | ||||||||
|
|
|
|
|
|
|
|
|
|||||||||
The Company did not have any financial liabilities measured at fair value on a recurring basis as of December 31, 2011 or 2010.
6. Property and Equipment, Net
Property and equipment balances were comprised of the following (in thousands):
| December 31, | ||||||||
| 2011 | 2010 | |||||||
| Computers and equipment |
$ | 11,562 | $ | 7,765 | ||||
| Software |
19,487 | 13,169 | ||||||
| Furniture and fixtures |
5,879 | 5,503 | ||||||
| Leasehold improvements |
4,957 | 2,898 | ||||||
|
|
|
|
|
|||||
| 41,885 | 29,335 | |||||||
| Less: accumulated depreciation and amortization |
(23,187 | ) | (13,960 | ) | ||||
|
|
|
|
|
|||||
| 18,698 | 15,375 | |||||||
| Construction in progress |
8,142 | 4,043 | ||||||
|
|
|
|
|
|||||
| $ | 26,840 | $ | 19,418 | |||||
|
|
|
|
|
|||||
Depreciation expense related to property and equipment was $9.4 million, $6.1 million and $3.5 million during 2011, 2010 and 2009, respectively.
Property and equipment at December 31, 2011 and 2010 includes $3.3 million and $3.1 million, respectively, acquired under capital lease agreements. Accumulated amortization under capital leases totaled $1.7 million and $1.1 million at December 31, 2011 and 2010, respectively.
The Company capitalized costs of $6.0 million, $4.7 million and $5.0 million, during 2011, 2010 and 2009, respectively, related to internal-use software. As of December 31, 2011 and 2010, the carrying value of capitalized costs related to internal-use software, net of accumulated amortization, was $9.0 million and $9.6 million respectively. Amortization of capitalized costs related to internal-use software was $3.9 million, $2.5 million and $1.1 million during 2011, 2010 and 2009, respectively.
78
Table of Contents
7. Other Accrued Liabilities
Other accrued liabilities balances were comprised of the following (in thousands):
| December 31, | ||||||||
| 2011 | 2010 | |||||||
| Accrued professional fees |
$ | 944 | $ | 2,485 | ||||
| Amounts refundable to end customers |
582 | 2,083 | ||||||
| Deferred revenue |
593 | 151 | ||||||
| Deferred rent obligations |
734 | 477 | ||||||
| Employee-related |
379 | 353 | ||||||
| Other (includes ESPP contributions of $1,106 at December 31, 2011) |
4,407 | 2,026 | ||||||
|
|
|
|
|
|||||
| $ | 7,639 | $ | 7,575 | |||||
|
|
|
|
|
|||||
8. Long-Term Debt
Long-term debt balances were comprised of the following (in thousands):
| December 31, | ||||||||
| 2011 | 2010 | |||||||
| Current: |
||||||||
| Term loan |
$ | — | $ | 1,500 | ||||
| Capital lease obligations |
706 | 779 | ||||||
|
|
|
|
|
|||||
| 706 | 2,279 | |||||||
| Non-current: |
||||||||
| Term loan |
— | 13,959 | ||||||
| Capital lease obligations |
958 | 980 | ||||||
|
|
|
|
|
|||||
| 958 | 14,939 | |||||||
|
|
|
|
|
|||||
| Total long-term debt |
$ | 1,664 | $ | 17,218 | ||||
|
|
|
|
|
|||||
Term Loan and Revolving Credit Facility
At December 31, 2011, the Company had a revolving credit facility which expires in February 2013 and provides borrowings of up to $20 million including amounts under letters of credit. Amounts outstanding on the facility at December 31, 2011 consisted of a letter of credit of $1.1 million as required under an operating lease agreement for office space. The Facility has a non-use fee of 0.50% per annum based on the average monthly available borrowing base. Borrowings on the facility, including amounts outstanding under letter of credit, bear interest at either: (i) the LIBOR Rate plus an additional margin; or (ii) the Base Rate (i.e., prime rate) plus an additional margin. At December 31, 2011 the interest rate for borrowings under the facility was 5.0 %.
The revolving credit facility provides the Company the option to terminate the facility at no cost; prior to February 25, 2012, the Company was subject to an early termination fee of $0.2 million.
The credit facility is collateralized by substantially all of the Company’s assets and has certain financial covenants which include a maximum consolidated leverage ratio and a minimum liquidity. At December 31, 2011, the Company was in compliance with its borrowing covenants.
Entered into in February 2011, the New Facility amended a previous credit arrangement wherein $15.5 million of term loans were converted to the new revolving credit facility which initially provided for maximum borrowings of up to $30 million. During the first quarter of 2011, and an additional $7.9 million was drawn
79
Table of Contents
against the credit facility in connection with payments to Oracle/Sun in connection with the termination of our engagements with Sun Microsystems and to fund the Company’s operations. On March 30, 2011, net proceeds from our initial public offering were used to prepay $23.4 million borrowed under the credit facility. In April 2011, as provided for in the borrowing agreement, the Company elected to reduce the maximum borrowing under the facility to $20 million.
Capital Leases
The Company has capital lease agreements that are collateralized by the underlying property and equipment and expire through September 2019. The weighted-average imputed interest rates for the capital lease agreements were 3.6%, 5.6% and 5.9% at December 31, 2011, 2010 and 2009, respectively.
The future contractual maturities of capital lease obligations as of December 31, 2011 are as follows (in thousands):
| 2012 |
$ | 706 | ||
| 2013 |
325 | |||
| 2014 |
267 | |||
| 2015 |
74 | |||
| 2016 |
76 | |||
| Thereafter |
216 | |||
|
|
|
|||
| $ | 1,664 | |||
|
|
|
9. Commitments and Contingencies
Operating Leases
The Company leases its office space and certain equipment under noncancelable operating lease agreements with various expiration dates through August 2018. As of December 31, 2011, future minimum payments under operating leases were as follows (in thousands):
| 2012 |
$ | 7,745 | ||
| 2013 |
6,138 | |||
| 2014 |
5,206 | |||
| 2015 |
4,031 | |||
| 2016 |
3,330 | |||
| Thereafter |
7,190 | |||
|
|
|
|||
| $ | 33,640 | |||
|
|
|
Rent expense during 2011, 2010 and 2009, was $6.5 million, $5.1 million, and $3.8 million, respectively. In February 2010, the Company recorded a $0.4 million charge to terminate an office lease prior to its expiration.
Other Matters
The Company may be subject to litigation or other claims in the normal course of business. In the opinion of management, the Company’s ultimate liability, if any, related to pending or threatened litigation or claims would not materially affect its consolidated financial position, results of operations or cash flows.
10. Stockholders’/ Members’ Equity
Members’ equity consists of one class of common shares. Income is allocated pro rata to members as defined in the limited liability company agreement. The holder of each common share is entitled to one vote. Members are entitled to mandatory distributions for their respective income tax expense resulting from the operations of the LLC and other distributions as and when declared by the board of directors.
80
Table of Contents
The Company repurchased 0 and 86,157 shares during 2011 and 2010, at the then estimated fair value. All of the acquired shares are held as treasury shares on the accompanying statements of Stockholders’/ members’ equity and comprehensive income (loss).
Other than distributions upon a redemption or liquidation event, as defined in the Company’s limited liability company Agreement, funds and assets of the Company determined by the Company’s board of directors to be available for distribution shall be distributed to all of the members, pro rata in proportion to the number of vested common shares held by each member.
On March 25, 2011, the Company sold 9,791,020 shares of newly-issued common stock in the IPO, raising net proceeds of approximately $87.7 million, after deducting the underwriting discount and expenses incurred related to the IPO.
On August 3, 2011, the Company closed a secondary public offering of 10,350,000 shares of its common stock, which included 1,372,061 shares of common stock sold by the Company and 8,977,939 shares of common stock sold by the selling stockholders. The net proceeds from the offering to the Company were $23.0 million.
In conjunction with the conversion from a limited liability company to a Delaware corporation described in Note 1, the Company’s certificate of incorporation authorized 1,000,000,000 shares of $0.0001 par value common stock and 20,000,000 shares of $0.0001 par value preferred stock. No preferred stock was issued or outstanding as of December 31, 2011.
11. Share-Based Compensation
Share Option Plans
The Company historically granted options through two plans, the Company’s 2004 Omnibus Share Plan and the 2008 Share Option Plan (collectively, the “2004 and 2008 Option Plans”). Concurrent with the effectiveness of the Company’s registration statement on Form S-1 on March 24, 2011 for ServiceSource’s IPO, the Company’s 2011 Equity Incentive Plan (the “2011 Plan”) became effective and all remaining common stock reserved for future grant or issuance under the 2004 and 2008 Options Plan were added to the 2011 Plan. Shares of common stock reserved for issuance under the 2011 Plan consist of (a) 5,760,000 shares of common stock initially available for future grants under the 2011 Plan plus (b) 2,584,015 shares of common stock previously reserved but unissued under the 2004 and 2008 Option Plans that are now available for issuance under the 2011 Plan. To the extent outstanding awards under the 2004 and 2008 Option Plans are forfeited or lapse unexercised and would otherwise have been returned to the share reserves under the 2004 and 2008 Option Plans, the shares of common stock subject to such awards instead will be available for future issuance under the 2011 Plan. At the end of each fiscal year, the share reserve will increase automatically by an amount equal to 4% outstanding shares as of the end of that most recently completed fiscal year or 3,840,000 shares, whichever is less. The Company’s board of directors and, as delegated to its compensation committee, administers the 2011 Plan and has authority to determine the directors, officers, employees and consultants to whom options or restricted stock may be granted, the option price or restricted stock purchase price, the timing of when each share is exercisable and the duration of the exercise period and the nature of any restrictions or vesting periods applicable to an option or restricted stock grant.
Under the 2011 Plan, options granted are generally subject to a four-year vesting period whereby options become 25% vested after a one-year period and the remainder then vests monthly through the end of the vesting period. Vested options may be exercised up to ten years from the vesting commencement date, as defined in the 2011 Option Plan. Vested but unexercised options expire three months after termination of employment with the Company. The restricted stock units typically vest over four years with a yearly cliff contingent upon employment with the Company on the dates of vest.
There were no significant modifications or repurchases in 2011 or 2009. In June 2010, the Company modified the vesting of 260,416 share options granted to one employee such that the cancellation of the vested
81
Table of Contents
shares occurred 12 months after the employee terminated with the Company. This transaction was accounted for as a modification and total incremental compensation cost resulting from the modification amounted to $0.1 million.
The Company has elected to recognize the compensation cost of all share-based awards on a straight-line basis over the vesting period of the award. Further, the Company applied an estimated forfeiture rate to unvested awards when computing the share compensation expenses. The Company estimated the forfeiture rate for unvested awards based on its historical experience on employee turnover behavior and other factors during the preceding three calendar years.
Employee Stock Purchase Plan
In February 2011, the Company’s board of directors approved the 2011 Employee Stock Purchase Plan, under which 900,000 shares have been reserved for issuance. The 2011 Employee Stock Purchase Plan contains successive six-month offering periods and the share price of stock purchased under the plan is 85% of the lower of the fair value of the common stock either at the beginning or the end of the period. At the end of each fiscal year, the share reserve will increase automatically by an amount equal to 1% outstanding shares as of the end of that most recently completed fiscal year or 1,500,000 shares, whichever is less.
Concurrent with the effectiveness of the Company’s registration statement on Form S-1 on March 24, 2011 for ServiceSource’s IPO, the Company’s 2011 Employee Stock Purchase Plan (the “ESPP”) became effective and is intended to qualify under Section 423 of the Internal Revenue Code of 1986. Under the ESPP, employees are eligible to purchase common stock through payroll deductions of up to 10% of their eligible compensation, subject to any plan limitations. The purchase price of the shares on each purchase date is equal to 85% of the lower of the fair market value of the Company’s common stock on the first and last trading days of each six-month offering period.
The Company estimates the fair value of purchase rights under the ESPP using the Black-Scholes valuation model. The fair value of each purchase right under the ESPP was estimated on the date of grant using the Black-Scholes option valuation model and the straight-line attribution approach with the following weighted-average assumptions:
| Period from March 24, 2011 to December 31, 2011 | ||
| Expected term (in years) |
0.39-0.50 | |
| Expected volatility |
36%-45% | |
| Risk-free interest rate |
0.18%-0.07% | |
| Expected dividend yield |
— |
As of December 31, 2011, 89,885 shares had been issued under the ESPP and 810,115 shares were available for future issuance. The ESPP provides that additional shares are reserved under the plan annually on the first day of each fiscal year in an amount equal to the lesser of (i) 1.5 million shares, (ii) one percent of the outstanding shares of common stock on the last day of the immediately preceding fiscal year, or (iii) an amount determined by the board of directors and/or the compensation committee of the board of directors.
Stock Awards Issued to Non Employees
During 2011 and 2010, the Company granted stock options to purchase 10,000 and 25,000 common shares, respectively, to non employees for professional services at exercise prices of $6.20 and $4.95 per share. Stock-based compensation expense related to options granted to non employees was $0.1 million during 2011 and 2010. The weighted-average remaining contractual terms at December 31, 2011 for the two options grants was 8.9 years and 0 years, respectively.
82
Table of Contents
Determining Fair Value of Share/Stock Options and Awards
The estimated fair value of stock options and awards granted during 2011, 2010 and 2009, was approximately $27.1 million, $20.5 million, and $7.7 million, respectively. The fair value of the share options was estimated by using the Black-Scholes option- pricing model, which takes into account inputs such as the exercise price, the value of the underlying common shares at the grant date, expected term, expected volatility, risk-free interest rate and dividend yield. The fair market value of each grant of options during 2011, 2010 and 2009 was determined by the Company using the methods and assumptions discussed below. The Company stratifies its population of outstanding share options into two relatively homogeneous groups to estimate the expected term and forfeiture rate of options grants. Each of these inputs is subjective and generally requires significant judgment to determine.
Expected Term—The expected term represents the period that the Company’s share-based awards are expected to be outstanding. The Company calculated the expected term of share options using four data points: options exercised, options expired, options forfeited and options outstanding. The weighted-average of the four data points were used to calculate the expected term.
Expected Volatility—The expected volatility was based on the historical stock volatility of several of the Company’s self-designated publicly listed comparable companies over a period equal to the expected terms of the options, as the Company does not have any trading history to use the volatility of its own common shares.
Risk-Free Interest Rate—The risk-free interest rate was based on the implied yield on U.S. Treasury zero-coupon issues for each option grant date with maturities approximately equal to the option’s contractual term.
Expected Dividend Yield—The Company has not paid dividends on its common shares nor does it expect to pay dividends in the foreseeable future beyond annual tax distributions to LLC members.
Forfeiture Rate—The Company estimated its forfeiture rate based on an analysis of its actual forfeitures and will continue to evaluate the adequacy of the forfeiture rate based on actual forfeiture experience, analysis of employee turnover behavior, and other factors. The impact from a forfeiture-rate adjustment will be recognized in full in the period of adjustment, if the actual number of future forfeitures differs from that estimated by the Company.
Fair Value of Common Shares—Prior to the Company’s initial public offering in late March 2011, the fair value of common shares underlying the share options was determined by the board of directors. As there had been no public market for the Company’s common shares, the board of directors has determined the fair value of the common shares at the time of grant of the option by considering a number of objective and subjective factors, including valuation of comparable companies, the probability-weighted expected return under possible future events, such as an initial public offering, a strategic merger or sale, or remaining a private company, the Company’s operating and financial performance, the lack of liquidity of capital share and general and industry specific economic outlook, amongst other factors. The board of directors also considers work performed by valuation specialists engaged by the Company to determine the valuation of its common shares.
The following table reflects the weighted-average assumptions for options grants during 2011, 2010 and 2009:
| Years Ended December 31, | ||||||
| 2011 | 2010 | 2009 | ||||
| Expected term (in years) |
5.26 | 5.4 | 4.8 | |||
| Expected volatility |
50% | 54% | 56% | |||
| Risk-free interest rate |
1.50% | 1.75% - 2.43% | 2.17% - 2.68% | |||
| Expected dividend yield |
— | — | — | |||
83
Table of Contents
Option activity under the Option Plans for 2011, 2010 and 2009 was as follows (shares and aggregate intrinsic value in thousands):
| Options Outstanding | Restricted Stock Outstanding |
|||||||||||||||
| Shares Available for Grant |
Number of Shares |
Weighted- Average Exercise Price |
Number of Shares | |||||||||||||
| Outstanding—January 1, 2009 |
11,454 | 10,307 | 3.27 | — | ||||||||||||
| Granted |
(3,650 | ) | 3,650 | 4.35 | — | |||||||||||
| Exercised |
— | (459 | ) | 1.27 | — | |||||||||||
| Forfeited |
997 | (997 | ) | 3.13 | — | |||||||||||
|
|
|
|
|
|||||||||||||
| Outstanding—December 31, 2009 |
8,801 | 12,501 | 3.67 | — | ||||||||||||
| Granted |
(6,994 | ) | 6,994 | 5.11 | — | |||||||||||
| Exercised |
— | (707 | ) | 0.79 | — | |||||||||||
| Forfeited |
1,064 | (1,065 | ) | 4.25 | — | |||||||||||
|
|
|
|
|
|||||||||||||
| Outstanding—December 31, 2010 |
2,871 | 17,723 | 4.32 | — | ||||||||||||
| Additional shares reserved under the 2011 Equity Incentive Plan |
5,760 | — | — | — | ||||||||||||
| Granted |
(2,996 | ) | 2,186 | 13.44 | 810 | |||||||||||
| Exercised |
— | (3,808 | ) | 3.75 | — | |||||||||||
| Forfeited |
774 | (766 | ) | 5.58 | (8 | ) | ||||||||||
|
|
|
|
|
|
|
|||||||||||
| Outstanding—December 31, 2011 |
6,409 | 15,335 | 5.70 | 802 | ||||||||||||
|
|
|
|
|
|
|
|||||||||||
| Number of Shares |
Weighted- Average Exercise Price |
Weighted- Average Remaining Contractual Life (Years) |
Aggregate Intrinsic Value |
|||||||||||||
| Options vested and expected to vest—December 31, 2011 |
14,880 | $ | 5.62 | 7.4 | $ | 151,313 | ||||||||||
| Options exercisable—December 31, 2011 |
8,040 | 4.12 | 6.4 | 92,992 | ||||||||||||
The weighted-average grant date fair value of options granted during 2011, 2010 and 2009 was $6.53, $2.93 and $2.12 respectively. The aggregate intrinsic value of options exercised under the Option Plans was $42.2 million, $2.8 million and $1.4 million, in 2011, 2010 and 2009, respectively, determined as of the date of option exercise. The intrinsic value is calculated as the difference between the fair value of the common shares on the exercise date and the exercise price of the option shares. The total estimated fair value of share options vested in 2011, 2010 and 2009 was $11.4 million, $6.9 million and $8.5 million, respectively.
Stock-based compensation expense is based on applying calculated fair values determined at the grant date to those options granted in the year that are ultimately expected to vest. Accordingly, the fair values calculated on the total population of grants have been reduced for estimated forfeitures expected to occur in the future.
84
Table of Contents
The table below summarizes stock-based compensation expense as allocated within the Company’s consolidated statements of operations (in thousands):
| Years Ended December 31, | ||||||||||||
| 2011 | 2010 | 2009 | ||||||||||
| (in thousands) | ||||||||||||
| Includes stock-based compensation of: |
||||||||||||
| Cost of revenue |
$ | 1,877 | $ | 1,126 | $ | 914 | ||||||
| Sales and marketing |
4,456 | 2,993 | 2,340 | |||||||||
| Research and development |
1,167 | 803 | 541 | |||||||||
| General and administrative |
4,099 | 3,167 | 2,265 | |||||||||
|
|
|
|
|
|
|
|||||||
| Total stock-based compensation |
$ | 11,599 | $ | 8,089 | $ | 6,060 | ||||||
|
|
|
|
|
|
|
|||||||
The following table summarizes information about share/stock options outstanding at December 31, 2011 (shares in thousands):
| Options Outstanding | Options Exercisable | |||||||||||||||||||
| Range of Exercise Prices |
Number of Shares Outstanding |
Weighted- Average Remaining Contract Life (in Years) |
Weighted- Average Exercise Price per Share |
Number of Shares Exercisable |
Weighted Average Exercise Price |
|||||||||||||||
| $0.20 to $1.49 |
824 | 4.1 | $ | 0.99 | 824 | $ | 0.99 | |||||||||||||
| $4.26 |
5,995 | 6.1 | 4.26 | 5,010 | 4.26 | |||||||||||||||
| $4.60 to $4.95 |
4,263 | 7.9 | 4.74 | 1,632 | 4.70 | |||||||||||||||
| $5.80 to $14.11 |
3,221 | 8.9 | 7.27 | 574 | 5.81 | |||||||||||||||
| $14.64 to $17.98 |
1,032 | 9.8 | 16.88 | — | — | |||||||||||||||
|
|
|
|
|
|||||||||||||||||
| 15,335 | 7.3 | 5.70 | 8,040 | 4.12 | ||||||||||||||||
|
|
|
|
|
|||||||||||||||||
As of December 31, 2011 and 2010 there was $33.8 million, and $22.6 million of unrecognized compensation expense related to nonvested share-based compensation arrangements granted under the Option Plans, which is expected to be recognized over a weighted-average period of 2.59 years and 3.1 years, respectively.
12. Employee Benefit Plan
The Company maintains a 401(k) defined contribution benefit plan that covers all eligible domestic employees who have attained 21 years of age and provide at least 20 hours of service per week. This plan allows U.S. employees to contribute up to 90% of their pre-tax salary in certain investments at the discretion of the employee, up to maximum annual contribution limits established by the U.S. Department of Treasury. During 2011, 2010 and 2009, the Company matched, up to an annual limit of $2,000, the first 3% of a participant’s contributions. Matching contributions by the Company are fully vested upon completion of the first year of employment. Employer matching contributions, which may be discontinued at the Company’s discretion, amounted to $1.0 million, $0.7 million and $0.6 million, during 2011, 2010 and 2009, respectively.
85
Table of Contents
13. Income Taxes
Income from continuing operations before provision for income taxes for the Company’s domestic and international operations was as follows (in thousands):
| Years Ended December 31, | ||||||||||||
| 2011 | 2010 | 2009 | ||||||||||
| Domestic |
$ | (3,664 | ) | $ | (1,734 | ) | $ | 9,562 | ||||
| International |
(608 | ) | 1,314 | 2,679 | ||||||||
|
|
|
|
|
|
|
|||||||
| Income (loss) before provision for income taxes |
$ | (4,272 | ) | $ | (420 | ) | $ | 12,241 | ||||
|
|
|
|
|
|
|
|||||||
The income tax provision consisted of the following (in thousands):
| Years Ended December 31, | ||||||||||||
| 2011 | 2010 | 2009 | ||||||||||
| Current: |
||||||||||||
| Federal |
$ | 1,116 | $ | 2,448 | $ | 2,244 | ||||||
| Foreign |
424 | 567 | 280 | |||||||||
| State and local |
98 | 472 | 367 | |||||||||
|
|
|
|
|
|
|
|||||||
| Total current income tax provision |
1,638 | 3,487 | 2,891 | |||||||||
| Deferred: |
||||||||||||
| Federal |
(16,756 | ) | (687 | ) | (585 | ) | ||||||
| Foreign |
56 | — | 264 | |||||||||
| State and local |
(4,321 | ) | (653 | ) | (704 | ) | ||||||
|
|
|
|
|
|
|
|||||||
| Total deferred income tax benefit |
(21,021 | ) | (1,340 | ) | (1,025 | ) | ||||||
|
|
|
|
|
|
|
|||||||
| Income tax provision (benefit) |
$ | (19,383 | ) | $ | 2,147 | $ | 1,866 | |||||
|
|
|
|
|
|
|
|||||||
The following table provides a reconciliation of income taxes provided at the federal statutory rate of 34% to the income tax provision (in thousands):
| Years Ended December 31, | ||||||||||||
| 2011 | 2010 | 2009 | ||||||||||
| U.S. income tax at federal statutory rate for LLC |
$ | — | $ | — | $ | — | ||||||
| U.S. income tax at federal statutory rate for taxable subsidiaries |
(1,452 | ) | (143 | ) | 4,151 | |||||||
| (Benefit) provision from (income) loss attributable to LLC |
1,470 | 1,711 | (1,432 | ) | ||||||||
| Benefit from change in tax status |
(20,740 | ) | — | — | ||||||||
| State income taxes, net of federal benefit |
52 | 153 | 241 | |||||||||
| Foreign tax rate differential |
415 | 40 | (476 | ) | ||||||||
| Permanent differences |
876 | 536 | 266 | |||||||||
| State tax credits |
(228 | ) | (330 | ) | (413 | ) | ||||||
| Valuation allowance |
196 | — | — | |||||||||
| Other, net |
28 | 180 | (471 | ) | ||||||||
|
|
|
|
|
|
|
|||||||
| $ | (19,383 | ) | $ | 2,147 | $ | 1,866 | ||||||
|
|
|
|
|
|
|
|||||||
Effective March 1, 2011, the parent company elected to be treated as a corporation under Subchapter C of Chapter 1 of the United States Internal Revenue Code, and therefore became subject to federal and state tax expense beginning March 1, 2011. As a result of this tax election, the Company recorded a net deferred tax asset and a one-time non-cash tax benefit of $20.7 million. On March 24, 2011, the LLC converted into a Delaware corporation and merged with two of its corporate equity holders. The Company recorded an additional deferred tax asset of $8.1 million and a corresponding adjustment to paid-in capital as a result of the merger.
86
Table of Contents
The following table provides the effect of temporary differences that created deferred income taxes as of December 31, 2011 and 2010. Deferred tax assets and (liabilities) represent the future effects on income taxes resulting from temporary differences and carry-forwards at the end of the respective periods (in thousands):
| December 31, | ||||||||
| 2011 | 2010 | |||||||
| Current |
||||||||
| Accrued liabilities |
$ | 3,602 | $ | 1,062 | ||||
| State taxes |
(88 | ) | 93 | |||||
| Allowance for doubtful accounts |
12 | — | ||||||
|
|
|
|
|
|||||
| Current deferred tax assets |
3,526 | 1,155 | ||||||
|
|
|
|
|
|||||
| Non-current |
||||||||
| Share-based compensation expense |
7,696 | 3,622 | ||||||
| Net operating loss carryforwards |
7,169 | — | ||||||
| State tax credits |
1,197 | 847 | ||||||
| Unrealized loss on foreign exchange transactions |
235 | 46 | ||||||
| Amortization of intangibles |
17,082 | — | ||||||
| Other, net |
29 | — | ||||||
|
|
|
|
|
|||||
| Non-current deferred tax assets |
33,408 | 4,515 | ||||||
|
|
|
|
|
|||||
| Total current and non-current |
36,934 | 5,670 | ||||||
| Deferred tax liabilities |
||||||||
| Property & equipment |
(3,030 | ) | (735 | ) | ||||
| Less: Valuation allowance |
(196 | ) | — | |||||
|
|
|
|
|
|||||
| Net deferred tax assets |
$ | 33,708 | $ | 4,935 | ||||
|
|
|
|
|
|||||
As of December 31, 2011 and 2010, management assessed the realizability of deferred tax assets and determined that based on the available evidence, including a history of taxable income and estimates of future taxable income, it is more likely than not that the deferred tax assets will be realized except for its Singapore net operating loss carryforward. The net change in the valuation allowance for the years ended December 31, 2011 and 2010 was an increase of $0.2 million and $0, respectively.
As of December 31, 2011, the Company had net operating loss carryforwards of approximately $38.9 million for federal income tax purposes and approximately $39.4 million for state income tax purposes. These losses are available to reduce taxable income and expire at various dates beginning in 2017. Approximately $18.0 million of federal net operating loss carryforwards and $21.5 million of state net operating loss carryforwards are related to excess tax benefits from stock-based compensation. The tax benefits associated with net operating losses attributed to stock-based compensation will be credited to additional paid-in capital when realized. At December 31, 2011, the Company had $1.7 million of state tax credits which expire beginning in 2023 if not utilized.
Utilization of the Company’s net operating loss and tax credit carryforwards may be subject to a substantial annual limitation due to the ownership change limitations provided by the Internal Revenue Code and similar state provisions. Such an annual limitation could result in the expiration or elimination of the net operating loss and tax credit carryforwards before utilization. In connection with the conversion of the LLC into a Delaware corporation, two of its equity holders, GA SS Holding LLC and SSLLC Holdings, Inc were merged with and into ServiceSource International, Inc. As a result, the Company acquired the net operating loss carryforwards of these two entities subject to the ownership change limitations. Management believes that the limitation will not limit utilization of the carryforwards prior to their expiration.
The Company’s income taxes payable have been reduced by the tax benefits associated with employee stock option transactions. These benefits, credited directly to stockholders’ equity, amounted to $2.9 million for the year ended December 31, 2011 and $0.1 million for the year ended December 31, 2010.
87
Table of Contents
The Company files U.S. federal and state and foreign income tax returns in jurisdictions with varying statutes of limitations. In the normal course of business the Company is subject to examination by taxing authorities throughout the world. These audits could include examining the timing and amount of deductions, the allocation of income among various tax jurisdictions and compliance with federal, state, local and foreign tax laws. In November 2010, the Company concluded an IRS audit of the 2008 tax year which resulted in a change to a temporary difference but with no impact on the 2008 income tax provision as previously reported. The 2007 through 2011 tax years generally remain subject to examination by federal, state and foreign tax authorities.
As of December 31, 2011, the Company does not have any unrecognized tax benefits and does not expect its unrecognized tax benefits to change significantly over the next 12 months.
The Company considers its undistributed earnings of its foreign subsidiaries permanently reinvested in foreign operations and has not provided for U.S. income taxes on such earnings. As of December 31, 2011 the Company’s unremitted earnings was $0.5 million from its foreign subsidiaries.
14. Reportable Segments
The Company’s operations are principally managed on a geographic basis and are comprised of three reportable and operating segments: NALA, EMEA, and APJ.
The Company reports segment information based on the management approach. The management approach designates the internal reporting used by the Company’s Chief Operating Decision Maker (“CODM”), for making decisions and assessing performance as the source of the Company’s reportable segments. The CODM is the Company’s Chief Executive Officer. The CODM allocates resources to and assesses the performance of each of the operating segment using information about its revenue and direct profit contribution, which is management’s measure of segment profitability. Management has determined that the Company’s reportable and operating segments are as follows, based on the information used by the CODM:
NALA—Includes operations from offices in San Francisco, California; Denver, Colorado and Nashville, Tennessee related primarily to end customer in North America.
EMEA—Includes operations from offices in Liverpool, United Kingdom and Dublin, Ireland related primarily to end customers in Europe.
APJ—Includes operations from offices in Kuala Lumpur, Malaysia and Singapore related primarily to end customers in Asia Pacific and Japan.
The Company does not allocate sales and marketing, research and development, or general and administrative expenses to its geographic regions because management does not include the information in its measurement of the performance of the operating segments. The Company excludes certain items such as share-based compensation, overhead allocations and other items from direct profit contribution. Revenue for a particular geography reflects fees the Company earns from its customers for sales and renewals of maintenance, support and subscription contracts on their behalf and managed from the Company’s sales center in that geography.
88
Table of Contents
Summarized financial information by geographic location for 2011, 2010 and 2009 based on the Company’s internal management reporting and as utilized by the Company’s CODM, is as follows (in thousands):
| Years Ended December 31, | ||||||||||||
| 2011 | 2010 | 2009 | ||||||||||
| Net revenue |
||||||||||||
| NALA |
$ | 127,430 | $ | 102,411 | $ | 77,283 | ||||||
| EMEA |
58,344 | 43,069 | 31,995 | |||||||||
| APJ |
19,727 | 7,455 | 1,398 | |||||||||
|
|
|
|
|
|
|
|||||||
| Total net revenue |
$ | 205,501 | $ | 152,935 | $ | 110,676 | ||||||
|
|
|
|
|
|
|
|||||||
| Direct profit contribution |
||||||||||||
| NALA |
72,333 | 55,463 | 47,035 | |||||||||
| EMEA |
27,756 | 18,370 | 12,707 | |||||||||
| APJ |
1,945 | 1,509 | 666 | |||||||||
|
|
|
|
|
|
|
|||||||
| Total direct profit contribution |
102,034 | 75,342 | 60,408 | |||||||||
| Adjustments: |
||||||||||||
| Stock-based compensation |
(1,877 | ) | (1,126 | ) | (914 | ) | ||||||
| Overhead allocations |
(17,705 | ) | (14,810 | ) | (10,567 | ) | ||||||
| Other, net |
9,643 | 3,481 | 2,872 | |||||||||
|
|
|
|
|
|
|
|||||||
| Gross Profit |
$ | 92,095 | $ | 62,887 | $ | 51,799 | ||||||
|
|
|
|
|
|
|
|||||||
The majority of the Company’s assets were attributable to its U.S. operations at December 31, 2011 and 2010. Property and equipment information is based on the physical location of the assets. The following table presents the long-lived assets, consisting of property and equipment, by geographic location (in thousands):
| December 31, | ||||||||
| 2011 | 2010 | |||||||
| NALA |
$ | 23,138 | $ | 16,844 | ||||
| EMEA |
1,161 | 1,444 | ||||||
| APJ |
2,541 | 1,130 | ||||||
|
|
|
|
|
|||||
| Total property and equipment, net |
$ | 26,840 | $ | 19,418 | ||||
|
|
|
|
|
|||||
15. Selected Quarterly Financial Data (Unaudited)
Selected summarized quarterly financial information for the years ended December 31, 2011 and 2010 is as follows:
| Three Months Ended | ||||||||||||||||||||||||||||||||
| Dec. 31, 2011 |
Sept. 30, 2011 |
June 30, 2011 |
Mar. 31, 2011 |
Dec. 31, 2010 |
Sept. 30, 2010 |
June 30, 2010 |
Mar. 31, 2010 |
|||||||||||||||||||||||||
| (in thousands, except per share amounts) | ||||||||||||||||||||||||||||||||
| Net revenue |
$ | 60,779 | $ | 50,088 | $ | 48,512 | $ | 46,122 | $ | 44,467 | $ | 38,316 | $ | 37,976 | $ | 32,176 | ||||||||||||||||
| Gross profit |
29,772 | 22,054 | 20,283 | 19,986 | 18,260 | 16,421 | 16,801 | 11,405 | ||||||||||||||||||||||||
| Income (loss) from operations |
3,538 | (2,606 | ) | (2,392 | ) | (1,685 | ) | (52 | ) | (138 | ) | 2,579 | (1,187 | ) | ||||||||||||||||||
| Income (loss) before provision for (benefit from) income taxes |
3,422 | (2,324 | ) | (2,828 | ) | (2,543 | ) | (532 | ) | (738 | ) | 2,443 | (1,593 | ) | ||||||||||||||||||
| Net income (loss) |
$ | 1,653 | $ | (2,825 | ) | $ | (1,133 | ) | $ | 17,416 | $ | (1,311 | ) | $ | (1,003 | ) | $ | 1,517 | $ | (1,770 | ) | |||||||||||
| Net income (loss) per common share: |
||||||||||||||||||||||||||||||||
| Basic |
$ | 0.02 | $ | (0.04 | ) | $ | (0.02 | ) | $ | 0.30 | $ | (0.02 | ) | $ | (0.02 | ) | $ | 0.03 | $ | (0.03 | ) | |||||||||||
| Diluted |
$ | 0.02 | $ | (0.04 | ) | $ | (0.02 | ) | $ | 0.28 | $ | (0.02 | ) | $ | (0.02 | ) | $ | 0.03 | $ | (0.03 | ) | |||||||||||
89
Table of Contents
| ITEM 9. | CHANGES IN AND DISAGREEMENTS WITH ACCOUNTANTS ON ACCOUNTING AND FINANCIAL DISCLOSURES |
None.
| ITEM 9A. | CONTROLS AND PROCEDURES |
Evaluation of Disclosure Controls and Procedures
Our management, with the participation of our chief executive officer and chief financial officer, evaluated the effectiveness of our disclosure controls and procedures as of December 31, 2011. The term “disclosure controls and procedures,” as defined in Rules 13a-15(e) and 15d-15(e) under the Exchange Act, means controls and other procedures of a company that are designed to ensure that information required to be disclosed by a company in the reports that it files or submits under the Exchange Act is recorded, processed, summarized and reported, within the time periods specified in the SEC’s rules and forms. Disclosure controls and procedures include, without limitation, controls and procedures designed to ensure that information required to be disclosed by a company in the reports that it files or submits under the Exchange Act is accumulated and communicated to the company’s management, including its principal executive and principal financial officers, as appropriate to allow timely decisions regarding required disclosure. Based on the evaluation of our disclosure controls and procedures as of December 31, 2011, our chief executive officer and chief financial officer concluded that, as of such date, our disclosure controls and procedures were effective at the reasonable assurance level.
Management recognizes that any controls and procedures, no matter how well designed and operated, can provide only reasonable assurance of achieving their objectives and management necessarily applies its judgment in evaluating the cost-benefit relationship of possible controls and procedures.
Management’s Annual Report on Internal Control Over Financial Reporting
This Annual Report on Form 10-K does not include a report of management’s assessment regarding internal control over financial reporting or an attestation report of our independent registered public accounting firm as permitted in this transition period under the rules of the SEC for newly public companies.
Changes in Internal Control over Financial Reporting
There were no changes in our internal control over financial reporting identified in management’s evaluation pursuant to Rules 13a-15(d) or 15d-15(d) of the Exchange Act during the quarter ended December 31, 2011 that materially affected, or are reasonably likely to materially affect, our internal control over financial reporting.
| ITEM 9B. | OTHER INFORMATION |
Not applicable.
90
Table of Contents
PART III
| ITEM 10. | DIRECTORS, EXECUTIVE OFFICERS AND CORPORATE GOVERNANCE |
The information required by Item 10 of this Annual Report on Form 10-K that is found in our 2012 Definitive Proxy Statement to be filed with the SEC in connection with the solicitation of proxies for our 2012 Annual Meeting of Stockholders (“2012 Proxy Statement”) is incorporated herein by reference to our 2012 Proxy Statement. The 2012 Proxy Statement will be filed with the SEC within 120 days after the end of the fiscal year to which this report relates.
| ITEM 11. | EXECUTIVE COMPENSATION |
The information required by Item 11 of this Annual Report on Form 10-K that is found in our 2012 Proxy Statement is incorporated herein by reference to our 2012 Proxy Statement. The 2012 Proxy Statement will be filed with the SEC within 120 days after the end of the fiscal year to which this report relates.
| ITEM 12. | SECURITY OWNERSHIP OF CERTAIN BENEFICIAL OWNERS AND MANAGEMENT AND RELATED STOCKHOLDER MATTERS |
The information required by Item 12 of this Annual Report on Form 10-K that is found in our 2012 Proxy Statement is incorporated herein by reference to our 2011 Proxy Statement. The 2012 Proxy Statement will be filed with the SEC within 120 days after the end of the fiscal year to which this report relates.
| ITEM 13. | CERTAIN RELATIONSHIPS AND RELATED TRANSACTIONS, AND DIRECTOR INDEPENDENCE |
The information required by Item 13 of this Annual Report on Form 10-K that is found in our 2012 Proxy Statement is incorporated herein by reference to our 2011 Proxy Statement. The 2012 Proxy Statement will be filed with the SEC within 120 days after the end of the fiscal year to which this report relates.
| ITEM 14. | PRINCIPAL ACCOUNTANT FEES AND SERVICES |
The information required by Item 14 of this Annual Report on Form 10-K that is found in our 2012 Proxy Statement is incorporated herein by reference to our 2011 Proxy Statement. The 2012 Proxy Statement will be filed with the SEC within 120 days after the end of the fiscal year to which this report relates.
91
Table of Contents
PART IV
| ITEM 15. | EXHIBITS AND FINANCIAL STATEMENT SCHEDULES |
| (a) | Documents filed as a part of this report: |
| 1. | Financial Statements: The information concerning our financial statements and Report of Independent Registered Public Accounting Firm required by this Item is incorporated by reference herein to the section of this Annual Report on Form 10-K in Item 8, titled “Financial Statements and Supplementary Data.” |
| 2. | Financial Statement Schedule: Schedule II Valuation and Qualifying Accounts is filed as part of this Annual Report on Form 10-K and should be read in conjunction with the consolidated financial statements or notes thereto. |
SERVICESOURCE INTERNATIONAL, INC.
SCHEDULE II—VALUATION AND QUALIFYING ACCOUNTS
(in thousands)
| Tax Valuation Allowance |
Balance at Beginning of Period |
Tax Valuation Allowance Charged to Income Tax Provision |
Tax Valuation Allowance Credited to Income Tax Provision |
Balance at End of Period |
||||||||||||
| Year ended December 31, 2011 income tax valuation allowance |
$ | — | $ | 196 | $ | — | $ | 196 | ||||||||
| Year ended December 31, 2010 income tax valuation allowance |
— | — | — | — | ||||||||||||
| Year ended December 31, 2009 income tax valuation allowance |
— | — | — | — | ||||||||||||
All other schedules have been omitted because the required information is included in the consolidated financial statements or the notes thereto, or is not applicable or required.
| 3. | Exhibits: See Item 15(b) below. We have filed, or incorporated into this Annual Report on Form 10-K by reference, the exhibits listed on the accompanying Index to Exhibits immediately following the signature page of this Form 10-K. |
| (b) | Exhibits: The exhibit list in the Index to Exhibits immediately following the signature page of this Annual Report on Form 10-K is incorporated herein by reference as the list of exhibits required by this Item 15(b). |
| (c) | Financial Statement Schedules: See Item 15(a) above. |
92
Table of Contents
Pursuant to the requirements of Section 13 or 15(d) of the Securities Exchange Act of 1934, the registrant has duly caused this report to be signed on its behalf by the undersigned, thereunto duly authorized.
| SERVICESOURCE INTERNATIONAL, INC. | ||||
| Dated: March 6, 2012 | By: | /S/ MICHAEL A. SMERKLO | ||
| Michael A. Smerklo | ||||
| Chairman of the Board and Chief Executive Officer (Principal Executive Officer) | ||||
| SERVICESOURCE INTERNATIONAL, INC. | ||||
| Dated: March 6, 2012 | By: | /S/ DAVID S. OPPENHEIMER | ||
| David S. Oppenheimer Chief Financial Officer (Principal Financial and Accounting Officer) | ||||
POWER OF ATTORNEY
KNOW ALL MEN BY THESE PRESENTS, that each person whose signature appears below hereby constitutes and appoints Michael A. Smerklo and David S. Oppenheimer, and each of them, his or her true and lawful attorney-in-fact and agent, with full power of substitution, each with power to act alone, to sign and execute on behalf of the undersigned any and all amendments to this Annual Report on Form 10-K, and to perform any acts necessary in order to file the same, with all exhibits thereto and other documents in connection therewith with the Securities and Exchange Commission, granting unto said attorney-in-fact and agent full power and authority to do and perform each and every act and thing requested and necessary to be done in connection therewith, as fully to all intents and purposes as he might or could do in person, hereby ratifying and confirming all that said attorney-in-fact and agent, or their or his or her substitutes, shall do or cause to be done by virtue hereof.
Pursuant to the requirements of the Securities Exchange Act of 1934, this report has been signed below by the following persons on behalf of the registrant and in the capacities and on the dates indicated.
| Date |
Signature |
Title | ||
| March 6, 2012 |
/s/ MICHAEL A. SMERKLO Michael A. Smerklo |
Chairman of the Board and Chief Executive Officer (Principal Executive Officer) | ||
| March 6, 2012 |
/s/ DAVID S. OPPENHEIMER David S. Oppenheimer |
Chief Financial Officer (Principal Financial and Accounting Officer) | ||
| March 6, 2012 |
/s/ STEVEN CAKEBREAD Steven Cakebread |
Director | ||
| March 6, 2012 |
/s/ BRUCE DUNLEVIE Bruce Dunlevie |
Director | ||
| March 6, 2012 |
/s/ JIM MADDEN Jim Madden |
Director | ||
93
Table of Contents
| Date |
Signature |
Title | ||
| March 6, 2012 |
/s/ MARC F. MCMORRIS Marc F. McMorris |
Director | ||
| March 6, 2012 |
/s/ TOM MENDOZA Tom Mendoza |
Director | ||
| March 6, 2012 |
/s/ BARRY REYNOLDS Barry Reynolds |
Director | ||
| March 6, 2012 |
/s/ TONY ZINGALE Tony Zingale |
Director | ||
94
Table of Contents
Index to Exhibits
| Incorporated by Reference Herein | ||||||||||
| Exhibit |
Exhibit Description |
Filed Herewith |
Exhibit | Form/File No. | Filing Date | |||||
| 2.1 | Form of Conversion Agreement dated as of March 24, 2011, between the Registrant, GA SS Holding LLC and SSLLC Holdings, Inc. | 2.1 | Form S-1/A (No. 333- 171271) |
March 11, 2011 | ||||||
| 2.2 | Form of Agreement and Plan of Merger dated as of March 24, 2011, between the Registrant, GA SS Holding LLC, GA SS Holding II, LLC, SSLLC Holdings, Inc. and Benchmark Capital Partners V, L.P. | 2.2 | Form S-1/A (No. 333- 171271) |
March 11, 2011 | ||||||
| 3.1 | Certificate of Incorporation of the Company filed March 24, 2011 | 3.1 | Form 8-K (No. 001- 35108) |
April 1, 2011 | ||||||
| 3.2 | Bylaws of the Company dated March 24, 2011 | 3.2 | Form 8-K (No. 001- 35108) |
April 1, 2011 | ||||||
| 3.3 | Fifth Amended and Restated Limited Liability Company Agreement | 3.3 | Form S-1/A (No. 333- 171271) |
January 28, 2011 | ||||||
| 4.1 | Registration and Information Rights Agreement dated as of December 8, 2006, between the Registrant and GA SS Holding LLC, SSLLC Holdings, Inc., Housatonic Micro Fund SBIC, LP and Housatonic Equity Investors SBIC, LP | 4.1 | Form S-1/A (No. 333- 171271) |
February 25, 2011 | ||||||
| 4.2 | Securities Purchase Agreement and Registration Rights Schedule dated as of January 31, 2003, between the Registrant and the 2003 Holders | 4.2 | Form S-1/A (No. 333- 171271) |
February 25, 2011 | ||||||
| 4.3 | Specimen common stock certificate of the Registrant | 4.3 | Form S-1/A (No. 333- 171271) |
March 11, 2011 | ||||||
| 10.1+ | Form of Director and Executive Officer Indemnification Agreement | 10.1 | Form S-1 (No. 333- 171271) |
December 20, 2010 | ||||||
| 10.2+ | 2004 Omnibus Share Plan and forms of agreements thereunder | 10.2 | Form S-1 (No. 333- 171271) |
December 20, 2010 | ||||||
| 10.3+ | 2008 Share Option Plan and form of agreement thereunder | 10.3 | Form S-1 (No. 333- 171271) |
December 20, 2010 | ||||||
| 10.4+ | 2011 Equity Incentive Plan and forms of agreements thereunder | 4.4 | Form S-8 (No. 333- 173116) |
March 28, 2011 | ||||||
95
Table of Contents
| Incorporated by Reference Herein | ||||||||||
| Exhibit |
Exhibit Description |
Filed Herewith |
Exhibit | Form/File No. | Filing Date | |||||
| 10.5+ | 2011 Equity Incentive Plan form of Restricted Stock Award Agreement | 10.1 | Form 8-K (No. 001- 35108) |
February 10, 2012 | ||||||
| 10.6+ | 2011 Employee Stock Purchase Plan and form of agreement thereunder | 4.5 | Form S-8 (No. 333- 173116) |
March 28, 2011 | ||||||
| 10.7+ | Amended and Restated Employment and Confidential Information Agreement dated as of June 8, 2010, between the Registrant and Michael A. Smerklo | 10.5 | Form S-1 (No. 333- 171271) |
December 20, 2010 | ||||||
| 10.8+ | Amended and Restated Employment and Confidential Information Agreement dated as of December 8, 2010, between the Registrant and Jeffrey M. Bizzack | 10.6 | Form S-1 (No. 333- 171271) |
December 20, 2010 | ||||||
| 10.9+ | Employment and Confidential Information Agreement dated as of July 7, 2010, between the Registrant and David Oppenheimer | 10.7 | Form S-1 (No. 333- 171271) |
December 20, 2010 | ||||||
| 10.10+ | Amended and Restated Employment and Confidential Information Agreement dated as of December 8, 2010, between the Registrant and Robert Sturgeon | 10.8 | Form S-1 (No. 333- 171271) |
December 20, 2010 | ||||||
| 10.11+ | Employment and Confidential Information Agreement dated as of April 13, 2010, between the Registrant and Ganesh Bell | 10.9 | Form S-1 (No. 333- 171271) |
December 20, 2010 | ||||||
| 10.12+ | Amended and Restated Employment and Confidential Information Agreement dated as of December 8, 2010, between the Registrant and Raymond M. Martinelli | 10.10 | Form S-1 (No. 333- 171271) |
December 20, 2010 | ||||||
| 10.13+ | Amended and Restated Employment Letter Agreement dated as of November 4, 2010, between the Registrant and Natalie A. McCullough | 10.11 | Form S-1 (No. 333- 171271) |
December 20, 2010 | ||||||
| 10.14+ | Amended and Restated Employment and Confidential Information Agreement dated as of December 8, 2010, between the Registrant and Paul D. Warenski | 10.12 | Form S-1/A (No. 333- 171271) |
January 28, 2011 | ||||||
| 10.15+ | Employment and Confidential Information Agreement dated as of April 7, 2008, between the Registrant and Charles D. Boynton | 10.13 | Form S-1 (No. 333- 171271) |
February 25, 2011 | ||||||
| 10.16+ | Release Letter Agreement date as of June 25, 2010, between the Registrant and Charles D. Boynton | 10.14 | Form S-1 (No. 333- 171271) |
February 25, 2011 | ||||||
96
Table of Contents
| Incorporated by Reference Herein | ||||||||||
| Exhibit |
Exhibit Description |
Filed Herewith |
Exhibit | Form/File No. | Filing Date | |||||
| 10.17+ | Employment and Confidential Information Agreement dated as of August 16, 2011, between the Company and John Boucher. | 10.1 | Form10-Q (No. 001- 35108) |
November 14, 2011 | ||||||
| 10.18+ | Amended and Restated Employment and confidential Information Agreement dated as of December 6, 2010, between the Registrant and Jay Ackerman |
X | ||||||||
| 10.19 | Office Lease, dated as of October 31, 2007, between the Registrant and Six Thirty-Four Second Street, LLC | 10.16 | Form S-1/A (No. 333- 171271) |
February 25, 2011 | ||||||
| 10.20 | Second Amended and Restated Credit Agreement dated as of February 24, 2011 between the Registrant, the Lenders named therein and Wells Fargo Capital Finance, Inc., as Administrative Agent | 10.17 | Form S-1/A (No. 333- 171271) |
February 25, 2011 | ||||||
| 10.21 | Second Amended and Restated Security Agreement dated as of February 24, 2011 between the Registrant, ServiceSource International Inc. and Wells Fargo Capital Finance, Inc., as Administrative Agent | 10.18 | Form S-1/A (No. 333- 171271) |
February 25, 2011 | ||||||
| 10.22 | General Continuing Guaranty dated as of April 29, 2008 delivered by ServiceSource International Inc. in favor of Wells Fargo Foothill, Inc. | 10.19 | Form S-1/A (No. 333- 171271) |
February 25, 2011 | ||||||
| 10.23 | Waiver dated as of March 19, 2010, between the Registrant, the Lenders named therein and Wells Fargo Capital Finance, LLC, as Administrative Agent | 10.20 | Form S-1/A (No. 333- 171271) |
February 25, 2011 | ||||||
| 21.1 | List of subsidiaries | X | ||||||||
| 23.1 | Consent of PricewaterhouseCoopers LLP | X | ||||||||
| 31.1 | Certification of Principal Executive Officer required by Rule 13a-14(a) or Rule 15d-14(a) of the Securities Exchange Act of 1934, as adopted pursuant to Section 302 of the Sarbanes-Oxley Act of 2002. | X | ||||||||
| 31.2 | Certification of Principal Financial Officer required by Rule 13a-14(a) or Rule 15d-14(a) of the Securities Exchange Act of 1934, as adopted pursuant to Section 302 of the Sarbanes-Oxley Act of 2002. | X | ||||||||
| 32.1* | Certification of Chief Executive Officer pursuant to 18 U.S.C. Section 1350, as adopted pursuant to Section 906 of the Sarbanes-Oxley Act of 2002. | |||||||||
| 32.2* | Certification of Chief Financial Officer pursuant to 18 U.S.C. Section 1350, as adopted pursuant to Section 906 of the Sarbanes-Oxley Act of 2002. | |||||||||
97
Table of Contents
| Incorporated by Reference Herein | ||||||||||
| Exhibit |
Exhibit Description |
Filed Herewith |
Exhibit | Form/File No. | Filing Date | |||||
| 101.INS** | XBRL Instance Document | |||||||||
| 101.SCH** | XBRL Taxonomy Extension Schema | |||||||||
| 101.CAL** | XBRL Taxonomy Extension Calculation Linkbase | |||||||||
| 101.DEF** | XBRL Taxonomy Extension Definition Linkbase | |||||||||
| 101.LAB** | XBRL Taxonomy Extension Label Linkbase | |||||||||
| 101.PRE** | XBRL Taxonomy Extension Presentation Linkbase | |||||||||
| + | Management contract or compensatory plan or arrangement. |
| * | In accordance with Item 601(b)(32)(ii) of Regulation S-K and SEC Release No. 33-8238 and 34-47986, Final Rule: Management’s Reports on Internal Control Over Financial Reporting and Certification of Disclosure in Exchange Act Periodic Reports, the certifications furnished in Exhibits 32.1 and 32.2 hereto are deemed to accompany this Annual Report on Form 10-K and will not be deemed “filed” for purposes of Section 18 of the Exchange Act. Such certifications will not be deemed to be incorporated by reference into any filings under the Securities Act or the Exchange Act, except to the extent that the registrant specifically incorporates it by reference. |
| ** | XBRL (Extensible Business Reporting Language) information is furnished and not filed herewith, is not a part of a registration statement or prospectus for purposes of sections 11 or 12 of the Securities Act of 1933, is deemed not filed for purposes of section 18 of the Securities Exchange Act of 1934, and otherwise is not subject to liability under these sections. |