Attached files
| file | filename |
|---|---|
| EX-32.2 - EXHIBIT 32.2 - SERVICESOURCE INTERNATIONAL, INC. | srev12312016exhibit322.htm |
| EX-32.1 - EXHIBIT 32.1 - SERVICESOURCE INTERNATIONAL, INC. | srev12312016exhibit321.htm |
| EX-31.2 - EXHIBIT 31.2 - SERVICESOURCE INTERNATIONAL, INC. | srev12312016exhibit312.htm |
| EX-31.1 - EXHIBIT 31.1 - SERVICESOURCE INTERNATIONAL, INC. | srev12312016exhibit311.htm |
| EX-23.2 - EXHIBIT 23.2 - SERVICESOURCE INTERNATIONAL, INC. | srev12312016exhibit232.htm |
| EX-23.1 - EXHIBIT 23.1 - SERVICESOURCE INTERNATIONAL, INC. | srev12312016exhibit231.htm |
| EX-21.1 - EXHIBIT 21.1 - SERVICESOURCE INTERNATIONAL, INC. | srev12312016exhibit211.htm |
UNITED STATES
SECURITIES AND EXCHANGE COMMISSION
Washington, D.C. 20549
FORM 10-K
ý | ANNUAL REPORT PURSUANT TO SECTION 13 OR 15(d) OF THE SECURITIES EXCHANGE ACT OF 1934 |
For the fiscal year ended December 31, 2016
or
¨ | TRANSITION REPORT PURSUANT TO SECTION 13 OR 15(d) OF THE SECURITIES EXCHANGE ACT OF 1934 |
For the transition period from to
Commission file number 001-35108
SERVICESOURCE INTERNATIONAL, INC.
(Exact name of registrant as specified in its charter)
Delaware | No. 81-0578975 | |
(State or Other Jurisdiction of Incorporation or Organization) | (I.R.S. Employer Identification No.) | |
760 Market Street, 4th Floor San Francisco, California | 94102 | |
(Address of Principal Executive Offices) | (Zip Code) | |
Registrant’s telephone number, including area code: (415) 901-6030
Securities registered pursuant to Section 12(b) | Name of each exchange on which registered | |
Common Stock, $0.0001 Par Value | The NASDAQ Stock Market LLC | |
Securities registered pursuant to Section 12(g) of the Act:
None
Indicate by check mark if the registrant is a well-known seasoned issuer, as defined in Rule 405 of the Securities Act. Yes ¨ No ý
Indicate by check mark if the registrant is not required to file reports pursuant to Section 13 or Section 15(d) of the Act. Yes ¨ No ý
Indicate by check mark whether the registrant (1) has filed all reports required to be filed by Section 13 or 15(d) of the Securities Exchange Act 1934 during the preceding 12 months (or for such shorter period that the registrant was required to file such reports), and (2) has been subject to such filing requirements for the past 90 days. Yes ý No ¨
Indicate by check mark whether the registrant has submitted electronically and posted on its corporate Web site, if any, every Interactive Data File required to be submitted and posted pursuant to Rule 405 of Regulation S-T (§232.405 of this chapter) during the preceding 12 months (or for such shorter period that the registrant was required to submit and post such files). Yes ý No ¨
Indicate by check mark if disclosure of delinquent filers pursuant to Item 405 of Regulation S-K (§29.405 of this chapter) is not contained herein, and will not be contained, to the best of registrant’s knowledge, in definitive proxy or information statements incorporated by reference in Part III of this Form 10-K or any amendment to this Form 10-K. ý
Indicate by check mark whether the registrant is a large accelerated filer, an accelerated filer, a non-accelerated filer or a smaller reporting company. See definition of “large accelerated filer, “accelerated filer” and “smaller reporting company” in Rule 12b-2 of the Exchange Act. (Check one):
Large accelerated filer | ¨ | Accelerated filer | ý | |||
Non-accelerated filer | ¨ | Smaller reporting company | ¨ | |||
Indicate by check mark whether the registrant is a shell company (as defined in Rule 12b-2 of the Exchange Act). Yes ¨ No ý
The aggregate market value of the voting and non-voting common stock held by non-affiliates of the registrant, computed by reference to the closing price at which the common stock was sold on June 30, 2016, the last business day of the registrant’s most recently completed second fiscal quarter, as reported on The NASDAQ Global Market, was $264,649,379. Shares of common stock held by each executive officer, director and holder of 5% or more of the outstanding common stock have been excluded in that such persons may be deemed to be affiliates. This determination of affiliate status does not reflect a determination that such persons are affiliates of the registrant for any other purpose.
As of February 17, 2017, there were approximately 88,445,754 shares of the registrant’s common stock outstanding.
DOCUMENTS INCORPORATED BY REFERENCE
Portions of the registrant’s definitive Proxy Statement for its 2017 Annual Meeting of Stockholders are incorporated by reference in Part III of this Annual Report on Form 10-K. Such Proxy Statement will be filed with the U.S. Securities and Exchange Commission within 120 days after the end of the fiscal year to which this report relates. Except with respect to information specifically incorporated by reference in this Form 10-K, the Proxy Statement is not deemed to be filed as part of this Form 10-K.
TABLE OF CONTENTS
Page | ||
PART I | ||
Item 1. | ||
Item 1A. | ||
Item 1B. | ||
Item 2. | ||
Item 3. | ||
Item 4. | ||
PART II | ||
Item 5. | ||
Item 6. | ||
Item 7. | ||
Item 7A. | ||
Item 8. | ||
Item 9. | ||
Item 9A. | ||
Item 9B. | ||
PART III | ||
Item 10. | ||
Item 11. | ||
Item 12. | ||
Item 13. | ||
Item 14. | ||
PART IV | ||
Item 15. | ||
Item 16. | ||
i
i
SPECIAL NOTE REGARDING FORWARD LOOKING STATEMENTS AND INDUSTRY DATA
This report includes estimates, projections, statements relating to our business plans, objectives and expected operating results that are “forward-looking statements” within the meaning of the Private Securities Litigation Reform Act of 1995, Section 27A of the Securities Act of 1933 and Section 21E of the Securities Exchange Act of 1934. Forward-looking statements may appear throughout this report. These forward-looking statements generally are identified by the words “believe,” “project,” “expect,” “anticipate,” “estimate,” “intend,” “strategy,” “future,” “opportunity,” “plan,” “may,” “should,” “will,” “would,” “will be,” “will continue,” “will likely result,” and similar expressions. Forward-looking statements are based on current expectations and assumptions that are subject to risks and uncertainties that may cause actual results to differ materially. We describe risks and uncertainties that could cause actual results and events to differ materially in “Risk Factors” (Part I, Item 1.A. of this Form 10-K), “Quantitative and Qualitative Disclosures about Market Risk” (Part II, Item 7.A. of this Form 10-K) and “Management’s Discussion and Analysis of Financial Condition and Results of Operations” (Part II, Item 7 of this Form 10-K). We undertake no obligation to update or revise publicly any forward-looking statements, whether because of new information, future events, or otherwise.
We use “ServiceSource,” “the Company,” “we,” “us,” or “our” in this report on Form 10-K to include ServiceSource International, Inc. and its subsidiaries, unless the context indicates otherwise.
PART I
ITEM 1. | BUSINESS |
Overview
ServiceSource International, Inc. is a global leader in outsourced, performance-based customer success and revenue growth solutions. Through our people, processes and technology, we grow and retain revenue on behalf of our clients—some of the world’s leading business-to-business companies—in more than 35 languages. Our solutions help our clients strengthen their customer relationships, drive improved customer adoption, expansion and retention and minimize churn. Our technology platform and best-practice business processes combined with our highly-trained, client-focused revenue delivery professionals and data from over 15 years of operating experience enable us to provide our clients greater value for our customer success services than attained by our clients' in-house customer success teams.
Our total revenue was $252.9 million, $252.2 million and $272.2 million for the years ended December 31, 2016, 2015 and 2014, respectively. For summarized financial information by geographic area, see Note 16 of the Notes to Consolidated Financial Statements.
Our Solutions
We leverage deep experience, analytical expertise, high-performance revenue delivery teams and unique technology to drive customer success and renewals through our solutions.
Our client-focused revenue delivery professionals receive extensive training and expertise in our clients’ businesses and are deployed as an extension of our clients’ brands. Through direct interaction with our clients' end users, our revenue delivery professionals follow a sales process tailored specifically to improve end-customer retention and meet our clients’ business objectives. Our solution is designed to optimize recurring revenue across different business-to-business revenue models, distribution models and segments, including hardware, software, Software-as-a-Service, industrial systems, information and media, as well as technology-enabled healthcare and life sciences. Our global revenue delivery centers, located in Bulgaria, Ireland, Japan, Malaysia, the Philippines, Singapore, the United Kingdom and the United States enable us to provide our solutions to our clients in more than 35 languages.
Our solutions span the entire lifecycle of our clients’ customers, from landing new customers (we provide lead generation and outsourced sales operations services), adoption (we provide customer onboarding and customer success management services), expansion (we provide cross-sell and upsell, warranty conversion, account-based marketing and channel recruitment and enablement) and renewals (we provide renewals management services, including the sale of maintenance and support service contracts for the products used by our clients’ end-users).
1
• | Outsourced Sales Operations. Our sales enablement and quoting solutions advance our clients’ renewal sales process with specialized resources handling the administrative work associated with renewals and subscriptions. We apply a standardized, best-practice approach to sales enablement and quoting across the opportunities we manage through a dedicated, trained team completely focused on quoting, data entry and bookings processing combined with an in-depth understanding of our clients’ product SKUs, pricing and systems. In addition, we provide rigorous quality control through a dedicated quote audit team and analytics dashboards to monitor accuracy, throughput and cycle times. |
• | Customer Onboarding. Our revenue delivery teams proactively welcome our clients’ new customers and ensure the customers are established for ongoing success. Using our best-practice processes developed over our 15-year history, we confirm successful implementation of our clients’ products or services and promote adoption and use, including thorough reviews of customer usage and initial contact; brief demonstrations and reviews of key product features; identification and, if needed, escalation of support or implementation issues; delivery of basic training and/or product education; and supporting change management initiatives. |
• | Customer Success Management. Our revenue delivery teams continuously monitor the health of our clients’ customers; reinforce the unique value and benefits of our clients’ products; and share customer feedback with our clients’ product and marketing teams. Our revenue delivery professionals are specifically and continuously trained to articulate the value of our clients’ products and services to their customers, which drives improved customer loyalty. In addition, we use our technology platform to provide predictive analytics to identify our clients’ at-risk customers as well as to provide segmentation and analysis to assist in minimizing or avoiding churn. |
• | Cross-sell and Upsell Services. Our revenue delivery teams are specifically trained in the identification of cross-sell and upsell activities, including upgrading service/support level, uncovering additional assets/licenses, extending term length and product sales lead generation. We do this through expert data analysis, specifically designed account plans and partnerships with our clients’ sales teams. |
• | Warranty Conversion. We proactively engage with our clients’ warranty customers with skilled revenue delivery teams who are trained to clearly articulate the benefits of an extended support and maintenance contract. In addition, we identify and engage customers who have lapsed warranty agreements. |
• | Renewals Management. We help our clients develop a finely-tuned renewals management and growth strategy. We begin by analyzing our clients’ existing business data, systems and processes to accurately diagnose our clients’ renewal revenue challenges. The initial analysis is followed by our proposal of a tailored solution of expert selling services, technology and processes to achieve our clients’ revenue growth and customer retention objectives. Our revenue delivery teams operate as an extension of our clients’ brand and sales team, support either direct or channel selling models and have worldwide sales experience. |
Our pay-for-performance model allows our clients to pay us either flat-rate or variable commissions based on the revenue we generate on their behalf. Fixed-fee arrangements, such as in our Accelerate offering, are typically used in quick deployments to address discrete target areas of our clients’ needs. We also generate revenue through our professional services teams, who assist our clients with data optimization, as well as through supporting select existing clients with our Renew OnDemand application.
Our engagement with our clients begins in the pre-sales process and continues through their lifecycle.
• | Client Performance Analysis. We typically begin engagements with our prospective clients by conducting in-depth interviews, analyzing their historical performance and future opportunity and evaluating their recurring revenue business using proprietary analytical models. We also use our breadth of experience to benchmark and identify service renewal opportunities, and to calculate our ability to improve our clients' performance based on our performance with similar types of businesses and revenue streams. |
• | Business Case, Pricing and Contract Structuring. We use our reservoir of data and benchmarks to estimate the critical components of the business case and appropriate pricing model for prospective clients, whether for renewals, selling services, or lead generation. This intelligence is fundamental to our pay-for-performance business model. |
• | Data Integration. We deploy our professional services teams to enable data integration at scale, combined with data enhancement, enablement, integration and optimization where needed. |
• | Performance. Once a partnership is in place with one of our clients, we leverage our reporting platform and our data reservoir and performance optimization tools to enable, measure, analyze, benchmark and optimize the performance of our service sales teams. |
2
• | Client Benchmarking and Continuous Improvement. Our extensive platform and the accumulation of more than 15 years of experience serve as the foundation for benchmarking our clients’ evolving recurring revenue and end customer success performance against industry peers and previous period performance. We generally conduct quarterly business review meetings and annual partnership reviews with our clients to review performance, identify potential weaknesses in their processes and determine opportunities for improvement and make recommendations that we believe will allow our clients and us to achieve higher levels of performance and efficiencies. |
• | Developing and Delivering Applications. Our data reservoir fuels the opportunity data, sales methodologies, metrics and reporting dashboards that we engineer into our applications. Accordingly, we design our applications to leverage the transactional, analytical and industry data housed in our platform. |
Our Technology
Our technology platform is a combination of our proprietary tools, best-in-class industry solutions, application integrations, a proprietary recurring revenue data model and proven release management and operational procedures. We deploy our technologies to enable higher productivity and efficiency from our revenue delivery and operations teams to drive better outcomes for our clients. We specifically focus on process and productivity management, analytics that drive high-performing and effective sales, customer retention and customer success management capabilities. In addition, we continue to provide our Renew OnDemand application through contractual arrangements with select customers.
Customer Success Management Technologies
We deploy customer success management technologies to our customer success services teams on behalf of our clients in order to enable our agreed-upon economic outcomes. The applications are our own proprietary intellectual property, based on our years of history supporting recurring revenue management and customer success management, combined with best-in-class third party technology. Our reporting platform (which we previously referred to as ServiceSource Revenue Analytics) correlates product usage, billing and customer revenue management data with success plans to proactively trigger intelligent workflow automations, helping our precision customer success and revenue delivery professionals engage the right end customer with the right sales motion at the right time. To further our customer success management capabilities in our technology platform, we have integrated GainsightTM as part of our Outcome360 partnership with GainsightTM. We deploy this technology as needed for customer engagements to support on-boarding, adoption and retention plays.
Renewal and Channel Management Technologies
We deploy applications that are uniquely designed for our revenue delivery professionals who are specifically focused on managing renewals, warranty conversions, install base out-of-warranty (IBOW) and channel engagements. These applications allow us to optimize the selling processes between revenue delivery professionals engaging with our clients’ customers and operations services responsible for creating quotes and booking orders. These selling processes, and our purpose-built applications that facilitate them, are also extended to channel partners to drive channel sales performance in scenarios where our clients sell via one-tier or two-tier distribution. All of these applications are based on our proprietary data model to effectively capture and track key recurring revenue metrics that drive performance for our customer partnerships.
Productivity Tools
We deploy productivity tools to our revenue delivery professionals that focus on performance management, knowledge management, communication and training. These tools allow managers to monitor and coach our selling teams to improve performance and efficiency and provide real-time communication and client related news to our revenue delivery team members. These tools are available to our selling teams via a proprietary and customized landing page, and include the following features:
• | Communication. Team chat functionality for easy and immediate communication to managers and other team members; a softphone tie-in that enables recording for training purposes as well as time and task tracking features; and customer contact look-up application. |
• | Knowledge Management. Product knowledge to guide selling and accelerate new team member training/onboarding, including client social media and other client-related news feeds. |
• | Productivity Tools. These features enable managers and team leaders to capture best practices and productivity metrics for training and sharing across teams, as well as suggesting selling motions and task prioritization to enable targeted and efficient selling motions. |
3
• | Performance management. All information from the productivity tools, including task tracking and time management, rolls up to the individual representative and managers in both an individual and aggregated manner to allow for real-time tracking of performance relative to quarter goals. |
Each deployment of the productivity tools is customized to the particular client and region being serviced by the revenue delivery team member. To scale best practices from our highest-performing team members, we also deploy workforce optimization software and desktop analytics. As we learn from our high performers how to navigate complex client systems or manage sophisticated selling activities, we can easily share those practices with new hires, team members or incorporate them into our global learning methodologies. Lastly, much of this information integrates with our reporting platform of transactional, productivity and performance information to allow us to offer our clients benchmarking of our clients’ results against their industry peers.
Renew OnDemand
Renew OnDemand is an application that we previously marketed to our clients. Although we provide our Renew OnDemand application through contractual arrangements with select customers, we do not currently offer Renew OnDemand for new engagements.
Our intellectual property consists primarily of software systems. We rely upon a combination of copyrights, trade secrets and trademarks, in addition to contractual restrictions such as confidentiality agreements, to establish and protect our proprietary rights. We currently own nine U.S. patents, and additional applications for U.S. patents are currently pending. Our name and logo are protected by their historic use and by trademarks that are registered in the United States, the European Community, Japan, Singapore and Australia.
Key benefits of our solutions include:
Financial Benefits
• | Increased recurring revenue. Our solutions are designed to increase revenues for our clients. We actively monitor the success rates-including contract renewal rates, cross-sell and upsell rates, lead generation, or other services that we drive on behalf of our clients in each engagement. When we generate higher renewal rates, we not only drive incremental client revenue for the associated period, but also have a compounding effect in increasing the base number of contracts eligible for renewal in subsequent periods, which expands the opportunity to generate greater client revenue in future periods. As we expand our solution to include cross-sell and upsell, lead generation and other strategic customer success services, we believe that our opportunity to generate client revenue in future periods through our renewal management services will also increase. |
• | Improved retention and customer success. Our solutions drive end customer retention and revenue growth for some of the world’s leading companies, leveraging more than 15 years of expertise to continuously monitor end customer health, engage each end customer with the right play at the right time and reinforce the unique value and benefits of each end customer’s product. The result is reduced end customer churn, increased revenue through up-sell and cross-sell, stronger end customer relationships and higher satisfaction. |
• | Increased margin and profitability. We believe that the variable rate we charge for our solutions is lower than the fully-loaded fixed internal costs incurred by our clients managing renewals internally. As a result, each incremental dollar of recurring revenue generated by our solutions can drive greater profitability for our clients. |
Operational Benefits
• | Greater business insight and analytics. The analytics engines in our technologies allow us to analyze each client’s renewals and churn rates against similar transactions, identifying areas for improvement and enabling greater insight into their business. All transactions, regardless of outcome, are recorded in our platform. We leverage this platform to provide benchmarking, end customer metrics, sales efficiency data and insight into successful and unsuccessful renewal efforts. The breadth of our data allows us to provide powerful analysis across regions, industries, channel partners and product segments. |
• | Greater visibility and forecasting tools. Our technologies deliver real-time analytics and visibility into our client’s recurring revenue performance, sales efficiency and forecasts. We measure recurring revenue performance across dozens of key performance indicators and provide real-time data to our clients through a clear and impactful web-based interface. Our clients rely on our applications to assist in forecasting their results and to measure progress against their forecasts on a real-time basis. |
4
• | Global consistency. We are able to maintain a globally consistent customer success and revenue growth selling process for our clients. Our revenue delivery centers operate from a unified platform. Our technologies automate the application of best practices to recurring revenue renewals and customer success processes and provide all relevant constituencies with a consistent view of the data. This automation facilitates contract renewals and provides reliable performance management and analytics. |
Our Strategy
We intend to continue our industry leadership by delivering solutions to support the challenges faced by our clients in managing their revenue lifecycle. Our strategy to execute this vision is:
• | Expand our client base. In order to expand our client base, we are offering rapid, smaller deployments to address our clients’ discrete needs or to support fast-growth enterprises. |
• | Increase footprint with existing clients to drive greater revenue per client. Our goal is to manage a greater portion of each client’s recurring revenue. We have increasingly taken on the management of more than just one component of a client’s recurring revenue, such as a specific product, market segment or geographic region, or adding selling services such as cross-sell and upsell services, to an existing client’s renewal services. Because we baseline our clients’ performance prior to any engagement, we are able to quantify our results for the client, which frequently leads to increased opportunities to expand our Opportunity Under Management for that client. |
• | Continue to invest in our technologies. We believe that our ability to leverage our technology to drive increased productivity by our revenue delivery professionals through more efficient and engaging training and productivity management, as well as our revenue analytics capabilities, is critical to our value proposition. We will continue to invest in our automation processes and the innovation of our technology platform to lower our operating costs, increase the efficiency and success of our solutions and enhance our competitive differentiation. |
• | Expand our investments in our people. Retention and enablement of our revenue delivery professionals is important to the success of our business. We have invested, and will continue to invest, in specific job-related next-generation training tailored to an individuals’ specific role. In addition, we will continue to support and roll out our continuous leadership training and learning management program, designed to identify high potential leaders as well as motivate our workforce and provide avenues for success across our worldwide employee base. We believe these investments will not only result in improved performance for our clients, but will also continue to set us apart from potential competitors and how our clients manage customer success internally. |
Our Clients
We target our solutions to business-to-business companies, within a range of industries including computer hardware, software, Software as-a-Service, telecommunications, healthcare, life sciences, media and industrial systems. In 2016 we managed approximately $10.3 billion of Opportunity Under Management for our clients. Opportunity Under Management is an operational metric that represents our estimate of the value of all end customer service contracts that we have the opportunity to sell on behalf of our clients over a designated period of time. Opportunity Under Management is not a measure of our expected revenue. As of December 31, 2016, we managed approximately 143 engagements across 66 clients.
Our top ten clients accounted for approximately 66%, 57% and 51% of our revenue in 2016, 2015 and 2014, respectively. Three clients represented 14%, 11% and 11% of our revenue, respectively, in 2016. No single client represented 10% or more of our revenues in 2015. One client represented 12% of our revenue in 2014.
Our People
As of December 31, 2016, we had a total of 3,145 employees throughout the world: 1,295 employees in the United States, 76 in Bulgaria, 280 in the Republic of Ireland, 60 in Japan, 312 in the Philippines, 657 in Malaysia, 175 in Singapore and 290 in the United Kingdom. We are not subject to collective bargaining agreements with any of our employees.
Sales and Marketing
We sell our solutions through our global sales organization. Our sales representatives are organized by geographic regions: North America and Latin America (NALA); Europe, Middle East and Africa (EMEA); and Asia Pacific-Japan (APJ). In 2016, we generated 64% of our revenue in NALA; 25% in EMEA and 11% in APJ.
5
We generate client leads, accelerate sales opportunities and build brand awareness through our marketing programs. Our marketing programs target sales, services, customer success, account management, technology and finance executives within the computer hardware, software, SaaS, telecommunications, healthcare, life sciences, media and industrial systems industries. Our marketing programs are organized by geography and industry segment to focus on the unique needs of clients within the specific target markets.
We participate in industry trade shows and host local and regional events around the world to stimulate industry dialog on revenue lifecycle management and to promote our services. In addition, we actively seek to collaborate with other like-minded businesses where such collaboration can increase our market penetration or provide value to our customers. For example, in November 2016, we announced a joint solution with Gainsight™, providing enterprises with a comprehensive offering. The new Outcome360™ solution combines Gainsight™ technology, which includes customer health scoring, automated workflows and customer communications, with our expertise and methodology in data enablement and enhancement, systems integration and technical implementation. In addition, we added Gainsight™ technology to our selling services platform to enable us to deliver additional value and differentiation on behalf of our clients.
Research and Development
We focus our research and development efforts on enhancing our technologies as well as creating complementary new capabilities to add to our solutions. Our development strategy is to identify features, business intelligence, applications and other technology elements that are, or are expected to be, needed by sales professionals, customer success and account management professionals, clients, channel partners and end customers to optimize recurring revenue performance and customer success. We are also continuing to invest in the development of our technologies to serve our clients’ needs and enable greater operational efficiencies in our organization.
Our research and development expenses were $8.3 million in 2016, $16.5 million in 2015 and $25.8 million in 2014. In addition, we capitalized certain expenditures related to the development and enhancement of internal-use software in 2016, 2015 and 2014.
Competition
The market for oustourced customer success and revenue growth solutions is evolving. Historically, companies have managed their service renewals through internal personnel and relied upon a variety of technologies including spreadsheets, internally developed software and customized versions of traditional business intelligence tools and end-customer relationship management or enterprise resource planning software from vendors such as Oracle Corporation, SAP AG, salesforce.com, inc. and NetSuite, Inc. Some companies have made further investments in this area using firms such as Accenture and McKinsey & Company for technology consulting and education services focused on service renewals. These internally-developed solutions represent the primary alternative to our integrated approach of combining people, processes and technology to provide end-to-end optimized outsourced customer success and revenue growth solutions.
We believe we are the only company of scale operating at the intersection of three key customer-success vectors:
• | business process outsourcing/business process as a service (including offerings from vendors such as Accenture, Genpact and Concentrix); |
• | business-to-business revenue enablement services (including offerings from vendors such as Omnicom, Publicis and Acxiom); and |
• | data and analytics services (including offerings from vendors such as Lattice Engines, InsideSales.com and 6sense). |
We believe our unique market position and our differentiated business model allows us to maintain our market presence, and our global scale and ability to provide our solutions in over 35 languages provides a competitive advantage over smaller companies entering the outsourced customer success space.
We believe our principal competitive differentiators include:
• | recurring revenue and customer success industry expertise, best practices and benchmarks; |
• | ability to increase recurring revenue and renewal rates; |
• | global capabilities; |
• | completeness of solution; |
• | performance-based pricing of solutions; |
• | ability to effectively represent client brands to end customers and channel partners; |
6
• | quality of the business and client insight and its ability to generate revenue and customer success; |
• | size of upfront investment; and |
• | size and financial stability of operations. |
Although we currently have few direct competitors that offer integrated solutions at our scale, we expect competition and competitive pressure, from both new and existing competitors, to increase in the future.
Additional Information
Additional information about us is available on our website at http://www.servicesource.com. The information on our website is not incorporated in this report by reference and is not a part of this Form 10-K. We make available free of charge on our corporate website our Annual Reports on Form 10-K, Quarterly Reports on Form 10-Q and Current Reports on Form 8-K and any amendments to those reports filed or furnished pursuant to Section 13(a) or 15(d) of the Securities Exchange Act of 1934, as soon as reasonably practicable after those reports are electronically filed with, or furnished to, the SEC. From time to time, we may use our website as a channel of distribution of material information about our company. Financial and other important information regarding our business is routinely posted on and accessible at http://ir.servicesource.com.
ITEM 1A. | Risk Factors |
Investing in our common stock involves risk. Our operations and financial results are subject to various risks and uncertainties, including those described below, that could adversely affect our business, financial condition, results of operations, cash flows and the trading price of our common stock. You should carefully consider the risks described below and the other information in this Report on Form 10-K.
Risks Related to Our Business and Industry
Our business and growth depend substantially on clients renewing their agreements with us and expanding their use of our solution for additional available markets. Any decline in our client renewals, termination of ongoing engagements or failure to expand their relationships with us could harm our future operating results.
In order for us to improve our operating results and grow, it is important that our clients renew their agreements with us when the initial contract term expires and that we expand our client relationships to add new market opportunities and the related revenue management opportunity. Our clients may elect not to renew their contracts with us after their initial terms have expired or may elect to otherwise terminate our services, and we cannot assure you that our clients will renew service contracts with us at the same or higher level of service, if at all, or provide us with the opportunity to manage additional revenue management opportunities. Although our renewal rates have been historically higher than those achieved by our clients prior to their using our solution, some clients have still elected not to renew their agreements with us. Our clients’ renewal rates may decline or fluctuate as a result of a number of factors, many of which are beyond our control, including their satisfaction or dissatisfaction with our solution and results, our pricing, mergers and acquisitions affecting our clients or their end customers, the effects of economic conditions or reductions in our clients’ or their end customers’ spending levels. If our clients do not renew their agreements with us, renew on less favorable terms, terminate their services with us or fail to contract with us for additional Opportunity Under Management, our revenue may decline and our operating results may be adversely affected.
Our revenue will decline if there is a decrease in the overall demand for our clients’ products and services
A majority of our revenue is based on a pay-for-performance model, which means that we are paid a commission based on the service contracts we sell on behalf of our clients. If a particular client’s products or services fail to appeal to its end customers, our revenue will decline for our work with that client. In addition, if end customer demand decreases for other reasons, such as negative news regarding our clients or their products, unfavorable economic conditions, shifts in strategy by our clients away from promoting the service contracts we sell in favor of selling their other products or services to their end customers, or if end customers experience financial constraints and terminate or fail to renew the service contracts we sell, we may experience a decrease in our revenue as the demand for our clients’ service contracts declines. Similarly, if our clients come under economic pressure, they may be more likely to terminate their contracts with us or seek to restructure those contracts, and for clients whose contracts are up for renewal, they may seek to renew those contracts on less favorable terms. If one of our clients is under economic pressure due to decreasing customer demand, negative news, or other issues that impact the demand for their product or services, our business could suffer and we may experience a significant decrease in our revenue.
7
If our bookings rates fall short of our estimates, our client relationships will be at risk, our revenue will suffer and our ability to grow and achieve broader market acceptance of our solution could be harmed.
Given our pay-for-performance pricing model, a majority of our revenue is directly tied to our bookings, or closure, rates. Bookings rates represent the percentage of the Opportunity Under Management delivered to us by our clients that we renew, "close," or "book" on behalf of our clients. If the bookings rate for a particular client is lower than anticipated, then our revenue for that client will also be lower than projected. If bookings rates fall short of expectations across a broad range of clients, or if they fall below expectations for a particularly large client, then the impact on our revenue and our overall business will be significant. In the event bookings rates are lower than expected for a given client, our margins will suffer because we will have already incurred a certain level of costs in both personnel and infrastructure to support the engagement. This risk is compounded by the fact that many of our client relationships can be terminated by the client if we fail to meet certain specified sales targets, including bookings rates, over a sustained period of time. If bookings rates fall to a level at which our revenue and client contracts are at risk, then our financial performance will decline and we will be severely compromised in our ability to retain and attract new clients. Increasing our client base and achieving broader market acceptance of our solution depends, to a large extent, on how effectively our solution increases our clients' service sales. As a result, poor performance with respect to our bookings rates, in addition to causing our revenue, margins and earnings to suffer, will likely damage our client relationships and overall reputation, and prevent us from effectively developing and maintaining awareness of our brand or achieving widespread acceptance of our solution, in which case we could fail to grow our business and our revenue, margins and earnings would suffer.
If there is a widespread shift away from business end customers purchasing maintenance and support service contracts, we could be adversely impacted if we are not able to adapt to new trends or expand our target markets.
As a result of our historical concentration in the software and hardware industries, a significant portion of our revenue comes from the sale of maintenance and support service contracts for the software and hardware products used by our clients’ end customers. Although we also sell other types of renewals, such as subscriptions to software-as-a-service offerings, those sales have, to date, constituted a relatively small portion of our revenue. The continued industry progress towards the provision of technology services on a remote-access basis has adversely impacted, and we believe will continue to adversely impact, the size of the market for traditional maintenance and support contracts. If these alternative models continue gaining traction and reduce the size of our traditional market, we will need to continue to adapt our solution to capitalize on these trends or our results of operations will suffer.
We depend on a limited number of clients for a significant portion of our revenue, and the loss of business from one or more of our key clients could adversely affect our results of operations.
Our top ten clients accounted for 66% of our revenue in 2016, and three clients each represented over 10% of our revenue during this period. A relatively small number of clients may continue to account for a significant portion of our revenue for the foreseeable future. The loss of revenue from any of our significant clients for any reason, including the failure to renew our contracts, termination of some or all of our services, a change of relationship with any of our key clients, or the acquisition of one of our significant clients, may cause a significant decrease in our revenue.
If we cannot efficiently implement our offering for clients, we may be delayed in generating revenue, fail to generate revenue and/or incur significant costs.
In general, our client engagements are complex and we must undertake lengthy and significant work to implement our offerings. Changes in our go-to-market and technology strategies also will increase costs and create implementation risks for us. We generally incur sales and marketing expenses related to the commissions owed to our sales representatives and make upfront investments in technology and personnel to support the engagements one to three months before we begin selling end customer contracts on behalf of our clients. Each client’s situation may be different, and unanticipated difficulties and delays may arise as a result of our failure, or that of our client, to meet implementation responsibilities. If the client implementation process is not executed successfully or if execution is delayed, we could incur significant costs without yet generating revenue, and our relationships with some of our clients may be adversely impacted.
8
The market for our solution is relatively undeveloped and may not grow.
The market for outsourced customer success and revenue growth solutions is still relatively undeveloped, has not yet achieved widespread acceptance and may not grow quickly or at all. Our success depends to a substantial extent on the willingness of companies to engage a third party (such as us) to manage the sales of their support, maintenance and subscription contracts. Many companies have invested substantial personnel, infrastructure and financial resources in their own internal service revenue organizations or in some cases have built or modified software applications to help manage renewals, and therefore may be reluctant to switch to a solution such as ours. Companies may not engage us for other reasons, including a desire to maintain control over all aspects of their sales activities and end customer relations, concerns about end customer reaction, a belief that they can sell their support, maintenance and subscription services more cost-effectively using their internal sales organizations, perceptions about the expenses associated with changing to a new approach and the timing of expenses once they adopt a new approach, general reluctance to adopt any new and different approach to old ways of doing business, or other considerations that may not always be evident. Particularly because our market is relatively undeveloped, we must address our potential clients’ concerns and explain the benefits of our approach in order to convince them to change the way that they manage the sales of support, maintenance and subscription contracts. If companies are not sufficiently convinced that we can address their concerns and that the benefits of our solution are compelling, then the market for our solution may not develop as we anticipate and our business will not grow.
If our new and/or enhanced technologies do not work as intended, our business could suffer.
We have invested significant resources in research and development of technologies designed to enhance our managed services offerings. The development of new technologies or enhancements to existing technologies entails a number of risks that could adversely affect our business and operating results, including:
• | the risk of diverting the attention of our management and our employees from the day-to-day operations of the business; |
• | insufficient revenue to offset increased expenses associated with research, development and operational activities; and |
• | write-offs of the value of such technology investments as a result of unsuccessful implementation or otherwise. |
If any of our new or enhanced technologies do not work as intended, are not responsive to user preferences or industry or regulatory changes, are not appropriately timed with market opportunity, or do not enhance our managed service offerings, we may lose existing and potential clients or related revenue opportunities, in which case our results of operations may suffer.
We conduct operations in a number of countries and are subject to risks of international operations.
In 2016, approximately 36% of our revenue was related to operations located outside of the U.S. In addition, 59% of our employees are located in offices outside of the U.S. We expect to continue our international growth, with international revenue accounting for an increased portion of total revenue in the future. Our international operations involve risks that differ from or are in addition to those faced by our U.S. operations. These risks include different employment laws and rules and related social and cultural factors; different regulatory and compliance requirements, including in the areas of privacy and data protection, anti-bribery and anti-corruption, trade sanctions, marketing and sales and other barriers to conducting business; cultural and language differences; diverse or less stable political, operating and economic environments and market fluctuations; and civil disturbances or other catastrophic events that reduce business activity. If we are not able to efficiently adapt to or effectively manage our business in markets outside of the U.S., our business prospects and operating results could be materially and adversely affected. In particular, political tension has been increasing in Manila, the Philippines, due to comments and the behavior over the last few months of the Philippines president. Increasing civil unrest in Manila may make it difficult or impossible for us to continue our operations there. Although we have business continuity plans in place for our operations, an extended period of civil unrest that halts or significantly impedes operations could have a material adverse effect on our business.
9
Laws or public perception may eliminate or restrict our ability to use revenue delivery centers not located in the United States, which could have a material adverse impact on our business and results of operations.
The issue of companies outsourcing services to organizations operating in other countries is a politically sensitive topic and has been under heightened scrutiny in many countries, including the United States. We provide our outsourced customer success and revenue growth solutions in several non-U.S. locations, including the Philippines and Malaysia, and our growth strategy includes increasing reliance on these “offshore” revenue delivery centers. Many organizations and public figures in the United States have publicly expressed concern about a perceived association between offshore outsourcing providers and the loss of jobs in the United States, and the topic of offshore outsourcing has recently received a great deal of negative attention from the U.S. executive branch. Because of negative public perception about offshore outsourcing, measures aimed at limiting or restricting offshore outsourcing by United States companies are periodically considered in the U.S. Congress. Current or prospective clients may elect to perform such services themselves or may be discouraged from transferring these services from onshore to offshore providers to avoid negative perceptions that may be associated with using an offshore provider. Any slowdown or reversal of existing industry trends towards offshore outsourcing, including due to the enactment of any legislation restricting offshore outsourcing by U.S. companies, would harm our ability to provide certain of our services to our clients at a competitive and cost-effective price point and would have a material adverse effect on our business and results of operations.
Our estimates of Opportunity Under Management and other metrics may prove inaccurate.
We use various estimates in formulating our business plans and analyzing our potential and historical performance, including our estimate of Opportunity Under Management. We base our estimates upon a number of assumptions that are inherently subject to significant business and economic uncertainties and contingencies, many of which are beyond our control. Our estimates therefore may prove inaccurate.
Opportunity Under Management is an operational metric that represents our estimate, over a designated period of time, of the value of all end customer service contracts that we have the opportunity to sell on behalf of our clients. Opportunity Under Management is not a measure of our expected revenue. We estimate the value of end customer contracts based on a combination of factors, including the value of end customer contracts made available to us by clients in past periods; the minimum value of end customer contracts that our clients are required to give us the opportunity to sell pursuant to the terms of their contracts with us; periodic internal business reviews of our expectations as to the value of end customer contracts that will be made available to us by clients; the value of end customer contracts included in our pre-contract analysis conducted by our solution design team; and collaborative discussions with our clients assessing their expectations as to the value of service contracts that they make available to us for sale. Although the minimum value of end customer contracts that our clients are required to give us represents a portion of our estimated Opportunity Under Management, a significant portion of the Opportunity Under Management is estimated based on the other factors described above.
When estimating Opportunity Under Management and other similar metrics, we rely on our assumptions described above, which may prove incorrect. These assumptions are inherently subject to significant business and economic uncertainties and contingencies, many of which are beyond our control. Our estimates therefore may prove inaccurate and the actual value of end customer contracts delivered to us in a given period may differ from our estimate of Opportunity Under Management. The business and economic uncertainties and contingencies include:
• | the extent to which clients deliver a greater or lesser value of end customer contracts than may be required or otherwise expected; |
• | changes in the pricing or terms of service contracts offered by our clients; |
• | increases or decreases in the end customer base of our clients; |
• | the extent to which the renewal rates we achieve on behalf of a client early in an engagement affect the amount of opportunity that the client makes available to us later in the engagement; |
• | client cancellations of their contracts with us due to acquisitions or otherwise; and |
• | changes in our clients’ businesses, sales organizations, sales processes or priorities, including changes in executive support for our partnership. |
In addition, Opportunity Under Management reflects our estimates over a designated period of time and should not be used to estimate our historical or future opportunity for any particular quarter within that period. Although we experienced an increase in our Opportunity Under Management in 2016 as compared to 2015, our Opportunity Under Management declined in 2015 as compared to 2014 and in 2014 as compared to 2013. In addition, the increase in our 2016 Opportunity Under Management did not translate into proportional revenue growth in 2016.
10
If our security measures are breached or fail, resulting in unauthorized access to client data, our solution may be perceived as insecure, the attractiveness of our solution to current or potential clients may be reduced and we may incur significant liabilities.
Our solution involves the storage and transmission of the proprietary information and protected data that we receive from our clients. We rely on proprietary and commercially available systems, software, tools and monitoring, as well as other processes, to provide security for processing, transmission and storage of such information. If our security measures are breached or fail as a result of third-party action, employee negligence, error, malfeasance or otherwise, unauthorized access to client or end customer data may occur. Techniques used to obtain unauthorized access or to sabotage systems change frequently and generally are not recognized until launched against a target, and we may be unable to anticipate these techniques or implement adequate protective measures. Our security measures may not be effective in preventing these types of activities, and the security measures of our third-party data centers and service providers may not be adequate.
Our client contracts generally provide that we will indemnify our clients for data privacy breaches caused by our act or omission. If a data privacy breach occurs, we could face contractual damages, damages and fees arising from our indemnification obligations, penalties for violation of applicable laws or regulations, possible lawsuits by affected individuals and significant remediation costs and efforts to prevent future occurrences. Insurance may not be able to cover these costs in full, in particular if the damages are large. In addition, whether there is an actual or a perceived breach of our security, the market perception of the effectiveness of our security measures could be harmed significantly and we could lose current or potential clients.
We may be liable to our clients or third parties if we make errors in providing our solution or fail to properly safeguard our clients' confidential information.
The solution we offer is complex, and we make errors from time to time. These may include human errors made in the course of managing the sales process for our clients as we interact with their end customers, or errors arising from our technology solution as it interacts with our clients’ systems and the disparate data contained on such systems. For example, our employees enter codes to classify their interactions with our clients’ end customers, and incorrect code entry could result in our clients' end customer not receiving the service or solution they requested, which in turn could lead to customer dissatisfaction or termination causing our client relationships to suffer and our revenue and our clients' revenue to decline. The costs incurred in correcting any material errors may be substantial. Any claims based on errors could subject us to exposure for damages, significant legal defense costs, adverse publicity and reputational harm, regardless of the merits or eventual outcome of such claims.
Performing our obligations on the remaining Renew OnDemand subscriptions could impact our operating results.
We derive a portion of our revenue from subscriptions to Renew OnDemand, our service revenue management platform, for select clients. Although we no longer offer these stand-alone subscriptions to new customers, we will be required to continue performing our obligations on the existing subscriptions through the end of the applicable contract term. We have encountered, and may continue to encounter, technical and execution challenges that undermine the quality of the technology offering or have caused us to fall short of client expectations. Continuing to manage and perform our obligations on these existing subscription engagements may lead to a diversion of financial and managerial resources from our existing business and an inability to generate sufficient revenue to offset the costs of these subscription accounts, which would harm our results of operations.
Changes in the legal and regulatory environment that affect our operations, including laws and regulations relating to the handling of personal data, data security and cross-border data flows, may impede the adoption of our services, disrupt our business or result in increased costs, legal claims, or fines against us.
We are subject to a wide variety of laws and regulations in the United States and the other jurisdictions in which we operate, and changes in the level of government regulation of our business have the potential to materially alter our business practices with resultant increases in costs and decreases in profitability. Depending on the jurisdiction, those changes may come about through new legislation, the issuance of new regulations or changes in the interpretation of existing laws and regulations by a court, regulatory body or governmental official. Sometimes those changes have both prospective and retroactive effect, which is particularly true when a change is made through reinterpretation of laws or regulations that have been in effect for some time.
11
Our international operations and global client base relies increasingly on the movement of data across national boundaries. Legal requirements relating to the collection, storage, handling and transfer of personal data continue to evolve, and additional regulation in those areas, some of it potentially difficult and costly for us to accommodate, is frequently proposed and occasionally adopted. Laws in many countries and jurisdictions, particularly in the European Union and Canada, govern the requirements related to how we store, transfer or otherwise process the private data provided to us by our clients. In addition, the centralized nature of our information systems at the data and operations centers that we use requires the routine flow of data relating to our clients and their respective end customers across national borders, both with respect to the jurisdictions within which we have operations and the jurisdictions in which we provide services to our clients. If this flow of data becomes subject to new or different restrictions, our ability to serve our clients and their respective end customers could be seriously impaired for an extended period of time.
For example, the European Union and the United States formally entered into a new framework in July 2016 that provides a mechanism for companies to transfer data from European Union member states to the United States. This framework, called the Privacy Shield, is intended to address shortcomings identified by the European Court of Justice in a predecessor mechanism. The Privacy Shield and other mechanisms are likely to be reviewed by the European courts, which may lead to uncertainty about the legal basis for data transfers across the Atlantic. Ongoing legal reviews may result in burdensome or inconsistent requirements affecting the location and movement of our customer and internal employee data as well as the management of that data. Compliance with the Privacy Shield and other mechanisms may also require changes in services, business practices, or internal systems that result in increased costs, lower revenue, reduced efficiency, or greater difficulty in competing with foreign-based firms. As a result, we may be unsuccessful in establishing legitimate means to transfer personal data under these mechanisms, and/or we may experience reluctance or refusal by European clients to use our solutions due to potential risk exposure. Some countries are considering legislation requiring local storage and processing of data that could increase the cost and complexity of delivering our services.
We also have entered into various model contracts and related contractual provisions to enable these data flows. For any jurisdictions in which these measures are not recognized or otherwise not compliant with the laws of the countries in which we process data, or where more stringent data privacy laws are enacted irrespective of international treaty arrangements or other existing compliance mechanisms, we could face increased compliance expenses and face penalties for violating such laws or be excluded from those markets altogether, in which case our operations could be materially damaged.
If we are unable to compete effectively, our business and operating results will be harmed.
The market for outsourced customer success and revenue growth solutions is evolving and new competitors are emerging. Historically, internally-developed solutions have represented the primary alternative to our offerings. However, we also face direct competition from smaller companies that offer specialized revenue management solutions as well as larger business process outsourcers that are moving into the revenue growth space. We believe that more competitors will emerge. Competitors may have greater name recognition, longer operating histories, well-established relationships with clients in our markets and substantially greater financial, technical, personnel and other resources than we have, and even a potentially broader array of offerings. Potential competitors of any size may be able to respond more quickly and effectively than we can to new or changing opportunities, technologies, standards or end customer requirements. Even if our solution is more effective than competing solutions, potential clients might choose new entrants unless we can convince them of the advantages of our integrated solution. We expect competition and competitive pressure, from both new and existing competitors, to increase in the future.
Consolidation in the technology sector could harm our business in the event that our clients are acquired and their contracts are canceled.
Consolidation among technology companies in our target market has been robust in recent years, and this trend poses a risk for us. Acquisitions of our clients could lead to cancellation of our contracts with those end customers by the acquiring companies and could reduce the number of our existing and potential clients. For example, in January 2010, Oracle acquired our then-largest client, Sun Microsystems, as well as several of our smaller clients. Oracle elected to terminate our service contracts with each client because Oracle conducted its service revenue management internally. We have seen this trend continue through the years. If mergers and acquisitions take place within our customer base, some of the acquiring companies may terminate, renegotiate and/or elect not to renew our contracts with the companies they acquire, which would reduce our revenue. In addition, acquisitions in our customer base may adversely impact our revenue even if the contract is not terminated. The sales we make on behalf of our customers are processed through our customers’ billing and quoting platforms. If our customers are acquired or merge with another company and as a result their billing platforms or the procedures for processing closed sales are changed or slowed down, we will be unable to close our sales and our closure rate, and therefore our revenue and our ability to keep our customers, could suffer.
12
We enter into long-term, commission-based contracts with our clients, and our failure to correctly price these contracts may negatively affect our profitability.
We enter into long-term contracts with our clients that are priced based on multiple factors determined in large part by the performance analysis we conduct for our clients. These factors include opportunity size, anticipated booking rates and expected commission rates at various levels of sales performance. Some of these factors require forward-looking assumptions that may prove incorrect. If our assumptions are inaccurate, or if we otherwise fail to correctly price our client contracts, particularly those with lengthy contract terms, then our revenue, profitability and overall business operations may suffer. Further, if we fail to anticipate any unexpected increase in our cost of providing services, including the costs for employees, office space or technology, we could be exposed to risks associated with cost overruns related to our required performance under our contracts, which could have a negative effect on our margins and earnings.
Our business may be harmed if our clients rely upon our service revenue forecasts in their business and actual results are materially different.
The contracts that we enter into with our clients provide for sharing of information with respect to forecasts and plans for the renewal of maintenance, support and subscription agreements of our clients. Our clients may use this forecasted data for a variety of purposes related to their business. Our forecasts are based upon the data our clients provide to us, and are inherently subject to significant business, economic and competitive uncertainties, many of which are beyond our control. In addition, these forecasted expectations are based upon historical trends and data that may not be true in subsequent periods. Any material inaccuracies related to these forecasts could lead to claims on the part of our clients related to the accuracy of the forecasted data we provide to them, or the appropriateness of our methodology. Any liability that we incur or any harm to our brand that we suffer because of inaccuracies in the forecasted data we provide to our clients could impact our ability to retain existing clients and harm our business.
Changing global economic conditions and large scale economic shifts may impact our business.
Our overall performance depends in part on worldwide economic conditions that impact the technology sector and other technology-enabled industries such as healthcare, life sciences and industrial systems. For example, an economic downturn typically results in many businesses deferring technology investments, including purchases of new software, hardware and other equipment, and purchases of additional or supplemental maintenance, support and subscription services. To a certain extent, these businesses also slow the rate of renewals of maintenance, support and subscription services for their existing technology base. Any future downturn could cause business end customers to stop renewing their existing maintenance, support and subscription agreements or contracting for additional maintenance services as they look for ways to further cut expenses, in which case our business could suffer.
Conversely, a significant upturn in global economic conditions could cause business purchasers to purchase new hardware, software and other technology products, which we generally do not sell, instead of renewing or otherwise purchasing maintenance, support and subscription services for their existing products. A general shift toward new product sales could reduce our near term opportunities for these contracts, which could lead to a decline in our revenue.
Our inability to expand our target markets could adversely impact our business and operating results.
We derive substantially all of our revenue from clients in certain sectors in the technology and technology-enabled healthcare and life sciences industries, and an important part of our strategy is to expand our existing client base and win new clients in these industries. In addition, because of the service revenue opportunities that we believe exist beyond these industries, we intend to target new clients in additional industry vertical markets, such as heavy machinery and manufacturing. In connection with the expansion of our target markets, we may not have familiarity with such additional industry verticals, and our execution of such expansion could face risks where our experience base is less developed within a particular new vertical. We may encounter clients in these previously untapped markets that have different pricing and other business sensitivities than we are used to managing. As a result of these and other factors, our efforts to expand our solution to additional industry vertical markets may not succeed, may divert management resources from our existing operations and may require us to commit significant financial resources to unproven parts of our business, all of which may harm our financial performance.
13
A substantial portion of our business consists of supporting our clients’ channel partners in the sale of service contracts. If those channel partners become unreceptive to our solution, our business could be harmed.
Many of our clients, including some of our largest clients, sell service contracts through their channel partners and engage our solution to help those channel partners become more effective at selling service contract renewals. In this context, the ultimate buyers of the service contracts are end customers of those channel partners, who then receive the actual services from our clients. In the event our clients’ channel partners become unreceptive to our involvement in the renewals process, those channel partners could discourage our current or future clients from engaging our solution to support channel sales. This risk is compounded by the fact that large channel partners may have relationships with more than one of our clients or prospects, in which case the negative reaction of one or more of those large channel partners could impact multiple client relationships. Accordingly, with respect to those clients and prospective clients who sell service contracts through channel partners, any significant resistance to our solution by their channel partners could harm our ability to attract or retain clients, which would damage our overall business operations.
We face long sales cycles to secure new client contracts, making it difficult to predict the timing of specific new client relationships.
We face a variable selling cycle to secure new client agreements, typically spanning a number of months and requiring our effort to obtain and analyze our prospect’s business through the service performance analysis, for which we are not paid. We recently have also experienced a lengthening of our sales cycles reflecting the hiring of a number of new sales personnel in the past eighteen months who are new to selling our solution as well as slower decision making by a few end customers as well as other end customers considering renewals of large, multi-year contracts. This has adversely affected the conversion rates of new client contracts. Moreover, even if we succeed in developing a relationship with a potential new client, the scope of the potential subscription or service revenue management engagement frequently changes over the course of the business discussions and, for a variety of reasons, our sales discussions may fail to result in new client acquisitions. Consequently, we have only a limited ability to predict the timing and size of specific new client relationships.
If we fail to balance our expenses with our revenue forecasts or experience significant fluctuations in our business, our results could be harmed and we may need to raise additional capital.
Due to our evolving business model, the uncertain size of our markets and the unpredictability of future general economic and financial market conditions, we expect to continue to require significant capital and may not be able to accurately forecast our revenue and operating needs. We require a significant amount of cash resources to operate our business. We plan our expense levels and investments based on estimates of future sales performance for our clients with respect to their end customers, future revenue and future end customer acquisition. If our assumptions prove incorrect, we may not be able to adjust our spending quickly enough to offset the resulting decline in growth and revenue. Consequently, we expect that our gross margins, operating margins and cash flows may fluctuate significantly on a quarterly basis, and we may need to raise additional capital in order to meet operating and capital expenditure requirements. Any decline in our client renewals or termination of our ongoing engagements may result in higher than anticipated losses in the future and shorten the time before we would need to raise additional capital. If we issue equity securities in order to raise additional funds, substantial dilution to existing stockholders may occur. If we raise cash through additional indebtedness, we may be subject to additional contractual restrictions on our business.
Changes to management, including turnover of our top executives, or an inability to attract, hire, integrate and retain key personnel and other necessary employees, may harm our business.
Our future success depends on the continued contributions of our executives, each of whom may be difficult to replace. Our future success also depends in part on our ability to attract, hire, integrate and retain qualified service sales personnel, sales representatives and management- level employees to oversee such sales forces in addition to marketing, research and development and general and administrative personnel to support our global operation. We have experienced increased turnover in key executive positions, including our chief executive officer and chief financial officer positions in 2015 and chief customer officer in 2016. These new executives may view the business differently than prior members of management, and over time may make changes to our strategic focus, operations or business plans with corresponding changes in how we report our results of operations. We can make no assurances that our new executives will be able to properly manage any such shift in focus or that any changes to our business would ultimately prove successful. The loss of any of our key executives, or our inability to continue to attract, retain and integrate high-quality talent, could harm our business.
14
Because competition for our target employees is intense, we may be unable to attract and retain the highly skilled employees we need to support our planned growth.
To continue to execute on our growth plan, we must attract and retain highly qualified sales representatives, engineers and other key employees in the international markets in which we have operations. Competition for these personnel is intense, especially for highly educated, qualified sales representatives with multiple language skills. We have from time to time in the past experienced, and we expect to continue to experience in the future, difficulty in hiring and retaining highly skilled key employees with appropriate qualifications. If we fail to attract new sales representatives, engineers and other key employees, or fail to retain and motivate our most successful employees, our business and future growth prospects could be harmed.
The length of time it takes our newly-hired sales representatives to become productive could adversely impact our success rate, the execution of our overall business plan and our costs.
It can take twelve months or longer before our internal sales representatives are fully trained and productive in selling our solution to prospective clients. This long ramp period presents a number of operational challenges as the cost of recruiting, hiring and carrying new sales representatives cannot be offset by the revenue such new sales representatives produce until after they complete their long ramp periods. Further, given the length of the ramp period, we often cannot determine if a sales representative will succeed until he or she has been employed for a year or more. If we cannot reliably develop our sales representatives to a productive level, or if we lose productive representatives in whom we have heavily invested, our future growth rates and revenue will suffer.
Our revenue and earnings are affected by foreign currency exchange rate fluctuations.
In 2016, approximately 36% of our revenue was generated outside of the United States, as compared to 34% of our revenue in 2015. As a result of our continued focus on international markets, we expect that revenue derived from international sources will continue to represent a significant portion of our total revenue.
A portion of the sales commissions earned from our international clients is paid in foreign currencies. As a result, fluctuations in the value of these foreign currencies may make our solution more expensive or cause resulting fluctuations in cost for international clients, which could harm our business. We currently do not undertake hedging activities to manage these currency fluctuations. In addition, if the effective price of the contracts we sell to end customers were to increase as a result of fluctuations in the exchange rate of the relevant currencies, demand for such contracts could fall, which in turn would reduce our revenue.
The planned exit of the United Kingdom from the European Union could adversely affect our business.
The upcoming departure of the United Kingdom from the European Union, known as Brexit, could have significant implications for our business. We have a revenue delivery center in Liverpool, United Kingdom, and Brexit has, and could continue to, create uncertainty in our employee base relating to immigration and other cross-border matters. Brexit could lead to economic and legal uncertainty, including significant volatility in currency exchange rates, reduced customer demand for our services, and increasingly divergent laws and regulations as the United Kingdom determines which European Union laws to replace or replicate. In addition, Brexit could cause a shift or increase in data privacy regulations for data transfers between the United Kingdom and European Union. Any of these effects of Brexit, among others, could adversely affect our operations in the United Kingdom and our financial results.
We may not succeed in expanding to additional international locations.
Our growth strategy includes further expansion into international markets. Our international expansion, including opening new office locations, may require significant additional financial resources and management attention, and could negatively affect our financial condition, cash flows and operating results. In addition, we may be exposed to associated risks and challenges, including:
• | the need to localize and adapt our solution for specific countries, including translation into foreign languages and associated expenses; |
• | difficulties in staffing and managing foreign operations; |
• | different pricing environments, longer sales cycles and longer accounts receivable payment cycles and difficulties in collecting accounts receivable; |
• | new and different sources of competition; |
15
• | weaker protection for our intellectual property than in the United States and practical difficulties in enforcing our rights abroad; |
• | laws and business practices favoring local competitors; |
• | compliance obligations related to multiple, conflicting and changing foreign governmental laws and regulations, including employment, tax, privacy and data protection laws and regulations; |
• | increased financial accounting and reporting burdens and complexities; |
• | restrictions on the transfer of funds; |
• | adverse tax consequences; and |
• | unstable regional economic and political conditions. |
We may not succeed in creating additional international demand for our solution and we may not be able to effectively sell service agreements in the international markets we enter.
Although we believe we currently have adequate internal control over financial reporting, we are required to evaluate our internal control over financial reporting under Section 404 of the Sarbanes-Oxley Act of 2002 and any adverse results from such evaluation could result in a loss of investor confidence in our financial reports and have an adverse effect on our stock price.
Under Section 404 of the Sarbanes-Oxley Act, we are required to furnish a report by our management on our internal control over financial reporting. The report contains, among other matters, an assessment of the effectiveness of our internal control over financial reporting as of the end of our fiscal year, including a statement as to whether or not our internal control over financial reporting is effective. This assessment must include disclosure of any material weaknesses in our internal control over financial reporting identified by management.
We monitor and assess our internal control over financial reporting, and if our management identifies one or more material weaknesses in our internal control over financial reporting and such weakness remains uncorrected at year-end, we will be unable to assert such internal control is effective at such time. Additionally, there can be no guaranty that our internal controls will prevent all errors or fraud, restatements, or other similar problems. If we are unable to assert that our internal control over financial reporting is effective at year-end (or if our independent registered public accounting firm is unable to express an opinion on the effectiveness of our internal control over financial reporting or concludes that we have a material weakness in our internal controls), we could lose investor confidence in the accuracy and completeness of our financial reports, which would likely have an adverse effect on our business and stock price.
Claims by others that we infringe or violate their intellectual property could force us to incur significant costs and require us to change the way we conduct our business.
Our services or solutions could infringe the intellectual property rights of others, impacting our ability to deploy our services or solutions with our clients. From time to time, we receive letters from other parties alleging, or inquiring about, possible breaches of their intellectual property rights. These claims could require us to cease activities, incur expensive licensing costs, or engage in costly litigation, each of which could adversely affect our business and results of operations.
In addition, we may incorporate open source software into our technology solution. The terms of many open source licenses have not been interpreted by United States or foreign courts, and there is a risk that such licenses could be construed in a manner that imposes unanticipated conditions or restrictions on our commercialization of any of our solutions that may include open source software. As a result, we will be required to analyze and monitor our use of open source software closely. As a result of the use of open source software, we could be required to seek licenses from third parties in order to develop such future products, re-engineer our products, discontinue sales of our solutions or release our software code under the terms of an open source license to the public. Given the nature of open source software, there is also a risk that third parties may assert copyright and other intellectual property infringement claims against us based on any use of such open source software. These claims could result in significant expense to us, which could harm our business.
16
Interruption of operations at our data centers and revenue delivery centers could have a materially adverse effect on our business.
If we experience a temporary or permanent interruption in our operations at one or more of our data or revenue delivery centers, through natural disaster, casualty, operating malfunction, cyberattack, sabotage or other causes, we may be unable to provide the services we are contractually obligated to deliver. Failure to provide contracted services could result in contractual damages or clients’ termination or renegotiation of their contracts. Although we maintain disaster recovery and business continuity plans and precautions designed to protect our company and our clients from events that could interrupt our delivery of services, there is no guarantee that such plans and precautions will be effective or that any interruption will not be prolonged. Any prolonged interruption in our ability to provide services to our clients for which our plans and precautions fail to adequately protect us could have a material adverse effect on our business, results of operation and financial condition.
We are dependent on the continued participation and level of service of our third-party platform provider. Any failure or disruption in this service could materially and adversely affect our ability to manage our business effectively.
We rely on salesforce.com to provide the platform supporting many of our technologies and Amazon Web Services ("AWS") to support a significant portion of our data storage. If salesforce.com or AWS stops supporting our technologies or if they fail to provide a platform that consistently and adequately supports our solution, including as a result of errors or failures in their systems or events beyond their control, or refuse to provide this platform on terms acceptable to us or at all and we are not able to find suitable alternatives, our business may be materially and adversely affected.
Additional government regulations may reduce the size of the market for our solution, harm demand for our solution and increase our costs of doing business.
Any changes in government regulations that impact our clients or their end customers could have a harmful effect on our business by reducing the size of our addressable market or otherwise increasing our costs. For example, with respect to our technology-enabled healthcare and life sciences clients, any change in U.S. Food and Drug Administration or foreign equivalent regulation of, or denial, withholding or withdrawal of approval of, our clients’ products could lead to a lack of demand for service revenue management with respect to such products. Other changes in government regulations, in areas such as privacy, export compliance or anti-bribery statutes, such as the U.S. Foreign Corrupt Practices Act, could require us to implement changes in our services or operations that increase our cost of doing business and thereby hurt our financial performance.
We may be subject to state, local and foreign taxes that could harm our business.
We operate revenue delivery centers in multiple locations. Some of the jurisdictions in which we operate, such as Ireland, give us the benefit of either relatively low tax rates, tax holidays or government grants, in each case, that are dependent on how we operate or how many jobs we create and employees we retain. We plan on utilizing such tax incentives in the future as opportunities are made available to us. Any failure on our part to operate in conformity with applicable requirements to remain qualified for any such tax incentives or grants may result in an increase in our taxes. In addition, jurisdictions may choose to increase rates at any time due to economic or other factors. Any such rate increases may harm our results of operations.
We may lose sales or incur significant costs should various tax jurisdictions impose taxes on either a broader range of services or services that we have performed in the past. We may be subject to audits of the taxing authorities in the jurisdictions where we do business that would require us to incur costs in responding to such audits. Imposition of such taxes on our services could result in substantial unplanned costs, would effectively increase the cost of such services to our clients and may adversely affect our ability to retain existing clients or to gain new clients in the areas in which such taxes are imposed.
We may be exposed to various risks related to legal proceedings or claims that could adversely affect our operating results.
From time to time, we may be party to lawsuits in the normal course of our business. Such litigation may include claims, suits, government investigations and other proceedings involving intellectual property rights, commercial, corporate and securities, labor and employment, wage and hour and other matters. Litigation in general can be expensive, lengthy and disruptive to normal business operations. Moreover, the results of complex legal proceedings are difficult to predict. Responding to lawsuits brought against us, or legal actions initiated by us, can often be expensive and time-consuming. Unfavorable outcomes from any claims and/or lawsuits could adversely affect our business, results of operations, or financial condition and we could incur substantial monetary liability and/or be required to change our business practices. Our business and technology acquisition activity could also result in litigation in connection with such acquired companies.
17
We may incur material restructuring charges.
We continually evaluate ways to reduce our operating expenses and adapt to changing industry and market conditions through new restructuring opportunities, including more effective utilization of our assets, workforce and operating facilities. We have recorded restructuring charges in the past and we may incur material restructuring charges in the future. The risk that we incur material restructuring charges may be heightened during economic downturns or with expanded global operations.
We have incurred indebtedness in connection with our business and may in the future incur additional indebtedness that could limit cash flow available for our operations, limit our ability to borrow additional funds and, if we were unable to repay our debt when due, would have a material adverse effect on our business, results of operations, cash flows and financial condition.
In August 2013, we issued $150.0 million aggregate principal amount of 1.50% convertible notes due August 1, 2018 (the “Notes”). The Notes will mature on August 1, 2018, unless earlier converted. Upon conversion, the Notes will be settled in cash, shares of our stock, or any combination thereof, at our option. In addition, we may incur additional indebtedness in connection with financing acquisitions, strategic transactions or for other purposes. We are subject to the risks normally associated with debt obligations, including the risk that we will be unable to refinance our indebtedness, or that the terms of such refinancing will not be as favorable as the terms of our indebtedness.
Our indebtedness could have a material adverse effect on our business, results of operations, cash flows and financial condition. For example, it could:
• | increase our vulnerability to general adverse economic and industry conditions; |
• | reduce our ability to use cash to fund acquisitions, working capital and other general corporate purposes; |
• | limit our flexibility in planning for, or reacting to, changes in our business; |
• | restrict us from exploiting business opportunities; |
• | dilute our existing stockholders if we elect to issue common stock instead of paying cash in the event the holders convert the 2018 Notes, or any other convertible securities issued in the future; |
• | limit our ability to borrow additional funds for working capital, capital expenditures, acquisitions, execution of our business strategy or other general corporate purposes. |
If we are unable to generate sufficient cash flow or otherwise obtain funds necessary to make required payments or otherwise refinance the Notes or any additional debt that we incur, our business could suffer.
Changes in financial accounting standards or practices may cause adverse, unexpected financial reporting fluctuations and affect our reported operating results.
We prepare our financial statements to conform to generally accepted accounting principles in the United States. These accounting principles are subject to interpretation by the Financial Accounting Standards Board, American Institute of Certified Public Accountants, the U.S. Securities and Exchange Commission and various bodies formed to interpret and create appropriate accounting standards and guidelines. A change in those standards and guidelines can have a significant effect on our reported results and may affect our reporting of transactions that were completed before a change is announced. Changes to those rules or the questioning of current practices may adversely affect our reported financial results or the way we conduct our business. For example, in May 2014, the FASB issued an accounting standards update on a comprehensive new revenue recognition standard that will supersede the majority of existing revenue recognition guidance. We are in the process of performing our initial assessment of the impacts of the standard, and have not yet determined whether the standard will have a material impact on our consolidated financial statements. Depending on the outcome of our assessment and the potential issuance of further accounting pronouncements, implementation guidelines and interpretations, we may be required to modify our reported results, revenue recognition policies, or business practices, which could materially adversely affect our results of operations. Also, implementation of this new standard could have a significant effect on our post-adoption financial results, and any difficulties in implementing the standard could cause us to fail to meet our financial reporting obligations, which could result in regulatory discipline and harm investors’ confidence in us. Under the new standard, we will be required to use judgment and make estimates, including identifying performance obligations in our contracts, estimating the amount of variable consideration to include in the transaction price, allocating the transaction price to each separate performance obligation, determining when performance obligations have been satisfied, identifying the costs to acquire and fulfill client contracts and determine the contract period and/or client life over which to expense these costs.
18
The final revenue recognition standard is expected to take effect for us in 2018. See “Notes to Consolidated Financial Statements - Recently Issued Accounting Pronouncements” for more detail.
Risks Relating to Owning Our Common Stock and Capitalization Matters
Our results may differ significantly from any guidance that we may issue.
From time to time, we may release financial guidance or other forward-looking statements in our earnings releases, earnings conference calls or otherwise, regarding our future performance that represent our management’s estimates as of the date of release. If given, this guidance will be based on forecasts prepared by our management. These forecasts are not prepared with a view toward compliance with published accounting guidelines, and neither our independent registered public accounting firm nor any other independent expert or outside party compiles or examines the forecasts and, accordingly, no such person expresses any opinion or any other form of assurance with respect to such forecasts. The principal reason that we may release guidance is to provide a basis for our management to discuss our business outlook with analysts and investors. We do not accept any responsibility for any projections or reports published by any third persons. Guidance is necessarily speculative in nature, and it can be expected that some or all of the assumptions of any future guidance furnished by us may not materialize or may vary significantly from actual future results.
Concentration of ownership among our existing executive officers, directors and their affiliates may prevent new investors from influencing significant corporate decisions.
Our directors and executive officers and their affiliates beneficially own, in the aggregate, approximately 17.8% of our outstanding common stock as of December 31, 2016. As a result, these stockholders will have substantial influence over all matters requiring stockholder approval, including the election of directors and approval of significant corporate transactions, such as a merger or other sale of our company or its assets. This concentration of ownership could limit the ability of other stockholders to influence corporate matters and may have the effect of delaying or preventing a third party from acquiring control over us.
Anti-takeover provisions contained in our certificate of incorporation and bylaws, as well as provisions of Delaware law, could impair a takeover attempt.
Our certificate of incorporation, bylaws and Delaware law contain provisions that could have the effect of rendering more difficult or discouraging an acquisition deemed undesirable by our board of directors. Our corporate governance documents include provisions:
• | authorizing blank check preferred stock, which could be issued by our board of directors without stockholder approval, with voting, liquidation, dividend and other rights superior to our common stock; |
• | classifying our board of directors, staggered into three classes, only one of which is elected at each annual meeting; |
• | limiting the liability of, and providing indemnification to, our directors and officers; |
• | limiting the ability of our stockholders to call and bring business before special meetings and to take action by written consent in lieu of a meeting; |
• | requiring advance notice of stockholder proposals for business to be conducted at meetings of our stockholders and for nominations of candidates for election to our board of directors; |
• | controlling the procedures for the conduct and scheduling of stockholder meetings; |
• | providing the board of directors with the express power to postpone previously scheduled annual meetings and to cancel previously scheduled special meetings; |
• | limiting the determination of the number of directors on our board and the filling of vacancies or newly created seats on the board to our board of directors then in office; and |
• | providing that directors may be removed by stockholders only for cause. |
These provisions, alone or together, could delay hostile takeovers and changes in control or changes in our management. As a Delaware corporation, we are also subject to provisions of Delaware law, including Section 203 of the Delaware General Corporation law, which limits the ability of stockholders owning in excess of 15% of our outstanding common stock to merge or combine with us.
19
Any provision of our certificate of incorporation, by laws or Delaware law that has the effect of delaying or deterring a change in control could limit the opportunity for our stockholders to receive a premium for their shares of our common stock, and could also affect the price that some investors are willing to pay for our common stock.
If securities or industry analysts do not publish or cease publishing research or reports about us, our business or our market, or if they change their recommendations regarding our stock, our stock price and trading volume could decline.
The trading market for our common stock depends in part on the research and reports that securities or industry analysts publish about us or our business. If any of these analysts cease coverage of us, the trading price and trading volume of our stock could be negatively impacted. If analysts downgrade our stock or publish unfavorable research about our business, our stock price would also likely decline.
We are leveraged financially, which could adversely affect our ability to adjust our business to respond to competitive pressures and to obtain sufficient funds to satisfy our future growth, business needs and development plans.
We have substantial existing indebtedness. In August 2013, we issued $150.0 million aggregate principal amount of our convertible notes.
The degree to which we are leveraged could have negative consequences, including, but not limited to, the following:
• | we may be more vulnerable to economic downturns, less able to withstand competitive pressures and less flexible in responding to changing business and economic conditions; |
• | our ability to obtain additional financing in the future for working capital, capital expenditures, acquisitions, general corporate or other purposes may be limited; |
• | a substantial portion of our cash flows from operations in the future may be required for the payment of the principal amount of our existing indebtedness when it becomes due; and |
• | we may be required to make cash payments upon any conversion of the convertible notes, which would reduce our cash on hand. |
A failure to comply with the covenants and other provisions of our debt instruments could result in events of default under such instruments, which could permit acceleration of all of our outstanding convertible notes and credit facilities.
Any required repurchase of the convertible notes as a result of a fundamental change or acceleration of the convertible notes would reduce our cash on hand such that we would not have those funds available for use in our business. If we are at any time unable to generate sufficient cash flows from operations to service our indebtedness when payment is due, we may be required to attempt to renegotiate the terms of the instruments relating to the indebtedness, seek to refinance all or a portion of the indebtedness or obtain additional financing. There can be no assurance that we will be able to successfully renegotiate such terms, that any such refinancing would be possible or that any additional financing could be obtained on terms that are favorable or acceptable to us.
Conversion of our convertible notes will dilute the ownership interest of existing stockholders and may depress the price of our common stock.
The conversion of some or all of our convertible notes will dilute the ownership interests of then-existing stockholders to the extent we deliver shares upon conversion of any of the notes. Any sales in the public market of the common stock issuable upon such conversion could adversely affect prevailing market prices of our common stock. In addition, the existence of the notes may encourage short selling by market participants because the conversion of the notes could be used to satisfy short positions, or anticipated conversion of the notes into shares of our common stock could depress the price of our common stock.
The conditional conversion feature of the notes, if triggered, may adversely affect our financial condition and operating results.
In the event the conditional conversion feature of the notes is triggered, holders of notes will be entitled to convert the notes at any time during specified periods at their option. If one or more holders elect to convert their notes, unless we elect to satisfy our conversion obligation by delivering solely shares of our common stock (other than paying cash in lieu of delivering any fractional share), we would be required to settle a portion of our conversion obligation through the payment of cash, which could adversely affect our liquidity. In addition, even if holders do not elect to convert their notes, we could be required under applicable accounting rules to reclassify all or a portion of the outstanding principal of the notes as a current rather than long term liability, which would result in a material reduction of our net working capital.
20
ITEM 1B. | UNRESOLVED STAFF COMMENTS |
None.
ITEM 2. | PROPERTIES |
The table below describes the location, size and principal function of our global locations. We do not own any real estate; all of our facilities are occupied under long-term leases with varying expiration dates. We believe that our facilities are adequate to meet our needs for the foreseeable future.
Location | Square Footage | Region | Type of Facility |
Nashville, TN, United States | 120,685 | NALA | Revenue Delivery Center |
Denver, CO, United States | 71,319 | NALA | Revenue Delivery Center |
Kuala Lumpur, Malaysia | 70,782 | APJ | Revenue Delivery Center |
Manila, Philippines | 68,049 | APJ | Revenue Delivery Center |
Dublin, Republic of Ireland | 37,923 | EMEA | Revenue Delivery Center |
San Francisco, CA, United States | 24,394 | NALA | Research and Development Center |
Liverpool, United Kingdom | 22,500 | EMEA | Revenue Delivery Center |
Sofia, Bulgaria | 22,104 | EMEA | Revenue Delivery Center |
Singapore | 17,626 | APJ | Revenue Delivery Center |
Yokohama, Japan | 8,977 | APJ | Revenue Delivery Center |
Issaquah, WA, United States | 8,441 | NALA | Research and Development Center |
Redwood City, CA, United States | 4,267 | NALA | Research and Development Center |
ITEM 3. | LEGAL PROCEEDINGS |
The Company is subject to various legal proceedings and claims arising in the ordinary course of our business, including the cases discussed below. Although the results of litigation and claims cannot be predicted with certainty, the Company is currently not aware of any litigation or threats of litigation in which the final outcome could have a material adverse effect on our business, operating results, financial position, or cash flows. Regardless of the outcome, litigation can have an adverse impact on the Company because of defense and settlement costs, diversion of management resources and other factors. The Company records a contingent liability when it is probable that a loss has been incurred and the amount is reasonably estimable in accordance with accounting for contingencies. As of December 31, 2016, the Company has accrued a $1.5 million reserve relating to our potential liability for currently pending disputes, reflected in Accrued Expenses in the condensed consolidated balance sheets and in the notes to our condensed consolidated financial statements appearing elsewhere in this Annual Report on Form 10-K.
On July 8, 2015, a single plaintiff filed a putative securities class action lawsuit, Weller v. ServiceSource International, Inc. et al., in the U.S. District Court for the Northern District of California (the “Weller Lawsuit”) against the Company and the Company’s former Chief Executive Officer. All claims under the Weller Lawsuit have been dismissed with prejudice.
On August 23, 2016, the United States District Court for the Middle District of Tennessee granted conditional class certification in a lawsuit originally filed on September 21, 2015 by three former senior sales representatives. The lawsuit, Sarah Patton, et al v. ServiceSource Delaware, Inc., asserts a claim under the Fair Labor Standards Act alleging that certain sales account representatives and senior sales representatives in our Nashville location were not paid for all hours worked and were not properly paid for overtime hours worked. The complaint also asserts claims under Tennessee state law for breach of contract and unjust enrichment, however, the plaintiffs have not yet filed a motion to certify the state law breach of contract and unjust enrichment claims as a class action. The Company will continue to vigorously defend itself against these claims.
21
ITEM 4. | MINE SAFETY DISCLOSURES |
Not applicable.
22
PART II
ITEM 5. | MARKET FOR REGISTRANT’S COMMON EQUITY, RELATED STOCKHOLDER MATTERS AND ISSUER PURCHASES OF EQUITY SECURITIES |
Market Information
Our common stock is traded on The NASDAQ Global Market under the symbol “SREV.” The following table sets forth, for the time period indicated, the high and low prices of our common stock as reported on The NASDAQ Global Market.
2016 | |||||||
High | Low | ||||||
First Quarter | $ | 4.62 | $ | 3.35 | |||
Second Quarter | $ | 4.54 | $ | 3.52 | |||
Third Quarter | $ | 5.31 | $ | 3.89 | |||
Fourth Quarter | $ | 6.25 | $ | 4.40 | |||
2015 | |||||||
High | Low | ||||||
First Quarter | $ | 4.70 | $ | 3.05 | |||
Second Quarter | $ | 5.55 | $ | 3.00 | |||
Third Quarter | $ | 6.15 | $ | 3.95 | |||
Fourth Quarter | $ | 5.75 | $ | 3.93 | |||
Holders
As of February 17, 2017, there were 71 holders of record of our common stock. A substantially greater number of holders of our common stock are “street name” or beneficial holders, whose shares are held by banks, brokers and other financial institutions.
Dividends
We have never declared or paid cash dividends on our common stock. We currently intend to retain all available funds and any future earnings for use in the operation of our business and do not anticipate paying any dividends on our common stock in the foreseeable future. Any future determination to declare dividends will be made at the discretion of our board of directors and will depend on our financial condition, operating results, capital requirements, general business conditions and other factors that our board of directors may deem relevant.
Stock Performance Graph
This performance graph shall not be deemed “filed” for purposes of Section 18 of the Securities Exchange Act of 1934, as amended (Exchange Act), or incorporated by reference into any filing of ServiceSource under the Securities Act of 1933, as amended, or the Securities Act, except as shall be expressly set forth by specific reference in such filing.
The following graph shows a comparison from March 25, 2011(the date our common stock commenced trading on The NASDAQ Global Market) through December 31, 2016, of the cumulative total return for (1) our common stock, (2) the Morgan Stanley Technology Index and (3) the NASDAQ Composite Index. Such returns are based on historical results and are not intended to suggest future performance. Data for the NASDAQ Composite Index and the Morgan Stanley Technology Index assume reinvestment of dividends. We have never declared or paid cash dividends on our common stock nor do we anticipate paying any such cash dividends in the foreseeable future.
23
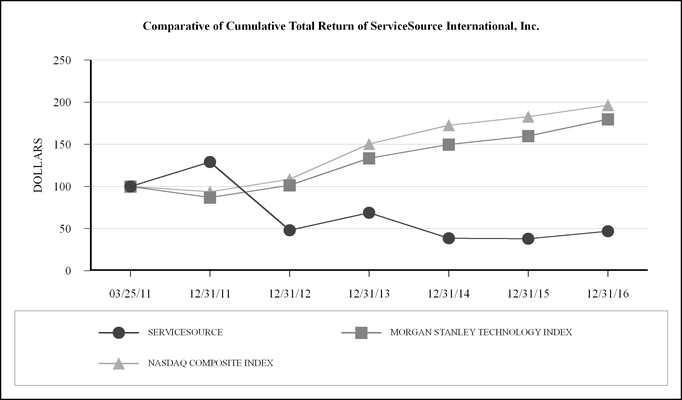
ServiceSource | Morgan Stanley Technology Index | NASDAQ Composite Index | ||||
3/25/2011 | 100.00 | 100.00 | 100.00 | |||
12/31/2011 | 128.82 | 86.91 | 93.67 | |||
12/31/2012 | 48.03 | 101.22 | 108.57 | |||
12/31/2013 | 68.80 | 133.39 | 150.18 | |||
12/31/2014 | 38.42 | 149.78 | 172.66 | |||
12/31/2015 | 37.85 | 159.91 | 182.55 | |||
12/31/2016 | 46.63 | 179.63 | 196.25 | |||
Recent Sales of Unregistered Securities
None.
Purchases of Equity Securities by the Issuer and Affiliated Purchasers
There were no stock repurchases during the quarter ended December 31, 2016. In August 2015, the Board authorized a stock repurchase program with a maximum authorization to repurchase up to $30.0 million worth of common stock of the Company. The program expires in August 2017. During fiscal 2016, we repurchased and retired 2.3 million shares of our common stock at an average price of $3.94 per share for an aggregate purchase price of $8.9 million. Since inception of the stock repurchase program through December 31, 2016, we had repurchased and retired 2.6 million shares of our common stock at an average price of $3.96 per share for an aggregate purchase price of $10.1 million since inception of the stock repurchase program. The aggregate amount available under the program was approximately $19.9 million at December 31, 2016. The Company’s share repurchase program does not obligate it to acquire any specific number of shares. Under the program, shares may be repurchased in privately negotiated and/or open market transactions, including under plans complying with Rule 10b5-1 under the Securities Exchange Act, as amended. All shares repurchased were made using currently available cash resources and the reacquired shares were retired upon repurchase.
24
Securities Authorized for Issuance Under Equity Compensation Plans
Information regarding securities authorized for issuance under equity compensation plans is incorporated by reference from our Proxy Statement to be filed for our 2017 Annual Meeting of Stockholders.
25
ITEM 6. | SELECTED FINANCIAL DATA |
The following selected consolidated financial data should be read in conjunction with “Management’s Discussion and Analysis of Financial Condition and Results of Operations” and our consolidated financial statements and the related notes included elsewhere in this Annual Report on Form 10-K. Income tax provision, Net income (loss), net income (loss) per common share, Total assets, Convertible notes, net and Total stockholders' equity has been updated to reflect the adoption of ASU 2015-03, Simplifying the Presentation of Debt Issuance Costs, and tax correction described in Note 2 of the Notes to Consolidated Financial Statements.
Years Ended December 31, | |||||||||||||||||||
2016 | 2015 | 2014 | 2013 | 2012 | |||||||||||||||
(in thousands, except per share amounts) | |||||||||||||||||||
Net revenue | $ | 252,887 | $ | 252,203 | $ | 272,180 | $ | 272,482 | $ | 243,703 | |||||||||
Cost of revenue (1) | 165,069 | 171,369 | 194,009 | 162,449 | 136,321 | ||||||||||||||
Gross profit | 87,818 | 80,834 | 78,171 | 110,033 | 107,382 | ||||||||||||||
Operating expenses: | |||||||||||||||||||
Sales and marketing (1) | 41,972 | 44,086 | 59,988 | 58,826 | 56,925 | ||||||||||||||
Research and development (1) | 8,344 | 16,480 | 25,802 | 23,855 | 19,255 | ||||||||||||||
General and administrative (1) | 52,995 | 46,299 | 47,808 | 44,913 | 41,135 | ||||||||||||||
Restructuring and other (1) | — | 3,662 | 3,314 | — | — | ||||||||||||||
Goodwill and other intangibles impairments | — | — | 25,108 | — | — | ||||||||||||||
Total operating expenses | 103,311 | 110,527 | 162,020 | 127,594 | 117,315 | ||||||||||||||
Loss from operations | (15,493 | ) | (29,693 | ) | (83,849 | ) | (17,561 | ) | (9,933 | ) | |||||||||
Interest expense and other, net | (8,704 | ) | (9,316 | ) | (11,008 | ) | (4,420 | ) | (774 | ) | |||||||||
Impairment of cost basis equity investment | (4,500 | ) | — | — | — | — | |||||||||||||
Loss before income taxes | (28,697 | ) | (39,009 | ) | (94,857 | ) | (21,981 | ) | (10,707 | ) | |||||||||
Income tax provision | 3,429 | 1,584 | 482 | 1,051 | 33,690 | ||||||||||||||
Net loss | $ | (32,126 | ) | $ | (40,593 | ) | $ | (95,339 | ) | $ | (23,032 | ) | $ | (44,397 | ) | ||||
Net loss per common share: | |||||||||||||||||||
Basic | $ | (0.37 | ) | $ | (0.48 | ) | $ | (1.15 | ) | $ | (0.29 | ) | $ | (0.60 | ) | ||||
Diluted | $ | (0.37 | ) | $ | (0.48 | ) | $ | (1.15 | ) | $ | (0.29 | ) | $ | (0.60 | ) | ||||
Weighted-average shares used in computing net income (loss) per common share: | |||||||||||||||||||
Basic | 86,318 | 85,417 | 82,872 | 78,408 | 74,270 | ||||||||||||||
Diluted | 86,318 | 85,417 | 82,872 | 78,408 | 74,270 | ||||||||||||||
(1) | Reported amounts include stock-based compensation expense as follows: |
Years Ended December 31, | |||||||||||||||||||
2016 | 2015 | 2014 | 2013 | 2012 | |||||||||||||||
(in thousands) | |||||||||||||||||||
Cost of revenue | $ | 1,484 | $ | 2,666 | $ | 3,995 | $ | 3,303 | $ | 2,780 | |||||||||
Sales and marketing | 3,004 | 3,393 | 6,193 | 9,831 | 8,146 | ||||||||||||||
Research and development | 586 | 1,299 | 2,800 | 2,414 | 1,880 | ||||||||||||||
General and administrative | 5,678 | 6,029 | 7,911 | 8,072 | 8,077 | ||||||||||||||
Restructuring and other | — | 2,579 | — | — | — | ||||||||||||||
Total stock-based compensation | $ | 10,752 | $ | 15,966 | $ | 20,899 | $ | 23,620 | $ | 20,883 | |||||||||
26
As of December 31, | |||||||||||||||||||
2016 | 2015 | 2014 | 2013 | 2012 | |||||||||||||||
(in thousands) | |||||||||||||||||||
Consolidated Balance Sheet Data: | |||||||||||||||||||
Cash, cash equivalents and short-term investments | $ | 185,573 | $ | 208,712 | $ | 215,382 | $ | 275,133 | $ | 109,442 | |||||||||
Working capital | 218,585 | 236,431 | 249,590 | 315,185 | 149,431 | ||||||||||||||
Total assets | 306,090 | 317,564 | 337,120 | 396,561 | 224,472 | ||||||||||||||
Obligations under capital leases, current and non-current | 176 | 317 | 521 | 657 | 964 | ||||||||||||||
Convertible notes, net | 134,775 | 126,051 | 118,004 | 110,530 | — | ||||||||||||||
Total stockholders' equity | $ | 126,936 | $ | 147,975 | $ | 169,347 | $ | 238,935 | $ | 185,344 | |||||||||
27
ITEM 7. | MANAGEMENT’S DISCUSSION AND ANALYSIS OF FINANCIAL CONDITION AND RESULTS OF OPERATIONS |
The following Management’s Discussion and Analysis of Financial Condition and Results of Operations (“MD&A”) should be read in conjunction with our annual consolidated financial statements and notes thereto which appear elsewhere in this Annual Report on Form 10-K.
This discussion contains “forward-looking statements” that involve risks and uncertainties, as well as assumptions that, if they never materialize or prove incorrect, could cause our results to differ materially from those expressed or implied by such forward-looking statements. These statements are based on the beliefs and assumptions of our management based on information currently available to management. Such forward-looking statements are subject to risks, uncertainties and other important factors that could cause actual results and the timing of certain events to differ materially from future results expressed or implied by such forward-looking statements. Factors that could cause or contribute to such differences include, but are not limited to, those identified below, and those discussed in the section of this Annual Report on Form 10-K titled “Special Note Regarding Forward Looking Statements and Industry Data” and “Risk Factors”. Furthermore, such forward-looking statements speak only as of the date of this report. Except as required by law, we undertake no obligation to update any forward-looking statements to reflect events or circumstances after the date of such statements.
Overview
ServiceSource International, Inc. is the global leader in outsourced customer success and revenue growth solutions. Through our people, processes and technology, we grow and retain revenue on behalf of our clients—some of the world’s leading business-to-business companies—in more than 35 languages. Our solutions help our clients strengthen their customer relationships, drive improved customer adoption, expansion and retention and minimize churn. Our technology platform and best-practice business processes combined with our highly-trained, client-focused revenue delivery professionals and data from over 15 years of operating experience enable us to provide our clients greater value for our customer success services than attained by our clients' in-house customer success teams.
Our Chief Executive Officer ("CEO") is the chief operating decision maker and historically managed the Company as two reportable segments: Managed Services and Cloud and Business Intelligence ("CBI") based on the discrete financial information available for each segment. However, during the second half of 2015, we began implementing a series of actions to emphasize a one-company, single go-to-market strategy for our services offering that resulted in the reorganization of our CBI personnel and sales team delivery structure. The objective of these actions was to more closely integrate and support the Managed Services organization with our cloud technologies and to eliminate new stand-alone CBI offerings. Further, due to this reorganization and shift to a single go-to-market strategy, discrete cost information is no longer separately available for the former CBI segment. Consequently, beginning in the first quarter of 2016, our CEO manages and allocates resources on a company-wide basis as a single segment that is focused on service offerings which integrate data, processes and cloud technologies.
Key Business Metrics
In assessing the performance of our business, we consider a variety of business metrics in addition to the financial metrics discussed below under, “Basis of Presentation.” These key metrics include Opportunity Under Management and number of engagements, both of which are operational metrics.
Opportunity Under Management. For the year ended December 31, 2016, our Opportunity Under Management in our managed services business was approximately $10.3 billion. Opportunity Under Management is an operational metric that represents our estimate of the value of all end customer service contracts that we have the opportunity to sell on behalf of our clients over a designated period of time. Opportunity Under Management is not a measure of our expected revenue or backlog. Opportunity Under Management reflects our estimate over a designated period of time and should not be used to estimate our opportunity for any particular quarter within that period. Also, the value of end customer contracts actually delivered during a given period should not be expected to be realized in full or to occur in even quarterly increments due to seasonality and other factors impacting our clients and their end customers.
28
We estimate the value of our end customer contracts based on a combination of factors, including the value of end customer contracts made available to us by our clients in past periods, the minimum value of end customer contracts that our clients are required to give us the opportunity to sell pursuant to the terms of our contracts with them, periodic internal business reviews of our expectations as to the value of end customer contracts that will be made available to us by our clients, the value of end customer contracts included in the service performance analysis that we conduct with our clients during the sales process, and collaborative discussions with our clients assessing their expectations as to the value of service contracts that they make available to us for sale. Although the minimum value of end customer contracts that our clients are required to give us represents a portion of our estimated Opportunity Under Management, a significant portion of the Opportunity Under Management is estimated based on the other factors described above. As our experience with our business, our clients and their contracts has grown, we have continually refined the process, improved the assumptions and expanded the data related to our calculation of Opportunity Under Management. When estimating Opportunity Under Management, we rely on our assumptions described above, which may prove incorrect. These assumptions are inherently subject to significant business and economic uncertainties and contingencies, many of which are beyond our control. Our estimates therefore may prove inaccurate, and the actual value of end customer contracts delivered to us in a given period to differ from our estimate of Opportunity Under Management. These business and economic uncertainties and contingencies include:
• | the extent to which clients deliver a greater or lesser value of end customer contracts than may be required or |
otherwise expected;
•changes in the pricing or terms of service contracts offered by our clients;
•increases or decreases in the end customer base of our clients;
•the extent to which the renewal rates we achieve on behalf of a client early in an engagement affect the amount of
opportunity that the client makes available to us later in the engagement;
•client cancellations of their contracts with us; and
•changes in our clients’ businesses, sales organizations, management, sales processes or priorities;
•as well as other factors discussed in Part 1. Item 1.A. entitled "Risk Factors" of this Annual Report on Form 10-K.
Our revenue also depends on our booking rates and commissions. Our bookings represent the total amount of Opportunity Under Management that we renew on behalf of our clients. Our commission rate is an agreed-upon percentage of the renewal value of end customer contracts that we sell on behalf of our clients.
Our booking rate is impacted principally by our ability to successfully sell service contracts on behalf of our clients. Other factors impacting our booking rate include: the manner in which our clients price their service contracts for sale to their end customers; the stage of life-cycle associated with the products and underlying technologies covered by the service contracts offered to the end customer; the extent to which our clients or their competitors introduce new products or underlying technologies; the nature, size and age of the service contracts; and the extent to which we have managed the renewals process for similar products and underlying technologies in the past.
In determining commission rates for an individual engagement, various factors, including our booking rate, as described above, are evaluated. These factors include: historical, industry specific and client specific renewal rates for similar service contracts; the magnitude of the Opportunity Under Management in a particular engagement; the number of end customers associated with these opportunities; and the opportunity to receive additional performance commissions when we exceed certain renewal levels. We endeavor to set our commission rates at levels commensurate with these factors and other factors that may be relevant to a particular engagement. Accordingly, our commission rates vary, often significantly, from engagement to engagement. In addition, we sometimes agree to lower commission rates for engagements with significant Opportunity Under Management.
29
Number of Engagements. We track the number of engagements we have with our clients. We often have multiple engagements with a single client, particularly where we manage the sales of service renewals relating to different product lines, technologies, types of contracts or geographies for the client. When the set of renewals we manage on behalf of a client is associated with a separate client contract or a distinct product set, type of end customer contract or geography and therefore requires us to assign a service sales team to manage the renewals, we designate the set of renewals and associated revenues and costs as a unique engagement. For example, we may have one engagement consisting of a service sales team selling maintenance contract renewals of a particular product for a client in the United States and another engagement consisting of a sales team selling warranty contract renewals of a different product for the same client in Europe. These would count as two engagements. We had 143, 154 and 191 engagements as of December 31, 2016, 2015 and 2014, respectively.
Factors Affecting our Performance
Sales Cycle. We sell our integrated solution through our sales organization. At the beginning of the sales process, our quota-carrying sales representatives contact prospective clients and educate them about our offerings. Educating prospective clients about the benefits of our solution can take time, as many of these prospects have not historically relied upon integrated solutions like ours for service revenue management, nor have they typically put out a formal request for proposal or otherwise made a decision to focus on this area. As part of our sales process, our solutions design team performs a service performance analysis of our prospect’s service revenue. This includes an analysis of best practices, and benchmarks the prospect’s service revenue against industry peers. Through this process, which typically takes several weeks, we are able to assess the characteristics and size of the prospect’s service revenue, identify potential areas of performance improvement, and formulate our proposal for managing the prospect’s service revenue. The length of our sales cycle for a new client, inclusive of the service performance analysis process and measured from our first formal discussion with the client until execution of a new client contract, is typically longer than six months and has increased in recent periods.
Implementation Cycle. After entering into an engagement with a new client, and to a lesser extent after adding an engagement with an existing client, we incur sales and marketing expenses related to the commissions owed to our sales personnel. These commissions are based on the estimated total contract value, with a material portion of the commission expensed upfront and the remaining portion expensed ratably over a period of twelve to fourteen months. We also make upfront investments in technology and personnel to support the engagement. These expenses are typically incurred one to three months before we begin generating sales and recognizing revenue. Accordingly, in a given quarter, an increase in new clients, and, to a lesser extent, an increase in engagements with existing clients, or a significant increase in the contract value associated with such new clients and engagements, will negatively impact our gross margin and operating margins until we begin to achieve anticipated sales levels associated with the new engagements, which is typically two to three quarters after we begin selling contracts on behalf of our clients.
Although we expect new client engagements to contribute to our operating profitability over time, in the initial periods of a client relationship, the near term impact on our profitability can be negatively impacted by slower-than anticipated growth in revenues for these engagements as well as the impact of the upfront costs we incur, the lower initial level of associated service sales team productivity and lack of mature data and technology integration with the client. As a result, an increase in the mix of new clients as a percentage of total clients may initially have a negative impact on our operating results. Similarly, a decline in the ratio of new clients to total clients may positively impact our near-term operating results.
Contract Terms. A significant portion of our revenue comes from our pay-for-performance model. Under our pay-for-performance model, we earn commissions based on the value of service contracts we sell on behalf of our clients. In some cases, we earn additional performance-based commissions for exceeding pre-determined service renewal targets.
Our new client contracts typically have an initial term between two and four years. Our contracts generally require our clients to deliver a minimum value of qualifying service revenue contracts for us to renew on their behalf during a specified period. To the extent that our clients do not meet their minimum contractual commitments over a specified period, they may be subject to fees for the shortfall. Our client contracts are cancelable on relatively short notice, subject in most cases to the payment of an early termination fee by the client. The amount of this fee is based on the length of the remaining term and value of the contract.
30
We invoice our clients on a monthly basis based on commissions we earn during the prior month, and with respect to performance-based commissions, on a quarterly basis based on our overall performance during the prior quarter. Revenue is recognized in the period in which our services are performed or, in the case of performance commissions, when the performance condition is achieved. Because the invoicing for our services generally coincides with or immediately follows the sale of service contracts on behalf of our clients, we do not generate or report a significant deferred revenue balance. However, the combination of factors including minimum contractual commitments, the performance improvement potential, our success in generating improved renewal rates for our clients, and our clients’ historical renewal rates may all affect our performance favorably or unfavorably.
M&A Activity. Our clients, particularly those in the technology sector, participate in an active environment for mergers and acquisitions. Large technology companies have maintained active acquisition programs to increase the breadth and depth of their product and service offerings and small and mid-sized companies have combined to better compete with large technology companies. A number of our clients have merged, purchased other companies or been acquired by other companies. We expect merger and acquisition activity to continue to occur in the future.
The impact of these transactions on our business can vary. Acquisitions of other companies by our clients can provide us with the opportunity to pursue additional business to the extent the acquired company is not already one of our clients. Similarly, when a client is acquired, we may be able to use our relationship with the acquired company to build a relationship with the acquirer. In some cases we have been able to maintain our relationship with an acquired client even where the acquiring company handles its other service contract renewals through internal resources. In other cases, however, acquirers have elected to terminate or not renew our contract with the acquired company.
Economic Conditions and Seasonality. An improving economic outlook generally has a positive, but mixed, impact on our business. As with most businesses, improved economic conditions can lead to increased end customer demand and sales. In particular, within the technology sector, we recently experienced the effect of the economic downturn, which led many companies to cut their expenses by choosing to let their existing maintenance, support and subscription agreements lapse. An improving economy may have the opposite effect.
However, an improving economy may also cause companies to purchase new hardware, software and other technology products, which we generally do not sell on behalf of our clients, instead of purchasing maintenance, support and subscription services for existing products. To the extent this occurs, it would have a negative impact on our opportunities in the near term that would partially offset the benefits of an improving economy.
We believe uncertainty in the economy, combined with shifting market forces toward subscription-based models, may impact a number of our clients and prospective clients, particularly in the traditional enterprise software and hardware segments. These forces have placed pressure on end customer demand for their renewal contracts and also have led to some slower decision making in general. This economic and industry environment has adversely affected the conversion rates for end customers and contracts. To the extent these conditions continue they will impact our future revenues.
In addition to the uncertainty in the macroeconomic environment, we experience a seasonal variance in our revenue which is typically higher in the fourth quarter when many of our clients’ products come up for renewal, and for the third quarter of the year which is typically lower as a result of lower or flat renewal volume corresponding to the timing of our customers’ product sales particularly in the international regions. The impact of this seasonal fluctuation can be amplified if the economy as a whole is experiencing disruption or uncertainty, leading to deferral of some renewal decisions. However, this pattern may not continue.
Basis of Presentation
Net Revenue
Substantially all of our net revenue is attributable to commissions we earn from the sale of renewals of maintenance, support and subscription agreements on behalf of our clients. We generally invoice our clients for our services in arrears on a monthly basis for sales commissions, and on a quarterly basis for certain performance sales commissions; accordingly, we typically have no deferred revenue related to these services. We do not set the price, terms or scope of services in the service contracts with end customers and do not have any obligations related to the underlying service contracts between our clients and their end customers.
We also earn revenue from the sale of subscriptions to our cloud based applications. To date, subscription revenue has been a small percentage of total revenue. We expect revenues generated from subscriptions of Renew OnDemand to decline in 2017. Subscription fees are accounted for separately from commissions, and they are billed in advance over a monthly, quarterly or annual basis. Subscription revenue is recognized ratably over the related subscription term.
31
We have generated a significant portion of our revenue from a limited number of clients. Our top ten clients accounted for 66%, 57% and 51% of our net revenue for the years ended December 31, 2016, 2015 and 2014, respectively. Three clients represented 14%, 11% and 11%, respectively, of our revenues in 2016. No single client represented 10% or more of our revenues in 2015. One client represented 12% of our revenue in 2014.
The loss of revenue from any of our top clients for any reason, including the failure to renew our contracts, termination of some or all of our services, a change of relationship with any of our key clients or their acquisition, can cause a significant decrease in our revenue.
Our business is geographically diversified. During 2016, 64% of our net revenue was earned in North America and Latin America (NALA), 25% in Europe, Middle East and Africa (EMEA) and 11% in Asia Pacific-Japan (APJ). Net revenue for a particular geography generally reflects commissions earned from sales of service contracts managed from our revenue delivery centers in that geography. Predominantly all of the service contracts sold and managed by our revenue delivery centers relate to end customers located in the same geography. APJ is our newest region, and as a result accounts for less of our net revenue. In addition, our Kuala Lumpur, Manila and Sofia locations are revenue delivery centers where we have centralized, for our worldwide operations, the key contract renewal processes that do not require regional expertise, such as client data management and quoting.
Cost of Revenue and Gross Profit
Our cost of revenue expenses include employee compensation, technology costs, including those related to the delivery of our cloud-based technologies, and allocated overhead costs. Compensation expense includes salary, bonus, benefits and stock-based compensation for our dedicated service sales teams. Our allocated overhead includes costs for facilities, information technology and depreciation, including amortization of internal-use software associated with our service revenue technology platform and cloud applications. Allocated costs for facilities consist of rent, maintenance and compensation of personnel in our facilities departments. Our allocated costs for information technology include costs associated with third-party data centers where we maintain our data servers, compensation of our information technology personnel and the cost of support and maintenance contracts associated with computer hardware and software. To the extent our client base or Opportunity Under Management expands, we may need to hire additional service sales personnel and invest in infrastructure to support such growth. Our cost of revenue may fluctuate significantly and increase or decrease on an absolute basis and as a percentage of revenue in the near term, including for the reasons discussed under, “Factors Affecting Our Performance—Implementation Cycle”. In 2016, we saw cost of revenue decrease in absolute dollars and as a percent of revenue primarily related to lowering the average cost of employee by moving roles to our new revenue delivery center in the Philippines and the mix of roles in our other centers. In 2015, we saw material reductions in cost of revenue expenses related primarily to our efforts to better align our personnel costs with the decrease in revenue during 2015. We expect cost of revenues to remain flat in 2017 as cost reduction measures will be offset by incremental investments in technology and the expansion of our client engagements. Gross profit as a percent of revenue is expected to be flat to slightly improved for 2017.
Operating Expenses
Sales and Marketing. Sales and marketing expenses are a significant component of our operating costs and consist primarily of compensation expenses and sales commissions for our sales and marketing staff, allocated expenses and marketing programs and events. We sell our solutions through our global sales organization, which is organized across three geographic regions: NALA, EMEA and APJ. Our commission plans provide that payment of commissions to our sales representatives is contingent on their continued employment, and we recognize expense over a period that is generally between the contract signing date and twelve to fourteen months following the execution of the applicable contract. When commissions are paid upon contract signing and are not contingent on future payments and continued employment, we consider that portion of the commission to be earned and therefore expensed at contract signing. We currently expect sales and marketing expenses to increase in 2017 over 2016 amounts due to increased headcount and related employee expenses.
Research and Development. Research and development expenses consist primarily of employee compensation expense, allocated costs and the cost of third-party service providers. We focus our research and development efforts on developing new products and applications related to our technology platform. In connection with the development and enhancements of our SaaS cloud applications, we capitalize certain expenditures related to the development and enhancement of internal-use software related to our technology platform. We expect research and development spending to increase in 2017 as compared to 2016 due to incremental costs of moving our clients to a single technology platform.
32
General and Administrative. General and administrative expenses consist primarily of employee compensation expense for our executive, human resources, finance and legal functions and related expenses for professional fees for accounting, tax and legal services, as well as allocated expenses, which consists of depreciation, amortization of internally developed software, facilities and technology costs. We expect that our general and administrative expenses will increase in 2017 as we continue to expand our learning and development function and invest in additional information technology.
Restructuring and Other. Restructuring and other expenses consist primarily of stock compensation expense related to the accelerated vesting of certain equity awards, employees’ separation payments and related employee benefits and charges related to cancellation of contracts. We completed this restructuring in 2015.
Goodwill and other intangibles impairment. No impairment charges were recognized in 2015 or 2016. The goodwill and other intangibles impairment charge recorded in 2014 is related to the outcome of our impairment analysis which resulted in a non-cash goodwill impairment charge of $22.7 million relating to our former Cloud and Business Intelligence (CBI) reporting unit, and a charge of $2.5 million related to the impairment of intangible assets. Our policy is to perform an annual impairment analysis of goodwill in the fourth quarter of each year and between annual tests if events or circumstances indicate that it is more likely than not that the asset is impaired. Additionally, any further decline in the Company’s market capitalization or other events or circumstances may require additional impairment charges to be recorded in future periods against any remaining other intangibles
Interest Expense and Other, Net and Impairment of Cost Basis Equity Investment
Interest expense. Interest expense consists of interest expense associated with our convertible debt, imputed interest from capital lease payments, accretion of debt discount and amortization of debt issuance costs. We recognize accretion of debt discount and amortization of interest costs using the effective interest method. We expect our interest expense to increase slightly in 2017 from accretion of debt discount, amortization of deferred financing costs and contractual interest costs as a result of our August 2013 issuance of $150.0 million aggregate principal amount of convertible notes due August 2018.
Other, Net. Other, net consists primarily of foreign exchange gains and losses and the interest income earned on our cash, cash equivalents and marketable securities investments. We expect other income to vary depending on the movement in foreign currency exchange rates and the related impact on our foreign exchange gain (loss) and the return of interest on our investments.
Impairment of cost basis equity investment. We recorded a $4.5 million impairment charge related to a cost basis equity investment during 2016. The decision to fully impair the carrying value of this asset was based on our evaluation and assessment of the company's declining financial performance, unfavorable growth trends and future liquidity needs.
Income Tax Provision (Benefit)
We account for income taxes using an asset and liability method, which requires the recognition of taxes payable or refundable for the current year and deferred tax assets and liabilities for the expected future tax consequences of temporary differences that currently exist between the tax basis and the financial reporting basis of our taxable subsidiaries’ assets and liabilities using the enacted tax rates in effect for the year in which the differences are expected to reverse. The effect of a change in tax rates on deferred tax assets and liabilities is recognized in operations in the period that includes the enactment date. The measurement of deferred tax assets is reduced, if necessary, by the amount of any tax benefits that, based on available evidence, are not expected to be realized.
We evaluate our ability to realize the tax benefits associated with deferred tax assets on a jurisdictional basis. This evaluation utilizes the framework contained in ASC 740, Income Taxes, wherein management analyzes all positive and negative evidence available at the balance sheet date to determine whether all or some portion of our deferred tax assets will not be realized. Under this guidance, a valuation allowance must be established for deferred tax assets when it is more likely than not (a probability level of more than 50 percent) that they will not be realized. In assessing the realization of our deferred tax assets, we consider all available evidence, both positive and negative, and place significant emphasis on guidance contained in ASC 740, which states that “a cumulative loss in recent years is a significant piece of negative evidence that is difficult to overcome.”
33
We account for unrecognized tax benefits using a more-likely-than-not threshold for financial statement recognition and measurement of tax positions taken or expected to be taken in a tax return. We establish reserves for tax-related uncertainties based on estimates of whether, and the extent to which, additional taxes will be due. We record an income tax liability, if any, for the difference between the benefit recognized and measured and the tax position taken or expected to be taken on our tax returns. To the extent that the assessment of such tax positions change, the change in estimate is recorded in the period in which the determination is made. The reserves are adjusted in light of changing facts and circumstances, such as the outcome of a tax audit. The provision for income taxes includes the impact of reserve provisions and changes to reserves that are considered appropriate.
Results of Operations
The table below sets forth our consolidated results of operations for the periods presented. As described in Note 2 of the Notes to the Condensed Consolidated Financial Statements, the results of operations for the periods presented below have been revised to reflect prior period error correction to income tax expense. The period-to-period comparison of financial results presented below is not necessarily indicative of financial results to be achieved in future periods.
Years Ended December 31, | |||||||||||
2016 | 2015 | 2014 | |||||||||
Consolidated statement of operations data: | (in thousands) | ||||||||||
Net revenue | $ | 252,887 | $ | 252,203 | $ | 272,180 | |||||
Cost of revenue | 165,069 | 171,369 | 194,009 | ||||||||
Gross profit | 87,818 | 80,834 | 78,171 | ||||||||
Operating expenses: | |||||||||||
Sales and marketing | 41,972 | 44,086 | 59,988 | ||||||||
Research and development | 8,344 | 16,480 | 25,802 | ||||||||
General and administrative | 52,995 | 46,299 | 47,808 | ||||||||
Restructuring and other | — | 3,662 | 3,314 | ||||||||
Goodwill and other intangibles impairments | — | — | 25,108 | ||||||||
Total operating expenses | 103,311 | 110,527 | 162,020 | ||||||||
Loss from operations | (15,493 | ) | (29,693 | ) | (83,849 | ) | |||||
Interest expense and other, net | (8,704 | ) | (9,316 | ) | (11,008 | ) | |||||
Impairment of cost basis equity investment | (4,500 | ) | — | — | |||||||
Loss before income taxes | (28,697 | ) | (39,009 | ) | (94,857 | ) | |||||
Income tax provision | 3,429 | 1,584 | 482 | ||||||||
Net loss | $ | (32,126 | ) | $ | (40,593 | ) | $ | (95,339 | ) | ||
Includes stock-based compensation of: | |||||||||||
Cost of revenue | $ | 1,484 | $ | 2,666 | $ | 3,995 | |||||
Sales and marketing | 3,004 | 3,393 | 6,193 | ||||||||
Research and development | 586 | 1,299 | 2,800 | ||||||||
General and administrative | 5,678 | 6,029 | 7,911 | ||||||||
Restructuring and other | — | 2,579 | — | ||||||||
Total stock-based compensation | $ | 10,752 | $ | 15,966 | $ | 20,899 | |||||
The following table sets forth our operating results as a percentage of net revenue:
34
Years Ended December 31, | ||||||||
2016 | 2015 | 2014 | ||||||
(as % of net revenue) | ||||||||
Net revenue | 100 | % | 100 | % | 100 | % | ||
Cost of revenue | 65 | % | 68 | % | 71 | % | ||
Gross profit | 35 | % | 32 | % | 29 | % | ||
Operating expenses: | ||||||||
Sales and marketing | 17 | % | 17 | % | 22 | % | ||
Research and development | 3 | % | 7 | % | 9 | % | ||
General and administrative | 21 | % | 18 | % | 18 | % | ||
Restructuring and other | — | % | 1 | % | 1 | % | ||
Goodwill and other intangibles impairment | — | % | — | % | 9 | % | ||
Total operating expenses | 41 | % | 43 | % | 59 | % | ||
Loss from operations | (6 | )% | (11 | )% | (30 | )% | ||
Years Ended—December 31, 2016 and 2015
Net Revenue
Years Ended December 31, | ||||||||||||||||||||
2016 | 2015 | |||||||||||||||||||
Amount | % of Net Revenue | Amount | % of Net Revenue | Change | % Change | |||||||||||||||
(in thousands) | ||||||||||||||||||||
Net Revenue | $ | 252,887 | 100 | % | $ | 252,203 | 100 | % | $ | 684 | — | % | ||||||||
Cost of Revenue | 165,069 | 65 | % | 171,369 | 68 | % | (6,300 | ) | (4 | )% | ||||||||||
Gross Profit | $ | 87,818 | 35 | % | $ | 80,834 | 32 | % | $ | 6,984 | 9 | % | ||||||||
Net revenue increased $0.7 million, or 0%, in 2016 compared to 2015. The overall increase in revenue in 2016 was due to expansion of business with the existing client base, as well as new business with existing clients and with new clients.
The $6.3 million, or 4%, decrease in our cost of revenue in 2016 compared to 2015 reflects a $8.5 million decrease in employee costs related to operational improvements in the business that resulted in reduced headcount and greater productivity from our revenue generating employees, and shifting headcount to lower cost offices and locations, all of which are related to our continuous efforts to better align employee costs with revenue. Also contributing to the change was a decrease of $4.1 million in temporary labor and consulting costs. Offsetting these decreases was a $0.9 million increase in information technology costs, $1.8 million increase in depreciation and amortization and $3.8 million increase in net overhead allocations from other departments.
Gross profit in 2016 increased by $7.0 million, or 9%, compared to 2015 which is in line with our moderate increase in revenue and the significant reduction in employee related costs.
35
Operating Expenses
Years Ended December 31, | ||||||||||||||||||||
2016 | 2015 | |||||||||||||||||||
Amount | % of Net Revenue | Amount | % of Net Revenue | Change | % Change | |||||||||||||||
(in thousands) | ||||||||||||||||||||
Operating expenses: | ||||||||||||||||||||
Sales and marketing | $ | 41,972 | 17 | % | $ | 44,086 | 17 | % | $ | (2,114 | ) | (5 | )% | |||||||
Research and development | 8,344 | 3 | % | 16,480 | 7 | % | (8,136 | ) | (49 | )% | ||||||||||
General and administrative | 52,995 | 21 | % | 46,299 | 18 | % | 6,696 | 14 | % | |||||||||||
Restructuring and other | — | — | % | 3,662 | 1 | % | (3,662 | ) | (100 | )% | ||||||||||
Total operating expenses | $ | 103,311 | 41 | % | $ | 110,527 | 43 | % | $ | (7,216 | ) | (7 | )% | |||||||
Includes stock-based compensation of: | ||||||||||||||||||||
Sales and marketing | $ | 3,004 | $ | 3,393 | $ | (389 | ) | |||||||||||||
Research and development | 586 | 1,299 | (713 | ) | ||||||||||||||||
General and administrative | 5,678 | 6,029 | (351 | ) | ||||||||||||||||
Restructuring and other | — | 2,579 | (2,579 | ) | ||||||||||||||||
Total stock-based compensation | $ | 9,268 | $ | 13,300 | $ | (4,032 | ) | |||||||||||||
Sales and marketing expenses
The $2.1 million, or 5%, decrease in sales and marketing expenses in 2016 compared to 2015 resulted primarily from decreased employee compensation expense of $1.6 million due to lower headcount. The lower headcount period over period is the result of our efforts to rationalize our cost structure. Also, contributing to the decrease was a $0.9 million decrease in marketing programs and a $0.2 million decrease in depreciation and amortization, offset by a $0.8 million increase in travel costs.
Research and development expenses
The $8.1 million, or 49%, decrease in research and development expense in 2016 compared to 2015 was primarily due to a $4.6 million decrease in employee compensation expense, a $2.9 million decrease in temporary labor and a $0.3 million decrease in information technology costs, all related to our efforts to reduce research and development spend.
Internal-use software development capitalization increased by $5.9 million in 2016 compared to 2015, primarily due to continued development efforts related to our internal managed services platforms. We expect to continue to invest in our technology platforms to support our services offering and thus capitalizing internal-use software costs in the future. However, the amount capitalized will depend on the future level of expenditures on our technology platforms.
General and administrative expenses
The $6.7 million, or 14%, increase in general and administrative expense in 2016 compared to 2015 reflected a $3.2 million increase in employee compensation expense related to higher headcount, a $2.1 million increase in facilities costs, a $1.0 million increase in depreciation and amortization, a $0.9 million increase in temporary labor and professional fees, a $0.9 increase in technology spend and a $2.2 million increase across the following: travel costs, marketing programs and other, all offset by a $3.6 million net reduction in overhead allocations to other departments.
Restructuring and other expenses
There were no restructuring and other costs in 2016 due to the Company completing restructuring efforts in 2015.
36
Interest Expense and Other, Net and Impairment of Cost Basis Equity Investment
Years Ended December 31, | ||||||||||||||||||||
2016 | 2015 | |||||||||||||||||||
Amount | % of Net Revenue | Amount | % of Net Revenue | Change | % Change | |||||||||||||||
(in thousands) | ||||||||||||||||||||
Interest expense | $ | 11,030 | 4 | % | $ | 10,393 | 4 | % | $ | 637 | 6 | % | ||||||||
Other, net | (2,326 | ) | (1 | )% | (1,077 | ) | — | % | (1,249 | ) | 116 | % | ||||||||
Impairment of cost basis equity investment | $ | (4,500 | ) | 2 | % | $ | — | — | % | $ | 4,500 | 100 | % | |||||||
Interest expense for 2016 increased by $0.6 million, or 6%, as compared to 2015 due to the accretion of debt discount related to the convertible notes issued in August 2013.
Other, net for 2015 decreased by $1.2 million due primarily to lower foreign currency gains as a result of the U.S. dollar strengthening against the Euro and other foreign currencies where we have operations.
Impairment of cost basis equity investment of $4.5 million in 2016 was the result of our recoverability assessment of a cost basis equity investment made in 2013. Based on unfavorable declining financial performance, growth trends and future liquidity needs of this company, the Company determined that its investment was fully impaired during 2016 and recorded the impairment charge.
Income Tax Provision
Years Ended December 31, | |||||||||||||
2016 | 2015 | Change | % Change | ||||||||||
(in thousands) | |||||||||||||
Income tax provision | $ | 3,429 | $ | 1,584 | $ | 1,845 | * | ||||||
*Not considered meaningful.
For the year ended December 31, 2016, we recorded a charge to income tax expense of $3.4 million. This amount primarily represents foreign income taxes of $1.1 million and $1.8 million of valuation allowance that reflects the portion of certain state deferred tax assets that are not more likely than not to be realized. No benefit was otherwise provided for losses incurred in U.S. and Singapore, because these losses are offset by a full valuation allowance.
For the year ended December 31, 2015, a charge to income tax expense of $1.6 million was recorded. This includes the impact of state income tax law changes that were recorded during the second quarter ended June 30, 2015 and affects the manner in which the Company apportions revenue to the state of Tennessee. The remaining portion of our tax expense relates to anticipated taxes in jurisdictions where we have profitable operations, including certain U.S. states, offset by benefits available from state tax credits. No benefit was otherwise provided for losses incurred in U.S. and Singapore, because these losses are offset by a full valuation allowance. In November 2015, the Philippine Economic Zone Authority granted a four year tax holiday to the Company's Philippine affiliate, commencing with its fiscal year, beginning January 1, 2016.
37
Years Ended—December 31, 2015 and 2014
Net Revenue, Cost of Revenue and Gross Profit
Years Ended December 31, | ||||||||||||||||||||
2015 | 2014 | |||||||||||||||||||
Amount | % of Net Revenue | Amount | % of Net Revenue | Change | % Change | |||||||||||||||
(in thousands) | ||||||||||||||||||||
Net Revenue | $ | 252,203 | 100 | % | $ | 272,180 | 100 | % | $ | (19,977 | ) | (7 | )% | |||||||
Cost of Revenue | 171,369 | 68 | % | 194,009 | 71 | % | (22,640 | ) | (12 | )% | ||||||||||
Gross Profit | $ | 80,834 | 32 | % | $ | 78,171 | 29 | % | $ | 2,663 | 3 | % | ||||||||
Net revenue decreased $20.0 million, or 7%, in 2015 compared to 2014. The overall decrease in revenue from 2014 to 2015 was due to client cancellations and engagement reductions, including some of our top clients, in excess of new client engagement additions. The client cancellations and reductions in 2015 were in line with our historical rates.
The $22.6 million, or 12%, decrease in our cost of revenue in 2015 compared to 2014 reflects a $19.8 million decrease in employee compensation expense as a result of lower headcount that corresponded with our efforts to better align employee costs with the decrease in revenue, $0.5 decrease in travel costs and $1.3 million decrease in technology spend, offset by a $1.0 million increase in temporary labor.
The $2.7 million, or 3%, increase in gross profit in 2015 compared to 2014 was mainly driven by the lower headcount and related personnel costs. Also, contributing to the cost reductions were lower cost of professional services and lower support and hosting costs related to our software solutions.
Operating Expenses
Years Ended December 31, | ||||||||||||||||||||
2015 | 2014 | |||||||||||||||||||
Amount | % of Net Revenue | Amount | % of Net Revenue | Change | % Change | |||||||||||||||
(in thousands) | ||||||||||||||||||||
Operating expenses: | ||||||||||||||||||||
Sales and marketing | $ | 44,086 | 17 | % | $ | 59,988 | 22 | % | $ | (15,902 | ) | (27 | )% | |||||||
Research and development | 16,480 | 7 | % | 25,802 | 9 | % | (9,322 | ) | (36 | )% | ||||||||||
General and administrative | 46,299 | 18 | % | 47,808 | 18 | % | (1,509 | ) | (3 | )% | ||||||||||
Restructuring and other | 3,662 | 1 | % | 3,314 | 1 | % | 348 | 11 | % | |||||||||||
Goodwill and other intangibles impairment | — | — | % | 25,108 | 9 | % | (25,108 | ) | 100 | % | ||||||||||
Total operating expenses | $ | 110,527 | 43 | % | $ | 162,020 | 59 | % | $ | (51,493 | ) | (32 | )% | |||||||
Includes stock-based compensation of: | ||||||||||||||||||||
Sales and marketing | $ | 3,393 | $ | 6,193 | $ | (2,800 | ) | |||||||||||||
Research and development | 1,299 | 2,800 | (1,501 | ) | ||||||||||||||||
General and administrative | 6,029 | 7,911 | (1,882 | ) | ||||||||||||||||
Restructuring and other | 2,579 | — | 2,579 | |||||||||||||||||
Total stock-based compensation | $ | 13,300 | $ | 16,904 | $ | (3,604 | ) | |||||||||||||
Sales and marketing expenses
The $15.9 million, or 27%, decrease in sales and marketing expenses in 2015 compared to 2014 resulted primarily from decreased employee compensation expense of $8.3 million due to lower headcount. The lower headcount period over period is the result of our efforts to rationalize our cost structure. Also, contributing to the decrease was a $3.4 million decrease in temporary labor and consultant costs, a $1.0 million decrease in travel expenses, a $1.4 million decrease in marketing programs and a $0.6 million decrease in recruiting fees.
38
Research and development expenses
The $9.3 million, or 36%, decrease in research and development expense in 2015 compared to 2014 was primarily due to a $4.2 million increase in capitalized internal-use software costs, $3.9 million decrease in employee compensation expense and a $0.7 million decrease in temporary labor, travel and recruiting costs, all related to our efforts to reduce research and development spend starting in the second half of 2014.
General and administrative expenses
The $1.5 million, or 3%, decrease in general and administrative expense in 2015 compared to 2014 reflected a $1.4 million decrease in employee compensation expense related to lower headcount and a $4.9 million decrease across the following: temporary labor and professional fees, facilities costs, technology spend, recruiting and depreciation, all offset by a $4.2 million reduction in overhead allocations to other departments.
Restructuring and other expenses
The increase in restructuring and other expenses in 2015 of $0.3 million, or 11%, was related to the recognition of additional employee termination related costs in 2015. The 2015 charge consists primarily of $2.6 million of stock compensation expense related to the accelerated vesting of certain equity awards granted to our former interim CFO and CEO, and separation payments. The Company completed this restructuring effort in 2015.
Goodwill and other intangibles impairment expenses
The decrease in goodwill and other intangible expenses in 2015 compared to 2014 is due to no impairment charges being recognized in 2015.
Interest Expense and Other, Net
Years Ended December 31, | ||||||||||||||||||||
2015 | 2014 | |||||||||||||||||||
Amount | % of Net Revenue | Amount | % of Net Revenue | Change | % Change | |||||||||||||||
(in thousands) | ||||||||||||||||||||
Interest expense | $ | 10,393 | 4 | % | $ | 9,886 | 4 | % | $ | 507 | 5 | % | ||||||||
Other, net | $ | (1,077 | ) | — | % | $ | 1,122 | — | % | $ | (2,199 | ) | (196 | )% | ||||||
Interest expense for 2015 increased by $0.5 million, or 5%, as compared to 2014 due to the accretion of debt discount related to the convertible notes issued in August 2013.
Other, net for 2015 decreased by $2.2 million due primarily to lower foreign currency expenses as a result of the U.S. dollar strengthening against the Euro and other foreign currencies where we have operations.
Income Tax Provision
Years Ended December 31, | % Change | ||||||||||||
2015 | 2014 | Change | |||||||||||
(in thousands) | |||||||||||||
Income tax provision | $ | 1,584 | $ | 482 | $ | 1,102 | * | ||||||
*Not considered meaningful.
For the year ended December, 31, 2015, we recorded a charge to income tax expense of $1.6 million. This includes the impact of state income tax law changes that were recorded during the second quarter ended June 30, 2015 and affects the manner in which the Company apportions revenue to the state of Tennessee. The remaining portion of our tax expense relates to anticipated taxes in jurisdictions where we have profitable operations, including certain U.S. states, offset by benefits available from state tax credits. No benefit was otherwise provided for losses incurred in U.S. and Singapore, because these losses are offset by a full valuation allowance. In November 2015, the Philippine Economic Zone Authority granted a four-year tax holiday to the Company's Philippine affiliate, commencing with its fiscal year, beginning January 1, 2016.
39
For the year ended December 31, 2014, a charge to income tax expense of $0.5 million was recorded. This amount primarily represents anticipated taxes in jurisdictions where we have profitable operations, including certain U.S. states, offset by benefits from state credits. No benefit was otherwise provided for losses incurred in U.S. and Singapore, because these losses are offset by a full valuation allowance. The benefit associated with losses in Ireland is also offset by a full valuation allowance, except to the extent of losses which may be carried back to offset taxable income in the preceding year. In December 2013, our Malaysia affiliate was granted a 10-year tax holiday as an Operational Headquarters (OHQ), commencing January 1, 2014.
Liquidity and Capital Resources
At December 31, 2016, we had cash, cash equivalents and short-term investments of $185.6 million, which primarily consisted of demand deposits, money market mutual funds, corporate bonds and United States government obligations held by well-capitalized financial institutions. In addition, at December 31, 2016, we had cash and cash equivalents of $8.6 million held outside of the United States by our foreign subsidiaries that was generated by such subsidiaries and which is used to satisfy their current operating requirements. We consider the undistributed earnings of our foreign subsidiaries to be indefinitely reinvested in foreign operations and we do not have current plans to repatriate these earnings to fund our U.S. operations as we have sufficient cash, cash-equivalents and short-term investments held in the United States.
Our primary operating cash requirements include the payment of compensation and related costs, working capital requirements related to accounts receivable and accounts payable, as well as costs for our facilities and information technology infrastructure. Historically, we have financed our operations principally from cash provided by our operating activities, proceeds from stock offerings and the exercise of stock options. We believe our existing cash and cash equivalents and short-term investments will be sufficient to meet our working capital and capital expenditure needs for at least the next twelve months.
In August 2013, we issued $150.0 million aggregate principal amount of 1.50% convertible notes due August 1, 2018 (the "Notes") and concurrently entered into convertible notes hedges and separate warrant transactions. The Notes will mature on August 1, 2018, unless earlier converted. Upon conversion, the Notes will be settled in cash, shares of our stock, or any combination thereof, at our option. We received proceeds of $145.1 million from the issuance of the convertible notes, net of associated fees, received $21.8 million from the issuance of the warrants and paid $31.4 million for the note hedges. The Notes were not subject to conversion or repurchase at December 31, 2016 and are classified as a noncurrent liability on our condensed consolidated balance sheet.
Share Repurchase Program
In August 2015, the Board authorized a stock repurchase program with a maximum authorization to repurchase up to $30.0 million worth of common stock of the Company. The program expires in August 2017. The aggregate amount available under the program was approximately $19.9 million at December 31, 2016. The program does not obligate it to acquire any specific number of shares. Under the program, shares may be repurchased in privately negotiated and/or open market transactions, including under plans complying with Rule 10b5-1 under the Securities Exchange Act of 1934, as amended.
During the year ended December 31, 2016, the Company repurchased 2.3 million shares of its common stock under the program at an average price of $3.94 per share for a total of $8.9 million. All repurchases were made using cash resources, and the reacquired shares were retired upon repurchase.
Letter of Credit and Restricted Cash
In May 2015 the Company commenced a 7-year office lease expiring in November 2022 for a new corporate headquarters in San Francisco, California. In connection with this new lease commitment, the Company was required to issue a $1.2 million letter of credit to the landlord. The letter of credit is secured by $1.2 million of a money market account which is classified as restricted cash in other assets, net, in our consolidated balance sheet as of December 31, 2016.
Summary Cash Flows
The following table sets forth a summary of our cash flows for the periods indicated:
40
Years Ended December 31, | |||||||||||
2016 | 2015 | 2014 | |||||||||
(in thousands) | |||||||||||
Net cash provided by (used in) operating activities | $ | 4,452 | $ | 3,597 | $ | (23,762 | ) | ||||
Net cash used in investing activities | (28,914 | ) | (25,194 | ) | (61,872 | ) | |||||
Net cash provided by financing activities | 937 | 3,347 | 4,168 | ||||||||
Net decrease in cash and cash equivalents, net of the effect of exchange rates on cash and cash equivalents | $ | (24,642 | ) | $ | (18,048 | ) | $ | (79,750 | ) | ||
Operating Activities
In 2016, net cash provided by operating activities was $4.5 million. Our net loss during the period was $32.1 million, which was impacted by non-cash charges of $16.1 million for depreciation and amortization, $8.7 million of amortization of debt discount and issuance costs, $10.8 million for stock-based compensation and $4.5 million related to impairment of cost basis equity investment. Cash provided by operations as a result of changes in our working capital include a $0.9 million increase in accounts payable, a $0.8 million increase in other liabilities and a $1.2 million increase in accrued expenses. Uses of cash were related to a $7.2 million increase in accounts receivable, net, $1.6 million decrease in deferred revenue and a $0.7 million decrease in prepaid expenses and other current assets.
In 2015, net cash provided by operating activities was $3.6 million. Our net loss during the period was $40.6 million, which was impacted by non-cash charges of $13.7 million for depreciation and amortization, $8.0 million of amortization of debt discount and issuance costs, $13.4 million for stock-based compensation and $2.6 million for restructuring and other. Cash provided by operations as a result of changes in our working capital, include a $12.0 million decrease in accounts receivable and a $2.7 million increase in accrued compensation and benefits. Uses of cash were related to a $1.8 million increase in prepaid expenses, a $0.5 million decrease in accrued taxes and a $1.6 million decrease in accounts payable.
In 2014, net cash used in operating activities was $23.8 million. Our net loss during the period was $95.2 million, which was impacted by non-cash charges of $13.2 million for depreciation and amortization, $7.5 million of amortization of debt discount and issuance costs, $20.9 million for stock-based compensation and $25.1 million for goodwill and other intangibles impairment. Cash provided by operations as a result of changes in our working capital, including a $3.7 million decrease in accounts receivable, a $0.5 million increase in accrued taxes and a $1.1 million increase in accrued liabilities and other. Uses of cash were related to a $0.6 million increase in prepaid expenses and a $0.3 million decrease in accounts payable.
Investing Activities
In 2016 cash used in investing activities was principally related to the net purchase, sale and maturities of short-term investments of $2.6 million and for purchases of property and equipment of $26.3 million, which includes $13.1 million of internally developed software costs.
In 2015 cash used in investing activities was principally related to the net purchase, sale and maturities of short-term investments of $12.0 million and for purchases of property and equipment of $12.0 million which includes $7.2 million of internally developed software costs.
In 2014 cash used in investing activities was principally related to the net purchase, sale and maturities of short-term investments of $20.0 million, acquisition of Scout Analytics of $32.6 million and for the purchases of property and equipment of $9.4 million.
Financing Activities
Cash provided by financing activities was $0.9 million during 2016 and consisted primarily of option exercises and the purchase of common stock under our employee stock purchase plan offset by $8.9 million from the repurchase of common stock.
Cash provided by financing activities was $3.3 million during 2015 and consisted primarily of option exercises and the purchase of common stock under our employee stock purchase plan offset by $1.2 million from the repurchase of common stock.
Cash provided by financing activities was $4.2 million during 2014 and consisted primarily of option exercises and the purchase of common stock under our employee stock purchase plan of $4.4 million, offset by payment of capital leases obligations.
41
Off-Balance Sheet Arrangements
We do not have any relationships with other entities or financial partnerships such as entities often referred to as structured finance or special-purpose entities, which have been established for the purpose of facilitating off-balance sheet arrangements or other contractually narrow or limited purposes.
Contractual Obligations and Commitments
Our principal commitments consist of obligations under operating leases for office space and computer equipment, convertible notes, purchase commitments and unrecognized tax benefits during our normal course of business.
At December 31, 2016, the future minimum payments under these commitments were as follows (in thousands):
Payments due by period | |||||||||||||||||||
Total | Less than 1 year | 1-3 years | 4-5 years | More than 5 years | |||||||||||||||
Obligations under capital leases | $ | 176 | $ | 63 | $ | 113 | $ | — | $ | — | |||||||||
Operating lease obligations | 47,120 | 10,349 | 18,036 | 14,614 | 4,121 | ||||||||||||||
Convertible Notes | 150,000 | — | 150,000 | — | — | ||||||||||||||
$ | 197,296 | $ | 10,412 | $ | 168,149 | $ | 14,614 | $ | 4,121 | ||||||||||
The contractual commitment amounts in the table above are associated with agreements that are enforceable and legally binding, which specify significant terms, including payment terms, related services and the approximate timing of the transaction. Obligations under contracts that we can cancel without a significant penalty are not included in the table above.
Also excluded from the table above is the income tax liability we recorded for the difference between the benefit recognized and measured and the tax position taken or expected to be taken on our tax returns (“unrecognized tax benefits”). As of December 31, 2016, our liability for unrecognized tax benefits was immaterial. Reasonably reliable estimates of the amounts and periods of related future payments cannot be made at this time.
In April 2016, the Company signed a 6-year office lease expiring in July 2022, for a new revenue delivery center in Singapore to occupy 17,626 square feet. The total minimum lease payments are estimated to be approximately $4.8 million over the lease term.
In July 2016, the Company signed a 5-year office lease expiring in December 2021, for an additional floor in the existing revenue delivery center in the Philippines to occupy 21,915 square feet. The total minimum lease payments are estimated to be approximately $3.5 million over the lease term.
Critical Accounting Policies and Estimates
Revenue Recognition
Our revenue is derived primarily from selling services. Other revenues include professional services and subscriptions to Renew OnDemand.
Revenue is recognized when all of the following criteria have been met:
• | Persuasive evidence of an arrangement exists. Client contracts are generally used to determine the existence of an arrangement. |
• | Delivery has occurred. The service has been or is being provided to the client. |
• | Our fee is fixed or determinable. We assess whether the fee is fixed or determinable based on the payment terms associated with the transaction and whether the selling price is subject to refund or adjustment. |
• | The collectability of our fee is reasonably assured. We assess collectability based primarily on the creditworthiness of the client as determined by credit checks and analysis, as well as the client’s payment history. |
42
Selling Services
Revenue from selling services consists of fees earned from the sales of services contracts on behalf of our clients or assisting our clients in their sales process. Our contract obligations include administering and managing the sales and/or renewal process for our client’s service contracts, providing adequately trained staff, reporting and holding periodic business reviews with our clients. Under our contracts, clients are obligated to provide us with a detailed listing of sales prospects, access to their databases or management systems and sales and marketing materials. Our fees are generally calculated as a fixed percentage of the overall sales value associated with the successful renewal of service contracts sold on behalf of our clients. In addition, some of our client contracts include performance-based fees determined by the achievement of specified performance metrics. Our selling service contracts typically entitle us to additional fees and adjustments resulting from instances where our clients fail to provide us with a specified minimum value of contract renewals or they fail to provide contract renewal data within the time frames specified in our contract. We also receive termination fees in the event a client cancels a contract without cause prior to its terminations date. Our selling service contracts can also be canceled by our clients without a termination fee if we fail to achieve certain performance levels.
Our fees from selling services are recognized on a net basis since we act as an agent on behalf of our clients. We do not perform the underlying maintenance services; determine pricing, terms or scope of services to our client’s end customers. Performance incentive fees and early termination fees are recorded in the period when the performance criteria have been met.
Subscriptions and Professional Services
Subscription revenue is comprised of subscriptions fees to access our Renew OnDemand application, and professional services is generated from implementation and project based services. Subscription revenue is recognized ratably over the contract term, commencing when our cloud applications are made available to our clients. Our subscription service arrangements are generally non-cancelable and do not contain refund-type provisions. Professional services are deemed delivered and revenue recognized upon the successful completion of implementation projects or when project milestones have been achieved and accepted by the client.
Multiple-Deliverable Arrangements
We have entered into a limited number of multiple element arrangements wherein our clients utilize a combination of selling services, subscriptions to our cloud applications and professional services. We separate deliverables at the inception of the arrangement as if each deliverable has stand-alone value to our client. Arrangement consideration is allocated based on the relative best estimate of selling prices of each deliverable. However, substantially all fees earned from our selling services are contingent in nature as the commissions we earn are based on our performance against the specific terms of each contract. Therefore, contingent fees from selling services are excluded from the allocation of relative best selling prices at inception of our multiple element arrangements.
According to the accounting guidance prescribed in Accounting Standards Codification (ASC) 605, Revenue Recognition, selling prices for each deliverable is determined based on the selling price hierarchy of vendor-specific objective evidence (VSOE), third-party evidence (TPE) and best estimated selling price (BESP). We have not been able to establish VSOE for our deliverables due to the customer-specific nature of our products and services. Also, we have not been able to reliably determine the stand-alone selling prices of competitor’s products and services, and as a result, we cannot rely on TPE for our deliverables. Therefore, we utilize estimates of BESP to determine the selling prices of our deliverables. BESP is determined through consultation with management, taking into consideration our marketing and pricing strategies. As these strategies evolve, we may modify our pricing practices in the future, which could result in changes in the estimates used to estimate BESP which could change the allocation of revenue for our multiple element arrangements.
43
Stock-Based Compensation
We measure and recognize compensation expense for share-based payment awards made to our employees and directors, including employee stock options and restricted stock units, based on the grant-date fair values of the awards.
We estimate the fair value of stock options granted using the Black-Scholes option-pricing model. This model requires us to make estimates and assumptions including, among other things, estimates regarding the length of time an employee will retain vested stock options before exercising them, the estimated volatility of our common stock price using peer company volatility and the number of options that will be forfeited prior to vesting. Prior to January 1, 2016, the expected stock price volatility assumption was determined by examining the historical volatilities for industry peers. Effective January 1, 2016, the stock price volatility assumption was determined by examining a blend of the historical volatilities for industry peers and the trading history for the Company’s common stock. Additionally, as a result of our early adoption of ASU 2016-09 in the third quarter of 2016 on a modified retrospective basis, estimation of equity award forfeitures was eliminated, and forfeitures are recognized as they occur.
Stock-based compensation expense for our restricted stock units and performance based restricted stock awards is determined using the fair value of our common stock on the date of grant, and the expense is recognized on a straight-line basis over the vesting period. Performance based restricted stock awards compensation expense is only recorded if it is probable that the performance conditions will be met.
Valuation analysis of goodwill and intangible assets
We perform our annual goodwill impairment analysis in the fourth quarter of each year according to the provisions of ASC 350-20-35. A two-step quantitative impairment test of goodwill is required, unless the simplified method described below is elected. In the first step, the fair value of each reporting unit is compared to its carrying value. If the fair value exceeds carrying value, goodwill is not impaired and further quantitative testing is not required. If the carrying value exceeds fair value, then the second step of the impairment test is required to determine the implied fair value of the reporting unit’s goodwill. The implied fair value of goodwill is calculated by deducting the fair value of all tangible and intangible net assets of the reporting unit, excluding goodwill, from the fair value of the reporting unit as determined in the first step. If the carrying value of the reporting unit’s goodwill exceeds its implied fair value, then an impairment loss must be recorded equal to the difference.
Simplified Method
In September 2011, the Financial Accounting Standards Board approved changes to the goodwill impairment guidance which are intended to reduce the cost and complexity of the annual impairment test, which is referred to as the simplified method. The revised standard gives an entity the option to first assess qualitative factors to determine whether performing the current two-step quantitative impairment test is necessary. Such qualitative factors that may indicate impairment and the need to perform a two-step include, but are not limited to, macro-economic conditions such as deterioration in the entity's operating environment or industry or market considerations; entity-specific events such as increasing costs, declining financial performance, or loss of key personnel; or other events such as an expectation that a reporting unit will be sold or a sustained decrease in the stock price on either an absolute basis or relative to peers.
If an entity believes, as a result of its qualitative assessment, that it is more-likely-than-not (i.e. > 50% chance) that the fair value of a reporting unit is less than its carrying amount, the two-step quantitative impairment test will be required. Otherwise, no further testing will be required.
Our goodwill valuation analysis is based on a single company-wide reporting unit, which is consistent with our single operating segment identified in Note 16-Segment and Geographic Information of the Notes to Consolidated Financial Statements. We used the simplified method to determine the fair value of our reporting units as of December 31, 2016, which was based on an assessment of the qualitative factors noted above in relation to the $6.3 million of goodwill recorded on our Consolidated Balance Sheet, all of which is assigned to our Managed Services reporting unit. Based on our qualitative assessment, we concluded that a two-step quantitative impairment test was not required and that our goodwill asset was not impaired as of December 31, 2016.
Significant management judgments are required in order to assess goodwill and intangible asset impairment, including the following:
• | identification of comparable companies to benchmark under the market approach giving due consideration to the following factors: |
◦ | financial condition and operating performance of the reporting unit being evaluated relative to companies operating in the same or similar business, |
44
◦ | economic, environmental and political factors faced by such companies, and |
• | impact of goodwill impairment recognized in prior years, |
• | susceptibility of our reporting unit to fair value fluctuations, |
• | reporting unit revenue, gross profit and operating expense growth rates, |
• | financial forecasts, |
• | discount rate to apply to estimated cash flows, |
• | terminal values, |
• | reasonable gross profit levels, |
• | estimated control premium a willing buyer is likely to pay, including consideration of the following: |
◦ | the most similar transactions in relevant industries and determined the average premium indicated by the transactions deemed to be most similar to a hypothetical transaction involving our reporting units, |
◦ | weighted average and median control premiums offered in relevant industries, |
◦ | industry specific control premiums, and |
◦ | specific transaction control premiums. |
• | significant events or changes in circumstances including the following: |
◦ | significant negative industry or economic trends, |
◦ | significant decline in our stock price for a sustained period, |
◦ | our market capitalization relative to net book value, |
◦ | significant changes in the manner of our use of the acquired assets, |
◦ | significant changes in the strategy for our overall business, and |
◦ | our assessment of growth and profitability in each reporting unit over the coming years. |
Given the uncertainty of the economic environment and the potential impact on our business, there can be no assurance that our estimates and assumptions regarding the duration of the ongoing economic malaise, made for purposes of our goodwill impairment testing at December 31, 2016 will prove to be accurate predictions of the future. If our assumptions regarding forecasted revenue or gross profit rates are not achieved, we may be required to record additional goodwill impairment charges in future periods relating to any of our reporting units, whether in connection with the next annual impairment testing in the fourth quarter of 2016 or prior to that, if any such change constitutes an interim triggering event. It is not possible to determine if any such future impairment charge would result, or, if it does, whether such charge would be material.
In 2014, we engaged a third party valuation firm in the past to assist management in goodwill impairment analysis. All estimates, key assumptions and forecasts were either provided by or reviewed by us. Although we chose to utilize a third party valuation firm, the 2014 impairment analysis and related valuations represent the conclusions of management and not the conclusions or statements of any third party.
Income Taxes
We account for income taxes using an asset and liability method, which requires the recognition of taxes payable or refundable for the current year and deferred tax assets and liabilities for the expected future tax consequences of temporary differences that currently exist between the tax basis and the financial reporting basis of our taxable subsidiaries’ assets and liabilities using the enacted tax rates in effect for the year in which the differences are expected to reverse. The effect of a change in tax rates on deferred tax assets and liabilities is recognized in operations in the period that includes the enactment date. The measurement of deferred tax assets is reduced, if necessary, by the amount of any tax benefits that, based on available evidence, are not expected to be realized.
45
We regularly assess the need for a valuation allowance against our deferred tax assets. In making that assessment, we consider both positive and negative evidence related to the likelihood of realization of the deferred tax assets on a jurisdictional basis to determine, based on the weight of available evidence, whether it is more likely than not that some or all of the deferred tax assets will not be realized. Examples of positive and negative evidence include future growth, forecasted earnings, future taxable income, the mix of earnings in the jurisdictions in which we operate, historical earnings, taxable income in prior years, if carryback is permitted under the law and prudent and feasible tax planning strategies. In the event we were to determine that we would not be able to realize all or part of our net deferred tax assets in the future, an adjustment to the deferred tax assets valuation allowance would be charged to earnings in the period in which we make such a determination, or goodwill would be adjusted at our final determination of the valuation allowance related to an acquisition within the measurement period. If we later determine that it is more likely than not that the net deferred tax assets would be realized, we would reverse the applicable portion of the previously provided valuation allowance as an adjustment to earnings at such time.
We account for unrecognized tax benefits using a more-likely-than-not threshold for financial statement recognition and measurement of tax positions taken or expected to be taken in a tax return. We establish reserves for tax-related uncertainties based on estimates of whether, and the extent to which, additional taxes will be due. We record an income tax liability, if any, for the difference between the benefit recognized and measured and the tax position taken or expected to be taken on our tax returns. We recognize interest accrued and penalties related to unrecognized tax benefits in the income tax provision. To the extent that the assessment of such tax positions change, the change in estimate is recorded in the period in which the determination is made. The reserves are adjusted in light of changing facts and circumstances, such as the outcome of a tax audit. The provision for income taxes includes the impact of reserve provisions and changes to reserves that are considered appropriate.
Recent Accounting Pronouncements
See “Note 2. Summary of Significant Accounting Policies” of the Notes to Consolidated Financial Statements in Item 8. Financial Statements and Supplementary Data for a full description of recent accounting pronouncements including the expected dates of adoption and the anticipated impact to the Consolidated Balance Sheets and Consolidated Statements of Operations.
ITEM 7A. | QUANTITATIVE AND QUALITATIVE DISCLOSURES ABOUT MARKET RISK |
Foreign Currency Risk
Our results of operations and cash flows are subject to fluctuations due to changes in foreign currency exchange rates, particularly changes in the Euro, British Pound, Singapore Dollar, Philippine Peso, Bulgarian Lev and Malaysian Ringgit. To date, we have not entered into any foreign currency hedging contracts, but may consider entering into such contracts in the future. We believe our operating activities act as a natural hedge for a substantial portion of our foreign currency exposure because we typically collect revenue and incur costs in the currency in the location in which we provide our solution from our revenue delivery centers. As our international operations grow, we will continue to reassess our approach to managing our risk relating to fluctuations in currency rates.
We performed a sensitivity analysis of our foreign currency exposure at December 31, 2016 to assess the potential impact of fluctuations in exchange rates for all foreign denominated assets and liabilities. A 10% appreciation or depreciation for all currencies against the U.S. dollar at December 31, 2016 would not have had a material impact on our results of operations or our cash flows.
46
Interest Rate Risk
At December 31, 2016, we had cash and cash equivalents of $47.7 million and short-term investments of $137.9 million, which primarily consisted of corporate bonds, agency securities, asset-backed securities and U.S. treasury securities. The carrying amount of our cash equivalents reasonably approximates fair value due to the short maturities of these instruments. The primary objectives of our investment activities are the preservation of capital, the fulfillment of liquidity needs and the fiduciary control of cash and investments. We do not enter into investments for trading or speculative purposes. Our investments are exposed to market risk due to fluctuations in interest rates, which may affect our interest income and the fair market value of our investments. Due to the short-term nature of our investment portfolio, however, we do not believe an immediate 10% increase or decrease in interest rates would have a material effect on the fair market value of our portfolio. We therefore do not expect our operating results or cash flows to be materially affected by a sudden change in market interest rates. We do not believe our cash equivalents have significant risk of default or illiquidity. While we believe our cash equivalents do not contain excessive risk, we cannot provide absolute assurance that in the future our investments will not be subject to adverse changes in market value. In addition, we maintain significant amounts of cash and cash equivalents at one or more financial institutions that are in excess of federally insured limits. We cannot be assured that we will not experience losses on these deposits
As of December 31, 2016, we had $150.0 million aggregate principal amount of convertible senior notes outstanding and capital lease obligations of $0.2 million, all of which are fixed rate instruments. Therefore, our results of operations are not subject to fluctuations in interest rates.
Inflation Risk
We do not believe that inflation has had a material effect on our business, financial condition or results of operations. Nonetheless, if our costs were to become subject to significant inflationary pressures, we may not be able to fully offset such higher costs through price increases. Our inability or failure to do so could harm our business, financial condition and results of operations.
47
ITEM 8. | FINANCIAL STATEMENTS AND SUPPLEMENTARY DATA |
ServiceSource International, Inc.
INDEX TO CONSOLIDATED FINANCIAL STATEMENTS AND SCHEDULE
48
Report of Independent Registered Public Accounting Firm
The Board of Directors and Stockholders of ServiceSource International, Inc.
We have audited the accompanying consolidated balance sheet of ServiceSource International, Inc. (the Company) as of December 31, 2016, and the related consolidated statements of operations, comprehensive loss, stockholders' equity and cash flows for the year ended December 31, 2016. These financial statements are the responsibility of the Company's management. Our responsibility is to express an opinion on these financial statements based on our audit.
We conducted our audit in accordance with the standards of the Public Company Accounting Oversight Board (United States). Those standards require that we plan and perform the audit to obtain reasonable assurance about whether the financial statements are free of material misstatement. An audit includes examining, on a test basis, evidence supporting the amounts and disclosures in the financial statements. An audit also includes assessing the accounting principles used and significant estimates made by management, as well as evaluating the overall financial statement presentation. We believe that our audit provides a reasonable basis for our opinion.
In our opinion, the financial statements referred to above present fairly, in all material respects, the consolidated financial position of the Company at December 31, 2016 and the consolidated results of its operations and its cash flows for the year ended December 31, 2016 in conformity with U.S. generally accepted accounting principles.
We also have audited, in accordance with the standards of the Public Company Accounting Oversight Board (United States), the Company's internal control over financial reporting as of December 31, 2016, based on criteria established in Internal Control-Integrated Framework issued by the Committee of Sponsoring Organizations of the Treadway Commission (2013 framework) and our report dated March 6, 2017, expressed an unqualified opinion thereon.
/s/ Ernst & Young LLP
Denver, Colorado
March 6, 2017
49
Report of Independent Registered Public Accounting Firm
To the Board of Directors and Stockholders of ServiceSource International, Inc.
In our opinion, the consolidated balance sheet as of December 31, 2015 and the related consolidated statements of operations, of comprehensive loss, of stockholders’ equity and of cash flows for each of the two years in the period ended December 31, 2015 present fairly, in all material respects, the financial position of ServiceSource International, Inc. and its subsidiaries as of December 31, 2015, and the results of their operations and their cash flows for each of the two years in the period ended December 31, 2015, in conformity with accounting principles generally accepted in the United States of America. These financial statements are the responsibility of the Company’s management. Our responsibility is to express an opinion on these financial statements based on our audits. We conducted our audits of these financial statements in accordance with the standards of the Public Company Accounting Oversight Board (United States). Those standards require that we plan and perform the audits to obtain reasonable assurance about whether the financial statements are free of material misstatement. An audit includes examining, on a test basis, evidence supporting the amounts and disclosures in the financial statements, assessing the accounting principles used and significant estimates made by management, and evaluating the overall financial statement presentation. We believe that our audits provide a reasonable basis for our opinion.
/s/ PricewaterhouseCoopers LLP
San Jose, California
March 8, 2016, except for the effects of the revisions, the change in composition of reportable segment and the manner in which the Company accounts for debt issuance costs discussed in Note 2 to the consolidated financial statements, as to which the date is March 6, 2017.
50
ServiceSource International, Inc.
Consolidated Balance Sheets
(In thousands, except per share amounts)
December 31, | |||||||
2016 | 2015 | ||||||
Assets | |||||||
Current assets: | |||||||
Cash and cash equivalents | $ | 47,692 | $ | 72,334 | |||
Short-term investments | 137,881 | 136,378 | |||||
Accounts receivable, net | 63,289 | 56,563 | |||||
Deferred income taxes | — | 97 | |||||
Prepaid expenses and other | 7,607 | 8,167 | |||||
Total current assets | 256,469 | 273,539 | |||||
Property and equipment, net | 38,180 | 25,903 | |||||
Deferred income taxes, net of current portion | 64 | 1,759 | |||||
Goodwill and intangibles, net | 7,932 | 9,444 | |||||
Other assets, net | 3,445 | 6,919 | |||||
Total assets | $ | 306,090 | $ | 317,564 | |||
Liabilities and Stockholders’ Equity | |||||||
Current liabilities: | |||||||
Accounts payable | $ | 1,916 | $ | 1,067 | |||
Accrued taxes | 1,388 | 1,112 | |||||
Accrued compensation and benefits | 21,579 | 22,116 | |||||
Deferred revenue | 4,152 | 5,770 | |||||
Accrued expenses | 5,891 | 4,716 | |||||
Other current liabilities | 2,958 | 2,327 | |||||
Total current liabilities | 37,884 | 37,108 | |||||
Obligations under capital leases, net of current portion | 113 | 198 | |||||
Convertible notes, net | 134,775 | 126,051 | |||||
Other long-term liabilities | 6,382 | 6,232 | |||||
Total liabilities | 179,154 | 169,589 | |||||
Commitments and contingencies (Note 12) | |||||||
Stockholders’ equity: | |||||||
Preferred stock, $0.001 par value; 20,000 shares authorized and none issued and outstanding | — | — | |||||
Common stock; $0.0001 par value; 1,000,000 shares authorized, 88,304 shares issued and 88,183 shares outstanding as of December 31, 2016; 86,893 shares issued and 86,772 shares outstanding at December 31, 2015 | 8 | 8 | |||||
Treasury stock | (441 | ) | (441 | ) | |||
Additional paid-in capital | 344,521 | 331,922 | |||||
Accumulated deficit | (216,361 | ) | (183,941 | ) | |||
Accumulated other comprehensive income | (791 | ) | 427 | ||||
Total stockholders’ equity | 126,936 | 147,975 | |||||
Total liabilities and stockholders’ equity | $ | 306,090 | $ | 317,564 | |||
The accompanying notes are an integral part of these consolidated financial statements.
51
ServiceSource International, Inc.
Consolidated Statements of Operations
(In thousands, except per share amounts)
Years Ended December 31, | |||||||||||
2016 | 2015 | 2014 | |||||||||
Net revenue | $ | 252,887 | $ | 252,203 | $ | 272,180 | |||||
Cost of revenue | 165,069 | 171,369 | 194,009 | ||||||||
Gross profit | 87,818 | 80,834 | 78,171 | ||||||||
Operating expenses: | |||||||||||
Sales and marketing | 41,972 | 44,086 | 59,988 | ||||||||
Research and development | 8,344 | 16,480 | 25,802 | ||||||||
General and administrative | 52,995 | 46,299 | 47,808 | ||||||||
Restructuring and other | — | 3,662 | 3,314 | ||||||||
Goodwill and other intangibles impairment | — | — | 25,108 | ||||||||
Total operating expenses | 103,311 | 110,527 | 162,020 | ||||||||
Loss from operations | (15,493 | ) | (29,693 | ) | (83,849 | ) | |||||
Interest expense and other, net | (8,704 | ) | (9,316 | ) | (11,008 | ) | |||||
Impairment of cost basis equity investment | (4,500 | ) | — | — | |||||||
Loss before income taxes | (28,697 | ) | (39,009 | ) | (94,857 | ) | |||||
Income tax provision | 3,429 | 1,584 | 482 | ||||||||
Net loss | $ | (32,126 | ) | $ | (40,593 | ) | $ | (95,339 | ) | ||
Net loss per common share: | |||||||||||
Basic | $ | (0.37 | ) | $ | (0.48 | ) | $ | (1.15 | ) | ||
Diluted | $ | (0.37 | ) | $ | (0.48 | ) | $ | (1.15 | ) | ||
Weighted-average shares used in computing net loss per common share: | |||||||||||
Basic | 86,318 | 85,417 | 82,872 | ||||||||
Diluted | 86,318 | 85,417 | 82,872 | ||||||||
The accompanying notes are an integral part of these consolidated financial statements.
52
ServiceSource International, Inc.
Consolidated Statements of Comprehensive Loss
(In thousands)
Years Ended December 31, | |||||||||||
2016 | 2015 | 2014 | |||||||||
Net loss | $ | (32,126 | ) | $ | (40,593 | ) | $ | (95,339 | ) | ||
Other comprehensive income (loss), net of tax: | |||||||||||
Foreign currency translation adjustments | (1,236 | ) | 12 | 471 | |||||||
Unrealized (loss) gain on short-term investments, net of tax | 18 | (698 | ) | (212 | ) | ||||||
Total other comprehensive income (loss), net of tax | (1,218 | ) | (686 | ) | 259 | ||||||
Total comprehensive loss, net of tax | $ | (33,344 | ) | $ | (41,279 | ) | $ | (95,080 | ) | ||
The accompanying notes are an integral part of these consolidated financial statements.
53
ServiceSource International, Inc.
Consolidated Statements of Stockholders' Equity
(In thousands)
Common Stock | Treasury Shares/Stock | Additional Paid-in Capital | Accumulated Deficit | Accumulated Other Comprehensive Income (Loss) | Total | ||||||||||||||||||||||||
Shares | Amount | Shares | Amount | ||||||||||||||||||||||||||
Balances at January 1, 2014 | 81,659 | $ | 8 | (121 | ) | $ | (441 | ) | $ | 286,526 | $ | (48,009 | ) | $ | 854 | $ | 238,938 | ||||||||||||
Proceeds from the exercise of stock options and employee stock purchase plan | 937 | — | — | — | 4,386 | — | — | 4,386 | |||||||||||||||||||||
Vested restricted stock units converted to shares | 1,332 | — | — | — | — | — | — | — | |||||||||||||||||||||
Stock-based compensation | — | — | — | — | 20,959 | — | — | 20,959 | |||||||||||||||||||||
Income tax benefit from stock-based compensation | — | — | — | — | 146 | — | — | 146 | |||||||||||||||||||||
Comprehensive loss: | |||||||||||||||||||||||||||||
Net loss | — | — | — | — | — | (95,339 | ) | — | (95,339 | ) | |||||||||||||||||||
Other comprehensive income | — | — | — | — | — | — | 259 | 259 | |||||||||||||||||||||
Total comprehensive loss | (95,080 | ) | |||||||||||||||||||||||||||
Balances at December 31, 2014 | 83,928 | $ | 8 | (121 | ) | $ | (441 | ) | $ | 312,017 | $ | (143,348 | ) | $ | 1,113 | $ | 169,349 | ||||||||||||
Proceeds from the exercise of stock options and employee stock purchase plan | 1,505 | — | — | — | 5,761 | — | — | 5,761 | |||||||||||||||||||||
Vested restricted stock units converted to shares | 1,755 | — | — | — | — | — | — | — | |||||||||||||||||||||
Net cash paid for payroll taxes on restricted stock unit releases | — | — | — | — | (974 | ) | — | — | (974 | ) | |||||||||||||||||||
Share repurchases | (295 | ) | — | — | — | (1,212 | ) | — | — | (1,212 | ) | ||||||||||||||||||
Stock-based compensation | — | — | — | — | 13,751 | — | — | 13,751 | |||||||||||||||||||||
Acceleration of stock-based compensation expense due to restructuring | — | — | — | — | 2,579 | — | — | 2,579 | |||||||||||||||||||||
Comprehensive loss: | — | ||||||||||||||||||||||||||||
Net loss | — | — | — | — | — | (40,593 | ) | — | (40,593 | ) | |||||||||||||||||||
Other comprehensive loss | — | — | — | — | — | — | (686 | ) | (686 | ) | |||||||||||||||||||
Total comprehensive loss | (41,279 | ) | |||||||||||||||||||||||||||
Balances at December 31, 2015 | 86,893 | $ | 8 | (121 | ) | $ | (441 | ) | $ | 331,922 | $ | (183,941 | ) | $ | 427 | $ | 147,975 | ||||||||||||
Cumulative effect of stock compensation standard adoption | — | — | — | — | 294 | (294 | ) | — | — | ||||||||||||||||||||
Proceeds from the exercise of stock options and employee stock purchase plan | 2,434 | — | — | — | 10,866 | — | — | 10,866 | |||||||||||||||||||||
Vested restricted stock units converted to shares | 1,240 | — | — | — | — | — | — | — | |||||||||||||||||||||
Net cash paid for payroll taxes on restricted stock unit releases | — | — | — | — | (947 | ) | — | — | (947 | ) | |||||||||||||||||||
Share repurchases | (2,263 | ) | — | — | — | (8,921 | ) | — | — | (8,921 | ) | ||||||||||||||||||
Stock-based compensation | — | — | — | — | 11,307 | — | — | 11,307 | |||||||||||||||||||||
Comprehensive loss: | — | ||||||||||||||||||||||||||||
Net loss | — | — | — | — | — | (32,126 | ) | — | (32,126 | ) | |||||||||||||||||||
Other comprehensive loss | — | — | — | — | — | — | (1,218 | ) | (1,218 | ) | |||||||||||||||||||
Total comprehensive loss | (33,344 | ) | |||||||||||||||||||||||||||
Balances at December 31, 2016 | 88,304 | $ | 8 | (121 | ) | $ | (441 | ) | $ | 344,521 | $ | (216,361 | ) | $ | (791 | ) | $ | 126,936 | |||||||||||
The accompanying notes are an integral part of these consolidated financial statements.
54
ServiceSource International, Inc.
Consolidated Statements of Cash Flows
(In thousands)
Years Ended December 31, | |||||||||||
2016 | 2015 | 2014 | |||||||||
Cash flows from operating activities | |||||||||||
Net loss | $ | (32,126 | ) | $ | (40,593 | ) | $ | (95,339 | ) | ||
Adjustments to reconcile net loss to net cash provided by (used in) operating activities: | |||||||||||
Depreciation and amortization | 16,052 | 13,736 | 13,219 | ||||||||
Amortization of debt discount and issuance costs | 8,724 | 8,048 | 7,474 | ||||||||
Amortization of premium on short-term investments | 1,091 | (101 | ) | (245 | ) | ||||||
Deferred income taxes | 1,924 | 969 | (334 | ) | |||||||
Stock-based compensation | 10,752 | 13,387 | 20,899 | ||||||||
Tax (benefit) deficit from stock-based compensation | — | — | (146 | ) | |||||||
Restructuring and other | — | 2,579 | 952 | ||||||||
Impairment of cost basis equity investment | 4,500 | — | — | ||||||||
Goodwill and other intangibles impairment | — | — | 25,108 | ||||||||
Changes in operating assets and liabilities: | |||||||||||
Accounts receivable, net | (7,156 | ) | 12,002 | 3,716 | |||||||
Deferred revenue | (1,589 | ) | (1,204 | ) | (371 | ) | |||||
Prepaid expenses and other | (673 | ) | (1,825 | ) | (631 | ) | |||||
Accounts payable | 872 | (1,562 | ) | (278 | ) | ||||||
Accrued taxes | 269 | (539 | ) | 477 | |||||||
Accrued compensation and benefits | (119 | ) | 2,706 | 248 | |||||||
Accrued expenses | 1,182 | (3,940 | ) | 1,978 | |||||||
Other liabilities | 749 | (66 | ) | (489 | ) | ||||||
Net cash provided by (used in) operating activities | 4,452 | 3,597 | (23,762 | ) | |||||||
Cash flows from investing activities | |||||||||||
Acquisition of property and equipment | (26,337 | ) | (11,975 | ) | (9,357 | ) | |||||
Restricted cash | — | (1,244 | ) | — | |||||||
Cash paid for acquisition, net of cash acquired | — | — | (32,550 | ) | |||||||
Purchases of short-term investments | (102,130 | ) | (95,421 | ) | (84,415 | ) | |||||
Sales of short-term investments | 98,028 | 82,351 | 60,407 | ||||||||
Maturities of short-term investments | 1,525 | 1,095 | 4,043 | ||||||||
Net cash used in investing activities | (28,914 | ) | (25,194 | ) | (61,872 | ) | |||||
Cash flows from financing activities | |||||||||||
Repayment on capital lease obligations | (131 | ) | (170 | ) | (364 | ) | |||||
Repurchase of common stock | (8,921 | ) | (1,212 | ) | — | ||||||
Proceeds from common stock issuances | 10,866 | 5,703 | 4,386 | ||||||||
Tax benefit (deficit) from stock-based compensation | — | — | 146 | ||||||||
Minimum tax withholding requirement | (877 | ) | (974 | ) | — | ||||||
Net cash provided by financing activities | 937 | 3,347 | 4,168 | ||||||||
Net (decrease) increase in cash and cash equivalents | (23,525 | ) | (18,250 | ) | (81,466 | ) | |||||
Effect of exchange rate changes on cash and cash equivalents | (1,117 | ) | 202 | 1,716 | |||||||
Cash and cash equivalents at beginning of period | 72,334 | 90,382 | 170,132 | ||||||||
Cash and cash equivalents at end of period | $ | 47,692 | $ | 72,334 | $ | 90,382 | |||||
Supplemental disclosure of cash flow information | |||||||||||
Cash paid for interest | $ | 2,260 | $ | 2,286 | $ | 2,440 | |||||
Income taxes paid, net | 1,544 | 854 | 146 | ||||||||
Supplemental disclosure of non-cash investing and financing activities | |||||||||||
Acquisition of property and equipment accrued in accounts payable and accrued expenses | 98 | 111 | 385 | ||||||||
The accompanying notes are an integral part of these consolidated financial statements.
55
ServiceSource International, Inc
NOTES TO CONSOLIDATED FINANCIAL STATEMENTS
1. The Company
ServiceSource International, Inc. ("ServiceSource" or the "Company") is a global leader in customer and revenue lifecycle solutions that power enterprise revenue relationships, partnering with business to business technology and technology-enabled companies to optimize maintenance, support and subscription revenue streams, while also improving end customer relationships and loyalty. The Company delivers these results via dedicated service teams and integral cloud-based technologies, leveraging benchmarks and best-practices derived from its rich database of service and renewal behavior. By integrating managed services, cloud software and data, the Company provides its clients with insights into their end customers' businesses, end-to-end management and optimization of the service-contract renewals process and customer success activities, including data management, quoting, selling and recurring revenue business intelligence. The Company receives commissions from its clients based on renewal sales that the Company generates on their behalf under a pay-for-performance or flat-rate model. In addition, the Company also offers a purpose-built cloud application to maximize the renewal of subscriptions, maintenance and support contracts and receives subscription fees from its clients. The Company’s corporate headquarters are located in San Francisco, California. The Company has additional U.S. offices in Colorado, Tennessee and Washington, and International offices in Bulgaria, Ireland, Japan, Malaysia, Philippines, Singapore and the United Kingdom.
2. Summary of Significant Accounting Policies
Basis of Consolidation
The accompanying consolidated financial statements of ServiceSource include the accounts of the Company and its wholly-owned subsidiaries. All intercompany balances and transactions have been eliminated in consolidation.
Use of Estimates
The preparation of consolidated financial statements in conformity with accounting principles generally accepted in the United States of America (“GAAP”) requires management to make estimates and assumptions that affect the reported amounts of assets and liabilities and disclosure of contingent assets and liabilities at the date of the consolidated financial statements and the reported amount of net revenue and expenses during the reporting period.
The Company’s significant accounting judgments and estimates include, but are not limited to: revenue recognition, the valuation and recognition of stock-based compensation, recognition and measurement of current and deferred income tax assets and liabilities and uncertain tax positions and the provision for bad debts.
The Company bases its estimates and judgments on historical experience and on various assumptions that it believes are reasonable under the circumstances. However, future events are subject to change and estimates and judgments routinely require adjustment. Actual results may differ from these estimates, and these differences may be material.
Reclassifications
Amounts shown in Other assets, net, on the Consolidated Balance Sheet as of December 31, 2015 have been reclassified to Convertible notes, net, to reflect the current period presentation as a result of the adoption of ASU No. 2015-03, Simplifying the Presentation of Debt Issuance Cost, which requires that debt issuance costs related to a recognized debt liability be presented in the balance sheet as a direct deduction from the carrying amount of that debt liability. See Note 11 - Debt.
Segment Reporting
The Company’s Chief Executive Officer ("CEO") is its chief operating decision maker. The CEO historically managed the Company as two reportable segments: Managed Services and Cloud and Business Intelligence ("CBI") based on the discrete financial information available for each segment. However, during the second half of 2015, the Company began implementing a series of actions to emphasize a one-company, single go-to-market strategy for its services offering that resulted in the reorganization of its CBI personnel and sales team delivery structure. The objective of these actions was to more closely integrate and support the Managed Services organization with the Company’s cloud technologies and to eliminate new stand-alone CBI cloud offerings. Further, due to this reorganization and shift to a single go-to-market strategy, discrete cost information was no longer separately available for the former CBI segment. Consequently, beginning in the first quarter of 2016, the CEO manages and allocates resources on a company-wide basis as a single segment that is focused on service offerings which integrate data, processes and cloud technologies. See entity-wide disclosures in Note 16- Geographical information.
56
Significant Risks and Uncertainties
The Company is subject to certain risks and uncertainties that could have a material and adverse effect on its future financial position or results of operations. The Company’s clients are primarily high technology companies and a downturn in these industries, changes in clients’ sales strategies, or widespread shift away from end customers purchasing maintenance and support contracts could have an adverse impact on the Company’s consolidated results of operations and financial condition.
Financial instruments that potentially subject the Company to concentration of credit risk consist principally of cash, cash equivalents, short-term investments, accounts receivable and the Note Hedges (Note 11). The Company is also exposed to a variety of market risks, including the effects of changes in foreign currency exchange rates and interest rates.
Cash is maintained in demand deposit accounts at U.S., European and Asian financial institutions that management believes are credit worthy. Deposits in these institutions may exceed the amount of insurance provided on these deposits.
Accounts receivable are derived from services performed for clients located primarily in the U.S., Europe and Asia. The Company attempts to mitigate the credit risk in its trade receivables through its ongoing credit evaluation process and historical collection experience. The Company maintains an allowance for doubtful accounts based upon the expected collectability of its accounts receivable, which takes into consideration an analysis of historical bad debts and other available information.
Three customers represented 15%, 14% and 12%, respectively, of accounts receivable as of December 31, 2016. Two customers represented 13% and 12%, respectively, of accounts receivable as of December 31, 2015, respectively.
Fair Value of Financial Instruments
The Company accounts for certain assets and liabilities at fair value. As defined in the authoritative guidance on fair value measurements, fair value is the price that would be received to sell an asset or paid to transfer a liability in an orderly transaction between market participants at the measurement date. The guidance establishes a fair value hierarchy that prioritizes the inputs to valuation techniques used to measure fair value. An asset or liability’s level is based on the lowest level of input that is significant to the fair value measurement. The guidance requires that assets and liabilities carried at fair value be classified and disclosed in one of the following three categories:
Level 1: Quoted prices (unadjusted) in active markets for identical assets or liabilities;
Level 2: Inputs other than quoted prices included within Level 1 that are either directly or indirectly observable;
Level 3: | Unobservable inputs in which little or no market activity exists, therefore requiring an entity to develop its own assumptions about the assumptions that market participants would use in pricing. |
Financial instruments not measured at fair value on a recurring basis include cash, restricted cash recorded in other assets, accounts receivable, accounts payable, accrued taxes, accrued expenses and other accrued liabilities and convertible notes. With the exception of the convertible notes and the financial instruments discussed in Note 6 - Fair Value of Financial Instruments, the fair value of the Company’s financial instruments approximate carrying value due to their short maturities.
Foreign Currency Translation and Remeasurement
Assets and liabilities of non-U.S. subsidiaries that operate in a local currency environment, where that local currency is the functional currency, are translated to U.S. dollars at exchange rates in effect at the balance sheet date. Net revenue and expenses are translated at monthly average exchange rates. The Company accumulates net translation adjustments in equity as a component of accumulated other comprehensive income (loss). For non-U.S. subsidiaries whose functional currency is the U.S. dollar, transactions that are denominated in foreign currencies have been remeasured in U.S. dollars, and any resulting gains and losses are reported in the accompanying consolidated statements of operations. Foreign currency transaction (gains) losses of $0.5 million, $(0.9) million and $0.8 million, were included in other (expense) income, net during 2016, 2015 and 2014, respectively.
57
Accounts Receivable and Allowance for Doubtful Accounts
Accounts receivable are stated at their carrying values net of an allowance for doubtful accounts. The Company evaluates the ongoing collectability of its accounts receivable based on a number of factors such as the credit quality of its clients, the age of accounts receivable balances, collections experience, current economic conditions and other factors that may affect a client’s ability to pay. In circumstances where the Company is aware of a specific client’s inability to meet its financial obligations to the Company, a specific allowance for doubtful accounts is estimated and recorded, which reduces the recognized receivable to the estimated amount that management believes will ultimately be collected. Account balances are charged off against the allowance when it is probable that the receivable will not be recovered.
The following are changes in the allowance for doubtful accounts during 2016, 2015 and 2014 (in thousands):
December 31, | |||||||||||
2016 | 2015 | 2014 | |||||||||
Balance, beginning of year | $ | 137 | $ | 37 | $ | 128 | |||||
Charged to expense | 392 | 137 | 37 | ||||||||
Recoveries | (529 | ) | (37 | ) | (128 | ) | |||||
Balance, end of year | $ | — | $ | 137 | $ | 37 | |||||
Property and Equipment
The Company records property and equipment at cost, less accumulated depreciation and amortization. Depreciation is recorded using the straight-line method over estimated useful lives of seven years for office furniture and equipment, three to five years for network equipment, two to three years for computer hardware and three to seven years for software. Leasehold improvements are amortized on a straight-line basis over the lesser of the lease term or the estimated useful life of the related assets, ranging from three to fifteen years.
When assets are retired, the cost and accumulated depreciation and amortization are removed from their respective accounts and any loss on such retirement is reflected in operating expenses. When assets are otherwise disposed of, the cost and related accumulated depreciation and amortization are removed from their respective accounts and any gain or loss on such sale or disposal is reflected in interest expense and other, net.
Lease Asset Retirement Obligations
The fair value of a liability for an asset retirement obligation (“ARO”) is recognized in the period in which it is incurred. The Company’s asset retirement obligations are primarily associated with leasehold improvements, which, at the end of a lease, are contractually obligated to be removed. Our asset retirement obligations were $1.2 million and $0.9 million at December 31, 2016 and 2015, respectively. Accretion expense was insignificant for the years ended December 31, 2016, 2015 and 2014.
Capitalized Internal-Use Software
Expenditures related to software developed or obtained for internal use are capitalized and amortized over a period of two to five years on a straight-line basis. The Company capitalizes direct external costs associated with developing or obtaining internal-use software. In addition, the Company also capitalizes certain payroll and payroll-related costs for employees or professional fees for consultants who are directly associated with the development of such applications. Costs associated with preliminary project stage activities, training, maintenance and all other post-implementation stage activities are expensed as incurred and are recorded in research and development on the accompanying consolidated statements of operations. Capitalized costs related to internal-use software under development are treated as construction-in-progress until the program, feature or functionality is ready for its intended use, at which time amortization commences.
Goodwill
Goodwill assets have indefinite useful lives and are not amortized, but are tested for impairment at least annually or as circumstances indicate their value may no longer be recoverable. The Company does not have intangible assets with indefinite useful lives other than goodwill.
58
The Company tests for goodwill impairment at the reporting unit level on an annual basis in the fourth quarter of each of its fiscal years, and at any other time at which events occur or circumstances indicate that the carrying amount of goodwill may exceed its fair value. To assess if goodwill is impaired a qualitative assessment, referred to as the simplified method, is first performed to determine whether further quantitative impairment testing is necessary. This qualitative analysis evaluates factors including, but not limited to, macro-economic conditions such as deterioration in the entity's operating environment or industry or market considerations; entity-specific events such as increasing costs, declining financial performance, or loss of key personnel; or other events such as an expectation that a reporting unit will be sold or a sustained decrease in the stock price on either an absolute basis or relative to peers. If, as a result of the qualitative assessment, the Company considers it more-likely-than-not that the fair value of a reporting unit is less than its carrying amount, then a two-step quantitative impairment test is performed. The first step requires comparing the fair value of the reporting unit to its net book value, including goodwill. A potential impairment exists if the fair value of the reporting unit is lower than its net book value. The second step of the process, which is performed only if a potential impairment exists, involves determining the difference between the fair value of the reporting unit's net assets other than goodwill and the fair value of the reporting unit. If this difference is less than the net book value of goodwill, impairment exists and is recorded.
Application of the goodwill impairment test requires judgment, including the identification of reporting units, assigning assets and liabilities to reporting units, assigning goodwill to reporting units, and determining the fair value of each reporting unit. Significant judgments required to estimate the fair value of reporting units include estimating future cash flows and determining appropriate discount rates, growth rates and other assumptions. Changes in these estimates and assumptions could materially affect the determination of fair value of each reporting unit which could trigger impairment.
If a two-step quantitative impairment test is required, the fair value of each reporting unit is determined based upon the income approach. Under the income approach, the Company estimates the fair value of the reporting unit based upon the present value of estimated future cash flows. Cash flow projections are determined by management to be commensurate with the risk inherent in current business model. Key assumptions used to estimate the fair value of the reporting units include the discount rate, compounded annual revenue growth rates, operating expense assumptions and terminal value capitalization rate. The discount rate used is based on the weighted-average cost of capital adjusted for the relevant risk associated with business-specific characteristics and the uncertainty related to the reporting unit's ability to execute on the projected cash flows. The discount rate and terminal value capitalization rate are derived from the use of market data which are Level 3 inputs within the fair value hierarchy.
The Company used the simplified method described above to determine if any impairment existed as of December 31, 2016 and 2015 and concluded that a two-step quantitative impairment test was not required and that its goodwill asset was not impaired as of December 31, 2016 and 2015. Refer to Note 4 Goodwill and Other Intangibles Impairment for more information.
Senior Convertible Notes
In accounting for the senior convertible notes (the “Notes”) at issuance, the Company separated the Notes into debt and equity components pursuant to the accounting standards for convertible debt instruments that may be fully or partially settled in cash upon conversion. The fair value of the debt component was estimated using an interest rate for nonconvertible debt, with terms similar to the Notes, excluding the conversion feature. The carrying amount of the liability component was calculated by measuring the fair value of a similar liability that does not have an associated convertible feature. The excess of the principal amount of the Notes over the fair value of the debt component was recorded as a debt discount and a corresponding increase in additional paid-in capital. The debt discount is accreted to interest expense over the term of the Notes using the effective interest method. The amount recorded to additional paid-in capital is not to be remeasured as long as it continues to meet the conditions for equity classification.
Impairment of Long-Lived Assets
The Company evaluates the recoverability of its long-lived assets, which include tangible assets and amortizable intangible such as internal-use software. Acquired intangible assets are amortized over their useful lives on a straight line basis which represents the pattern in which the Company derives benefit from the asset. The Company evaluates long-lived assets for impairment whenever events or changes in circumstances indicate that the carrying value of long-lived assets may not be recoverable. The Company recognizes such impairment in the event the net book value of such assets exceeds the future undiscounted cash flows attributable to such assets.
59
Operating Leases
The Company’s operating lease agreements for office facilities include provisions for certain rent holidays, tenant incentives and escalations in the base price of the rent payment. The Company records rent holidays and rent escalations on a straight-line basis over the lease term and records the difference between expense and cash payments as deferred rent. Tenant incentives are recorded as deferred rent and amortized on a straight-line basis over the lease term. Deferred rent is included in other accrued liabilities in the accompanying consolidated balance sheets.
Deferred Debt Issuance Costs
The Company defers debt issuance costs, which primarily consists of the debt discount on the convertible debt and issuance costs related to the convertible debt. Such costs primarily relates to convertible notes (Note 11) and is amortized using the effective interest method over the term of the debt instrument. The amortization of deferred debt issuance costs is recorded as interest expense. Unamortized deferred debt issuance costs were $15.2 million at December 31, 2016 and $23.9 million as of December 31, 2015. Amortization of deferred debt issuance costs was $8.7 million in 2016, $8.0 million in 2015 and $7.5 million in 2014, respectively. Estimated future amortization of deferred debt issuance costs expense will approximate $9.4 million in 2017 and $5.8 million in 2018.
Comprehensive Income (Loss)
Comprehensive income (loss) consists of two components, net income (loss) and other comprehensive income (loss). Other comprehensive income (loss) refers to revenue, expenses, gains and losses recorded as an element of equity but are excluded from net income (loss). The Company’s other comprehensive income (loss) consists of foreign currency translation adjustments from those subsidiaries not using the U.S. dollar as their functional currency and unrealized gains and losses on available-for-sale securities. The Company has disclosed accumulated comprehensive other income (loss) as a separate component of stockholders' equity.
Revenue Recognition
The Company’s revenue is derived primarily from recurring revenue management. Other revenues include subscriptions to the Company’s cloud applications and professional services.
Revenue is recognized when persuasive evidence of an arrangement exists, delivery has occurred, the sales price is fixed or determinable and collectability is reasonably assured from clients and no significant obligations remain unfulfilled by the Company.
Recurring Revenue Management
Revenue from recurring revenue management consists of fees earned from the sales of services contracts on behalf of the Company’s customers, which are referred to as clients, or assisting in their sales process. The Company’s contract obligations include administering and managing the sales and/or renewal processes for client contracts; providing adequately trained staff; reporting; and holding periodic business reviews with clients. Client obligations include providing a detailed listing of sales prospects, access to their databases or systems and sales or marketing materials. Fees are generally based on a fixed percentage of the overall sales value associated with the service contracts. However some client contracts include performance-based fees determined by the achievement of specified performance metrics. Recurring revenue management contracts entitle the Company to additional fees and adjustments which are invoked in various circumstances including a client’s failure to provide the Company with a specified minimum value of sales prospects, untimely delivery of client sales prospect data or other obligations inhibiting the Company’s ability to perform its obligations. In addition, many client contracts contain early termination fees.
Recurring revenue management services are deemed delivered when clients accept purchased orders from their sales prospects (the end customer) and no significant post-delivery obligations remain for the Company. Fees from recurring revenue management services are recognized on a net basis since the Company acts as an agent on behalf of its clients. The Company does not provide the services being renewed by the end customers, nor does it determine pricing, terms or scope of services to the end customers. Performance incentive fees and early termination fees are recorded in the period when either the performance criteria have been met or a triggering event has occurred.
60
Subscriptions
Subscription revenue is comprised of subscriptions fees to access the Company’s cloud based applications. Subscription revenue is recognized ratably over the contract term, generally over a period of one to three years, commencing when the cloud applications are made available. The Company's subscription service arrangements are generally non-cancelable and do not contain refund-type provisions.
Professional Services
Professional services revenue is generated from implementation services. Professional services are deemed delivered upon the successful completion of implementation projects or when project milestones have been achieved and accepted by the client.
Multiple Element Arrangements
The Company enters into multiple element arrangements when clients utilize a combination of recurring revenue management services, subscriptions and professional services. Deliverables are separated at the inception of the arrangement if each deliverable has stand-alone value to the client. The Company believes that it has stand-alone value for professional services. Arrangement consideration is allocated based on the relative best selling prices of each deliverable. However, most fees earned from recurring revenue management services are contingent in nature as the fees earned by the Company are based on performance against the specific terms of each contract. Therefore, contingent fees from recurring revenue management services are excluded from the allocation of relative best selling prices at inception of multiple element arrangements.
Selling prices for each deliverable is determined based on the selling price hierarchy of vendor-specific objective evidence (VSOE), third-party evidence (TPE) and best estimated selling price (BESP). Generally, the Company has not been able to establish VSOE for its deliverables as the items have not been sold separately. The Company has not been able to reliably determine the stand-alone selling prices of competitors’ products and services, and therefore cannot rely on TPE for its deliverables. Therefore, the Company utilizes BESP to determine the selling prices of its deliverables. The objective of BESP is to determine the price at which the Company would price a product or service if it were sold on a stand-alone basis. BESP is generally used for offerings that are not typically sold separately or for new offerings including Renew OnDemand. BESP is determined by considering multiple factors including, but not limited to, pricing practices, market conditions, competitive landscape, internal costs, geographies and gross margin. The determination of BESP is made through consultation with and formal approval with management, taking into consideration the Company’s marketing strategy. As these marketing strategies evolve, the Company may modify its pricing practices in the future, which could result in changes to selling prices.
Once arrangement consideration is allocated to the various deliverables in a multiple element arrangement, revenue is recognized when all other revenue recognition criteria has been achieved.
Advertising Costs
Advertising is expensed as incurred as a component of sales and marketing expenses on the consolidated statements of operations. Advertising expense was $0.1 million during 2016, 2015 and 2014.
Income Taxes
The Company accounts for income taxes using an asset and liability method, which requires the recognition of taxes payable or refundable for the current year and deferred tax assets and liabilities for the expected future tax consequences of temporary differences that currently exist between the tax basis and the financial reporting basis of our taxable subsidiaries’ assets and liabilities using the enacted tax rates in effect for the year in which the differences are expected to reverse. The effect of a change in tax rates on deferred tax assets and liabilities is recognized in operations in the period that includes the enactment date. The measurement of deferred tax assets is reduced, if necessary, by the amount of any tax benefits that, based on available evidence, are not expected to be realized.
The Company files U.S. federal and state and foreign income tax returns in jurisdictions with varying statutes of limitations. In the normal course of business the Company is subject to examination by taxing authorities throughout the world. These audits include questioning the timing and amount of deductions, the allocation of income among various tax jurisdictions and compliance with federal, state, local and foreign tax laws. The Company accounts for unrecognized tax benefits using a more-likely-than-not threshold for financial statement recognition and measurement of tax positions taken or expected to be taken in a tax return. The Company establishes reserves for tax-related uncertainties based on estimates of whether, and the extent to which, additional taxes will be due. The Company records an income tax liability, if any, for the difference between the benefit recognized and measured and the tax position taken or expected to be taken on our tax returns. The Company recognizes interest accrued and penalties related to unrecognized tax benefits in the income tax provision.
61
Stock-Based Compensation
The Company measures and recognizes compensation expense for all share-based awards made to employees and directors based on estimated fair values. The fair value of employee and director options is estimated on the date of grant using the Black-Scholes option-pricing model. The value of awards that are ultimately expected to vest is recognized as an expense over the requisite service periods.
For awards that are expected to result in a tax deduction, a deferred tax asset is established as the Company recognizes compensation expense. If the tax deduction exceeds the cumulative recorded compensation expense, the tax benefit associated with the excess deduction is considered a windfall benefit. The excess tax benefit from share compensation plans is recorded in in the accompanying consolidated income statement.
Net Income (Loss) Per Common Share
Basic net income (loss) per share is computed by dividing income available to common shareholders by the weighted-average number of shares of common stock outstanding during the period. Diluted net income (loss) per share is computed by dividing income available to common shareholders by the weighted-average number of shares of common stock outstanding during the period increased to include the number of additional shares of common stock that would have been outstanding if the potentially dilutive securities had been issued. Potentially dilutive securities include outstanding stock options, shares to be purchased under the Company’s employee stock purchase plan and unvested restricted stock units (“RSUs”). The dilutive effect of potentially dilutive securities is reflected in diluted earnings per share by application of the treasury stock method. Under the treasury stock method, an increase in the fair market value of the Company’s common stock can result in a greater dilutive effect from potentially dilutive securities.
Recent Accounting Pronouncements
In May 2014, the FASB issued Accounting Standards Update No. 2014-09, “Revenue from Contracts with Customers (Topic 606)” (“ASU 2014-09”) which amended the existing FASB Accounting Standards Codification. Under the new standard, revenue is recognized when a customer obtains control of promised goods or services and is recognized in an amount that reflects the consideration which the entity expects to receive in exchange for those goods or services. The standard also specifies that the incremental costs of obtaining a contract with a customer and the costs of fulfilling a contract with a customer (if those costs are not within the scope of another Topic or Sub-Topic) would be deferred and recognized over the appropriate period of contract performance if they are expected to be recovered. In addition, the standard requires disclosure of the nature, amount, timing and uncertainty of revenue and cash flows arising from contracts with customers. The FASB recently issued several amendments to the standard, including clarifications on disclosure of prior-period performance obligations and remaining performance obligations.
The guidance permits two methods of adoption: retrospectively to each prior reporting period presented (full retrospective method), or retrospectively with the cumulative effect of initially applying the guidance recognized at the date of initial application (modified retrospective method, also known as the cumulative catch-up transition method). The updates are effective for the Company for interim and annual periods beginning after December 15, 2017 and early adoption is permitted for annual periods beginning after December 15, 2016.
The Company is in the process of performing our initial assessment of the impacts of the standard, and have not yet determined whether the standard will have a material impact on our consolidated financial statements. However, we currently believe the most significant impact is from the timing of recognition of sales commission expenses, which upon adoption will be recognized as costs over a period of time instead of immediately. We are also in the process of assessing the impact of the new standard on certain of our contracts that include performance-based fees. We currently recognize such fees in the period when the performance criteria have been met; however, under the new standard we would estimate the variable fees and recognize amounts for which it is probable that a significant reversal would not occur. For certain contracts, this could result in acceleration of recognition of the performance-based fees. We do not currently expect our recurring revenue management fees, based on a fixed percentage of overall sales value associated with the service contracts, to be significantly impacted by the new standard.
We will adopt the standard in the first quarter of 2018 and preliminarily expect to use the modified prospective method. However, we are continuing to evaluate the impact of the standard, and our adoption method is subject to change. We expect to complete our assessment process, including impacts on our processes, systems and financial statement disclosures, by the end of the third quarter of 2017.
62
In February 2016, the FASB issued ASU No. 2016-02 “Leases (Topic 842).” This standard requires entities that lease assets to recognize on the balance sheet the assets and liabilities for the rights and obligations created by those leases. The standard is effective for fiscal years and the interim periods within those fiscal years beginning after December 15, 2018. The guidance is required to be applied by the modified retrospective transition approach. Early adoption is permitted. The Company is currently evaluating the impact of the adoption of this authoritative guidance on our consolidated financial statements.
In November 2015, the FASB issued ASU No. 2015-17 Balance Sheet Classification of Deferred Taxes, which requires that deferred tax assets and liabilities to be classified as noncurrent in the consolidated balance sheet. The standard will be effective for financial statements issued for annual periods beginning after December 15, 2016, and interim periods within those annual periods. Early adoption is permitted for financial statements that have not been previously issued. The standard may be applied either prospectively to all deferred tax assets and liabilities or retrospectively to all periods presented. We have elected to adopt this guidance prospectively as of December 31, 2016. As a result, we have classified all deferred tax liabilities and assets as non-current in the Consolidated Balance Sheet at December 31, 2016. Due to the prospective treatment, prior periods presented in these financial statements have not been adjusted.
In March 2016, the FASB issued ASU 2016-09, Compensation—Stock Compensation (Topic 718). The standard is intended to simplify several areas of accounting for share-based compensation arrangements, including the income tax impact, classification on the statement of cash flows and accounting for award forfeitures. ASU 2016-09 is effective for fiscal years, and interim periods within those years, beginning after December 15, 2016, and early adoption is permitted. The Company early adopted ASU 2016-09 during the third quarter of 2016 on a modified retrospective basis for the income statement impact of forfeitures and income taxes. Accordingly, the Company recognized a cumulative adjustment charge of $0.3 million to beginning Accumulated Deficit as of January 1, 2016 related to the forfeiture rate methodology change. ASU 2016-09 also requires the presentation of excess tax benefits as an operating activity (combined with other income tax cash flows) on the statement of cash flows rather than as a financing activity. Adopting this provision of the ASU did not have a material impact on the Company's financial statements. The new guidance also requires the presentation of shares withheld for employee taxes as a financing activity (retrospective change) on the statement of cash flows which resulted in a $0.9 million and $1.0 million reclassification from operating activities to financing activities for the years ended December 31, 2016 and 2015, respectively. There were no shares withheld for employee taxes in 2014.
In August 2014, the FASB issued ASU 2014-15 Presentation of Financial Statements—Going Concern (ASC Subtopic 205-40): "Disclosure of Uncertainties about an Entity's Ability to Continue as a Going Concern". The update requires management to assess a company's ability to continue as a going concern and to provide related footnote disclosures in certain circumstances. All entities are required to apply the new requirements in annual periods ending after December 15, 2016, and interim periods thereafter. Early application is permitted. The adoption of this guidance did not have a material effect on our consolidated financial statements.
Correction to Condensed Consolidated Balance Sheet as of December 31, 2015
Subsequent to the issuance of the Company’s 2015 consolidated financial statements, management determined that its net deferred tax asset valuation allowance was incorrectly computed and recorded for the periods ending after December 31, 2011. This error was due to the incorrect netting of an indefinite-lived deferred tax liability related to tax-deductible goodwill against certain deferred tax assets that the Company believed more likely than not would not be realized. In order to be a source of future taxable income to support realizability of a deferred tax asset, a taxable temporary difference must reverse in a period such that it would result in the realization of the deferred tax asset. Taxable temporary differences related to indefinite-lived intangibles and tax-deductible goodwill are problematic in this regard as, by their nature, they are not predicted to reverse (commonly referred to as naked credits). Although such temporary differences would reverse on impairment or sale of the related assets, those events are not anticipated under ASC 740 Income taxes (“ASC 740”) for purposes of predicting the reversal of the related taxable temporary difference. As a result, the reversal of taxable temporary differences with respect to indefinite-lived assets and tax-deductible goodwill should not be considered a source of future taxable income when evaluating and calculating a valuation allowance in accordance with ASC 740. The cumulative error beginning in 2012 totaled $2.1 million at December 31, 2015.
In evaluating whether the previously issued financial statements were materially misstated, the Company followed the guidance of ASC 250, Accounting Changes and Error Corrections, SEC Staff Accounting Bulletin ("SAB") Topic 1.M, Assessing Materiality and SAB Topic 1.N, Considering the Effects of Prior Year Misstatements when Quantifying Misstatements in Current Year Financial Statements. The Company concluded that the error was not material to the affected prior periods. However, correction of the entire cumulative error would have been material to that quarter's three month results and would have impacted comparisons to prior quarters. As a result, certain amounts presented in the Company’s consolidated financial statements have been revised from the amounts previously reported to correct this error as shown in the table below.
63
Condensed Consolidated Balance Sheet as of December 31, 2015 (in thousands):
As Previously Reported | Corrections | As Revised | |||||||||
Other long term liabilities | $ | 4,113 | $ | 2,119 | $ | 6,232 | |||||
Total liabilities | 167,470 | 2,119 | 169,589 | ||||||||
Accumulated deficit | (181,822 | ) | (2,119 | ) | (183,941 | ) | |||||
Total stockholders' equity | 150,094 | (2,119 | ) | 147,975 | |||||||
Total liabilities and stockholders' equity | $ | 317,564 | $ | — | $ | 317,564 | |||||
Correction to Condensed Consolidated Statements of Operations, Comprehensive Income (Loss) and Cash Flows for the periods ended December 31, 2015 and 2014
The Company has revised certain amounts in the condensed consolidated statements of operations and comprehensive income for years ended December 31, 2015 and 2014 and the condensed consolidated statement of cash flows for the years ended December 31, 2015 and 2014 to correct income tax expense related to the valuation allowance calculation error discussed above, so that such adjustment is recorded in the proper period. The Company believes this correction is not material to its previously issued annual and interim consolidated financial statements.
For the year ended December 31, 2015 | |||||||||||
As Previously Reported | Corrections | As Revised | |||||||||
Loss before income taxes | $ | (39,009 | ) | $ | — | $ | (39,009 | ) | |||
Income tax provision | 1,404 | 180 | 1,584 | ||||||||
Net loss | $ | (40,413 | ) | $ | (180 | ) | $ | (40,593 | ) | ||
Net loss per share, basic and diluted | $ | (0.47 | ) | $ | (0.01 | ) | $ | (0.48 | ) | ||
Weighted average common shares outstanding, basic and diluted | 85,417 | — | 85,417 | ||||||||
For the year ended December 31, 2014 | |||||||||||
As Previously Reported | Corrections | As Revised | |||||||||
Loss before income taxes | $ | (94,857 | ) | $ | — | $ | (94,857 | ) | |||
Income tax provision | 302 | 180 | 482 | ||||||||
Net loss | $ | (95,159 | ) | $ | (180 | ) | $ | (95,339 | ) | ||
Net loss per share, basic and diluted | $ | (1.15 | ) | $ | — | $ | (1.15 | ) | |||
Weighted average common shares outstanding, basic and diluted | 82,872 | — | 82,872 | ||||||||
The following tables summarize the effects of the corrections on the Company’s condensed consolidated statements of comprehensive income for the years ended December 31, 2015 and 2014 (in thousands):
For the year ended December 31, 2015 | |||||||||||
As Previously Reported | Corrections | As Revised | |||||||||
Net loss | $ | (40,413 | ) | $ | (180 | ) | $ | (40,593 | ) | ||
Other comprehensive income (loss): | |||||||||||
Foreign currency translation adjustments | 12 | — | 12 | ||||||||
Unrealized gain (loss) on short-term investments | (698 | ) | — | (698 | ) | ||||||
Other comprehensive income (loss) | (686 | ) | — | (686 | ) | ||||||
Total comprehensive loss | $ | (41,099 | ) | $ | (180 | ) | $ | (41,279 | ) | ||
64
For the year ended December 31, 2014 | |||||||||||
As Previously Reported | Corrections | As Revised | |||||||||
Net loss | $ | (95,159 | ) | $ | (180 | ) | $ | (95,339 | ) | ||
Other comprehensive income (loss): | |||||||||||
Foreign currency translation adjustments | 471 | — | 471 | ||||||||
Unrealized gain (loss) on short-term investments | (212 | ) | — | (212 | ) | ||||||
Other comprehensive income (loss) | 259 | — | 259 | ||||||||
Total comprehensive loss | $ | (94,900 | ) | $ | (180 | ) | $ | (95,080 | ) | ||
The following tables summarize the effects of the corrections on the Company’s condensed consolidated statement of cash flows for the years ended December 31, 2015 and 2014 (in thousands):
For the year ended December 31, 2015 | |||||||||||
Cash flows from operating activities | As Previously Reported | Corrections | As Revised | ||||||||
Net loss | $ | (40,413 | ) | $ | (180 | ) | $ | (40,593 | ) | ||
Adjustments to reconcile net loss to net cash provided by operating activities: | |||||||||||
Depreciation and amortization | 13,736 | — | 13,736 | ||||||||
Amortization of debt discount and issuance costs | 8,048 | — | 8,048 | ||||||||
Accretion of premium on short-term investments and other | (101 | ) | — | (101 | ) | ||||||
Deferred income taxes | 789 | 180 | 969 | ||||||||
Stock-based compensation | 13,387 | — | 13,387 | ||||||||
Restructuring and other | 2,579 | — | 2,579 | ||||||||
Changes in operating assets and liabilities: | |||||||||||
Accounts receivable, net | 12,002 | — | 12,002 | ||||||||
Deferred revenue | (1,204 | ) | — | (1,204 | ) | ||||||
Prepaid expenses and other | (1,825 | ) | — | (1,825 | ) | ||||||
Accounts payable | (1,562 | ) | — | (1,562 | ) | ||||||
Accrued taxes | (539 | ) | — | (539 | ) | ||||||
Accrued compensation and benefits | 2,706 | — | 2,706 | ||||||||
Accrued expenses | (3,940 | ) | — | (3,940 | ) | ||||||
Other liabilities | (66 | ) | — | (66 | ) | ||||||
Net cash provided by operating activities | $ | 3,597 | $ | — | $ | 3,597 | |||||
65
For the year ended December 31, 2014 | |||||||||||
Cash flows from operating activities | As Previously Reported | Corrections | As Revised | ||||||||
Net loss | $ | (95,159 | ) | $ | (180 | ) | $ | (95,339 | ) | ||
Adjustments to reconcile net loss to net cash provided by operating activities: | |||||||||||
Depreciation and amortization | 13,219 | — | 13,219 | ||||||||
Amortization of debt discount and issuance costs | 7,474 | — | 7,474 | ||||||||
Accretion of premium on short-term investments and other | (245 | ) | — | (245 | ) | ||||||
Deferred income taxes | (514 | ) | 180 | (334 | ) | ||||||
Stock-based compensation | 20,899 | — | 20,899 | ||||||||
Tax (benefit) deficit from stock-based compensation | (146 | ) | — | (146 | ) | ||||||
Restructuring and other | 952 | — | 952 | ||||||||
Goodwill and other intangibles impairment | 25,108 | — | 25,108 | ||||||||
Changes in operating assets and liabilities: | |||||||||||
Accounts receivable, net | 3,716 | — | 3,716 | ||||||||
Deferred revenue | (371 | ) | — | (371 | ) | ||||||
Prepaid expenses and other | (631 | ) | — | (631 | ) | ||||||
Accounts payable | (278 | ) | — | (278 | ) | ||||||
Accrued taxes | 477 | — | 477 | ||||||||
Accrued compensation and benefits | 248 | — | 248 | ||||||||
Accrued expenses | 1,978 | — | 1,978 | ||||||||
Other liabilities | (489 | ) | — | (489 | ) | ||||||
Net cash provided by operating activities | $ | (23,762 | ) | $ | — | $ | (23,762 | ) | |||
3. Net Income (Loss) Per Common Share
The basic and diluted net income (loss) per share calculations are presented below (in thousands, except for per share amounts):
Years Ended December 31, | |||||||||||
2016 | 2015 | 2014 | |||||||||
Basic net loss per common share | |||||||||||
Net loss | $ | (32,126 | ) | $ | (40,593 | ) | $ | (95,339 | ) | ||
Weighted-average common shares outstanding | 86,318 | 85,417 | 82,872 | ||||||||
Basic net loss per share | $ | (0.37 | ) | $ | (0.48 | ) | $ | (1.15 | ) | ||
Years Ended December 31, | |||||||||||
2016 | 2015 | 2014 | |||||||||
Diluted net loss per common share | |||||||||||
Net loss used to determine diluted earnings per common shares | $ | (32,126 | ) | $ | (40,593 | ) | $ | (95,339 | ) | ||
Weighted-average common shares outstanding used in basic calculation | 86,318 | 85,417 | 82,872 | ||||||||
Adjustment for dilutive shares | — | — | — | ||||||||
Weighted-average common shares for diluted net loss per share | 86,318 | 85,417 | 82,872 | ||||||||
Diluted net loss per share | $ | (0.37 | ) | $ | (0.48 | ) | $ | (1.15 | ) | ||
66
Potential shares of common stock that are not included in the determination of diluted net loss per share because they are anti-dilutive for the periods presented consist of weighted stock options, non-vested restricted stock and shares to be purchased under our Employee Stock Purchase Plan. These shares have an anti-dilutive effect of 7.7 million, 9.5 million and 6.4 million shares for the years ended December 31, 2016, 2015 and 2014, respectively.
4. Goodwill and Other Intangibles Impairment
On January 22, 2014, the Company acquired Scout Analytics, Inc. (“Scout”), a privately held company for a total purchase consideration of $32.5 million, net of cash acquired. Scout provides cloud-based recurring revenue management solutions that enable information services, media publishing and SaaS companies to understand how end customers engage with their online content. As a result of the acquisition, the Company recorded $22.7 million of goodwill and $9.0 million of other intangible assets.
Goodwill Impairment
During the third quarter of 2014, the Company’s market capitalization had a significant decline, the Company experienced slowing revenue growth and losses in 2014 for the former CBI reporting unit in the near term and the Company experienced churn of the former CBI client base. Therefore, the Company determined that there were sufficient indicators to require the Company to perform an interim impairment analysis in the third quarter of 2014.
Based on the analysis, the Company determined that the carrying amount of the goodwill for the former CBI reporting unit was in excess of its fair value and that a quantitative impairment test was necessary. The fair value of the reporting unit was determined using the income approach, which estimates the fair value based on the future discounted cash flows. Under the income approach, the company assumed a forecasted cash flow period of nine years, long-term annual growth rates of 4% and a discount rate of 16%. As required by the quantitative step of the impairment test, the Company performed an allocation of the fair value to all the assets and liabilities of the reporting unit, including identifiable intangible assets, based on their estimated fair values, to determine the implied fair value of goodwill. Accordingly, the Company recorded a goodwill impairment charge related to the former CBI reporting unit of $21.0 million, during the quarter ended September 30, 2014 for the difference between the carrying value of the goodwill in the reporting unit and its implied fair value. Consistent with the approach in the third quarter, the Company performed an analysis for the former CBI reporting unit and again determined that the fair value was less than the carrying value. The Company then performed the quantitative step of the impairment analysis which resulted in the impairment of all of the reporting unit’s remaining goodwill in the amount of $1.7 million in the fourth quarter of 2014.
In total, the Company recorded a $22.7 million non-cash goodwill impairment charge in 2014 for its former CBI reporting unit. No impairment of goodwill was recognized on the remaining $6.3 million of goodwill assigned to the former Managed Services reporting unit for the year ended December 31, 2015.
The carrying value of goodwill for the periods ended December 31, 2016 and 2015 was $6.3 million, respectively.
Intangible Assets Impairment
In the fourth quarter of 2014, due to a move to a competing solution by the reseller of a technology acquired from the Scout acquisition, and lack of alternative uses of this technology, the Company decided not to pursue future opportunities with this technology and fully impaired the intangible assets related to this technology, trademarks and client contracts and recorded at charge of $2.5 million for the year-ended December 31, 2014. No impairment of intangible assets was recognized for the year ended December 31, 2016 or 2015.
Intangible Assets
Intangible Assets consisted of the following:
67
Gross Carrying Amount | Accumulated Amortization | Net | |||||||||
(in thousands) | |||||||||||
Balance as of December 31, 2014 | $ | 6,050 | $ | (1,427 | ) | $ | 4,623 | ||||
Amortization expenses | — | (1,513 | ) | (1,513 | ) | ||||||
Balance as of December 31, 2015 | 6,050 | (2,940 | ) | 3,110 | |||||||
Amortization expenses | — | (1,512 | ) | (1,512 | ) | ||||||
Balance as of December 31, 2016 | $ | 6,050 | $ | (4,452 | ) | $ | 1,598 | ||||
Amortization expense for intangibles assets recognized was $1.5 million, $1.5 million and $1.9 million during the years ended December 31, 2016, 2015 and 2014, respectively. The Company’s intangible asset is comprised of $0.8 million of developed technology assets, $0.5 million of customer relationships assets and $0.3 million of trade name assets as of December 31, 2016.
The estimated future amortization expense of purchased intangible assets as of December 31, 2016 was as follows:
December 31, 2016 | |||
(in thousands) | |||
2017 | $ | 1,512 | |
2018 | 86 | ||
Total | $ | 1,598 | |
5. Cash, Cash Equivalents and Short-term Investments
Cash equivalents consist of highly liquid fixed-income investments with original maturities of three months or less at the time of purchase. Short-term investments consist of readily marketable securities with a remaining maturity of more than three months from time of purchase. The Company classifies all of its cash equivalents and short-term investments as “available for sale,” as these investments are free of trading restrictions and are available for use in the Company's daily operations. These marketable securities are carried at fair value, with the unrealized gains and losses, net of tax, reported as accumulated other comprehensive income and included as a separate component of stockholders’ equity. Gains and losses are recognized when realized. When the Company determines that an other-than-temporary decline in fair value has occurred, the amount of the decline that is related to a credit loss is recognized in earnings. Gains and losses are determined using the specific identification method. The Company’s realized gains and losses in the years ended December 31, 2016 and 2015 were insignificant.
Cash and cash equivalents and short-term investments consisted of the following as of December 31, 2016 and 2015 (in thousands):
December 31, 2016
Amortized Cost | Unrealized Gains | Unrealized Losses | Estimated Fair Value | ||||||||||||
Cash | $ | 47,060 | $ | — | $ | — | $ | 47,060 | |||||||
Cash equivalents: | |||||||||||||||
Money market mutual funds | 632 | — | — | 632 | |||||||||||
Total cash and cash equivalents | 47,692 | — | — | 47,692 | |||||||||||
Short-term investments: | |||||||||||||||
Corporate bonds | 54,827 | 19 | (188 | ) | 54,658 | ||||||||||
U.S. agency securities | 34,658 | — | (281 | ) | 34,377 | ||||||||||
Asset-backed securities | 26,431 | 25 | (23 | ) | 26,433 | ||||||||||
U.S. Treasury securities | 22,701 | — | (288 | ) | 22,413 | ||||||||||
Total short-term investments | 138,617 | 44 | (780 | ) | 137,881 | ||||||||||
Cash, cash equivalents and short-term investments | $ | 186,309 | $ | 44 | $ | (780 | ) | $ | 185,573 | ||||||
68
December 31, 2015
Amortized Cost | Unrealized Gains | Unrealized Losses | Estimated Fair Value | ||||||||||||
Cash | $ | 72,105 | $ | — | $ | — | $ | 72,105 | |||||||
Cash equivalents: | |||||||||||||||
Money market mutual funds | 229 | — | — | 229 | |||||||||||
Total cash and cash equivalents | 72,334 | — | — | 72,334 | |||||||||||
Short-term investments: | |||||||||||||||
Corporate bonds | 54,434 | — | (389 | ) | 54,045 | ||||||||||
U.S. agency securities | 36,010 | — | (187 | ) | 35,823 | ||||||||||
Asset-backed securities | 30,665 | — | (132 | ) | 30,533 | ||||||||||
U.S. Treasury securities | 16,024 | — | (47 | ) | 15,977 | ||||||||||
Total short-term investments | 137,133 | — | (755 | ) | 136,378 | ||||||||||
Cash, cash equivalents and short-term investments | $ | 209,467 | $ | — | $ | (755 | ) | $ | 208,712 | ||||||
The following table summarizes the amortized cost and estimated fair value of money market mutual funds and short-term fixed income securities classified as short-term investments based on stated effective maturities as of December 31, 2016 (in thousands):
Amortized Cost | Estimated Fair Value | ||||||
Less than 1 year | $ | 26,636 | $ | 26,634 | |||
Due in 1 to 5 years | 112,613 | 111,879 | |||||
Total | $ | 139,249 | $ | 138,513 | |||
As of December 31, 2016, the Company did not consider any of its investments to be other-than-temporarily impaired.
6. Fair Value of Financial Instruments
The Company measures certain financial instruments at fair value on a recurring basis. The Company uses a three-tier fair value hierarchy, which prioritizes the inputs used in the valuation methodologies in measuring fair value:
• | Level 1 valuations are based on quoted prices in active markets for identical assets or liabilities. |
• | Level 2 valuations are based on inputs that are observable, either directly or indirectly, other than quoted prices included within Level 1. Such inputs used in determining fair value for Level 2 valuations include quoted prices in active markets for similar assets or liabilities, quoted prices for identical or similar assets or liabilities in markets that are not active, or other inputs that are observable or can be corroborated by observable market data for substantially the full term of the assets or liabilities. |
• | Level 3 valuations are based on information that is unobservable and significant to the overall fair value measurement. |
All of the Company’s cash equivalents and short-term investments are classified within Level 1 or Level 2.
The following table presents information about the Company’s financial instruments that are measured at fair value as of December 31, 2016 and indicates the fair value hierarchy of the valuation (in thousands):
69
Total | Quoted Prices in Active Markets for Identical Assets (Level 1) | Significant Other Observable Inputs (Level 2) | |||||||||
Description | |||||||||||
Cash equivalents: | |||||||||||
Money market mutual funds | $ | 632 | $ | 632 | $ | — | |||||
Total cash equivalents | 632 | 632 | — | ||||||||
Short-term investments: | |||||||||||
Corporate bonds | 54,658 | — | 54,658 | ||||||||
U.S. agency securities | 34,377 | — | 34,377 | ||||||||
Asset-backed securities | 26,433 | — | 26,433 | ||||||||
U.S. Treasury securities | 22,413 | — | 22,413 | ||||||||
Total short-term investments | 137,881 | — | 137,881 | ||||||||
Cash equivalents and short-term investments | $ | 138,513 | $ | 632 | $ | 137,881 | |||||
The Company has restricted cash of $1.2 million within Other assets, net as of December 31, 2016 and 2015. The restricted cash is classified within Level 1.
The following table presents information about the Company’s financial instruments that are measured at fair value as of December 31, 2015 and indicates the fair value hierarchy of the valuation (in thousands):
Total | Quoted Prices in Active Markets for Identical Assets (Level 1) | Significant Other Observable Inputs (Level 2) | |||||||||
Description | |||||||||||
Cash equivalents: | |||||||||||
Money market mutual funds | $ | 229 | $ | 229 | $ | — | |||||
Total cash equivalents | 229 | 229 | — | ||||||||
Short-term investments: | |||||||||||
Corporate bonds | 54,045 | — | 54,045 | ||||||||
U.S. agency securities | 35,823 | — | 35,823 | ||||||||
Asset-backed securities | 30,533 | — | 30,533 | ||||||||
U.S. Treasury securities | 15,977 | — | 15,977 | ||||||||
Total short-term investments | 136,378 | — | 136,378 | ||||||||
Cash equivalents and short-term investments | $ | 136,607 | $ | 229 | $ | 136,378 | |||||
The convertible notes issued by the Company in August 2013 are shown in the accompanying consolidated balance sheets at their original issuance value, net of unamortized discount and issuance costs, and are not marked to market each period. The approximate fair value of the convertible notes was $143.8 million and $126.0 million as of December 31, 2016 and 2015 respectively. The fair value of the convertible notes was determined using quoted market prices for similar securities, which, due to limited trading activity, are considered Level 2 in the fair value hierarchy.
The Company did not have any other financial instruments or long-term debt measured at fair value as of December 31, 2016 and 2015, respectively.
7. Other Assets, Net
Other assets, net balances were comprised of the following (in thousands):
70
December 31, 2016 | December 31, 2015 | ||||||
Restricted Cash | $ | 1,244 | $ | 1,244 | |||
Cost basis equity investment | — | 4,500 | |||||
Long-term deposits and other | 2,201 | 1,175 | |||||
Total | $ | 3,445 | $ | 6,919 | |||
In 2013, we made an equity investment in a private company for $4.5 million, which represented less than 5% of the outstanding equity of the company. We have carried this investment on a cost basis and have periodically evaluated it to determine if there is an impairment in its carrying value. Based on unfavorable growth trends and declining financial performance during 2016 and the future liquidity needs of this company, the Company determined that its investment was impaired and recorded a $4.5 million impairment charge in the twelve months ended December 31, 2016.
8. Property and Equipment, Net
Property and equipment balances were comprised of the following (in thousands):
December 31, | |||||||
2016 | 2015 | ||||||
Computers and equipment | $ | 19,930 | $ | 18,471 | |||
Software | 59,453 | 46,142 | |||||
Leasehold improvements | 18,092 | 12,338 | |||||
Furniture and fixtures | 10,947 | 8,853 | |||||
108,422 | 85,804 | ||||||
Less: accumulated depreciation and amortization | (70,242 | ) | (59,901 | ) | |||
$ | 38,180 | $ | 25,903 | ||||
Depreciation and amortization expense during the years ended December 31, 2016, 2015 and 2014, was $16.1 million, $13.7 million and $13.2 million, respectively.
Total property and equipment assets under capital lease at December 31, 2016 and 2015, was $3.2 million and $3.3 million, respectively. Accumulated depreciation related to assets under capital lease as of these dates were $3.2 million and $3.2 million, respectively.
The Company capitalized costs of $13.1 million, $7.2 million and $3.0 million, during 2016, 2015 and 2014, respectively, related to internal-use software. As of December 31, 2016 and 2015, the carrying value of capitalized costs related to internal-use software, net of accumulated amortization, was $17.2 million and $11.7 million, respectively. Amortization of capitalized costs related to internal-use software was $7.6 million, $5.0 million and $2.9 million during 2016, 2015 and 2014, respectively.
9. Other Current Liabilities
Other current liabilities balances were comprised of the following (in thousands):
December 31, | |||||||
2016 | 2015 | ||||||
Accrued Interest - Convertible Notes | $ | 938 | $ | 948 | |||
Deferred rent | 1,359 | 738 | |||||
ESPP Withholding | 661 | 641 | |||||
Total | $ | 2,958 | $ | 2,327 | |||
71
10. Credit Facility and Capital Leases
Letter of Credit
On February 3, 2015, the Company issued a $1.2 million letter of credit in connection with a lease for a new San Francisco office facility. The letter of credit is secured by $1.2 million of a money market account which is classified as restricted cash in other assets, net, in the accompanying consolidated balance sheet.
Capital Leases
The Company has capital lease agreements that are collateralized by the underlying property and equipment and expire through September 2019. The weighted-average imputed interest rates for capital lease agreements were 2.9%, 4.4% and 5.8% at December 31, 2016, 2015 and 2014, respectively.
The future contractual maturities of capital lease obligations as of December 31, 2016 are less than $0.2 million through 2019.
11. Debt
Senior Convertible Notes
In August 2013, the Company issued senior convertible notes (the "Notes") raising gross proceeds of $150.0 million.
The Notes are governed by an Indenture, dated August 13, 2013 (the "Indenture"), between the Company and Wells Fargo Bank, National Association, as trustee. The Notes will mature on August 1, 2018, unless earlier repurchased or converted, and bear interest at a rate of 1.50% per year payable semi-annually in arrears on February 1 and August 1 of each year, commencing February 1, 2014.
The Notes are convertible at an initial conversion rate of 61.6770 of common stock per $1,000 principal amount of Notes, which represents an initial conversion price of approximately $16.21 per share of common stock, subject to anti-dilution adjustments upon certain specified events, including in certain circumstances, upon a make-whole fundamental change (as defined in the Indenture). Upon conversion, the Notes will be settled in cash, shares of the Company’s common stock, or any combination thereof, at the Company’s option.
Prior to February 1, 2018, the Notes are convertible only upon the following circumstances:
• | during any calendar quarter commencing after December 31, 2013, (and only during such calendar quarter), if for at least 20 trading days (whether or not consecutive) during the period of 30 consecutive trading days ending on the last trading day of the immediately preceding calendar quarter, the last reported sale price of common stock on such trading day is greater than or equal to 130% of the applicable conversion price on such trading day. |
• | during the five business day period after any five consecutive trading day period in which the trading price per $1,000 principal amount of the Notes for each trading day of that five consecutive trading day period was less than 98% of the product of the last reported sale price of common stock and the applicable conversion rate on each such trading day; or |
• | upon the occurrence of specified corporate events described in the Indenture. |
Holders of the Notes may convert their Notes at any time on or after February 1, 2018, until the close of business on the second schedule trading day immediately preceding the maturity date, regardless of the foregoing circumstances.
The holders of the Notes may require the Company to repurchase all or a portion of their Notes at a cash repurchase price equal to 100% of the principal amount of the Notes being repurchased, plus accrued and unpaid interest, if any, upon a fundamental change (as defined in the Indenture). In addition, upon certain events of default (as defined in the Indenture), the trustee by notice to the Company, or the holders of at least 25% in principal amount of the outstanding Notes by notice to the Company and the trustee, may, and the trustee at the request of such holders shall, declare 100% of the principal amount of the Notes, plus accrued and unpaid interest, if any, on all the Notes to be due and payable. In case of certain events of bankruptcy, insolvency or reorganization involving the Company, 100% of the principal of and accrued and unpaid interest on the Notes will automatically become due and payable. The Notes were not subject to conversion or repurchase at December 31, 2016.
72
To account for the Notes at issuance, the Company separated the Notes into debt and equity components pursuant to the accounting standards for convertible debt instruments that may be fully or partially settled in cash upon conversion. The fair value of debt component was estimated using an interest rate for nonconvertible debt, with terms similar to the Notes, excluding the conversion feature. The carrying amount of the liability component was calculated by measuring the fair value of a similar liability that does not have an associated convertible feature. The excess of the principal amount of the Notes over the fair value of the debt component was recorded as a debt discount and a corresponding increase in additional paid-in capital. The debt discount is accreted to interest expense over the term of the Notes using the interest method. The amount recorded to additional paid-in capital is not to be remeasured as long as it continues to meet the conditions of equity classification. Upon issuance of the $150.0 million of Notes, the Company recorded $111.5 million to debt and $38.5 million to additional paid-in capital.
The Company incurred transaction costs of approximately $4.9 million related to the issuance of the Notes. In accounting for these costs, the Company allocated the costs to the debt and equity components in proportion to the allocation of proceeds from the issuance of the Notes to such components. Transaction costs allocated to the debt component of $3.6 million are deferred as an asset and amortized to interest expense over the term of the Notes. As a result of the adoption of ASU No. 2015-03, Simplifying the Presentation of Debt Issuance Cost, these costs were reclassified to Convertible Notes, net, as of December 31, 2016 and 2015. The transaction costs allocated to the equity component of $1.3 million were recorded to additional paid-in capital.
The net carrying amount of the liability component of the Notes as of December 31, 2016 and 2015 consists of the following (in thousands):
December 31, | |||||||
2016 | 2015 | ||||||
Principal amount | $ | 150,000 | $ | 150,000 | |||
Unamortized debt discount | (13,928 | ) | (21,908 | ) | |||
Unamortized debt issuance costs | (1,297 | ) | (2,041 | ) | |||
Net carrying amount | $ | 134,775 | $ | 126,051 | |||
The following table presents the interest expense recognized related to the Notes for the year ended December 31, 2016 and 2015 (in thousands):
December 31, | |||||||
2016 | 2015 | ||||||
Contractual interest expense at 1.5% per annum | $ | 2,250 | $ | 2,250 | |||
Amortization of debt issuance costs | 743 | 686 | |||||
Accretion of debt discount | 7,981 | 7,362 | |||||
Total | $ | 10,974 | $ | 10,298 | |||
The net proceeds from the Notes were approximately $145.1 million after payment of the initial purchasers' offering expense. The Company used approximately $31.4 million of the net proceeds from the Notes to pay the cost of the Note Hedges described below, which was partially offset by $21.8 million of the proceeds from the Company's sale of the Warrants also described below.
Note Hedges
Concurrent with the issuance of the Notes, the Company entered into note hedges ("Note Hedges") with certain bank counterparties, with respect to its common stock. The Company paid $31.4 million for the Note Hedges. The Note Hedges cover approximately 9.25 million shares of the Company's common stock at a strike price of $16.21 per share. The Note Hedges will expire upon the maturity of the Notes. The Note Hedges are intended to reduce the potential dilution to the Company's common stock upon conversion of the Notes and/or offset the cash payment in excess of the principal amount of the Notes the Company is required to make in the event that the market value per share of the Company's common stock at the time of exercise is greater than the conversion price of the Notes.
73
Warrants
Separately, the Company entered into warrant transactions, whereby it sold warrants to the same bank counterparties as the Note Hedges to acquire approximately 9.25 million shares of the Company's common stock at an initial strike price of $21.02 per share ("Warrants"), subject to anti-dilution adjustments. The Company received proceeds of approximately $21.8 million from the sale of the Warrants. If the fair value per share of the Company's common stock exceeds the strike price of the Warrants, the Warrants will have a dilutive effect on earnings per share, unless the Company elects, subject to certain conditions, to settle the Warrants in cash.
The amounts paid and received for the Note Hedges and the Warrants have been recorded in additional paid-in capital. The fair value of the Note Hedges and the Warrants are not remeasured through earnings each reporting period.
12. Commitments and Contingencies
Operating Leases
The Company leases its office space and certain equipment under non-cancelable operating lease agreements with various expiration dates through November 2022. Rent expense during 2016, 2015 and 2014 was $11.3 million, $9.4 million and $9.2 million, respectively. The Company recognizes rent expense on a straight-line basis over the lease period and accrues for rent expense incurred but not paid.
In April 2016, the Company signed a 6-year office lease expiring in July 2022, for a new revenue delivery center in Singapore to occupy 17,626 square feet. The total minimum lease payments are estimated to be approximately $4.8 million over the lease term.
In July 2016, the Company signed a 5-year office lease expiring in December 2021, for an additional floor in the existing revenue delivery center in the Philippines to occupy 21,915 square feet. The total minimum lease payments are estimated to be approximately $3.5 million over the lease term.
Future annual minimum lease payments under all non-cancelable operating leases as of December 31, 2016 were as follows (in thousands):
Fiscal Year | |||
2017 | $ | 10,349 | |
2018 | 9,873 | ||
2019 | 8,163 | ||
2020 | 7,336 | ||
2021 | 7,278 | ||
Thereafter | 4,121 | ||
Total | $ | 47,120 | |
Purchase Orders
The Company had $10.1 million in non-cancelable purchase commitments with our suppliers as of December 31, 2016.
Litigation
The Company is subject to various legal proceedings and claims arising in the ordinary course of our business, including the cases discussed below. Although the results of litigation and claims cannot be predicted with certainty, the Company is currently not aware of any litigation or threats of litigation in which the final outcome could have a material adverse effect on our business, operating results, financial position, or cash flows. Regardless of the outcome, litigation can have an adverse impact on the Company because of defense and settlement costs, diversion of management resources and other factors. The Company records a contingent liability when it is probable that a loss has been incurred and the amount is reasonably estimable in accordance with accounting for contingencies. As of December 31, 2016, the Company has accrued a $1.5 million reserve relating to our potential liability for currently pending disputes, reflected in Accrued Expenses in the condensed consolidated balance sheets and in the notes to our condensed consolidated financial statements appearing elsewhere in this Annual Report on Form 10-K.
74
On July 8, 2015, a single plaintiff filed a putative securities class action lawsuit, Weller v. ServiceSource International, Inc. et al., in the U.S. District Court for the Northern District of California (the “Weller Lawsuit”) against the Company and the Company’s former Chief Executive Officer. All claims under the Weller Lawsuit have been dismissed with prejudice.
On August 23, 2016, the United States District Court for the Middle District of Tennessee granted conditional class certification in a lawsuit originally filed on September 21, 2015 by three former senior sales representatives. The lawsuit, Sarah Patton, et al v. ServiceSource Delaware, Inc., asserts a claim under the Fair Labor Standards Act alleging that certain sales account representatives and senior sales representatives in our Nashville location were not paid for all hours worked and were not properly paid for overtime hours worked. The complaint also asserts claims under Tennessee state law for breach of contract and unjust enrichment, however, the plaintiffs have not yet filed a motion to certify the state law breach of contract and unjust enrichment claims as a class action. The Company will continue to vigorously defend itself against these claims.
13. Share Repurchase Program, Stock-Based Compensation and ESPP
Share Repurchase Program
In August 2015, the Board authorized a stock repurchase program (the program) to repurchase up to $30.0 million worth of common stock of the Company. The program expires in August 2017. During the year ended December 31, 2016, the Company repurchased 2.3 million shares at an average price of $3.94 per share for an aggregate purchase price of $8.9 million under the program. During the year ended December 31, 2015 the Company repurchased 0.3 million shares at an average price of $4.11 per share for an aggregate purchase price of $1.2 million under the program. The aggregate amount available under the program was approximately $19.9 million as of December 31, 2016. The Company’s share repurchase program does not obligate the Company to acquire any specific number of shares. Shares may be repurchased in privately negotiated and/or open market transactions, including under plans complying with Rule 10b5-1 under the Exchange Act. The Company cash settles with the program broker periodically and reflects any unsettled amounts as a current liability at each period end.
Equity Incentive Plan
The Company maintains the following stock plans: the 2011 Equity Incentive Plan (the “2011 Plan”) and the 2011 Employee Stock Purchase Plan. The Company’s board of directors, by delegation to its compensation committee, administers the 2011 Plan and has authority to determine the directors, officers, employees and consultants to whom options, restricted stock units or restricted stock awards may be granted, the option price or restricted stock purchase price, the timing of when each share is exercisable and the duration of the exercise period and the nature of any restrictions or vesting periods applicable to an option or restricted stock grant
Under the 2011 Plan, options granted are generally subject to a four-year vesting period whereby 25% of the options become vested after a one-year period and the remainder then vests monthly through the end of the vesting period. Vested options may be exercised up to ten years from the grant date, as defined in the 2011 Plan. Vested but unexercised options expire 90 days after termination of employment with the Company. The restricted stock units and awards typically vest on a straight-line basis over four years with annual vesting as to one-fourth of the grant on each anniversary date with vesting contingent upon employment with the Company.
At the end of each fiscal year, the share reserve under the 2011 Plan increases automatically by an amount equal to 4% of the outstanding shares as of the end of that most recently completed fiscal year or 3,840,000 shares, whichever is less. On January 1, 2017, 3.5 million additional shares were reserved under the 2011 Equity Incentive Plan pursuant to the automatic increase.
During the third quarter of 2016, the Company granted performance-based restricted stock unit awards under the Company’s 2011 Equity Incentive Plan to certain key executives (the “2016 PSU Awards”). For each 2016 PSU Award, a number of restricted stock units will become eligible to vest based on the levels of achievement of the performance-based conditions described below, and any such restricted stock units that become eligible to vest will vest upon the satisfaction of the time-based vesting condition described below. The aggregate target number of restricted stock units subject to the 2016 PSU Awards is 1.0 million with an aggregate grant date fair value of $5.1 million, which will be expensed over a two year period.
75
The performance-based conditions are based upon the Company’s revenue and adjusted EBITDA performance in fiscal year 2016 against the target goals for such metrics under the Company’s 2016 corporate incentive plan (in each case, “Performance Achievement”), which will each be determined on the date the Company files its Annual Report on Form 10-K for fiscal year 2016. The target number of restricted stock units for each 2016 PSU Award will be divided equally between the two performance metrics. For each performance metric, the number of restricted stock units that become eligible to vest will be: (i) if the applicable Performance Achievement is less than 85% of the target goal, no restricted stock units for such performance metric, (ii) if the applicable Performance Achievement is equal to 85% of the target goal, 50% of the target number of restricted stock units for such performance metric, (iii) if the applicable Performance Achievement is equal to 100% of the target goal, 100% of the target number of restricted stock units for such performance metric, or (iv) if the applicable Performance Achievement is at least 120% of the target goal, 150% of the target number of restricted stock units for such performance metric. For each performance metric, if the applicable Performance Achievement falls between any of the thresholds (ii), (iii) and (iv) specified in the previous sentence, the number of restricted stock units that become eligible to vest for such performance metric will be determined via linear interpolation.
Under the time-based vesting condition, 50% of the restricted stock units that have become eligible to vest will vest on the first anniversary of the grant date, and 50% of the restricted stock units that have become eligible to vest will vest on the second anniversary of the grant date, except as otherwise provided under certain termination and change-in-control provisions in each award agreement governing a 2016 PSU Award. Such provisions will determine the number of restricted stock units that become eligible to vest and when and how many restricted stock units will actually vest in connection with the specified terminations of employment and changes in-control.
Determining Fair Value of Stock Options
The estimated fair value of stock options and awards granted during 2016, 2015 and 2014, was approximately $13.3 million, $18.6 million and $19.4 million, respectively. The Company estimates the fair value of stock option awards at the date of grant using the Black-Scholes option-pricing model. Options are granted with an exercise price equal to the fair value of the common stock as of the date of grant. Compensation expense is amortized on a straight-line basis over the requisite service period of the options, which is generally four years. Restricted stock vest over four years and upon vesting, entitles the holder to one share of common stock for each restricted stock and has an exercise price of $0.0001 per share, which is equal to the par value of the Company’s common stock. The fair value of the restricted stock is based on the Company’s closing stock price on the date of grant, and compensation expense is recognized on a straight-line basis over the vesting period.
The fair value of each grant of options during 2016, 2015 and 2014 was determined by the Company using the methods and assumptions discussed below. The Company stratifies its population of outstanding share options into two relatively homogeneous groups to estimate the expected term of options grants. Each of these inputs is subjective and generally requires significant judgment to determine.
Expected Term—The expected term represents the period that the Company’s share-based awards are expected to be outstanding. The Company calculated the expected term of share options using four data points: options exercised, options expired, options forfeited and options outstanding. The weighted-average of the four data points were used to calculate the expected term.
Expected Volatility—The expected volatility was based on the historical stock volatility of several of the Company’s self-designated publicly listed comparable companies over a period equal to the expected terms of the options, as the Company has limited trading history to use the volatility of its own common shares.
Risk-Free Interest Rate—The risk-free interest rate was based on the implied yield on U.S. Treasury zero-coupon issues for each option grant date with maturities approximately equal to the option’s contractual term.
Expected Dividend Yield—The Company has not paid dividends on its common shares nor does it expect to pay dividends in the foreseeable future.
The weighted average Black-Scholes option-pricing model assumptions for years ended 2016, 2015 and 2014 were as follows:
76
Years Ended December 31, | ||||||||
2016 | 2015 | 2014 | ||||||
Expected term (in years) | 5.0 | 5.0 | 5.0 | |||||
Expected volatility | 58 | % | 34 | % | 37 | % | ||
Risk-free interest rate | 1.23 | % | 1.64 | % | 1.57 | % | ||
Expected dividend yield | — | % | — | % | — | % | ||
Employee Stock Purchase Plan
The Company’s 2011 Employee Stock Purchase Plan (the “ESPP”) is intended to qualify under Section 423 of the Internal Revenue Code of 1986. Under the ESPP, employees are eligible to purchase common stock through payroll deductions of up to 10% of their eligible compensation, subject to any plan limitations. The purchase price of the shares on each purchase date is equal to 85% of the lower of the fair market value of the Company’s common stock on the first and last trading days of each six-month offering period.
The Company estimates the fair value of purchase rights under the ESPP using the Black-Scholes option-pricing model. The fair value of each purchase right under the ESPP was estimated on the date of grant using the Black-Scholes option valuation model and the straight-line attribution approach with the following weighted-average assumptions:
Years Ended December 31, | ||||||||
2016 | 2015 | 2014 | ||||||
Expected term (in years) | 0.5 -1.0 | 0.5 -1.0 | 0.5 -1.0 | |||||
Expected volatility | 38%-52% | 25%-35% | 33% - 45% | |||||
Risk-free interest rate | 0.42%-0.56% | 0.07%-0.37% | 0.05%-0.11% | |||||
Expected dividend yield | — | % | — | % | — | % | ||
The expected term represents the period of time from the beginning of the offering period to the purchase date. The Company uses its peer market volatility for a period equivalent to the expected term of the options to estimate the expected volatility. The risk-free interest rate that the Company uses in the Black-Scholes option valuation model is based on U.S. Treasury zero-coupon issues with remaining terms similar to the expected term. The Company has never declared or paid any cash dividends and does not plan to pay cash dividends in the foreseeable future, and, therefore, used an expected dividend yield of zero in the valuation model.
The ESPP provides that additional shares are reserved under the plan annually on the first day of each fiscal year in an amount equal to the lesser of (i) 1.5 million shares, (ii) one percent of the outstanding shares of common stock on the last day of the immediately preceding fiscal year, or (iii) an amount determined by the board of directors and/or the compensation committee of the board of directors. As of December 31, 2016, 1.8 million shares had been issued under the ESPP and 3.1 million shares were available for future issuance. On January 1, 2017, 0.9 million additional shares were reserved under the 2011 Employee Stock Purchase Plan.
Stock Awards Issued to Employees
Option and RSU activity under the Option Plans for 2016, 2015 and 2014 was as follows (shares and aggregate intrinsic value in thousands):
77
Options Outstanding | Restricted Stock Outstanding | |||||||||||
Shares Available for Grant | Number of Shares | Weighted- Average Exercise Price | Number of Shares | |||||||||
January 1, 2014 | 5,755 | 8,908 | $ | 5.89 | 5,431 | |||||||
Additional shares reserved under the 2011 equity incentive plan | 3,279 | — | — | — | ||||||||
Granted | (8,554 | ) | 4,345 | 4.46 | 4,209 | |||||||
Options exercised/ Restricted stock released | — | (518 | ) | 5.13 | (1,332 | ) | ||||||
Canceled/Forfeited | 5,502 | (2,665 | ) | 6.77 | (2,832 | ) | ||||||
December 31, 2014 | 5,982 | 10,070 | 5.08 | 5,476 | ||||||||
Additional shares reserved under the 2011 equity incentive plan | 3,364 | — | — | — | ||||||||
Granted | (6,696 | ) | 4,206 | 4.45 | 2,490 | |||||||
Options exercised/ Restricted stock released | — | (1,126 | ) | 4.13 | (1,966 | ) | ||||||
RSU shares withheld for taxes | 212 | 212 | ||||||||||
Canceled/Forfeited | 4,193 | (2,534 | ) | 5.65 | (1,660 | ) | ||||||
December 31, 2015 | 7,055 | 10,616 | 4.79 | 4,552 | ||||||||
Additional shares reserved under the 2011 equity incentive plan | 3,478 | — | — | — | ||||||||
Granted | (3,304 | ) | 709 | 4.11 | 2,594 | |||||||
Options exercised/ Restricted stock released | — | (2,111 | ) | 4.62 | (1,435 | ) | ||||||
RSU shares withheld for taxes | 195 | — | — | 195 | ||||||||
Canceled/Forfeited | 2,982 | (1,719 | ) | 5.43 | (1,263 | ) | ||||||
December 31, 2016 | 10,406 | 7,495 | $ | 4.63 | 4,643 | |||||||
Number of Shares | Weighted- Average Exercise Price | Weighted- Average Remaining Contractual Life (Years) | Aggregate Intrinsic Value | |||||||||
Options vested and expected to vest—December 31, 2016 | 7,495 | $ | 4.63 | 7.43 | $ | 9,160 | ||||||
Options exercisable—December 31, 2016 | 3,731 | 4.94 | 6.41 | 3,933 | ||||||||
Restricted stock expected to vest—December 31, 2016 | 4,237 | — | 1.33 | 24,063 | ||||||||
The weighted-average grant date fair value of options granted during 2016, 2015 and 2014 was $2.05, $1.45 and $1.56, respectively. The weighted-average grant date fair values of restricted stock units granted during 2016, 2015 and 2014 was $4.56, $5.03 and $4.62, respectively.
The aggregate intrinsic value of options exercised under the Option Plans was $1.5 million, $1.3 million and $1.7 million, in 2016, 2015 and 2014, respectively, determined as of the date of option exercise. The intrinsic value is calculated as the difference between the fair value of the common shares on the exercise date and the exercise price of the option shares. The total estimated fair value of options shares vested in 2016, 2015 and 2014 was $3.7 million, $2.7 million and $4.8 million, respectively.
Stock-based compensation expense is based on applying estimated fair values determined at the grant date to those options granted in the year that are ultimately expected to vest.
The table below summarizes stock-based compensation expense as allocated within the Company’s consolidated statements of operations (in thousands):
78
Years Ended December 31, | |||||||||||
2016 | 2015 | 2014 | |||||||||
(in thousands) | |||||||||||
Includes stock-based compensation of: | |||||||||||
Cost of revenue | $ | 1,484 | $ | 2,666 | $ | 3,995 | |||||
Sales and marketing | 3,004 | 3,393 | 6,193 | ||||||||
Research and development | 586 | 1,299 | 2,800 | ||||||||
General and administrative | 5,678 | 6,029 | 7,911 | ||||||||
Restructuring and other | — | 2,579 | — | ||||||||
Total stock-based compensation | $ | 10,752 | $ | 15,966 | $ | 20,899 | |||||
The above table does not include $0.6 million and $0.4 million of capitalized stock-based compensation related to internal-use software in in 2016 and 2015, respectively. There was no capitalized stock-based compensation related to internal-use software in 2014.
As of December 31, 2016 there was $22.2 million of unrecognized compensation expense related to non-vested share-based compensation arrangements granted under the 2011 Plan, which is expected to be recognized over a weighted-average period of 2.33 years.
14. Employee Benefit Plan
The Company maintains a 401(k) defined contribution benefit plan that covers domestic employees who have attained 21 years of age and provide at least 20 hours of service per week. This plan allows U.S. employees to contribute up to 90% of their pre-tax salary in certain investments at the discretion of the employee, up to maximum annual contribution limits established by the U.S. Department of Treasury. During 2016, 2015 and 2014, the Company matched up to 50% of employee contributions up to an annual limit of $2,000. Matching contributions by the Company are fully vested upon completion of the first year of employment. Employer matching contributions, which may be discontinued at the Company’s discretion, amounted to $1.7 million, $2.1 million and $1.9 million, during 2016, 2015 and 2014, respectively.
15. Income Taxes
Loss from continuing operations before provision for income taxes for the Company’s domestic and international operations was as follows (in thousands):
Years Ended December 31, | |||||||||||
2016 | 2015 | 2014 | |||||||||
U.S. | $ | (32,499 | ) | $ | (40,720 | ) | $ | (88,616 | ) | ||
International | 3,802 | 1,711 | (6,241 | ) | |||||||
Loss before provision for income taxes | $ | (28,697 | ) | $ | (39,009 | ) | $ | (94,857 | ) | ||
The income tax provision consisted of the following (in thousands):
79
Years Ended December 31, | |||||||||||
2016 | 2015 | 2014 | |||||||||
Current: | |||||||||||
Federal | $ | 279 | $ | — | $ | (16 | ) | ||||
Foreign | 1,112 | 632 | 517 | ||||||||
State and local | 89 | (32 | ) | 424 | |||||||
Total current income tax provision | 1,480 | 600 | 925 | ||||||||
Deferred: | |||||||||||
Federal | 129 | 160 | 160 | ||||||||
Foreign | (54 | ) | 52 | (97 | ) | ||||||
State and local | 1,874 | 772 | (506 | ) | |||||||
Total deferred income tax provision (benefit) | 1,949 | 984 | (443 | ) | |||||||
Income tax provision | $ | 3,429 | $ | 1,584 | $ | 482 | |||||
The following table provides a reconciliation of income taxes provided at the federal statutory rate of 35% to the income tax provision (in thousands):
Years Ended December 31, | |||||||||||
2016 | 2015 | 2014 | |||||||||
U.S. income tax at federal statutory rate | $ | (10,046 | ) | $ | (13,388 | ) | $ | (32,246 | ) | ||
State income taxes, net of federal benefit | (170 | ) | 342 | 758 | |||||||
Section 956 Inclusion | 2,976 | — | — | ||||||||
Foreign tax rate differential | (882 | ) | (85 | ) | 1,882 | ||||||
Share-based compensation | 5,038 | — | — | ||||||||
Permanent differences | 383 | 254 | 464 | ||||||||
Non-deductible impairment charges | — | — | 7,702 | ||||||||
Tax credits | (111 | ) | (405 | ) | (1,769 | ) | |||||
Federal Rate Change | (1,954 | ) | — | — | |||||||
Return to Provision | 1,068 | — | — | ||||||||
Adjustments to Opening Deferreds | 2,009 | — | |||||||||
Valuation allowance | 4,458 | 14,529 | 23,825 | ||||||||
Other, net | 660 | 337 | (134 | ) | |||||||
Income tax provision | $ | 3,429 | $ | 1,584 | $ | 482 | |||||
In November 2015, the Philippine Economic Zone Authority granted a four year tax holiday to the Company's Philippine affiliate, commencing with its fiscal year beginning January 1, 2016. The earnings per share benefit in 2016 and 2015 is not material.
In December 2013, Malaysia granted a ten year tax holiday to the Company’s Malaysia affiliate, commencing with its fiscal year beginning January 1, 2014. This resulted in a tax benefit in fiscal 2013 of approximately $0.2 million from the elimination of the Malaysia subsidiary’s deferred tax liabilities. The earnings per share benefit in 2016, 2015 and 2014 is not material.
The following table provides the effect of temporary differences that created deferred income taxes as of December 31, 2016 and 2015. Deferred tax assets and liabilities represent the future effects on income taxes resulting from temporary differences and carryforwards at the end of the respective periods (in thousands):
80
December 31, | |||||||
2016 | 2015 | ||||||
Deferred tax assets: | |||||||
Accrued liabilities | $ | 3,540 | $ | 2,390 | |||
Share-based compensation expense | 4,961 | 12,823 | |||||
Net operating loss carryforwards | 92,087 | 66,541 | |||||
Tax credits | 5,676 | 5,692 | |||||
Amortization of tax intangibles | 5,957 | 7,639 | |||||
Investments | 1,774 | — | |||||
Other, net | 351 | 27 | |||||
Total deferred tax assets | 114,346 | 95,112 | |||||
Deferred tax liabilities: | |||||||
Property & equipment | (3,607 | ) | (6,122 | ) | |||
Convertible debt costs | (1,041 | ) | (1,635 | ) | |||
Net deferred tax assets | 109,698 | 87,355 | |||||
Less: Valuation allowance | (111,935 | ) | (87,643 | ) | |||
Net deferred tax liabilities | $ | (2,237 | ) | $ | (288 | ) | |
As of December 31, 2016 and 2015, management assessed the realizability of deferred tax assets and evaluated the need for a valuation allowance for deferred tax assets on a jurisdictional basis. This evaluation utilizes the framework contained in ASC 740, Income Taxes, wherein management analyzes all positive and negative evidence available at the balance sheet date to determine whether all or some portion of the Company's deferred tax assets will not be realized. Under this guidance, a valuation allowance must be established for deferred tax assets when it is more likely than not (a probability level of more than 50 percent) that the asset will not be realized. In assessing the realization of the Company's deferred tax assets, management consider all available evidence, both positive and negative.
In concluding on the evaluation, management placed significant emphasis on guidance in ASC 740, which states that “a cumulative loss in recent years is a significant piece of negative evidence that is difficult to overcome.” Based upon available evidence, it was concluded on a more-likely-than-not basis that all deferred tax assets were not realizable as of December 31, 2016. Accordingly, a valuation allowance of $111.9 million has been recorded to offset this deferred tax asset. The change in valuation allowance for the years ended December 31, 2016 and 2015 were an increase of $24.3 million and $13.6 million, respectively.
The Company also maintains a deferred tax liability related to indefinite lived intangible assets that is not netted against the deferred tax assets, as reversal of the taxable temporary difference cannot serve as a source of income for realization of the deferred tax assets, because the deferred tax liability will not reverse until the asset is sold or written down due to impairment.
Management also concluded on a more-likely-than-not basis that its Singapore deferred tax assets were not realizable, using the analysis prescribed in ASC 740. Other factors were considered but provided neither positive nor negative objectively-verifiable evidence as to the realization of our deferred tax assets. The remaining deferred tax assets at December 31, 2016 relate to jurisdictions in which the Company has net adjusted historical pretax profits and sufficient forecast profitability to assure future realization of such deferred tax assets.
As of December 31, 2016, the Company had net operating loss carryforwards of approximately $233.4 million for federal income tax purposes and approximately $377.8 million for state income tax purposes. These losses are available to reduce taxable income and expire at various dates beginning in 2026 for federal income tax purposes and 2017 for state income tax purposes. The Company also has foreign net operating loss carryforwards of approximately $7.8 million which are indefinitely available to reduce taxable income and do not expire.
At December 31, 2016, the Company had $2.5 million of U.S. federal research and development credits which expire beginning in 2031, and $3.6 million of California research and development credits which do not expire. The Company also has $0.4 million of California Enterprise Zone Credits which expire beginning in 2023 if not utilized, and $1.9 million of other state tax credits which expire beginning in 2024 if not utilized.
Utilization of the Company’s net operating loss and tax credit carryforwards may be subject to a substantial annual limitation due to the ownership change limitations provided by the Internal Revenue Code and similar state provisions. Such an annual limitation could result in the expiration or elimination of the net operating loss and tax credit carryforwards before utilization. Management believes that the limitation will not limit utilization of the carryforwards prior to their expiration.
81
The Company acquired U.S. federal net operating loss carryforwards of Scout Analytics, Inc. upon the acquisition of that entity in January 2014, subject to the ownership change limitations. Acquired U.S. federal net operating losses from Scout total approximately $30.2 million, net of amounts unavailable due to ownership change limitations, which amount is included in the total U.S. federal net operating loss above.
The Company files U.S. federal and state and foreign income tax returns in jurisdictions with varying statutes of limitations. In the normal course of business the Company is subject to examination by taxing authorities throughout the world. These audits could include examining the timing and amount of deductions, the allocation of income among various tax jurisdictions and compliance with federal, state, local and foreign tax laws. Our 2005 through 2015 tax years generally remain subject to examination by federal, state and foreign tax authorities.
The Company has implemented the provisions of ASC 740-10, Accounting for Uncertainty in Income Taxes. A reconciliation of the beginning and ending amount of unrecognized tax benefits is as follows (in thousands):
December 31, | |||||||||||
Years Ended | 2016 | 2015 | 2014 | ||||||||
Beginning balance | $ | 937 | $ | 948 | $ | 880 | |||||
Additions based on tax positions related to the current year | 24 | 62 | 169 | ||||||||
Reductions for tax positions of prior years | (35 | ) | (73 | ) | (101 | ) | |||||
Ending balance | $ | 926 | $ | 937 | $ | 948 | |||||
At December 31, 2016, the Company had a liability for unrecognized tax benefits of $0.9 million, none of which, if recognized, would affect the Company’s effective tax rate. The Company does not expect its unrecognized tax benefits to change significantly over the next 12 months.
The Company recognizes interest and penalties accrued related to unrecognized tax benefits in income tax expense. During the year ended December 31, 2016, the interest and penalties recognized were not material. During the years ended December 31, 2014 and 2013, the Company recognized and accrued an insignificant amount of interest or penalties related to unrecognized tax benefits.
The Company considers its undistributed earnings of ServiceSource Europe, Ltd. and ServiceSource International Singapore Pte. Ltd. permanently reinvested in foreign operations and has not provided for U.S. income taxes on such earnings. As of December 31, 2016 the Company’s unremitted earnings from its foreign subsidiaries was $3.2 million. The determination of the unrecognized deferred U.S. income tax liability, if any, is not practicable due to the complexities associated with its hypothetical calculation.
We adopted ASU 2016-09 in the third quarter of 2016. Under the new guidance, companies will no longer record excess tax benefits and certain tax deficiencies related to share-based payment to employees in additional paid-in capital (APIC). Instead, we will recognize all income tax effects of awards in our income statement when awards vest or are settled. All excess tax benefits not previously recognized were to be recorded to retained earnings as a cumulative effect adjustment upon adoption. Upon adoption, no adjustment to retained earnings was necessary due to the Company’s valuation allowance position. Approximately $50.2 million attributable to excess tax benefits on stock compensation that had not been previously recognized were added to the Net Operating Loss with a corresponding increase to the valuation allowance.
16. Geographical Information
The Company’s business is geographically diverse. During 2016, 64% of net revenue was earned in North America and Latin America (“NALA”), 25% in Europe, Middle East and Africa (“EMEA”) and 11% in Asia Pacific-Japan (“APJ”). Net revenue for a particular geography generally reflects commissions earned from sales of service contracts managed from revenue delivery centers in that geography and subscription sales and professional services to deploy the Company's solutions. Predominantly all of the service contracts sold and managed by the revenue delivery centers relate to end customers located in the same geography. All of NALA net revenue represents revenue generated in the United States.
Net revenue by geographic region, is summarized as follows (in thousands):
82
Year Ended December 31, | |||||||||||
2016 | 2015 | 2014 | |||||||||
Net revenue | |||||||||||
NALA | $ | 163,371 | $ | 166,511 | $ | 176,928 | |||||
EMEA | 62,479 | 59,708 | 70,425 | ||||||||
APJ | 27,037 | 25,984 | 24,827 | ||||||||
Total net revenue | $ | 252,887 | $ | 252,203 | $ | 272,180 | |||||
During the twelve months ended December 31, 2016 the Company's top ten clients accounted for 66% of our revenue, with three clients each representing over 10% of revenue during this period.
The majority of the Company’s assets at December 31, 2016 and 2015 were attributable to its U.S. operations. Property and equipment information is based on the physical location of the assets. The following table presents the long-lived assets, consisting of property and equipment, by geographic location (in thousands):
December 31, | ||||||||
2016 | 2015 | |||||||
NALA | $ | 28,916 | $ | 21,626 | ||||
EMEA | 2,297 | 732 | ||||||
APJ | 6,967 | 3,545 | ||||||
Total property and equipment, net | $ | 38,180 | $ | 25,903 | ||||
83
17. Restructuring and Other
The Company announced at the beginning of the third quarter of 2014 a restructuring effort to better align its cost structure with current revenue levels. Restructuring was completed during 2015. The restructuring plans are accounted for in accordance with ASC 420, Exit or Disposal Cost Obligations. Restructuring and other charges during the years ended December 31, 2015 and 2014, was $3.7 million and $3.3 million, respectively. There were no restructuring charges during 2016.
Restructuring charges in 2015 consisted of $1.1 million of separation payments and related employee benefits and $2.6 million of stock compensation related to the accelerated vesting of certain equity awards granted to the Company’s former interim CFO and CEO. Restructuring charges in 2014 consisted of $2.8 million of separation payments and related employee benefits and $0.5 million of charges related to cancellation of contracts with outside vendors.
Restructuring and other reserve activities for the twelve months ended December 31, 2015 and 2014 are summarized as follows (in thousands):
Restructuring | Other | Total | |||||||||
Restructuring and other liability at January 1, 2014 | $ | — | $ | — | $ | — | |||||
Charges to expense and other adjustments | 2,054 | 1,260 | 3,314 | ||||||||
Cash paid | (1,690 | ) | (1,009 | ) | (2,699 | ) | |||||
Restructuring and other liability at December 31, 2014 | 364 | 251 | 615 | ||||||||
Charges to expense and other adjustments | 353 | 3,309 | 3,662 | ||||||||
Cash paid | (717 | ) | (886 | ) | (1,603 | ) | |||||
Acceleration of stock-based compensation expense in additional paid-in capital | — | (2,579 | ) | (2,579 | ) | ||||||
Restructuring and other liability at December 31, 2015 | — | 95 | 95 | ||||||||
Cash Paid | — | (95 | ) | (95 | ) | ||||||
Restructuring and other liability at December 31, 2016 | $ | — | $ | — | $ | — | |||||
18. Selected Quarterly Financial Data (Unaudited)
The following table sets forth data derived from our unaudited quarterly Condensed Consolidated Statement of Operations data for each of the eight quarters ended December 31, 2016. In management’s opinion, the data has been prepared on the same basis as the audited Consolidated Financial Statements included in this report, and reflects all necessary adjustments, consisting only of normal recurring adjustments, necessary for a fair statement of this data. Net loss and Net loss per common share has been updated to reflect the prior period tax correction discussed in Note 2.
.
Three Months Ended | |||||||||||||||||||||||||||||||
Dec. 31, 2016 | Sep. 30, 2016 | Jun. 30, 2016 | Mar. 31, 2016 | Dec. 31, 2015 | Sep. 30, 2015 | Jun. 30, 2015 | Mar. 31, 2015 | ||||||||||||||||||||||||
(in thousands, except per share amounts) | |||||||||||||||||||||||||||||||
Net revenue | $ | 68,654 | $ | 62,514 | $ | 61,969 | $ | 59,750 | $ | 64,960 | $ | 59,432 | $ | 61,613 | $ | 66,197 | |||||||||||||||
Gross profit | 26,152 | 21,725 | 21,625 | 18,316 | 24,667 | 16,864 | 18,921 | 20,382 | |||||||||||||||||||||||
Loss from operations | (2,168 | ) | (3,712 | ) | (3,269 | ) | (6,344 | ) | (3,736 | ) | (8,187 | ) | (9,579 | ) | (8,191 | ) | |||||||||||||||
Loss before income taxes | (7,572 | ) | (8,303 | ) | (4,969 | ) | (7,853 | ) | (5,954 | ) | (10,700 | ) | (12,318 | ) | (10,036 | ) | |||||||||||||||
Net loss | (8,496 | ) | (9,271 | ) | (5,218 | ) | (9,141 | ) | (6,023 | ) | (10,903 | ) | (13,452 | ) | (10,215 | ) | |||||||||||||||
Net loss per common share: | |||||||||||||||||||||||||||||||
Basic and diluted | $ | (0.09 | ) | $ | (0.11 | ) | $ | (0.06 | ) | $ | (0.11 | ) | $ | (0.07 | ) | $ | (0.13 | ) | $ | (0.16 | ) | $ | (0.12 | ) | |||||||
84
ITEM 9. | CHANGES IN AND DISAGREEMENTS WITH ACCOUNTANTS ON ACCOUNTING AND FINANCIAL DISCLOSURE |
None.
ITEM 9A. | CONTROLS AND PROCEDURES |
(a) Evaluation of disclosure controls and procedures
Under the supervision and with the participation of our management, including our chief executive officer and chief financial officer, we conducted an evaluation of the effectiveness of the design and operation of our disclosure controls and procedures, as defined in Rules 13a-15(e) and 15d-15(e) under the Securities Exchange Act of 1934, as amended (the “Exchange Act”), as of the end of the period covered by this Annual Report on Form 10-K.
In designing and evaluating our disclosure controls and procedures, management recognizes that any disclosure controls and procedures, no matter how well designed and operated, can provide only reasonable assurance of achieving the desired control objectives. In addition, the design of disclosure controls and procedures must reflect the fact that there are resource constraints and that management is required to apply its judgment in evaluating the benefits of possible controls and procedures relative to their costs.
Based on management’s evaluation, our chief executive officer and chief financial officer concluded that as of December 31, 2016 our disclosure controls and procedures are designed to, and are effective to, provide at a reasonable assurance level that the information we are required to disclose in reports that we file or submit under the Exchange Act is recorded, processed, summarized and reported within the time periods specified in Securities and Exchange Commission rules and forms, and that such information is accumulated and communicated to our management, including our chief executive officer and chief financial officer, as appropriate, to allow timely decisions regarding required disclosures.
(b) Management’s Report on Internal Control Over Financial Reporting
Our management is responsible for establishing and maintaining adequate internal control over financial reporting, as such term is defined in Exchange Act Rules 13a-15(f) and 15d-15(f). Under the supervision and with the participation of our management, including our chief executive officer and chief financial officer, we conducted an evaluation of the effectiveness of our internal control over financial reporting as of December 31, 2016 based on the guidelines established in Internal Control-Integrated Framework (2013) issued by the Committee of Sponsoring Organizations of the Treadway Commission (COSO). Our internal control over financial reporting is designed to provide reasonable assurance regarding the reliability of financial reporting and the preparation of financial statements for external reporting purposes in accordance with U.S. generally accepted accounting principles.
Based on the results of our evaluation, our management concluded that our internal control over financial reporting was effective as of December 31, 2016. The effectiveness of our internal control over financial reporting as of December 31, 2016 has been audited by Ernst and Young LLP, an independent registered public accounting firm, as stated in its report which is included herein.
(c) Changes in internal control over financial reporting
There was no change in our internal control over financial reporting that occurred during the quarter ended December 31, 2016 that has materially affected, or is reasonably likely to materially affect, our internal control over financial reporting.
(d) Inherent Limitations on Effectiveness of Controls
Our management, including our chief executive officer and chief financial officer, do not expect that our disclosure controls or our internal control over financial reporting will prevent all errors and all fraud. A control system, no matter how well conceived and operated, can provide only reasonable, not absolute, assurance that the objectives of the control system are met. Further, the design of a control system must reflect the fact that there are resource constraints, and the benefits of controls must be considered relative to their costs. Because of the inherent limitations in all control systems, no evaluation of controls can provide absolute assurance that all control issues and instances of fraud, if any, within the Company have been detected. These inherent limitations include the realities that judgments in decision-making can be faulty, and that breakdowns can occur because of a simple error or mistake. Additionally, controls can be circumvented by the individual acts of some persons, by collusion of two or more people or by management override of the controls. The design of any system of controls also is based in part upon certain assumptions about the likelihood of future events, and there can be no assurance that any design will succeed in achieving its stated goals under all potential future conditions; over time, controls may become inadequate because of changes in conditions, or the degree of compliance with policies or procedures may deteriorate. Because of the inherent limitations in a cost-effective control system, misstatements due to error or fraud may occur and not be detected.
Report of Independent Registered Public Accounting Firm
The Board of Directors and Stockholders of ServiceSource International, Inc.
We have audited ServiceSource International, Inc.’s internal control over financial reporting as of December 31, 2016, based on criteria established in Internal Control-Integrated Framework issued by the Committee of Sponsoring Organizations of the Treadway Commission (2013 framework) (the COSO criteria). ServiceSource International, Inc.’s management is responsible for maintaining effective internal control over financial reporting, and for its assessment of the effectiveness of internal control over financial reporting included in the accompanying Management’s Report on Internal Control over Financial Reporting. Our responsibility is to express an opinion on the Company’s internal control over financial reporting based on our audit.
We conducted our audit in accordance with the standards of the Public Company Accounting Oversight Board (United States). Those standards require that we plan and perform the audit to obtain reasonable assurance about whether effective internal control over financial reporting was maintained in all material respects. Our audit included obtaining an understanding of internal control over financial reporting, assessing the risk that a material weakness exists, testing and evaluating the design and operating effectiveness of internal control based on the assessed risk, and performing such other procedures as we considered necessary in the circumstances. We believe that our audit provides a reasonable basis for our opinion.
A company’s internal control over financial reporting is a process designed to provide reasonable assurance regarding the reliability of financial reporting and the preparation of financial statements for external purposes in accordance with generally accepted accounting principles. A company’s internal control over financial reporting includes those policies and procedures that (1) pertain to the maintenance of records that, in reasonable detail, accurately and fairly reflect the transactions and dispositions of the assets of the company; (2) provide reasonable assurance that transactions are recorded as necessary to permit preparation of financial statements in accordance with generally accepted accounting principles, and that receipts and expenditures of the company are being made only in accordance with authorizations of management and directors of the company; and (3) provide reasonable assurance regarding prevention or timely detection of unauthorized acquisition, use, or disposition of the company’s assets that could have a material effect on the financial statements.
Because of its inherent limitations, internal control over financial reporting may not prevent or detect misstatements. Also, projections of any evaluation of effectiveness to future periods are subject to the risk that controls may become inadequate because of changes in conditions, or that the degree of compliance with the policies or procedures may deteriorate.
In our opinion, ServiceSource International, Inc. maintained, in all material respects, effective internal control over financial reporting as of December 31, 2016, based on the COSO criteria.
We also have audited, in accordance with the standards of the Public Company Accounting Oversight Board (United States), the consolidated balance sheet of ServiceSource International, Inc. as of December 31, 2016 and the related consolidated statements of operations, comprehensive loss, stockholders’ equity and cash flows for the year ended December 31, 2016 of ServiceSource International, Inc. and our report dated March 6, 2017 expressed an unqualified opinion thereon.
/s/ Ernst & Young LLP
Denver, Colorado
March 6, 2017
ITEM 9B. | OTHER INFORMATION |
None.
85
PART III
ITEM 10. | DIRECTORS, EXECUTIVE OFFICERS AND CORPORATE GOVERNANCE |
Information regarding our directors is incorporated by reference from the information contained under the caption “Election of Directors” in our Proxy Statement for our 2017 Annual Meeting of Stockholders (the “2017 Proxy Statement”). Information regarding our current executive officers is incorporated by reference from information contained under the caption “Executive Officers” in our 2017 Proxy Statement. Information regarding Section 16 reporting compliance is incorporated by reference from information contained under the caption “Section 16(a) Beneficial Ownership Reporting Compliance” in our 2017 Proxy Statement. Information regarding the Audit Committee of our Board of Directors and information regarding an Audit Committee financial expert is incorporated by reference from information contained under the caption “Board Committees” in our 2017 Proxy Statement. Information regarding our code of ethics is incorporated by reference from information contained under the caption “Code of Business Conduct and Ethics” in our 2017 Proxy Statement. Information regarding our implementation of procedures for stockholder nominations to our Board of Directors is incorporated by reference from information contained under the caption “Process for Recommending Candidates to the Board of Directors” in our 2017 Proxy Statement.
We intend to disclose any amendment to our code of ethics, or waiver from, certain provisions of our code of ethics as applicable for our directors and executive officers, including our principal executive officer, principal financial and accounting officer, chief accounting officer, and controller, or persons performing similar functions, by posting such information on our website at http://www.servicesource.com.
ITEM 11. | EXECUTIVE COMPENSATION |
The information required by this item is incorporated by reference from the information contained under the captions “Compensation Discussion and Analysis” and “Executive Compensation” in our 2017 Proxy Statement.
ITEM 12. | SECURITY OWNERSHIP OF CERTAIN BENEFICIAL OWNERS AND MANAGEMENT AND RELATED STOCKHOLDER MATTERS |
Other than information regarding securities authorized for issuance under equity compensation plans, which is set forth in the Notes to the Consolidated Financial Statements above, the information required by this item is incorporated by reference from the information contained under the caption “Security Ownership” in our 2017 Proxy Statement.
ITEM 13. | CERTAIN RELATIONSHIPS AND RELATED TRANSACTIONS, AND DIRECTOR INDEPENDENCE |
The information required by this item is incorporated by reference from the information contained under the captions “Related Person Transactions and Section 16(a) Beneficial Ownership Reporting Compliance” and “Director Independence” in our 2017 Proxy Statement.
ITEM 14. | PRINCIPAL ACCOUNTANT FEES AND SERVICES |
The information required by this item is incorporated by reference from the information contained under the caption “Principal Accountant Fees and Services” in our 2017 Proxy Statement.
86
PART IV
ITEM 15. | EXHIBITS AND FINANCIAL STATEMENT SCHEDULES |
(a) (1) All financial statements
Consolidated financial statements filed as part of this report are listed under Part II, Item 8, pages [51] through [55] of this Form 10-K.
(2) Financial Statement Schedules
No schedules are required because either the required information is not present or is not present in amounts sufficient to require submission of the schedule, or because the information required is included in the consolidated financial statements or the notes thereto.
(3) Exhibits
See Item 15(b) below. Each management contract and compensatory plan or arrangement required to be filed has been identified.
(b) Exhibits
The exhibits listed on the accompanying Exhibit Index immediately following the signature page are filed as part of, or are incorporated by reference into, this Annual Report on Form 10-K.
(c) Financial Statement Schedules
Reference is made to Item 15(a)(2) above.
ITEM 16. | FORM 10-K SUMMARY |
None.
87
SIGNATURES
Pursuant to the requirements of Section 13 or 15(d) of the Securities Exchange Act of 1934, the registrant has duly caused this report to be signed on its behalf by the undersigned, thereunto duly authorized.
SERVICESOURCE INTERNATIONAL, INC. | |||||
Dated: | March 6, 2017 | By: | /s/ CHRISTOPHER M. CARRINGTON | ||
Christopher M. Carrington | |||||
Chief Executive Officer (Principal Executive Officer) | |||||
POWER OF ATTORNEY
KNOW ALL BY THESE PRESENTS, that each person whose signature appears below hereby constitutes and appoints Robert N. Pinkerton and Patricia Elias, and each of them, his or her true and lawful attorney-in-fact and agent, with full power of substitution, each with power to act alone, to sign and execute on behalf of the undersigned any and all amendments to this Annual Report on Form 10-K, and to perform any acts necessary in order to file the same, with all exhibits thereto and other documents in connection therewith with the Securities and Exchange Commission, granting unto said attorney-in-fact and agent full power and authority to do and perform each and every act and thing requested and necessary to be done in connection therewith, as fully to all intents and purposes as he might or could do in person, hereby ratifying and confirming all that said attorney-in-fact and agent, or their or his or her substitutes, shall do or cause to be done by virtue hereof.
Pursuant to the requirements of the Securities Exchange Act of 1934, this report has been signed below by the following persons on behalf of the ServiceSource International, Inc. and in the capacities and on the dates indicated.
Date | Signature | Title | ||
March 6, 2017 | /s/ CHRISTOPHER M. CARRINGTON | Chief Executive Officer (Principal Executive Officer) | ||
Christopher M. Carrington | ||||
March 6, 2017 | /s/ ROBERT N. PINKERTON | Chief Financial Officer (Principal Financial and Accounting Officer) | ||
Robert N. Pinkerton | ||||
March 6, 2017 | /s/ ROBERT G. ASHE | Director | ||
Robert G. Ashe | ||||
March 6, 2017 | /s/ STEVEN M. CAKEBREAD | Director | ||
Steven M. Cakebread | ||||
March 6, 2017 | /s/ BRUCE W. DUNLEVIE | Director | ||
Bruce W. Dunlevie | ||||
March 6, 2017 | /s/ JAMES C. MADDEN | Director | ||
James C. Madden | ||||
March 6, 2017 | /s/ THOMAS F. MENDOZA | Director | ||
Thomas F. Mendoza | ||||
March 6, 2017 | /s/ GARY B. MOORE | Director | ||
Gary B. Moore | ||||
March 6, 2017 | /s/ BARRY D. REYNOLDS | Director | ||
Barry D. Reynolds | ||||
88
Index to Exhibits
Incorporated by Reference Herein | ||||||||||
Exhibit Number | Exhibit Description | Filed Herewith | Exhibit | Form/File No. | Filing Date | |||||
3.1 | Certificate of Incorporation of the Company filed March 24, 2011 | 3.1 | Form 8-K (No. 001- 35108) | April 1, 2011 | ||||||
3.2 | Amended and Restated Bylaws of the Company dated March 28, 2016 | 3.2 | Form 8-K (No. 001- 35108) | March 31, 2016 | ||||||
4.1 | Registration and Information Rights Agreement dated as of December 8, 2006, between the Registrant and GA SS Holding LLC, SSLLC Holdings, Inc., Housatonic Micro Fund SBIC, LP and Housatonic Equity Investors SBIC, LP | 4.1 | Form S-1/A (No. 333- 171271) | February 25, 2011 | ||||||
4.2 | Securities Purchase Agreement and Registration Rights Schedule dated as of January 31, 2003, between the Registrant and the 2003 Holders | 4.2 | Form S-1/A (No. 333- 171271) | February 25, 2011 | ||||||
4.3 | Specimen common stock certificate of the Registrant | 4.3 | Form S-1/A (No. 333- 171271) | March 11, 2011 | ||||||
4.4 | Indenture between ServiceSource International, Inc. and Wells Fargo Bank, National Association, dated as of August 13, 2013 | 4.4 | Form 8-K (No. 001-35108) | August 14, 2013 | ||||||
4.5 | Registration Rights Agreement dated as of November 13, 2014, by and between the Company and Altai Capital Management, L.P. | 10.2 | Form 8-K (No. 001-35108) | November 14, 2014 | ||||||
10.1+ | Form of Director and Executive Officer Indemnification Agreement | 10.1 | Form S-1 (No. 333- 171271) | December 20, 2010 | ||||||
10.2+ | 2004 Omnibus Share Plan and forms of agreements thereunder | 10.2 | Form S-1 (No. 333- 171271) | December 20, 2010 | ||||||
10.3+ | 2008 Share Option Plan and form of agreement thereunder | 10.3 | Form S-1 (No. 333- 171271) | December 20, 2010 | ||||||
10.4+ | 2011 Equity Incentive Plan and forms of agreements thereunder | 4.4 | Form S-8 (No. 333- 173116) | March 28, 2011 | ||||||
10.5+ | 2011 Equity Incentive Plan form of Restricted Stock Award Agreement | 10.1 | Form 8-K (No. 001- 35108) | February 10, 2012 | ||||||
10.6+ | 2011 Employee Stock Purchase Plan and form of agreement thereunder | 4.5 | Form S-8 (No. 333- 173116) | March 28, 2011 | ||||||
89
Incorporated by Reference Herein | ||||||||||
Exhibit Number | Exhibit Description | Filed Herewith | Exhibit | Form/File No. | Filing Date | |||||
10.7 | Form of Convertible Note Hedge Confirmation | 10.3 | Form 8-K (No. 001-35108) | August 9, 2013 | ||||||
10.8 | Form of Warrant Confirmation | 10.4 | Form 8-K (No. 001-35108) | August 9, 2013 | ||||||
10.9 | Employment and Confidential Information Agreement dated as of November 16, 2014, between the Company and Christopher M. Carrington | 10.15 | Form 10-K/A (No. 001-35108) | March 17, 2015 | ||||||
10.10+ | Employment and Confidential Information Agreement dated as of April 6, 2015, between the Company and Robert N. Pinkerton | 10.1 | Form 10-Q (No. 001-35108) | May 8, 2015 | ||||||
10.11+ | Employment Agreement dated as of June 8, 2015 between the Company and Brian Delaney | 10.1 | Form 10-Q (No. 001-35108) | November 6, 2015 | ||||||
10.12+ | Employment Agreement dated as of April 20, 2015 between the Company and Gregory Hopkins | 10.2 | Form 10-Q (No. 001-35108) | November 6, 2015 | ||||||
21.1 | List of subsidiaries | X | ||||||||
23.1 | Consent of Ernst & Young LLP | X | ||||||||
23.2 | Consent of PricewaterhouseCoopers LLP | X | ||||||||
31.1 | Certification of Principal Executive Officer required by Rule 13a-14(a) or Rule 15d-14(a) of the Securities Exchange Act of 1934, as adopted pursuant to Section 302 of the Sarbanes-Oxley Act of 2002. | X | ||||||||
31.2 | Certification of Principal Financial Officer required by Rule 13a-14(a) or Rule 15d-14(a) of the Securities Exchange Act of 1934, as adopted pursuant to Section 302 of the Sarbanes-Oxley Act of 2002. | X | ||||||||
32.1* | Certification of Chief Executive Officer pursuant to 18 U.S.C. Section 1350, as adopted pursuant to Section 906 of the Sarbanes-Oxley Act of 2002. | X | ||||||||
32.2* | Certification of Chief Financial Officer pursuant to 18 U.S.C. Section 1350, as adopted pursuant to Section 906 of the Sarbanes-Oxley Act of 2002. | X | ||||||||
90
Incorporated by Reference Herein | ||||||||||
Exhibit Number | Exhibit Description | Filed Herewith | Exhibit | Form/File No. | Filing Date | |||||
101.INS | XBRL Instance Document | |||||||||
101.SCH | XBRL Taxonomy Extension Schema | |||||||||
101.CAL | XBRL Taxonomy Extension Calculation Linkbase | |||||||||
101.DEF | XBRL Taxonomy Extension Definition Linkbase | |||||||||
101.LAB | XBRL Taxonomy Extension Label Linkbase | |||||||||
101.PRE | XBRL Taxonomy Extension Presentation Linkbase | |||||||||
+ | Management contract or compensatory plan or arrangement. |
* | In accordance with Item 601(b)(32)(ii) of Regulation S-K and SEC Release No. 33-8238 and 34-47986, Final Rule: Management’s Reports on Internal Control Over Financial Reporting and Certification of Disclosure in Exchange Act Periodic Reports, the certifications furnished in Exhibits 32.1 and 32.2 hereto are deemed to accompany this Annual Report on Form 10-K and will not be deemed “filed” for purposes of Section 18 of the Exchange Act. Such certifications will not be deemed to be incorporated by reference into any filings under the Securities Act or the Exchange Act, except to the extent that the registrant specifically incorporates it by reference. |
91