Attached files
| file | filename |
|---|---|
| 8-K - 8-K - LTC PROPERTIES INC | a12-5879_18k.htm |
| EX-99.1 - EX-99.1 - LTC PROPERTIES INC | a12-5879_1ex99d1.htm |
Exhibit 99.2
|
|
Supplemental Operating and Financial Data December 31, 2011 (Unaudited) South Hills, PA 67 units Gulf Breeze, FL 61 units |
|
|
Table of Contents 2 CORPORATE Company Information 3 Additional Information 4 Forward-Looking Statements 5 Non-GAAP Information 5 Acquisitions 6 Real Estate Portfolio Summary 7-8 Real Estate Portfolio Diversification 9-11 Top Ten Operators - Owned Portfolio 12 Market Capitalization 13 Lease & Mortgage Loan Receivable Maturity 14 Debt Maturity 15 Financial Data Summary 16-17 Consolidated Statements of Income 18 Consolidated Balance Sheets 19 Funds from Operations 20 Glossary 21-23 |
|
|
3 Company Information CORPORATE Andre Dimitriadis Wendy Simpson Edmund King Executive Chairman Timothy Triche, MD Boyd Hendrickson Devra Shapiro Lead Director Andre Dimitriadis Wendy Simpson Pam Kessler Executive Chairman Chief Executive Officer and President Executive Vice President and Chief Financial Officer Clint Malin Andy Stokes Senior Vice President and Chief Investment Officer Senior Vice President, Marketing & Strategic Planning Corporate Office Investor Relations www.LTCProperties.com 2829 Townsgate Road, Suite 350 Investor.Relations@LTCProperties.com (805) 981-8655 phone Westlake Village, CA 91361 (805) 981-8655 (805) 981-8663 fax Board of Directors Management Contact Information Company Founded in 1992, LTC Properties, Inc. is a self-administered real estate investment trust that primarily invests in senior housing and long-term care properties through facility lease transactions, mortgage loans, and other investments. Our primary objectives are to sustain and enhance stockholder equity value and provide current income for distribution to stockholders through real estate investments in long-term care properties and other health care related properties managed by experienced operators. To meet these objectives, we attempt to invest in properties that provide opportunity for additional value and current returns to our stockholders and diversify our investment portfolio by geographic location, operator, and form of investment. For more information on LTC Properties, Inc., visit the Company’s website at www.LTCProperties.com . |
|
|
4 CORPORATE Additional Information BMO Capital Markets Corp. J.J. B. Hilliard, W.L. Lyons, Inc. JMP Securities, LLC Richard Anderson John Roberts Peter Martin KeyBanc Capital Markets, Inc. RBC Capital Markets Corporation Sandler O'Neill + Partners, L.P. Karin Ford Frank Morgan James Milam Stifel, Nicolaus & Company, Inc. Wells Fargo Securities, LLC Dan Bernstein Todd Stender Analyst Coverage Any opinions, estimates, or forecasts regarding LTC's performance made by the analysts listed above do not represent the opinions, estimates, or forecasts of LTC or its management. |
|
|
5 Forward-Looking Statements This supplemental information contains forward-looking statements within the meaning of Section 27A of the Securities Act of 1933, as amended, and Section 21E of the Securities Exchange Act of 1934, as amended, adopted pursuant to the Private Securities Litigation Reform Act of 1995. Statements that are not purely historical may be forward-looking. You can identify some of the forward-looking statements by their use of forward-looking words, such as ‘‘believes,’’ ‘‘expects,’’ ‘‘may,’’ ‘‘will,’’ ‘‘should,’’ ‘‘seeks,’’ ‘‘approximately,’’ ‘‘intends,’’ ‘‘plans,’’ ‘‘estimates’’ or ‘‘anticipates,’’ or the negative of those words or similar words. Forward- looking statements involve inherent risks and uncertainties regarding events, conditions and financial trends that may affect our future plans of operation, business strategy, results of operations and financial position. A number of important factors could cause actual results to differ materially from those included within or contemplated by such forward-looking statements, including, but not limited to, the status of the economy, the status of capital markets (including prevailing interest rates), and our access to capital; the income and returns available from investments in health care related real estate, the ability of our borrowers and lessees to meet their obligations to us, our reliance on a few major operators; competition faced by our borrowers and lessees within the health care industry, regulation of the health care industry by federal, state and local governments, (including as a result of the Patient Protection and Affordable Care Act of 2010 and the Health Care and Education Reconciliation Act of 2010), changes in Medicare and Medicaid reimbursement amounts (including due to federal and state budget constraints), compliance with and changes to regulations and payment policies within the health care industry, debt that we may incur and changes in financing terms, our ability to continue to qualify as a real estate investment trust, the relative illiquidity of our real estate investments, potential limitations on our remedies when mortgage loans default, and risks and liabilities in connection with properties owned through limited liability companies and partnerships. For a discussion of these and other factors that could cause actual results to differ from those contemplated in the forward-looking statements, please see the discussion under ‘‘Risk Factors’’ and other information contained in our Annual Report on Form 10-K for the fiscal year ended December 31, 2011 and in our publicly available filings with the Securities and Exchange Commission. We do not undertake any responsibility to update or revise any of these factors or to announce publicly any revisions to forward-looking statements, whether as a result of new information, future events or otherwise. Non-GAAP Information This supplemental information contains certain non-GAAP information including EBITDA, normalized EBITDA, FFO, normalized FFO, normalized interest coverage ratio, and normalized fixed charges coverage ratio. A reconciliation of this non-GAAP information is provided on pages 17 and 20 of this supplemental information, and additional information is available under the “Non-GAAP Financial Measures” subsection under the “Selected Financial Data” section of our website at www.LTCProperties.com. CORPORATE |
|
|
6 Acquisitions: Year 2010 and Year 2011 REAL ESTATE PORTFOLIO Hewitt, TX 140 licensed beds (dollar amounts in thousands) DATE # OF PROPERTIES ASSET CLASS # BEDS/UNITS LOCATION OPERATOR DATE OF CONSTRUCTION PURCHASE PRICE ANNUAL GAAP REVENUE GAAP Lease Yield 01/29/10 1 SNF 166 TX Creative Solutions 1987-1988 (2) 7,850 $ 892 $ 11.4% 02/22/10 1 SNF 120 FL Traditions Management 1988 9,000 997 11.1% 06/01/10 2 SNF/OTHER (1) 227 beds/93 units VA Traditions Management 1970-2005 22,000 2,420 11.0% 10/29/10 4 ALF 241 units MS & FL Selah Senior Care 1999-2004 26,900 2,952 11.0% 11/30/10 2 SNF 292 TX Senior Care Centers 1988-2009 28,500 2,919 10.2% Total 2010 10 805 beds/334 units $ 94,250 02/28/11 2 OTHER 118 beds/93 units SC Prestige Healthcare 1965-2001 11,450 $ 1,158 $ 10.1% 03/09/11 4 SNF 524 TX Meridian Senior Properties 2007-2008 45,000 (3) 4,722 10.5% (3) 08/01/11 1 SNF 140 TX Senior Care Centers 2008 10,000 1,058 10.5% 10/11/11 1 SNF 196 TX Fundamental 2005 15,500 1,881 11.0% (4) 10/11/11 1 (5) N/A (5) N/A (5) TX Fundamental 2012 (5) 844 - 11.0% (4) 11/01/11 1 SNF 156 CA Traditions Management 1990 17,500 1,814 10.3% Total 2011 10 1,134 beds/93 units $ 100,294 Total 20 1,939 beds/427 units $ 194,544 (1) One property is a SNF and the other provides a continuum of care comprised of independent living, assisted living, and skilled nursing (2) Renovation in 1991 (3) GAAP yield assumes a total purchase price of $45,000 which includes $41,000 of cash paid at closing and $4,000 paid on August 31, 2011 (4) GAAP yield assumes $8,250 construction funding as noted in (5) below (5) Acquired a vacant parcel of land in Texas and entered into a commitment to fund the construction of a 120-bed skilled nursing property which will replace an existing 90-bed skilled nursing property |
|
|
7 Real Estate Portfolio Summary REAL ESTATE PORTFOLIO “Same Property Portfolio” Quality Mix (dollar amounts in thousands) For the Nine Months Ended September 30, 2011 Private Pay 61.2% Medicare 14.3% Medicaid 24.5% (1) Quality mix for our skilled nursing portfolio, for the period presented, is 23.9% Private Pay, 25.9% Medicare, and 50.2% Medicaid. Owned Properties Payor Source (1) Real Estate Portfolio Snapshot Twelve Months Ended December 31, 2011 Type of Property Gross Investments % of Investments Rental Income Interest Income % of Revenues No. of Props No. of SNF Beds No. of ALF Units No. of ILF Units Investment per Bed/Unit Skilled Nursing $389,458 50.0% $35,579 $3,447 46.4% 89 10,347 - - $37.64 Assisted Living 308,757 39.6% 33,172 2,596 42.6% 102 - 4,365 - $70.73 Other Senior Housing 67,732 8.7% 7,543 368 9.4% 14 913 330 423 $40.66 Schools 12,192 1.6% 1,349 - 1.6% 2 - - - Under Development (1) 894 0.1% - - - - - - - Total $779,033 100.0% $77,643 $6,411 100.0% 207 11,260 4,695 423 (1) Real Estate Portfolio Snapshot During 2011, we acquired a vacant parcel of land in Texas and entered into a commitment to fund the construction of a 120-bed skilled nursing property which will replace an existing 90-bed skilled nursing property. |
|
|
8 “Same Property Portfolio” Statistics (1) Real Estate Portfolio Summary Historical “Same Property Portfolio” SNF Coverage (1) REAL ESTATE PORTFOLIO EBITDAR Coverage EBITDARM Coverage 3Q11 2.2 3.0 2Q11 2.2 3.0 1Q11 2.1 2.9 4Q10 2.0 2.8 (1) Data from property level operator financial statements which are unaduited and have not been independently verified by us. Occupancy EBITDAR Coverage EBITDARM Coverage Owned Properties 3Q11 2Q11 3Q11 2Q11 3Q11 2Q11 Assisted Living (2) 77.1% 77.1% 1.40 1.39 1.62 1.62 Assisted Living (3) 88.2% 88.1% 1.47 1.46 1.72 1.72 Skilled Nursing 78.1% 78.2% 2.15 2.13 2.92 2.90 Other Senior Housing 83.4% 83.7% 1.70 1.63 2.21 2.14 (1) Data from June 30, 2011 and September 30, 2011 property level operator financial statements which are unaudited and have not been independently verified by us. (2) (3) Includes properties leased to Assisted Living Concepts, Inc. (ALC) Excludes properties leased to Assisted Living Concepts, Inc. (ALC) |
|
|
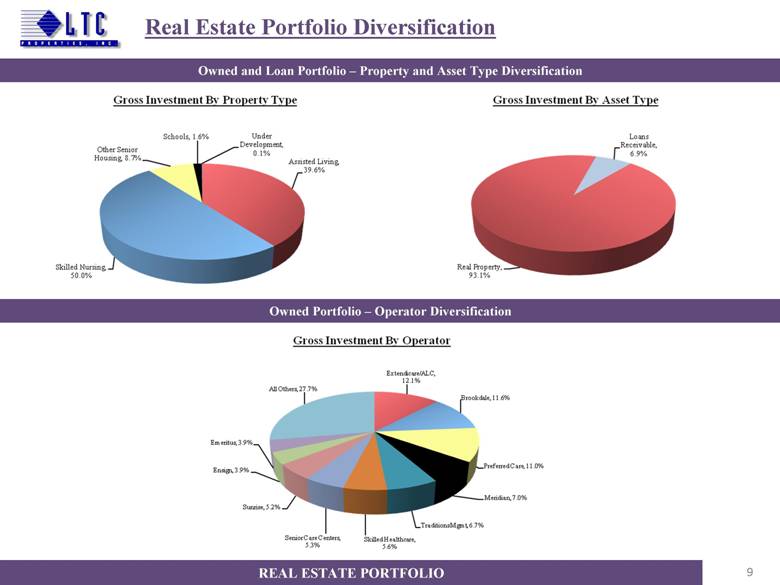
9 Real Estate Portfolio Diversification REAL ESTATE PORTFOLIO Owned and Loan Portfolio – Property and Asset Type Diversification Owned Portfolio – Operator Diversification |
|
|
10 Real Estate Portfolio Diversification REAL ESTATE PORTFOLIO Owned and Loan Portfolio – Property and Asset Type Diversification Owned Portfolio – Operator Diversification (dollar amounts in thousands) Operator % % Extendicare REIT and Assisted Living Concepts, Inc 37 88,034 $ 12.1% 10,963 $ 13.1% Brookdale Senior Living Communities, Inc. 35 84,210 11.6% 10,523 12.6% Preferred Care 26 80,088 11.0% 10,588 12.7% Meridian Senior Properties Fund II, LP 4 50,841 7.0% 4,742 5.7% Traditions Management 4 48,500 6.7% 5,231 6.3% Skilled Healthcare Group, Inc. 5 40,270 5.6% 4,501 5.4% Senior Care Centers, LLC 3 38,500 5.3% 4,004 4.8% Sunrise Senior Living 6 37,659 5.2% 4,614 5.5% Ensign Group, Inc. 3 28,496 3.9% 1,596 1.9% Emeritus Corporation 2 28,071 3.9% 2,726 3.3% All Others 46 200,362 27.7% 23,969 28.7% Total 171 725,031 $ 100.0% 83,457 $ 100.0% Annualized GAAP Rent Gross Investment # of Props Gross Gross Property Type Investment % % Asset Type Investment % Skilled Nursing 89 389,458 $ 50.0% 39,026 $ 46.4% Real Property 725,031 $ 93.1% Assisted Living 102 308,757 39.6% 35,768 42.6% Loans Receivable 54,002 6.9% Other Senior Housing 14 67,732 8.7% 7,911 9.4% Total 779,033 $ 100.0% Schools 2 12,192 1.6% 1,349 1.6% Under Development (1) - 894 0.1% - - Total 207 779,033 $ 100.0% 84,054 $ 100.0% (1) During 2011, we acquired a vacant parcel of land in Texas and entered into a commitment to fund the construction of a 120-bed skilled nursing property which will replace an existing 90-bed skilled nursing property. Properties Revenue Twelve Months Ended December 31, 2011 # of |
|
|
11 Real Estate Portfolio Diversification REAL ESTATE PORTFOLIO Owned and Loan Portfolio - State Diversification By Property Type (1) Due to master leases with properties in multiple states, revenue by state is not available. (2) Under Development Properties. See definition in the Glossary. (dollar amounts in thousands) State (1) Gross Investment % Texas 207,760 $ 26.7% Florida 70,217 9.0% Ohio 56,804 7.3% California 52,036 6.7% New Mexico 48,876 6.3% Arizona 41,212 5.3% Virginia 29,052 3.7% Washington 27,951 3.6% Colorado 27,816 3.6% Kansas 20,844 2.7% All Others 196,465 25.1% Total 779,033 $ 100.0% State (1) # of Props ALF % SNF % Other % School % UDP (2) % Gross Investment % Texas 55 32,266 $ 10.5% 165,968 $ 42.6% 8,632 $ 12.7% - $ - 894 $ 100.0% 207,760 $ 26.7% Florida 18 36,618 11.9% 20,179 5.2% 13,420 19.8% - - - - 70,217 9.0% Ohio 17 44,647 14.5% 12,157 3.1% - - - - - - 56,804 7.3% California 6 28,070 9.1% 20,872 5.4% 3,094 4.6% - - - - 52,036 6.7% New Mexico 7 - - 48,876 12.5% - - - - - - 48,876 6.3% Arizona 7 5,120 1.7% 36,092 9.3% - - - - - - 41,212 5.3% Virginia 4 - - 15,713 4.0% 13,339 19.7% - - - - 29,052 3.7% Washington 10 19,080 6.2% 8,871 2.3% - - - - - - 27,951 3.6% Colorado 10 18,402 6.0% 7,407 1.9% 2,007 3.0% - - - - 27,816 3.6% Kansas 7 6,733 2.2% 14,111 3.6% - - - - - - 20,844 2.7% All Others 66 117,821 37.9% 39,212 10.1% 27,240 40.2% 12,192 100.0% - - 196,465 25.1% Total 207 308,757 $ 100.0% 389,458 $ 100.0% 67,732 $ 100.0% 12,192 $ 100.0% 894 $ 100.0% 779,033 $ 100.0% |
|
|
12 Top Ten Operators — Owned Portfolio REAL ESTATE PORTFOLIO Extendicare REIT and Assisted Living Concepts, Inc (TSX: EXE.UN) operates 262 senior care facilities in Canada and in the United States with the ability to serve approximately 28,213 residents. EHSI offers a continuum of health care services, including nursing care, assisted living and related medical specialty services, such as sub-acute care and rehabilitative therapy on an inpatient and outpatient basis. ALC (NYSE: ALC) and its subsidiaries operate 211 residences which include licensed assisted living and independent living residences with capacity for 9,325 residents in 20 states. As of December 31, 2011, the LTC portfolio consisted of 37 assisted living properties in 10 states with a gross investment balance of $88.0 million. Brookdale Senior Living, Inc. (NYSE: BKD) operates 647 independent living, assisted living, and dementia-care communities and continuing care retirement centers, with the ability to serve approximately 67,000 residents. As of December 31, 2011, the LTC portfolio consisted of 35 assisted living properties in 8 states with a gross investment balance of $84.2 million. Preferred Care, Inc. (Privately held) operates 67 facilities comprised of skilled nursing, assisted living, and independent living facilities, as well as 5 specialty care facilities, in 10 states. As of December 31, 2011, the LTC portfolio consisted of 24 skilled nursing and 2 other senior housing properties in 6 states with a gross investment balance of $80.1 million. They also operate 1 skilled nursing facility under a sub-lease with another lessee we have which is not included in the Preferred Care rental revenue. Skilled Healthcare Group (NYSE: SKH) is a holding company with subsidiaries that operate skilled nursing facilities, assisted living facilities, a rehabilitation therapy business, and a hospice business. Skilled Healthcare operates in 8 states, including 74 skilled nursing facilities and 23 assisted living facilities. As of December 31, 2011, the LTC portfolio consisted of 5 skilled nursing properties in 1 state with a gross investment balance of $40.3 million. Meridian Senior Properties Fund II, LP (Privately held) acquires and develops independent living, assisted living and skilled nursing facilities and (owns or leases) 10 skilled nursing facilities and one assisted living facility, all located in Texas. They are currently developing two new skilled nursing facilities. As of December 31, 2011, the LTC portfolio consisted of 4 skilled nursing properties in 1 state with a gross investment balance of $50.8 million which includes $6.3 million of earn-out liabilities. Sunrise Senior Living (NYSE: SRZ) operates 311 communities in the United States, Canada and the United Kingdom, with a total capacity of approximately 31,000 units. Sunrise offers a full range of personalized senior living services , including independent living , assisted living , care for individuals with Alzheimer’s disease and other forms of memory loss , as well as Nursing and Rehabilitative services. As of December 31, 2011, the LTC portfolio consisted of 6 assisted living properties in 2 states with a gross investment balance of $37.7 million. Traditions Management (Privately held) operates 10 independent living, assisted living, and skilled nursing facilities in 4 states. As of December 31, 2011, the LTC portfolio consisted of 3 skilled nursing and 1 other senior housing properties in 3 states with a gross investment balance of $48.5 million. They also operate 2 skilled nursing properties under a sub-lease with Preferred Care, Inc. which is not included in the Traditions Management rental revenue. Senior Care Centers, LLC (Privately held) provides skilled nursing care, Alzheimer's care, assisted living, and independent living services in 37 facilities exclusively in Texas. As of December 31, 2011, the LTC portfolio consisted of 3 skilled nursing properties in 1 state with a gross investment balance of $38.5 million. They also operate 4 skilled nursing properties under a sub-lease with Meridian Senior Properties Fund II, LP which is not included in the Senior Care Centers, LLC rental revenue. The Ensign Group (NASDAQ: ENSG) provides skilled nursing and assisted living services, physical, occupational and speech therapies, home health and hospice services, and other rehabilitative and healthcare services for both long-term residents and short-stay rehabilitation patients at 106 facilities in 10 states. As of December 31, 2011, the LTC portfolio consisted of 3 skilled nursing properties in 1 state with a gross investment balance of $28.5 million. Emeritus Senior Living (NYSE:ESC) is a national public provider of independent living, assisted living, and Alzheimer's services. The company operates 485 communities representing capacity for approximately 35,703 residents in 38 states. As of December 31, 2011, the LTC portfolio consisted of 2 assisted living properties in 1 state with a gross investment balance of $28.1 million. |
|
|
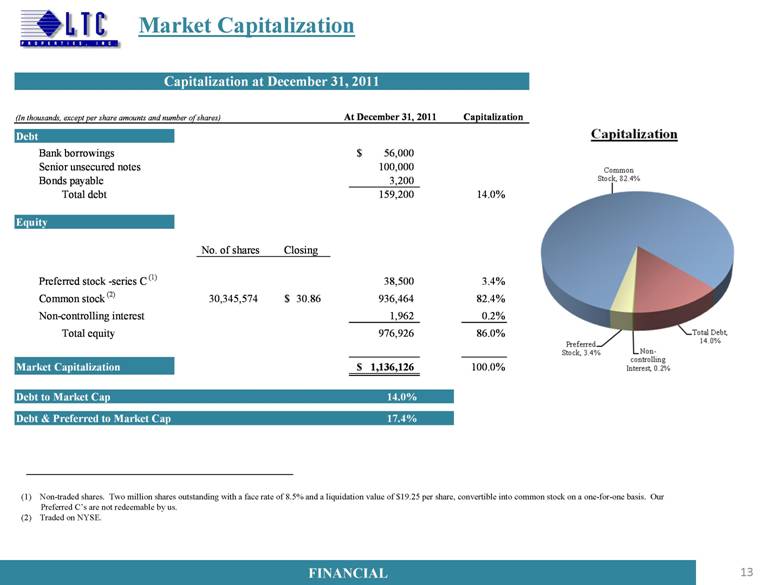
13 Market Capitalization (1) Non-traded shares. Two million shares outstanding with a face rate of 8.5% and a liquidation value of $19.25 per share, convertible into common stock on a one-for-one basis. Our Preferred C’s are not redeemable by us. (2) Traded on NYSE. FINANCIAL (In thousands, except per share amounts and number of shares) Capitalization Bank borrowings 56,000 $ Senior unsecured notes 100,000 Bonds payable 3,200 Total debt 159,200 14.0% No. of shares Preferred stock -series C (1) 38,500 3.4% Common stock (2) 30,345,574 30.86 $ 936,464 82.4% Non-controlling interest 1,962 0.2% Total equity 976,926 86.0% 1,136,126 $ 100.0% Debt to Market Cap Debt & Preferred to Market Cap 14.0% 17.4% Equity Closing Market Capitalization Capitalization at December 31, 2011 At December 31, 2011 Debt |
|
|
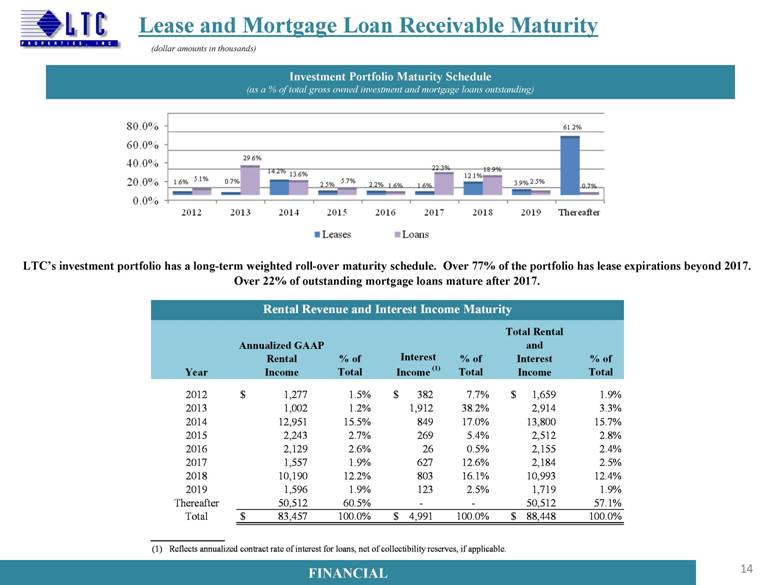
14 Lease and Mortgage Loan Receivable Maturity LTC’s investment portfolio has a long-term weighted roll-over maturity schedule. Over 77% of the portfolio has lease expirations beyond 2017. Over 22% of outstanding mortgage loans mature after 2017. FINANCIAL Investment Portfolio Maturity Schedule (as a % of total gross owned investment and mortgage loans outstanding) (dollar amounts in thousands) Year % of Total % of Total % of Total 2012 $ 1,277 1.5% $ 382 7.7% $ 1,659 1.9% 2013 1,002 1.2% 1,912 38.2% 2,914 3.3% 2014 12,951 15.5% 849 17.0% 13,800 15.7% 2015 2,243 2.7% 269 5.4% 2,512 2.8% 2016 2,129 2.6% 26 0.5% 2,155 2.4% 2017 1,557 1.9% 627 12.6% 2,184 2.5% 2018 10,190 12.2% 803 16.1% 10,993 12.4% 2019 1,596 1.9% 123 2.5% 1,719 1.9% Thereafter 50,512 60.5% - - 50,512 57.1% Total $ 83,457 100.0% $ 4,991 100.0% $ 88,448 100.0% (1) Reflects annualized contract rate of interest for loans, net of collectibility reserves, if applicable. Rental Revenue and Interest Income Maturity Annualized GAAP Rental Income Interest Income (1) Total Rental and Interest Income |
|
|
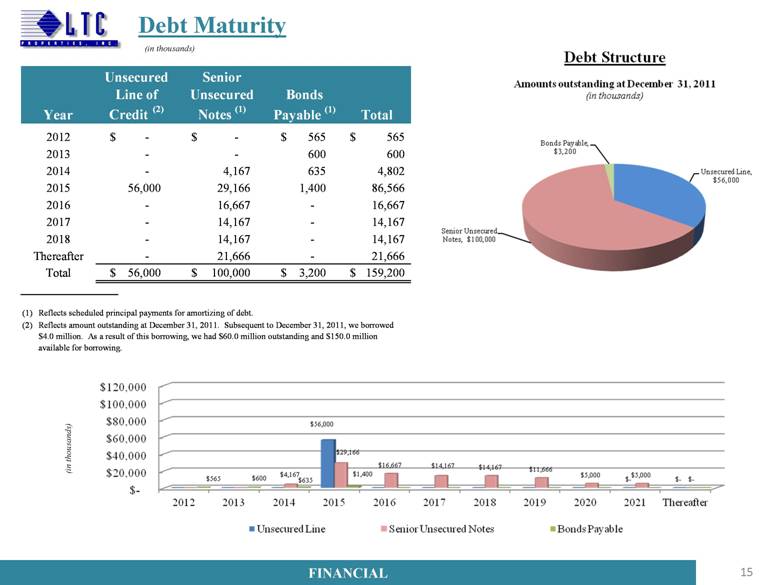
15 Debt Maturity (in thousands) FINANCIAL $ - $ - $ 565 $ 565 - - 600 600 - 4,167 635 4,802 56,000 29,166 1,400 86,566 - 16,667 - 16,667 - 14,167 - 14,167 - 14,167 - 14,167 - 21,666 - 21,666 $ 56,000 $ 100,000 $ 3,200 $ 159,200 (1) (2) Year 2018 2012 2013 2014 Unsecured Line of Credit (2) Senior Unsecured Notes (1) Bonds Payable (1) Total 2015 Total 2016 2017 Reflects amount outstanding at December 31, 2011. Subsequent to December 31, 2011, we borrowed $4.0 million. As a result of this borrowing, we had $60.0 million outstanding and $150.0 million available for borrowing. Reflects scheduled principal payments for amortizing of debt. Thereafter |
|
|
16 Financial Data Summary FINANCIAL (dollar amounts in thousands) 12/31/09 12/31/10 12/31/11 Net Real Estate Assets $444,163 $515,983 $599,916 Total Assets 490,593 561,264 647,097 Total Debt 25,410 91,430 159,200 Total Liabilities 36,280 103,742 178,387 Preferred Stock 186,801 126,913 38,500 Total Equity 454,313 457,522 468,710 Debt to book capitalization ratio 5.3% 16.7% 25.4% Debt & Preferred Stock to book capitalization ratio 44.2% 39.8% 31.5% Debt to market capitalization ratio 3.0% 9.5% 14.0% Debt & Preferred Stock to market capitalization ratio 25.1% 23.0% 17.4% Debt to Normalized EBITDA 0.4x 1.4x 2.1x Normalized interest coverage ratio 25.4x 24.5x 11.8x Normalized fixed charges coverage ratio 3.5x 4.0x 6.4x For the Year Ended Balance Sheet and Coverage Ratios |
|
|
17 Financial Data Summary FINANCIAL (dollar amounts in thousands) Non-Cash Rental Revenue Components $ 962 $ 639 $ 572 $ 573 $ 568 (165) (165) (165) (165) (165) $ 797 $ 474 $ 407 $ 408 $ 403 (1) 4Q12 (1) 4Q11 1Q12 (1) 2Q12 (1) 3Q12 (1) Straight-line rent Amort of lease inducement Net Projections based on current in-place leases, assuming no modification or replacement of existing leases and no new leased investments are added to our portfolio. Reconcilation of Normalized EBITDA and Fixed Charges For the Year Ended 12/31/09 12/31/10 12/31/11 Net income $ 44,360 $ 46,053 $ 49,443 Less: Gain on sale - (310) - Add: Interest expense 2,418 2,653 6,434 Add: Depreciation and amortization (including discontinued operations) 14,822 16,109 19,623 EBITDA 61,600 64,505 75,500 (Deduct)/Add back: Non-cash interest related to earn-out liability - - 464 Non-recurring one-time charge (198) 467 - Normalized EBITDA $ 61,402 $ 64,972 $ 75,964 Interest expense $ 2,418 $ 2,653 $ 6,434 Preferred stock dividend 15,141 13,662 5,512 Fixed Charges $ 17,559 $ 16,315 $ 11,946 |
|
|
Consolidated Statements of Income 18 FINANCIAL (dollar amounts in thousands, except per share amounts) (unaudited) 2011 2010 2011 2010 Revenues Rental income 20,504 $ 16,996 $ 77,643 $ 64,351 $ Interest from mortgage loans 1,560 1,799 6,411 7,482 Interest and other income 234 1,025 1,106 1,863 Total revenues 22,298 19,820 85,160 73,696 Expenses Interest expense 1,993 981 6,434 2,653 Depreciation and amortization 5,141 4,098 19,515 15,717 Provisions (recovery) for doubtful accounts 2 380 (13) 1,409 Acquisition costs 168 253 393 370 Operating and other expenses 2,358 2,073 9,158 7,687 Total expenses 9,662 7,785 35,487 27,836 Income from continuing operations 12,636 12,035 49,673 45,860 Discontinued operations: Loss from discontinued operations (32) (54) (230) (117) Gain on sale of assets, net - 310 - 310 Net (loss) income from discontinued operations (32) 256 (230) 193 Net income 12,604 12,291 49,443 46,053 Income allocated to non-controlling interests (47) (47) (191) (191) Net income attributable to LTC Properties, Inc. 12,557 12,244 49,252 45,862 Income allocated to participating securities (83) (75) (342) (230) Income allocated to preferred stockholders (818) (2,586) (9,078) (16,045) Net income available to common stockholders 11,656 $ 9,583 $ 39,832 $ 29,587 $ Basic earnings per common share: $0.39 $0.37 $1.36 $1.21 Diluted earnings per common share: $0.39 $0.37 $1.36 $1.21 Weighted average shares used to calculate earnings per common share Basic 30,141 26,090 29,194 24,495 Diluted 30,172 26,118 29,222 24,568 December 31 December 31 Three Months Ended Twelve Months Ended |
|
|
Consolidated Balance Sheets 19 FINANCIAL (amounts in thousands) December 31, 2011 December 31, 2010 December 31, 2011 December 31, 2010 (unaudited) (unaudited) ASSETS LIABILITIES Real estate investments: Bank borrowings 56,000 $ 37,700 $ Land 57,093 $ 43,031 $ Senior unsecured notes 100,000 50,000 Buildings and improvements 662,300 567,017 Bonds payable 3,200 3,730 Accumulated depreciation and amortization (177,583) (158,204) Accrued interest 1,356 675 Net operating real estate property 541,810 451,844 Earn-out liabilities 6,305 - Accrued expenses and other liabilities 11,400 9,737 Properties held-for-sale, net of accumulated depreciation Accrued expenses and other liabilities related to and amortization: 2011 - $613; 2010 - $505 5,025 5,113 properties held-for-sale 126 132 Net real estate property 546,835 456,957 Distributions payable - 1,768 Total liabilities 178,387 103,742 Mortgage loans receivable, net of allowance for doubtful accounts: 2011 - $921; 2010 - $981 53,081 59,026 Real estate investments, net 599,916 515,983 EQUITY Preferred stock (1) 38,500 126,913 Other assets: Common stock (2) 303 263 Cash and cash equivalents 4,408 6,903 Capital in excess of par value 507,343 398,599 Debt issue costs, net 2,301 743 Cumulative net income 672,743 623,491 Interest receivable 1,494 1,571 Other 199 264 Straight-line rent receivable, net of allowance Cumulative distributions (752,340) (693,970) for doubtful accounts: 2011 - $680; 2010 - $634 23,772 20,090 Total LTC Properties, Inc. stockholders' equity 466,748 455,560 Prepaid expenses and other assets 7,852 8,162 Other assets related to properties held-for-sale, net of Non-controlling interests 1,962 1,962 allowance for doubtful accounts: 2011 - $839; 2010 - $839 52 51 Notes receivable 817 1,283 Total equity 468,710 457,522 Marketable securities 6,485 6,478 Total assets 647,097 $ 561,264 $ Total liabilities and equity 647,097 $ 561,264 $ (1) $0.01 par value; 15,000 shares authorized; shares issued and outstanding: 2011 - 2,000; 2010 - 5,536 (2) $0.01 par value; 45,000 shares authorized; shares issued and outstanding: 2011 - 30,346; 2010 - 26,345 |
|
|
Funds from Operations 20 FINANCIAL (dollar amounts in thousands, except per share amounts)) 2011 2010 2011 2010 Net income available to common stockholders $ 11,656 $ 9,583 $ 39,832 $ 29,587 Add: Depreciation and amortization (continuing and discontinued operations) 5,141 4,162 19,623 16,109 Less: Gain on sale of assets, net - (310) - (310) FFO available to common stockholders 16,797 13,435 59,455 45,386 Add: Preferred stock redemption charge - - 3,566 (1) 2,383 (3) Add: Preferred stock redemption dividend - - 472 (2) - Add: Non-cash interest related to earn-out liabilities 110 - 464 - Add: Non-recurring one time items - (385) - 467 (4) Normalized FFO available to common stockholders 16,907 13,050 63,957 48,236 Less: Non-cash rental income (797) (840) (3,065) (3,155) Normalized adjusted FFO (AFFO) 16,110 12,210 60,892 45,081 Add: Non-cash compensation charges 372 303 1,467 1,285 Normalized funds available for distribution (FAD) $ 16,482 $ 12,513 $ 62,359 $ 46,366 $0.55 $0.51 $2.01 $1.83 $0.55 $0.49 $2.15 $1.94 $0.53 $0.46 $2.05 $1.82 $0.54 $0.47 $2.10 $1.87 (1) (2) (3) (4) Diluted normalized FAD per share FFO Reconciliation Twelve Months Ended December 31, December 31, Three Months Ended Represents the original issue costs related to the redemption of the remaining Series F preferred stock. Represents the dividends on the Series F preferred stock up to the redemption date. Diluted FFO available to common stockholders per share Includes a $1.2 million provision for doubtful accounts charge related to two mortgage loans (one secured by a private school property and one secured by land) partially offset by a $0.8 million bankruptcy settlement distribution. Diluted normalized FFO available to common stockholders per share Diluted normalized AFFO per share Represents the original issue costs related to the redemption of all of the Series E and 40% of the Series F preferred stock. |
|
|
21 GLOSSARY Glossary Adjusted Funds From Operations (“AFFO”): FFO excluding the effects of non - cash rental income. Assisted Living Properties (“ALF”) : Senior housing properties serving elderly persons who require assistance with activities of daily living, but do not require the constant supervision skilled nursing properties provide. Services are usually available 24 hours a day and include personal supervision and assistance with eating , bathing, gr ooming and administering medication. The facilities provide a combination of housing, supportive services, personalized assistance and health care designed to respond to individual needs . Contractual Lease Rent: Rental revenue as defined by the lease agreement between us and the operator for the lease year . EBITDA: Earnings before interest, taxes, depreciation and amortization . EBITDAR Coverage: From t he operator financial statement s, the trailing twelve month’s earnings before interest, taxes, depreciation, amortization, and rent divided by the operator’s contractual lease rent . Management fees are imputed at 5% of revenues. EBITDARM Coverage : From the operator financial statements, t he trailing twelve month’s earnings before interest, taxes, depreciation, amortization, rent and management fees divided by the operator’s contractual lease rent . Funds Available for Distribution (“FAD”): FFO excluding the effects of non - cas h rental income and non - cash compensation charges . Funds From Operations (“FFO”): A s defined by the National Association of Real Estate Investment Trusts (“NAREIT”), net income available to common stockholders (computed in accordance with U.S. GAAP) excl uding gains or losses on the sale of real estate and impairment write - downs of depreciable real estate plus real estate depreciation and amortization, and after adjustments for unconsolidated partnerships and joint ventures. GAAP Lease Yield: GAAP rent divided by the p urchase p rice. GAAP Rent: Total rent we will receive as a fixed amount over the life of the lease and recognize d evenly over that life. GAAP rent recorded in the early years of a lease is higher than the cash rent received and during the later years of the lease , the cash rent received is higher than GAAP rent recognized . GAAP rent is commonly referred to as straight - line rental income. Gross Investment: Original price paid for an asset plus capital improvements funded by LTC Properties, Inc. (“LTC”) , without any deprec i ation deductions. Gross Investment is commonly referred to as undepreciated book value. Independent Living Properties (“ILF”) : Senior housing properties offer ing nume rous levels of service, such as laundry, housekeeping, dining options/meal plans, exercise and wellness programs, transportation , social , cultural and recreational activities , on - site security and emergency response programs. Many offer on - site conveniences like beauty/barber shops, fitness facilities, game rooms, libraries and activity centers. ILFs are also known as retirement communities or senior apartments . Interest Income: Represents interest income from mortgage loans. |
|
|
22 GLOSSARY Glossary Licensed Beds/Un its: The number of beds and/or units tha t an operator is authorized to operate at a senior housing property . Licensed b eds and/or u nits may differ from the number of beds and/or units in service at any given time. Net Real Estate Assets: G ross investment less accumulated depreciation. Net Real Estate Asset is commonly referred to as Net Book Value (“NBV”) . Non - cash rental income: Straight - line rental income and amortization of lease inducement. Non - cash compensation charges: Vesting ex pense relating to stock option s and restricted stock. Normalized AFFO: FFO adjusted for non - recurring, infrequent or unusual items and excludes the non - cash rental income. Normalized FAD: FFO adjusted for non - recurring, infrequent or unusual items and excludes the non - cash rental income and non - cash compensation charges. Normalized FFO: FFO adjusted for non - recurring, infrequent or unusual items. Occupancy: The weighted average percentage of all beds and/or units that are occupied at a given time. The calculation uses the trailing twelve months and is based on licensed beds and/or units which may differ from the number of beds and/or units in service at any given time. Operator Financial Statements: Property level operator financial stateme nts are unaudited and have not been independently verified by us. Other Senior Housing: Senior housing p roperties consisting of independent living properties and properties providing any combination of skilled nursing, assisted living and/or independen t living services. Private Pay: Private pay includes private insurance, HMO, VA, and other payors . Purchase Price: Represents the fair value price of an asset that is exchanged in an orderly transaction between market participants at the me asurement da te. An orderly transaction is a transaction that assumes exposure to the market for a period prior to the measurement date t o allow for marketing activities that are usual and customary for transactions involving such assets; it is not a forced transactio n (for example, a forced liquidation or distress sale). Quality Mix: LTC revenue by operator underlying payor source for the quarter presented. LTC is not a Medicaid or a Medicare recipient. Statistics represent LTC's rental revenues times operators' underlying payor source revenue percentage. Underlying payor source revenue percentage is calculated from property level operator financial statements which are unaudited and have not been independently verified by us. Rental Income: Represents GAAP re nt net of amortized lease inducement cost from continuing and discontinued operations. |
|
|
23 GLOSSARY Glossary Same Property Portfolio (“SPP”) : S ame property statistics allow management to evaluate the performance of LTC’s leased property portfolio under a consistent population , which eliminates the changes in the composition of our portfolio of properties. We identif y our same property portfolio as s tabilized properties that are , and remained , in operations for the duration of the quarter - over quarter comparison periods presented . Accordingly, it takes a stabilized property a mi nimum of 12 months in operations to be included in our same property portfolio. Schools: An institution for educatin g students which include private and charter schools. Private schools are not administered by local, state or national governments; therefore, funded in whole or part by student tuition rather than government funded. Charter schools provide an alternative to the traditional public school. Charter schools are generally autonomous entities authorized by the state or locality to conduct operations independent from the surrounding public school district. Laws vary by state, but generally charters are granted by state boards of education eith er directly or in conjunction with local sc hool districts or public universities. Operators are granted charters to establish and operate schools based on the goals an d objectives set forth in the charter. Upon receipt of a charter, schools receive an annuity from the state for each student enrol led. Skilled Nursing Properties (“SNF”) : Senior housing properties providing restorative, rehabilitative and nursing care for people not requiring the more extensive and sophisticated treatment available at acute care hospitals. Many SNF s provide ancillary services that include occupational, speech, physical, respiratory and IV therapies, as well as sub - acute care services which are paid either by the patient, the patient’s family, private health insurance, or through the federal Medicare or state Medicaid programs. Stabilized: Newly acquired operating assets are generally considered sta bilized at the earlier of lease - up (typically when occupancy reaches 80% at a SNF or 90% at an ALF) or 12 months from the acquisition date. Newly completed devel opments, including redevelopments, are considered stabilized at the earlier of lease - up or 24 months from the date the property is placed in service. Under Development Properties (“UDP”): Development project s to construct senior living propert ies . |