Attached files
| file | filename |
|---|---|
| EX-12 - EXHIBIT 12 - LTC PROPERTIES INC | a2202129zex-12.htm |
| EX-32 - EXHIBIT 32 - LTC PROPERTIES INC | a2202129zex-32.htm |
| EX-21 - EXHIBIT 21 - LTC PROPERTIES INC | a2202129zex-21.htm |
| EX-31.1 - EXHIBIT 31.1 - LTC PROPERTIES INC | a2202129zex-31_1.htm |
| EX-31.2 - EXHIBIT 31.2 - LTC PROPERTIES INC | a2202129zex-31_2.htm |
| EX-23.1 - EXHIBIT 23.1 - LTC PROPERTIES INC | a2202129zex-23_1.htm |
UNITED STATES
SECURITIES AND EXCHANGE COMMISSION
Washington, D.C. 20549
FORM 10-K
| (Mark One) | ||
ý |
ANNUAL REPORT PURSUANT TO SECTION 13 OR 15(d) OF THE SECURITIES AND EXCHANGE ACT OF 1934 |
|
For the fiscal year ended December 31, 2010 |
||
OR |
||
o |
TRANSITION REPORT PURSUANT TO SECTION 13 OR 15(d) OF THE SECURITIES EXCHANGE ACT OF 1934 |
|
Commission file number: 1-11314
LTC PROPERTIES, INC.
(Exact name of Registrant as specified in its charter)
| MARYLAND (State or other jurisdiction of incorporation or organization) |
71-0720518 (I.R.S. Employer Identification No.) |
2829 Townsgate Road, Suite 350
Westlake Village, California 91361
(Address of principal executive offices)
Registrant's telephone number, including area code: (805) 981-8655
Securities registered pursuant to Section 12(b) of the Act:
| Title of Each Class | Name of Each Exchange on Which Registered | |
|---|---|---|
Common stock, $.01 Par Value |
New York Stock Exchange | |
8.00% Series F Cumulative Preferred Stock, $.01 Par Value |
New York Stock Exchange |
Securities registered pursuant to Section 12(g) of the Act: NONE
Indicate by checkmark if the Registrant is a well-known seasoned issuer, as defined in Rule 405 of the Securities Act. Yes o No ý
Indicate by checkmark if the Registrant is not required to file reports pursuant to Section 13 or Section 15(d) of the Act. Yes o No ý
Indicate by check mark whether the Registrant (1) has filed all reports required to be filed by Section 13 or 15(d) of the Securities Exchange Act of 1934 during the preceding 12 months (or for such shorter period that the Registrant was required to file such reports), and (2) has been subject to such filing requirements for the past 90 days. Yes ý No o
Indicate by check mark whether the registrant has submitted electronically and posted on its corporate Web site, if any, every Interactive Data File required to be submitted and posted pursuant to Rule 405 of Regulation S-T (§ 232.405 of this chapter) during the preceding 12 months (or for such shorter period that the registrant was required to submit and post such files). Yes o No o
Indicate by check mark if disclosure of delinquent filers pursuant to Item 405 of Regulation S-K is not contained herein, and will not be contained, to the best of the Registrant's knowledge, in definitive proxy or information statements incorporated by reference in Part III of this Form 10-K or any amendment to this Form 10-K. o
Indicate by check mark whether the registrant is a large accelerated filer, an accelerated filer, a non-accelerated filer, or a smaller reporting company. See the definitions of "large accelerated filer," "accelerated filer," and "smaller reporting company" in Rule 12b-2 of the Exchange Act. (Check one):
| Large accelerated filer o | Accelerated filer ý | Non-accelerated filer o | Smaller reporting company o | |||
(Do not check if a smaller reporting company) |
Indicate by check mark whether the Registrant is a shell company (as defined in Rule 12b-2 of the Act). Yes o No ý
The aggregate market value of voting and non-voting common equity held by non-affiliates of the Registrant was approximately $545,542,000 as of June 30, 2010 (the last business day of the Registrant's most recently completed second fiscal quarter). For purposes of this calculation, shares of common stock held by officers and directors of the registrant and shares of common stock held by persons who hold more than 10% of the outstanding common stock of the Registrant have been excluded from this calculation because such persons may be deemed to be affiliates.
The number of shares of common stock outstanding as of February 16, 2011 was 26,344,574.
DOCUMENTS INCORPORATED BY REFERENCE
Portions of the Registrant's definitive proxy statement relating to its 2011 Annual Meeting of Stockholders are incorporated by reference into Part III of this Annual Report on Form 10-K where indicated.
This annual report contains forward-looking statements within the meaning of Section 27A of the Securities Act of 1933, as amended, and Section 21E of the Securities Exchange Act of 1934, as amended, adopted pursuant to the Private Securities Litigation Reform Act of 1995. Statements that are not purely historical may be forward-looking. You can identify some of the forward-looking statements by their use of forward-looking words, such as "believes," "expects," "may," "will," "should," "seeks," "approximately," "intends," "plans," "estimates" or "anticipates," or the negative of those words or similar words. Forward- looking statements involve inherent risks and uncertainties regarding events, conditions and financial trends that may affect our future plans of operation, business strategy, results of operations and financial position. A number of important factors could cause actual results to differ materially from those included within or contemplated by such forward-looking statements, including, but not limited to, the status of the economy; the status of capital markets (including prevailing interest rates) and our access to capital; the income and returns available from investments in health care related real estate; the ability of our borrowers and lessees to meet their obligations to us; our reliance on a few major operators; competition faced by our borrowers and lessees within the health care industry; regulation of the health care industry by federal, state and local governments, including as a result of the Patient Protection and Affordable Care Act of 2010 and the Health Care and Education Reconciliation Act of 2010; changes in Medicare and Medicaid reimbursement amounts, including due to federal and state budget constraints; compliance with and changes to regulations and payment policies within the health care industry; debt that we may incur and changes in financing terms; ability to continue to qualify as a real estate investment trust; the relative illiquidity of our real estate investments; potential limitations on our remedies when mortgage loans default; and risks and liabilities in connection with properties owned through limited liability companies and partnerships. For a discussion of these and other factors that could cause actual results to differ from those contemplated in the forward-looking statements, please see the discussion under "Risk Factors" contained in this annual report and in other information contained in this annual report and our publicly available filings with the Securities and Exchange Commission. We do not undertake any responsibility to update or revise any of these factors or to announce publicly any revisions to forward-looking statements, whether as a result of new information, future events or otherwise.
General
LTC Properties, Inc., a health care real estate investment trust (or REIT), was incorporated on May 12, 1992 in the State of Maryland and commenced operations on August 25, 1992. We invest primarily in senior housing and long term care properties through mortgage loans, property lease transactions and other investments. We conduct and manage our business as one operating segment, rather than multiple operating segments, for internal reporting and internal decision making purposes. Our primary objectives are to sustain and enhance stockholder equity value and provide current income for distribution to stockholders through real estate investments in senior housing and long term care properties managed by experienced operators. Our primary senior housing and long term healthcare property types include skilled nursing properties (or SNF), assisted living properties (or ALF), independent living properties (or ILF) and combinations thereof. To meet these objectives, we attempt to invest in properties that provide opportunity for additional value and current returns to our stockholders and diversify our investment portfolio by geographic location, operator and form of investment.
Skilled nursing facilities provide restorative, rehabilitative and nursing care for people not requiring the more extensive and sophisticated treatment available at acute care hospitals. Many skilled nursing facilities provide ancillary services that include occupational, speech, physical, respiratory and
2
IV therapies, as well as sub-acute care services which are paid either by the patient, the patient's family, private health insurance, or through the federal Medicare or state Medicaid programs.
Assisted living facilities serve elderly persons who require assistance with activities of daily living, but do not require the constant supervision skilled nursing facilities provide. Services are usually available 24 hours a day and include personal supervision and assistance with eating, bathing, grooming and administering medication. The facilities provide a combination of housing, supportive services, personalized assistance and health care designed to respond to individual needs.
Independent living facilities, also known as retirement communities or senior apartments, offer a sense of community and numerous levels of service, such as laundry, housekeeping, dining options/meal plans, exercise and wellness programs, transportation, social, cultural and recreational activities, on-site security and emergency response programs. Many offer on-site conveniences like beauty/barber shops, fitness facilities, game rooms, libraries and activity centers.
We were organized to qualify, and intend to continue to qualify, as a REIT. So long as we qualify, with limited exceptions, we may deduct distributions, both preferred dividends and common dividends, to our stockholders from our taxable income. We have made distributions, and intend to continue to make distributions to our stockholders, in order to eliminate any federal tax liability.
Owned Properties. The following table summarizes our investment in owned properties at December 31, 2010 (in thousands):
| |
|
|
|
Number of | |
|||||||||||||||||
|---|---|---|---|---|---|---|---|---|---|---|---|---|---|---|---|---|---|---|---|---|---|---|
Type of Property
|
Gross Investments |
Percentage of Investments |
Number of Properties(1) |
SNF Beds |
ALF Units |
ILF Units |
Investment per Bed/Unit |
|||||||||||||||
Assisted Living |
$ | 284,926 | 46.3 | % | 88 | — | 3,941 | — | $ | 72.30 | ||||||||||||
Skilled Nursing |
266,231 | 43.2 | % | 61 | 7,005 | — | — | $ | 38.01 | |||||||||||||
Other Senior Housing(2) |
52,339 | 8.5 | % | 11 | 696 | 216 | 370 | $ | 40.83 | |||||||||||||
Schools |
12,170 | 2.0 | % | 2 | N/A | N/A | N/A | N/A | ||||||||||||||
Totals |
$ | 615,666 | 100.0 | % | 162 | 7,701 | 4,157 | 370 | ||||||||||||||
- (1)
- We
have investments in 25 states leased to 27 different operators.
- (2)
- Other senior housing properties consist of independent living properties and properties providing any combination of skilled nursing, assisted living and/or independent living services.
Here and throughout this Form 10-K wherever we provide details of our properties' bed/unit count, the number of beds/units applies to skilled nursing, assisted living and independent living properties only. This number is based upon unit/bed counts shown on operating licenses provided to us by lessees/borrowers or units/beds as stipulated by lease/mortgage documents. We have found during the years that these numbers often differ, usually not materially, from units/beds in operation at any point in time. The differences are caused by such things as operators converting a patient/resident room for alternative uses, such as offices or storage, or converting a multi-patient room/unit into a single patient room/unit. We monitor our properties on a routine basis through site visits and reviews of current licenses. In an instance where such change would cause a de-licensing of beds or in our opinion impact the value of the property, we would take action against the lessee/borrower to preserve the value of the property/collateral. See Item 8. FINANCIAL STATEMENTS—Note 6. Real Estate Investments for further description.
3
The following operators accounted for more than 10% of our 2010 rental income revenues:
Lessee
|
Percent of Rental Revenue | |||
|---|---|---|---|---|
Extendicare REIT and Assisted Living Concepts, Inc. |
16.9 | % | ||
Brookdale Senior Living Communities, Inc. |
15.9 | % | ||
Preferred Care, Inc. |
14.6 | % | ||
Mortgage Loans. As part of our strategy of making long term investments in properties used in the provision of long term health care services, we provide mortgage financing on such properties based on our established investment underwriting criteria. See "Investment and Other Policies" in this section for further discussion. We have also provided construction loans that by their terms converted into purchase/lease transactions or permanent financing mortgage loans upon completion of construction.
The following table summarizes our investments in mortgage loans secured by first mortgages at December 31, 2010 (in thousands):
| |
|
|
|
|
Number of | |
||||||||||||||||
|---|---|---|---|---|---|---|---|---|---|---|---|---|---|---|---|---|---|---|---|---|---|---|
Type of Property
|
Gross Investments |
Percentage of Investments |
Number of Loans |
Number of Properties(1) |
SNF Beds |
ALF Units |
Investment per Bed/Unit |
|||||||||||||||
Assisted Living |
$ | 24,203 | 40.3 | % | 10 | 15 | — | 589 | $ | 41.09 | ||||||||||||
Skilled Nursing |
32,503 | 54.2 | % | 23 | 28 | 3,207 | — | $ | 10.14 | |||||||||||||
Other Senior Housing(2) |
3,301 | 5.5 | % | 1 | 1 | 99 | 74 | $ | 19.08 | |||||||||||||
Totals |
$ | 60,007 | 100.0 | % | 34 | 44 | 3,306 | 663 | ||||||||||||||
- (1)
- We
have investments in 12 states that include mortgages to 16 different operators.
- (2)
- Other senior housing properties consist of independent living properties and properties providing any combination of skilled nursing, assisted living and/or independent living services.
Investment and Other Policies
Objectives and Policies. Our investment policy is to invest primarily in income-producing senior housing and long term care properties. Also see "Government Regulation" below. Over the past three years (2008 through 2010), we invested approximately $11.6 million in mortgage loans and we acquired skilled nursing properties, assisted living properties, independent living properties and combinations thereof for approximately $108.3 million. At December 31, 2010, we had $6.9 million of cash on hand, $72.3 million available on our $110.0 million Unsecured Credit Agreement which matures July 17, 2011, and the uncommitted private shelf agreement with affiliates and managed accounts of Prudential Investment Management, Inc. (individually and collectively "Prudential") which provides for the possible issuance of up to $50.0 million of senior unsecured fixed-rate term notes during the three-year issuance period. For additional liquidity, we had our ability to access the capital markets through the issuance of $64.6 million of common stock under our Amended Equity Distribution Agreement and through the issuance of debt and/or equity securities under our $276.3 million effective shelf registration. Subsequent to December 31, 2010, we repaid $4.2 million under our Unsecured Credit Agreement. After this payment, we had $33.5 million outstanding under the Unsecured Credit Agreement and $76.5 million available for borrowing. As a result, we believe our liquidity and various sources of available capital are sufficient to fund operations, meet debt service obligations (both principal and interest), make dividend distributions and finance some future investments should we determine such future investments are financially feasible. The timing, source and amount of cash flows provided by financing activities and used in investing activities are sensitive to the capital markets environment, especially to changes in interest rates. We continuously evaluate the availability of cost-effective capital and believe we have sufficient liquidity for additional capital investments in 2011.
4
Our primary marketing and development focus is to increase the awareness of our presence at the state and local levels through participation in various healthcare associations and trade shows. We believe that this targeted marketing effort has increased deal flow and continues to provide opportunities for new investments in 2011. Since the competition from buyers in large transactions consisting of multiple property portfolios generally results in pricing that does not meet our investment criteria, our marketing efforts primarily focus on single property transactions or small multiple property portfolios that complement our historic investments and are priced with yields in our historical range.
Historically our investments have consisted of:
- •
- fee ownership of senior housing and long term care properties that are leased to providers;
- •
- mortgage loans secured by senior housing and long term care properties; or
- •
- participation in such investments indirectly through investments in real estate partnerships or other entities that themselves make direct investments in such loans or properties.
In evaluating potential investments, we consider factors such as:
- •
- type of property;
- •
- the location;
- •
- construction quality, condition and design of the property;
- •
- the property's current and anticipated cash flow and its adequacy to meet operational needs and lease obligations or debt
service obligations;
- •
- the experience, reputation and solvency of the licensee providing services;
- •
- the payor mix of private, Medicare and Medicaid patients;
- •
- the growth, tax and regulatory environments of the communities in which the properties are located;
- •
- the occupancy and demand for similar properties in the area surrounding the property; and
- •
- the Medicaid reimbursement policies and plans of the state in which the property is located.
With respect to skilled nursing properties, we prefer to invest in properties that do not have to rely on a high percentage of private-pay patients. We seek to invest primarily in properties that are located in suburban areas of states. Prior to every investment, we conduct a property site review to assess the general physical condition of the property and the potential of additional services. In addition, we review the environmental reports, site surveys and financial statements of the property before the investment is made. We prefer to invest in a property that has a significant market presence in its community and where state certificate of need and/or licensing procedures limit the entry of competing properties.
We believe that assisted living and independent living facilities are an important sector in the long term care market and our investments include direct ownership and mortgages secured by assisted living and/or independent living properties. For assisted living and independent living investments we have attempted to diversify our portfolio both geographically and across product levels. Thus, we believe that although the majority of our investments are in affordably priced units, our portfolio also includes upscale units in appropriate markets with certain operators.
Our marketing efforts primarily focus on local and regional operators. As of December 31, 2010, 74% of our operators who leased our senior housing and long term care properties were non-public companies. Approximately 4% of our annualized rental income was generated by operators who operate less than nine senior housing and long term care properties, approximately 15% of our
5
annualized rental income was generated by operators who operate between 10 and 20 senior housing and long term care properties and approximately 81% of our annualized rental income was generated by operators who operate more than 20 senior housing and long term care properties. Annualized rental income includes cash and straight-line rental income.
Borrowing Policies. We may incur additional indebtedness when, in the opinion of our Board of Directors, it is advisable. We may incur such indebtedness to make investments in additional senior housing and long term care properties or to meet the distribution requirements imposed upon REITs under the Internal Revenue Code of 1986, as amended. For other short-term purposes, we may, from time to time, negotiate lines of credit, or arrange for other short-term borrowings from banks or otherwise. We may also arrange for long term borrowings through public offerings or from institutional investors.
In addition, we may incur mortgage indebtedness on real estate which we have acquired through purchase, foreclosure or otherwise. We may also obtain mortgage financing for unleveraged or underleveraged properties in which we have invested or may refinance properties acquired on a leveraged basis. There is no limitation on the number or amount of mortgages that may be placed on any one property, and we have no policy with respect to limitations on borrowing, whether secured or unsecured.
Prohibited Investments and Activities. Our policies, which are subject to change by our Board of Directors without stockholder approval, impose certain prohibitions and restrictions on our investment practices or activities including prohibitions against:
- •
- investing in any junior mortgage loan unless by appraisal or other method, our Board of Directors determine that
- (a)
- the
capital invested in any such loan is adequately secured on the basis of the equity of the borrower in the property underlying such investment and the
ability of the borrower to repay the mortgage loan; or
- (b)
- such
loan is a financing device we enter into to establish the priority of our capital investment over the capital invested by others investing with us in a
real estate project;
- •
- investing in commodities or commodity futures contracts (other than interest rate futures, when used solely for hedging
purposes);
- •
- investing more than 1% of our total assets in contracts for the sale of real estate unless such contracts are recordable
in the chain of title;
- •
- holding equity investments in unimproved, non-income producing real property, except such properties as are currently undergoing development or are presently intended to be developed within one year, together with mortgage loans on such property (other than first mortgage development loans), aggregating to more than 10% of our assets.
Competition
In the health care industry, we compete for real property investments with health care providers, other health care related REITs, real estate partnerships, banks, private equity funds, venture capital funds and other investors. Many of our competitors are significantly larger and have greater financial resources and lower cost of capital than we have available to us. Our ability to compete successfully for real property investments will be determined by numerous factors, including our ability to identify suitable acquisition targets, our ability to negotiate acceptable terms for any such acquisition and the availability and our cost of capital.
6
The lessees and borrowers of our properties compete on a local, regional and, in some instances, national basis with other health care providers. The ability of the lessee or borrower to compete successfully for patients or residents at our properties depends upon several factors, including the levels of care and services provided by the lessees or borrowers, the reputation of the providers, physician referral patterns, physical appearances of the properties, family preferences, financial condition of the operator and other competitive systems of health care delivery within the community, population and demographics.
Government Regulation
The health care industry is heavily regulated by the government. Our borrowers and lessees who operate health care facilities are subject to extensive regulation by federal, state and local governments. These laws and regulations are subject to frequent and substantial changes resulting from legislation, adoption of rules and regulations, and administrative and judicial interpretations of existing law. These changes may have a dramatic effect on the definition of permissible or impermissible activities, the relative costs associated with doing business and the amount of reimbursement by both government and other third-party payors. These changes may be applied retroactively. The ultimate timing or effect of these changes cannot be predicted. The failure of any borrower of funds from us or lessee of any of our properties to comply with such laws, requirements and regulations could result in sanctions or remedies such as denials of payment for new Medicare and Medicaid admissions, civil monetary penalties, state oversight and loss of Medicare and Medicaid participation or licensure. Such action could affect our borrower's or lessee's ability to operate its facility or facilities and could adversely affect such borrower's or lessee's ability to make debt or lease payments to us.
The properties owned by us and the manner in which they are operated are affected by changes in the reimbursement, licensing and certification policies of federal, state and local governments. Properties may also be affected by changes in accreditation standards or procedures of accrediting agencies that are recognized by governments in the certification process. In addition, expansion (including the addition of new beds or services or acquisition of medical equipment) and occasionally the discontinuation of services of health care facilities are, in some states, subjected to state and regulatory approval through "certificate of need" laws and regulations.
The ability of our borrowers and lessees to generate revenue and profit determines the underlying value of that property to us. Revenues of our borrowers and lessees of skilled nursing properties are generally derived from payments for patient care. Sources of such payments for skilled nursing facilities include the federal Medicare program, state Medicaid programs, private insurance carriers, health care service plans, health maintenance organizations, preferred provider arrangements, and self-insured employers, as well as the patients themselves.
A significant portion of the revenue of our skilled nursing property borrowers and lessees is derived from governmentally-funded reimbursement programs, such as Medicare and Medicaid. Because of significant health care costs paid by such government programs, both federal and state governments have adopted and continue to consider various health care reform proposals to control health care costs. Over the years there have been fundamental changes in the Medicare program that resulted in reduced levels of payment for a substantial portion of health care services, including skilled nursing facility services. In many instances, revenues from Medicaid programs are already insufficient to cover the actual costs incurred in providing care to those patients. On February 17, 2009, President Obama signed into law the American Recovery and Reinvestment Act of 2009, which, among many other things, increases federal Medicaid payments by approximately $87 billion to help support state Medicaid programs as they face budget shortfalls. An additional $16.1 billion in federal Medicaid assistance was included in the Education Jobs and Medicaid Assistance Act, which President Obama signed into law on August 10, 2010. Despite this funding, however, the Kaiser Commission on Medicaid and the Uninsured reported in October 2010 that nearly every state implemented at least one new
7
Medicaid policy to control spending in fiscal years 2010 and 2011, with 39 states in fiscal year 2010 implementing provider rate cuts or freezes, and 37 states planning to do so in fiscal year 2011. In addition, many states have been making changes to their long term care delivery systems that emphasize home and community-based long term care services, in some cases coupled with cost controls for institutional providers. According to the Kaiser Commission, 23 states adopted new home and community-based waiver programs or expanded existing waivers in fiscal year 2010. Likewise, 18 states implemented long-term care utilization controls or other service reductions to contain costs in fiscal year 2010, and 10 states intend to take such actions in fiscal year 2011. The federal government also has adopted policies to promote community-based alternatives to institutional services. As states and the federal government continue to respond to budget pressures, future reduction in Medicaid and/or Medicare payments for skilled nursing facility services could have an adverse effect on the financial condition of our borrowers and lessees which could, in turn, adversely impact the timing or level of their payments to us. Moreover, health care facilities continue to experience pressures from private payors attempting to control health care costs, and reimbursement from private payors has in many cases effectively been reduced to levels approaching those of government payors.
The Centers for Medicare & Medicaid Services (or CMS) annually updates Medicare skilled nursing facility prospective payment system rates and other policies. On July 22, 2010, CMS published the final Medicare skilled nursing facility rates for fiscal year 2011, which began on October 1, 2010. The rule is expected to increase Medicare payments by 1.7%, or approximately $542 million compared to fiscal year 2010 levels. The rule provides for 2.3% market basket update, which is partially offset by a "forecast error adjustment" that reduces payments by 0.6% to compensate for previous errors in projecting changes in the market basket. While Medicare payments are increasing for fiscal year 2011, any future reductions in Medicare skilled nursing facility payment rates could have an adverse effect on the financial condition of our borrowers and lessees which could, in turn, adversely impact the timing or level of their payments to us.
Governmental and public concern regarding health care costs may result in significant reductions in payment to health care facilities, and there can be no assurance that future payment rates for either governmental or private payors will be sufficient to cover cost increases in providing services to patients. Any changes in reimbursement policies which reduce reimbursement to levels that are insufficient to cover the cost of providing patient care could adversely affect revenues of our skilled nursing property borrowers and lessees and to a much lesser extent our assisted living property borrowers and lessees and thereby adversely affect those borrowers' and lessees' abilities to make their debt or lease payments to us. Failure of the borrowers or lessees to make their debt or lease payments would have a direct and material adverse impact on us.
Various federal and state laws govern financial and other arrangements between health care providers that participate in, receive payments from, or make or receive referrals for work in connection with government funded health care programs, including Medicare and Medicaid. These laws, known as the fraud and abuse laws, include the federal anti-kickback statute, which prohibits, among other things, knowingly and willfully soliciting, receiving, offering or paying any remuneration directly or indirectly in return for, or to induce, the referral of an individual to a person for the furnishing of an item or service for which payment may be made under federal health care programs. In addition, the federal physician self-referral law, commonly known as Stark II (or the Stark Law), prohibits physicians and certain other types of practitioners from making referrals for certain designated health services paid in whole or in part by Medicare and Medicaid to entities with which the practitioner or a member of the practitioner's immediate family has a financial relationship, unless the financial relationship fits within an applicable exception to the Stark Law. The Stark Law also prohibits the entity receiving the referral from seeking payment under the Medicare and Medicaid programs for services rendered pursuant to a prohibited referral. If an entity is paid for services rendered pursuant to a prohibited referral, it may incur civil penalties of up to $15,000 per prohibited claim and may be
8
excluded from participating in the Medicare and Medicaid programs. Many states have enacted similar fraud and abuse laws which are not necessarily limited to items and services for which payment is made by federal health care programs. Violations of these laws may result in fines, imprisonment, denial of payment for services, and exclusion from federal and/or other state-funded programs. Other federal and state laws authorize the imposition of penalties, including criminal and civil fines and exclusion from participation in federal healthcare programs for submitting false claims, improper billing and other offenses. Federal and state government agencies have continued rigorous enforcement of criminal and civil fraud and abuse laws in the health care arena. Our borrowers and lessees are subject to many of these laws, and some of them could in the future become the subject of a governmental enforcement action.
Health Care Reform and Other Legislative Developments
Congress and the state legislatures regularly consider, and in some cases adopt, legislation impacting health care providers, including long term care providers. For instance, the Balanced Budget Act of 1997 enacted significant changes to the Medicare and Medicaid programs designed to modernize payment and health care delivery systems while achieving substantial budgetary savings. Among other things, the law established the prospective payment system for skilled nursing facility services to replace the cost-based reimbursement system, which resulted in significant reductions in Medicare payments to skilled nursing facilities. In recent years, Congress has adopted legislation to somewhat mitigate the impact of the new payment system, including a temporary payment add-on for high-acuity patients, which has subsequently expired, and a temporary payment add-on for residents with AIDS that still is in effect through fiscal year 2011. Other legislation enacted by Congress in recent years has reduced certain Medicare skilled nursing facility bad debt payments, strengthened Medicaid asset transfer restrictions for persons seeking to qualify for Medicaid long term care coverage, reduced Medicaid provider taxes that are used by many states to finance state health programs, and given states greater flexibility to expand access to home and community based services.
In March 2010, the President signed into law the Patient Protection and Affordable Care Act, which subsequently was amended by the Health Care and Education and Reconciliation Act of 2010 (collectively referred to as the "Affordable Care Act"). The Affordable Care Act is designed to expand access to affordable health insurance, contain health care costs, and institute a variety of health policy reforms. The provisions of the sweeping law may affect us directly, as well as impact our lessees and borrowers. While certain provisions, such as expanding the insured population, may positively impact the revenues of our lessees and borrowers, other provisions, particularly those intended to reduce federal health care spending, could have a negative impact on our lessees and borrowers. Among other things, the Affordable Care Act: reduces Medicare skilled nursing facility reimbursement by a so-called "productivity adjustment" based on economy-wide productivity gains beginning in fiscal year 2012; requires the development of a value-based purchasing program for Medicare skilled nursing facility services; establishes a national voluntary pilot program to bundle Medicare payments for hospital and post-acute services that could lead to changes in the delivery of post-acute services; and provides incentives to state Medicaid programs to promote community-based care as an alternative to institutional long-term care services. The Affordable Care Act also includes provisions intended to expand public disclosure about nursing home ownership and operations, institute mandatory compliance and quality assurance programs, increase penalties for noncompliance, and expand fraud and abuse enforcement and penalty provisions that could impact our operators. In addition, the Affordable Care Act impacts both us and our lessees and borrowers as employers, including new requirements related to the health insurance we offer to our respective employees. Many aspects of the Affordable Care Act are being implemented through new regulations and subregulatory guidance. We cannot predict at this time what effect, if any, the various provisions of the Affordable Care Act will have on our lessees and borrowers or our business. There can be no assurances, however, that the Affordable Care Act will not
9
adversely impact the operations, cash flows or financial condition of our lessees and borrowers, which subsequently could materially adversely impact our revenue and operations.
In addition, comprehensive reforms affecting the payment for and availability of health care services have been proposed at the state level and adopted by certain states. Congress and state legislatures can be expected to continue to review and assess alternative health care delivery systems and payment methodologies. Changes in the law, new interpretations of existing laws, or changes in payment methodologies may have a dramatic effect on the definition of permissible or impermissible activities, the relative costs associated with doing business and the amount of reimbursement by the government and other third party payors.
Environmental Matters
Under various federal, state and local environmental laws, ordinances and regulations, an owner of real property or a secured lender (such as us) may be liable for the costs of removal or remediation of hazardous or toxic substances at, under or disposed of in connection with such property, as well as other potential costs relating to hazardous or toxic substances (including government fines and damages for injuries to persons and adjacent property). Such laws often impose such liability without regard to whether the owner or secured lender knew of, or was responsible for, the presence or disposal of such substances and may be imposed on the owner or secured lender in connection with the activities of an operator of the property. The cost of any required remediation, removal, fines or personal or property damages and the owner's or secured lender's liability therefore could exceed the value of the property, and/or the assets of the owner or secured lender. In addition, the presence of such substances, or the failure to properly dispose of or remediate such substances, may adversely affect the owner's ability to sell or rent such property or to borrow using such property as collateral which, in turn, would reduce our revenues.
Although the mortgage loans that we provide and leases covering our properties require the borrower and the lessee to indemnify us for certain environmental liabilities, the scope of such obligations may be limited and we cannot assure that any such borrower or lessee would be able to fulfill its indemnification obligations.
Insurance
It is our current policy, and we intend to continue this policy, that all borrowers of funds from us and lessees of any of our properties secure adequate comprehensive property and general and professional liability insurance that covers us as well as the borrower and/or lessee. Even though that is our policy, certain borrowers and lessees have been unable to obtain general and professional liability insurance in the specific amounts required by our leases or mortgages because the cost of such insurance and some insurers have stopped offering such insurance for long term care facilities. Additionally, in the past, insurance companies have filed for bankruptcy protection leaving certain of our borrowers and/or lessees without coverage for periods that were believed to be covered prior to such bankruptcies. The unavailability and associated exposure as well as increased cost of such insurance could have a material adverse effect on the lessees and borrowers, including their ability to make lease or mortgage payments. Although we contend that as a non-possessory landlord we are not generally responsible for what takes place on real estate we do not possess, claims including general and professional liability claims, may still be asserted against us which may result in costs and exposure for which insurance is not available. Certain risks may be uninsurable, not economically insurable or insurance may not be available and there can be no assurance that we, a borrower or lessee will have adequate funds to cover all contingencies. If an uninsured loss or a loss in excess of insured limits occurs with respect to one or more of our properties, we could be subject to an adverse claim including claims for general or professional liability, could lose the capital that we have invested in the properties, as well as the anticipated future revenue for the properties and, in the case of debt which is
10
with recourse to us, we would remain obligated for any mortgage debt or other financial obligations related to the properties. Certain losses, such as losses due to floods or seismic activity if insurance is available, may be insured subject to certain limitations including large deductibles or co-payments and policy limits.
Employees
At December 31, 2010, we employed 13 people. Subsequent to that date, we hired a Senior Financial Analyst and a Vice President, Investment and Asset Management. Our employees are not members of any labor union, and we consider our relations with our employees to be excellent.
Taxation of our Company
We have elected to be taxed as a REIT under Sections 856 through 860 of the Internal Revenue Code (or the Code). We believe that we have been organized and have operated in such a manner as to qualify for taxation as a REIT under the Code commencing with our taxable year ending December 31, 1992. We intend to continue to operate in such a manner, but there is no assurance that we have operated or will continue to operate in a manner so as to qualify or remain qualified.
If we continue to qualify for taxation as a REIT, we generally will not be subject to federal corporate income taxes on our net income that is currently distributed to our stockholders. This treatment substantially eliminates the "double taxation" (once at the corporate level when earned and once at stockholder level when distributed) that generally results from investment in a non-REIT corporation.
However, we will be subject to federal income tax as follows:
First, we will be taxed at regular corporate rates on any undistributed taxable income, including undistributed net capital gains.
Second, under certain circumstances, we may be subject to the alternative minimum tax, if our dividend distributions are less than our alternative minimum taxable income.
Third, if we have (i) net income from the sale or other disposition of foreclosure property which is held primarily for sale to customers in the ordinary course of business or (ii) other non-qualifying income from foreclosure property, we may elect to be subject to tax at the highest corporate rate on such income, if necessary to maintain our REIT status.
Fourth, if we have net income from "prohibited transactions" (as defined below), such income will be subject to a 100% tax.
Fifth, if we fail to satisfy the 75% gross income test or the 95% gross income test (as discussed below), but nonetheless maintain our qualification as a REIT because certain other requirements have been met, we will be subject to a 100% tax on an amount equal to (a) the gross income attributable to the greater of the amount by which we fail the 75% or 95% test multiplied by (b) a fraction intended to reflect our profitability.
Sixth, if we fail to distribute during each calendar year at least the sum of (i) 85% of our ordinary income for such year, (ii) 95% of our REIT capital gain net income for such year, and (iii) any undistributed taxable income from prior periods, we will be subject to a 4% excise tax on the excess of such required distribution over the amounts actually distributed.
Seventh, if we acquire an asset which meets the definition of a built-in gain asset from a corporation which is or has been a C corporation (i.e., generally a corporation subject to full corporate-level tax) in certain transactions in which the basis of the built-in gain asset in our hands is determined by reference to the basis of the asset in the hands of the C corporation, and if we subsequently
11
recognize gain on the disposition of such asset during the ten-year period, called the recognition period, beginning on the date on which we acquired the asset, then, to the extent of the built-in gain (i.e., the excess of (a) the fair market value of such asset over (b) our adjusted basis in such asset, both determined as of the beginning of the recognition period), such gain will be subject to tax at the highest regular corporate tax rate, pursuant to IRS regulations.
Eighth, if we have taxable REIT subsidiaries, we will also be subject to a tax of 100% on the amount of any rents from real property, deductions or excess interest paid to us by any of our taxable REIT subsidiaries that would be reduced through reapportionment under certain federal income tax principles in order to more clearly reflect income for the taxable REIT subsidiary.
Ninth, if we fail to satisfy any of the REIT asset tests, as described below, by more than a de minimus amount, due to reasonable cause and we nonetheless maintain our REIT qualification because of specified cure provisions, we will be required to pay a tax equal to the greater of $50,000 or the highest corporate tax rate multiplied by the net income generated by the non-qualifying assets that caused us to fail such test.
Tenth, if we fail to satisfy any provision of the Code that would result in our failure to qualify as a REIT (other than a violation of the REIT gross income tests or certain violations of the asset tests described below) and the violation is due to reasonable cause, we may retain our REIT qualification but we will be required to pay a penalty of $50,000 for each such failure.
Finally, if we own a residual interest in a real estate mortgage investment conduit (or REMIC), we will be taxed at the highest corporate rate on the portion of any excess inclusion income that we derive from the REMIC residual interests equal to the percentage of our shares that is held in record name by "disqualified organization." A "disqualified organization" includes the United States, any state or political subdivision thereof, any foreign government or international organization, any agency or instrumentality of any of the foregoing, any rural electrical or telephone cooperative and any tax-exempt organization (other than a farmer's cooperative described in Section 521 of the Code) that is exempt from income taxation and from the unrelated business taxable income provisions of the Code. However, to the extent that we own a REMIC residual interest through a taxable REIT subsidiary, we will not be subject to this tax.
Requirements for Qualification. The Code defines a REIT as a corporation, trust or association:
- (1)
- which
is managed by one or more trustees or directors;
- (2)
- the
beneficial ownership of which is evidenced by transferable shares, or by transferable certificates of beneficial interest;
- (3)
- which
would be taxable, but for Sections 856 through 860 of the Code, as a domestic corporation;
- (4)
- which
is neither a financial institution nor an insurance company subject to certain provisions of the Code;
- (5)
- the
beneficial ownership of which is held by 100 or more persons;
- (6)
- during
the last half of each taxable year not more than 50% in value of the outstanding stock of which is owned, actually or constructively, by five or
fewer individuals (including specified entities); and
- (7)
- which
meets certain other tests, described below, regarding the amount of its distributions and the nature of its income and assets;
- (8)
- that elects to be a REIT, or has made such election for a previous year, and satisfies the applicable filing and administrative requirements to maintain qualifications as a REIT; and
12
- (9)
- that adopts a calendar year accounting period.
The Code provides that conditions (1) to (4), inclusive, must be met during the entire taxable year and that condition (5) must be met during at least 335 days of a taxable year of 12 months, or during a proportionate part of a taxable year of less than 12 months. Conditions (5) and (6) do not apply until after the first taxable year for which an election is made to be taxed as a REIT. For purposes of condition (6), pension funds and certain other entities are treated as individuals, subject to a "look-through" exception.
Pursuant to the Code and applicable Treasury Regulations, in order to be able to elect to be taxed as a REIT, we must maintain certain records and request certain information from our stockholders designed to disclose the actual ownership of our stock. Based on publicly available information, we believe we have satisfied the share ownership requirements set forth in conditions (5) and (6). In addition, Sections 9.2 and 9.3 of our Charter provide for restrictions regarding the transfer and ownership of shares. These restrictions are intended to assist us in continuing to satisfy the share ownership requirements described in conditions (5) and (6). These restrictions, however, may not ensure that we will, in all cases, be able to satisfy the share ownership requirements described in conditions (5) and (6).
We have complied with, and will continue to comply with, regulatory rules to send annual letters to certain of our stockholders requesting information regarding the actual ownership of our stock. If despite sending the annual letters, we do not know, or after exercising reasonable diligence would not have known, whether we failed to satisfy the ownership requirement set forth in condition (6) above, we will be treated as having satisfied such condition. If we fail to comply with these regulatory rules, we will be subject to a monetary penalty. If our failure to comply was due to intentional disregard of the requirement, the penalty would be increased. However, if our failure to comply was due to reasonable cause and not willful neglect, no penalty would be imposed.
Income Tests. There presently are two gross income requirements that we must satisfy to qualify as a REIT:
- •
- First, at least 75% of our gross income (excluding gross income from
"prohibited transactions," as defined below) for each taxable year must be derived directly or indirectly from investments relating to real property or mortgages on real property, including rents from
real property, or from certain types of temporary investment income.
- •
- Second, at least 95% of our gross income for each taxable year must be directly or indirectly derived from income that qualifies under the 75% test, and from dividends (including dividends from taxable REIT subsidiaries), interest and gain from the sale or other disposition of stock or securities.
Cancellation of indebtedness income generated by us is not taken into account in applying the 75% and 95% income tests discussed above. A "prohibited transaction" is a sale or other disposition of property (other than foreclosure property) held for sale to customers in the ordinary course of business. Any gain realized from a prohibited transaction is subject to a 100% penalty tax.
Rents received by us will qualify as "rents from real property" for purposes of satisfying the gross income tests for a REIT only if several conditions are met:
- •
- The amount of rent must not be based in whole or in part on the income or profits of any person, although rents generally
will not be excluded merely because they are based on a fixed percentage or percentages of receipts or sales.
- •
- Rents received from a tenant will not qualify as rents from real property if the REIT, or an owner of 10% or more of the REIT, also directly or constructively owns 10% or more of the tenant, unless the tenant is our taxable REIT subsidiary and certain other requirements are met with respect to the real property being rented.
13
- •
- If rent attributable to personal property leased in connection with a lease of real property is greater than 15% of the
total rent received under the lease, then the portion of rent attributable to the personal property will not qualify as rents from real property.
- •
- We generally must not furnish or render services to tenants, other than through a taxable REIT subsidiary or an "independent contractor" from whom we derive no income, except that we may directly provide services that are "usually or customarily rendered" in the geographic area in which the property is located in connection with the rental of real property for occupancy only, or are not otherwise "rendered to the occupant for his convenience."
For taxable years beginning after August 5, 1997, a REIT has been permitted to render a de minimus amount of impermissible services to tenants and still treat amounts received with respect to that property as rents from real property. The amount received or accrued by the REIT during the taxable year for the impermissible services with respect to a property may not exceed 1% of all amounts received or accrued by the REIT directly or indirectly from the property. If the amount received or accrued by the REIT during the taxable year for impermissible services with respect to a property exceeds 1% of the total amounts received or accrued with respect to such property, then none of the rents received or accrued from such property shall be treated as rents from real property. The amount received for any service or management operation for this purpose shall be deemed to be not less than 150% of the direct cost of the REIT in furnishing or rendering the service or providing the management or operation. Furthermore, impermissible services may be furnished to tenants by a taxable REIT subsidiary subject to certain conditions, and we may still treat rents received with respect to the property as rent from real property.
The term "interest" generally does not include any amount if the determination of the amount depends in whole or in part on the income or profits of any person, although an amount generally will not be excluded from the term "interest" solely by reason of being based on a fixed percentage of receipts or sales.
If we fail to satisfy one or both of the 75% or 95% gross income tests for any taxable year, we may nevertheless qualify as a REIT for the year if we are eligible for relief. These relief provisions will be generally available if our failure to meet the tests was due to reasonable cause and not due to wilful neglect and following the identification of the failure to satisfy one or both income tests, a description of each item of gross income is filed in accordance with IRS regulations.
It is not now possible to determine the circumstances under which we may be entitled to the benefit of these relief provisions. If these relief provisions apply, a 100% tax is imposed on an amount equal to (a) the gross income attributable to the greater of the amount by which we failed the 75% or 95% test, multiplied by (b) a fraction intended to reflect our profitability.
Asset Tests. At the close of each quarter of our taxable year, we must also satisfy several tests relating to the nature and diversification of our assets. At least 75% of the value of our total assets must be represented by real estate assets, cash, cash items (including receivables arising in the ordinary course of our operations), and government securities and qualified temporary investments. Although the remaining 25% of our assets generally may be invested without restriction, we are prohibited from owning securities representing more than 10% of either the vote or value of the outstanding securities of any issuer other than a qualified REIT subsidiary, another REIT or a taxable REIT subsidiary (the "10% vote and value test"). Further, no more than 25% of our total assets may be represented by securities of one or more taxable REIT subsidiaries (for tax years beginning prior to July 30, 2008, 20% of the total value of our assets) and no more than 5% of the value of our total assets may be represented by securities of any non-governmental issuer other than a qualified REIT subsidiary, another REIT or a taxable REIT subsidiary (or TRS). Each of the 10% vote and value test and the 25% and 5% asset tests must be satisfied at the end of any quarter. There are special rules which
14
provide relief if the value related tests are not satisfied due to changes in the value of the assets of a REIT.
Investments in Taxable REIT Subsidiaries. For taxable years beginning after December 1, 2000, REITs may own more than 10% of the voting and value of securities in a TRS. A TRS is a corporation other than a REIT in which a REIT directly or indirectly holds stock, and that has made a joint election with the REIT to be treated as a TRS. A TRS also includes any corporation other than a REIT with respect to which a TRS owns securities possessing more that 35% of the total voting power or value of the outstanding securities of such corporation. Other than some activities relating to lodging and health care facilities, a TRS may generally engage in any business, including the provision of customary or non-customary services to tenants of its parent REIT. A TRS is subject to income tax as a regular C corporation. In addition, a TRS may be prevented from deducting interest on debt funded directly or indirectly by its parent REIT if certain tests regarding the TRS's debt to equity ratio and interest expense are not satisfied. A REIT's ownership of a TRS will not be subject to the 10% or 5% asset tests described above, and its operations will be subject to the provisions described above. At this time, we do not have any taxable REIT subsidiaries.
REMIC. A regular or residual interest in a REMIC will be treated as a real estate asset for purposes of the REIT asset tests, and income derived with respect to such interest will be treated as interest on an obligation secured by a mortgage on real property, assuming that at least 95% of the assets of the REMIC are real estate assets. If less than 95% of the assets of the REMIC are real estate assets, only a proportionate share of the assets of and income derived from the REMIC will be treated as qualifying under the REIT asset and income tests. All of our historical REMIC certificates were secured by real estate assets, therefore we believe that our historic REMIC interests fully qualified for purposes of the REIT income and asset tests.
Ownership of Interests in Partnerships, Limited Liability Companies and Qualified REIT Subsidiaries. We own interests in various partnerships and limited liabilities companies. In the case of a REIT which is a partner in a partnership, or a member in a limited liability company treated as a partnership for federal income tax purposes, Treasury Regulations provide that the REIT will be deemed to own its proportionate share of the assets of the partnership or limited liability company, based on its interest in partnership capital, subject to special rules relating to the 10% REIT asset test described above. Also, the REIT will be deemed to be entitled to its proportionate share of income of that entity. The assets and items of gross income of the partnership or limited liability company retain the same character in the hands of the REIT for purposes of Section 856 of the Code, including satisfying the gross income tests and the asset tests. Thus, our proportionate share of the assets and items of income of partnerships and limited liability companies taxed as partnerships, in which we are, directly or indirectly through other partnerships or limited liability companies taxed as partnerships, a partner or member, are treated as our assets and items of income for purposes of applying the REIT qualification requirements described in this Annual Report on Form 10-K (including the income and asset tests previously described).
We also own interests in a number of subsidiaries which are intended to be treated as qualified REIT subsidiaries. The Code provides that such subsidiaries will be ignored for federal income tax purposes and that all assets, liabilities and items of income, deduction and credit of such subsidiaries will be treated as assets, liabilities and such items of our company. If any partnership or qualified real estate investment trust subsidiary in which we own an interest were treated as a regular corporation (and not as a partnership or qualified real estate investment trust subsidiary) for federal income tax purposes, we would likely fail to satisfy the REIT asset test prohibiting a REIT from owning greater than 10% of the voting power of the stock or value of securities of any issuer, as described above, and would therefore fail to qualify as a REIT. We believe that each of the partnerships and subsidiaries in which we own an interest will be treated for tax purposes as a partnership or qualified REIT subsidiary,
15
respectively, although no assurance can be given that the IRS will not successfully challenge the status of any such entity.
Annual Distribution Requirements. In order to qualify as a REIT, we are required to distribute dividends (other than capital gain dividends) to our stockholders annually in an amount at least equal to:
- (1)
- the
sum of:
- (a)
- 90%
of our "real estate investment trust taxable income" (computed without regard to the dividends paid deduction and our net capital gain); and
- (b)
- 90%
of the net income, if any (after tax), from foreclosure property; minus
- (2)
- the excess of certain items of non-cash income over 5% of our real estate investment trust taxable income.
In addition, if we dispose of any asset we acquired from a corporation which is or has been a C corporation in a transaction in which our basis in the asset is determined by reference to the basis of the asset in the hands of that C corporation, within the ten-year period following our acquisition of such asset, we would be required to distribute at least 90% of the after-tax gain, if any, we recognized on the disposition of the asset, to the extent that gain does not exceed the excess of (a) the fair market value of the asset on the date we acquired the asset over (b) our adjusted basis in the asset on the date we acquired the asset.
We must pay these annual distributions (1) in the taxable year to which they relate or (2) in the following year if (i) we pay these distributions during January to stockholders of record in either October, November, or December of the prior year or (ii) we elect to declare the dividend before the due date of the tax return (including extensions) and pay on or before the first regular dividend payment date after such declaration.
Amounts distributed must not be preferential; that is, every stockholder of the class of stock with respect to which a distribution is made must be treated the same as every other stockholder of that class, and no class of stock may be treated otherwise than in accordance with its dividend rights as a class.
To the extent that we do not distribute all of our net long term capital gain or distribute at least 90% but less than 100%, of our "real estate investment trust taxable income," as adjusted, we will be subject to tax on such amounts at regular corporate tax rates. Furthermore, if we should fail to distribute during each calendar year (or, in the case of distributions with declaration and record dates in the last three months of the calendar year, by the end of the following January) at least the sum of:
- (1)
- 85%
of our real estate investment trust ordinary income for such year,
- (2)
- 95%
of our real estate investment trust capital gain net income for such year, and
- (3)
- 100% of taxable income from prior periods less 100% of distributions from prior periods
We would be subject to a 4% excise tax on the excess of such required distributions over the amounts actually distributed. Any real estate investment trust taxable income and net capital gain on which this excise tax is imposed for any year is treated as an amount distributed during that year for purposes of calculating such tax.
We intend to make timely distributions sufficient to satisfy these annual distribution requirements and to avoid the imposition of the 4% excise tax.
Failure to Qualify. If we fail to qualify for taxation as a REIT in any taxable year, and certain relief provisions do not apply, we will be subject to tax (including any applicable alternative minimum
16
tax) on our taxable income at regular corporate rates. Distributions to stockholders in any year in which we fail to qualify as a REIT will not be deductible by us, nor will any distributions be required to be made. Unless entitled to relief under specific statutory provisions, we will also be disqualified from re-electing our REIT status for the four taxable years following the year during which qualification was lost. It is not possible to state whether we would be entitled to the statutory relief in all circumstances. Failure to qualify as a REIT for even one year could substantially reduce distributions to stockholders and could result in our incurring substantial indebtedness (to the extent borrowings are feasible) or liquidating substantial investments in order to pay the resulting taxes.
State and local taxation. We may be subject to state or local taxation in various state or local jurisdictions, including those in which we transact business or reside. The state and local tax treatment of our Company may not conform to the federal income tax consequences discussed above.
Investor Information
We make available to the public free of charge through our internet website our Annual Report on Form 10-K, Quarterly Reports on Form 10-Q, Current Reports on Form 8-K, and amendments to those reports filed or furnished pursuant to Section 13(a) or 15(d) of the Securities Exchange Act of 1934, as amended, as soon as reasonably practicable after we electronically file such reports with, or furnish such reports to, the Securities and Exchange Commission (or SEC). Our internet website address is www.LTCProperties.com. We are not including the information contained on our website as part of, or incorporating it by reference into, this Annual Report on Form 10-K.
Posted on our website www.LTCProperties.com under the "Corporate Governance" heading are our Audit Committee, Compensation Committee and Nominating and Corporate Governance Committee Charters, our Corporate Governance Policies, and a Code of Business Conduct, Ethics and Corporate Governance governing our directors, officers and employees. Within the time period required by the SEC and the New York Stock Exchange (or NYSE), we will post on our website any amendment to the Code of Business Conduct, Ethics and Corporate Governance and any waiver applicable to our Principal Executive Officer, Principal Financial Officer, Principal Accounting Officer or Directors. In addition, our website under the heading "SEC Filings" ""includes information concerning purchases and sales of our equity securities by our executive officers and directors.
You may read and copy materials that we file with the SEC at the SEC's Public Reference Room at 100 F Street, N.E., Washington D.C. 20549. Information on the operation of the Public Reference Room is available by calling the SEC at 1-800-SEC-0330. The SEC maintains an Internet site that contains reports, proxy statements and other information we file. The address of the SEC website is www.sec.gov.
You also may contact our Investor Relations Department at:
LTC
Properties, Inc.
2829 Townsgate Road, Suite 350
Westlake Village, California 91361
Attn: Investor Relations
(805) 981-8655
The following discussion of risk factors contains "forward-looking statements" as discussed above. These risk factors may be important to understanding any statement in this Annual Report on Form 10-K or elsewhere. The following information should be read in conjunction with Management's Discussion and Analysis, and the consolidated financial statements and related notes in this Annual Report on Form 10-K.
17
A Failure to Maintain or Increase our Dividend Could Reduce the Market Price of Our Stock. In January 2011, we declared a $0.14 per share monthly dividend for the first quarter of calendar 2011. During January through October of 2010 and calendar 2009, we paid a $0.13 monthly dividend on our common stock. In November and December of 2010, we paid $0.14 monthly dividends on our common stock which is a 7.7% increase. The ability to maintain or raise our common dividend is dependent, to a large part, on growth of funds available for distribution. This growth in turn depends upon increased revenues from additional investments and loans, rental increases and mortgage rate increases.
At Times, We May Have Limited Access to Capital Which Will Slow Our Growth. A REIT is required to make dividend distributions and retains little cash flow for growth. As a result, growth for a REIT is generally through the steady investment of new capital in real estate assets. There may be times when we will have limited access to capital from the equity and/or debt markets. During such periods, virtually all of our available capital would be required to meet existing commitments and to reduce existing debt. We may not be able, during such periods, to obtain additional equity and/or debt capital or dispose of assets on favorable terms, if at all, at the time we require additional capital to acquire health care properties on a competitive basis or meet our obligations. We believe that our low debt levels, $72.3 million available under our $110.0 million Unsecured Credit Agreement, $50 million available under the uncommitted private shelf agreement with Prudential, $64.6 million available under our Amended Equity Distribution Agreement to issue and sell, from time to time, up to $85.7 million in aggregate offering price of our common shares, $276.3 million available to issue debt and/or equity securities under our effective shelf registration and $6.9 million cash balance at December 31, 2010, will enable us to meet our obligations and continue to make investments. Subsequent to December 31, 2010, we repaid $4.2 million under our Unsecured Credit Agreement. After this payment, we had $33.5 million outstanding under the Unsecured Credit Agreement and $76.5 million available for borrowing.
Income and Returns from Health Care Facilities Can be Volatile. The possibility that the health care properties in which we invest will not generate income sufficient to meet operating expenses, will generate income and capital appreciation, if any, at rates lower than those anticipated or will yield returns lower than those available through investments in comparable real estate or other investments are additional risks of investing in health care related real estate. Income from properties and yields from investments in such properties may be affected by many factors, including changes in governmental regulation (such as zoning laws and government payment), general or local economic conditions (such as fluctuations in interest rates and employment conditions), the available local supply of and demand for improved real estate, a reduction in rental income as the result of an inability to maintain occupancy levels, natural disasters (such as hurricanes, earthquakes and floods) or similar factors.
We Depend on Lease Income and Mortgage Payments from Real Property. Approximately 97% of our revenue for the year ended December 31, 2010, was derived from lease income and mortgage payments from real property. Our revenue would be adversely affected if a significant number of our borrowers or lessees were unable to meet their obligations to us or if we were unable to lease our properties or make mortgage loans on economically favorable terms. There can be no assurance that any lessee will exercise its option to renew its lease upon the expiration of the initial term or that if such failure to renew were to occur, we could lease the property to others on favorable terms.
We Rely on a Few Major Operators. Extendicare REIT and Assisted Living Concepts, Inc. (or ALC), collectively lease 37 assisted living properties with a total of 1,427 units owned by us representing approximately 10.3%, or $57.6 million, of our total assets at December 31, 2010. Brookdale Senior Living Communities, Inc., (or Brookdale Communities), formerly known as Alterra Healthcare Corporation, a wholly owned subsidiary of Brookdale Senior Living, Inc., leases 35 assisted living properties with a total of 1,416 units owned by us representing approximately 10.2%, or
18
$57.4 million, of our total assets at December 31, 2010. Preferred Care, Inc. (or Preferred Care), through various wholly owned subsidiaries, operates 30 skilled nursing properties and two other senior housing properties that we own or on which we hold mortgages secured by first trust deeds. These properties consist of a total of 3,861 skilled nursing beds and 49 assisted living units. This represents approximately 10.5% or $58.7 million of our total assets at December 31, 2010. Our financial position and ability to make distributions may be adversely affected by financial difficulties experienced by any of our other lessees and borrowers, including bankruptcies, inability to emerge from bankruptcy, insolvency or general downturn in business of any such operator, or in the event any such operator does not renew and/or extend its relationship with us or our borrowers when it expires.
Our Borrowers and Lessees Face Competition in the Health Care Industry. The long term care industry is highly competitive and we expect that it may become more competitive in the future. Our borrowers and lessees are competing with numerous other companies providing similar long term care services or alternatives such as home health agencies, hospices, life care at home, community-based service programs, retirement communities and convalescent centers. There can be no assurance that our borrowers and lessees will not encounter increased competition in the future which could limit their ability to attract residents or expand their businesses and therefore affect their ability to make their debt or lease payments to us.
The Health Care Industry is Heavily Regulated by the Government. Our borrowers and lessees who operate health care facilities are subject to extensive regulation by federal, state and local governments. These laws and regulations are subject to frequent and substantial changes resulting from legislation, adoption of rules and regulations, and administrative and judicial interpretations of existing law. These changes may have a dramatic effect on the definition of permissible or impermissible activities, the relative costs associated with doing business and the amount of reimbursement by both government and other third-party payors. These changes may be applied retroactively. The ultimate timing or effect of these changes cannot be predicted. The failure of any borrower of funds from us or lessee of any of our properties to comply with such laws, requirements and regulations could affect its ability to operate its facility or facilities and could adversely affect such borrower's or lessee's ability to make debt or lease payments to us.
Congress and the States Have Enacted Health Care Cost Containment Measures. The health care industry continues to face various challenges, including increased government and private payor pressure on health care providers to control costs. Certain of these initiatives have had the result of limiting Medicare and Medicaid reimbursement for nursing facility services. In particular, the establishment of a Medicare prospective payment system for skilled nursing facility services to replace the cost-based reimbursement system significantly reduced Medicare reimbursement to skilled nursing facility providers. While Congress subsequently took steps to mitigate the impact of the prospective payment system on skilled nursing facilities, other federal legislative and regulatory policies have been adopted and may continue to be proposed that would reduce Medicare and/or Medicaid payments to nursing facilities. Moreover, states are facing increasing budget pressures in light of the current economic conditions, prompting consideration and in some cases adoption of cuts in state Medicaid payments to providers. No assurances can be given that any additional Medicare or Medicaid legislation or regulatory policies adopted by the federal government or the states would not reduce Medicare or Medicaid reimbursement to nursing facilities or result in additional costs for operators of nursing facilities.
Congress also has given states greater flexibility to expand access to home and community based services as an alternative to nursing facility services. These provisions could further increase state funding for home and community based services, while prompting states to cut funding for nursing facilities and homes for persons with disabilities. In light of continuing state Medicaid program reforms, budget cuts, and regulatory initiatives, no assurance can be given that the implementation of such
19
regulations and reforms will not have a material adverse effect on the financial condition or results of operations of our lessees and/or borrowers which, in turn, could affect their ability to meet their contractual obligations to us.
In March 2010, the President signed into law the Patient Protection and Affordable Care Act, which subsequently was amended by the Health Care and Education and Reconciliation Act of 2010 (collectively referred to as the "Affordable Care Act"). The Affordable Care Act is designed to expand access to affordable health insurance, contain health care costs, and institute a variety of health policy reforms. The provisions of the sweeping law may affect us directly, as well as impact our lessees and borrowers. While certain provisions, such as expanding the insured population, may positively impact the revenues of our lessees and borrowers, other provisions, particularly those intended to reduce federal health care spending, could have a negative impact on our lessees and borrowers. Among other things, the Affordable Care Act: reduces Medicare skilled nursing facility reimbursement by a so-called "productivity adjustment" based on economy-wide productivity gains beginning in fiscal year 2012; requires the development of a value-based purchasing program for Medicare skilled nursing facility services; establishes a national voluntary pilot program to bundle Medicare payments for hospital and post-acute services that could lead to changes in the delivery of post-acute services; and provides incentives to state Medicaid programs to promote community-based care as an alternative to institutional long-term care services. The Affordable Care Act also includes provisions intended to expand public disclosure about nursing home ownership and operations, institute mandatory compliance and quality assurance programs, increase penalties for noncompliance, and expand fraud and abuse enforcement and penalty provisions that could impact our operators. In addition, the Affordable Care Act impacts both us and our lessees and borrowers as employers, including new requirements related to the health insurance we offer to our respective employees. Many aspects of the Affordable Care Act are being implemented through new regulations and subregulatory guidance. We cannot predict at this time what effect, if any, the various provisions of the Affordable Care Act will have on our lessees and borrowers or our business. There can be no assurances, however, that the Affordable Care Act will not adversely impact the operations, cash flows or financial condition of our lessees and borrowers, which subsequently could materially adversely impact our revenue and operations.
In addition, comprehensive reforms affecting the payment for and availability of health care services have been proposed at the state level and adopted by certain states. Congress and state legislatures can be expected to continue to review and assess alternative health care delivery systems and payment methodologies. Changes in the law, new interpretations of existing laws, or changes in payment methodologies may have a dramatic effect on the definition of permissible or impermissible activities, the relative costs associated with doing business and the amount of reimbursement by the government and other third party payors.
Our Borrowers and Lessees Rely on Government and Third Party Reimbursement. The ability of our borrowers and lessees to generate revenue and profit determines the underlying value of that property to us. Revenues of our borrowers and skilled nursing property lessees are generally derived from payments for patient care. Sources of such payments include the federal Medicare program, state Medicaid programs, private insurance carriers, health care service plans, health maintenance organizations, preferred provider arrangements, self-insured employers, as well as the patients themselves.
We Could Incur More Debt. We operate with a policy of incurring debt when, in the opinion of our Board of Directors, it is advisable. We may incur additional debt by borrowing under our Unsecured Credit Agreement or the uncommitted private shelf agreement with Prudential, mortgaging properties we own and/or issuing debt securities in a public offering or in a private transaction. Accordingly, we could become more highly leveraged. The degree of leverage could have important consequences to stockholders, including affecting our ability to obtain, in the future, additional
20
financing for working capital, capital expenditures, acquisitions, development or other general corporate purposes and making us more vulnerable to a downturn in business or the economy generally.
We Could Fail to Collect Amounts Due Under Our Straight-line Rent Receivable Asset. Straight-line accounting requires us to calculate the total rent we will receive as a fixed amount over the life of the lease and recognize that revenue evenly over that life. In a situation where a lease calls for fixed rental increases during the life of the lease, rental income recorded in the early years of a lease is higher than the actual cash rent received which creates an asset on the consolidated balance sheet called straight-line rent receivable. At some point during the lease, depending on the rent levels and terms, this reverses and the cash rent payments received during the later years of the lease are higher than the rental income recognized which reduces the straight-line rent receivable balance to zero by the end of the lease. We periodically assess the collectability of the straight-line rent receivable. If during our assessment we determined that we were unlikely to collect a portion or the entire straight-line rent receivable asset, we may provide a reserve against the previously recognized straight-line rent receivable asset for a portion or up to its full value that we estimate may not be recoverable.
Our Assets May be Subject to Impairment Charges. We periodically but not less than quarterly evaluate our real estate investments and other assets for impairment indicators. The judgment regarding the existence of impairment indicators is based on factors such as market conditions, operator performance and legal structure. If we determine that a significant impairment has occurred, we would be required to make an adjustment to the net carrying value of the asset which could have a material adverse affect on our results of operations and a non-cash impact on funds from operations in the period in which the write-off occurs.
A Failure to Reinvest Cash Available to Us Could Adversely Affect Our Future Revenues and Our Ability to Increase Dividends to Stockholders; There is Considerable Competition in Our Market for Attractive Investments. From time to time, we will have cash available from (1) proceeds of sales of shares of securities, (2) proceeds from new debt issuances, (3) principal payments on our mortgages and other investments, (4) sale of properties, and (5) funds from operations. We may reinvest this cash in health care investments and in accordance with our investment policies, repay outstanding debt or invest in qualified short term or long term investments. We compete for real estate investments with a broad variety of potential investors. The competition for attractive investments negatively affects our ability to make timely investments on acceptable terms. Delays in acquiring properties or making loans will negatively impact revenues and perhaps our ability to increase distributions to our stockholders.
Our Failure to Qualify as a REIT Would Have Serious Adverse Consequences to Our Stockholders. We intend to operate so as to qualify as a REIT under the Code. We believe that we have been organized and have operated in a manner which would allow us to qualify as a REIT under the Code beginning with our taxable year ended December 31, 1992. However, it is possible that we have been organized or have operated in a manner which would not allow us to qualify as a REIT, or that our future operations could cause us to fail to qualify. Qualification as a REIT requires us to satisfy numerous requirements (some on an annual and quarterly basis) established under highly technical and complex Code provisions for which there are only limited judicial and administrative interpretations, and involves the determination of various factual matters and circumstances not entirely within our control. For example, in order to qualify as a REIT, at least 95% of our gross income in any year must be derived from qualifying sources, and we must pay dividends to stockholders aggregating annually at least 90% (95% for taxable years ending prior to January 1, 2001) of our REIT taxable income (determined without regard to the dividends paid deduction and by excluding capital gains). Legislation, new regulations, administrative interpretations or court decisions could significantly change the tax laws with respect to qualification as a REIT or the federal income tax consequences of such qualification.
21
If we fail to qualify as a REIT in any taxable year, we will be subject to federal income tax (including any applicable alternative minimum tax) on our taxable income at regular corporate rates. Unless we are entitled to relief under statutory provisions, we would be disqualified from treatment as a REIT for the four taxable years following the year during which we lost qualification. If we lose our REIT status, our net earnings available for investment or distribution to stockholders would be significantly reduced for each of the years involved. In addition, we would no longer be required to make distributions to stockholders.
Provisions in Our Articles of Incorporation May Limit Ownership of Shares of Our Capital Stock. In order for us to qualify as a REIT, no more than 50% in value of the outstanding shares of our stock may be beneficially owned, directly or indirectly, by five or fewer individuals at any time during the last half of each taxable year. To ensure qualification under this test, our articles of incorporation provide that, subject to exceptions, no person may beneficially own more than 9.8% of outstanding shares of any class or series of our stock, including our common stock. Our Board of Directors may exempt a person from the 9.8% ownership limit upon such conditions as the Board of Directors may direct. However, our Board of Directors may not grant an exemption from the 9.8% ownership limit if it would result in the termination of our status as a REIT. Shares of capital stock in excess of 9.8% ownership limitation that lack an applicable exemption may lose rights to dividends and voting, and may be subject to redemption. As a result of the limitations on ownership set forth in our Articles of Incorporation, acquisition of any shares of capital stock that would result in our disqualification as a REIT may be limited or void. The 9.8% ownership limitation also may have the effect of delaying, deferring, or preventing a change in control of us, including an extraordinary transaction (such as a merger, tender offer or sale of all or substantially all of our assets) that might provide a premium price for holders of our capital stock.
Our Real Estate Investments are Relatively Illiquid. Real estate investments are relatively illiquid and, therefore, tend to limit our ability to vary our portfolio promptly in response to changes in economic or other conditions. All of our properties are "special purpose" properties that cannot be readily converted to general residential, retail or office use. Health care facilities that participate in Medicare or Medicaid must meet extensive program requirements, including physical plant and operational requirements, which are revised from time to time. Such requirements may include a duty to admit Medicare and Medicaid patients, limiting the ability of the facility to increase its private pay census beyond certain limits. Medicare and Medicaid facilities are regularly inspected to determine compliance, and may be excluded from the programs—in some cases without a prior hearing—for failure to meet program requirements. Transfers of operations of nursing homes and other healthcare-related facilities are subject to regulatory approvals not required for transfers of other types of commercial operations and other types of real estate. Thus, if the operation of any of our properties becomes unprofitable due to competition, age of improvements or other factors such that our lessee or borrower becomes unable to meet its obligations on the lease or mortgage loan, the liquidation value of the property may be substantially less than the net book value or the amount owing on any related mortgage loan, than would be the case if the property were readily adaptable to other uses. The receipt of liquidation proceeds or the replacement of an operator that has defaulted on its lease or loan could be delayed by the approval process of any federal, state or local agency necessary for the transfer of the property or the replacement of the operator with a new operator licensed to manage the facility. In addition, certain significant expenditures associated with real estate investment, such as real estate taxes and maintenance costs, are generally not reduced when circumstances cause a reduction in income from the investment. Should such events occur, our income and cash flows from operations would be adversely affected.
Our Remedies May Be Limited When Mortgage Loans Default. To the extent we invest in mortgage loans, such mortgage loans may or may not be recourse obligations of the borrower and generally will not be insured or guaranteed by governmental agencies or otherwise. In the event of a default under
22
such obligations, we may have to foreclose on the property underlying the mortgage or protect our interest by acquiring title to a property and thereafter make substantial improvements or repairs in order to maximize the property's investment potential. Borrowers may contest enforcement of foreclosure or other remedies, seek bankruptcy protection against such enforcement and/or bring claims for lender liability in response to actions to enforce mortgage obligations. If a borrower seeks bankruptcy protection, the Bankruptcy Court may impose an automatic stay that would preclude us from enforcing foreclosure or other remedies against the borrower. Declines in the value of the property may prevent us from realizing an amount equal to our mortgage loan upon foreclosure.
We are Subject to Risks and Liabilities in Connection with Properties Owned Through Limited Liability Companies and Partnerships. We have ownership interests in limited liability companies and/or partnerships. We may make additional investments through these ventures in the future. Partnership or limited liability company investments may involve risks such as the following:
- •
- our partners or co-members might become bankrupt (in which event we and any other remaining general partners
or members would generally remain liable for the liabilities of the partnership or limited liability company);
- •
- our partners or co-members might at any time have economic or other business interests or goals which are
inconsistent with our business interests or goals;
- •
- our partners or co-members may be in a position to take action contrary to our instructions, requests,
policies or objectives, including our policy with respect to maintaining our qualification as a REIT; and
- •
- agreements governing limited liability companies and partnerships often contain restrictions on the transfer of a member's or partner's interest or "buy-sell" or other provisions which may result in a purchase or sale of the interest at a disadvantageous time or on disadvantageous terms.
We will, however, generally seek to maintain sufficient control of our partnerships and limited liability companies to permit us to achieve our business objectives. Our organizational documents do not limit the amount of available funds that we may invest in partnerships or limited liability companies. The occurrence of one or more of the events described above could have a direct and adverse impact on us.
Item 1B. UNRESOLVED STAFF COMMENTS
None.
23
Investment Portfolio
Our real estate investment in senior housing and long term care healthcare properties is managed and conducted as a single operating segment for internal reporting and for internal decision-making purposes. The following table summarizes our real estate investment portfolio as of December 31, 2010 (dollar amounts in thousands):
| |
|
|
Twelve Months Ended December 31, 2010 |
|
|
Number of | ||||||||||||||||||||||
|---|---|---|---|---|---|---|---|---|---|---|---|---|---|---|---|---|---|---|---|---|---|---|---|---|---|---|---|---|
Type of Property
|
Gross Investments |
Percentage of Investments |
Rental Income(1) |
Interest Income(2) |
Percentage of Revenues(3) |
Number of Properties(4) |
SNF Beds |
ALF Units |
ILF Units |
|||||||||||||||||||
Assisted Living |
$ | 309,129 | 45.8 | % | $ | 30,402 | $ | 2,796 | 45.6 | % | 103 | — | 4,530 | — | ||||||||||||||
Skilled Nursing |
298,734 | 44.2 | % | 28,511 | 4,219 | 44.9 | % | 89 | 10,212 | — | — | |||||||||||||||||
Other Senior Housing(5) |
55,640 | 8.2 | % | 5,242 | 390 | 7.7 | % | 12 | 795 | 290 | 370 | |||||||||||||||||
Schools(6) |
12,170 | 1.8 | % | 1,201 | 77 | 1.8 | % | 2 | N/A | N/A | N/A | |||||||||||||||||
Totals |
$ | 675,673 | 100.0 | % | $ | 65,356 | $ | 7,482 | 100.0 | % | 206 | 11,007 | 4,820 | 370 | ||||||||||||||
- (1)
- Includes
Rental Income from properties classified as held-for-sale.
- (2)
- Includes
Interest Income from Mortgage Loans.
- (3)
- Includes
Rental Income and Interest Income from Mortgage Loans.
- (4)
- We
have investments in 30 states leased or mortgaged to 40 different operators.
- (5)
- Other
senior housing properties consist of independent living properties and properties providing any combination of skilled nursing, assisted living and/or
independent living services.
- (6)
- During the year end December 31, 2010, we acquired a school property located in Minnesota via deed-in-lieu of foreclosure as a result of the borrower filing for Chapter 7 bankruptcy. The property has been classified as held-for-sale and we are actively marketing to sell it.
As of December 31, 2010 we had $516.0 million in carrying value of net real estate investments, consisting of $457.0 million or 88.6% invested in owned and leased properties and $59.0 million or 11.4% invested in mortgage loans secured by first mortgages.
Skilled nursing facilities provide restorative, rehabilitative and nursing care for people not requiring the more extensive and sophisticated treatment available at acute care hospitals. Many skilled nursing facilities provide ancillary services that include occupational, speech, physical, respiratory and IV therapies, as well as sub-acute care services which are paid either by the patient, the patient's family, private health insurance, or through the federal Medicare or state Medicaid programs.
Assisted living facilities serve elderly persons who require assistance with activities of daily living, but do not require the constant supervision skilled nursing facilities provide. Services are usually available 24 hours a day and include personal supervision and assistance with eating, bathing, grooming and administering medication. The facilities provide a combination of housing, supportive services, personalized assistance and health care designed to respond to individual needs.
Independent living facilities, also known as retirement communities or senior apartments, offer a sense of community and various levels of service, such as laundry, housekeeping, dining options/meal plans, exercise and wellness programs, transportation, social, cultural and recreational activities, on-site
24
security and emergency response programs. Many offer on-site conveniences like beauty/barber shops, fitness facilities, game rooms, libraries and activity centers.
One property in our real estate investment portfolio is a charter school. Charter schools provide an alternative to the traditional public school. Charter schools are generally autonomous entities authorized by the state or locality to conduct operations independent from the surrounding public school district. Laws vary by state, but generally charters are granted by state boards of education either directly or in conjunction with local school districts or public universities. Operators are granted charters to establish and operate schools based on the goals and objectives set forth in the charter. Upon receipt of a charter, schools receive an annuity from the state for each student enrolled. The other school in our real estate investment portfolio was a private school and is closed and has been classified as held-for-sale. The closed school was acquired via deed-in-lieu of foreclosure after the borrower ceased operations and filed for bankruptcy. We are actively marketing to sell this property.
Owned Properties. The following table summarizes our investment in owned properties at December 31, 2010 (in thousands):
| |
|
|
|
Number of | |
|||||||||||||||||
|---|---|---|---|---|---|---|---|---|---|---|---|---|---|---|---|---|---|---|---|---|---|---|
Type of Property
|
Gross Investments |
Percentage of Investments |
Number of Properties(1) |
SNF Beds |
ALF Units |
ILF Units |
Investment per Bed/Unit |
|||||||||||||||
Assisted Living |
$ | 284,926 | 46.3 | % | 88 | — | 3,941 | — | $ | 72.30 | ||||||||||||
Skilled Nursing |
266,231 | 43.2 | % | 61 | 7,005 | — | — | $ | 38.01 | |||||||||||||
Other Senior Housing(2) |
52,339 | 8.5 | % | 11 | 696 | 216 | 370 | $ | 40.83 | |||||||||||||
Schools |
12,170 | 2.0 | % | 2 | N/A | N/A | N/A | N/A | ||||||||||||||
Totals |
$ | 615,666 | 100.0 | % | 162 | 7,701 | 4,157 | 370 | ||||||||||||||
- (1)
- We
have investments in 25 states leased to 27 different operators.
- (2)
- Other senior housing properties consist of independent living properties and properties providing any combination of skilled nursing, assisted living and/or independent living services.
Owned properties are leased pursuant to non-cancelable operating leases generally with an initial term of 10 to 15 years. Many of the leases contain renewal options and one contains limited period options that permit the operator to purchase the property. The leases provide for fixed minimum base rent during the initial and renewal periods. The majority of our leases contain provisions for specified annual increases over the rents of the prior year and that increase is generally computed in one of four ways depending on specific provisions of each lease:
- (i)
- a
specified percentage increase over the prior year's rent, generally between 2.0% and 3.0%;
- (ii)
- a
calculation based on the Consumer Price Index;
- (iii)
- as
a percentage of facility net patient revenues in excess of base amounts or
- (iv)
- specific dollar increases.
Each lease is a triple net lease which requires the lessee to pay all taxes, insurance, maintenance and repairs, capital and non-capital expenditures and other costs necessary in the operations of the facilities. Generally our leases provide for one or more of the following: security deposits, property tax impounds, and credit enhancements such as corporate or personal guarantees or letters of credit. In addition, our leases are typically structured as master leases and multiple master leases with one operator are generally cross defaulted. See Item 8. FINANCIAL STATEMENTS—NOTE 6. Real Estate Investments for further descriptions.
25
The following table sets forth certain information regarding our owned properties as of December 31, 2010 (dollars in thousands):
Location
|
No. of SNFs |
No. of ALFs |
No. of Others(5) |
No. of Schools |
No. of Beds/Units(1) |
Encumbrances | Remaining Lease Term(2) |
Gross Investment |
|||||||||||||||||
|---|---|---|---|---|---|---|---|---|---|---|---|---|---|---|---|---|---|---|---|---|---|---|---|---|---|
Alabama |
2 | — | 2 | — | 459 | $ | — | 58 | $ | 18,466 | |||||||||||||||
Arizona |
5 | 2 | — | — | 1,029 | — | 87 | 41,211 | |||||||||||||||||
California |
1 | 2 | — | — | 343 | — | 70 | 30,839 | |||||||||||||||||
Colorado |
3 | 6 | 1 | — | 582 | — | 120 | 27,805 | |||||||||||||||||
Florida |
2 | 8 | 3 | — | 1,058 | — | 116 | 60,567 | |||||||||||||||||
Georgia |
2 | — | 1 | — | 300 | — | 50 | 6,600 | |||||||||||||||||
Idaho |
— | 4 | — | — | 148 | — | 48 | 9,756 | |||||||||||||||||
Indiana |
— | 3 | — | — | 140 | — | 76 | 9,561 | |||||||||||||||||
Iowa |
6 | 1 | 1 | — | 616 | — | 122 | 17,422 | |||||||||||||||||
Kansas |
3 | 4 | — | — | 398 | — | 125 | 19,601 | |||||||||||||||||
Minnesota |
— | — | — | 1 | — | — | — | 2,900 | |||||||||||||||||
Mississippi |
— | 1 | — | — | 62 | — | 118 | 9,400 | |||||||||||||||||
Nebraska |
— | 4 | — | — | 156 | — | 48 | 9,332 | |||||||||||||||||
New Jersey |
— | 1 | — | 1 | 39 | — | 63 | 12,195 | |||||||||||||||||
New Mexico |
7 | — | — | — | 860 | — | 94 | 48,876 | |||||||||||||||||
N. Carolina |
— | 5 | — | — | 210 | — | 120 | 13,096 | |||||||||||||||||
Ohio |
6 | 11 | — | — | 737 | — | 62 | 56,804 | |||||||||||||||||
Oklahoma |
— | 6 | — | — | 221 | — | 120 | 12,315 | |||||||||||||||||
Oregon |
1 | 3 | — | — | 218 | — | 53 | 11,927 | |||||||||||||||||
Pennsylvania |
— | 3 | — | — | 199 | — | 117 | 17,662 | |||||||||||||||||
S. Carolina |
— | 3 | — | — | 128 | — | 120 | 7,610 | |||||||||||||||||
Tennessee |
2 | — | — | — | 142 | — | 94 | 3,075 | |||||||||||||||||
Texas |
17 | 13 | 2 | — | 3,184 | — | 106 | 112,490 | |||||||||||||||||
Virginia |
3 | — | 1 | — | 568 | — | 169 | 29,052 | |||||||||||||||||
Washington |
1 | 8 | — | — | 431 | 3,730 | 50 | 27,104 | |||||||||||||||||
TOTAL |
61 | 88 | 11 | 2 | 12,228 | $ | 3,730 | (3) | 94 | $ | 615,666 | (4) | |||||||||||||
- (1)
- See
Item 1. Business General—Owned Properties for discussion of bed/unit count.
- (2)
- Weighted
average remaining months in lease term as of December 31, 2010.
- (3)
- Consists
of $3,730 of tax-exempt bonds secured by five assisted living properties in Washington with 188 units. As of December 31, 2010
our gross investment in properties encumbered by these bonds was $11,280.
- (4)
- Of
the total, $284,926 relates to investments in assisted living properties, $266,231 relates to investments in skilled nursing properties, $52,339 relates
to investments in other senior housing properties, and $12,170 relates to investments in two schools.
- (5)
- Other represents other senior housing properties consisting of independent living properties and properties providing any combination of skilled nursing, assisted living and/or independent living services.
26
Mortgage Loans. The following table summarizes our investments in mortgage loans secured by first mortgages at December 31, 2010 (in thousands):
| |
|
|
|
|
Number of | |
|||||||||||||||||||
|---|---|---|---|---|---|---|---|---|---|---|---|---|---|---|---|---|---|---|---|---|---|---|---|---|---|
Type of Property
|
Gross Investments |
Percentage of Investments |
Number of Loans |
Number of Properties(1) |
SNF Beds |
ALF Units |
ILF Units |
Investment per Bed/Unit |
|||||||||||||||||
Assisted Living |
$ | 24,203 | 40.3 | % | 10 | 15 | — | 589 | — | $ | 41.09 | ||||||||||||||
Skilled Nursing |
32,503 | 54.2 | % | 23 | 28 | 3,207 | — | — | $ | 10.14 | |||||||||||||||
Other Senior Housing(2) |
3,301 | 5.5 | % | 1 | 1 | 99 | 74 | — | $ | 19.08 | |||||||||||||||
Totals |
$ | 60,007 | 100.0 | % | 34 | 44 | 3,306 | 663 | — | ||||||||||||||||
- (1)
- We
have investments in 12 states that include mortgages to 16 different operators.
- (2)
- Other senior housing properties consist of independent living properties and properties providing any combination of skilled nursing, assisted living and/or independent living services.
In general, the mortgage loans may not be prepaid except in the event of the sale of the collateral property to a third party that is not affiliated with the borrower, although partial prepayments (including the prepayment premium) are often permitted where a mortgage loan is secured by more than one property upon a sale of one or more, but not all, of the collateral properties to a third party which is not an affiliate of the borrower. The terms of the mortgage loans generally impose a premium upon prepayment of the loans depending upon the period in which the prepayment occurs, whether such prepayment was permitted or required, and certain other conditions such as upon the sale of the property under a pre-existing purchase option, destruction or condemnation, or other circumstances as approved by us. On certain loans, such prepayment amount is based upon a percentage of the then outstanding balance of the loan, usually declining ratably each year. For other loans, the prepayment premium is based on a yield maintenance formula. In addition to a lien on the mortgaged property, the loans are generally secured by certain non-real estate assets of the properties and contain certain other security provisions in the form of letters of credit, pledged collateral accounts, security deposits, cross-default and cross-collateralization features and certain guarantees. See Item 8. FINANCIAL STATEMENTS—Note 6. Real Estate Investments for further description.
27
The following table sets forth certain information regarding our mortgage loans as of December 31, 2010 (dollars in thousands):
Location
|
No. of SNFs |
No. of ALFs |
No. of Other(4) |
No. of Beds/ Units(1) |
Interest Rate |
Average Months to Maturity |
Original Face Amount of Mortgage Loans |
Current Carrying Amount of Mortgage Loans |
Current Annual Debt Service(3) |
|||||||||||||||||||
|---|---|---|---|---|---|---|---|---|---|---|---|---|---|---|---|---|---|---|---|---|---|---|---|---|---|---|---|---|
California |
1 | — | 1 | 297 | 11.13%-11.18% | 36 | $ | 6,800 | $ | 3,761 | $ | 848 | ||||||||||||||||
Florida |
4 | 1 | — | 387 | 10.75%-14.33% | 22 | 11,360 | 9,899 | 1,458 | |||||||||||||||||||
Iowa |
— | 1 | — | 44 | 11.22% | 34 | 2,400 | 2,110 | 272 | |||||||||||||||||||
Missouri |
2 | — | — | 190 | 10.38%-10.85% | 87 | 3,000 | 4,050 | 642 | |||||||||||||||||||
Montana |
— | 1 | — | 34 | 13.95% | 34 | 2,346 | 2,144 | 326 | |||||||||||||||||||
Nebraska |
— | 4 | — | 163 | 11.22%-11.44% | 34 | 10,911 | 9,380 | 1,222 | |||||||||||||||||||
Oklahoma |
1 | — | — | 161 | 12.65% | 6 | 2,600 | 1,078 | 174 | |||||||||||||||||||
S. Dakota |
— | 1 | — | 34 | 11.22% | 34 | 2,346 | 2,064 | 266 | |||||||||||||||||||
Texas |
17 | 7 | — | 2,356 | 9.80%-13.20% | 37 | 37,605 | 21,813 | 4,773 | |||||||||||||||||||
Utah |
1 | — | — | 84 | 10.15% | 107 | 1,400 | 1,356 | 164 | |||||||||||||||||||
Washington |
1 | — | — | 104 | 13.25% | 70 | 1,700 | 961 | 235 | |||||||||||||||||||
Wisconsin |
1 | — | — | 115 | 11.00% | 74 | 2,200 | 1,324 | 273 | |||||||||||||||||||
TOTAL |
28 | 15 | 1 | 3,969 | 40 | $ | 84,668 | $ | 59,940 | (2) | $ | 10,653 | ||||||||||||||||
- (1)
- See
Item 1. Business General—Owned Properties for discussion of bed/unit count.
- (2)
- Of
the total current principal balance, $32,503 relates to investments in skilled nursing properties, $24,203 relates to investments in assisted living
properties and $3,301 relates to an investment in other senior housing properties. This balance is gross of a loan loss reserve of $981 and includes discounts and premiums related to loans acquired in
prior years totaling $67.
- (3)
- Includes
principal and interest payments.
- (4)
- Other represents other senior housing properties consisting of independent living properties and properties providing any combination of skilled nursing, assisted living and/or independent living services.
We are from time to time a party to various general and professional liability claims and lawsuits asserted against the lessees or borrowers of our properties, which in our opinion are not singularly or in the aggregate material to our results of operations or financial condition. These types of claims and lawsuits may include matters involving general or professional liability, which we believe under applicable legal principles are not our responsibility as a non-possessory landlord or mortgage holder. We believe that these matters are the responsibility of our lessees and borrowers pursuant to general legal principles and pursuant to insurance and indemnification provisions in the applicable leases or mortgages. We intend to continue to vigorously defend such claims.
Item 4. [REMOVED AND RESERVED]
28
Item 5. MARKET FOR THE REGISTRANT'S COMMON EQUITY, RELATED STOCKHOLDER MATTERS AND ISSUER PURCHASES OF EQUITY SECURITIES
Market Information
Our common stock is listed on the NYSE under the symbol "LTC". Set forth below are the high and low reported sale prices for our common stock as reported on the NYSE for each of the periods indicated.
| |
2010 | 2009 | |||||||||||
|---|---|---|---|---|---|---|---|---|---|---|---|---|---|
| |
High | Low | High | Low | |||||||||
First Quarter |
$ | 28.10 | $ | 24.52 | $ | 23.10 | $ | 15.74 | |||||
Second Quarter |
$ | 28.76 | $ | 23.13 | $ | 21.99 | $ | 17.22 | |||||
Third Quarter |
$ | 26.06 | $ | 22.91 | $ | 26.73 | $ | 19.13 | |||||
Fourth Quarter |
$ | 28.66 | $ | 25.37 | $ | 28.41 | $ | 22.50 | |||||
Holders of Record
As of December 31, 2010 we had approximately 340 stockholders of record of our common stock.
Dividend Information
We declared and paid total cash distributions on common stock as set forth below:
| |
Declared | Paid | |||||||||||
|---|---|---|---|---|---|---|---|---|---|---|---|---|---|
| |
2010 | 2009 | 2010 | 2009 | |||||||||
First Quarter |
$ | 0.39 | $ | 0.39 | $ | 0.39 | $ | 0.39 | |||||
Second Quarter |
$ | 0.39 | $ | 0.39 | $ | 0.39 | $ | 0.39 | |||||
Third Quarter |
$ | 0.39 | $ | 0.39 | $ | 0.39 | $ | 0.39 | |||||
Fourth Quarter |
$ | 0.41 | $ | 0.39 | $ | 0.41 | $ | 0.39 | |||||
|
$ | 1.58 | $ | 1.56 | $ | 1.58 | $ | 1.56 | |||||
We intend to distribute to our stockholders an amount at least sufficient to satisfy the distribution requirements of a REIT. Cash flows from operating activities available for distribution to stockholders will be derived primarily from interest and rental payments from our real estate investments. All distributions will be made subject to approval of our Board of Directors and will depend on our earnings, our financial condition and such other factors as our Board of Directors deem relevant. In order to qualify for the beneficial tax treatment accorded to REITs by Sections 856 through 860 of the Internal Revenue Code, we are required to make distributions to holders of our shares equal to at least 90% of our REIT taxable income. (See "Annual Distribution Requirements" beginning on page 14.)
Issuer Purchases of Equity Securities
Our Board of Directors authorized a share repurchase program enabling us to repurchase up to 5,000,000 shares of our equity securities, including common and preferred stock on the open market. This authorization does not expire until 5,000,000 shares of our equity securities have been repurchased or the Board of Directors terminates its authorization. During the fourth quarter ended December 31, 2010, we did not repurchase any of our outstanding common stock or preferred securities.
Since inception of our existing share repurchase program through December 31, 2010, we have repurchased on the open market (i) 893,979 shares of our common stock at an average cost of $21.01 per share, including fees and costs, for an aggregate purchase price including fees and costs paid of
29
$18,783,000 and (ii) 745,784 shares of our Series F preferred stock at an average cost of $21.83 per share, including fees and costs, for an aggregate purchase price including fees and costs paid of $16,277,000. We continue to have authorization to purchase on the open market an additional 3,360,237 shares of our equity securities.
Stock Performance Graph
The National Association of Real Estate Investment Trusts (or NAREIT), an organization representing U.S. REITs and publicly traded real estate companies, classifies a company with 75% or more of assets directly or indirectly in the equity ownership of real estate as an equity REIT. In 2010, our equity ownership of real estate assets was more than 75%.
This graph compares the cumulative total stockholder return on our common stock from December 31, 2005 to December 31, 2010 with the cumulative stockholder total return of (1) the Standard & Poor's 500 Stock Index and (2) the NAREIT Equity REIT Index. The comparison assumes $100 was invested on December 31, 2005 in our common stock and in each of the foregoing indices and assumes the reinvestment of dividends.
Total Return Performance
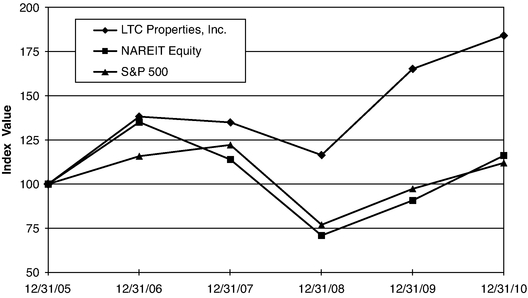
| |
Period Ending | ||||||||||||||||||
|---|---|---|---|---|---|---|---|---|---|---|---|---|---|---|---|---|---|---|---|
Index
|
12/31/05 | 12/31/06 | 12/31/07 | 12/31/08 | 12/31/09 | 12/31/10 | |||||||||||||
LTC Properties, Inc. |
100.00 | 138.18 | 134.89 | 116.41 | 165.18 | 184.09 | |||||||||||||
NAREIT Equity |
100.00 | 135.06 | 113.87 | 70.91 | 90.76 | 116.13 | |||||||||||||
S&P 500 |
100.00 | 115.79 | 122.16 | 76.96 | 97.33 | 111.99 | |||||||||||||
The stock performance depicted in the above graph is not necessarily indicative of future performance.
The stock performance graph shall not be deemed incorporated by reference into any filing by us under the Securities Act of 1933 or the Securities Exchange Act of 1934 except to the extent that we specifically incorporate such information by reference, and shall not otherwise be deemed filed under such Acts.
30
Item 6. SELECTED FINANCIAL DATA
The following table of selected financial information should be read in conjunction with our financial statements and related notes thereto included elsewhere in this Annual Report on Form 10-K.
| |
2010 | 2009 | 2008 | 2007 | 2006 | |||||||||||
|---|---|---|---|---|---|---|---|---|---|---|---|---|---|---|---|---|
| |
(In thousands, except per share amounts) |
|||||||||||||||
Operating Information: |
||||||||||||||||
Total revenues |
$ | 74,302 | $ | 69,376 | $ | 68,839 | $ | 74,304 | $ | 72,931 | ||||||
Income from continuing operations |
45,521 | 44,135 | 42,967 | 47,803 | 45,360 | |||||||||||
Income allocated to non-controlling interests |
191 | 296 | 307 | 343 | 343 | |||||||||||
Income allocated to participating securities |
230 | 139 | 159 | 219 | 447 | |||||||||||
Income allocated to preferred stockholders(7) |
16,045 | 14,515 | 14,401 | 16,923 | 17,157 | |||||||||||
Net income allocable to common stockholders |
29,587 | 29,410 | 28,417 | 30,613 | 61,184 | (3) | ||||||||||
Per share Information: |
||||||||||||||||
Net Income per Common Share from Continuing Operations Allocable to Common Stockholders: |
||||||||||||||||
Basic |
$ | 1.19 | $ | 1.26 | $ | 1.22 | $ | 1.31 | $ | 1.21 | ||||||
Diluted |
$ | 1.18 | $ | 1.26 | $ | 1.22 | $ | 1.29 | $ | 1.21 | ||||||
Net Income Per Common Share Allocable to Common Stockholders: |
||||||||||||||||
Basic |
$ | 1.21 | $ | 1.27 | $ | 1.24 | $ | 1.32 | $ | 2.64 | (3) | |||||
Diluted |
$ | 1.21 | $ | 1.27 | $ | 1.24 | $ | 1.31 | $ | 2.50 | (3) | |||||
Common Stock Distributions declared |
$ | 1.58 | $ | 1.56 | $ | 1.56 | $ | 1.50 | $ | 1.08 | (1) | |||||
Common Stock Distributions paid |
$ | 1.58 | $ | 1.56 | $ | 1.56 | $ | 1.50 | $ | 1.44 | ||||||
Balance Sheet Information: |
||||||||||||||||
Total assets |
$ | 561,264 | $ | 490,593 | $ | 506,053 | $ | 544,105 | $ | 567,767 | ||||||
Total debt(2) |
91,430 | (6) | 25,410 | (5) | 36,753 | (4) | 52,295 | 53,811 | ||||||||
- (1)
- Dividends
for the first quarter of 2006 were declared in the fourth quarter of 2005.
- (2)
- Includes
bank borrowings, senior unsecured notes, mortgage loans payable and bonds payable.
- (3)
- Higher
due to a gain of $32.6 million relating to four assisted living properties sold in 2006 and a $0.5 million gain recognized in 2006 from
the sale of our investment in common stock of another REIT.
- (4)
- Lower
due to the pay off during 2008 of a mortgage loan in the amount of $14.2 million secured by four assisted living properties located in Ohio.
- (5)
- Lower
due to the pay off during 2009 of three mortgage loans totaling $23.9 million secured by 11 assisted living properties located in various
states partially offset by outstanding bank borrowings in the amount of $13.5 million.
- (6)
- Increase due to the sale to Prudential of $50.0 million aggregate principal amount of the senior unsecured term notes and additional bank borrowing to fund real estate acquisitions in 2010.
31
- (7)
- Income allocated to preferred stockholders includes the following (dollar amounts in thousands):
| |
2010 | 2009 | 2008 | 2007 | 2006 | ||||||||||||
|---|---|---|---|---|---|---|---|---|---|---|---|---|---|---|---|---|---|
Preferred stock dividends |
$ | 13,662 | $ | 15,141 | $ | 15,390 | $ | 16,923 | $ | 17,157 | |||||||
Preferred stock redemption charge |
2,383 | — | — | — | — | ||||||||||||
Allocation of income from preferred stock buyback |
— | (626 | ) | (989 | ) | — | — | ||||||||||
Total income allocated to preferred stockholders |
$ | 16,045 | $ | 14,515 | $ | 14,401 | $ | 16,923 | $ | 17,157 | |||||||
32
Item 7. MANAGEMENT'S DISCUSSION AND ANALYSIS OF FINANCIAL CONDITION AND RESULTS OF OPERATIONS
Executive Overview
Business
We are a self-administered health care real estate investment trust (or REIT) that invests primarily in senior housing and long term care properties through mortgage loans, property lease transactions and other investments. We conduct and manage our business as one operating segment, rather than multiple operating segments, for internal reporting and internal decision making purposes. In 2010, senior housing and long term care properties, which include skilled nursing properties, assisted living properties, independent living properties, and combinations thereof comprised approximately 98% of our investment portfolio. The following table summarizes our real estate investment portfolio as of December 31, 2010 (dollar amounts in thousands):
| |
|
|
Twelve Months Ended December 31, 2010 |
|
|
Number of | ||||||||||||||||||||||
|---|---|---|---|---|---|---|---|---|---|---|---|---|---|---|---|---|---|---|---|---|---|---|---|---|---|---|---|---|
Type of Property
|
Gross Investments |
Percentage of Investments |
Rental Income(1) |
Interest Income(2) |
Percentage of Revenues(3) |
Number of Properties(4) |
SNF Beds |
ALF Units |
ILF Units |
|||||||||||||||||||
Assisted Living |
$ | 309,129 | 45.8 | % | $ | 30,402 | $ | 2,796 | 45.6 | % | 103 | — | 4,530 | — | ||||||||||||||
Skilled Nursing |
298,734 | 44.2 | % | 28,511 | 4,219 | 44.9 | % | 89 | 10,212 | — | — | |||||||||||||||||
Other Senior Housing(5) |
55,640 | 8.2 | % | 5,242 | 390 | 7.7 | % | 12 | 795 | 290 | 370 | |||||||||||||||||
Schools(6) |
12,170 | 1.8 | % | 1,201 | 77 | 1.8 | % | 2 | N/A | N/A | N/A | |||||||||||||||||
Totals |
$ | 675,673 | 100.0 | % | $ | 65,356 | $ | 7,482 | 100.0 | % | 206 | 11,007 | 4,820 | 370 | ||||||||||||||
- (1)
- Includes
rental income from properties classified as held-for-sale.
- (2)
- Includes
interest income from mortgage loans.
- (3)
- Includes
rental income and interest income from mortgage loans.
- (4)
- We
have investments in 30 states leased or mortgaged to 40 different operators.
- (5)
- Other
senior housing properties consist of independent living properties and properties providing any combination of skilled nursing, assisted living and/or
independent living services.
- (6)
- During the year end December 31, 2010, we acquired a school property located in Minnesota via deed-in-lieu of foreclosure as a result of the borrower filing for Chapter 7 bankruptcy. The property has been classified as held-for-sale and we are actively marketing to sell it.
As of December 31, 2010 we had $516.0 million in carrying value of net real estate investment, consisting of $457.0 million or 88.6% invested in owned and leased properties and $59.0 million or 11.4% invested in mortgage loans secured by first mortgages.
For the year ended December 31, 2010, rental income and interest income from mortgage loans excluding discontinued operations represented 87.4% and 10.1%, respectively, of total gross revenues. In most instances, our lease structure contains fixed annual rental escalations, which are generally recognized on a straight-line basis over the minimum lease period. Certain leases have annual rental escalations that are contingent upon changes in the Consumer Price Index and/or changes in the gross operating revenues of the property. This revenue is not recognized until the appropriate contingencies have been resolved. This lease structure initially generates lower revenues and net income but enables us to generate additional growth and minimize non-cash straight-line rent over time. For the years ended December 31, 2010, 2009 and 2008 we recorded $3.8 million, $4.2 million, and $3.5 million, respectively, in straight-line rental income. Also during 2010, 2009 and 2008 we recorded $0.8 million,
33
$0.8 million and $0.1 million, respectively, of straight-line rent receivable reserve. Straight-line rental income for leases in place at December 31, 2010 are projected to decrease from $3.8 million in 2010 to $2.5 million in 2011 assuming no new leased investments with fixed annual rental escalations are added to our portfolio. Conversely, our cash rental income is projected to increase from $62.2 million in 2010 to $69.9 million in 2011 assuming no modification or replacement of existing leases and no new leased investments are added to our portfolio. During the year ended December 31, 2010 we received $62.2 million of cash rental revenue and recorded $0.7 million of lease inducement costs. At December 31, 2010 and 2009, the straight-line rent receivable balance, net of reserves, for continuing and discontinued operations on the consolidated balance sheet was $20.1 million and $17.1 million, respectively.
Our primary objectives are to sustain and enhance stockholder equity value and provide current income for distribution to stockholders through real estate investments in senior housing and long term care properties managed by experienced operators. To meet these objectives, we attempt to invest in properties that provide opportunity for additional value and current returns to our stockholders and diversify our investment portfolio by geographic location, operator and form of investment. We opportunistically consider investments in health care facilities in related businesses where the business model is similar to our existing model and the opportunity provides an attractive expected return. Consistent with this strategy, we pursue, from time to time, opportunities for potential acquisitions and investments, with due diligence and negotiations often at different stages of development at any particular time.
- •
- With respect to skilled nursing properties, we attempt to invest in properties that do not have to rely on a high
percentage of private-pay patients. We seek to invest primarily in properties that are located in suburban and rural areas of states. We prefer to invest in a property that has significant
market presence in its community and where state certificate of need and/or licensing procedures limit the entry of competing properties.
- •
- For assisted living and independent living investments we have attempted to diversify our portfolio both geographically
and across product levels. Thus, we believe that although the majority of our investments are in affordably priced units, our portfolio also includes a significant number of upscale units in
appropriate markets with certain operators.
- •
- Our marketing efforts primarily focus on local and regional operators. As of December 31, 2010, 74% of our operators who leased our senior housing and long term care properties were non-public companies. Approximately 4% of our annualized rental income was generated by operators who operate less than nine senior housing and long term care properties, approximately 15% of our annualized rental income was generated by operators who operate between 10 and 20 senior housing and long term care properties and approximately 81% of our annualized rental income was generated by operators who operate more than 20 senior housing and long term care properties. Annualized rental income includes cash and straight-line rental income.
Substantially all of our revenues and sources of cash flows from operations are derived from operating lease rentals and interest earned on outstanding loans receivable. Our investments in mortgage loans and owned properties represent our primary source of liquidity to fund distributions and are dependent upon the performance of the operators on their lease and loan obligations and the rates earned thereon. To the extent that the operators experience operating difficulties and are unable to generate sufficient cash to make payments to us, there could be a material adverse impact on our consolidated results of operations, liquidity and/or financial condition. To mitigate this risk, we monitor our investments through a variety of methods determined by the type of health care facility and operator. Our monitoring process includes periodic review of financial statements for each facility,
34
periodic review of operator credit, scheduled property inspections and review of covenant compliance relating to real estate taxes and insurance.
In addition to our monitoring and research efforts, we also structure our investments to help mitigate payment risk. Prior to 2008 we might have financed up to 90 percent of the stabilized market value of a property. Due to recent market uncertainties we most likely will finance at a lower percentage. Some operating leases and loans are credit enhanced by guaranties and/or letters of credit. In addition, operating leases are typically structured as master leases and loans are generally cross-defaulted and cross-collateralized with other loans, operating leases or agreements between us and the operator and its affiliates.
Depending upon the availability and cost of external capital, we anticipate making additional investments in health care related properties. New investments are generally funded from cash on hand and temporary borrowings under our unsecured line of credit and internally generated cash flows. Our investments generate internal cash from rent and interest receipts and principal payments on mortgage loans receivable. Permanent financing for future investments, which replaces funds drawn under our unsecured line of credit, is expected to be provided through a combination of public and private offerings of debt and equity securities and secured and unsecured debt financing. The timing, source and amount of cash flows provided by financing activities and used in investing activities are sensitive to the capital markets environment, especially to changes in interest rates. Changes in capital markets environment may impact the availability of cost-effective capital. We believe our liquidity and various sources of available capital are sufficient to fund operations, meet debt service obligations (both principal and interest), make dividend distributions and finance future investments.
We believe our business model has enabled and will continue to enable us to maintain the integrity of our property investments, including in response to financial difficulties that may be experienced by operators. Traditionally, we have taken a conservative approach to managing our business, choosing to maintain liquidity and exercise patience until favorable investment opportunities arise.
At December 31, 2010, we had $6.9 million of cash on hand, $72.3 million available on our $110.0 million Unsecured Credit Agreement which matures July 17, 2011, and the uncommitted private shelf agreement with affiliates and managed accounts of Prudential Investment Management, Inc. (individually and collectively "Prudential") which provides for the possible issuance of up to $50.0 million of senior unsecured fixed-rate term notes during the three-year issuance period. Also, our potential ability to access the capital markets through the issuance of $64.6 million of common stock under our Amended Equity Distribution Agreement and through the issuance of debt and/or equity securities under our $276.3 million effective shelf registration. Subsequent to December 31, 2010, we repaid $4.2 million under our Unsecured Credit Agreement. After this payment, we had $33.5 million outstanding under the Unsecured Credit Agreement and $76.5 million available for borrowing. As a result, we believe our liquidity and various sources of available capital are sufficient to fund operations, meet debt service obligations (both principal and interest), make dividend distributions and finance some future investments should we determine such future investments are financially feasible.
Key Transactions
Owned Properties. During 2010, we sold a 195-bed skilled nursing property located in Virginia to the lessee under a purchase option for $4.9 million. As a result, we received net cash proceeds of
35
$4.9 million and recognized a gain net of selling expenses of $0.3 million. The following table summarizes our acquisitions during 2010 (in thousands):
| |
|
|
|
|
|
Number of | |||||||||||||||||||
|---|---|---|---|---|---|---|---|---|---|---|---|---|---|---|---|---|---|---|---|---|---|---|---|---|---|
Type of Property
|
Purchase Price |
Transaction Costs |
Total Acquisition Costs |
Annualized Rental Income(6) |
Number of Properties |
SNF Beds |
ALF Units |
ILF Units |
|||||||||||||||||
Assisted Living |
$ | 26,900 | $ | 210 | (4) | $ | 27,110 | $ | 2,952 | 4 | — | 241 | — | ||||||||||||
Skilled Nursing(1) |
54,011 | (3) | 140 | 54,151 | 7,228 | 5 | 668 | — | — | ||||||||||||||||
Other Senior Housing(2) |
13,339 | — | (5) | 13,339 | — | (5) | 1 | 137 | 46 | 47 | |||||||||||||||
Totals |
$ | 94,250 | $ | 350 | $ | 94,600 | $ | 10,180 | 10 | 805 | 287 | 47 | |||||||||||||
- (1)
- At
the time of acquisition, we preliminarily estimate the allocation of the assets acquired based upon historical valuations of similar acquisitions and the
facts and circumstances available at the time. We determine the final value of the identifiable assets as soon as information is available, but not more than 12 months from the date of
acquisition. We are in the process of completing the final allocation of assets for our December 2010 acquisitions.
- (2)
- Other
senior housing properties consist of independent living properties and properties providing any combination of skilled nursing, assisted living and/or
independent living services.
- (3)
- Purchased
a 166-skilled nursing property in Texas and leased the property to a third party operator, who previously operated the property under
a lease with the seller. We paid this operator $0.1 million as a lease inducement which is amortized as a yield adjustment over the life of the lease.
- (4)
- Purchased
four assisted living properties with a total of 241 units for $26.9 million and incurred $0.2 million in transaction costs. Included
in the transaction costs is a $0.1 million charge which represents half of the seller's prepayment penalty on its loan.
- (5)
- Acquired
the other senior housing property along with a 90-bed skilled nursing property for $22.0 million and incurred $7,000 in
transaction costs. The transaction costs for this acquisition are included in the skilled nursing property transaction costs above. These properties were leased to a third party operator under a
12-year master lease with two 10-year renewal options and the annualized rental income for this master lease is $2.4 million which is included in the annualized rental
income for skilled nursing properties above. We do not allocate rental income among properties in a master lease.
- (6)
- Includes annualized cash and straight-line rental income. For the year ended December 31, 2010 we recorded cash and straight-line rental income of $5.1 million for properties acquired during 2010.
Subsequent to December 31, 2010, we entered into a purchase agreement to acquire two senior housing properties with 178 skilled nursing beds, 40 assisted living units, 34 independent living units and 19 cottages and patio homes. The properties are located in South Carolina and the aggregate purchase price is $11.5 million. The transaction is scheduled to close on or about February 28, 2011. Simultaneous with the purchase, we will lease the properties, under a 10-year triple net master lease, to an unrelated third-party operator. The lease will contain three 5-year renewal options and annual escalations of 2.5%. Additionally we have agreed to fund $0.7 million in capital improvements to the properties at the lease rate.
Mortgage Loans. During 2010, we invested $1.6 million, before closing fees of $0.1 million, in a mortgage loan secured by a skilled nursing property located in Missouri to finance an expansion of the property and extend the loan maturity for an additional five years to January 2018. Also during 2010, we received $3.9 million plus accrued interest related to the payoff of five mortgage loans secured by
36
five skilled nursing properties. Subsequent to December 31, 2010, we received $1.0 million plus accrued interest related to the payoff of a mortgage loan secured by an assisted living property in Texas.
Bank Borrowings. During 2010, we added a new lender with a $30.0 million commitment to our Unsecured Credit Agreement, dated July 17, 2008. This additional commitment provides a total availability of $110.0 million under our Unsecured Credit Agreement with the opportunity to increase the credit amount up to a total of $120.0 million. The Unsecured Credit Agreement provides a revolving line of credit with a final maturity date of July 17, 2011.
Mortgage Loans and Bonds Payable. During 2010, we paid off a $7.6 million mortgage loan secured by an assisted living property located in California. The retired debt had an interest rate of 8.7%. After this payoff, we have $3.7 million outstanding which was funded with multifamily tax-exempt revenue bonds secured by five assisted living properties located in Washington. These bonds bear interest at a variable interest rate and mature in 2015. The weighted average interest rate as of December 31, 2010, including letter of credit fees, was 2.2%.
Senior Unsecured Notes. During 2010, we completed the sale to affiliates and managed accounts of Prudential Investment Management, Inc. (individually and collectively "Prudential") of $25.0 million aggregate principal amount of 5.26% senior unsecured term notes due July 14, 2015 and $25.0 million aggregate principal amount of 5.74% senior unsecured term notes fully amortizing to maturity between January 14, 2014 and January 14, 2019. Also, we entered into an uncommitted private shelf agreement with Prudential which provides for the possible issuance of up to an additional $50.0 million of senior unsecured fixed-rate term notes during the three-year issuance period. Interest rates on any issuance under the shelf agreement will be set at a spread over applicable Treasury rates at the date of the "rate lock." Maturities of each issuance are at our election for up to 10 years from the date of issuance with a maximum average life of 7 years from the date of original issuance.
Common Stock. On June 9, 2010, we filed a Form S-3 "shelf" registration statement which became effective June 16, 2010, to replace our prior shelf registration statement. Our current shelf registration statement provides us with the capacity to offer up to $400.0 million in common stock, preferred stock, warrants, debt, depositary shares, or units. We may from time to time raise capital under our current shelf registration in amounts, at prices, and on terms to be announced when and if the securities are offered. The specifics of any future offerings, along with the use of proceeds of any securities offered, will be described in detail in a prospectus supplement, or other offering materials, at the time of the offering. At December 31, 2010 we had $276.3 million availability under our effective shelf registration.
On August 4, 2010, we entered into an amendment to our equity distribution agreement dated as of August 5, 2009 to issue and sell, from time to time, up to $85.7 million in aggregate offering price of our common shares. On October 26, 2010, we entered into an amended and restated equity distribution agreement to include an additional sales agent. During 2010, we sold 776,400 shares of common stock at a weighted average price, including fees and costs, of $25.55 per share, resulting in net proceeds of $19.8 million after $0.5 million of fees and costs. Additionally, during 2010, we sold 1,970,000 shares of common stock at a price of $24.70 per share, before fees and costs of $0.7 million, in a registered direct placement to certain institutional investors. We raised $48.0 million in net proceeds from the offering. The net proceeds were used to fund the redemption of all of our Series E preferred stock and 40% of our Series F preferred stock outstanding, as discussed below.
Preferred Stock. During 2010, we redeemed 4,921 shares representing all of our outstanding 8.5% Series E Cumulative Convertible Preferred Stock ("Series E Preferred Stock") and 2,357,686 shares representing 40% of our outstanding 8.0% Series F Cumulative Preferred Stock ("Series F Preferred Stock"). Accordingly, we recognized the $2.4 million of original issue costs related to the Series E and Series F Preferred Stock as a preferred stock redemption charge which is included in the income statement line item "Income allocated to preferred stockholders."
37
Key Performance Indicators, Trends and Uncertainties
We utilize several key performance indicators to evaluate the various aspects of our business. These indicators are discussed below and relate to concentration risk and credit strength. Management uses these key performance indicators to facilitate internal and external comparisons to our historical operating results in making operating decisions and for budget planning purposes.
Concentration Risk. We evaluate our concentration risk in terms of asset mix, investment mix, operator mix and geographic mix. Concentration risk is valuable to understand what portion of our investments could be at risk if certain sectors were to experience downturns. Asset mix measures the portion of our investments that are real property or mortgage loans. In order to qualify as an equity REIT, at least 75 percent of our total assets must be represented by real estate assets, cash, cash items and government securities. Investment mix measures the portion of our investments that relate to our various property types. Operator mix measures the portion of our investments that relate to our top three operators. Geographic mix measures the portion of our investment that relate to our top five states.
The following table reflects our recent historical trends of concentration risk (gross investment, in thousands):
| |
Period Ended | ||||||||||||||||
|---|---|---|---|---|---|---|---|---|---|---|---|---|---|---|---|---|---|
| |
12/31/10 | 9/30/10 | 6/30/10 | 3/31/10 | 12/31/09 | ||||||||||||
Asset mix: |
|||||||||||||||||
Real property |
$ | 615,666 | $ | 564,539 | $ | 560,254 | $ | 536,963 | $ | 519,460 | |||||||
Loans receivable |
60,007 | 65,455 | 68,644 | 69,663 | 70,587 | ||||||||||||
Investment asset mix: |
|||||||||||||||||
Assisted living properties |
$ | 309,129 | $ | 281,912 | $ | 281,575 | $ | 280,682 | $ | 280,771 | |||||||
Skilled nursing properties |
298,734 | 280,452 | 279,098 | 271,164 | 254,694 | ||||||||||||
Other senior housing properties(1) |
55,640 | 55,460 | 55,205 | 41,760 | 41,562 | ||||||||||||
Schools |
12,170 | 12,170 | 13,020 | 13,020 | 13,020 | ||||||||||||
Operator asset mix: |
|||||||||||||||||
Extendicare (ALC) |
$ | 88,034 | $ | 88,034 | $ | 88,034 | $ | 88,034 | $ | 88,034 | |||||||
Preferred Care, Inc.(2) |
87,685 | 86,920 | 86,516 | 86,610 | 86,702 | ||||||||||||
Brookdale Communities |
84,210 | 84,210 | 84,210 | 84,210 | 84,210 | ||||||||||||
Remaining operators |
415,744 | 370,830 | 370,138 | 347,772 | 331,101 | ||||||||||||
Geographic mix: |
|||||||||||||||||
Texas |
$ | 134,366 | $ | 109,015 | $ | 109,556 | $ | 110,017 | $ | 102,741 | |||||||
Florida |
70,466 | 53,023 | 53,078 | 53,132 | 44,144 | ||||||||||||
Ohio |
56,804 | 56,804 | 56,804 | 56,804 | 56,804 | ||||||||||||
New Mexico |
48,876 | 48,876 | 48,876 | 48,876 | 48,876 | ||||||||||||
Arizona |
41,212 | 41,212 | 41,212 | 41,212 | 41,212 | ||||||||||||
Remaining states |
323,950 | 321,064 | 319,372 | 296,585 | 296,270 | ||||||||||||
- (1)
- Other
senior housing properties consist of independent living properties and properties providing any combination of skilled nursing, assisted living and/or
independent living services.
- (2)
- Preferred Care, Inc. leases 23 skilled nursing and two other senior housing properties under two master leases and one skilled nursing property under a separate lease agreement. In addition, they operate six skilled nursing properties securing five mortgage loans receivable that we have with unrelated third parties and one mortgage loan receivable we have with Preferred Care. They also operate one skilled nursing facility under a sub-lease with another lessee we have which is not included in the Preferred Care operator mix.
38
Credit Strength. We measure our credit strength both in terms of leverage ratios and coverage ratios. Our leverage ratios include debt to book capitalization and debt to market capitalization. The leverage ratios indicate how much of our consolidated balance sheet capitalization is related to long term obligations. Our coverage ratios include interest coverage ratio and fixed charge coverage ratio. The coverage ratios indicate our ability to service interest and fixed charges (interest plus preferred dividends). The coverage ratios are based on earnings before interest, taxes, depreciation and amortization. Leverage ratios and coverage ratios are widely used by investors, analysts and rating agencies in the valuation, comparison, rating and investment recommendations of companies. The following table reflects the recent historical trends for our credit strength measures:
Balance Sheet Metrics
| |
Year to Date | Quarter Ended | |||||||||||||||||
|---|---|---|---|---|---|---|---|---|---|---|---|---|---|---|---|---|---|---|---|
| |
12/31/10 | 12/31/10 | 9/30/10 | 6/30/10 | 3/31/10 | 12/31/09 | |||||||||||||
Debt to book capitalization ratio |
16.7 | % | 16.7% | (1) | 10.5% | (5) | 8.9% | (1) | 7.9% | (1) | 5.3 | % | |||||||
Debt & Preferred Stock to book capitalization ratio |
39.8 | % | 39.8% | (1) | 35.3% | (6) | 45.8% | (1) | 45.2% | (1) | 44.2 | % | |||||||
Debt to market capitalization ratio |
9.5 | % | 9.5% | (2) | 6.3% | (5) | 5.5% | (1) | 4.6% | (1) | 3.0 | % | |||||||
Debt & Preferred Stock to market capitalization ratio |
23.0 | % | 23.0% | (2) | 21.4% | (6) | 28.6% | (1) | 26.1% | (8) | 25.1 | % | |||||||
Interest coverage ratio(10) |
24.3 | x | 17.5 | x(3) | 19.4 | x(7) | 38.3 | x(8) | 37.0 | x(9) | 40.8 | x | |||||||
Fixed charge coverage ratio(10) |
4.0 | x | 4.8 | x(4) | 3.8 | x | 3.8 | x(8) | 3.5 | x(9) | 3.6 | x | |||||||
- (1)
- Increase
primarily due to the increase in bank borrowing.
- (2)
- Increase
primarily due to the increase in bank borrowing partially offset by the increase in market capitalization.
- (3)
- Decrease
primarily due to the increase in interest expense relating to increased bank borrowing and the sale to Prudential of $50.0 million aggregate
principal amount of the senior unsecured term notes partially offset by the increase in income generated from acquisitions in 2010 and the one-time bankruptcy settlement distribution
relating to Sunwest.
- (4)
- Increased
primarily due to the decrease in preferred dividends resulting from our redemption of all of our Series E and 40% of our Series F
Preferred Stock outstanding and the increase in income generated from acquisitions in 2010 and the one-time bankruptcy settlement distribution relating to Sunwest.
- (5)
- Increase
primarily due to the sale to Prudential of $50.0 million aggregate principal amount of the senior unsecured term notes.
- (6)
- Decrease
primarily due to our redemption of all of our Series E and 40% of our Series F Preferred Stock outstanding.
- (7)
- Decrease
primarily due to the increase in interest expense related to the $50.0 million senior unsecured term notes.
- (8)
- Increase
primarily due to additional income generated from acquisitions in 2010.
- (9)
- Decrease primarily due to the increase of $0.9 million in provision for doubtful accounts related to a mortgage loan secured by a private school property located in Minnesota. During the first quarter of 2010, we acquired this school property via deed-in-lieu of foreclosure as a result of the borrower filing for Chapter 7 bankruptcy. The school property has been classified as held-for-sale and we are actively marketing to sell it.
39
- (10)
- In calculating our interest coverage and fixed charge coverage ratios above, we use EBITDA, which is a financial measure not derived in accordance with U.S. generally accepted accounting principles (non-GAAP financial measure). EBITDA is not an alternative to net income, operating income, income from continuing operations or cash flows from operating activities as calculated and presented in accordance with U.S. GAAP. You should not rely on EBITDA as a substitute for any such U.S. GAAP financial measures or consider it in isolation, for the purpose of analyzing our financial performance, financial position or cash flows. Net income is the most directly comparable GAAP measure to EBITDA. Below are a reconciliation of net income to EBITDA and the calculation of the interest coverage and fixed charge coverage ratios disclosed above.
| |
Year to Date | Quarter Ended | |||||||||||||||||
|---|---|---|---|---|---|---|---|---|---|---|---|---|---|---|---|---|---|---|---|
| |
12/31/10 | 12/31/10 | 9/30/10 | 6/30/10 | 3/31/10 | 12/31/09 | |||||||||||||
Net income |
$ | 46,053 | $ | 12,291 | $ | 11,562 | $ | 11,630 | $ | 10,570 | $ | 11,056 | |||||||
Less: Gain on sale |
(310 | ) | (310 | ) | — | — | — | — | |||||||||||
Add: Interest Expense |
2,653 | 981 | 852 | 419 | 401 | 372 | |||||||||||||
Add: Depreciation and amortization—continuing operations |
15,963 | 4,162 | 4,073 | 3,941 | 3,787 | 3,659 | |||||||||||||
Add: Depreciation and amortization—discontinued operations |
146 | — | — | 73 | 73 | 74 | |||||||||||||
Total EBITDA |
$ | 64,505 | $ | 17,124 | $ | 16,487 | $ | 16,063 | $ | 14,831 | $ | 15,161 | |||||||
Interest expense |
$ | 2,653 | $ | 981 | $ | 852 | $ | 419 | $ | 401 | $ | 372 | |||||||
Interest coverage ratio |
24.3 | x | 17.5 | x | 19.4 | x | 38.3 | x | 37.0 | x | 40.8 | x | |||||||
Interest expense |
$ | 2,653 | $ | 981 | $ | 852 | $ | 419 | $ | 401 | $ | 372 | |||||||
Preferred stock dividends (excludes preferred stock redemption charge) |
13,662 | 2,586 | 3,506 | 3,785 | 3,785 | 3,785 | |||||||||||||
Total fixed charges |
$ | 16,315 | $ | 3,567 | $ | 4,358 | $ | 4,204 | $ | 4,186 | $ | 4,157 | |||||||
Fixed charge coverage ratio |
4.0 | x | 4.8 | x | 3.8 | x | 3.8 | x | 3.5 | x | 3.6 | x | |||||||
We evaluate our key performance indicators in conjunction with current expectations to determine if historical trends are indicative of future results. Our expected results may not be achieved and actual results may differ materially from our expectations. This may be a result of various factors, including, but not limited to
- •
- The status of the economy;
- •
- The status of capital markets, including prevailing interest rates;
- •
- Compliance with and changes to regulations and payment policies within the health care industry;
- •
- Changes in financing terms;
- •
- Competition within the health care and senior housing industries; and
- •
- Changes in federal, state and local legislation.
Management regularly monitors the economic and other factors listed above. We develop strategic and tactical plans designed to improve performance and maximize our competitive position. Our ability to achieve our financial objectives is dependent upon our ability to effectively execute these plans and to appropriately respond to emerging economic and company-specific trends.
40
Operating Results
Year ended December 31, 2010 compared to year ended December 31, 2009
Revenues for the year ended December 31, 2010 increased to $74.3 million from $69.4 million for the same period in 2009 primarily due to increases in rental income and in interest and other income partially offset by decreases in interest income from mortgage loans, as discussed below. Rental income for the year ended December 31, 2010 increased $5.5 million from the same period in 2009 primarily due to increases resulting from acquisitions in 2010 and 2009.
Interest income from mortgage loans for the year ended December 31, 2010 decreased $1.1 million from the same period in 2009 primarily due to payoffs, normal amortization of existing mortgage loans and the deed-in-lieu of foreclosure of the mortgage loan secured by a school property located in Minnesota.
Interest and other income for the year ended December 31, 2010 increased $0.5 million from the same period in 2009 primarily due to a $0.8 million bankruptcy settlement distribution related to Sunwest Management, Inc. (or Sunwest) partially offset by lower interest income resulting from payoffs and the normal amortization of our notes receivable. See Item 8. FINANCIAL STATEMENTS—Notes 6. Real Estate Investments for further discussion on Sunwest.
Interest expense for the year ended December 31, 2010 was $0.2 million higher than the same period in 2009 due to increase in bank borrowings outstanding during 2010 and the sale of $50.0 million aggregate principal of senior unsecured notes partially offset by a decrease in mortgage loans payable outstanding during the period resulting from the repayment of mortgage loans in 2010 and 2009 and the normal amortization of existing mortgage loans.
Depreciation and amortization expense for the year ended December 31, 2010 increased $1.4 million from the same period in 2009 primarily due to capital improvement investments and acquisitions in 2010 and 2009.
Provisions for doubtful accounts for the year ended December 31, 2010 increased $1.2 million from the same period in 2009 primarily due to a provision for doubtful accounts charge related to two mortgage loans (one secured by a private school property located in Minnesota and one secured by land in Oklahoma). In the first quarter of 2010, we acquired the school property via deed-in-lieu of foreclosure as a result of the borrower filing for Chapter 7 bankruptcy. The school property has been classified as held-for-sale and we are actively marketing to sell it.
Operating and other expenses for the year ended December 31, 2010 increased $0.6 million from the same period in 2009 primarily due to transaction costs related to the acquisitions in 2010, and an increase in legal and other expenses related to the shelf registration and the Series E and Series F preferred stock redemption.
For the year ended December 31, 2010 and 2009, net income from discontinued operations included the financial results from properties sold and properties classified as held-for-sale and a gain on sale of sold properties. During the fourth quarter 2010, we sold a 195-bed skilled nursing property in Virginia and recognized a gain of $0.3 million. The private school property in Minnesota that we acquired via deed-in-lieu of foreclosure is classified as held-for-sale. This reclassification was made in accordance with accounting guidance which requires that the financial results of properties meeting certain criteria be reported on a separate line item called "Discontinued Operations."
Net income allocable to common stockholders for the year ended December 31, 2010 increased $0.2 million from the same period in 2009 primarily due to the changes previously described above.
41
Year ended December 31, 2009 compared to year ended December 31, 2008
Revenues for the year ended December 31, 2009 increased to $69.4 million from $68.8 million for the same period in 2008 primarily due to increases in rental income partially offset by decreases in interest income from mortgage loans and decreases in interest and other income, as discussed below. Rental income increased $2.4 million from the same period in 2008 primarily as a result of acquisitions in 2009 and new leases on properties formerly operated by affiliates of Sunwest, as described in Item 8. FINANCIAL STATEMENTS—Note 6. Real Estate Investments.
Interest income from mortgage loans for the year ended December 31, 2009 decreased $1.2 million from the same period in 2008 primarily due to mortgage loan payoffs and the conversion of a mortgage loan to an owned property in the fourth quarter of 2008 resulting from the non-payment of interest income from affiliates of Sunwest, as described in Item 8. FINANCIAL STATEMENTS—Note 6. Real Estate Investments.
Interest and other income for the year ended December 31, 2009 decreased $0.8 million from the same period in 2008 primarily due to lower interest income from our investments of cash resulting from lower interest rates and lower cash balances.
Interest expense for the year ended December 31, 2009 was $1.7 million lower than the same period in 2008 due to a decrease in mortgage loans outstanding during the period resulting from the repayment of mortgage loans and the normal amortization of existing mortgage loans partially offset by increase in borrowings under our Unsecured Credit Agreement.
Depreciation and amortization expense was comparable for each of the years ended December 31, 2009 and 2008.
Provisions for doubtful accounts for the year ended December 31, 2009 increased $0.7 million from the same period in 2008 primarily due to an increase in straight-line rent receivable reserve.
Operating and other expenses were $0.5 million higher in the year ended December 31, 2009 as compared to the same period in 2008 primarily due to an increase in accounting fees related to the implementation of new FASB accounting guidance during 2009, property tax expenses paid on behalf of one of our operators, transaction costs related to the acquisition of three assisted living properties and the timing of certain expenditures.
Net income allocable to common stockholders for the year ended December 31, 2009 increased $1.0 million from the same period in 2008 primarily due to the changes previously described above partially offset by the increase in income allocated to our preferred stockholders, which includes the repurchase of preferred stock for less than liquidation value and preferred stock dividends.
Critical Accounting Policies
Preparation of the consolidated financial statements in conformity with U.S. generally accepted accounting principles (U.S. GAAP) requires management to make estimates and assumptions that affect the amounts reported in the consolidated financial statements and accompanying notes. Actual results could differ from those estimates. See Item 8. FINANCIAL STATEMENTS—Note 2. Summary of Significant Accounting Policies for a description of the significant accounting policies we followed in preparing the consolidated financial statements for all periods presented. We have identified the following significant accounting policies as critical accounting policies in that they require significant judgment and estimates and have the most impact on financial reporting.
Impairments. Impairment losses are recorded when events or changes in circumstances indicate the asset is impaired and the estimated undiscounted cash flows to be generated by the asset are less than its carrying amount. Management assesses the impairment of properties individually and impairment losses are calculated as the excess of the carrying amount over the fair value of assets to be
42
held and used, and carrying amount over the fair value less cost to sell in instances where management has determined that we will dispose of the property. In determining fair value, we use current appraisals or other third party opinions of value and other estimates of fair value such as estimated discounted future cash flows.
Also, we evaluate the carrying values of mortgage loans receivable on an individual basis. Management periodically evaluates the realizability of future cash flows from the mortgage loan receivable when events or circumstances, such as the non-receipt of principal and interest payments and/or significant deterioration of the financial condition of the borrower, indicate that the carrying amount of the mortgage loan receivable may not be recoverable. An impairment charge is recognized in current period earnings and is calculated as the difference between the carrying amount of the mortgage loan receivable and the discounted cash flows expected to be received, or if foreclosure is probable, the fair value of the collateral securing the mortgage.
Accounting Standards Codification No. 320, Investments—Debt and Equity Securities (or ASC 320), requires an entity to assess whether it intends to sell, or it is more likely than not that it will be required to sell, a debt security in an unrealized loss position before recovery of its amortized cost basis. If either of these criteria is met, the entire difference between fair value and amortized cost is recognized as impairment through earnings. For securities that do not meet the aforementioned criteria, the amount of impairment is split into two components as follows: 1) other-than-temporary impairment (or OTTI) related to other factors such as an entity's ability to make scheduled interest or principal payments on the debt securities, which is recognized in other comprehensive income and 2) OTTI related to credit loss, which must be recognized in the income statement. The credit loss is determined as the difference between the present value of the cash flows expected to be collected and the amortized cost basis.
Mortgage Loans Receivable. Mortgage loans receivable we originate are recorded on an amortized cost basis. Mortgage loans we acquire are recorded at fair value at the time of purchase net of any related premium or discount which is amortized as a yield adjustment to interest income over the life of the loan. We maintain a valuation allowance based upon the expected collectability of our mortgage loans receivable. Changes in the valuation allowance are included in current period earnings.
Revenue Recognition. Interest income on mortgage loans is recognized using the effective interest method. We follow a policy related to mortgage interest whereby we consider a loan to be non-performing after 60 days of non-payment of amounts due and do not recognize unpaid mortgage interest income from that loan until the past due amounts have been received.
Rental income from operating leases is recognized in accordance with U.S. GAAP. Substantially all of our leases contain provisions for specified annual increases over the rents of the prior year and are generally computed in one of four methods depending on specific provisions of each lease as follows:
- (i)
- a
specified annual increase over the prior year's rent, generally between 2.0% and 3.0%;
- (ii)
- a
calculation based on the Consumer Price Index;
- (iii)
- as
a percentage of facility net patient revenues in excess of base amounts or
- (iv)
- specific dollar increases.
The FASB does not provide for the recognition of contingent revenue until all possible contingencies have been eliminated. We consider the operating history of the lessee and the general condition of the industry when evaluating whether all possible contingencies have been eliminated and have historically, and expect in the future, to not include contingent rents as income until received. We follow a policy related to rental income whereby we consider a lease to be non-performing after 60 days of non-payment of past due amounts and do not recognize unpaid rental income from that lease until the amounts have been received.
43
Rental revenues relating to non-contingent leases that contain specified rental increases over the life of the lease are recognized on the straight-line basis. Recognizing income on a straight-line basis requires us to calculate the total non-contingent rent containing specified rental increases over the life of the lease and to recognize the revenue evenly over that life. This method results in rental income in the early years of a lease being higher than actual cash received, creating a straight-line rent receivable asset included in our consolidated balance sheet. At some point during the lease, depending on its terms, the cash rent payments eventually exceed the straight-line rent which results in the straight-line rent receivable asset decreasing to zero over the remainder of the lease term. We assess the collectability of straight-line rent in accordance with the applicable accounting standards and our reserve policy. If the lessee becomes delinquent in rent owed under the terms of the lease, we may provide a reserve against the recognized straight-line rent receivable asset for a portion, up to its full value, that we estimate may not be recoverable.
Net loan fee income and commitment fee income are amortized over the life of the related loan. Costs associated with leases are deferred and allocated over the lease term in proportion to the recognition of rental income.
Liquidity and Capital Resources
Operating Activities:
At December 31, 2010, our real estate investment portfolio (before accumulated depreciation and amortization) consisted of $615.7 million invested primarily in owned long term healthcare properties and mortgage loans of approximately $60.0 million (prior to deducting a $1.0 million reserve). Our portfolio consists of investments in 89 skilled nursing properties, 103 assisted living properties, 12 other senior housing properties and two schools. These properties are located in 30 states. Other senior housing properties consist of independent living properties and properties providing any combination of skilled nursing, assisted living and/or independent living services. For the year ended December 31, 2010, we had net cash provided by operating activities of $65.3 million.
For the year ended December 31, 2010 we recorded $3.8 million in straight-line rental income and $0.8 million in straight-line rent receivable reserve. We currently expect that straight-line rental income for leases in place at December 31, 2010 will decrease from $3.8 million in 2010 to $2.5 million in 2011 assuming no modification or replacement of existing leases and no new leased investments are added to our portfolio. Conversely, our cash rental income is projected to increase from $62.2 million in 2010 to $69.9 million in 2011 assuming no modification or replacement of existing leases and no new leased investments are added to our portfolio. During the year ended December 31, 2010 we received $62.2 million of cash rental revenue and recorded $0.7 million of amortized lease inducement cost.
Investing Activities:
For the year ended December 31, 2010, we used $87.4 million of cash for investing activities. During 2010, we sold a 195-bed skilled nursing property located in Virginia to the lessee under a purchase option for $4.9 million. As a result, we received net cash proceeds of $4.9 million and
44
recognized a gain net of selling expenses of $0.3 million. The following table summarizes our acquisitions during 2010 (in thousands):
| |
|
|
|
|
|
Number of | |||||||||||||||||||
|---|---|---|---|---|---|---|---|---|---|---|---|---|---|---|---|---|---|---|---|---|---|---|---|---|---|
Type of Property
|
Purchase Price |
Transaction Costs |
Total Acquisition Costs |
Annualized Rental Income(6) |
Number of Properties |
SNF Beds |
ALF Units |
ILF Units |
|||||||||||||||||
Assisted Living |
$ | 26,900 | $ | 210 | (4) | $ | 27,110 | $ | 2,952 | 4 | — | 241 | — | ||||||||||||
Skilled Nursing(1) |
54,011 | (3) | 140 | 54,151 | 7,228 | 5 | 668 | — | — | ||||||||||||||||
Other Senior Housing(2) |
13,339 | — | (5) | 13,339 | — | (5) | 1 | 137 | 46 | 47 | |||||||||||||||
Totals |
$ | 94,250 | $ | 350 | $ | 94,600 | $ | 10,180 | 10 | 805 | 287 | 47 | |||||||||||||
- (1)
- At
the time of acquisition, we preliminarily estimate the allocation of the assets acquired based upon historical valuations of similar acquisitions and the
facts and circumstances available at the time. We determine the final value of the identifiable assets as soon as information is available, but not more than 12 months from the date of
acquisition. We are in the process of completing the final allocation of assets for our December 2010 acquisitions.
- (2)
- Other
senior housing properties consist of independent living properties and properties providing any combination of skilled nursing, assisted living and/or
independent living services.
- (3)
- Purchased
a 166-skilled nursing property in Texas and leased the property to a third party operator, who previously operated the property under
a lease with the seller. We paid this operator $0.1 million as a lease inducement which is amortized as a yield adjustment over the life of the lease.
- (4)
- Purchased
four assisted living properties with a total of 241 units for $26.9 million and incurred $0.2 million in transaction costs. Included
in the transaction costs is a $0.1 million charge which represents half of the seller's prepayment penalty on its loan
- (5)
- Acquired
the other senior housing property along with a 90-bed skilled nursing property for $22.0 million and incurred $7,000 in
transaction costs. The transaction costs for this acquisition are included in the skilled nursing property transaction costs above. These properties were leased to a third party operator under a
12-year master lease with two 10-year renewal options and the annualized rental income is $2.4 million which is included in the annualized rental income for skilled
nursing properties above. We do not allocate rental income among properties in a master lease.
- (6)
- Includes annualized cash and straight-line rental income. For the year ended December 31, 2010 we recorded cash and straight-line rental income of $5.1 million for properties acquired during 2010.
Subsequent to December 31, 2010, we entered into a purchase agreement to acquire two senior housing properties with 178 skilled nursing beds, 40 assisted living units, 34 independent living units and 19 cottages and patio homes. The properties are located in South Carolina and the aggregate purchase price is $11.5 million. The transaction is scheduled to close on or about February 28, 2011. Simultaneous with the purchase, we will lease the properties, under a 10-year triple net master lease, to an unrelated third-party operator. The lease will contain three 5-year renewal options and annual escalations of 2.5%. Additionally we have agreed to fund $0.7 million in capital improvements to the properties at the lease rate.
Also, during the year ended December 31, 2010, we invested $4.6 million, at an average yield of 9.7%, under agreements to expand and renovate 11 existing properties operated by seven different operators and we invested $1.2 million in capital improvements to existing properties under various lease agreements whose rental rates already reflected this investment.
45
During the year ended December 31, 2010, we received $3.9 million plus accrued interest related to the payoff of five mortgage loans secured by five skilled nursing properties. Additionally, we invested $0.1 million under one existing mortgage loan for capital improvements and we invested $1.6 million, before closing fees of $0.1 million, in a mortgage loan secured by a skilled nursing property located in Missouri to finance an expansion of the property and extend the loan maturity for an additional five years to January 2018. Also, during 2010, we received $4.5 million in principal payments on mortgage loans. Subsequent to December 31, 2010, we received $1.0 million plus accrued interest related to the payoff of a mortgage loan secured by an assisted living property in Texas.
During 2010, we recorded a $1.2 million provision for doubtful accounts charge for two mortgage loans (one secured by a private school property located in Minnesota and one secured by land in Oklahoma). We acquired the private school property via deed-in-lieu of foreclosure as a result of the borrower filing for Chapter 7 bankruptcy. The school property has been classified as held-for-sale and we are actively marketing to sell it.
During the year ended December 31, 2010, we received $1.6 million in principal payments and funded $0.1 million on various loans and lines of credit with certain operators. At December 31, 2010, we had five such notes receivable outstanding with a carrying value of $1.3 million at a weighted average interest rate of 11.9%.
Financing Activities:
For the year ended December 31, 2010, we had net cash provided by financing activities of $20.1 million. We paid off a $7.6 million mortgage loan secured by an assisted living property located in California at a fixed interest rate of 8.69% and we paid $0.6 million in scheduled principal payments on mortgage loans and bonds payable. Subsequent to December 31, 2010, we paid $0.5 million in scheduled principal payments on bonds payable.
During the year ended December 31, 2010, we added a new lender with a $30.0 million commitment to our Unsecured Credit Agreement, dated July 17, 2008. This additional commitment provides a total availability of $110.0 million under our Unsecured Credit Agreement with the opportunity to increase the credit amount up to a total of $120.0 million. The Unsecured Credit Agreement provides a revolving line of credit with a final maturity date of July 17, 2011. Based on our current maximum total indebtedness to total asset value ratio as calculated in the Unsecured Credit Agreement, our current pricing under the Unsecured Credit Agreement is either Prime Rate plus 0.50% or LIBOR plus 1.50% depending on our borrowing election. At the time of borrowing, we may elect the 1, 2, 3 or 6 month LIBOR rate. Under financial covenants contained in the Unsecured Credit Agreement which are measured quarterly we are required to maintain, among other things:
- (i)
- a
ratio, of total indebtedness to total asset value, not greater than 0.5 to 1.0;
- (ii)
- a
ratio not greater than 0.35 to 1.0 of secured debt to total asset value;
- (iii)
- a
ratio not less than 2.5 to 1.0 of EBITDA as calculated in the Unsecured Credit Agreement to interest expense; and
- (iv)
- a ratio of not less than 1.50 to 1.0 of EBITDA as calculated in the Unsecured Credit Agreement to fixed charges.
During the year ended December 31, 2010, we borrowed $83.7 million and repaid $59.5 million under our Unsecured Credit Agreement. At December 31, 2010, we had $37.7 million outstanding at an interest rate of LIBOR plus 1.50% under our Unsecured Credit Agreement with $72.3 million available for borrowing. Subsequent to December 31, 2010, we repaid $4.2 million under our Unsecured Credit Agreement. After this payment, we had $33.5 million outstanding under the
46
Unsecured Credit Agreement and $76.5 million available for borrowing. At December 31, 2010, we were in compliance with all our covenants.
During the year ended December 31, 2010, we completed the sale to affiliates and managed accounts of Prudential of $25.0 million aggregate principal amount of 5.26% senior unsecured term notes due July 14, 2015 and $25.0 million aggregate principal amount of 5.74% senior unsecured term notes fully amortizing to maturity between January 14, 2014 and January 14, 2019. Also, we entered into an uncommitted private shelf agreement with Prudential which provides for the possible issuance of up to an additional $50.0 million of senior unsecured fixed-rate term notes during the three-year issuance period. Interest rates on any issuance under the shelf agreement will be set at a spread over applicable Treasury rates at the date of the "rate lock." Maturities of each issuance are at our election for up to 10 years from the date of issuance with a maximum average life of 7 years from the date of original issuance.
Our Board of Directors authorized a share repurchase program enabling us to repurchase up to 5,000,000 shares of our equity securities, including common and preferred securities. We continue to have an open Board authorization to purchase an additional 3,360,237 shares in total of our equity securities.
On August 4, 2010, we entered into an amendment to our equity distribution agreement dated as of August 5, 2009 to issue and sell, from time to time, up to $85.7 million in aggregate offering price of our common shares. On October 26, 2010, we entered into an amended and restated equity distribution agreement to include an additional sales agent. Sales of common shares are made by means of ordinary brokers' transactions at market prices, in block transactions, or as otherwise agreed between us and our sales agent. During 2010, we sold 776,400 shares of common stock at a weighted average price, including fees and costs, of $25.55 per share, resulting in net proceeds of $19.8 million after $0.5 million of fees and costs. At December 31, 2010 we had $64.6 million available under this agreement.
During the year ended December 31, 2010, we sold 1,970,000 shares of common stock at a price of $24.70 per share, before $0.7 million of fees and costs, in a registered direct placement to certain institutional investors. The net proceeds of $48.0 million were used for the redemption of all of our 4,921 shares of our Series E preferred stock and 2,357,686 shares of our Series F preferred stock outstanding. The redemption price for the full redemption of our Series E preferred stock was $25.4191 per share, including accrued and unpaid dividends up to and including the redemption date, and the redemption price for the 40% redemption of our Series F preferred stock was $25.3889 per share, including accrued and unpaid dividends up to the redemption date. Accordingly, we recognized the $2.4 million original issue costs related to the Series E and Series F preferred stock as a preferred stock redemption charge which is included in the income statement line item "Income allocated to preferred stockholders."
We paid cash dividends on our Series C, Series E, and Series F preferred stock totaling $3.3 million, $0.1 million and $11.5 million, respectively. Additionally, we declared and paid cash dividends on our common stock totaling $39.0 million. Subsequent to December 31, 2010, we declared a monthly cash dividend of $0.14 per share on our common stock for the months of January, February and March 2011, payable on January 31, February 28 and March 31, 2011, respectively, to stockholders of record on January 21, February 18 and March 23, 2011, respectively.
During the year ended December 31, 2010, a total of 11,666 common stock options were exercised at a total option value $0.2 million and a total market value on the date of exercise of $0.3 million. During 2010, we granted 4,000 shares of restricted stock at $25.95 per share, 1,000 shares of restricted stock at $25.04 per share and 11,030 shares of restricted stock at $26.53 per share. These shares vest ratably over a three-year period from the grant date. Additionally, during 2010, we granted 92,900 shares of restricted stock at $26.59 per share. These shares vest ratably over a five-year period from the
47
grant date. We also granted 99,661 shares of restricted stock at $26.53 per share during 2010. These shares vest ratably over a five-year period with the first date of vesting beginning in December 31, 2010. We did not grant stock options during 2010.
Available Shelf Registrations:
On June 9, 2010, we filed a Form S-3 "shelf" registration statement which became effective June 16, 2010, to replace our prior shelf registration statement. Our current shelf registration statement provides us with the capacity to offer up to $400.0 million in common stock, preferred stock, warrants, debt, depositary shares, or units. We may from time to time raise capital under our current shelf registration in amounts, at prices, and on terms to be announced when and if the securities are offered. The specifics of any future offerings, along with the use of proceeds of any securities offered, will be described in detail in a prospectus supplement, or other offering materials, at the time of the offering. At December 31, 2010, we had $276.3 million availability under our effective shelf registration.
Commitments:
The following table summarizes our capital improvement commitments as of December 31, 2010 (dollar amounts in thousands):
Commitment
|
Expiration Date |
Used Commitment at 12/31/10 |
Open Commitment at 12/31/10 |
Estimated Yield |
Property Type |
Properties | Major Operator | |||||||||||||
|---|---|---|---|---|---|---|---|---|---|---|---|---|---|---|---|---|---|---|---|---|
| $ | 2,000 | 1/1/2011 | $ | — | $ | 2,000 | (2)(3) | SNF | 1 | N/A | ||||||||||
| 40 | 2/28/2011 | 27 | 13 | (4) | OTHER | (1) | 1 | N/A | ||||||||||||
| 1,920 | 4/1/2011 | 1,534 | 386 | (5) | ALF | 2 | N/A | |||||||||||||
| 4,000 | 4/1/2011 | 2,121 | (9)(b) | 1,879 | 11.00% | (2) | SNF | 1 | Preferred Care | |||||||||||
| 1,500 | 5/31/2011 | 826 | (9)(a) | 674 | (6) | ALF | 3 | N/A | ||||||||||||
| 1,927 | 7/1/2011 | 1,802 | 125 | 10.00% | (2) | OTHER | (1) | 1 | N/A | |||||||||||
| 5,000 | 12/31/2014 | — | 5,000 | (7) | (8) | ALF | 37 | ALC | ||||||||||||
| $ | 16,387 | $ | 6,310 | $ | 10,077 | |||||||||||||||
- (1)
- Other
senior housing properties consist of independent living properties and properties providing any combination of skilled nursing, assisted living and/or
independent living services.
- (2)
- Minimum
rent will increase upon final funding and project completion or in some cases, the improvement deadline as defined in each lease agreement.
- (3)
- The
higher of one-year LIBOR plus 5.3% or 10%.
- (4)
- The
yield is included in the initial lease rate.
- (5)
- The
commitment is allocated in three tranches of $750, $850 and $320. The yield for the $750 tranche is included in the initial lease rate; the yield for
the $850 tranche is 8.5% with minimum rent increases as per footnote (3); the yield for the $320 tranche is 9.5% with minimum rent increases on the 1st of each month by the amount
advanced in the previous month multiplied by the estimated yield .
- (6)
- The
lease rate in effect on the date funded: 7% for March through November 2010 and 8% for December 2010 through the expiration date of the commitment.
Minimum rent increase as per footnote (2).
- (7)
- $5,000 per year for the life of the lease.
48
- (8)
- 9.5%
plus the positive difference, if any, between the average yields on the U.S. Treasury 10-year note for the five days prior to funding,
minus 420 basis points (expressed as a percentage).
- (9)
- Subsequent to December 31, 2010, we invested an additional $602 in the following commitments: (9)(a) $142, (9)(b) $460.
The following table summarizes our loan commitments as of December 31, 2010 (dollar amounts in thousands):
Commitment
|
Expiration Date |
Used Commitment at 12/31/10 |
Open Commitment at 12/31/10 |
Yield | Property Type(1) |
Properties | Major Operator |
||||||||||||
|---|---|---|---|---|---|---|---|---|---|---|---|---|---|---|---|---|---|---|---|
$50 |
3/31/2011 | $ | 20 | $ | 30 | 10.00 | % | OTHER | 1 | N/A | |||||||||
- (1)
- Other senior housing properties consist of independent living properties and properties providing any combination of skilled nursing, assisted living and/or independent living services.
Contractual Obligations:
We monitor our contractual obligations and commitments detailed above to ensure funds are available to meet obligations when due. The following table represents our long term contractual obligations (scheduled principal payments and amounts due at maturity) as of December 31, 2010, and excludes the effects of interest (in thousands):
| |
Total | 2011 | 2012- 2013 |
2014- 2015 |
Thereafter | |||||||||||
|---|---|---|---|---|---|---|---|---|---|---|---|---|---|---|---|---|
Bank borrowings |
$ | 37,700 | (1) | $ | 37,700 | $ | — | $ | — | $ | — | |||||
Senior unsecured notes |
50,000 | — | — | 33,333 | 16,667 | |||||||||||
Bonds payable |
3,730 | 530 | 1,165 | 2,035 | — | |||||||||||
|
$ | 91,430 | $ | 38,230 | $ | 1,165 | $ | 35,368 | $ | 16,667 | ||||||
- (1)
- At December 31, 2010 we had $72.3 million available for borrowing under our Unsecured Credit Agreement. Subsequent to December 31, 2010, we repaid $4.2 million under our Unsecured Credit Agreement. After this payment, we had $33.5 million outstanding under the Unsecured Credit Agreement with $76.5 million available for borrowing.
Off-Balance Sheet Arrangements:
We had no off-balance sheet arrangements as of December 31, 2010.
Liquidity:
We have an Unsecured Credit Agreement in the amount of $110.0 million and it provides for the opportunity to increase the credit amount up to a total of $120.0 million. The Credit Agreement provides a revolving line of credit with no scheduled maturities other than the maturity date of July 17, 2011. Based on our current maximum total indebtedness to total asset value ratio as calculated in the Unsecured Credit Agreement, our current pricing under the Unsecured Credit Agreement is either Prime Rate plus 0.50% or LIBOR plus 1.50% depending on our borrowing election. At the time of borrowing, we may elect the 1, 2, 3 or 6 month LIBOR rate.
At December 31, 2010, we had $6.9 million of cash on hand, $72.3 million available on our $110.0 million Unsecured Credit Agreement, and the uncommitted private shelf agreement with Prudential which provides for the possible issuance of up to $50.0 million of senior unsecured fixed-rate term notes during the three-year issuance period. Also, our potential ability to access the capital markets through the issuance of $64.6 million of common stock under our Amended Equity
49
Distribution Agreement and through the issuance of debt and/or equity securities under our $276.3 million effective shelf registration. Subsequent to December 31, 2010, we repaid $4.2 million under our Unsecured Credit Agreement. After this payment, we had $33.5 million outstanding under the Unsecured Credit Agreement and $76.5 million available for borrowing. As a result, we believe our liquidity and various sources of available capital are sufficient to provide for payment of our current operating costs and debt obligations (both principal and interest) and to provide funds for distribution to the holders of our preferred stock and pay common dividends at least sufficient to maintain our REIT status. The timing, source and amount of cash flows provided by financing activities and used in investing activities are sensitive to the capital markets environment, especially to changes in interest rates.
Item 7A. QUANTITATIVE AND QUALITATIVE DISCLOSURES ABOUT MARKET RISK
You are cautioned that statements contained in this section are forward looking and should be read in conjunction with the disclosure under the heading "Cautionary Statements" and the "Risk Factors" set forth above.
We are exposed to market risks associated with changes in interest rates as they relate to our mortgage loans receivable and debt. Interest rate risk is sensitive to many factors, including governmental monetary and tax policies, domestic and international economic and political considerations and other factors that are beyond our control.
We do not utilize interest rate swaps, forward or option contracts or foreign currencies or commodities, or other types of derivative financial instruments nor do we engage in "off-balance sheet" transactions. The purpose of the following disclosure is to provide a framework to understand our sensitivity to hypothetical changes in interest rates as of December 31, 2010.
Our future earnings, cash flows and estimated fair values relating to financial instruments are dependent upon prevalent market rates of interest, such as LIBOR or term rates of U.S. Treasury Notes. Changes in interest rates generally impact the fair value, but not future earnings or cash flows, of mortgage loans receivable and fixed rate debt. For variable rate debt, such as our revolving line of credit, changes in interest rates generally do not impact the fair value, but do affect future earnings and cash flows.
At December 31, 2010, the fair value of our mortgage loans receivable using a 7.5% discount rate was approximately $67.7 million. A 1% increase in such rates would decrease the estimated fair value of our mortgage loans by approximately $2.1 million while a 1% decrease in such rates would increase their estimated fair value by approximately $2.2 million. At December 31, 2010, the fair value of our senior unsecured notes using a 5.5% discount rate was approximately $49.9 million. A 1% increase in such rates would decrease the estimated fair value of our senior unsecured notes by approximately $2.1 million while a 1% decrease in such rates would increase their estimated fair value by approximately $2.3 million. These discount rates were measured based upon management's estimates of rates currently prevailing for comparable loans available to us and instruments of comparable maturities.
The estimated impact of changes in interest rates discussed above are determined by considering the impact of the hypothetical interest rates on our borrowing costs, lending rates and current U.S. Treasury rates from which our financial instruments may be priced. We do not believe that future market rate risks related to our financial instruments will be material to our financial position or results of operations. These analyses do not consider the effects of industry specific events, changes in the real estate markets, or other overall economic activities that could increase or decrease the fair value of our financial instruments. If such events or changes were to occur, we would consider taking actions to mitigate and/or reduce any negative exposure to such changes. However, due to the uncertainty of the specific actions that would be taken and their possible effects, the sensitivity analysis assumes no changes in our capital structure.
50
Index to Consolidated Financial Statements
and Financial Statement Schedules
51
REPORT OF INDEPENDENT REGISTERED PUBLIC ACCOUNTING FIRM
To the Board of Directors and Stockholders of LTC Properties, Inc.
We have audited the accompanying consolidated balance sheets of LTC Properties, Inc. (the "Company") as of December 31, 2010 and 2009, and the related consolidated statements of income and comprehensive income, equity, and cash flows for each of the three years in the period ended December 31, 2010. Our audits also included the financial statement schedules listed in the Index at Item 15. These financial statements and schedules are the responsibility of the Company's management. Our responsibility is to express an opinion on these financial statements and schedules based on our audits.
We conducted our audits in accordance with the standards of the Public Company Accounting Oversight Board (United States). Those standards require that we plan and perform the audit to obtain reasonable assurance about whether the financial statements are free of material misstatement. An audit includes examining, on a test basis, evidence supporting the amounts and disclosures in the financial statements. An audit also includes assessing the accounting principles used and significant estimates made by management, as well as evaluating the overall financial statement presentation. We believe that our audits provide a reasonable basis for our opinion.
In our opinion, the financial statements referred to above present fairly, in all material respects, the consolidated financial position of LTC Properties, Inc. at December 31, 2010 and 2009, and the consolidated results of its operations and its cash flows for each of the three years in the period ended December 31, 2010, in conformity with U.S. generally accepted accounting principles. Also, in our opinion, the related financial statement schedules, when considered in relation to the basic financial statements taken as a whole, present fairly in all material respects the information set forth therein.
As discussed in Note 2 to the consolidated financial statements, the Company changed its method of accounting for business combinations with the adoption of the FASB Accounting Standards Codification (ASC) Topic 805, Business Combinations, effective January 1, 2009.
We also have audited, in accordance with the standards of the Public Company Accounting Oversight Board (United States), LTC Properties, Inc.'s internal control over financial reporting as of December 31, 2010, based on criteria established in Internal Control-Integrated Framework issued by the Committee of Sponsoring Organizations of the Treadway Commission and our report dated February 23, 2011 expressed an unqualified opinion thereon.
| /s/ Ernst & Young LLP |
Los
Angeles, California
February 23, 2011
52
LTC PROPERTIES, INC.
CONSOLIDATED BALANCE SHEETS
(In thousands, except per share amounts)
| |
December 31, | ||||||||
|---|---|---|---|---|---|---|---|---|---|
| |
2010 | 2009 | |||||||
ASSETS |
|||||||||
Real Estate Investments: |
|||||||||
Land |
$ | 42,254 | $ | 36,205 | |||||
Buildings and improvements |
570,512 | 476,369 | |||||||
Accumulated depreciation and amortization |
(158,709 | ) | (142,839 | ) | |||||
Net operating real estate property |
454,057 | 369,735 | |||||||
Properties held-for-sale, net of accumulated depreciation and amortization: 2010—$0; 2009—$2,341 |
2,900 | 4,545 | |||||||
Net real estate property |
456,957 | 374,280 | |||||||
Mortgage loans receivable, net of allowance for doubtful accounts: 2010—$981; 2009—$704 |
59,026 | 69,883 | |||||||
Real estate investments, net |
515,983 | 444,163 | |||||||
Other Assets: |
|||||||||
Cash and cash equivalents |
6,903 | 8,856 | |||||||
Debt issue costs, net |
743 | 476 | |||||||
Interest receivable |
1,571 | 1,964 | |||||||
Straight-line rent receivable,(1) net of allowance for doubtful accounts: 2010—$1,473; 2009—$629 |
20,090 | 17,124 | |||||||
Prepaid expenses and other assets |
8,202 | 8,663 | |||||||
Other assets related to properties held-for-sale |
11 | 185 | |||||||
Notes receivable |
1,283 | 2,689 | |||||||
Marketable debt securities(2) |
6,478 | 6,473 | |||||||
Total assets |
$ | 561,264 | $ | 490,593 | |||||
LIABILITIES AND EQUITY |
|||||||||
Bank borrowings |
$ | 37,700 | $ | 13,500 | |||||
Senior unsecured notes |
50,000 | — | |||||||
Mortgage loans payable |
— | 7,685 | |||||||
Bonds payable |
3,730 | 4,225 | |||||||
Accrued interest |
675 | 102 | |||||||
Accrued expenses and other liabilities |
9,869 | 7,786 | |||||||
Accrued expenses and other liabilities related to properties held-for-sale |
— | 15 | |||||||
Distributions payable |
1,768 | 2,967 | |||||||
Total liabilities |
103,742 | 36,280 | |||||||
EQUITY |
|||||||||
Stockholders' equity: |
|||||||||
Preferred stock $0.01 par value: 15,000 shares authorized; shares issued and outstanding: 2010—5,536; 2009—7,932 |
126,913 | 186,801 | |||||||
Common stock: $0.01 par value; 45,000 shares authorized; shares issued and outstanding: 2010—26,345 ; 2009—23,312 |
263 | 233 | |||||||
Capital in excess of par value |
398,599 | 326,163 | |||||||
Cumulative net income |
623,491 | 577,629 | |||||||
Other |
264 | 390 | |||||||
Cumulative distributions |
(693,970 | ) | (638,884 | ) | |||||
Total LTC Properties, Inc. stockholders' equity |
455,560 | 452,332 | |||||||
Non-controlling interests |
1,962 | 1,981 | |||||||
Total equity |
457,522 | 454,313 | |||||||
Total liabilities and equity |
$ | 561,264 | $ | 490,593 | |||||
- (1)
- On
December 31, 2010 and 2009, we had $2,822 and $2,480, respectively, in straight-line rent receivable from a lessee that qualifies as a
related party because the lessee's Chief Executive Officer is on our Board of Directors. See Note 12. Transactions with Related Party for further
discussion.
- (2)
- At December 31, 2010 and 2009, we had a $6,500 face value investment in marketable securities issued by an entity that qualifies as a related party because the entity's Chief Executive Officer is on our Board of Directors. See Note 12. Transactions with Related Party for further discussion.
See accompanying notes.
53
LTC PROPERTIES, INC.
CONSOLIDATED STATEMENTS OF INCOME AND COMPREHENSIVE INCOME
(In thousands, except per share amounts)
| |
Years ended December 31, | |||||||||||
|---|---|---|---|---|---|---|---|---|---|---|---|---|
| |
2010 | 2009 | 2008 | |||||||||
Revenues: |
||||||||||||
Rental income(1) |
$ | 64,952 | $ | 59,487 | $ | 57,044 | ||||||
Interest income from mortgage loans |
7,482 | 8,558 | 9,708 | |||||||||
Interest and other income(2) |
1,868 | 1,331 | 2,087 | |||||||||
Total revenues |
74,302 | 69,376 | 68,839 | |||||||||
Expenses: |
||||||||||||
Interest expense |
2,653 | 2,418 | 4,114 | |||||||||
Depreciation and amortization |
15,963 | 14,529 | 14,667 | |||||||||
Provisions for doubtful accounts |
2,010 | 775 | 85 | |||||||||
Operating and other expenses |
8,155 | 7,519 | 7,006 | |||||||||
Total expenses |
28,781 | 25,241 | 25,872 | |||||||||
Income from continuing operations |
45,521 | 44,135 | 42,967 | |||||||||
Discontinued operations: |
||||||||||||
Loss from discontinued operations |
222 | 225 | 225 | |||||||||
Gain on sale of assets, net |
310 | — | 92 | |||||||||
Net income from discontinued operations |
532 | 225 | 317 | |||||||||
Net income |
46,053 | 44,360 | 43,284 | |||||||||
Income allocated to non-controlling interests |
(191 | ) | (296 | ) | (307 | ) | ||||||
Net income attributable to LTC Properties, Inc. |
45,862 | 44,064 | 42,977 | |||||||||
Income allocated to participating securities |
(230 | ) | (139 | ) | (159 | ) | ||||||
Income allocated to preferred stockholders |
(16,045 | ) | (14,515 | ) | (14,401 | ) | ||||||
Net income allocable to common stockholders |
$ | 29,587 | $ | 29,410 | $ | 28,417 | ||||||
Basic earnings per common share (See Note 14): |
||||||||||||
Continuing operations |
$ | 1.19 | $ | 1.26 | $ | 1.22 | ||||||
Discontinued operations |
$ | 0.02 | $ | 0.01 | $ | 0.01 | ||||||
Net income allocable to common stockholders |
$ | 1.21 | $ | 1.27 | $ | 1.24 | ||||||
Diluted earnings per common share (See Note 14): |
||||||||||||
Continuing operations |
$ | 1.18 | $ | 1.26 | $ | 1.22 | ||||||
Discontinued operations |
$ | 0.02 | $ | 0.01 | $ | 0.01 | ||||||
Net income allocable to common stockholders |
$ | 1.21 | $ | 1.27 | $ | 1.24 | ||||||
Weighted average shares used to calculate earnings per common share: |
||||||||||||
Basic |
24,495 | 23,099 | 22,974 | |||||||||
Diluted |
24,568 | 23,182 | 23,089 | |||||||||
Comprehensive Income: |
||||||||||||
Net income |
$ | 46,053 | $ | 44,360 | $ | 43,284 | ||||||
Reclassification adjustment |
(126 | ) | (345 | ) | (221 | ) | ||||||
Comprehensive income |
$ | 45,927 | $ | 44,015 | $ | 43,063 | ||||||
- (1)
- During
2010, 2009 and 2008, we received $4,160, $4,058, and $3,917, respectively, in rental income and recorded $342, $443 and $535, respectively, in
straight-line rental income from a lessee that qualifies as a related party because the lessee's Chief Executive Officer is on our Board of Directors. See Note 12. Transactions with Related Party
for further discussion.
- (2)
- During 2010, 2009 and 2008 we recognized $720, $720, and $728, respectively, of interest income from an entity that qualifies as a related party because the entity's Chief Executive Officer is on our Board of Directors. See Note 12. Transactions with Related Party for further discussion.
NOTE: Computations of per share amounts from continuing operations, discontinued operations and net income are made independently. Therefore, the sum of per share amounts from continuing operations and discontinued operations may not agree with the per share amounts from net income allocable to common stockholders.
See accompanying notes.
54
LTC PROPERTIES, INC.
CONSOLIDATED STATEMENTS OF EQUITY
(In thousands, except per share amounts)
| |
Shares | |
|
|
|
|
|
|
|
|
||||||||||||||||||||||||
|---|---|---|---|---|---|---|---|---|---|---|---|---|---|---|---|---|---|---|---|---|---|---|---|---|---|---|---|---|---|---|---|---|---|---|
| |
Preferred Stock |
Common Stock |
Preferred Stock |
Common Stock |
Capital in Excess of Par Value |
Cumulative Net Income |
Other | Cumulative Distributions |
Total Stockholders' Equity |
Non- controlling Interests |
Total Equity |
|||||||||||||||||||||||
Balance—December 31, 2007 |
8,802 | 22,872 | $ | 208,553 | $ | 229 | $ | 316,609 | $ | 490,588 | $ | 956 | $ | (537,779 | ) | $ | 479,156 | $ | 3,518 | $ | 482,674 | |||||||||||||
Conversion of 8.5% Series E Preferred Stock |
(124 | ) | 247 | (3,085 | ) | 2 | 3,083 | — | — | — | — | — | — | |||||||||||||||||||||
Reclassification adjustment |
— | — | — | — | — | — | (221 | ) | — | (221 | ) | — | (221 | ) | ||||||||||||||||||||
Stock option exercises |
— | 17 | — | — | 416 | — | — | — | 416 | — | 416 | |||||||||||||||||||||||
Repurchase of stock |
(636 | ) | — | (15,908 | ) | — | 642 | — | — | 989 | (14,277 | ) | — | (14,277 | ) | |||||||||||||||||||
Net income |
— | — | — | — | — | 42,977 | — | — | 42,977 | 307 | 43,284 | |||||||||||||||||||||||
Vested stock options |
— | — | — | — | 1,088 | — | — | — | 1,088 | — | 1,088 | |||||||||||||||||||||||
Vested restricted stock |
— | — | — | — | 141 | — | — | — | 141 | — | 141 | |||||||||||||||||||||||
Non-controlling interests conversion |
— | — | — | — | — | — | — | — | — | (374 | ) | (374 | ) | |||||||||||||||||||||
Non-controlling interests preferred return |
— | — | — | — | — | — | — | — | — | (317 | ) | (317 | ) | |||||||||||||||||||||
Preferred stock dividends |
— | — | — | — | — | — | — | (15,390 | ) | (15,390 | ) | — | (15,390 | ) | ||||||||||||||||||||
Common stock cash distributions ($1.56 per share) |
— | — | — | — | — | — | — | (36,012 | ) | (36,012 | ) | — | (36,012 | ) | ||||||||||||||||||||
Balance—December 31, 2008 |
8,042 | 23,136 | 189,560 | 231 | 321,979 | 533,565 | 735 | (588,192 | ) | 457,878 | 3,134 | 461,012 | ||||||||||||||||||||||
Conversion of 8.5% Series E Preferred Stock |
(1 | ) | 2 | (22 | ) | — | 22 | — | — | — | — | — | — | |||||||||||||||||||||
Reclassification adjustment |
— | — | — | — | — | — | (345 | ) | — | (345 | ) | — | (345 | ) | ||||||||||||||||||||
Stock option exercises |
— | 35 | — | — | 770 | — | — | — | 770 | — | 770 | |||||||||||||||||||||||
Repurchase of stock |
(109 | ) | (1 | ) | (2,737 | ) | — | 95 | — | — | 626 | (2,016 | ) | — | (2,016 | ) | ||||||||||||||||||
Issue common stock |
— | 30 | — | — | 766 | — | — | — | 766 | — | 766 | |||||||||||||||||||||||
Issue restricted stock |
— | 43 | — | 1 | (1 | ) | — | — | — | — | — | — | ||||||||||||||||||||||
Net income |
— | — | — | — | — | 44,064 | — | — | 44,064 | 296 | 44,360 | |||||||||||||||||||||||
Vested stock options |
— | — | — | — | 147 | — | — | — | 147 | — | 147 | |||||||||||||||||||||||
Vested restricted stock |
— | — | — | — | 1,242 | — | — | — | 1,242 | — | 1,242 | |||||||||||||||||||||||
Non-controlling interests conversion |
— | 67 | — | 1 | 1,143 | — | — | — | 1,144 | (1,144 | ) | — | ||||||||||||||||||||||
Non-controlling interests preferred return |
— | — | — | — | — | — | — | — | — | (305 | ) | (305 | ) | |||||||||||||||||||||
Preferred stock dividends |
— | — | — | — | — | — | — | (15,141 | ) | (15,141 | ) | — | (15,141 | ) | ||||||||||||||||||||
Common stock cash distributions ($1.56 per share) |
— | — | — | — | — | — | — | (36,177 | ) | (36,177 | ) | — | (36,177 | ) | ||||||||||||||||||||
Balance—December 31, 2009 |
7,932 | 23,312 | 186,801 | 233 | 326,163 | 577,629 | 390 | (638,884 | ) | 452,332 | 1,981 | 454,313 | ||||||||||||||||||||||
Conversion of 8.5% Series E Preferred Stock |
(33 | ) | 66 | (823 | ) | 1 | 822 | — | — | — | — | — | — | |||||||||||||||||||||
8.5% Series E Preferred Stock full redemption |
(5 | ) | — | (123 | ) | — | 6 | — | — | (6 | ) | (123 | ) | — | (123 | ) | ||||||||||||||||||
8.0% Series F Preferred Stock partial redemption |
(2,358 | ) | — | (58,942 | ) | — | 2,377 | — | — | (2,377 | ) | (58,942 | ) | — | (58,942 | ) | ||||||||||||||||||
Reclassification adjustment |
— | — | — | — | — | — | (126 | ) | — | (126 | ) | — | (126 | ) | ||||||||||||||||||||
Stock option exercises |
— | 12 | — | — | 182 | — | — | — | 182 | — | 182 | |||||||||||||||||||||||
Issue common stock |
— | 2,746 | — | 27 | 67,766 | — | — | — | 67,793 | — | 67,793 | |||||||||||||||||||||||
Issue restricted stock |
— | 209 | — | 2 | (2 | ) | — | — | — | — | — | — | ||||||||||||||||||||||
Net income |
— | — | — | — | — | 45,862 | — | — | 45,862 | 191 | 46,053 | |||||||||||||||||||||||
Vested stock options |
— | — | — | — | 75 | — | — | — | 75 | — | 75 | |||||||||||||||||||||||
Vested restricted stock |
— | — | — | — | 1,210 | — | — | — | 1,210 | — | 1,210 | |||||||||||||||||||||||
Non-controlling interests preferred return |
— | — | — | — | — | — | — | — | — | (210 | ) | (210 | ) | |||||||||||||||||||||
Preferred stock dividends |
— | — | — | — | — | — | — | (13,662 | ) | (13,662 | ) | — | (13,662 | ) | ||||||||||||||||||||
Common stock cash distributions ($1.58 per share) |
— | — | — | — | — | — | — | (39,041 | ) | (39,041 | ) | — | (39,041 | ) | ||||||||||||||||||||
Balance—December 31, 2010 |
5,536 | 26,345 | $ | 126,913 | $ | 263 | $ | 398,599 | $ | 623,491 | $ | 264 | $ | (693,970 | ) | $ | 455,560 | $ | 1,962 | $ | 457,522 | |||||||||||||
See accompanying notes.
55
LTC PROPERTIES, INC.
CONSOLIDATED STATEMENTS OF CASH FLOWS
(In thousands)
| |
Year ended December 31, | |||||||||||
|---|---|---|---|---|---|---|---|---|---|---|---|---|
| |
2010 | 2009 | 2008 | |||||||||
OPERATING ACTIVITIES: |
||||||||||||
Net income |
$ | 46,053 | $ | 44,360 | $ | 43,284 | ||||||
Adjustments to reconcile net income to net cash provided by operating activities: |
||||||||||||
Depreciation and amortization—continuing and discontinued operations |
16,109 | 14,822 | 14,960 | |||||||||
Stock-based compensation expense |
1,285 | 1,389 | 1,229 | |||||||||
Gain on sale of assets, net |
(310 | ) | — | (92 | ) | |||||||
Straight-line rental income—continuing and discontinued operations(1) |
(3,822 | ) | (4,241 | ) | (3,492 | ) | ||||||
Provisions for doubtful accounts |
2,010 | 775 | 85 | |||||||||
Other non-cash items, net |
1,231 | 851 | 870 | |||||||||
Decrease in interest receivable |
95 | 91 | 152 | |||||||||
Increase in prepaid, other assets and allowance |
(310 | ) | (285 | ) | (113 | ) | ||||||
Increase (decrease) in accrued interest payable |
573 | (149 | ) | (98 | ) | |||||||
Increase (decrease) in accrued expenses and other liabilities |
2,411 | 2,727 | (401 | ) | ||||||||
Net cash provided by operating activities |
65,325 | 60,340 | 56,384 | |||||||||
INVESTING ACTIVITIES: |
||||||||||||
Investment in real estate properties and capital improvements, net |
(100,424 | ) | (16,984 | ) | (5,369 | ) | ||||||
Conversion of mortgage loans to owned properties |
— | — | (13 | ) | ||||||||
Proceeds from sale of real estate investments, net |
4,864 | — | 555 | |||||||||
Investment in real estate mortgages |
(1,694 | ) | (221 | ) | (9,635 | ) | ||||||
Principal payments on mortgage loans receivable |
8,403 | 7,843 | 18,990 | |||||||||
Advances under notes receivable |
(100 | ) | (375 | ) | (420 | ) | ||||||
Principal payments received on notes receivable |
1,573 | 671 | 848 | |||||||||
Net cash (used in) provided by investing activities |
(87,378 | ) | (9,066 | ) | 4,956 | |||||||
FINANCING ACTIVITIES: |
||||||||||||
Bank borrowings |
83,700 | 19,000 | — | |||||||||
Repayment of bank borrowings |
(59,500 | ) | (5,500 | ) | — | |||||||
Proceeds from issuance of senior unsecured notes |
50,000 | — | — | |||||||||
Principal payments on mortgage loans and bonds payable |
(8,180 | ) | (24,843 | ) | (15,542 | ) | ||||||
Proceeds from common stock offering |
67,793 | 766 | — | |||||||||
Repurchase of common stock |
— | (16 | ) | — | ||||||||
Repurchase of preferred stock |
— | (2,000 | ) | (14,276 | ) | |||||||
Redemption of preferred stock |
(59,065 | ) | — | — | ||||||||
Distributions paid to stockholders |
(53,902 | ) | (51,373 | ) | (51,786 | ) | ||||||
Redemption of non-controlling interests |
— | — | (510 | ) | ||||||||
Distributions paid to non-controlling interests |
(210 | ) | (305 | ) | (317 | ) | ||||||
Other |
(536 | ) | 735 | (422 | ) | |||||||
Net cash provided by (used in) financing activities |
20,100 | (63,536 | ) | (82,853 | ) | |||||||
Decrease in cash and cash equivalents |
(1,953 | ) | (12,262 | ) | (21,513 | ) | ||||||
Cash and cash equivalents, beginning of year |
8,856 | 21,118 | 42,631 | |||||||||
Cash and cash equivalents, end of year |
$ | 6,903 | $ | 8,856 | $ | 21,118 | ||||||
Supplemental disclosure of cash flow information: |
||||||||||||
Interest paid |
$ | 1,628 | $ | 2,177 | $ | 3,879 | ||||||
Non-cash investing and financing transactions: |
||||||||||||
See Note 4: Supplemental Cash Flow Information for further discussion. |
||||||||||||
- (1)
- During 2010, 2009 and 2008, we recorded $342, $443, and $535, respectively, in straight-line rental income from a lessee that qualifies as a related party because the lessee's Chief Executive Officer is on our Board of Directors. See Note 12. Transactions with Related Party for further discussion.
See accompanying notes.
56
LTC PROPERTIES, INC.
NOTES TO CONSOLIDATED FINANCIAL STATEMENTS
1. The Company
LTC Properties, Inc. (or LTC), a Maryland corporation, commenced operations on August 25, 1992. LTC is a real estate investment trust (or REIT) that invests primarily in senior housing and long term care properties through mortgage loans, property lease transactions and other investments.
2. Summary of Significant Accounting Policies
Basis of Presentation. The accompanying consolidated financial statements include the accounts of LTC, our wholly-owned subsidiaries and our controlled partnership. All intercompany investments, accounts and transactions have been eliminated. Control over the partnership is based on the provisions of the partnership agreement that provides us with a controlling financial interest in the partnership. Under the terms of the partnership agreement, we, as the general partner, are responsible for the management of the partnership's assets, business and affairs. Our rights and duties in management of the partnership include making all operating decisions, setting the capital budget, executing all contracts, making all employment decisions, and handling the purchase and disposition of assets, among others. We, as the general partner, are responsible for the ongoing, major, and central operations of the partnership and make all management decisions. In addition, we, as the general partner, assume the risk for all operating losses, capital losses, and are entitled to substantially all capital gains (appreciation).
The Financial Accounting Standard Board (or FASB) created a framework for evaluating whether a general partner or a group of general partners controls a limited partnership or a managing member or a group of managing members controls a limited liability company and therefore should consolidate the entity. The guidance states that the presumption of general partner or managing member control would be overcome only when the limited partners or non-managing members have certain specific rights as described in the guidance. The limited partners have virtually no rights and are precluded from taking part in the operation, management or control of the partnership. The limited partners are also precluded from transferring their partnership interests without the expressed permission of the general partner. However, we can transfer our interest without consultation or permission of the limited partners. We consolidate our partnerships in accordance with the guidance.
The FASB requires the classification of non-controlling interests (formerly minority interests) as a component of consolidated equity in the consolidated balance sheet subject to the provisions of the rules governing classification and measurement of redeemable securities. The guidance requires consolidated net income to be reported at the amounts attributable to both the controlling and non-controlling interests. The calculation of earnings per share will be based on income amounts attributable to the controlling interest. Also, this guidance addresses accounting and reporting for a change in control of a subsidiary.
Certain reclassifications have been made to the prior period consolidated financial statements to conform to the current period presentation, including changes as a result of the application of accounting guidance for properties held-for-sale.
The FASB addresses when a company should include in its financial statements the assets, liabilities and activities of another entity. The guidance requires that we consolidate a "variable interest entity" if we are subject to a majority of the risk of loss from the "variable interest entity's" activities, or are entitled to receive a majority of the entity's residual returns, or both. The guidance also requires disclosure about "variable interest entities" that we are not required to consolidate but in which we have a significant variable interest. We believe that as of December 31, 2010, we do not have investments in any entities that meet the definition of a "variable interest entity."
57
LTC PROPERTIES, INC.
NOTES TO CONSOLIDATED FINANCIAL STATEMENTS (Continued)
Use of Estimates. Preparation of the consolidated financial statements in conformity with U.S. generally accepted accounting principles (or U.S. GAAP)requires management to make estimates and assumptions that affect the amounts reported in the consolidated financial statements and accompanying notes. Actual results could differ from those estimates.
Cash Equivalents. Cash equivalents consist of highly liquid investments with a maturity of three months or less when purchased and are stated at cost which approximates market.
Land, Buildings and Improvements. Land, buildings, improvements and equipments are recorded at fair value on the acquisition date and allocated in accordance with U.S. GAAP. The FASB accounting guidance requires the acquiring entity to measure the assets acquired, liabilities assumed (including contingencies) and any non-controlling interests at their fair values on the acquisition date. In determining fair value, we use current appraisals or other third party opinions of value. This guidance also requires that acquisition-related transaction costs be expensed as incurred and acquired research and development value be capitalized. In addition, acquisition-related restructuring costs are to be capitalized only if they meet certain criteria.
Depreciation is computed principally by the straight-line method for financial reporting purposes which generally range from 3 to 5 years for computers, 7 to 10 years for equipment, 35 to 40 years for buildings and 10 to 20 years for building improvements.
Mortgage Loans Receivable. Mortgage loans receivable we originate are recorded on an amortized cost basis. Mortgage loans we acquire are recorded at fair value at the time of purchase net of any related premium or discount which is amortized as a yield adjustment to interest income over the life of the loan.
Allowance for Doubtful Accounts. We maintain an allowance for doubtful accounts. The allowance for doubtful accounts is based upon the expected collectability of our receivables and is maintained at a level believed adequate to absorb potential losses in our receivables. In determining the allowance we perform a quarterly evaluation of all receivables. If this evaluation indicates that there is a greater risk of receivable charge-offs, additional allowances are recorded in current period earnings.
Impairments. Impairment losses are recorded when events or changes in circumstances indicate the asset is impaired and the estimated undiscounted cash flows to be generated by the asset are less than its carrying amount. Management assesses the impairment of properties individually and impairment losses are calculated as the excess of the carrying amount over the fair value of assets to be held and used, and carrying amount over the fair value less cost to sell in instances where management has determined that we will dispose of the property. In determining fair value, we use current appraisals or other third party opinions of value and other estimates of fair value such as estimated discounted future cash flows.
Also, we evaluate the carrying values of mortgage loans receivable on an individual basis. Management periodically evaluates the realizability of future cash flows from the mortgage loan receivable when events or circumstances, such as the non-receipt of principal and interest payments and/or significant deterioration of the financial condition of the borrower, indicate that the carrying amount of the mortgage loan receivable may not be recoverable. An impairment charge is recognized in current period earnings and is calculated as the difference between the carrying amount of the mortgage loan receivable and the discounted cash flows expected to be received, or if foreclosure is probable, the fair value of the collateral securing the mortgage.
58
LTC PROPERTIES, INC.
NOTES TO CONSOLIDATED FINANCIAL STATEMENTS (Continued)
Accounting Standards Codification No. 320, Investments—Debt and Equity Securities (or ASC 320), requires an entity to assess whether it intends to sell, or it is more likely than not that it will be required to sell, a debt security in an unrealized loss position before recovery of its amortized cost basis. If either of these criteria is met, the entire difference between fair value and amortized cost is recognized as impairment through earnings. For securities that do not meet the aforementioned criteria, the amount of impairment is split into two components as follows: 1) other-than-temporary impairment (or OTTI) related to other factors such as an entity's ability to make scheduled interest or principal payments on the debt securities, which is recognized in other comprehensive income and 2) OTTI related to credit loss, which must be recognized in the income statement. The credit loss is determined as the difference between the present value of the cash flows expected to be collected and the amortized cost basis.
Fair Value of Financial Instruments. The FASB requires the disclosure of fair value information about financial instruments for which it is practicable to estimate that value. In cases where quoted market prices are not available, fair values are based on estimates using present value or other valuation techniques. Those techniques are significantly affected by the assumptions used, including the discount rate and estimates of future cash flows. In that regard, the derived fair value estimates cannot be substantiated by comparison to independent markets and, in many cases, could not be realized in immediate settlement of the instrument. Accordingly, the aggregate fair market value amounts presented in the notes to these consolidated financial statements do not represent our underlying carrying value in financial instruments.
The FASB provides guidance for using fair value to measure assets and liabilities, the information used to measure fair value, and the effect of fair value measurements on earnings. The FASB emphasizes that fair value is a market-based measurement, not an entity-specific measurement. Therefore, a fair value measurement should be determined based on the assumptions that market participants would use in pricing the asset or liability. As a basis for considering market participant assumptions in fair value measurements, the FASB establishes a fair value hierarchy that distinguishes between market participant assumptions based on market data obtained from sources independent of the reporting entity (observable inputs that are classified within Levels 1 and 2 of the hierarchy) and the reporting entity's own assumptions about market participant assumptions (unobservable inputs classified within Level 3 of the hierarchy). Level 1 inputs utilize quoted prices (unadjusted) in active markets for identical assets or liabilities that we have the ability to access. Level 2 inputs are inputs other than quoted prices included in Level 1 that are observable for the asset or liability, either directly or indirectly. Level 2 inputs may include quoted prices for similar assets and liabilities in active markets, as well as inputs that are observable for the asset or liability (other than quoted prices).
The fair value guidance issued by the FASB excludes accounting pronouncements that address fair value measurements for purposes of lease classification or measurement. However, this scope exception does not apply to assets acquired and liabilities assumed in a business combination that are required to be measured at fair value, regardless of whether those assets and liabilities are related to leases.
In accordance with the accounting guidance regarding the fair value option for financial assets and financial liabilities, entities are permitted to choose to measure certain financial assets and liabilities at fair value, with the change in unrealized gains and losses on items for which the fair value option has been elected reported in earnings. We did not adopt the elective fair market value option in our consolidated financial statements.
59
LTC PROPERTIES, INC.
NOTES TO CONSOLIDATED FINANCIAL STATEMENTS (Continued)
The FASB requires disclosures about fair value of financial instruments for interim reporting periods of publicly traded companies as well as in annual financial statements. See Note 16. Fair Value Measurements for the disclosure about fair value of our financial instruments.
Investments. Investments in marketable debt and equity securities are categorized as trading, available-for-sale or held-to-maturity. Available-for-sale securities are stated at fair value, with the unrealized gains and losses, reported in other comprehensive income until realized. Realized gains and losses and declines in value judged to be other-than-temporary on available-for-sale securities are included in net income. The cost of securities sold is based on the specific identification method. Interest and dividends on securities classified as available-for-sale are included in interest and other income. Our investment in marketable debt securities is classified as held-to-maturity because we have the positive intent and ability to hold the securities to maturity. Held-to-maturity securities are stated at amortized cost, adjusted for amortization of premiums and accretion of discounts to maturity.
Revenue Recognition. Interest income on mortgage loans is recognized using the effective interest method. We follow a policy related to mortgage interest whereby we consider a loan to be non-performing after 60 days of non-payment of amounts due and do not recognize unpaid mortgage interest income from that loan until the past due amounts have been received.
Rental income from operating leases is recognized in accordance with U.S. GAAP. Substantially all of our leases contain provisions for specified annual increases over the rents of the prior year and are generally computed in one of four methods depending on specific provisions of each lease as follows:
- (i)
- a
specified annual increase over the prior year's rent, generally between 2.0% and 3.0%;
- (ii)
- a
calculation based on the Consumer Price Index;
- (iii)
- as
a percentage of facility net patient revenues in excess of base amounts or
- (iv)
- specific dollar increases.
The FASB does not provide for the recognition of contingent revenue until all possible contingencies have been eliminated. We consider the operating history of the lessee and the general condition of the industry when evaluating whether all possible contingencies have been eliminated and have historically, and expect in the future, to not include contingent rents as income until received. We follow a policy related to rental income whereby we consider a lease to be non-performing after 60 days of non-payment of past due amounts and do not recognize unpaid rental income from that lease until the amounts have been received.
Rental revenues relating to non-contingent leases that contain specified rental increases over the life of the lease are recognized on the straight-line basis. Recognizing income on a straight-line basis requires us to calculate the total non-contingent rent containing specified rental increases over the life of the lease and to recognize the revenue evenly over that life. This method results in rental income in the early years of a lease being higher than actual cash received, creating a straight-line rent receivable asset included in our consolidated balance sheet. At some point during the lease, depending on its terms, the cash rent payments eventually exceed the straight-line rent which results in the straight-line rent receivable asset decreasing to zero over the remainder of the lease term. We assess the collectability of straight-line rent in accordance with the applicable accounting standards and our reserve policy. If the lessee becomes delinquent in rent owed under the terms of the lease, we may provide a reserve against the recognized straight-line rent receivable asset for a portion, up to its full value, that we estimate may not be recoverable.
60
LTC PROPERTIES, INC.
NOTES TO CONSOLIDATED FINANCIAL STATEMENTS (Continued)
Net loan fee income and commitment fee income are amortized over the life of the related loan. Costs associated with leases are deferred and allocated over the lease term in proportion to the recognition of rental income.
Federal Income Taxes. LTC qualifies as a REIT under the Internal Revenue Code of 1986, as amended, and as such, no provision for Federal income taxes has been made. A REIT is required to distribute at least 90% of its taxable income to its stockholders and a REIT may deduct dividends in computing taxable income. If a REIT distributes 100% of its taxable income and complies with other Internal Revenue Code requirements, it will generally not be subject to Federal income taxation.
For Federal tax purposes, depreciation is generally calculated using the straight-line method over a period of 27.5 years. Earnings and profits, which determine the taxability of distributions to stockholders, use the straight-line method over 40 years. Both Federal and earnings and profits differ from net income for financial statement purposes principally due to the treatment of certain interest income, rental income, other expense items, impairment charges and the depreciable lives and basis of assts. At December 31, 2010, the book basis of our net depreciable assets exceeds our tax basis (unaudited) by approximately $71,310,000, primarily due to additional depreciation taken for tax purposes.
The FASB clarified the accounting for income taxes by prescribing the minimum recognition threshold a tax position is required to meet before being recognized in the financial statements. The guidance utilizes a two-step approach for evaluating tax positions. Recognition (step one) occurs when a company concludes that a tax position, based solely on its technical merits, is more likely than not to be sustained upon examination. Measurement (step two) is only addressed if step one has been satisfied (i.e., the position is more likely than not to be sustained). Under step two, the tax benefit is measured as the largest amount of benefit (determined on a cumulative probability basis) that is more likely than not to be realized upon ultimate settlement. We currently do not have any uncertain tax positions that would not be sustained on its technical merits on a more-likely than not basis.
We may from time to time be assessed interest or penalties by certain tax jurisdictions. In the event we have received an assessment for interest and/or penalties, it has been classified in our consolidated financial statements as operating and other expenses.
Concentrations of Credit Risks. Financial instruments which potentially subject us to concentrations of credit risk consist primarily of cash and cash equivalents, mortgage loans receivable, marketable debt securities and operating leases on owned properties. Our financial instruments, mortgage loans receivable and operating leases, are subject to the possibility of loss of carrying value as a result of the failure of other parties to perform according to their contractual obligations or changes in market prices which may make the instrument less valuable. We obtain various collateral and other protective rights, and continually monitor these rights, in order to reduce such possibilities of loss. In addition, we provide reserves for potential losses based upon management's periodic review of our portfolio.
Discontinued Operations. Properties classified as held-for-sale on the consolidated balance sheet includes only those properties available for immediate sale in their present condition and for which management believes that it is probable that a sale of the property will be completed within one year. Accordingly, we record reclassification adjustments to reflect properties sold subsequent to the respective consolidated balance sheet date as held-for-sale in the prior period consolidated balance sheet. Properties held-for-sale are carried at the lower of cost or fair value less estimated selling costs. No depreciation expense is recognized on properties held-for-sale once they have been classified as
61
LTC PROPERTIES, INC.
NOTES TO CONSOLIDATED FINANCIAL STATEMENTS (Continued)
such. The operating results of real estate assets designated as held-for-sale are included in discontinued operations in the consolidated statement of income. In addition, all gains and losses from real estate sold are also included in discontinued operations. For comparative purposes, as required by the FASB accounting guidance, the prior year's operating results of sold and held-for-sale real estate assets have been reclassified to discontinued operations in the consolidated income statement for the prior years. See Note 6. Real Estate Investments, for a detail of the property classified as held for sale during 2010 and the related components of the net income from discontinued operations.
Net Income Per Share. Basic earnings per share is calculated using the weighted-average shares of common stock outstanding during the period excluding common stock equivalents. Diluted earnings per share includes the effect of all dilutive common stock equivalents.
In accordance with the accounting guidance regarding the determination of whether instruments granted in share-based payments transactions are participation securities, we have applied the two-class method of computing basic earnings per share. This guidance clarifies that outstanding unvested share-based payment awards that contain rights to non-forfeitable dividends participate in undistributed earnings with common stockholders and are considered participating securities.
Stock-Based Compensation. The FASB requires all share-based payments to employees, including grants of employee stock options, to be recognized in the income statement based on their fair values. We use the Black-Scholes-Merton formula to estimate the value of stock options granted to employees. This model requires management to make certain estimates including stock volatility, expected dividend yield and the expected term. If management incorrectly estimates these variables, the results of operations could be affected. The FASB also requires the benefits of tax deductions in excess of recognized compensation cost to be reported as a financing cash flow. Because we qualify as a REIT under the Internal Revenue Code of 1986, as amended, we are not subject to Federal income taxation. Therefore, this reporting requirement does not have an impact on our statement of cash flows.
Segment Disclosures. The FASB accounting guidance regarding disclosures about segments of an enterprise and related information establishes standards for the manner in which public business enterprises report information about operating segments. Our investment decisions in senior housing and long term care healthcare properties, including mortgage loans, property lease transaction and other investments, are made and resulting investments are managed as a single operating segment for internal reporting and for internal decision-making purposes. Therefore, we have concluded that we operate as a single segment.
3. Major Operators
We have three operators, based on properties subject to lease agreements and secured by mortgage loans that each represent between 10% and 20% of our total assets and three operators from each of which we derive over 10% of our rental revenue and interest income from mortgage loans.
In 2006, Extendicare Services, Inc. (or EHSI), one of our major operators, effected a reorganization whereby it completed a spin-off of Assisted Living Concepts, Inc. (or ALC). ALC is now a NYSE traded public company operating assisted living centers. The remaining EHSI assets and operations were converted into a Canadian REIT (or Extendicare REIT) listed on the Toronto Stock Exchange (or TSX). Both Extendicare REIT and ALC continue to be parties to the leases with us.
Brookdale Senior Living Communities, Inc. (or Brookdale Communities) is a wholly owned subsidiary of a publicly traded company, Brookdale Senior Living, Inc. (or Brookdale).
62
NOTES TO CONSOLIDATED FINANCIAL STATEMENTS (Continued)
The following table summarizes Extendicare REIT's, ALC's and Brookdale's financial information as of and for the nine months ended September 30, 2010 per the operators' public filings (in thousands, unaudited). Our other operator is privately owned and thus no public financial information is available:
| |
Extendicare REIT(1) | ALC | Brookdale | |||||||
|---|---|---|---|---|---|---|---|---|---|---|
Current assets |
539,929 | 55,195 | 328,935 | |||||||
Non-current assets |
1,165,724 | 425,898 | 4,209,128 | |||||||
Current liabilities |
373,981 | 35,818 | 707,181 | |||||||
Non-current liabilities |
1,306,405 | 161,167 | 2,768,112 | |||||||
Stockholders' equity |
25,267 | 284,108 | 1,062,770 | |||||||
Gross revenue |
1,540,705 |
174,693 |
1,651,860 |
|||||||
Operating expenses |
1,298,494 | 149,581 | 1,603,638 | |||||||
Income from continuing operations |
34,869 | 11,076 | (40,765 | ) | ||||||
Net income (loss) |
33,983 | 11,076 | (40,765 | ) | ||||||
Cash provided by operations |
114,516 |
36,311 |
179,155 |
|||||||
Cash used in investing activities |
(29,721 | ) | (12,394 | ) | (95,265 | ) | ||||
Cash provided by (used in) financing activities |
50,700 | 8,857 | (81,299 | ) | ||||||
- (1)
- The
numbers shown for Extendicare REIT are in Canadian dollars and are prepared in accordance with Canadian GAAP.
- *
- The financial information contained in the foregoing table for Extendicare REIT, ALC and Brookdale is based on information we obtained from such companies' available public filing and, therefore, we have not independently verified the accuracy of such information.
Extendicare REIT and ALC, collectively lease 37 assisted living properties with a total of 1,427 units owned by us representing approximately 10.3%, or $57,611,000, of our total assets at December 31, 2010 and 15.1% of rental revenue and interest income from mortgage loans recognized as of December 31, 2010.
Brookdale Communities, a wholly owned subsidiary of Brookdale, leases 35 assisted living properties with a total of 1,416 units owned by us representing approximately 10.2%, or $57,429,000, of our total assets at December 31, 2010 and 14.2% of rental revenue and interest income from mortgage loans recognized as of December 31, 2010.
Preferred Care, Inc. (or Preferred Care), through various wholly owned subsidiaries, operates 30 skilled nursing properties and two other senior housing properties that we own or on which we hold mortgages secured by first trust deeds. These properties consist of a total of 3,861 skilled nursing beds and 49 assisted living units. This represents approximately 10.5%, or $58,747,000, of our total assets at December 31, 2010 and 14.6% of rental revenue and interest income from mortgage loans recognized as of December 31, 2010. They also operate one skilled nursing property under a sub-lease with another lessee we have which is not included in the Preferred Care rental revenue and interest income from mortgage loans.
Our financial position and ability to make distributions may be adversely affected by financial difficulties experienced by Brookdale Communities, Extendicare REIT & ALC, Preferred Care, or any of our lessees and borrowers, including any bankruptcies, inability to emerge from bankruptcy, insolvency or general downturn in business of any such operator, or in the event any such operator does not renew and/or extend its relationship with us or our borrowers when it expires.
63
LTC PROPERTIES, INC.
NOTES TO CONSOLIDATED FINANCIAL STATEMENTS (Continued)
4. Supplemental Cash Flow Information
| |
For the year ended December 31, | |||||||||
|---|---|---|---|---|---|---|---|---|---|---|
| |
2010 | 2009 | 2008 | |||||||
| |
(in thousands) |
|||||||||
Non-cash investing and financing transactions: |
||||||||||
Conversion of mortgage loans to owned properties |
$ | 2,900 | $ | — | $ | 4,704 | ||||
Conversion of preferred stock to common stock |
823 | 22 | 3,085 | |||||||
Redemption of non-controlling interest |
— | 1,144 | 136 | |||||||
Restricted stock issued, net of cancellations |
2 | 1 | — | |||||||
5. Impairment Charge
No impairment charges on our real estate investments held and used were recorded during 2010, 2009 or 2008. We have evaluated all assets and believe there were no other-than-temporary impairments. However in past years, the long term care industry experienced significant adverse changes which resulted in operating losses by certain of our lessees and borrowers and in some instances the filing by certain lessees and borrowers for bankruptcy protection. Thus, we cannot predict what, if any, impairment charge may be needed in the future.
6. Real Estate Investments
Mortgage Loans. The following table summarizes our investments in mortgage loans secured by first mortgages at December 31, 2010 (in thousands):
| |
|
|
(Unaudited) | |||||||||||||||||||
|---|---|---|---|---|---|---|---|---|---|---|---|---|---|---|---|---|---|---|---|---|---|---|
| |
|
|
|
|
Number of | |
||||||||||||||||
Type of Property
|
Gross Investments |
Percentage of Investments |
Number of Loans |
Number of Properties(1) |
SNF Beds |
ALF Units |
Investment per Bed/Unit |
|||||||||||||||
Assisted Living |
$ | 24,203 | 40.3 | % | 10 | 15 | — | 589 | $ | 41.09 | ||||||||||||
Skilled Nursing |
32,503 | 54.2 | % | 23 | 28 | 3,207 | — | $ | 10.14 | |||||||||||||
Other Senior Housing(2) |
3,301 | 5.5 | % | 1 | 1 | 99 | 74 | $ | 19.08 | |||||||||||||
Totals |
$ | 60,007 | 100.0 | % | 34 | 44 | 3,306 | 663 | ||||||||||||||
- (1)
- We
have investments in 12 states that include mortgages to 16 different operators.
- (2)
- Other senior housing properties consist of independent living properties and properties providing any combination of skilled nursing, assisted living and/or independent living services.
At December 31, 2010, the mortgage loans had interest rates ranging from 9.8% to 14.3% and maturities ranging from 2011 to 2019. In addition, the loans contain certain guarantees, provide for certain facility fees and generally have 25-year amortization schedules. The majority of the mortgage loans provide for annual increases in the interest rate based upon a specified increase of 10 to 25 basis points. At December 31, 2010 and 2009, the carrying values of the mortgage loans were $59,026,000 and $69,883,000, respectively. Scheduled principal payments on mortgage loans are $5,740,000; $5,240,000; $17,673,000; $9,327,000; $4,477,000 and $16,569,000 in 2011, 2012, 2013, 2014, 2015 and thereafter, respectively.
64
LTC PROPERTIES, INC.
NOTES TO CONSOLIDATED FINANCIAL STATEMENTS (Continued)
During the year ended December 31, 2010, we received $3,904,000 plus accrued interest related to the payoff of five mortgage loans secured by five skilled nursing properties. We invested $72,000 under one mortgage loan for capital improvements and we invested $1,622,000, before closing fees of $64,000, in a mortgage loan secured by a skilled nursing property located in Missouri to finance an expansion of the property and extend the loan maturity for an additional five years to January 2018. We received $4,499,000 in regularly scheduled principal payments. Subsequent to December 31, 2010, we received $1,005,000 plus accrued interest related to the payoff of a mortgage loan secured by an assisted living property in Texas.
Also, during the year ended December 31, 2010, we recorded a $1,235,000 provision for doubtful accounts charge for two mortgage loans (one secured by a private school property in Minnesota and one secured by land in Oklahoma). We acquired the school property via deed-in-lieu of foreclosure as a result of the borrower filing for Chapter 7 bankruptcy. The property has been classified as held-for-sale and we are actively marketing to sell it.
During the year ended December 31, 2009, we received $3,716,000 plus accrued interest related to the payoff of three mortgage loans secured by three skilled nursing properties. Additionally, we invested $221,000 under one mortgage loan for capital improvements. We received $4,127,000 in regularly scheduled principal payments.
During the year ended December 31, 2008, we received $14,248,000 plus accrued interest related to the payoff of nine mortgage loans secured by nine skilled nursing properties Additionally, we invested $9,085,000, net of closing fees, in three mortgage loans secured by one skilled nursing and seven assisted living properties and we also invested $550,000 under three mortgage loans for capital improvements at an average rate of 11.07%. We received $4,742,000 in regularly scheduled principal payments.
Owned Properties. The following table summarizes our investment in owned properties at December 31, 2010 (in thousands):
| |
|
|
(Unaudited) | |||||||||||||||||||
|---|---|---|---|---|---|---|---|---|---|---|---|---|---|---|---|---|---|---|---|---|---|---|
| |
|
|
|
Number of | |
|||||||||||||||||
Type of Property
|
Gross Investments |
Percentage of Investments |
Number of Properties(1) |
SNF Beds |
ALF Units |
ILF Units |
Investment per Bed/Unit |
|||||||||||||||
Assisted Living |
$ | 284,926 | 46.3 | % | 88 | — | 3,941 | — | $ | 72.30 | ||||||||||||
Skilled Nursing |
266,231 | 43.2 | % | 61 | 7,005 | — | — | $ | 38.01 | |||||||||||||
Other Senior Housing(2) |
52,339 | 8.5 | % | 11 | 696 | 216 | 370 | $ | 40.83 | |||||||||||||
Schools |
12,170 | 2.0 | % | 2 | N/A | N/A | N/A | N/A | ||||||||||||||
Totals |
$ | 615,666 | 100.0 | % | 162 | 7,701 | 4,157 | 370 | ||||||||||||||
- (1)
- We
have investments in 25 states leased to 27 different operators.
- (2)
- Other senior housing properties consist of independent living properties and properties providing any combination of skilled nursing, assisted living and/or independent living services.
Owned properties are leased pursuant to non-cancelable operating leases generally with an initial term of 10 to 15 years. Each lease is a triple net lease which requires the lessee to pay all taxes, insurance, maintenance and repairs, capital and non-capital expenditures and other costs necessary in the operations of the facilities. Many of the leases contain renewal options and one contains limited period options that permit the operator to purchase the property. The leases provide for fixed
65
LTC PROPERTIES, INC.
NOTES TO CONSOLIDATED FINANCIAL STATEMENTS (Continued)
minimum base rent during the initial and renewal periods. The majority of our leases contain provisions for specified annual increases over the rents of the prior year that are generally computed in one of four ways depending on specific provisions of each lease:
- (i)
- a
specified annual increase over the prior year's rent, generally between 2.0% and 3.0%;
- (ii)
- a
calculation based on the Consumer Price Index;
- (iii)
- as
a percentage of facility net patient revenues in excess of base amounts or
- (iv)
- specific dollar increases.
Contingent rent income for the years ended December 31, 2010, 2009 and 2008 was not significant in relation to contractual base rent income.
During the year ended December 31, 2010, we sold a 195-bed skilled nursing property located in Virginia to the lessee under a purchase option for $4,935,000. As a result, we received net cash proceeds of $4,864,000 and recognized a gain net of selling expenses of $310,000.
The following table summarizes our acquisitions during 2010 (in thousands):
| |
|
|
|
(Unaudited) | |||||||||||||||||||||
|---|---|---|---|---|---|---|---|---|---|---|---|---|---|---|---|---|---|---|---|---|---|---|---|---|---|
| |
|
|
|
|
|
Number of | |||||||||||||||||||
Type of Property
|
Purchase Price |
Transaction Costs |
Total Acquisition Costs |
Annualized Rental Income(6) |
Number of Properties |
SNF Beds |
ALF Units |
ILF Units |
|||||||||||||||||
Assisted Living |
$ | 26,900 | $ | 210 | (4) | $ | 27,110 | $ | 2,952 | 4 | — | 241 | — | ||||||||||||
Skilled Nursing(1) |
54,011 | (3) | 140 | 54,151 | 7,228 | 5 | 668 | — | — | ||||||||||||||||
Other Senior Housing(2) |
13,339 | — | (5) | 13,339 | — | (5) | 1 | 137 | 46 | 47 | |||||||||||||||
Totals |
$ | 94,250 | $ | 350 | $ | 94,600 | $ | 10,180 | 10 | 805 | 287 | 47 | |||||||||||||
- (1)
- At
the time of acquisition, we preliminarily estimate the allocation of the assets acquired based upon historical valuations of similar acquisitions and the
facts and circumstances available at the time. We determine the final value of the identifiable assets as soon as information is available, but not more than 12 months from the date of
acquisition. We are in the process of completing the final allocation of assets for our December 2010 acquisitions.
- (2)
- Other
senior housing properties consist of independent living properties and properties providing any combination of skilled nursing, assisted living and/or
independent living services.
- (3)
- Purchased
a 166-skilled nursing property in Texas and leased the property to a third party operator, who previously operated the property under
a lease with the seller. We paid this operator $0.1 million as a lease inducement which is amortized as a yield adjustment over the life of the lease.
- (4)
- Purchased
four assisted living properties with a total of 241 units for $26,900,000 and incurred $210,000 in transaction costs. Included in the transaction
costs is a $106,000 charge which represents half of the seller's prepayment penalty on its loan
- (5)
- Acquired the other senior housing property along with a 90-bed skilled nursing property for $22,000,000 and incurred $7,000 in transaction costs. The transaction costs for this acquisition are included in the skilled nursing property transaction costs above. These properties were leased to a third party operator under a 12-year master lease with two 10-year renewal options and the
66
LTC PROPERTIES, INC.
NOTES TO CONSOLIDATED FINANCIAL STATEMENTS (Continued)
annualized rental income is $2,420,000 (unaudited) which is included in the annualized rental income for skilled nursing properties above. We do not allocate rental income among properties in a master lease.
- (6)
- Includes annualized cash and straight-line rental income. For the year ended December 31, 2010 we recorded cash and straight-line rental income of $5,096,000 (unaudited) for properties acquired during 2010.
The following unaudited pro forma consolidated results of operations for the years ended December 31, 2010 and 2009 assume that the acquisitions of the above properties were completed as of January 1, 2009 as shown below (in thousands):
| |
December 31, 2010 | December 31, 2009 | |||||
|---|---|---|---|---|---|---|---|
Revenues |
$ | 79,386 | $ | 79,556 | |||
Net Income |
$ | 48,827 | $ | 49,192 | |||
Pro forma data may not be indicative of the results that would have been obtained had the acquisition actually occurred as of January 1, 2009, nor does it intend to be a projection of future results.
Subsequent to December 31, 2010, we entered into a purchase agreement to acquire two senior housing properties with 178 skilled nursing beds, 40 assisted living units, 34 independent living units and 19 cottages and patio homes. The properties are located in South Carolina and the aggregate purchase price is $11,450,000. The transaction is scheduled to close on or about February 28, 2011. Simultaneous with the purchase, we will lease the properties, under a 10-year triple net master lease, to an unrelated third-party operator. The lease will contain three 5-year renewal options and annual escalations of 2.5%. Additionally we have agreed to fund $700,000 in capital improvements to the properties at the lease rate.
Also, during the year ended December 31, 2010, we invested $4,593,000 at an average yield of 9.7% under agreements to expand and renovate 11 properties operated by seven different operators and we invested $1,231,000 in capital improvements to existing properties under various lease agreements whose rental rates already reflected this investment. See Note 11. Commitments and Contingencies for further discussion about our commitment agreements.
During the year ended December 31, 2009, we acquired three assisted living properties with a total of 192 units for $13,000,000 and incurred and expensed $181,000 in transaction costs. We also invested $3,170,000 at an average yield of 10.6% under agreements to expand and renovate eight properties operated by six different operators and we invested $633,000 in capital improvements to existing properties under various lease agreements whose rental rates already reflected this investment.
During the year ended December 31, 2008, we sold for $600,000 a vacant parcel of land adjacent to a skilled nursing property in New Mexico to a third party. We received net cash proceeds of $555,000 and recognized a $92,000 gain on sale. We also acquired a 30-bed skilled nursing property located in Ohio for an aggregate price of $1,014,000 that was added to an existing master lease. Additionally, we invested $2,996,000, at an average yield of approximately 10.0%, under existing commitment agreements to expand and renovate 13 existing properties operated by seven different operators and we invested $1,359,000 in capital improvements to existing properties under various lease agreements whose rental rates already reflected this investment.
67
NOTES TO CONSOLIDATED FINANCIAL STATEMENTS (Continued)
Depreciation expense on buildings and improvements, including properties classified as held-for-sale, was $16,016,000, $14,705,000, and $14,709,000 for the years ended December 31, 2010, 2009 and 2008.
Future minimum base rents receivable under the remaining non-cancelable terms of operating leases excluding the effects of straight-line rent are: $69,588,000; $70,838,000; $72,122,000; $72,539,000; $59,158,000 and $314,463,000 for the years ending December 31, 2011, 2012, 2013, 2014, 2015, and thereafter.
Set forth in the table below are the components of the net income from discontinued operations (in thousands):
| |
For the year ended December 31, | ||||||||||
|---|---|---|---|---|---|---|---|---|---|---|---|
| |
2010 | 2009 | 2008 | ||||||||
Rental income |
$ | 404 | $ | 518 | $ | 518 | |||||
Interest and other income |
— | — | — | ||||||||
Total revenues |
404 | 518 | 518 | ||||||||
Interest expense |
— | — | — | ||||||||
Depreciation and amortization |
(146 | ) | (293 | ) | (293 | ) | |||||
Operating and other expenses |
(36 | ) | — | — | |||||||
Total expenses |
(182 | ) | (293 | ) | (293 | ) | |||||
Income from discontinued operations |
$ | 222 | $ | 225 | $ | 225 | |||||
Any reference to the number of properties, number of schools, number of units, number of beds, and yield on investments in real estate are unaudited and outside the scope of our independent registered public accounting firm's audit of our consolidated financial statements in accordance with the standards of the Public Company Accounting Oversight Board.
Sunwest Management Inc. During 2010, we received a $770,000 bankruptcy settlement distribution relating to Sunwest Management, Inc. (or Sunwest). During 2008, we disclosed in a Current Report on Form 8-K filed with the SEC that companies affiliated with Sunwest was experiencing certain negative cash shortfalls. Our relationship with Sunwest was limited to four properties: two mortgage loans secured by properties in Texas and a master lease covering two properties in California. In August 2008, Sunwest ceased payment on the mortgage loans and the master lease. We acted to preserve our investments as described below.
In October 2008, we completed an assignment and assumption of a $1,523,000 loan secured by a first mortgage on a 165-unit assisted living property in Mesquite, Texas to an entity formed by the non-Sunwest equity investors after the non-Sunwest equity investors paid all of the past due interest, property tax impounds, attorney's fees and a $50,000 replacement reserve relating to this loan when mortgaged to Sunwest. The loan matures in November 2011 with an interest rate of 11.15%. Subsequent to December 31, 2010, we received $1,005,000 plus accrued interest related to the payoff of the outstanding balance of this mortgage loan.
In October 2008, we acquired a 140-unit assisted living property in Fort Worth, Texas through foreclosure for $4,717,000, which represented the amount of the Sunwest loan of $4,704,000 and capitalized fees associated with the foreclosure. The property is being operated by a third party operator under a 10-year lease with two five-year renewal options.
68
LTC PROPERTIES, INC.
NOTES TO CONSOLIDATED FINANCIAL STATEMENTS (Continued)
In August 2008, Sunwest ceased payments on a master lease covering a 109-unit assisted living property in Vacaville, California and a 113-unit assisted living property in Bakersfield, California. Accordingly we wrote-off $124,000 of straight-line rent receivable in 2008 related to this master lease. Our total gross investment in the properties under the master lease was approximately $26,156,000 or 4.5% of our gross investments in real estate as of December 31, 2008. In December 2008, we leased these properties to a third party operator under a 10-year lease with two five-year renewal options.
As of December 31, 2008, single purpose subsidiaries owned by us owed debt obligations totaling $16,054,000 secured by the master lease properties. Specifically, the outstanding principal balance on the Bakersfield property was $8,202,000 at a rate of 8.43% which was paid off in July 2009, and the outstanding principal balance on the Vacaville property was $7,852,000 at a rate of 8.69% which was paid off in May 2010.
7. Notes Receivable
Our notes receivable consists of various loans and line of credit agreements with certain operators. The following table summarizes the number of loans outstanding, the weighted average interest rate and the carrying value as of December 31, 2010, 2009, and 2008 and notes receivable principal payments received and advanced for the years 2010, 2009, and 2008 (in thousands):
| |
Number of Loans |
Weighted Average Interest Rate |
Carrying Value |
Principal Payments Received |
Principal Advanced |
|||||||||||
|---|---|---|---|---|---|---|---|---|---|---|---|---|---|---|---|---|
2010 |
5 | 11.9 | % | $ | 1,283 | $ | 1,573 | $ | (100 | ) | ||||||
2009 |
7 | 11.5 | % | 2,689 | 671 | (375 | ) | |||||||||
2008 |
6 | 11.8 | % | 2,895 | 848 | (420 | ) | |||||||||
8. Marketable Securities
At December 31, 2010, 2009 and 2008, we had a $6,500,000 investment in Skilled Healthcare Group, Inc.'s (or SHG) Senior Subordinated Notes with a face rate of 11.0% and an effective yield of 11.1%. Interest on the notes is payable semi-annually in arrears and the notes mature on January 15, 2014. One of our board members is the chief executive officer of SHG. See Note 12. Transactions with Related Party for further discussion.
9. Debt Obligations
Bank Borrowings. During 2010, we added a new lender with a $30,000,000 commitment to our Unsecured Credit Agreement, dated July 17, 2008. This additional commitment provides a total availability of $110,000,000 under our Unsecured Credit Agreement with the opportunity to increase the credit amount up to a total of $120,000,000. The Unsecured Credit Agreement provides a revolving line of credit with a final maturity date of July 17, 2011. Based on our current maximum total indebtedness to total asset value ratio as calculated in the Unsecured Credit Agreement, our current pricing under the Unsecured Credit Agreement is either Prime Rate plus 0.50% or LIBOR plus 1.50% depending on our borrowing election. At the time of borrowing, we may elect the 1, 2, 3 or 6 month LIBOR rate.
69
LTC PROPERTIES, INC.
NOTES TO CONSOLIDATED FINANCIAL STATEMENTS (Continued)
Under financial covenants contained in the Unsecured Credit Agreement which are measured quarterly we are required to maintain, among other things:
- (i)
- a
ratio, of total indebtedness to total asset value, not greater than 0.5 to 1.0;
- (ii)
- a
ratio not greater than 0.35 to 1.0 of secured debt to total asset value;
- (iii)
- a
ratio not less than 2.5 to 1.0 of EBITDA as calculated in the Unsecured Credit Agreement to interest expense; and
- (iv)
- a ratio of not less than 1.50 to 1.0 of EBITDA as calculated in the Unsecured Credit Agreement to fixed charges.
During 2010 we borrowed $83,700,000 and repaid $59,500,000 under our Unsecured Credit Agreement. At December 31, 2010, we had $37,700,000 outstanding at an interest rate of LIBOR plus 1.50% under our Unsecured Credit Agreement and $72,300,000 available for borrowing. Subsequent to December 31, 2010, we repaid $4,200,000 under our Unsecured Credit Agreement. After this payment, we had $33,500,000 outstanding under the Unsecured Credit Agreement with $76,500,000 available for borrowing. At December 31, 2010 and 2009, we were in compliance with all covenants.
Senior Unsecured Notes. During 2010, we completed the sale to affiliates and managed accounts of Prudential Investment Management, Inc. (individually and collectively "Prudential") of $25,000,000 aggregate principal amount of 5.26% senior unsecured term notes due July 14, 2015 and $25,000,000 aggregate principal amount of 5.74% senior unsecured term notes fully amortizing to maturity between January 14, 2014 and January 14, 2019. Also, we entered into an uncommitted private shelf agreement with Prudential which provides for the possible issuance of up to an additional $50,000,000 of senior unsecured fixed-rate term notes during the three-year issuance period. Interest rates on any issuance under the shelf agreement will be set at a spread over applicable Treasury rates at the date of the "rate lock." Maturities of each issuance are at our election for up to 10 years from the date of issuance with a maximum average life of 7 years from the date of original issuance.
Mortgage Loans Payable. During 2010, we paid off a $7,626,000 mortgage loan secured by an assisted living property located in California. The retired debt had an interest rate of 8.69%. Also, during 2010, we paid $59,000 in regularly scheduled principal payments. At December 31, 2010, we have no mortgage loans payable outstanding. During 2009, we paid off three mortgage loans totaling $23,935,000 secured by 11 assisted living properties located in various states. The retired debts bore a weighted average interest rate of 8.68%. We also paid $443,000 in regularly scheduled principal payments. At December 31, 2009, we had one mortgage loan outstanding with a carrying value of $7,685,000 and the aggregate carrying value of real estate properties securing our mortgage loans payable was $10,456,000.
Bonds Payable. At December 31, 2010 and 2009 we had outstanding principal of $3,730,000 and $4,225,000, respectively, on multifamily tax-exempt revenue bonds that are secured by five assisted living properties in Washington. These bonds bear interest at a variable rate that is reset weekly and mature during 2015. For the year ended December 31, 2010, the weighted average interest rate, including letter of credit fees, on the outstanding bonds was 2.20%. During 2010 and 2009 we paid $495,000 and $465,000, respectively, in regularly scheduled principal payments. Subsequent to December 31, 2010, we paid $530,000 in scheduled principal payments on bonds payable. As of December 31, 2010 and 2009, the aggregate carrying value of real estate properties securing our bonds payable was $7,179,000 and $7,443,000, respectively.
70
LTC PROPERTIES, INC.
NOTES TO CONSOLIDATED FINANCIAL STATEMENTS (Continued)
Scheduled Principal Payments. The following table represents our long term contractual obligations (scheduled principal payments and amounts due at maturity) as of December 31, 2010, and excludes the effects of interest (in thousands):
| |
Total | 2011 | 2012 | 2013 | 2014 | 2015 | Thereafter | |||||||||||||||
|---|---|---|---|---|---|---|---|---|---|---|---|---|---|---|---|---|---|---|---|---|---|---|
Bank borrowings |
$ | 37,700 | (1) | $ | 37,700 | $ | — | $ | — | $ | — | $ | — | $ | — | |||||||
Senior unsecured notes |
50,000 | — | — | — | 4,167 | 29,166 | 16,667 | |||||||||||||||
Bonds payable |
3,730 | 530 | 565 | 600 | 635 | 1,400 | — | |||||||||||||||
|
$ | 91,430 | $ | 38,230 | $ | 565 | $ | 600 | $ | 4,802 | $ | 30,566 | $ | 16,667 | ||||||||
- (1)
- At December 31, 2010 we had $72,300 available for borrowing under our Unsecured Credit Agreement. Subsequent to December 31, 2010, we repaid $4,200 under our Unsecured Credit Agreement. After this payment, we had $33,500 outstanding under the Unsecured Credit Agreement with $76,500 available for borrowing.
10. Equity
Preferred Stock. Preferred Stock is comprised of the series summarized as follows:
| |
Shares outstanding at December 31, | |
|
Carrying Value at December 31, | |||||||||||||||
|---|---|---|---|---|---|---|---|---|---|---|---|---|---|---|---|---|---|---|---|
| |
Liquidation Value Per share |
Dividend Rate |
|||||||||||||||||
Issuance
|
2010 | 2009 | 2010 | 2009 | |||||||||||||||
Series C Cumulative Convertible Preferred Stock |
2,000,000 | 2,000,000 | $ | 19.25 | 8.5 | % | $ | 18.80 | $ | 18.80 | |||||||||
Series E Cumulative Convertible Preferred Stock |
— | 37,816 | $ | 25.00 | 8.5 | % | $ | — | $ | 23.84 | |||||||||
Series F Cumulative Preferred Stock |
3,536,530 | 5,894,216 | $ | 25.00 | 8.0 | % | $ | 23.99 | $ | 23.99 | |||||||||
Total Cumulative Preferred Stock |
5,536,530 | 7,932,032 | |||||||||||||||||
Our 8.5% Series C Cumulative Convertible Preferred Stock (or Series C Preferred Stock) is convertible into 2,000,000 shares of our common stock at $19.25 per share. Dividends are payable quarterly. Total shares reserved for issuance of common stock related to the conversion of Series C Preferred Stock were 2,000,000 shares at December 31, 2010 and 2009.
Our 8.5% Series E Cumulative Convertible Preferred Stock (or Series E Preferred Stock) was convertible at any time into shares of our common stock at a conversion price of $12.50 per share of common stock. Series E Preferred Stock was redeemable by us, at our option, in whole or from time to time in part, for $25.00 per Series E Preferred Stock in cash plus any accrued and unpaid dividends to the date of redemption. Dividends were payable quarterly. During 2010, 2009 and 2008, holders of 32,895 shares, 900 shares and 123,419 shares, respectively, of Series E Preferred Stock elected to convert such shares into 65,790 shares, 1,800 shares and 246,838 shares, respectively, of common stock. During 2010, we redeemed the remaining 4,921 shares of outstanding Series E preferred stock at a redemption price of $25.4191 per share, including accrued and unpaid dividends up to and including the redemption date. Accordingly, we recognized the $6,000 of original issue costs related to the Series E preferred stock as a preferred stock redemption charge which is included in the income statement line item "Income allocated to preferred stockholders." At December 31, 2010, we had no shares of our Series E preferred stock outstanding and no shares reserved for issuance of common stock related to the conversion of Series E Preferred Stock.
71
LTC PROPERTIES, INC.
NOTES TO CONSOLIDATED FINANCIAL STATEMENTS (Continued)
Our 8.0% Series F Cumulative Stock (or Series F Preferred Stock) may be redeemed by us, at our option, in whole or from time to time in part, for $25.00 per Series F Preferred Stock in cash plus any accrued and unpaid dividends to the date of redemption. The dividend rate is 8.0% and the liquidation value is $25.00 per share. Dividends are cumulative from the date of original issue and are payable quarterly to stockholders of record on the first day of each quarter. During 2010, we redeemed 2,357,686 shares of our Series F preferred stock, representing 40% of our outstanding shares, at a redemption price of $25.3889 per share, including accrued and unpaid dividends up to the redemption date. Accordingly, we recognized the $2,377,000 of original issue costs related to the Series F preferred stock as a preferred stock redemption charge which is included in the income statement line item "Income allocated to preferred stockholders." During 2009 and 2008, we invested $2,000,000 and $14,276,000, respectively, to repurchase a total of 109,484 shares and 636,300 shares, respectively, of our Series F Preferred Stock at an average cost including fees and costs of $18.27 per share and $22.44 per share, respectively. In accordance with the accounting guidance regarding the effect on the calculation of earnings per share for the redemption or induced conversion of preferred stock, the discounted purchase price on these shares, which is the liquidation value over the fair value, netted with the original issuance costs has been added to net income in calculating net income allocable to common stockholders.
While outstanding, the liquidation preferences of each share of preferred stock are pari passu with one another. None have any voting rights, any stated maturity, nor are they subject to any sinking fund or mandatory redemption.
Common Stock. Our Board of Directors authorized a share repurchase program enabling us to repurchase up to 5,000,000 shares of our equity securities, including common and preferred stock in the open market. This authorization does not expire until 5,000,000 shares of our equity securities have been repurchased or the Board of Directors terminates its authorization. During 2010 and 2009, we did not purchase shares of our common stock. During 2009, we repurchased and retired 900 shares of common stock for an aggregate purchase price of $16,000 or $17.33 per share, including fees and costs. The shares were purchased on the open market under this Board authorization. At December 31, 2010, we continue to have an open Board authorization to purchase an additional 3,360,237 shares in total of equity securities.
On August 4, 2010, we entered into an amendment to our equity distribution agreement dated as of August 5, 2009 to issue and sell, from time to time, up to $85,686,000 in aggregate offering price of our common shares. On October 26, 2010, we entered into an amended and restated equity distribution agreement to include an additional sales agent. Sales of common shares are made by means of ordinary brokers' transactions at market prices, in block transactions, or as otherwise agreed between us and our sales agents. During 2010, we sold 776,400 shares of common stock at a weighted average price, including fees and costs, of $25.55 per share, resulting in net proceeds of $19,838,000 after $492,000 of fees and costs. During 2009, we sold 30,000 shares of common stock at a weighted average price, including fees and costs, of $25.54 per share, resulting in net proceeds of $766,000 after $18,000 of fees and costs.
Additionally, during 2010, we sold 1,970,000 shares of common stock at a price of $24.70 per share, before fees and costs of $703,000, in a registered direct placement to certain institutional investors. We raised $47,956,000 in net proceeds from the offering. The net proceeds were used as part of the redemption costs of all of our Series E preferred stock and 40% of our Series F preferred stock outstanding, as previously discussed.
72
NOTES TO CONSOLIDATED FINANCIAL STATEMENTS (Continued)
Non-controlling Interests. We have one limited partnership. The limited partnership agreement allows the limited partners to convert, on a one-for-one basis, their limited partnership units into shares of common stock or the cash equivalent, at our option. At December 31, 2010, we have reserved 112,588 shares of our common stock under this partnership agreement. If we issued shares of our common stock upon limited partners' election to exercise their conversion rights, the carrying amount of the partnership would be reclassified to stockholders' equity. Since we exercise control, we consolidate the limited partnership and we carry the non-controlling interests at cost. At December 31, 2010, the carrying value and market value of the partnership conversion rights was $1,962,000 and $3,209,000, respectively.
During 2009 one of our limited partners exercised its conversion rights and exchanged all of its interest in the limited partnership. Upon receipt of the redemption notification of 67,294 limited partnership units, we elected to convert its partnership units into 67,294 shares of our common stock. In accordance with FASB accounting guidance, we account for this exchange as an equity transaction because there was no change in control requiring consolidation or deconsolidation and remeasurement. Accordingly, the $1,144,000 carrying amount of the limited partner's interest in the partnership was reclassified to stockholders' equity.
During 2008 one of our limited partners exercised its conversion rights and exchanged a portion of its interest in the limited partnership. Upon receipt of the redemption notification of 22,000 limited partnership units, we elected to satisfy the redemption in cash. We paid the limited partner $510,000 in cash, which represented the closing price of our common stock on the redemption date multiplied by the number of limited partnership units redeemed. The amount we paid upon redemption exceeded the book value of the limited partnership interest redeemed by $136,000. We recognized this $136,000 difference as an increase in the basis of the properties.
Available Shelf Registrations. On June 9, 2010, we filed a Form S-3 "shelf" registration statement which became effective June 16, 2010, to replace our prior shelf registration statement. Our current shelf registration statement provides us with the capacity to offer up to $400,000,000 in common stock, preferred stock, warrants, debt, depositary shares, or units. We may from time to time raise capital under our current shelf registration in amounts, at prices, and on terms to be announced when and if the securities are offered. The specifics of any future offerings, along with the use of proceeds of any securities offered, will be described in detail in a prospectus supplement, or other offering materials, at the time of the offering.
73
LTC PROPERTIES, INC.
NOTES TO CONSOLIDATED FINANCIAL STATEMENTS (Continued)
Dividend Distributions. We declared and paid the following cash dividends on our common and preferred stock (in thousands):
| |
Year Ended December 31, 2010 | Year ended December 31, 2009 | ||||||||||||
|---|---|---|---|---|---|---|---|---|---|---|---|---|---|---|
| |
Declared | Paid | Declared | Paid | ||||||||||
Preferred Stock |
||||||||||||||
Series C |
$ | 3,272 | $ | 3,272 | $ | 3,272 | $ | 3,272 | ||||||
Series E |
42 | 62 | 81 | 81 | ||||||||||
Series F |
10,348 | 11,527 | 11,788 | 11,843 | ||||||||||
Total Preferred |
13,662 | 14,861 | 15,141 | 15,196 | ||||||||||
Common Stock |
39,041 | (1) | 39,041 | (1) | 36,177 | (2) | 36,177 | (2) | ||||||
Total(3) |
$ | 52,703 | $ | 53,902 | $ | 51,318 | $ | 51,373 | ||||||
- (1)
- Represents
$0.13 per share per month for January through October of 2010 and $0.14 per share per month for November and December of 2010 which represents a
7.7% increase.
- (2)
- Represents
$0.13 per share per month for the year ended December 31, 2009.
- (3)
- The difference between declared and paid is the change in distributions payable on the consolidated balance sheet.
Subsequent to December 31, 2010, we declared a monthly cash dividend of $0.14 per share on our common stock for the months of January, February and March 2011, payable on January 31, February 28 and March 31, 2011, respectively, to stockholders of record on January 21, February 18 and March 23, 2011, respectively.
Other Equity. During the years we had investments in Real Estate Mortgage Investment Conduit (or REMIC) Certificates, we retained the non-investment grade certificates issued in the securitizations. During 2005, a loan was paid off in the last remaining REMIC pool which caused the last third party REMIC Certificate holders entitled to any principal payments to be paid off in full. After this transaction, we became the sole holder of the remaining REMIC Certificates and are therefore entitled to the entire principal outstanding of the loan pool underlying the remaining REMIC Certificates. Under the FASB accounting guidance relating to accounting for changes that result in a transferor regaining control of financial assets sold, a Special Purpose Entity (or SPE) may become non-qualified or tainted which generally results in the "repurchase" by the transferor of all the assets sold to and still held by the SPE. Since we were the sole REMIC Certificate holder entitled to principal from the underlying loan pool, we had all the risks and were entitled to all the rewards from the underlying loan pool. As required by the accounting guidance, the repurchase for the transferred assets was accounted for at fair value. The accumulated other comprehensive income balance represents the fair market value adjustment offset by any previously adjusted impairment charge which is amortized to increase interest income over the remaining life of the loans that we repurchased from the REMIC pool. At December 31, 2010 and 2009, Other Equity consisted of $264,000 and $390,000, respectively, of accumulated other comprehensive income.
Stock Based Compensation Plans. During 2008 we adopted and our shareholders approved the 2008 Equity Participation Plan under which 600,000 shares of common stock have been reserved for awards, including nonqualified stock option grants and restricted stock grants to officers, employees, non-employee directors and consultants. The terms of the awards granted under the 2008 Equity
74
LTC PROPERTIES, INC.
NOTES TO CONSOLIDATED FINANCIAL STATEMENTS (Continued)
Participation Plan are set by our compensation committee at its discretion. During 2010, we granted 4,000 shares of restricted stock at $25.95 per share, 1,000 shares of restricted stock at $25.04 per share and 11,030 shares of restricted stock at $26.53 per share under this plan. These shares vest ratably over a three-year period from the grant date. Additionally, during 2010, we granted 92,900 shares of restricted stock at $26.59 per share under this plan. These shares vest ratably over a five-year period from the grant date. We also granted 99,661 shares of restricted stock at $26.53 per share under this plan during 2010. These shares vest ratably over a five-year period with the first date of vesting beginning in December 31, 2010. We did not grant stock options during 2010. During 2009 we granted 15,000 stock options and 3,000 shares of restricted stock at $24.65 per share under this plan. Also, we granted 3,000 shares of restricted stock at $18.34 per share and 36,988 shares of restricted stock at $17.06 per share under this plan. These shares vest ratably over a three-year period. During 2008 neither stock options nor restricted stock were granted under this plan.
Restricted Stock. Restricted stock activity for the years ended December 31, 2010, 2009 and 2008 was as follows:
| |
2010 | 2009 | 2008 | ||||||||
|---|---|---|---|---|---|---|---|---|---|---|---|
Outstanding, January 1 |
84,866 | 88,450 | 137,354 | ||||||||
Granted |
208,591 | 42,988 | — | ||||||||
Vested |
(76,140 | ) | (46,572 | ) | (48,904 | ) | |||||
Canceled |
— | — | — | ||||||||
Outstanding, December 31 |
217,317 | 84,866 | 88,450 | ||||||||
Compensation expense for the year(1) |
$ | 1,210,000 | $ | 1,242,000 | $ | 1,088,000 | |||||
- (1)
- At December 31, 2010, the total compensation cost related to unvested restricted stock granted is $5,170,000, which will be recognized ratably over the remaining vesting period.
Dividends are payable on the restricted shares to the extent and on the same date as dividends are paid on all of our common stock.
Stock Options. Nonqualified stock option activity for the years ended December 31, 2010, 2009 and 2008, was as follows:
| |
Shares | Weighted Average Price | |||||||||||||||||
|---|---|---|---|---|---|---|---|---|---|---|---|---|---|---|---|---|---|---|---|
| |
2010 | 2009 | 2008 | 2010 | 2009 | 2008 | |||||||||||||
Outstanding, January 1 |
197,000 | 217,000 | 234,500 | $ | 22.88 | $ | 22.62 | $ | 22.71 | ||||||||||
Granted |
— | 15,000 | — | $ | — | $ | 24.65 | $ | — | ||||||||||
Exercised |
(11,666 | ) | (35,000 | ) | (17,500 | ) | $ | 15.62 | $ | 22.00 | $ | 23.79 | |||||||
Canceled |
— | — | — | $ | — | $ | — | $ | — | ||||||||||
Outstanding, December 31 |
185,334 | 197,000 | 217,000 | $ | 23.34 | $ | 22.88 | $ | 22.62 | ||||||||||
Exercisable, December 31(1) |
175,334 | 113,830 | 80,663 | $ | 23.27 | $ | 27.94 | $ | 25.88 | ||||||||||
- (1)
- The aggregate intrinsic value of exercisable options at December 31, 2010, based upon the closing price of our common shares at December 31, 2010, amounted to approximately $844,000. Options exercisable at December 31, 2010 have a weighted average remaining contractual life of approximately 4.4 years.
75
LTC PROPERTIES, INC.
NOTES TO CONSOLIDATED FINANCIAL STATEMENTS (Continued)
The options exercised during 2010, 2009 and 2008 were as follows:
| |
Options Exercised |
Weighted Average Exercise Price |
Option Value |
Market Value(1) |
|||||||||
|---|---|---|---|---|---|---|---|---|---|---|---|---|---|
2010 |
11,666 | $ | 15.62 | $ | 182,000 | $ | 315,000 | ||||||
2009 |
35,000 | $ | 22.00 | $ | 770,000 | $ | 924,000 | ||||||
2008 |
17,500 | $ | 23.79 | $ | 416,000 | $ | 519,000 | ||||||
- (1)
- As of the exercise dates.
We use the Black-Scholes-Merton formula to estimate the value of stock options granted to employees. This model requires management to make certain estimates including stock volatility, expected dividend yield and the expected term. If management incorrectly estimates these variables, the results of operations could be affected.
The estimates for the fair value of options granted during 2010, 2009, and 2008 were as follows:
| |
Options Granted |
Weighted Average Expected Life (in years) |
Weighted Average Volatility |
Weighted Average Risk Free Interest Rate |
Expected Dividend Yield |
Weighted Average Fair Value |
|||||||||||||
|---|---|---|---|---|---|---|---|---|---|---|---|---|---|---|---|---|---|---|---|
2010 |
— | — | —— | — | % | — | % | $ | — | ||||||||||
2009 |
15,000 | 3 | 0.323 | 1.73 | % | 6.33 | % | $ | 3.39 | ||||||||||
2008 |
— | — | — | — | % | — | % | $ | — | ||||||||||
The weighted average exercise price of the options was $23.34, $22.88 and $22.62 and the weighted average remaining contractual life was 0.1, 0.6 and 1.3 years as of December 31, 2010, 2009 and 2008, respectively. At December 31, 2010, the total compensation cost related to unvested stock options granted was $27,000, which will be recognized over the remaining vesting period.
11. Commitments and Contingencies
The following table summarizes our capital improvement commitments as of December 31, 2010 (dollar amounts in thousands):
Commitment
|
Expiration Date |
Used Commitment at 12/31/10 |
Open Commitment at 12/31/10 |
Estimated Yield |
Property Type |
Properties | Major Operator | |||||||||||||
|---|---|---|---|---|---|---|---|---|---|---|---|---|---|---|---|---|---|---|---|---|
| $ | 2,000 | 1/1/2011 | $ | — | $ | 2,000 | (2)(3) | SNF | 1 | N/A | ||||||||||
| 40 | 2/28/2011 | 27 | 13 | (4) | OTHER(1) | 1 | N/A | |||||||||||||
| 1,920 | 4/1/2011 | 1,534 | 386 | (5) | ALF | 2 | N/A | |||||||||||||
| 4,000 | 4/1/2011 | 2,121 | (9)(b) | 1,879 | 11.00% | (2) | SNF | 1 | Preferred Care | |||||||||||
| 1,500 | 5/31/2011 | 826 | (9)(a) | 674 | (6) | ALF | 3 | N/A | ||||||||||||
| 1,927 | 7/1/2011 | 1,802 | 125 | 10.00% | (2) | OTHER(1) | 1 | N/A | ||||||||||||
| 5,000 | 12/31/2014 | — | 5,000 | (7) | (8) | ALF | 37 | ALC | ||||||||||||
| $ | 16,387 | $ | 6,310 | $ | 10,077 | |||||||||||||||
- (1)
- Other senior housing properties consist of independent living properties and properties providing any combination of skilled nursing, assisted living and/or independent living services.
76
LTC PROPERTIES, INC.
NOTES TO CONSOLIDATED FINANCIAL STATEMENTS (Continued)
- (2)
- Minimum
rent will increase upon final funding and project completion or in some cases, the improvement deadline as defined in each lease agreement.
- (3)
- The
higher of one-year LIBOR plus 5.3% or 10%.
- (4)
- The
yield is included in the initial lease rate.
- (5)
- The
commitment is allocated in three tranches of $750, $850 and $320. The yield for the $750 tranche is included in the initial lease rate; the yield for
the $850 tranche is 8.5% with minimum rent increases as per footnote (3); the yield for the $320 tranche is 9.5% with minimum rent increases on the 1st of each month by the amount
advanced in the previous month multiplied by the estimated yield.
- (6)
- The
lease rate in effect on the date funded: 7% for March through November 2010 and 8% for December 2010 through the expiration date of the commitment.
Minimum rent increase as per footnote (2).
- (7)
- $5,000
per year for the life of the lease.
- (8)
- 9.5%
plus the positive difference, if any, between the average yields on the U.S. Treasury 10-year note for the five days prior to funding,
minus 420 basis points (expressed as a percentage).
- (9)
- Subsequent to December 31, 2010, we invested an additional $602 in the following commitments: (9)(a) $142, (9)(b) $460.
The following table summarizes our loan commitments as of December 31, 2010 (dollar amounts in thousands):
Commitment
|
Expiration Date |
Used Commitment at 12/31/10 |
Open Commitment at 12/31/10 |
Yield | Property Type(1) |
Properties | Major Operator |
||||||||||||
|---|---|---|---|---|---|---|---|---|---|---|---|---|---|---|---|---|---|---|---|
$50 |
3/31/2011 | $ | 20 | $ | 30 | 10.00 | % | OTHER | 1 | N/A | |||||||||
- (1)
- Other senior housing properties consist of independent living properties and properties providing any combination of skilled nursing, assisted living and/or independent living services.
12. Transactions with Related Party
We have entered into transactions with Skilled Healthcare Group, Inc. (or SHG). One of our directors, Boyd W. Hendrickson, serves as Chief Executive Officer of SHG.
In December 2005, we purchased, on the open market, $10,000,000 face value of SHG Senior Subordinated Notes with a face rate of 11.0% and an effective yield of 11.1%. One of our directors, Boyd W. Hendrickson, serves as Chief Executive Officer of SHG. Our Board of Directors, with Mr. Hendrickson abstaining, ratified the purchase of SHG Senior Subordinated Notes. As a result of an early redemption by SHG in 2007, we have a remaining investment in $6,500,000 face value of SHG Senior Subordinated Notes at December 31, 2010 and 2009. During 2010, 2009 and 2008, we recognized $720,000, $720,000 and $728,000 of interest income related to the SHG Senior Subordinated Notes. Interest on the notes is payable semi-annually in arrears and the notes mature on January 15, 2014.
In addition, during September 2007 SHG purchased the assets of Laurel Healthcare (or Laurel). We were not a direct party to this transaction. One of the assets SHG purchased was Laurel's leasehold interests in the skilled nursing properties in New Mexico Laurel leased from us under a 15-year master
77
LTC PROPERTIES, INC.
NOTES TO CONSOLIDATED FINANCIAL STATEMENTS (Continued)
lease agreement dated in February 2006. Our Board of Directors, with Mr. Hendrickson abstaining, ratified our consent to the assignment of Laurel's master lease to subsidiaries of SHG. The economic terms of the master lease agreement did not change as a result of our assignment of the master lease to subsidiaries of SHG. During 2010, 2009 and 2008, we received $4,160,000, $4,058,000 and $3,917,000, respectively, in rental income and recorded $342,000, $443,000 and $535,000, respectively, in straight-line rental income from subsidiaries of SHG. At December 31, 2010 and 2009, the straight-line rent receivable from subsidiaries of SHG was $2,822,000 and $2,480,000, respectively.
13. Distributions
We must distribute at least 90% of our taxable income in order to continue to qualify as a REIT. This distribution requirement can be satisfied by current year distributions or, to a certain extent, by distributions in the following year.
For federal tax purposes, distributions to stockholders are treated as ordinary income, capital gains, return of capital or a combination thereof. Distributions for 2010, 2009 and 2008 were cash distributions.
The federal income tax classification of the per share common stock distributions are as follows (unaudited):
| |
Year Ended December 31, | ||||||||||
|---|---|---|---|---|---|---|---|---|---|---|---|
| |
2010 | 2009 | 2008 | ||||||||
Ordinary taxable distribution |
$ | 1.200 | $ | 1.549 | $ | 1.557 | |||||
Return of capital |
0.334 | — | — | ||||||||
Unrecaptured Section 1250 gain |
0.034 | — | — | ||||||||
Long term capital gain |
0.012 | 0.011 | 0.003 | ||||||||
Total |
$ | 1.580 | $ | 1.560 | $ | 1.560 | |||||
78
LTC PROPERTIES, INC.
NOTES TO CONSOLIDATED FINANCIAL STATEMENTS (Continued)
14. Net Income Per Common Share
Basic and diluted net income per share were as follows (in thousands except per share amounts):
| |
For the year ended December 31, | ||||||||||
|---|---|---|---|---|---|---|---|---|---|---|---|
| |
2010 | 2009 | 2008 | ||||||||
Income from continuing operations |
$ | 45,521 | $ | 44,135 | $ | 42,967 | |||||
Less income allocated to non-controlling interests |
(191 | ) | (296 | ) | (307 | ) | |||||
Less income allocated to participating securities Non-forfeitable dividends on participating securities |
(230 | ) | (139 | ) | (159 | ) | |||||
Total income allocated to participating securities |
(230 | ) | (139 | ) | (159 | ) | |||||
Less income allocated to preferred stockholders: |
|||||||||||
Preferred stock dividends |
(13,662 | ) | (15,141 | ) | (15,390 | ) | |||||
Preferred stock redemption charge |
(2,383 | ) | — | — | |||||||
Allocation of income from preferred stock buyback |
— | 626 | 989 | ||||||||
Total income allocated to preferred stockholders |
(16,045 | ) | (14,515 | ) | (14,401 | ) | |||||
Income from continuing operations allocable to common stockholders |
29,055 | 29,185 | 28,100 | ||||||||
Add net income from discontinued operations: |
|||||||||||
Discontinued operations |
222 | 225 | 225 | ||||||||
Gain on sale of assets, net |
310 | — | 92 | ||||||||
Total net income from discontinued operations |
532 | 225 | 317 | ||||||||
Total net income allocable to common stockholders |
29,587 | 29,410 | 28,417 | ||||||||
Effect of dilutive securities: |
|||||||||||
Convertible preferred securities |
40 | 80 | 110 | ||||||||
Total effect of dilutive securities |
40 | 80 | 110 | ||||||||
Net income for diluted net income per share |
$ | 29,627 | $ | 29,490 | $ | 28,527 | |||||
Shares for basic net income per share |
24,495 | 23,099 | 22,974 | ||||||||
Effect of dilutive securities: |
|||||||||||
Stock options |
23 | 8 | 11 | ||||||||
Convertible preferred securities |
50 | 75 | 104 | ||||||||
|
73 | 83 | 115 | ||||||||
Shares for diluted net income per share |
24,568 | 23,182 | 23,089 | ||||||||
Basic net income per common share |
$ | 1.21 | $ | 1.27 | $ | 1.24 | |||||
Diluted net income per common share(1) |
$ | 1.21 | $ | 1.27 | $ | 1.24 | |||||
- (1)
- For each year, the Series C Cumulative Convertible Preferred Stock, the participating securities and the convertible non-controlling interests have been excluded from the computation of diluted net income per share as such inclusion would be anti-dilutive.
79
NOTES TO CONSOLIDATED FINANCIAL STATEMENTS (Continued)
15. Quarterly Financial Information (Unaudited)
| |
For the quarter ended | |||||||||||||
|---|---|---|---|---|---|---|---|---|---|---|---|---|---|---|
| |
March 31, | June 30, | September 30, | December 31, | ||||||||||
| |
(in thousands except per share amounts) |
|||||||||||||
2010 |
||||||||||||||
Revenues |
$ | 17,736 | $ | 18,070 | $ | 18,517 | $ | 19,979 | ||||||
Net income from discontinued operations |
56 | 44 | 101 | 331 | ||||||||||
Net income available to common stockholders |
6,694 | 7,739 | 5,571 | 9,583 | ||||||||||
Net income per common share from continuing operations allocable to common stockholders: |
||||||||||||||
Basic |
$ | 0.29 | $ | 0.33 | $ | 0.22 | $ | 0.35 | ||||||
Diluted |
$ | 0.28 | $ | 0.32 | $ | 0.22 | $ | 0.35 | ||||||
Net income per common share from discontinued operations: |
||||||||||||||
Basic |
$ | 0.00 | $ | 0.00 | $ | 0.01 | $ | 0.02 | ||||||
Diluted |
$ | 0.00 | $ | 0.00 | $ | 0.01 | $ | 0.02 | ||||||
Net income per common share available to common stockholders: |
||||||||||||||
Basic |
$ | 0.29 | $ | 0.33 | $ | 0.22 | $ | 0.37 | ||||||
Diluted |
$ | 0.29 | $ | 0.33 | $ | 0.22 | $ | 0.37 | ||||||
Dividends per share declared |
$ | 0.39 | $ | 0.39 | $ | 0.39 | $ | 0.41 | ||||||
Dividend per share paid |
$ | 0.39 | $ | 0.39 | $ | 0.39 | $ | 0.41 | ||||||
2009 |
||||||||||||||
Revenues |
$ | 17,587 | $ | 17,256 | $ | 17,198 | $ | 17,335 | ||||||
Net income (loss) from discontinued operations |
56 | 56 | 57 | 56 | ||||||||||
Net income available to common stockholders |
7,966 | 6,843 | 7,431 | 7,170 | ||||||||||
Net income per common share from continuing operations allocable to common stockholders: |
||||||||||||||
Basic |
$ | 0.34 | $ | 0.29 | $ | 0.32 | $ | 0.31 | ||||||
Diluted |
$ | 0.34 | $ | 0.29 | $ | 0.32 | $ | 0.31 | ||||||
Net income per common share from discontinued operations: |
||||||||||||||
Basic |
$ | 0.00 | $ | 0.00 | $ | 0.00 | $ | 0.00 | ||||||
Diluted |
$ | 0.00 | $ | 0.00 | $ | 0.00 | $ | 0.00 | ||||||
Net income per common share available to common stockholders: |
||||||||||||||
Basic |
$ | 0.35 | $ | 0.30 | $ | 0.32 | $ | 0.31 | ||||||
Diluted |
$ | 0.35 | $ | 0.30 | $ | 0.32 | $ | 0.31 | ||||||
Dividends per share declared |
$ | 0.39 | $ | 0.39 | $ | 0.39 | $ | 0.39 | ||||||
Dividend per share paid |
$ | 0.39 | $ | 0.39 | $ | 0.39 | $ | 0.39 | ||||||
- (1)
- Revenues
related to properties sold in 2010 have been reclassified to discontinued operations for all periods presented as required by the FASB accounting
guidance. There were no properties sold in 2009.
- NOTE:
- Quarterly and year-to-date computations of per share amounts are made independently. Therefore, the sum of per share amounts for the quarters may not agree with the per share amounts for the year. Computations of per share amounts from continuing operations, discontinued operations and net income (loss) are made independently. Therefore, the sum of per share amounts from continuing operations and discontinued operations may not agree with the per share amounts from net income (loss) available to common stockholders.
80
NOTES TO CONSOLIDATED FINANCIAL STATEMENTS (Continued)
16. Fair Value Measurements
In accordance with the accounting guidance regarding the fair value option for financial assets and financial liabilities, entities are permitted to choose to measure certain financial assets and liabilities at fair value, with the change in unrealized gains and losses on items for which the fair value option has been elected reported in earnings. We did not adopt the elective fair market value option in our financial statements.
The carrying amount of cash and cash equivalents approximates fair value because of the short-term maturity of these instruments. We do not invest our cash in auction rate securities. The carrying value and fair value of our financial instruments as of December 31, 2010 and 2009 assuming election of fair value for our financial assets and financial liabilities were as follows:
| |
At December 31, 2010 | At December 31, 2009 | |||||||||||
|---|---|---|---|---|---|---|---|---|---|---|---|---|---|
| |
Carrying Value |
Fair Value |
Carrying Value |
Fair Value |
|||||||||
Mortgage loans receivable |
$ | 59,026 | $ | 67,697 | (1) | $ | 69,883 | $ | 80,200 | (1) | |||
Marketable debt securities |
6,478 | 6,695 | (2) | 6,473 | 6,874 | (2) | |||||||
Mortgage loans payable |
— | — | 7,685 | 7,806 | (3) | ||||||||
Bonds payable |
3,730 | 3,730 | (4) | 4,225 | 4,225 | (4) | |||||||
Bank borrowings |
37,700 | 37,700 | (4) | 13,500 | 13,500 | (4) | |||||||
Senior unsecured notes |
50,000 | 49,943 | (5) | — | — | ||||||||
- (1)
- Our
investment in mortgage loans receivable is classified as Level 3. The fair value is determined using a widely accepted valuation technique,
discounted cash flow analysis on the expected cash flows. The discount rate is determined using our assumption on market conditions adjusted for market and credit risk and current returns on our
investments. The discount rate used to value our future cash inflows of the mortgage loans receivable at December 31, 2010 and 2009 was 7.5%.
- (2)
- Our
investment in marketable debt securities is classified as Level 2. The fair value is measured using quoted market rates based on most recent
transactions from an independent third party source. The pricing of our marketable debt securities as of December 31, 2010 and 2009 was 103.00% and 105.75%, respectively. See Note 4. Marketable
Securities for further discussion.
- (3)
- Our
obligation under our mortgage loans payable is classified as Level 3 and thus the fair value is determined using a widely accepted valuation
technique, discounted cash flow analysis on the expected cash flows. The discount rate is measured based upon management's estimates of rates currently prevailing for comparable loans available to us,
and instruments of comparable maturities. At December 31, 2009, the discount rate used to value our future cash outflow of our mortgage loans payable was 6.25%.
- (4)
- Our bonds payable and bank borrowings are at a variable interest rate. The estimated fair value of our bonds payable approximated their carrying values at December 31, 2010 and 2009 based upon prevailing market interest rates for similar debt arrangements. Subsequent to December 31, 2010, we paid $530,000 in scheduled principal payments on bonds payable. Also , subsequent to December 31, 2010, we repaid $4,200,000 under our Unsecured Credit Agreement. After this payment we had $33,500,000 outstanding under
81
LTC PROPERTIES, INC.
NOTES TO CONSOLIDATED FINANCIAL STATEMENTS (Continued)
the Unsecured Credit Agreement with $76,500,000 available for borrowing. At December 31, 2009, we had $13,500,000 outstanding borrowings under our Unsecured Revolving Credit Agreement and $66,500,000 was available for borrowing.
- (5)
- Our obligation under our senior unsecured notes is classified as Level 3 and thus the fair value is determined using a widely accepted valuation technique, discounted cash flow analysis on the expected cash flows. The discount rate is measured based upon management's estimates of rates currently prevailing for comparable loans available to us, and instruments of comparable maturities. At December 31, 2010, the discount rate used to value our future cash outflow of our senior unsecured notes was 5.5%.
17. Subsequent Events
We had the following events occur subsequent to December 31, 2010.
We declared a monthly cash dividend of $0.14 per common share per month for the months of January, February and March 2011, payable on January 31, February 28 and March 31, 2011, respectively, to stockholders of record on January 21, February 18 and March 23, 2011, respectively.
We received $1,005,000 plus accrued interest related to the payoff of a mortgage loan secured by an assisted living property in Texas.
We repaid $4,200,000 under our Unsecured Credit Agreement. After this payment, we had $33,500,000 outstanding under the Unsecured Credit Agreement with $76,500,000 available for borrowing. Also, we paid $530,000 in scheduled principal payments on bonds payable.
We invested an additional $602,000 in various capital improvement commitments as follows (dollar amounts in thousands):
| Commitment | Expiration Date |
Funded Subsequent to 12/31/10 |
Open Commitment Subsequent to 12/31/10 |
Estimated Yield |
Property Type |
Properties | Major Operator |
|||||||||||||
|---|---|---|---|---|---|---|---|---|---|---|---|---|---|---|---|---|---|---|---|---|
| $ | 1,500 | 5/31/2011 | $ | 142 | $ | 532 | (1) | ALF | 3 | N/A | ||||||||||
| 4,000 | 4/1/2011 | 460 | 1,419 | 11% | (2) | SNF | 1 | Preferred Care | ||||||||||||
- (1)
- The
lease rate in effect on the date funded: 7% for March through November 2010 and 8% for December 2010 through the expiration date of the commitment.
Minimum rent will increase upon final funding and project completion or in some cases, the improvement deadline as defined in each lease agreement.
- (2)
- Minimum rent will increase upon final funding and project completion or in some cases, the improvement deadline as defined in each lease agreement.
82
LTC PROPERTIES, INC.
SCHEDULE II
VALUATION AND QUALIFYING ACCOUNTS
(in thousands)
| |
|
Additions | |
|
|||||||||||||
|---|---|---|---|---|---|---|---|---|---|---|---|---|---|---|---|---|---|
Account Description
|
Balance at beginning of period(2) |
(Recovered) charged to costs and expenses |
Charged to other accounts |
Deductions(1) | Balance at end of period(2) |
||||||||||||
Year ended December 31, 2008 |
|||||||||||||||||
Allowance for doubtful accounts and other receivables |
$ | 890 | $ | (55 | ) | $ | — | $ | (75 | ) | $ | 760 | |||||
Straight-line rent receivable allowance |
— | 140 | — | — | 140 | ||||||||||||
|
$ | 890 | $ | 85 | $ | — | $ | (75 | ) | $ | 900 | ||||||
Year ended December 31, 2009 |
|||||||||||||||||
Allowance for doubtful accounts and other receivables |
$ | 760 | $ | (56 | ) | $ | — | $ | — | $ | 704 | ||||||
Straight-line rent receivable allowance |
140 | 831 | — | (342 | ) | 629 | |||||||||||
|
$ | 900 | $ | 775 | $ | — | $ | (342 | ) | $ | 1,333 | ||||||
Year ended December 31, 2010 |
|||||||||||||||||
Allowance for doubtful accounts and other receivables |
$ | 704 | $ | 1,166 | $ | — | $ | (889 | ) | $ | 981 | ||||||
Straight-line rent receivable allowance |
629 | 844 | — | — | 1,473 | ||||||||||||
|
$ | 1,333 | $ | 2,010 | $ | — | $ | (889 | ) | $ | 2,454 | ||||||
- (1)
- Deductions
represent uncollectible accounts written off.
- (2)
- Includes straight-line rent receivable allowance for properties classified as held-for-sale.
83
LTC PROPERTIES, INC.
SCHEDULE III
REAL ESTATE AND ACCUMULATED DEPRECIATION
| |
|
|
|
|
Gross amount at which carried at December 31, 2010 |
|
|
|
||||||||||||||||||||||
|---|---|---|---|---|---|---|---|---|---|---|---|---|---|---|---|---|---|---|---|---|---|---|---|---|---|---|---|---|---|---|
| |
|
Initial cost to company | Costs capitalized subsequent to acquisition |
|
|
|
||||||||||||||||||||||||
| |
Encumbrances | Land | Building and improvements |
Land | Building and improvements |
Total(2) | Accum deprec. |
Construction/ renovation date |
Acquisition date |
|||||||||||||||||||||
Skilled Nursing |
||||||||||||||||||||||||||||||
Alamogordo, NM |
$ | — | $ | 210 | $ | 2,590 | $ | 3 | $ | 210 | $ | 2,593 | $ | 2,803 | $ | 624 | 1985 | Dec-01 | ||||||||||||
Albuquerque, NM |
— | 1,696 | 3,891 | 530 | 1,696 | 4,421 | 6,117 | 835 | 1967/2008 | Sep-05 | ||||||||||||||||||||
Albuquerque, NM |
— | 1,950 | 8,910 | 207 | 1,950 | 9,117 | 11,067 | 1,773 | 1982 | Sep-05 | ||||||||||||||||||||
Albuquerque, NM |
— | 2,463 | 7,647 | 9 | 2,463 | 7,656 | 10,119 | 1,502 | 1970 | Sep-05 | ||||||||||||||||||||
Altoona, IA |
— | 105 | 2,309 | 444 | 105 | 2,753 | 2,858 | 1,333 | 1973 | Jan-96 | ||||||||||||||||||||
Aransas Pass, TX |
— | 154 | 1,276 | 589 | 154 | 1,865 | 2,019 | 359 | 1973/2008 | Dec-04 | ||||||||||||||||||||
Atlanta, GA |
— | 175 | 1,282 | 3 | 175 | 1,285 | 1,460 | 556 | 1968 | Sep-99 | ||||||||||||||||||||
Atmore, AL |
— | 131 | 2,877 | 196 | 131 | 3,073 | 3,204 | 1,344 | 1967/1974 | Jan-96 | ||||||||||||||||||||
Beaumont, TX |
— | 370 | 1,141 | 93 | 370 | 1,234 | 1,604 | 275 | 1950 | Dec-05 | ||||||||||||||||||||
Beeville, TX |
— | 186 | 1,197 | 70 | 186 | 1,267 | 1,453 | 224 | 1974 | Dec-04 | ||||||||||||||||||||
Benbrook, TX |
— | 503 | 2,121 | 102 | 503 | 2,223 | 2,726 | 520 | 1976 | Jan-05 | ||||||||||||||||||||
Canyon, TX(3) |
— | 196 | 506 | 211 | 196 | 717 | 913 | 370 | 1985/86 | Jun-00 | ||||||||||||||||||||
Carroll, IA |
— | 47 | 1,033 | 213 | 47 | 1,246 | 1,293 | 602 | 1969 | Jan-96 | ||||||||||||||||||||
Chesapeake, VA |
— | 388 | 3,469 | 1,097 | 388 | 4,566 | 4,954 | 2,096 | 1977/2002/2007 | Oct-95 | ||||||||||||||||||||
Clovis, NM |
— | 561 | 5,539 | 307 | 561 | 5,846 | 6,407 | 1,455 | 1970/2006 | Dec-01 | ||||||||||||||||||||
Clovis, NM |
— | 598 | 5,902 | 59 | 598 | 5,961 | 6,559 | 1,514 | 1969/95 | Dec-01 | ||||||||||||||||||||
Commerce City, CO |
— | 236 | 3,217 | 167 | 236 | 3,384 | 3,620 | 847 | 1964 | Jun-04 | ||||||||||||||||||||
Commerce City, CO |
— | 161 | 2,160 | 95 | 161 | 2,255 | 2,416 | 551 | 1967 | Jun-04 | ||||||||||||||||||||
Daleville, VA |
— | 279 | 8,382 | — | 279 | 8,382 | 8,661 | 177 | 2005 | Jun-10 | ||||||||||||||||||||
Del Norte, CO |
— | 103 | 930 | 326 | 103 | 1,256 | 1,359 | 238 | 1955/2006 | Jun-05 | ||||||||||||||||||||
Dresden, TN |
— | 31 | 1,529 | 123 | 31 | 1,652 | 1,683 | 544 | 1966/2002 | Nov-00 | ||||||||||||||||||||
Gardner, KS |
— | 896 | 4,478 | 2,908 | 896 | 7,386 | 8,282 | 1,989 | 1961/1974 | Dec-99 | ||||||||||||||||||||
Granger, IA |
— | 62 | 1,356 | 221 | 62 | 1,577 | 1,639 | 718 | 1979 | Jan-96 | ||||||||||||||||||||
Grapevine, TX |
— | 431 | 1,449 | 188 | 431 | 1,637 | 2,068 | 634 | 1974 | Jan-02 | ||||||||||||||||||||
Griffin, GA |
— | 500 | 2,900 | — | 500 | 2,900 | 3,400 | 1,107 | 1969 | Sep-99 | ||||||||||||||||||||
Houston, TX |
— | 202 | 4,458 | 1,426 | 202 | 5,884 | 6,086 | 2,678 | 1961/2007 | Jun-96 | ||||||||||||||||||||
Houston, TX |
— | 365 | 3,769 | 1,598 | 365 | 5,367 | 5,732 | 2,447 | 1964/1968 | Jun-96 | ||||||||||||||||||||
Houston, TX |
— | 202 | 4,458 | 1,359 | 202 | 5,817 | 6,019 | 2,591 | 1967/2008 | Jun-96 | ||||||||||||||||||||
Jacksonville, FL |
— | 486 | 1,981 | 30 | 486 | 2,011 | 2,497 | 632 | 1986-1987 | Mar-02 | ||||||||||||||||||||
Jefferson, IA |
— | 86 | 1,883 | 296 | 86 | 2,179 | 2,265 | 975 | 1968/1972 | Jan-96 | ||||||||||||||||||||
Marion, OH |
— | 119 | 1,156 | 1,142 | 119 | 2,298 | 2,417 | 457 | 1950/2006/2007 | May-05 | ||||||||||||||||||||
Marion, OH |
— | 48 | 2,466 | — | 48 | 2,466 | 2,514 | 416 | 1997 | May-06 | ||||||||||||||||||||
Marion, OH |
— | 210 | 804 | — | 210 | 804 | 1,014 | 756 | 1959 | Jan-08 | ||||||||||||||||||||
Mesa, AZ |
— | 305 | 6,909 | 1,876 | 305 | 8,785 | 9,090 | 3,674 | 1975/1996 | Jun-96 | ||||||||||||||||||||
Mesa, AZ |
— | 1,095 | 2,330 | — | 1,095 | 2,330 | 3,425 | 388 | 1979 | Aug-06 | ||||||||||||||||||||
Midland, TX |
— | 33 | 2,285 | 26 | 33 | 2,311 | 2,344 | 1,071 | 1973 | Feb-96 | ||||||||||||||||||||
Mission, TX |
— | 710 | 10,659 | — | 710 | 10,659 | 11,369 | 30 | 1988/2004 | Nov-10 | ||||||||||||||||||||
Montgomery, AL |
— | 242 | 5,327 | 115 | 242 | 5,442 | 5,684 | 2,444 | 1967/1974 | Jan-96 | ||||||||||||||||||||
Nacogdoches, TX |
— | 100 | 1,738 | 168 | 100 | 1,906 | 2,006 | 811 | 1973 | Oct-97 | ||||||||||||||||||||
Nacogdoches, TX |
— | 394 | 7,456 | 168 | 394 | 7,624 | 8,018 | 221 | 1987/1988/1991 | Jan-10 | ||||||||||||||||||||
Norwalk, IA |
— | 47 | 1,033 | 239 | 47 | 1,272 | 1,319 | 582 | 1975 | Jan-96 | ||||||||||||||||||||
Olathe, KS |
— | 520 | 1,872 | 313 | 520 | 2,185 | 2,705 | 857 | 1968 | Sep-99 | ||||||||||||||||||||
Orrville, OH |
— | 107 | 1,946 | 108 | 107 | 2,054 | 2,161 | 383 | 1956 | Jun-06 | ||||||||||||||||||||
Phoenix, AZ |
— | 334 | 3,383 | 456 | 334 | 3,839 | 4,173 | 1,073 | 1982 | Apr-04 | ||||||||||||||||||||
Phoenix, AZ |
— | 300 | 9,703 | 92 | 300 | 9,795 | 10,095 | 3,587 | 1985 | Aug-00 | ||||||||||||||||||||
Polk City, IA |
— | 63 | 1,376 | 153 | 63 | 1,529 | 1,592 | 712 | 1976 | Jan-96 | ||||||||||||||||||||
Portland, OR |
— | 100 | 1,925 | 2,652 | 100 | 4,577 | 4,677 | 1,488 | 1956/1974/2006/2007 | Jun-97 | ||||||||||||||||||||
Richland Hills, TX |
— | 144 | 1,656 | 427 | 144 | 2,083 | 2,227 | 751 | 1976 | Dec-01 | ||||||||||||||||||||
Ripley, TN |
— | 20 | 985 | 387 | 20 | 1,372 | 1,392 | 444 | 1951/2002/2007 | Nov-00 | ||||||||||||||||||||
Roswell, NM |
— | 568 | 5,232 | 3 | 568 | 5,235 | 5,803 | 1,259 | 1975 | Dec-01 | ||||||||||||||||||||
Rusk, TX |
— | 34 | 2,399 | 448 | 34 | 2,847 | 2,881 | 1,551 | 1969 | Mar-94 | ||||||||||||||||||||
Sacramento, CA |
— | 220 | 2,929 | — | 220 | 2,929 | 3,149 | 1,310 | 1968 | Feb-97 | ||||||||||||||||||||
Salina, KS(3) |
— | 100 | 1,153 | 628 | 100 | 1,781 | 1,881 | 829 | 1985 | May-97 | ||||||||||||||||||||
Stephenville TX |
— | 670 | 16,461 | — | 670 | 16,461 | 17,131 | 48 | 2009 | Nov-10 | ||||||||||||||||||||
St. Petersburg, FL |
— | 1,070 | 7,930 | — | 1,070 | 7,930 | 9,000 | 201 | 1988 | Feb-10 | ||||||||||||||||||||
Tacoma, WA |
— | 723 | 6,401 | 901 | 723 | 7,302 | 8,025 | 1,100 | 1993/2009 | Aug-06 | ||||||||||||||||||||
Tappahannock, VA(3) |
— | 375 | 1,327 | 397 | 375 | 1,724 | 2,099 | 1,194 | 1977/1978 | Oct-95 | ||||||||||||||||||||
Tucson, AZ |
— | 276 | 8,924 | 112 | 276 | 9,036 | 9,312 | 3,303 | 1985/92 | Aug-00 | ||||||||||||||||||||
84
LTC PROPERTIES, INC.
SCHEDULE III
REAL ESTATE AND ACCUMULATED DEPRECIATION (Continued)
| |
|
|
|
|
Gross amount at which carried at December 31, 2010 |
|
|
|
||||||||||||||||||||||
|---|---|---|---|---|---|---|---|---|---|---|---|---|---|---|---|---|---|---|---|---|---|---|---|---|---|---|---|---|---|---|
| |
|
Initial cost to company | Costs capitalized subsequent to acquisition |
|
|
|
||||||||||||||||||||||||
| |
Encumbrances | Land | Building and improvements |
Land | Building and improvements |
Total(2) | Accum deprec. |
Construction/ renovation date |
Acquisition date |
|||||||||||||||||||||
Tyler, TX |
— | 300 | 3,071 | 22 | 300 | 3,093 | 3,393 | 663 | 1974 | Mar-04 | ||||||||||||||||||||
Wooster, OH |
— | 118 | 1,711 | 2,223 | 118 | 3,934 | 4,052 | 699 | 1952/62/71/07/08 | Jun-06 | ||||||||||||||||||||
Skilled Nursing |
— | 23,118 | 217,187 | 25,926 | 23,118 | 243,113 | 266,231 | 63,812 | ||||||||||||||||||||||
Assisted Living |
||||||||||||||||||||||||||||||
Ada, OK |
— | 100 | 1,650 | — | 100 | 1,650 | 1,750 | 604 | 1996 | Dec-96 | ||||||||||||||||||||
Arlington, OH |
— | 629 | 6,973 | — | 629 | 6,973 | 7,602 | 1,668 | 1993 | Dec-01 | ||||||||||||||||||||
Arvada, CO |
— | 100 | 2,810 | 276 | 100 | 3,086 | 3,186 | 1,053 | 1997 | Aug-97 | ||||||||||||||||||||
Athens, TX |
— | 96 | 1,510 | 1 | 96 | 1,511 | 1,607 | 588 | 1995 | Jan-96 | ||||||||||||||||||||
Bakersfield, CA |
— | 834 | 11,986 | 812 | 834 | 12,798 | 13,632 | 3,198 | 1998/2002 | Dec-01 | ||||||||||||||||||||
Battleground, WA |
— | 100 | 2,500 | — | 100 | 2,500 | 2,600 | 907 | 1996 | Nov-96 | ||||||||||||||||||||
Beatrice, NE |
— | 100 | 2,173 | — | 100 | 2,173 | 2,273 | 747 | 1997 | Oct-97 | ||||||||||||||||||||
Bexley, OH |
— | 306 | 4,196 | — | 306 | 4,196 | 4,502 | 1,005 | 1992 | Dec-01 | ||||||||||||||||||||
Bullhead City, AZ |
— | 100 | 2,500 | — | 100 | 2,500 | 2,600 | 861 | 1997 | Aug-97 | ||||||||||||||||||||
Burley, ID |
— | 100 | 2,200 | — | 100 | 2,200 | 2,300 | 761 | 1997 | Sep-97 | ||||||||||||||||||||
Caldwell, ID |
— | 100 | 2,200 | — | 100 | 2,200 | 2,300 | 761 | 1997 | Sep-97 | ||||||||||||||||||||
Camas, WA |
— | (1) | 100 | 2,175 | — | 100 | 2,175 | 2,275 | 819 | 1996 | May-96 | |||||||||||||||||||
Central, SC |
— | 100 | 2,321 | — | 100 | 2,321 | 2,421 | 645 | 1998 | Mar-99 | ||||||||||||||||||||
Daytona Beach, FL |
— | 733 | 3,568 | — | 733 | 3,568 | 4,301 | 18 | 1996 | Oct-10 | ||||||||||||||||||||
Denison, IA |
— | 100 | 2,713 | — | 100 | 2,713 | 2,813 | 876 | 1998 | Jun-98 | ||||||||||||||||||||
Dodge City, KS |
— | 84 | 1,666 | 4 | 84 | 1,670 | 1,754 | 674 | 1995 | Dec-95 | ||||||||||||||||||||
Durant, OK |
— | 100 | 1,769 | — | 100 | 1,769 | 1,869 | 631 | 1997 | Apr-97 | ||||||||||||||||||||
Edmond, OK |
— | 100 | 1,365 | 526 | 100 | 1,891 | 1,991 | 653 | 1996 | Aug-97 | ||||||||||||||||||||
Elkhart, IN |
— | 100 | 2,435 | — | 100 | 2,435 | 2,535 | 819 | 1997 | Dec-97 | ||||||||||||||||||||
Erie, PA |
— | 850 | 7,477 | — | 850 | 7,477 | 8,327 | 2,490 | 1998 | Oct-99 | ||||||||||||||||||||
Eugene, OR |
— | 100 | 2,600 | — | 100 | 2,600 | 2,700 | 894 | 1997 | Sep-97 | ||||||||||||||||||||
Fremont ,OH |
— | 100 | 2,435 | — | 100 | 2,435 | 2,535 | 844 | 1997 | Aug-97 | ||||||||||||||||||||
Ft. Collins, CO |
— | 100 | 2,961 | — | 100 | 2,961 | 3,061 | 896 | 1998 | Mar-99 | ||||||||||||||||||||
Ft. Collins, CO |
— | 100 | 3,400 | — | 100 | 3,400 | 3,500 | 1,000 | 1999 | Jul-99 | ||||||||||||||||||||
Ft. Meyers, FL |
— | 100 | 2,728 | 9 | 100 | 2,737 | 2,837 | 900 | 1998 | Mar-98 | ||||||||||||||||||||
Ft. Wayne, IN |
— | 594 | 3,461 | 476 | 594 | 3,937 | 4,531 | 124 | 1996 | Nov-09 | ||||||||||||||||||||
Goldsboro, NC |
— | 100 | 2,385 | 1 | 100 | 2,386 | 2,486 | 615 | 1998 | Mar-99 | ||||||||||||||||||||
Grandview, WA |
— | (1) | 100 | 1,940 | — | 100 | 1,940 | 2,040 | 745 | 1996 | Mar-96 | |||||||||||||||||||
Great Bend, KS |
— | 80 | 1,570 | 21 | 80 | 1,591 | 1,671 | 692 | 1995 | Dec-95 | ||||||||||||||||||||
Greeley, CO |
— | 100 | 2,310 | 270 | 100 | 2,580 | 2,680 | 887 | 1997 | Aug-97 | ||||||||||||||||||||
Greenville, NC |
— | 100 | 2,478 | 2 | 100 | 2,480 | 2,580 | 721 | 1998 | Mar-99 | ||||||||||||||||||||
Greenville, TX |
— | 42 | 1,565 | — | 42 | 1,565 | 1,607 | 608 | 1995 | Jan-96 | ||||||||||||||||||||
Greenwood, SC |
— | 100 | 2,638 | — | 100 | 2,638 | 2,738 | 783 | 1998 | Mar-99 | ||||||||||||||||||||
Gulf Breeze, FL |
— | 624 | 3,878 | — | 624 | 3,878 | 4,502 | 22 | 2000 | Oct-10 | ||||||||||||||||||||
Hayden, ID |
— | 100 | 2,450 | 243 | 100 | 2,693 | 2,793 | 969 | 1996 | Dec-96 | ||||||||||||||||||||
Hoquiam, WA |
— | 100 | 2,500 | — | 100 | 2,500 | 2,600 | 866 | 1997 | Aug-97 | ||||||||||||||||||||
Jacksonville, TX |
— | 100 | 1,900 | — | 100 | 1,900 | 2,000 | 733 | 1996 | Mar-96 | ||||||||||||||||||||
Kelso, WA |
— | 100 | 2,500 | — | 100 | 2,500 | 2,600 | 963 | 1996 | Nov-96 | ||||||||||||||||||||
Kennewick. WA |
— | (1) | 100 | 1,940 | — | 100 | 1,940 | 2,040 | 749 | 1996 | Feb-96 | |||||||||||||||||||
Klamath Falls, OR |
— | 100 | 2,300 | — | 100 | 2,300 | 2,400 | 832 | 1996 | Dec-96 | ||||||||||||||||||||
Lake Havasu, AZ |
— | 100 | 2,420 | — | 100 | 2,420 | 2,520 | 839 | 1997 | Aug-97 | ||||||||||||||||||||
Longmont, CO |
— | 100 | 2,640 | — | 100 | 2,640 | 2,740 | 858 | 1998 | Jun-98 | ||||||||||||||||||||
Longview, TX |
— | 38 | 1,568 | 1 | 38 | 1,569 | 1,607 | 616 | 1995 | Oct-95 | ||||||||||||||||||||
Loveland, CO |
— | 100 | 2,865 | 270 | 100 | 3,135 | 3,235 | 1,062 | 1997 | Sep-97 | ||||||||||||||||||||
Lufkin, TX |
— | 100 | 1,950 | — | 100 | 1,950 | 2,050 | 745 | 1996 | Apr-96 | ||||||||||||||||||||
Madison, IN |
— | 100 | 2,435 | — | 100 | 2,435 | 2,535 | 834 | 1997 | Oct-97 | ||||||||||||||||||||
Marshall, TX |
— | 38 | 1,568 | 451 | 38 | 2,019 | 2,057 | 792 | 1995 | Oct-95 | ||||||||||||||||||||
McPherson, KS |
— | 79 | 1,571 | 4 | 79 | 1,575 | 1,654 | 685 | 1994 | Dec-95 | ||||||||||||||||||||
Merritt Island, FL |
— | 455 | 8,245 | — | 455 | 8,245 | 8,700 | 42 | 2004 | Oct-10 | ||||||||||||||||||||
Millville, NJ |
— | 100 | 2,825 | — | 100 | 2,825 | 2,925 | 975 | 1997 | Aug-97 | ||||||||||||||||||||
Monroeville, PA |
— | 526 | 5,334 | 230 | 526 | 5,564 | 6,090 | 167 | 1997 | Nov-09 | ||||||||||||||||||||
Nampa, ID |
— | 100 | 2,240 | 23 | 100 | 2,263 | 2,363 | 818 | 1997 | Jan-97 | ||||||||||||||||||||
New Bern, NC |
— | 100 | 2,427 | 1 | 100 | 2,428 | 2,528 | 638 | 1998 | Mar-99 | ||||||||||||||||||||
Newark, OH |
— | 100 | 2,435 | — | 100 | 2,435 | 2,535 | 834 | 1997 | Oct-97 | ||||||||||||||||||||
85
LTC PROPERTIES, INC.
SCHEDULE III
REAL ESTATE AND ACCUMULATED DEPRECIATION (Continued)
| |
|
|
|
|
Gross amount at which carried at December 31, 2010 |
|
|
|
||||||||||||||||||||||
|---|---|---|---|---|---|---|---|---|---|---|---|---|---|---|---|---|---|---|---|---|---|---|---|---|---|---|---|---|---|---|
| |
|
Initial cost to company | Costs capitalized subsequent to acquisition |
|
|
|
||||||||||||||||||||||||
| |
Encumbrances | Land | Building and improvements |
Land | Building and improvements |
Total(2) | Accum deprec. |
Construction/ renovation date |
Acquisition date |
|||||||||||||||||||||
Newport Richey, FL |
— | 100 | 5,845 | 664 | 100 | 6,509 | 6,609 | 2,409 | 1986/1995 | Jan-98 | ||||||||||||||||||||
Newport, OR |
— | 100 | 2,050 | — | 100 | 2,050 | 2,150 | 914 | 1996 | Dec-96 | ||||||||||||||||||||
Niceville, FL |
— | 100 | 2,680 | — | 100 | 2,680 | 2,780 | 871 | 1998 | Jun-98 | ||||||||||||||||||||
Norfolk, NE |
— | 100 | 2,123 | — | 100 | 2,123 | 2,223 | 744 | 1997 | Jun-97 | ||||||||||||||||||||
Pittsburgh, PA |
— | 470 | 2,615 | 117 | 470 | 2,732 | 3,202 | 89 | 1994 | Nov-09 | ||||||||||||||||||||
Rocky Mount, NC |
— | 100 | 2,494 | 1 | 100 | 2,495 | 2,595 | 676 | 1998 | Mar-99 | ||||||||||||||||||||
Rocky River, OH |
— | 760 | 6,963 | — | 760 | 6,963 | 7,723 | 2,260 | 1998 | Oct-99 | ||||||||||||||||||||
Salina, KS |
— | 79 | 1,571 | 4 | 79 | 1,575 | 1,654 | 685 | 1994 | Dec-95 | ||||||||||||||||||||
San Antonio, TX |
— | 100 | 1,900 | — | 100 | 1,900 | 2,000 | 676 | 1997 | May-97 | ||||||||||||||||||||
San Antonio, TX |
— | 100 | 2,055 | — | 100 | 2,055 | 2,155 | 725 | 1997 | Jun-97 | ||||||||||||||||||||
Shelby, NC |
— | 100 | 2,805 | 2 | 100 | 2,807 | 2,907 | 911 | 1998 | Jun-98 | ||||||||||||||||||||
Spring Hill, FL |
— | 100 | 2,650 | — | 100 | 2,650 | 2,750 | 862 | 1998 | Jun-98 | ||||||||||||||||||||
Springfield, OH |
— | 100 | 2,035 | 270 | 100 | 2,305 | 2,405 | 791 | 1997 | Aug-97 | ||||||||||||||||||||
Sumter, SC |
— | 100 | 2,351 | — | 100 | 2,351 | 2,451 | 671 | 1998 | Mar-99 | ||||||||||||||||||||
Tallahassee, FL |
— | 100 | 3,075 | — | 100 | 3,075 | 3,175 | 1,002 | 1998 | Apr-98 | ||||||||||||||||||||
Tiffin, OH |
— | 100 | 2,435 | — | 100 | 2,435 | 2,535 | 844 | 1997 | Aug-97 | ||||||||||||||||||||
Troy, OH |
— | 100 | 2,435 | 306 | 100 | 2,741 | 2,841 | 955 | 1997 | May-97 | ||||||||||||||||||||
Tulsa, OK |
— | 200 | 1,650 | — | 200 | 1,650 | 1,850 | 597 | 1997 | Feb-97 | ||||||||||||||||||||
Tulsa, OK |
— | 100 | 2,395 | — | 100 | 2,395 | 2,495 | 840 | 1997 | Jun-97 | ||||||||||||||||||||
Tupelo, MS |
— | 467 | 8,933 | — | 467 | 8,933 | 9,400 | 47 | 2000 | Oct-10 | ||||||||||||||||||||
Tyler, TX |
— | 100 | 1,800 | — | 100 | 1,800 | 1,900 | 656 | 1996 | Dec-96 | ||||||||||||||||||||
Vacaville, CA |
— | 1,662 | 11,634 | 759 | 1,662 | 12,393 | 14,055 | 3,137 | 1998/2002 | Dec-01 | ||||||||||||||||||||
Vancouver, WA |
— | (1) | 100 | 2,785 | — | 100 | 2,785 | 2,885 | 1,047 | 1996 | Jun-96 | |||||||||||||||||||
Waco, TX |
— | 100 | 2,235 | — | 100 | 2,235 | 2,335 | 786 | 1997 | Jun-97 | ||||||||||||||||||||
Wahoo, NE |
— | 100 | 2,318 | — | 100 | 2,318 | 2,418 | 805 | 1997 | Jul-97 | ||||||||||||||||||||
Walla Walla, WA |
3,730 | (1) | 100 | 1,940 | — | 100 | 1,940 | 2,040 | 741 | 1996 | Apr-96 | |||||||||||||||||||
Watauga, TX |
— | 100 | 1,668 | — | 100 | 1,668 | 1,768 | 583 | 1996 | Aug-97 | ||||||||||||||||||||
Wetherford, OK |
— | 100 | 1,669 | 592 | 100 | 2,261 | 2,361 | 776 | 1996 | Aug-97 | ||||||||||||||||||||
Wheelersburg, OH |
— | 29 | 2,435 | — | 29 | 2,435 | 2,464 | 834 | 1997 | Sep-97 | ||||||||||||||||||||
Wichita Falls, TX |
— | 100 | 1,850 | — | 100 | 1,850 | 1,950 | 674 | 1996 | Dec-96 | ||||||||||||||||||||
Wichita Falls, TX |
— | 100 | 2,750 | — | 100 | 2,750 | 2,850 | 944 | 1997 | Sep-97 | ||||||||||||||||||||
Worthington, OH |
— | — | 6,102 | — | — | 6,102 | 6,102 | 3,064 | 1993 | Dec-01 | ||||||||||||||||||||
Worthington, OH |
— | — | 3,402 | — | — | 3,402 | 3,402 | 1,749 | 1995 | Dec-01 | ||||||||||||||||||||
York, NE |
— | 100 | 2,318 | 100 | 2,318 | 2,418 | 805 | 1997 | Aug-97 | |||||||||||||||||||||
Assisted Living |
3,730 | 15,975 | 262,615 | 6,336 | 15,975 | 268,951 | 284,926 | 78,696 | ||||||||||||||||||||||
Other Senior Housing Properties: |
||||||||||||||||||||||||||||||
Bradenton, FL |
— | 330 | 2,720 | 160 | 330 | 2,880 | 3,210 | 1,472 | 1989/2002 | Sep-93 | ||||||||||||||||||||
Brownsville, TX |
— | 302 | 1,856 | 835 | 302 | 2,691 | 2,993 | 487 | 1968/2009 | Apr-04 | ||||||||||||||||||||
Cordele, GA |
— | 153 | 1,455 | 132 | 153 | 1,587 | 1,740 | 574 | 1987/1988/2002 | Jul-00 | ||||||||||||||||||||
Des Moines, IA(3) |
— | 115 | 2,096 | 1,433 | 115 | 3,529 | 3,644 | 1,445 | 1972 | Sep-99 | ||||||||||||||||||||
Ft. Worth, TX |
— | 333 | 4,385 | 900 | 333 | 5,285 | 5,618 | 505 | 1985/2009 | Oct-08 | ||||||||||||||||||||
Gardendale, AL |
— | 84 | 6,316 | 1,927 | 84 | 8,243 | 8,327 | 2,776 | 1976/1984/2009 | May-96 | ||||||||||||||||||||
Gardendale, AL |
— | 16 | 1,234 | — | 16 | 1,234 | 1,250 | 542 | 1988 | May-96 | ||||||||||||||||||||
Holyoke, CO |
— | 211 | 1,513 | 283 | 211 | 1,796 | 2,007 | 811 | 1963 | Nov-00 | ||||||||||||||||||||
Lakeland, FL |
— | 519 | 2,313 | 1,626 | 519 | 3,939 | 4,458 | 1,140 | 1968/74/96/02/06/07/09 | Jul-00 | ||||||||||||||||||||
Lecanto, FL |
— | 351 | 2,665 | 2,737 | 351 | 5,402 | 5,753 | 2,551 | 1988/2006 | Sep-93 | ||||||||||||||||||||
Wytheville, VA |
— | 647 | 12,692 | — | 647 | 12,692 | 13,339 | 332 | 1970/75/85/96 | Jun-10 | ||||||||||||||||||||
|
— | |||||||||||||||||||||||||||||
Other Senior Housing Properties |
— | 3,061 | 39,245 | 10,033 | 3,061 | 49,278 | 52,339 | 12,635 | ||||||||||||||||||||||
86
LTC PROPERTIES, INC.
SCHEDULE III
REAL ESTATE AND ACCUMULATED DEPRECIATION (Continued)
| |
|
|
|
|
Gross amount at which carried at December 31, 2010 |
|
|
|
||||||||||||||||||||||
|---|---|---|---|---|---|---|---|---|---|---|---|---|---|---|---|---|---|---|---|---|---|---|---|---|---|---|---|---|---|---|
| |
|
Initial cost to company | Costs capitalized subsequent to acquisition |
|
|
|
||||||||||||||||||||||||
| |
Encumbrances | Land | Building and improvements |
Land | Building and improvements |
Total(2) | Accum deprec. |
Construction/ renovation date |
Acquisition date |
|||||||||||||||||||||
School: |
||||||||||||||||||||||||||||||
Eagan, MN |
— | 1,110 | 1,790 | — | 1,110 | 1,790 | 2,900 | —- | 1987/1994 | Sep-10 | ||||||||||||||||||||
Trenton, NJ |
— | 100 | 6,000 | 3,170 | 100 | 9,170 | 9,270 | 3,566 | 1930/1998 | Dec-98 | ||||||||||||||||||||
School |
— | 1,210 | 7,790 | 3,170 | 1,210 | 10,960 | 12,170 | 3,566 | ||||||||||||||||||||||
Total |
$ | 3,730 | $ | 43,364 | $ | 526,837 | $ | 45,465 | $ | 43,364 | $ | 572,302 | $ | 615,666 | $ | 158,709 | ||||||||||||||
- (1)
- Single
note backed by five properties in Washington.
- (2)
- Depreciation
for building are calculated using a 35 to 40 year life. Depreciation for building improvements are calculated using a 10 to
20 year life. Depreciation for furniture and fixtures is calculated based on a 7 to 10 year life.
- (3)
- An
impairment charge totaling $4,190 was taken against four properties based on our estimate of the excess carrying value over the fair value of assets to
be held and used, and the carrying value over the fair value less cost to sell in instances where management has determined that the Company will dispose of the property.
87
SCHEDULE III
REAL ESTATE AND ACCUMULATED DEPRECIATION (Continued)
Activity for the years ended December 31, 2010, 2009 and 2008 is as follows (in thousands):
| |
Real Estate & Equipment |
Accumulated Depreciation |
||||||
|---|---|---|---|---|---|---|---|---|
Balance at December 31, 2007 |
$ | 492,880 | $ | 115,766 | ||||
Additions |
5,347 | 14,655 | ||||||
Conversion of mortgage loans into owned properties |
4,717 | 50 | ||||||
Impairment charges |
136 | 4 | ||||||
Cost of real estate sold |
(463 | ) | — | |||||
Balance at December 31, 2008 |
502,617 | 130,475 | ||||||
Additions |
16,843 | 14,705 | ||||||
Conversion of mortgage loans into owned properties |
— | — | ||||||
Impairment charges |
— | — | ||||||
Cost of real estate sold |
— | — | ||||||
Balance at December 31, 2009 |
519,460 | 145,180 | ||||||
Additions |
100,191 | 16,016 | ||||||
Conversion of mortgage loans into owned properties |
2,900 | — | ||||||
Impairment charges |
— | — | ||||||
Cost of real estate sold |
(6,885 | ) | (2,487 | ) | ||||
Balance at December 31, 2010 |
$ | 615,666 | $ | 158,709 | ||||
88
LTC PROPERTIES, INC.
SCHEDULE IV
MORTGAGE LOANS ON REAL ESTATE
| |
|
|
|
|
|
|
|
|
Principal Amount of Loans Subject to Delinquent Principal or Interest |
|||||||||||||||||
|---|---|---|---|---|---|---|---|---|---|---|---|---|---|---|---|---|---|---|---|---|---|---|---|---|---|---|
| |
(Unaudited) Number of |
|
|
|
|
|
Carrying Amount of Mortgages December 31, 2010 |
|||||||||||||||||||
| |
|
|
|
Current Monthly Debt Service |
|
|||||||||||||||||||||
| |
|
Final Maturity Date |
Balloon Amount(2) |
Face Amount of Mortgages |
||||||||||||||||||||||
State
|
Properties | Units/Beds(3) | Interest Rate(1) | |||||||||||||||||||||||
TX |
6 | 108 | 9.80% | 2018 | $ | 5,095 | $ | 65 | $ | 6,800 | $ | 6,516 | $ | — | ||||||||||||
FL |
3 | 256 | 11.60% | 2014 | 6,061 | 70 | 6,850 | 6,465 | — | |||||||||||||||||
TX |
1 | 230 | 10.20% | 2017 | 2,972 | 39 | 4,000 | 3,771 | — | |||||||||||||||||
CA |
1 | 173 | 11.13% | 2015 | 2,232 | 47 | 4,700 | 3,301 | — | |||||||||||||||||
MO |
1 | 100 | 10.85% | 2018 | 1,847 | 39 | 1,500 | 3,147 | — | |||||||||||||||||
NE |
1 | 47 | 11.22% | 2013 | 2,716 | 31 | 3,243 | 2,874 | — | |||||||||||||||||
NE |
1 | 44 | 11.22% | 2013 | 2,537 | 29 | 3,036 | 2,684 | — | |||||||||||||||||
FL |
1 | 90 | 14.33% | 2012 | 2,221 | 42 | 3,510 | 2,456 | — | |||||||||||||||||
MT |
1 | 34 | 13.95% | 2013 | 2,053 | 27 | 2,346 | 2,144 | — | |||||||||||||||||
NE |
1 | 44 | 11.44% | 2013 | 2,005 | 24 | 2,700 | 2,135 | — | |||||||||||||||||
IA |
1 | 44 | 11.22% | 2013 | 1,998 | 23 | 2,400 | 2,111 | — | |||||||||||||||||
TX |
1 | 117 | 10.20% | 2017 | 1,634 | 21 | 2,200 | 2,074 | — | |||||||||||||||||
SD |
1 | 34 | 11.22% | 2013 | 1,954 | 22 | 2,346 | 2,064 | — | |||||||||||||||||
Various |
24 | 2,648 | 10.00%-13.25% | 2011-2019 | 6,711 | 409 | 39,037 | 17,284 | — | |||||||||||||||||
|
44 | (4) | 3,969 | $ | 42,036 | $ | 888 | $ | 84,668 | $ | 59,026 | $ | — | |||||||||||||
- (1)
- Represents
current stated interest rate. Generally, the loans have 25-year amortization with principal and interest payable at varying amounts
over the life to maturity with annual interest adjustments through specified fixed rate increases effective either on the first anniversary or calendar year of the loan.
- (2)
- Balloon
payment is due upon maturity.
- (3)
- This
number is based upon unit/bed counts shown on operating licenses provided to us by lessees/borrowers or units/beds as stipulated by lease/mortgage
documents. We have found during the years that these numbers often differ, usually not materially, from units/beds in operation at any point in time. The differences are caused by such things as
operators converting a patient/resident room for alternative uses, such as offices or storage, or converting a multi-patient room/unit into a single patient room/unit. We monitor our properties on a
routine basis through site visits and reviews of current licenses. In an instance where such change would cause a de-licensing of beds or in our opinion impact the value of the property,
we would take action against the lessee/borrower to preserve the value of the property/collateral.
- (4)
- Includes 34 first-lien mortgage loans as follows:
Number of Loans
|
Original loan amounts | |
|---|---|---|
18 |
$ 500 - $ 2,000 | |
8 |
$2,001 - $ 3,000 | |
4 |
$3,001 - $ 4,000 | |
1 |
$4,001 - $ 5,000 | |
— |
$5,001 - $ 6,000 | |
2 |
$6,001 - $ 7,000 | |
1 |
$7,001 - $10,000 |
89
LTC PROPERTIES, INC.
SCHEDULE IV
MORTGAGE LOANS ON REAL ESTATE (Continued)
Activity for the years ended December 31, 2010, 2009 and 2008 is as follows:
Balance—December 31, 2007 |
$ | 91,278 | |||
Investment in real estate mortgages |
9,783 | ||||
Recovery of loan losses |
130 | ||||
Mortgage premium |
44 | ||||
Loan prepayments/payoffs |
(14,348 | ) | |||
Collections of principal |
(4,642 | ) | |||
Conversion of loans into leases |
(4,704 | ) | |||
Balance—December 31, 2008 |
77,541 | ||||
Investment in real estate mortgages |
280 | ||||
Recovery of loan losses |
56 | ||||
Mortgage discount |
(151 | ) | |||
Loan prepayments/payoffs |
(3,716 | ) | |||
Collections of principal |
(4,127 | ) | |||
Balance—December 31, 2009 |
69,883 | ||||
Investment in real estate mortgages |
1,694 | ||||
Recovery of loan losses |
108 | ||||
Provisions for doubtful accounts |
(1,235 | ) | |||
Mortgage discount |
(121 | ) | |||
Loan prepayments/payoffs |
(3,904 | ) | |||
Collections of principal |
(4,499 | ) | |||
Conversion of loans into leases |
(2,900 | ) | |||
Balance—December 31, 2010 |
$ | 59,026 | |||
90
Item 9. CHANGES IN AND DISAGREEMENTS WITH ACCOUNTANTS ON ACCOUNTING AND FINANCIAL DISCLOSURE
None.
Item 9A. CONTROLS AND PROCEDURES
Disclosure Controls and Procedures.
Our management, with the participation of our Chief Executive Officer and Chief Financial Officer, evaluated the effectiveness of our disclosure controls and procedures (as such term is defined in Rules 13a-15(e) and 15d-15(e) under the Securities and Exchange Act of 1934, as amended) as of the end of the period covered by this report. Based on such evaluation our Chief Executive Officer and Chief Financial Officer concluded that, as of the end of the period covered by this report our disclosure controls and procedures were effective.
Internal Control over Financial Reporting.
The Management Report on Internal Control over Financial Reporting and the Report of Independent Registered Public Accounting Firm thereon are set forth on pages 82 and 83, respectively.
There has been no change in our internal control over financial reporting during the period covered by this report that has materially affected, or is reasonably likely to materially affect, our internal control over financial reporting.
None.
91
MANAGEMENT REPORT ON INTERNAL CONTROL OVER FINANCIAL REPORTING
Our management is responsible for establishing and maintaining adequate internal control over financial reporting. Internal control over financial reporting is defined in Rule 13a-15(f) or 15d-15(f) promulgated under the Securities Exchange Act of 1934, as amended, as a process designed by, or under the supervision of, the issuer's principal executive and principal financial officers and effected by the issuer's board of directors, management and other personnel, to provide reasonable assurance regarding the reliability of financial reporting and the preparation of financial statements for external purposes in accordance with generally accepted accounting principles and includes those policies and procedures that:
- •
- Pertain to the maintenance of records that in reasonable detail accurately and fairly reflect the transactions and
dispositions of the assets of the issuer;
- •
- Provide reasonable assurance that transactions are recorded as necessary to permit preparation of financial statements in
accordance with generally accepted accounting principles, and that receipts and expenditures of the issuer are being made only in accordance with authorizations of management and directors of the
issuer; and
- •
- Provide reasonable assurance regarding prevention or timely detection of unauthorized acquisition, use or disposition of the issuer's assets that could have a material effect on the financial statements.
Because of its inherent limitations, internal control over financial reporting may not prevent or detect material misstatements on a timely basis. Projections of any evaluation of effectiveness to future periods are subject to the risk that controls may become inadequate because of changes in conditions, or that the degree of compliance with the policies or procedures may deteriorate.
Our management, with the participation of our Chief Executive Officer and Chief Financial Officer, evaluated the effectiveness of our internal control over financial reporting as of December 31, 2010. In making this assessment, management used the criteria set forth by the Committee of Sponsoring Organizations of the Treadway Commission (or COSO) in Internal Control-Integrated Framework. Based on this assessment, our management concluded that, as of the end of the fiscal year ended December 31, 2010, our internal control over financial reporting was effective.
The effectiveness of our internal control over financial reporting as of December 31, 2010, has been audited by Ernst &Young LLP, independent registered public accounting firm. Ernst & Young LLP's report on our internal control over financial reporting appears on page 83.
92
Report of Independent Registered Public Accounting Firm
To the Board of Directors and Stockholders of LTC Properties, Inc.
We have audited LTC Properties, Inc.'s (the "Company") internal control over financial reporting as of December 31, 2010, based on criteria established in Internal Control—Integrated Framework issued by the Committee of Sponsoring Organizations of the Treadway Commission (the COSO criteria). LTC Properties Inc.'s management is responsible for maintaining effective internal control over financial reporting, and for its assessment of the effectiveness of internal control over financial reporting included in the accompanying Management's Report on Internal Control over Financial Reporting. Our responsibility is to express an opinion on the company's internal control over financial reporting based on our audit.
We conducted our audit in accordance with the standards of the Public Company Accounting Oversight Board (United States). Those standards require that we plan and perform the audit to obtain reasonable assurance about whether effective internal control over financial reporting was maintained in all material respects. Our audit included obtaining an understanding of internal control over financial reporting, assessing the risk that a material weakness exists, testing and evaluating the design and operating effectiveness of internal control based on the assessed risk, and performing such other procedures as we considered necessary in the circumstances. We believe that our audit provides a reasonable basis for our opinion.
A company's internal control over financial reporting is a process designed to provide reasonable assurance regarding the reliability of financial reporting and the preparation of financial statements for external purposes in accordance with generally accepted accounting principles. A company's internal control over financial reporting includes those policies and procedures that (1) pertain to the maintenance of records that, in reasonable detail, accurately and fairly reflect the transactions and dispositions of the assets of the company; (2) provide reasonable assurance that transactions are recorded as necessary to permit preparation of financial statements in accordance with generally accepted accounting principles, and that receipts and expenditures of the company are being made only in accordance with authorizations of management and directors of the company; and (3) provide reasonable assurance regarding prevention or timely detection of unauthorized acquisition, use or disposition of the company's assets that could have a material effect on the financial statements.
Because of its inherent limitations, internal control over financial reporting may not prevent or detect misstatements. Also, projections of any evaluation of effectiveness to future periods are subject to the risk that controls may become inadequate because of changes in conditions, or that the degree of compliance with the policies or procedures may deteriorate.
In our opinion, LTC Properties, Inc. maintained, in all material respects, effective internal control over financial reporting as of December 31, 2010, based on the COSO criteria.
We also have audited, in accordance with the standards of the Public Company Accounting Oversight Board (United States), the consolidated balance sheets of LTC Properties Inc. as of December 31, 2010 and 2009, and the related consolidated statements of income and comprehensive income, equity, and cash flows for each of the three years in the period ended December 31, 2010 of LTC Properties Inc. and our report dated February 23, 2011 expressed an unqualified opinion thereon.
/s/ Ernst & Young LLP |
||
Los Angeles, California February 23, 2011 |
93
Item 10. DIRECTORS, EXECUTIVE OFFICERS AND CORPORATE GOVERNANCE
The information required by this item is incorporated by reference to our definitive proxy statement for the 2011 Annual Meeting of Stockholders (to be filed with the Securities and Exchange Commission within 120 days of our December 31, 2010 fiscal year end) under the headings "Proposal 1 Election of Directors," "Corporate Governance Principles and Board Matters," and "Executive Officers."
Item 11. EXECUTIVE COMPENSATION
The information required by this item is incorporated by reference to our definitive proxy statement for the 2011 Annual Meeting of Stockholders (to be filed with the Securities and Exchange Commission within 120 days of our December 31, 2010 fiscal year end) under the headings "Executive Compensation Discussion and Analysis," "Summary Compensation Table," "Director Compensation," and "Compensation Committee Report."
Item 12. SECURITY OWNERSHIP OF CERTAIN BENEFICIAL OWNERS AND MANAGEMENT AND RELATED STOCKHOLDER MATTERS
The information required by this item is incorporated by reference to our definitive proxy statement for the 2011 Annual Meeting of Stockholders (to be filed with the Securities and Exchange Commission within 120 days of our December 31, 2010 fiscal year end) under the heading "Security Ownership of Certain Beneficial Owners and Management and Related Stockholder Matters."
Item 13. CERTAIN RELATIONSHIPS AND RELATED TRANSACTIONS, AND DIRECTOR INDEPENDENCE
The information required by this item is incorporated by reference to our definitive proxy statement for the 2011 Annual Meeting of Stockholders (to be filed with the Securities and Exchange Commission within 120 days of our December 31, 2010 fiscal year end) under the heading "Certain Relationships and Related Transactions, and Director Independence."
Item 14. PRINCIPAL ACCOUNTANT FEES AND SERVICES
The information required by this item is incorporated by reference to our definitive proxy statement for the 2011 Annual Meeting of Stockholders (to be filed with the Securities and Exchange Commission within 120 days of our December 31, 2010 fiscal year end) under the heading "Independent Registered Public Accounting Firm Fees and Services."
94
Item 15. EXHIBITS AND FINANCIAL STATEMENT SCHEDULES
The following documents are filed as a part of this report:
Financial Statements
| |
Page | |||
|---|---|---|---|---|
Report of Independent Registered Public Accounting Firm |
52 | |||
Consolidated Balance Sheets as of December 31, 2010 and 2009 |
53 | |||
Consolidated Statements of Income and Comprehensive Income for the years ended December 31, 2010, 2009 and 2008 |
54 | |||
Consolidated Statements of Equity for the years ended December 31, 2010, 2009 and 2008 |
55 | |||
Consolidated Statements of Cash Flows for the years ended December 31, 2010, 2009 and 2008 |
56 | |||
Notes to Consolidated Financial Statements |
57 | |||
Financial Statement Schedules
| II. | Valuation and Qualifying Accounts | 83 | |||
| III. | Real Estate and Accumulated Depreciation | 84 | |||
| IV. | Mortgage Loans on Real Estate | 89 |
All other schedules are omitted because they are not applicable or not present in amounts sufficient to require submission of the schedule or the required information is shown in the Consolidated Financial Statements and the Notes thereto.
Exhibits
The exhibits required by Item 601 of Regulation S-K are set forth in the index to exhibits on page 86 of this annual report.
95
LTC PROPERTIES, INC.
INDEX TO EXHIBITS
| Exhibit Number |
Description | |
|---|---|---|
| 3.1 | LTC Properties, Inc. Articles of Restatement (incorporated by reference to Exhibit 3.1 to LTC Properties Inc.'s Form 10-Q for the quarter ended June 30, 2009) | |
3.2 |
Bylaws of LTC Properties, Inc., as amended and restated August 3, 2009 (incorporated by reference to Exhibit 3.2 to LTC Properties Inc.'s Form 10-Q for the quarter ended June 30, 2009) |
|
4.1 |
Amended and Restated Agreement of Limited Partnership of LTC Partners IX, L.P. and Exchange Rights Agreement dated February 11, 1998 (incorporated by reference to Exhibit 4.8 to LTC Properties, Inc.'s Registration Statement on Form S-3 (File No. 333-115991) filed on May 28, 2004) |
|
10.1 |
Second Amended and Restated Credit Agreement dated July 17, 2008 among LTC Properties, Inc. and Bank of Montreal, Chicago Branch is the Administrative Agent, BMO Capital Markets, as Co-Lead Arranger and Book Manager, Key Bank National Association as Co-Lead Arranger and Syndication Agent (incorporated by reference to Exhibit 10.1 to LTC Properties, Inc.'s Current Report on Form 8-K filed July 18, 2008) |
|
10.2 |
Commitment Amount Increase Request dated as of March 15, 2010 (incorporated by reference to Exhibit 10.2 to LTC Properties, Inc.'s Current Report on Form 8-K filed March 17, 2010) |
|
10.3 |
First Amendment to the Second Amended and Restated Credit Agreement, dated October 29, 2010 (incorporated by reference to Exhibit 10.1 to LTC Properties Inc.'s Current Report on Form 8-K dated November 1, 2010) |
|
10.4 |
Equity Distribution Agreement, date August 5, 2009, between LTC Properties, Inc. and KeyBanc Capital Markets Inc. (incorporated by reference to Exhibit 1.1 to LTC Properties, Inc.'s Current Report on Form 8-K filed August 5, 2009) |
|
10.5 |
Amendment No. 1 to Equity Distribution Agreement, dated August 4, 2010 (incorporated by reference to Exhibit 1.1 to LTC Properties Inc.'s Current Report on Form 8-K dated August 4, 2010) |
|
10.6 |
Amended and Restated Equity Distribution Agreement, dated October 26, 2010, between LTC Properties, Inc. and KeyBanc Capital Markets Inc. (incorporated by reference to Exhibit 1.1 to LTC Properties Inc.'s Current Report on Form 8-K dated October 26, 2010) |
|
10.7 |
Equity Distribution Agreement, dated October 26, 2010, between LTC Properties, Inc. and BMO Capital Markets Corp. (incorporated by reference to Exhibit 1.2 to LTC Properties Inc.'s Current Report on Form 8-K dated October 26, 2010) |
|
10.8 |
Note Purchase and Private Shelf Agreement between LTC Properties, Inc. and Prudential Investment Management, Inc. dated July 14, 2010 (incorporated by reference to Exhibit 10.1 to LTC Properties, Inc.'s Quarterly Report on Form 10-Q for the quarter ended June 30, 2010) |
|
10.9 |
Form of Purchase Agreement by and between the Company and the Purchasers of the Shares (incorporated by reference to Exhibit 10.1 to LTC Properties Inc.'s Current Report on Form 8-K dated August 3, 2010) |
96
| Exhibit Number |
Description | |
|---|---|---|
| 10.10 | Placement Agent Agreement dated August 2, 2010 between the Company and CSCA Capital Advisors, LLC (incorporated by reference to Exhibit 10.2 to LTC Properties Inc.'s Current Report on Form 8-K dated August 3, 2010) | |
10.11+ |
Second Amendment to 2007 Amended and Restated Employment Agreement of Andre Dimitriadis, dated July 1, 2007 (incorporated by reference to Exhibit 10.3 to LTC Properties, Inc.'s Quarterly Report on Form 10-Q for the quarter ended June 30, 2007) |
|
10.12+ |
Third Amendment to the 2007 Amended and Restated Employment Agreement of Wendy Simpson dated December 4, 2007 (incorporated by reference to Exhibit 10.1 to LTC Properties, Inc.'s Current Report on Form 8-K dated December 5, 2007) |
|
10.13+ |
Third Amended and Restated Employment Agreement of Pamela Kessler, effective as of December 4, 2007 (incorporated by reference to Exhibit 10.13 to LTC Properties, Inc.'s Annual Report on Form 10-K for the year ended December 31, 2007) |
|
10.14+ |
Second Amended and Restated Employment Agreement of Clint Malin, effective as of December 4, 2007 (incorporated by reference to Exhibit 10.15 to LTC Properties, Inc.'s Annual Report on Form 10-K for the year ended December 31, 2007) |
|
10.15+ |
Amended and Restated Employment Agreement of T. Andrew Stokes, effective as of December 4, 2007 (incorporated by reference to Exhibit 10.16 to LTC Properties, Inc.'s Annual Report on Form 10-K for the year ended December 31, 2007) |
|
10.16 |
The 2008 Equity Participation Plan (incorporated by reference to Exhibit 10.8 to LTC Properties, Inc.'s Annual Report on Form 10-K for the year ended December 31, 2009) |
|
10.17 |
Form of Stock Option Agreement under the 2008 Equity Participation Plan (incorporated by reference to Exhibit 10.9 to LTC Properties, Inc.'s Annual Report on Form 10-K for the year ended December 31, 2009) |
|
10.18 |
Form of Restricted Stock Agreement under the 2008 Equity Participation Plan (incorporated by reference to Exhibit 10.10 to LTC Properties, Inc.'s Annual Report on Form 10-K for the year ended December 31, 2009) |
|
10.19 |
Form of Indemnity Agreement dated as of July 30, 2009 between LTC Properties, Inc. and its Directors and Officers (incorporated by reference to Exhibit 10.1 to LTC Properties, Inc.'s Quarterly Report on Form 10-Q for the quarter ended June 30, 2009) |
|
12 |
Ratio of Earnings to Fixed Charges |
|
21 |
List of Subsidiaries |
|
23.1 |
Consent of Independent Registered Accounting Firm |
|
31.1 |
Certification of the Chief Executive Officer pursuant to Section 302 of the Sarbanes-Oxley Act of 2002 |
|
31.2 |
Certification of the Chief Financial Officer pursuant to Section 302 of the Sarbanes-Oxley Act of 2002 |
|
32 |
Certifications pursuant to 18 U.S.C. Section 1350, as adopted pursuant to Section 906 of the Sarbanes-Oxley Act of 2002 |
- +
- Management contract or compensatory plan or arrangement in which an executive officer or director of the Company participates.
97
LTC PROPERTIES, INC.
SIGNATURES
Pursuant to the requirements of Section 13 or 15(d) of the Securities Exchange Act of 1934, the Registrant has duly caused this report to be signed on its behalf by the undersigned, thereunto duly authorized.
| LTC PROPERTIES, INC. Registrant |
||||
Dated: February 23, 2011 |
||||
| By: | /s/ PAMELA SHELLEY-KESSLER Pamela Shelley-Kessler |
|||
| Executive Vice President, Chief Financial Officer and Corporate Secretary (Principal Financial Officer) |
||||
Pursuant to the requirements of the Securities Exchange Act of 1934, this report has been signed below by the following persons on behalf of the Registrant and in the capacities and on the dates indicated.
| /s/ WENDY L. SIMPSON Wendy L. Simpson |
Chief Executive Officer, President and Director (Principal Executive Officer) |
February 23, 2011 | ||||
/s/ PAMELA SHELLEY-KESSLER Pamela Shelley-Kessler |
Executive Vice President, Chief Financial Officer and Corporate Secretary (Principal Financial Officer and Principal Accounting Officer) |
February 23, 2011 |
||||
/s/ ANDRE C. DIMITRIADIS Andre C. Dimitriadis |
Executive Chairman of the Board and Director |
February 23, 2011 |
||||
/s/ BOYD HENDRICKSON Boyd Hendrickson |
Director |
February 23, 2011 |
||||
/s/ DEVRA G. SHAPIRO Devra G. Shapiro |
Director |
February 23, 2011 |
||||
/s/ EDMUND C. KING Edmund C. King |
Director |
February 23, 2011 |
||||
/s/ TIMOTHY J. TRICHE Timothy J. Triche |
Director |
February 23, 2011 |
98