Attached files
| file | filename |
|---|---|
| 8-K - ZALE CORPORATION 8-K - ZALE CORP | a50177035.htm |
| EX-99.1 - EXHIBIT 99.1 - ZALE CORP | a50177035ex99_1.htm |
Exhibit 99.2

Second Quarter Fiscal 2012
Earnings Call February 22, 2012 1
Forward-Looking Statements and Use of Non-GAAP Financial Measures•This presentation contains forward-looking statements, including statements regarding our multi-year plan, future sales, expenses, margins, profitability, merchandising and marketing initiatives, the future impact of the warranty revenue recognition change and industry growth forecasts. Forward-looking statements are not guarantees of future performance and a variety of factors could cause the Company's actual results to differ materially from the results expressed in the forward-looking statements. These factors include, but are not limited to: if the general economy continues to perform poorly, discretionary spending on goods that are, or are perceived to be, “luxuries” may decrease; the concentration of a substantial portion of the Company’s sales in three, relatively brief selling seasons means that the Company’s performance is more susceptible to disruptions; most of the Company’s sales are of products that include diamonds, precious metals and other commodities, and fluctuations in the availability and pricing of commodities could impact the Company’s ability to obtain and produce products at favorable prices; the Company’s sales are dependent upon mall traffic; the Company operates in a highly competitive industry; the financing market remains difficult, and if we are unable to meet the financial commitments in our current financing arrangements it will be difficult to replace or restructure these arrangements; and changes in regulatory requirements may increase the cost or adversely affect the Company’s operations and its ability to provide consumer credit and write credit insurance. For other factors, see the Company's filings with the Securities and Exchange Commission, including its Quarterly Report on Form 10-Q for the fiscal quarter ended October 31, 2011. The Company disclaims any obligation to update or revise publicly or otherwise any forward-looking statements to reflect subsequent events, new information or future circumstances, except as required by law. •This presentation contains certain non-GAAP measures as defined by SEC rules. One of these non-GAAP measures is EBITDA, which is defined as earnings before interest, taxes, depreciation and amortization. A second non-GAAP measure is adjusted EBITDA, which is further adjusted to exclude charges related to store closures. We use these measurements as part of our evaluation of the performance of the Company. In addition, we believe these measures provide useful information to investors. Please refer to the appendix at the back of this presentation for a reconciliation of these non-GAAP measures to the most comparable GAAP financial measures. 2
–Five consecutive quarters
of positive comps –Follows a 7.9% rise in the same quarter last year
•Solid performance driven by: –Improved core inventory and launch of new
branded merchandise –Expanded market reach…alternative credit program in
U.S. –New marketing campaign –Integrated online and traditional store
infrastructure –Strong execution by our customer-facing teams •Continued
investment to support the turnaround of the business 3 (1) Comparable
Store Sales exclude revenue recognized from warranties. The sales
results of new stores are included beginning with the thirteenth full
month of operations, and the sales results of closed stores are excluded
from the calculation
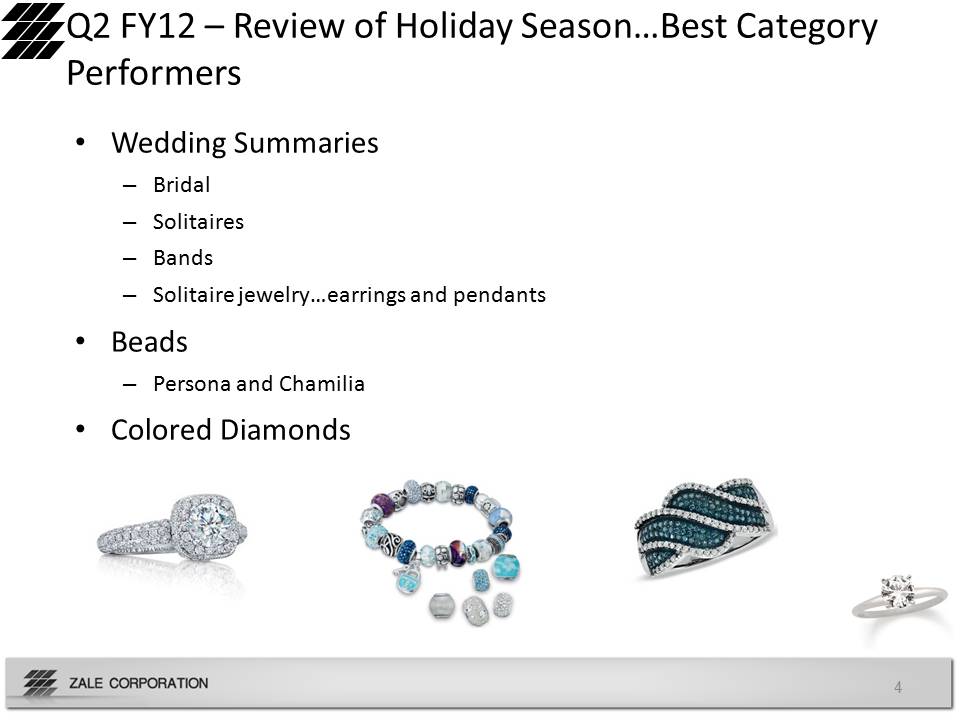
Q2 FY12 – Review of Holiday
Season…Best Category Performers •Wedding Summaries –Bridal –Solitaires
–Bands –Solitaire jewelry…earrings and pendants •Beads –Persona and
Chamilia •Colored Diamonds 4
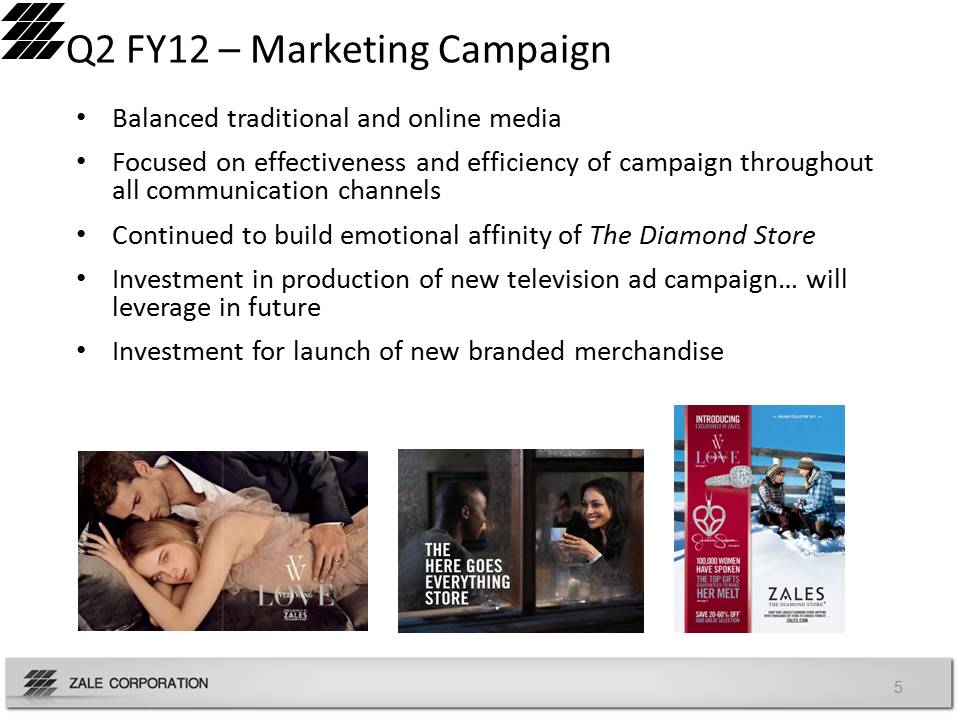
Q2 FY12 – Marketing
Campaign •Balanced traditional and online media •Focused on
effectiveness and efficiency of campaign throughout all communication
channels •Continued to build emotional affinity of The Diamond Store
•Investment in production of new television ad campaign… will leverage
in future •Investment for launch of new branded merchandise 5
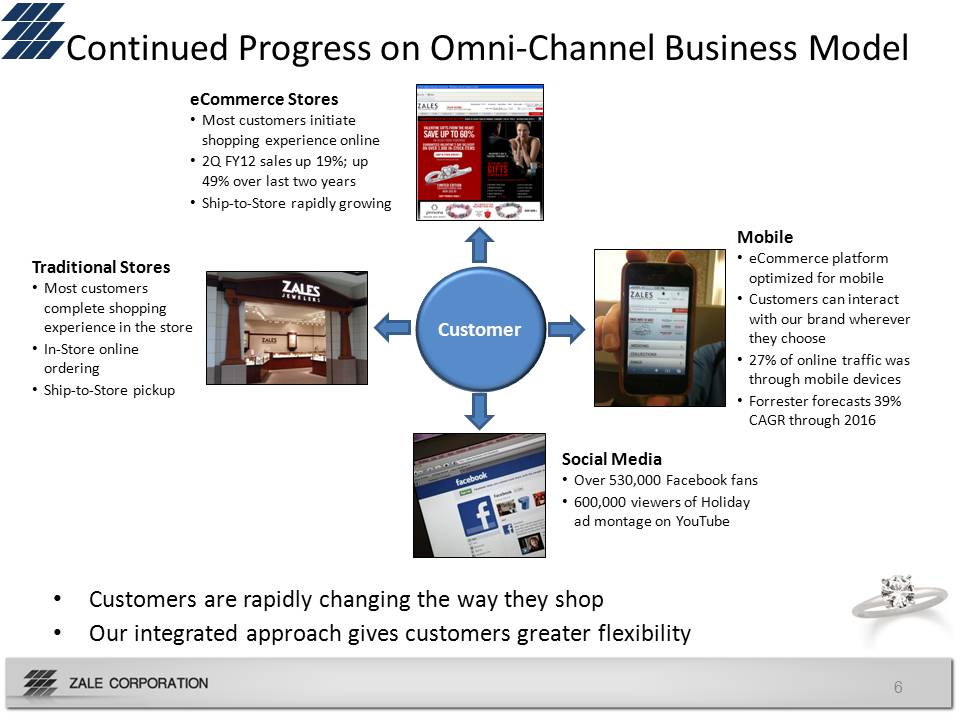
6 Continued Progress on
Omni-Channel Business Model •Customers are rapidly changing the way they
shop •Our integrated approach gives customers greater flexibility
Traditional Stores •Most customers complete shopping experience in the
store •In-Store online ordering •Ship-to-Store pickup Mobile •eCommerce
platform optimized for mobile •Customers can interact with our brand
wherever they choose •27% of online traffic was through mobile devices
•Forrester forecasts 39% CAGR through 2016 Social Media •Over 530,000
Facebook fans •600,000 viewers of Holiday ad montage on YouTube
eCommerce Stores •Most customers initiate shopping experience online •2Q
FY12 sales up 19%; up 49% over last two years •Ship-to-Store rapidly
growing Customer
Experienced Board and
Management Team •New Board Members –Beth Pritchard…retail industry
veteran –Josh Olshansky, Managing Director, Golden Gate Capital…broad
finance, retail and board experience –Neale Attenborough, Operating
Partner, Golden Gate Capital…broad retail and operating experience
•Executive Management Team –Ken Brumfield appointed Senior Vice
President, Financial Products –Experienced executive team with extensive
jewelry, retail and turnaround expertise 7
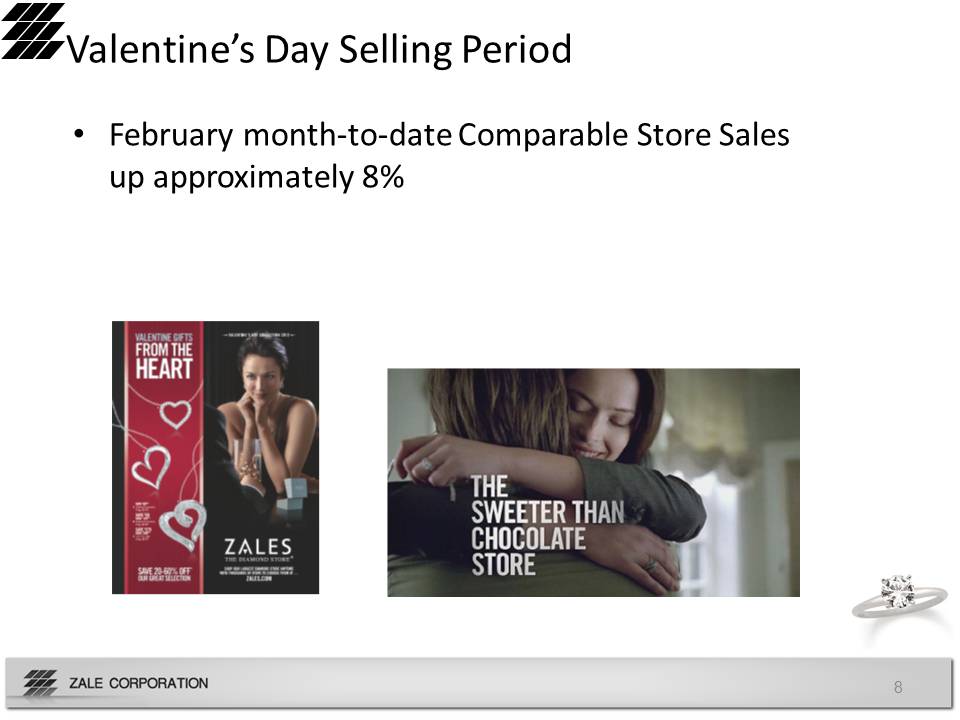
Valentine’s Day Selling
Period •February month-to-date Comparable Store Sales up approximately
8% 8
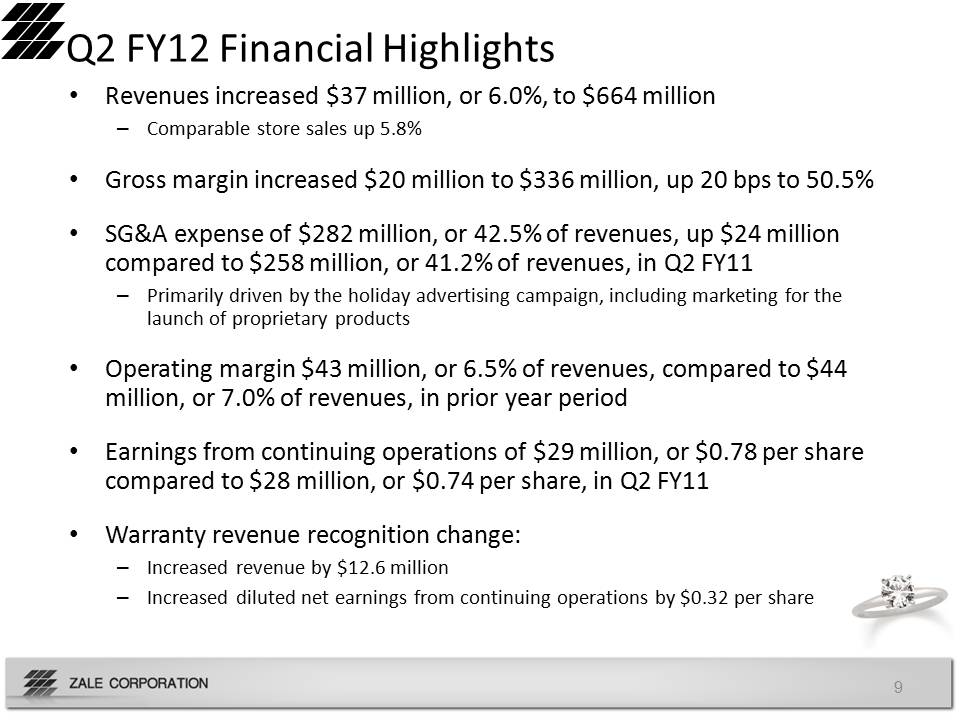
Q2 FY12 Financial •Revenues
increased $37 million, or 6.0%, to $664 million –Comparable store sales
up 5.8% •Gross margin increased $20 million to $336 million, up 20 bps
to 50.5% •SG&A expense of $282 million, or 42.5% of revenues, up $24
million compared to $258 million, or 41.2% of revenues, in Q2 FY11
–Primarily driven by the holiday advertising campaign, including
marketing for the launch of proprietary products •Operating margin $43
million, or 6.5% of revenues, compared to $44 million, or 7.0% of
revenues, in prior year period •Earnings from continuing operations of
$29 million, or $0.78 per share compared to $28 million, or $0.74 per
share, in Q2 FY11 •Warranty revenue recognition change: –Increased
revenue by $12.6 million –Increased diluted net earnings from continuing
operations by $0.32 per share 9
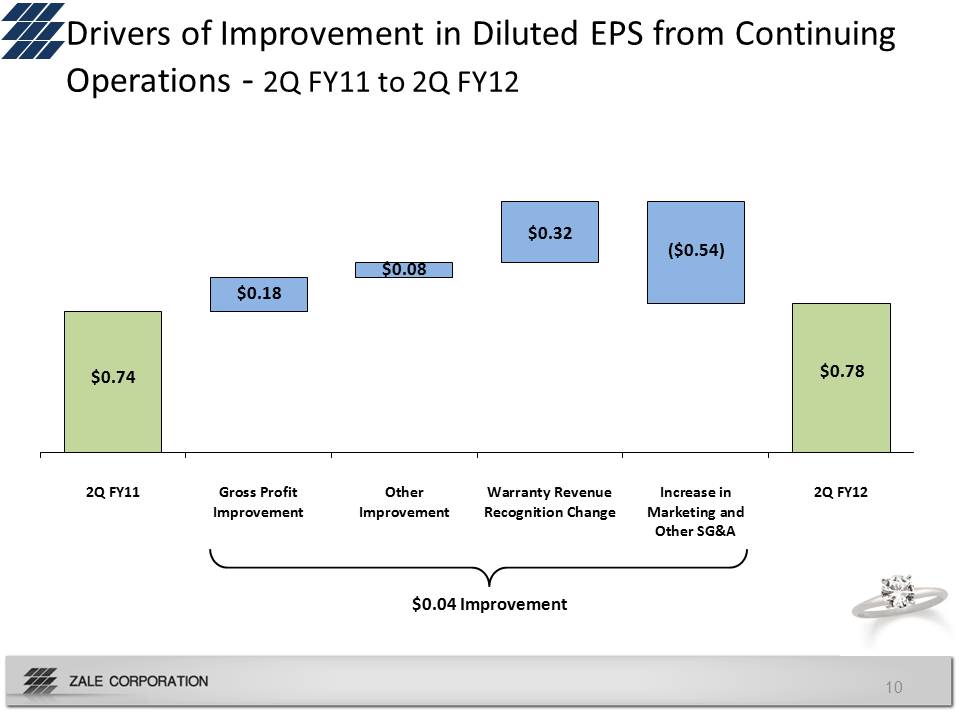
10 Drivers of Improvement
in Diluted EPS from Continuing Operations - 2Q FY11 to 2Q FY12 $0.04
Improvement 2Q FY11Gross ProfitImprovementOtherImprovementWarranty
Revenue Recognition Change Increase in Marketing andOther SG&A2Q
FY12$0.74 $0.78 $0.32 ($0.54$0.08 $0.18
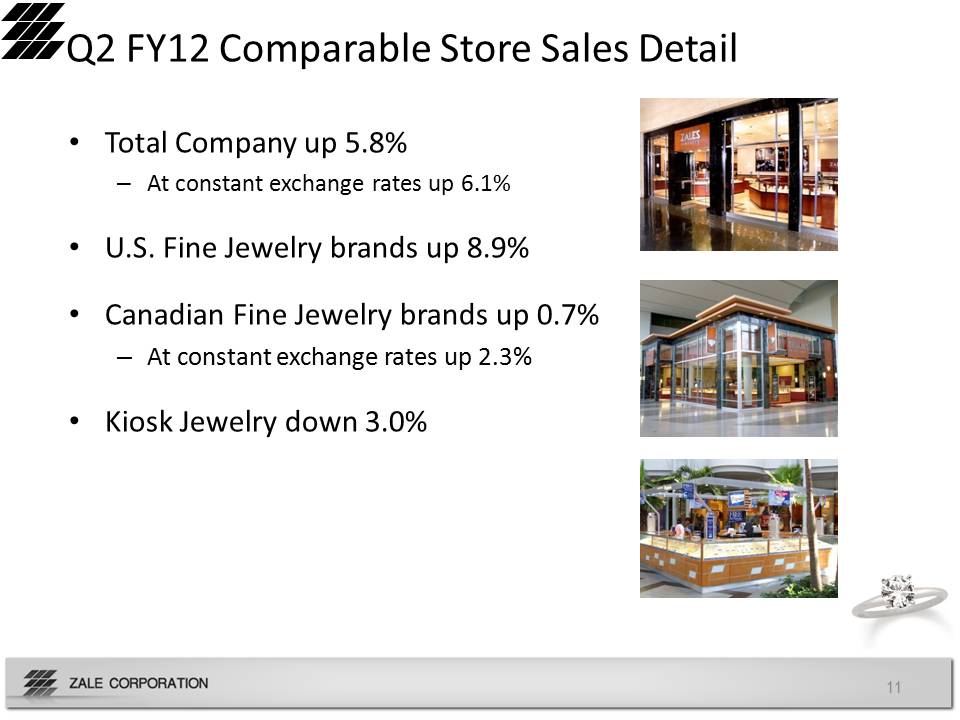
Q2 FY12 Comparable Store
Sales Detail •Total Company up 5.8% –At constant exchange rates up 6.1%
•U.S. Fine Jewelry brands up 8.9% •Canadian Fine Jewelry brands up 0.7%
–At constant exchange rates up 2.3% •Kiosk Jewelry down 3.0% 11
Q2 FY12 Inventory and
Liquidity •Inventory stood at $815 million compared to $777 million at
January 31, 2011 •Current net revolver availability, adjusted for
minimum liquidity requirement, at $108 million 12

YTD FY12 Financial
Highlights •Revenues increased $61 million, or 6.4%, to $1,015 million
–Comparable store sales up 5.8% •Gross margin increased $43 million to
$523 million, up 120 bps to 51.6% •Loss from continuing operations of $3
million, or $0.09 per share compared to $69 million, or $2.16 per share,
in the same period last year 13
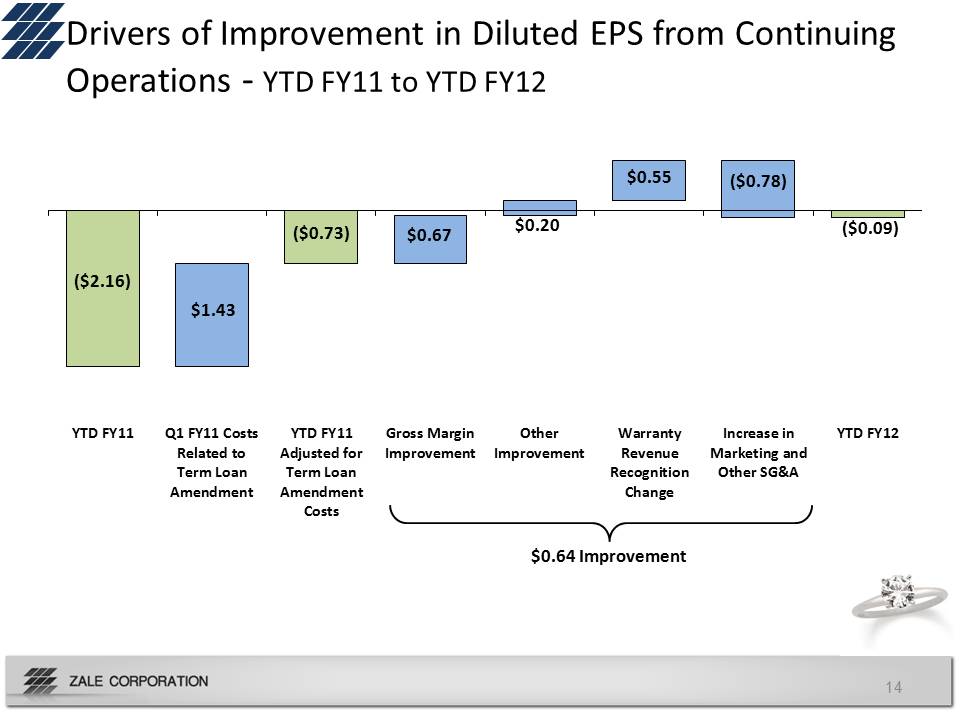
14 Drivers of Improvement
in Diluted EPS from Continuing Operations - YTD FY11 to YTD FY12 $0.64
Improvement YTD FY11Q1 FY11 CostsRelated toTerm LoanAmendmentYTD
FY11Adjusted forTerm LoanAmendment CostsGross MarginImprovement Other
Improvement Warranty Revenue Recognition Change Increase in Marketing
andOther SG&AYTD FY12 ($2.16) ($0.09) $0.20 ($0.78) $0.67 $0.55 $1.43
($0.73)
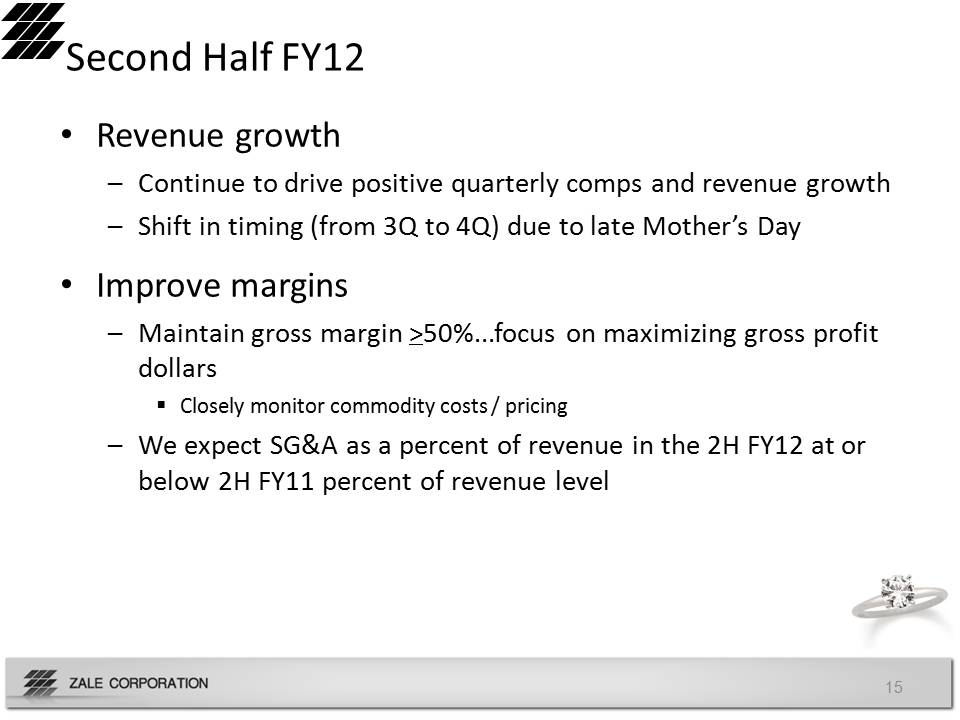
Second Half FY12 •Revenue
growth –Continue to drive positive quarterly comps and revenue growth
–Shift in timing (from 3Q to 4Q) due to late Mother’s Day •Improve
margins –Maintain gross margin >50%...focus on maximizing gross profit
dollars Closely monitor commodity costs / pricing –We expect SG&A as a
percent of revenue in the 2H FY12 at or below 2H FY11 percent of revenue
levelSource: Millward Brown consumer attitude tracking study (January
22, 201115
Appendix 16
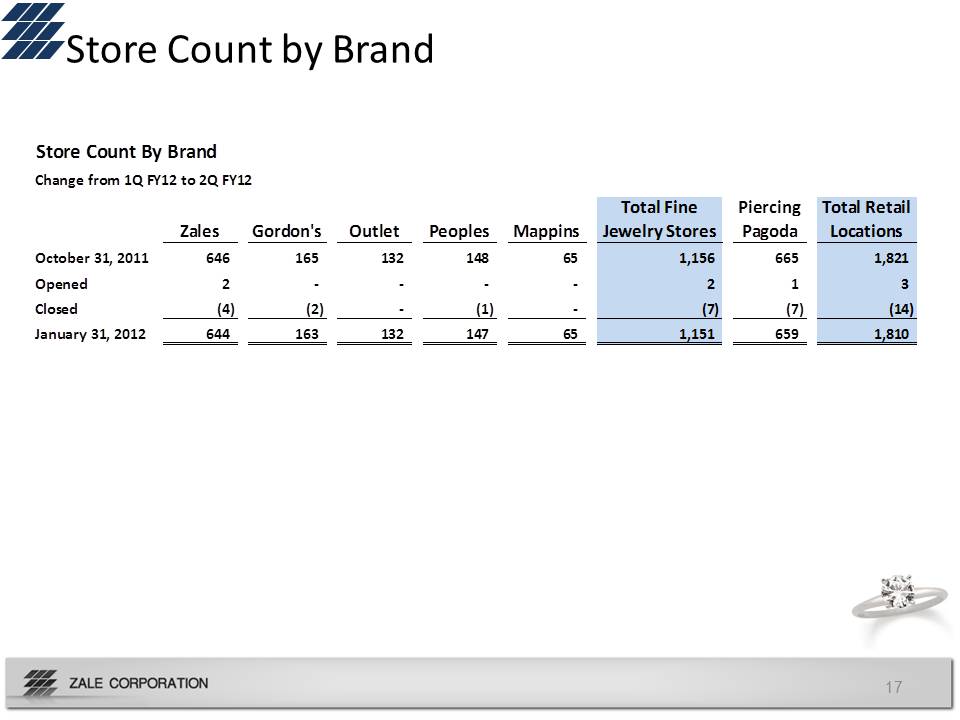
17 Store Count by Brand
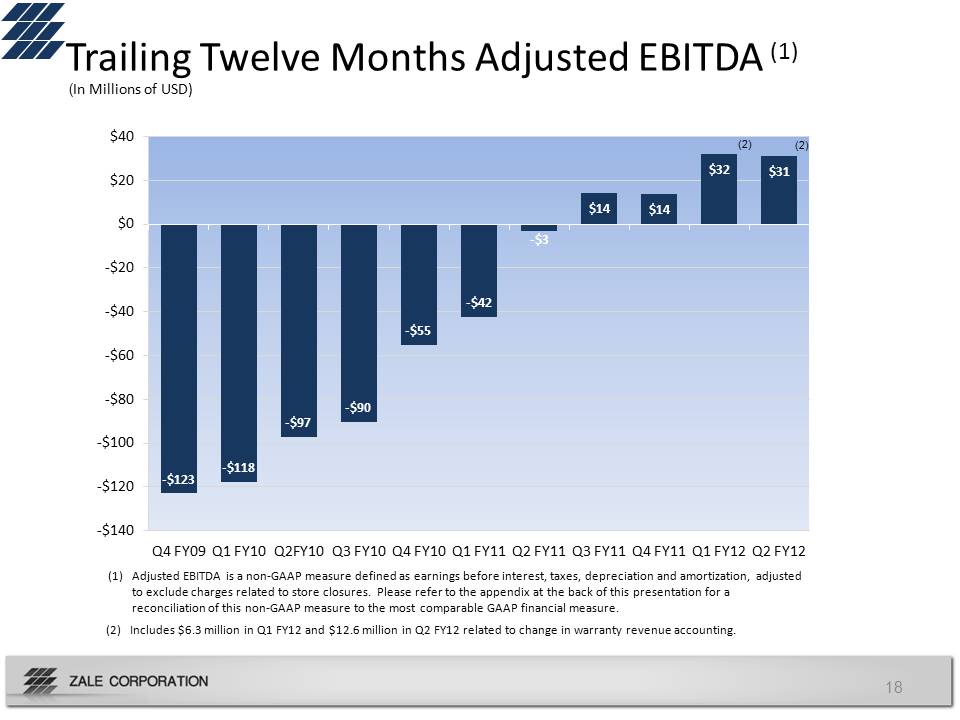
-$123 -$118 -$97 -$90 -$55
-$42 -$3 $14 $14 $32 $31 -$140-$120-$100-$80-$60-$20$0$20$40Q4 FY09Q1
FY10Q2FY10Q3 FY10Q4 FY10Q1 FY11Q2 FY11Q3 FY11Q4 FY11Q1 FY12Q2 FY12(2)
Trailing Twelve Months Adjusted EBITDA (1) ($ in Millions) (1)Adjusted
EBITDA is a non-GAAP measure defined as earnings before interest, taxes,
depreciation and amortization, adjusted to exclude charges related to
store closures. Please refer to the appendix at the back of this
presentation for a reconciliation of this non-GAAP measure to the most
comparable GAAP financial measure. 18 (2 (2) Includes $6.3 million in Q1
FY12 and $12.6 million in Q2 FY12 related to change in warranty revenue
accounting. (In Millions of USD) 18
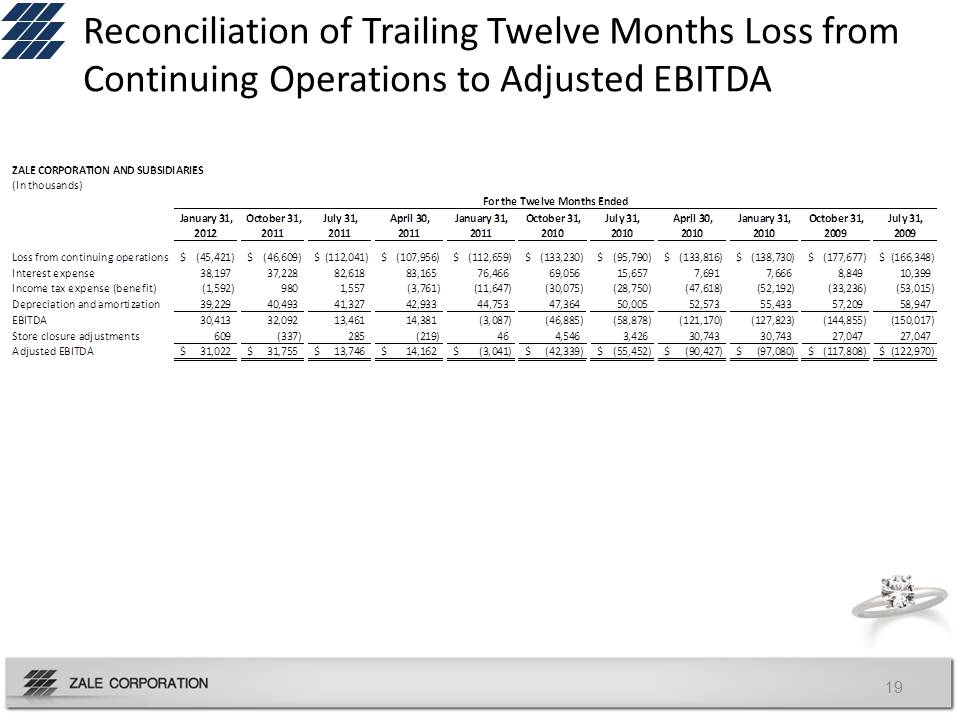
Reconciliation of Trailing Twelve Months Loss from Continuing Operations to Adjusted EBITDA ($ in Millions) 19