Attached files
| file | filename |
|---|---|
| 8-K - 8-K - KAPSTONE PAPER & PACKAGING CORP | a12-5403_18k.htm |
Exhibit 99.1
|
|
February 2012 WELL POSITIONED TO PROSPER Roger W. Stone Chairman and Chief Executive Officer Andrea K. Tarbox CFO |

|
|
2 FORWARD LOOKING STATEMENTS The information in this presentation and statements made during this presentation may contain certain forward-looking statements within the meaning of federal securities laws. These statements reflect management’s expectations regarding future events and operating performance. These forward-looking statements involve a number of risks and uncertainties. A list of the factors that could cause actual results to differ materially from those expressed in, or underlying, any forward-looking statements can be found in the Company’s filings with the Securities and Exchange Commission, such as its annual and quarterly reports. The Company disclaims any obligation to revise or update such statements to reflect the occurrence of events after the date of this presentation. This presentation refers to non-U.S. GAAP financial information. A reconciliation of those numbers to U.S. GAAP financial measures is available on the company’s website at KapStonePaper.com under Investors. Forward-Looking Statements Non-GAAP Financial Measures Risk Factors 2 |

|
|
3 BUILDING OF KAPSTONE 3 KS founded by Roger Stone and Matt Kaplan Focus on paper & packaging Industry veterans Largest stakeholders in company April 2005 Kraft paper mill & dunnage bag business acquired from IP Purchase price $204 MM 3.3 Xs TTM Adj. EBITDA Kraft paper mill acquired from MWV Purchase Price $471 MM 5.8 Xs TTM Adj. EBITDA USC acquired on October 31, 2011 Purchase Price $330 MM 6.4 Xs Adj. TTM EBITDA Dunnage bag business sold to ITW Sold for $35 MM 6.4 Xs TTM Adj. EBITDA January 2007 July 2008 March 2009 October 2011 |

|
|
4 KAPSTONE TODAY-PRODUCTS Kraft Linerboard – Approximately 900,000 tons per year Surface facing on corrugated boxes Wide range of grades and basis weights High performance light weight grades Kraft Papers – Approximately 275,000 tons per year Approximately 19% of market share Multiwall -Packaging for flour, sugar, pet food, cat litter, cement, Bag & Sack-Bags and sacks for retail, lawn & leaf, fast food carryout, and grocery 4 |

|
|
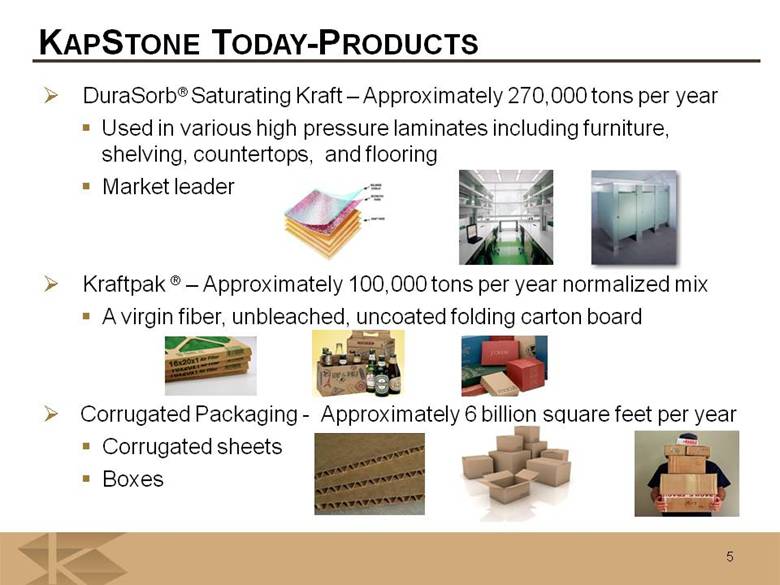
5 KAPSTONE TODAY-PRODUCTS DuraSorb® Saturating Kraft – Approximately 270,000 tons per year Used in various high pressure laminates including furniture, shelving, countertops, and flooring Market leader Kraftpak ® – Approximately 100,000 tons per year normalized mix A virgin fiber, unbleached, uncoated folding carton board Corrugated Packaging - Approximately 6 billion square feet per year Corrugated sheets Boxes 5 |
|
|
6 KAPSTONE TODAY–PRODUCTION FACILITIES Three efficient and cost effective paper mills which produce linerboard, kraft paper, saturating, medium, and unbleached, folding carton board 2 virgin fiber mills 1 recycled fiber mill Capable of producing approximately 1.5 million tons of various kraft paper grades annually 14 box/sheet feeder facilities which have substantial excess capacity. Ample capacity for expansion 6 full line box plants 2 sheet feeders 6 sheet plants Shipments of approximately 6 billion square feet 6 |

|
|
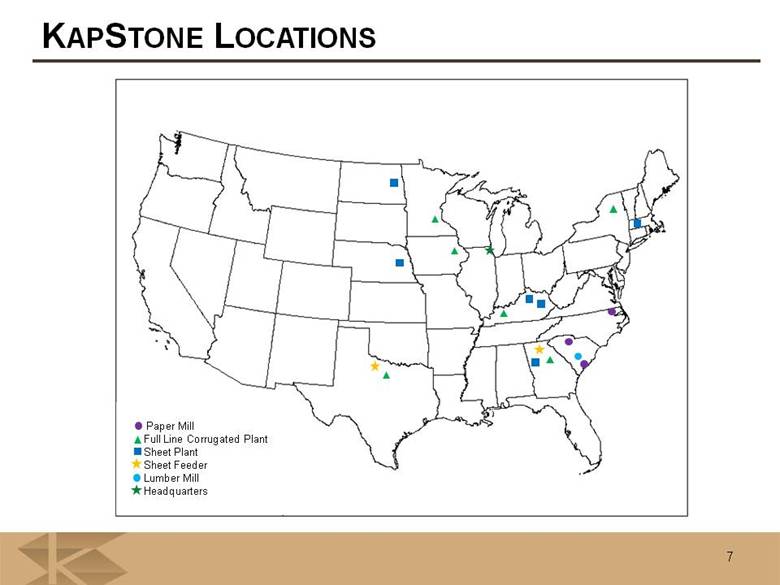
KAPSTONE LOCATIONS Paper Mill Full Line Corrugated Plant Sheet Plant Sheet Feeder Lumber Mill Headquarters 7 |
|
|
8 Strong, Profitable Growth Millions CAGR of 35% CAGR of 42% KapStone Delivers Net Sales Adj. EBITDA* *Adjusted to exclude alternative fuel mixture credits, non-cash stock compensation, acquisition related costs, and dunnage bag business sold in March 2009 Acquisitions, higher prices, and improved operations have driven substantial sales and EBITDA growth millions $224 $492 $626 $783 $906 2007 2008 2009 2010 2011 $50 $78 $27 $95 $165 2007 2008 2009 2010 2011 |

|
|
9 THE “NEW, TRANSFORMED” KAPSTONE 9 Increased exposure to highly desirable containerboard market 9 Significant opportunity to grow revenue and profits by increasing utilization of converting facilities Addition of 2 product lines, corrugated medium and boxes Purchaser of 195 thousand tons of containerboard Enhanced profitability throughout the economic cycle as the risk of costly lack of order downtime is mitigated Modest leverage ratio Day 1 with opportunity to quickly de-lever due to strong free cash flow Alternative, logical growth path in addition to purchasing mill assets Ability to grow in the future due to strong Day 1 balance sheet |

|
|
Inventories are low Supply and demand are in balance Anticipate increased demand as worldwide economies improve Minimal growth in supply expected over next several years High industry-wide operating rates FUTURE OPPORTUNITIES – STRONG FUNDAMENTALS 10 |

|
|
11 Track Record of Providing Return to Our Shareholders Closing Price of $18.88 Feb. 13, 2012 Ranked 5th by Fortune in 2010 annual list of 100 Fastest Growing Companies on: Growth in revenue, EPS and total stock market return over past 3 years Ranked 1st for industrial companies Ranked 10th by Forbes in 2011 annual list of 100 best small companies in America Recognitions |

|
|
2011 Full Year Financial Results *Adjusted to exclude alternative fuel mixture credit , non-cash stock compensation, and acquisition related costs **Adjusted to exclude items above and cellulosic biofuel tax credits 12 Years Ended December 31, ($ in Millions, except per share data) 2010 2011 Inc. Inc. Net Sales $ 783 $ 906 $ 123 16% EBITDA $ 113 $ 157 $ 44 39% Adj. EBITDA* $ 95 $ 165 $ 70 74% Net Income $ 65 $ 124 $ 59 91% Adj. Net Income** $ 29 $ 67 $ 38 131% Diluted EPS $ 1.38 $ 2.61 $ 1.23 89% Adj. Diluted EPS** $ 0.62 $ 1.41 $ 0.79 127% |

|
|
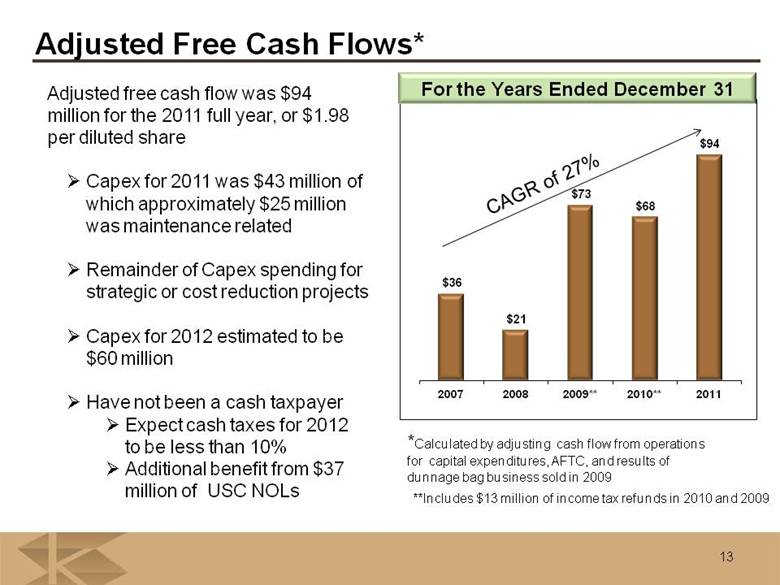
Adjusted Free Cash Flows* Adjusted free cash flow was $94 million for the 2011 full year, or $1.98 per diluted share Capex for 2011 was $43 million of which approximately $25 million was maintenance related Remainder of Capex spending for strategic or cost reduction projects Capex for 2012 estimated to be $60 million Have not been a cash taxpayer Expect cash taxes for 2012 to be less than 10% Additional benefit from $37 million of USC NOLs *Calculated by adjusting cash flow from operations for capital expenditures, AFTC, and results of dunnage bag business sold in 2009 For the Years Ended December 31 13 **Includes $13 million of income tax refunds in 2010 and 2009 CAGR of 27% $36 $21 $73 $68 $94 2007 2008 2009** 2010** 2011 |
|
|
Strong Balance Sheet at December 31, 2011 14 Net debt $347 million Current interest rate on debt 2.27% Debt to EBITDA ratio per bank agreement 1.83 At Dec. 31, 2011, KapStone had $8 million of cash and $142 million of revolver borrowing capacity In addition, KapStone’s credit facility has a $300 million accordion provision to provide for future borrowing under the same terms and conditions |

|
|
Summary of Key Assumptions for 2012 Full year of USC results Only two months included in 2011 Integration progressing well $16 million of synergy benefits previously identified to be recognized over first 18 months Timing is on target, if not slightly ahead Planned outages and major maintenance Roanoke Rapids Mill – Q4 2012 Approximately $1 million higher than 2011 Charleston Mill – comparable to 2011 Cowpens – Q4 2012: Comparable to 2011 Expected maintenance cost: $1.2 million Expected lost production and potential sale tons: 2,700 tons 15 |

|
|
Summary of Key Assumptions for 2012 Input costs Expect overall flat to slight upward cost pressure Primarily driven by stable wood prices offset with slightly lower OCC Partially offset by higher energy and caustic soda CAPEX - Approximately $60 million Including approximately $10 million for USC including the replacement of the ERP system FX Slight negative compared to 2011 Avg. rate for 2011 was 1.39 16 |

|
|
Appendix |
|
|
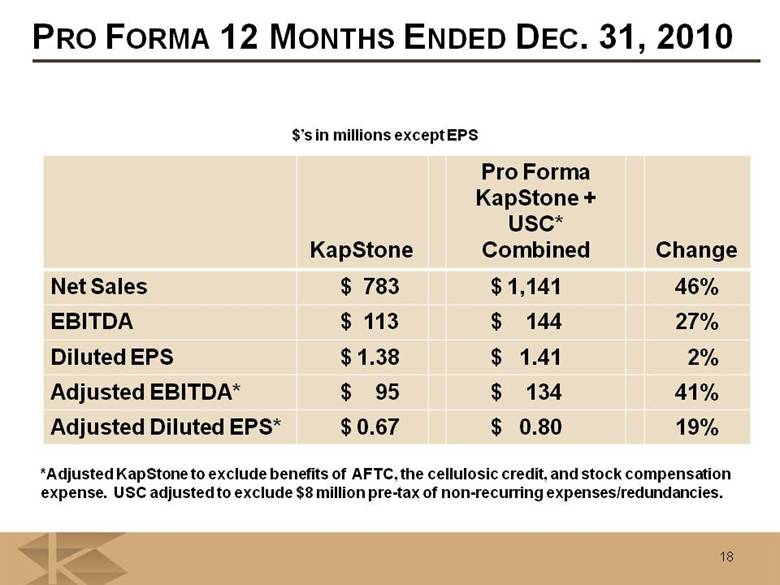
18 18 KapStone Pro Forma KapStone + USC* Combined Change Net Sales $ 783 $ 1,141 46% EBITDA $ 113 $ 144 27% Diluted EPS $ 1.38 $ 1.41 2% Adjusted EBITDA* $ 95 $ 134 41% Adjusted Diluted EPS* $ 0.67 $ 0.80 19% $’s in millions except EPS *Adjusted KapStone to exclude benefits of AFTC, the cellulosic credit, and stock compensation expense. USC adjusted to exclude $8 million pre-tax of non-recurring expenses/redundancies. PRO FORMA 12 MONTHS ENDED DEC. 31, 2010 |
|
|
19 FINANCING – SOURCES & USES* 19 $525 million senior credit facility with a 5 year term $375 million term loan and $150 million revolving credit facility Accordion provision up to an additional $300 million Amortization: back-ended with 50% bullet at end of term Initial interest rate is approximately 2.25% Debt to EBITDA leverage ratio at closing was less than 2.0 times $’s in millions Sources Uses Cash $ 72 Purchase Price $ 330 Revolving Credit Facility 0 Transaction Costs 13 Working capital dj t t 3 adjustment Term Loan Facility 375 Retire Existing Debt 101 Sources $ 447 Total Uses $ 447 Total |

|
|
Roanoke Rapids Mill The Roanoke Rapids Mill is an integrated pulp and paper mill, consisting of two paper machines Broad range of basis weights, manufacturing flexibility Leading edge technology as a result of $70 million in capital investments since 1998 Prime Location On I-95 corridor in North Carolina, excellent geographic location In low cost S.E. fiber region Annual maintenance CAPEX estimated to be approximately $5 - $6 million 20 Facilities Paper Machine Available Product Year Built Most Recent Upgrade Capacity (tons) No. 3 Kraft paper 1953 1998 205,000 Linerboard No. 4 Kraft paper / Specialty 1959 1999 / 2004 120,000 Linerboard 100,000 Total Tons 425,000 |

|
|
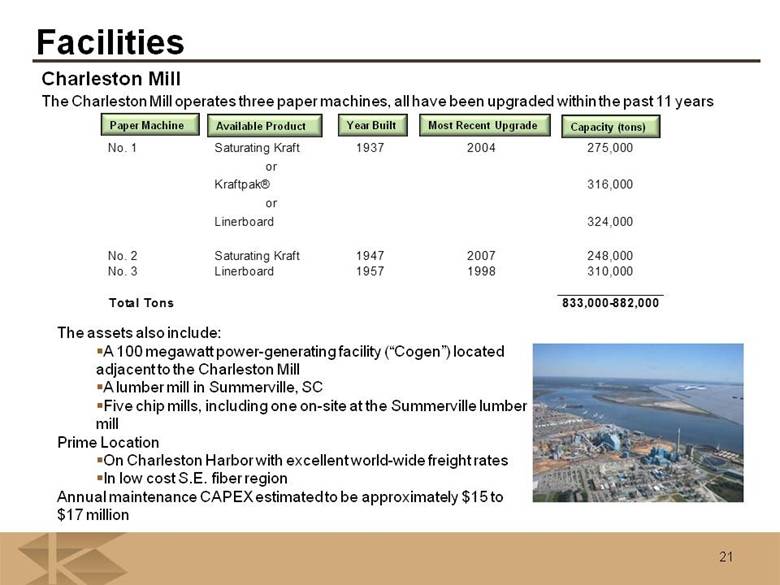
Charleston Mill The Charleston Mill operates three paper machines, all have been upgraded within the past 11 years 21 Facilities Paper Machine Available Product Year Built Most Recent Upgrade Capacity (tons) The assets also include: A 100 megawatt power-generating facility (“Cogen”) located adjacent to the Charleston Mill A lumber mill in Summerville, SC Five chip mills, including one on-site at the Summerville lumber mill Prime Location On Charleston Harbor with excellent world-wide freight rates In low cost S.E. fiber region Annual maintenance CAPEX estimated to be approximately $15 to $17 million No. 1 Saturating Kraft 1937 2004 275,000 or Kraftpak® 316,000 or Linerboard 324,000 No. Saturating 1947 2007 248,000 2 Kraft No. 3 Linerboard 1957 1998 310,000 Total Tons 833,000-882,000 |
|
|
Cowpens Mill The Cowpens Mill operates one paper machine 22 Facilities Available Product Year Built Capacity (tons) The mill uses approximately 260 tons of recycled fiber (OCC) Operates with a unique closed loop water system which reduces water usage and mitigates potential pollution problems Linerboard and medium 1992 240 |
